can policy interact with culture? minimum wage and the
TRANSCRIPT

Can Policy Interact with Culture?Minimum Wage and the Quality of Labor Relations
Philippe Aghion1, Yann Algan2, and Pierre Cahuc3
March 12, 2008
1Harvard University, [email protected] School of Economics, [email protected] Polytechnique, CREST, [email protected]

Abstract
Can public policy interfere with culture, such as beliefs and norms of cooperation? We investigatethis question by evaluating how state regulation of minimum wage interacts with unionizationbehavior and social dialogue. International data shows a negative correlation between uniondensity and the quality of labor relations on one hand, and state regulation of the minimumwage on the other hand. To explain this relation, we develop a model of learning of the quality oflabor relations. State regulation crowds out the possibility for workers to experiment negotiationand learn about the true cooperative nature of participants in the labor market. This crowdingout e¤ect can give rise to multiple equilibria: a �good�equilibrium characterized by strong beliefsin cooperation, leading to high union density and low state regulation; and a �bad�equilibrium,characterized by distrustful labor relations, low union density and strong state regulation of theminimum wage. We then use surveys on social attitudes and unionization behavior to documentthe relation between minimum wage legislation and the beliefs about the scope of cooperationin the labor market.

1 Introduction
The role of social capital in explaining economic outcomes is gaining wider acceptance among
economists. De�ned by Putnam (2000), one of the founding father of this concept, as �the
collective values of all social networks and the inclinations that arise from these networks to do
things for each other�, social capital has been found to have a signi�cant e¤ect on a large set of
economic outcomes such as growth (Knack and Keefer, 1997, Tabellini, 2005, Algan and Cahuc,
2007), �nancial development (Guiso et al., 2004) or institutions (La Porta et al., 1997, Algan
and Cahuc, 2006, Tabellini, 2007a).
But if social capital plays such a key role in the economy, one should try to identify (some of)
its determinants and ask to what extent it can be a¤ected by policies. Actually Putnam (1993)
already suggested that social capital is largely shaped by historical institutions. According to
him, the contemporaneous di¤erences in social capital between the North and the South of Italy
are due to the culture of independence fostered by the free city states experienced in the North
of Italy in the past.1 Similarly, since the seminal work of Putnam (2000) on the United States,
sociologists and political scientists have tried to identify the role of public policies in explaining
the strong decline in social capital since the postwar period, measured in particular by the sharp
drop in association memberships.
From this perspective, it has been argued that policies that assign authority to a central
agency to design rules can contribute to erode social capital. More precisely, Ostrom (2005)
argues that such policies deteriorate social capital for two reasons. First, they induce individ-
uals to be narrowly self-interested and to wait for externally imposed inducement of sanctions
before voluntary contributing to collective action. Second, they undermine citizens�ability to
experiment solutions to their problems and learn from such experimentation over time.
A main purpose of this paper is to bring this issue of state intervention and cooperation,
so far mainly addressed by sociologists and political scientists, into economic analysis. More
speci�cally, we evaluate to which extent centralized wage policy can in�uence cooperation in
the labor market. One main dimension of cooperation in the labor markets is the employees�
propensity to group into trade unions (Freeman and Medo¤, 1984). The sharp decline in union-
ization in some developed countries has been identi�ed as a symptom of the decline in social
capital (Putnam, 2000), while its growth in Scandinavian countries re�ects the strengthening
of cooperation in these countries. In this paper, we argue that the state regulation of wages,
1Guiso et al. (2007) test Putnam�s conjecture that current di¤erences in social capital between the North andSouth of Italy are due to the culture of independence fostered by the free city states experience in the North ofItaly at the turn of the �rst millennium. They estimate that at least 50 percent of the North-South gap in socialcapital come from the lack of a free city state experience in the South. See also Tabellini (2007a) for a theoryand an estimation of the e¤ect of past political institutions on current cooperation.
1
through the minimum wage legislation, a¤ects and also re�ects individuals�beliefs about the
cooperative nature of labor relations and their willingness to update their beliefs through social
experimentation.
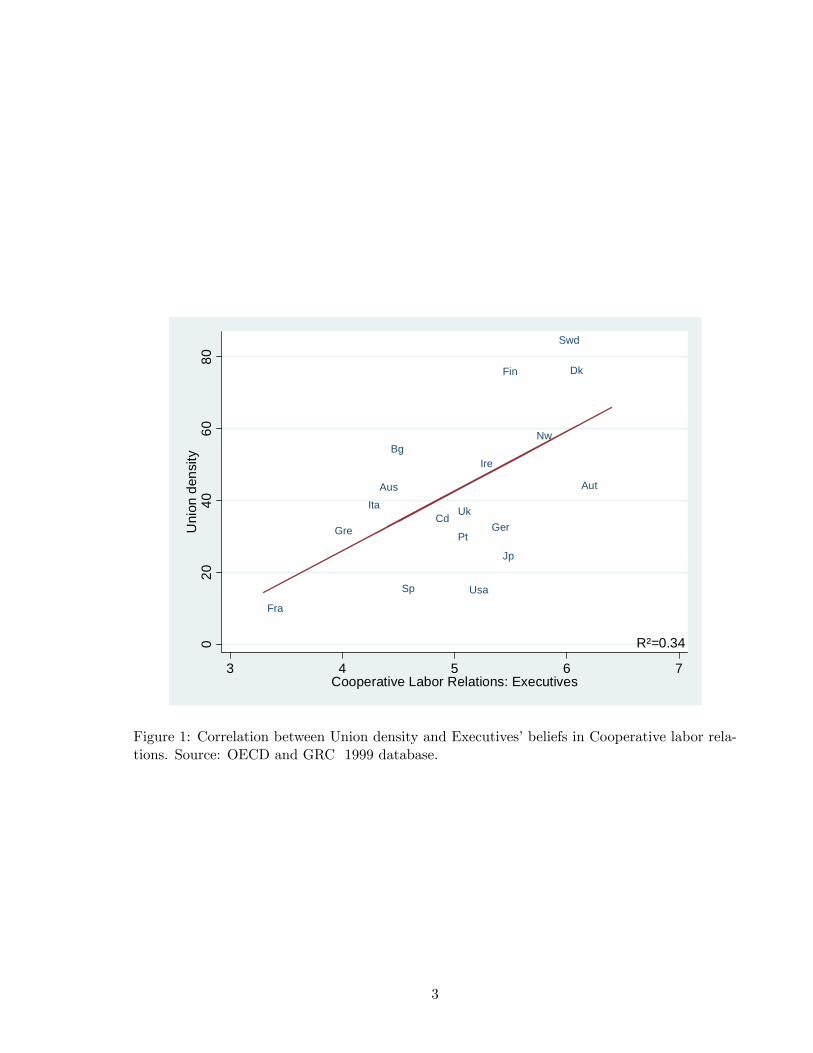
As shown in Figure 1 and Figure 2, there are strong correlations across OECD countries
between the perceived quality of labor relations and the extent to which these countries rely on
state intervention versus direct negotiations between social partners to regulate labor markets.
The index of perceived cooperation on the labor market is constructed using the Global Com-
petitiveness Reports, a survey sent out to thousands of executives each year with the following
question: �Do you think that abor/employer relations are generally cooperative�. Responses
may vary from 1 for strong disagreement to 7 for strong agreement.2 Figure 1 reports the strong
positive correlation between the excutives�beliefs in cooperative labor relations and union mem-
bership. Countries with low union density, such as France, are characterized by distrustful labor
relations, whereas Nordic countries with their high unionization rates show widespread beliefs
in cooperative labor relations. In contrast, Figure 2 shows a strong negative correlation between
the extent of state intervention to regulate wages and the quality of labor relations. We mea-
sure state intervention by the state�s propensity to directly regulate minimum wages instead of
letting wage �oors be negotiated between employers and employees�unions. The index of state
regulation of wage encapsulates : (i) a dummy for the existence of a legal statutory minimum
wage in the country; (ii) the ratio of the minimum wage to the median wage; (iii) a dummy for
the existence of potential derogations from the law, such as the provision of sub-minimum wages
for certain categories; (iv) and a dummy for the existence of legal extensions of minimum wages
set by collective agreements.3 Figure 2 shows that Scandinavian countries are characterized by
a low level of state intervention in the regulation of minimum wage. Wage �oors are directly
negotiated between unions and no statutory legal minimum wage exists. This characteristic is as-
sociated with highly cooperative labor relations. At the other extreme, state intervention is high
in countries (in particular, France) where labor relations are distrustful and union membership
is low.
In this paper we provide a rationale for this negative relationship between state intervention
and cooperation in the labor market. We develop a model where social partners learn about
the scope for cooperation through social experimentation. The e¤ects of state regulation of
minimum wages on social capital in our model are similar to those identi�ed by the political
science literature on centralized rules regulating the civil society (Ostrom, 2005). First, high
2Evidence about the perceptions of the quality of labor relations across OECD countries are given each yearby the Global Competitiveness Reports. This index is presented more precisely in Section 3.
3This index and the de�nition of union density are presented more precisely in section 3.
2
Aus Aut
Bg
Cd
DkFin
Fra
GerGre
Ire
Ita
Jp
Nw
Pt
Sp
Swd
Uk
Usa
020
4060
80U
nion
den
sity
3 4 5 6 7Cooperative Labor Relations: Executives
R²=0.34
Figure 1: Correlation between Union density and Executives�beliefs in Cooperative labor rela-tions. Source: OECD and GRC 1999 database.
3

Aus
Aut
Bg
Cd
DkFin
Fra
Ger
Gre
Ire
Ita
Jp
Nth
Nw
Pt
Sp
Swd
UkUsa
0.2
.4.6
Stat
e re
gula
tion
of m
inim
um w
age
3 4 5 6 7Cooperative Labor Relations: Executives
R²=0.46
Figure 2: Correlation between State regulation of minimum wages and Executives�beliefs inCooperative labor relations. Source: ILO, OECD, and GRC 1999 database.
4

legal minimum wage directly reduces the incentives to become a union member: it is not worth
paying the cost of union membership when the worker can rely on state regulation (Checchi and
Lucifora, 2002). Second, a high legal minimum wage policy erodes social capital in the future:
by discouraging individual agents from experimenting collective action and social dialogue, it
makes it more di¢ cult for them to learn over time about the scope for cooperation. This in
turn crowds out investment in social capital.4 Our theoretical argument goes beyond unions
and wage regulations. Spending time in associations, investing in negotiation and cooperation,
makes it possible for individuals to gather information about the true cooperative nature of other
participants in the labor market. This view of learning and cooperation-building is quite in line
with Tocqueville�s description of associations5 as small social laboratories for experimenting
cooperation and building up democracy. This representation is also similar to the idea conveyed
by Freeman and Medo¤ (1984) that unions might improve the quality of labor relation by
forstering voice rather than exit in industrial relations, a distinction �rst proposed by Hirshman
(1970) and con�rmed by Figure 1 .
We then close the model by letting the minimum wage be set by an elected government that
maximizes social welfare each period. The interaction between state regulation of wages and the
dynamics of cooperative beliefs can give rise to multiple equilibria, which in turn can explain
the polarization of countries reported in Figure 1 and Figure 2. In countries where beliefs in
cooperation are too low to sustain involvement in trade unions, there is a strong demand for
active state interventions in minimum wage regulation. But state intervention itself contributes
to destroy social capital by preventing social experimentation and the resulting updating of
beliefs. In that case, countries can be stuck in an equilibrium with high minimum wage and low
union density. The absence of negotiation in such countries does not mean that labor market
participants are not cooperative. It rather re�ects the fact that participants have not been
able to learn their true cooperative nature, as public policy left no room for experimentation.
At the other extreme, in countries where beliefs about cooperation are optimistic enough to
sustain unions and negotiations, the demand for the legal minimum wage is lower. The low
stringency of the minimum wage legislation provides incentives to experiment social dialogue by
joining unions and thereby learning about the true cooperative nature of labor relations. This
experimentation in turn makes it possible for such countries to converge towards an equilibrium
with low minimum wage, cooperative labor relations and high union density.
The learning process implies that the joint dynamics of the legal minimum wage and union
4See Blanchard and Philippon (2006) for a stimulating analysis of the e¤ect of cooperative priors on wagenegotiation.
5See Tocqueville, Demcracia in America (1835).
5
density is history-dependent: countries starting with low social capital will typically converge
toward equilibria with low union density and high minimum wage, whereas countries starting
with high social capital will converge to high unionization and low minimum wage steady states.
This representation of the building-up of social capital as resulting from experimentation in
collective action can explain the high degree of persistence in cooperative values found by Putnam
(1993). In particular, if initial beliefs about cooperation are too pessimistic, a country can be
persistently trapped in a no-experimentation equilibrium characterized by strong state regulation
of the minimum wage, low union rates and distrustful labor relations. More generally, our model
can account for the fact that countries with excessive state regulation of various aspects of
economic life tend to be also characterized by much more distrustful relations. This explanation
is complementary to the one proposed by Tabellini (2007b) where parents rationally choose
which values to transmit to their o¤spring, and this choice is in turn in�uenced by the quality
of external enforcement of values. In Tabellini�s framework, values evolve gradually over time
and if the quality of external enforcement is chosen under majority rule, there is hysteresis
in the dynamics of values: adverse initial conditions, with weak enforcement, may lead to an
equilibrium path where external enforcement remains weak and individual values discourage
cooperation.
The paper is organized as follows. We �rst describe and analyze our model of social exper-
imentation and minimum wage policy, and use it to explain the negative relationship between
the quality of labor relations and the extent of state regulation of wages. We then test the main
channels of the model by documenting to what extent beliefs in cooperation on the labor market
and norms of cooperation through union membership, interact in reality with state regulation
of wages.
2 The model
2.1 The environment
We consider an in�nite horizon economy populated by a continuum of measure one of risk neutral
individuals, each of whom lives for one period. There are two non storable goods in the economy:
a numeraire good and labor. Each individual is endowed with one unit of labor. Individuals get
utility from their consumption of the numeraire good and they di¤er in productive ability. In
each period t; the proportion of individuals who produce less than y; y � 0; with one unit of
labor, is de�ned by the cumulative distribution function G(y): For simplicity, we shall take the
G distribution to be uniform on the interval [0; 1]:
Individuals may decide to join a trade union. The utility of an individual paid wage wt in
6

period t; is just equal to wt if the individual is not unionized and to
vt = wt � c
if she is unionized, where c 2 (0; 1) denotes the cost of unionization.Workers face a monopsonistic representative �rm. First, the �rm makes take-it-or-leave-it
o¤ers to non unionized workers. Consequently, non unionized workers cannot get more than the
minimum wage �wt � 0 set by the government if their productivity y is higher than the minimumwage, and they get no job o¤er from the �rm otherwise (we implicitly assume that workers�
productivity characteristics are publicly observable).
Unionization allows workers to capture a share of output if labor relations are su¢ ciently
"cooperative". The quality of labor relations in turn hinges on both, unions�and �rms�attitudes.
In particular unions�propensity to cooperate, may partly re�ect their ability to coordinate and
centralize information, to be present in local workplaces and express voice rather than exit,
or to provide services to their members. But their ability to obtain wage concessions through
direct negotiations, also depends upon the employer�s propensity to cooperate. For example,
cooperative employers might choose not to take excessive advantage of their monopsony power
as a lever to reduce wages. For the sake of simplicity, we will focus on unions�e¤ort to improve
cooperative attitudes, even if in reality such e¤orts are shared between unions and �rms.
Labor relations can be either cooperative or non cooperative. The true cooperative nature
of labor relations is not observable. Workers only observe the outcome of their bargaining with
the �rm.6 In every period, the bargaining can either be: (i) a success -in which case all type-y
unionized workers get a wage equal to their productivity wt(y) = y7; (ii) or a failure, in which
case workers obtain the minimum wage wt(y) = �wt:8
In each period t; bargaining between workers and the �rm succeeds with a probability that
depends upon the quality of labor relations:
Pr (bargaining succeeds) =�1� " if quality of labor relations is high" if quality of labor relations is low;
Pr (bargaining fails) =�1� " if quality of labor relation is low," if quality of labor relation is high
6For the sake of simplicity, it is assumed that workers are able to extract the same information about theoutcome of negotiation independently of the number of employees whose wage is bargained over by the tradeunion. Alternatively, one could assume that workers observe the outcome of negotiation with a probability thatincreases with the number of employees whose wage is bargained over in the period. Our results are robust tointroducing this additional feature to the model.
7The assumption that workers obtain the whole the surplus if bargaining succeeds, is made for notationalsimplicity. Assuming that the worker get a share � 2 [0; 1] of the surplus would lead to similar results.
8Note that the wages negotiated by the trade union depend upon workers�productivity, whereas the minimumwage is independent of productivity. Here we simply capture the idea that trade unions have a better informationabout workers�productivity than the government.
7

where " < 1=2.
Investment in cooperation and the dynamics of beliefs
The union can invest to improve the quality of labor relations. We denote the union�s speci�c
investment by it: For simplicity, assume that it can take only two values: zero or I > 0: The
investment is publicly observable. When it = 0; the quality of labor relations is necessarily low.
When it = I; the quality of labor relations is high with probability qt; and it remains low with
the complementary probability 1� qt:Upon deciding whether or not to invest in the quality of labor relations, unionized workers do
not know whether they live in a cooperative economy where the investment will indeed lead to
high quality of labor relations or if they live in a non-cooperative economy where such investment
is pointless. In other words, the investment decision can be seen as a costly experimentation to
improve labor relations and discover the true cooperative nature of the economy.
Let e 2 fC;Ng denote the type of the economy: C if the economy is cooperative and N if it
is non cooperative. We let
Prt=0(e = C) = q0
denote workers�prior beliefs as to the cooperative nature of the economy at date zero.
A history ht(n; s) at the beginning of period t consists in n � t past negotiations (betweendate 0 and date t � 1) over which unions have invested in cooperation, s � n of which have
been successful, and n � s have been unsuccessful. The number n of periods with negotiationand positive investment, may be smaller than t for two reasons. First, the trade union does not
necessarily invest in every period. Second, there is no negotiation in the periods where nobody
is unionized.
>From Bayes�rule, we have:
qt = Pr [e = Cjht(n; s)] =(1� ")s"n�sq0
(1� ")s"n�sq0 + (1� ")n�s"s(1� q0): (1)
Finally, using the fact that Pr [e = Cjht(n; s)] = 1�Pr [e = N jht(n; s)] ; we can compute theprobability that bargaining succeeds in period twhen there have been n previous periods with
investment and negotiations, s of which have been successful, namely:
p(qt; it) =
�"+ (1� 2")qt if it = I
" if it = 0.(2)
In this framework, by unionizing and by investing in the quality of labor relations, workers
manage both, to obtain wage increases and also to generate information about the possibility
to increase the quality of labor relations. In periods in which the trade union invests and some
8

workers are unionized, the outcome of the negotiation reveals information on the type of economy.
This in turn enables workers of the future generation to update their beliefs. When there is no
investment or when nobody is unionized in period t, workers of generation t+ 1 cannot update
their beliefs.
Bayes�rule immediately implies a positive correlation between beliefs in successive periods
as stated by:
Lemma 1: In periods where the trade union invests I; the belief p(qt; I) that bargaining succeeds
in period t is non-decreasing with p(qt�1; it�1):
Proof : From the de�nition (17) of beliefs we know that p(qt; I) increases with qt = Pr [e = Cjht(n; s)] :Let
a = Pr [e = Cjht(n; s)] ; b = Pr�e = Cjht�1(n0; s0)
�where n0 = n; or n0 = n� 1; and s0 = s or s0 = s� 1:We have:
1=a = 1 + (1� q0q0
)(1� "")n�2s;
1=b = 1 + (1� q0q0
)(1� "")n
0�2s0 :
Thus
1=a = (1=b)
�1� ""
�n�n0�2(s�s0)+ 1�
�1� ""
�n�n0�2(s�s0):
In particular (1=a) and (1=b) are positively correlated, and thus so are a and b: QED.
Timing
At the beginning of period t = 0; nature determines once for all the type of economy e 2fC;Ng which is not observable. Then, in each period t � 0, the sequence of decisions can be
described as follows:9
1. The trade union decides whether or not to invest in the quality of labor relations.
2. Individuals vote to elect a government that sets a minimum wage �wt � 0:
3. Workers decide whether or not to join the trade union.
4. Wages are set by employers for non unionized workers and by wage negotiation for union-
ized workers.9Here it is assumed that the trade union investments before the government sets the wage. This assumption
has been chosen because investment in the quality of labor relations can be interpreted as a commitment de-vice. However, it should be noticed that our main result of multiplicity of steady states, some with investment,others without, also holds when the wage is set before investment and when investment and wage are chosensimultaneously.
9
We �rst analyze the outcome of the wage negotiation and the decision to invest in labor
relations and to unionize when the minimum wage is exogenous. This �rst step will allow us to
shed light on the relations between the minimum wage, unionization and investment behaviors
and beliefs. Then, we endogeneize the minimum wage by making it a choice variable by the
elected government.
2.2 Minimum wage and dynamics of cooperation and beliefs
Unionization behavior and investment in labor relations are in�uenced by beliefs about the
e¢ ciency of the investment and by the minimum wage. Beliefs are themselves in�uenced by past
unionization and investment experience. In this section, we �rst analyze how the minimum wage
in�uences unionization and investment behavior within each period t; taking beliefs are given.
Then, we proceed to analyze the impact of the minimum wage on the dynamics of beliefs and
unionization.
2.2.1 Short run equilibrium
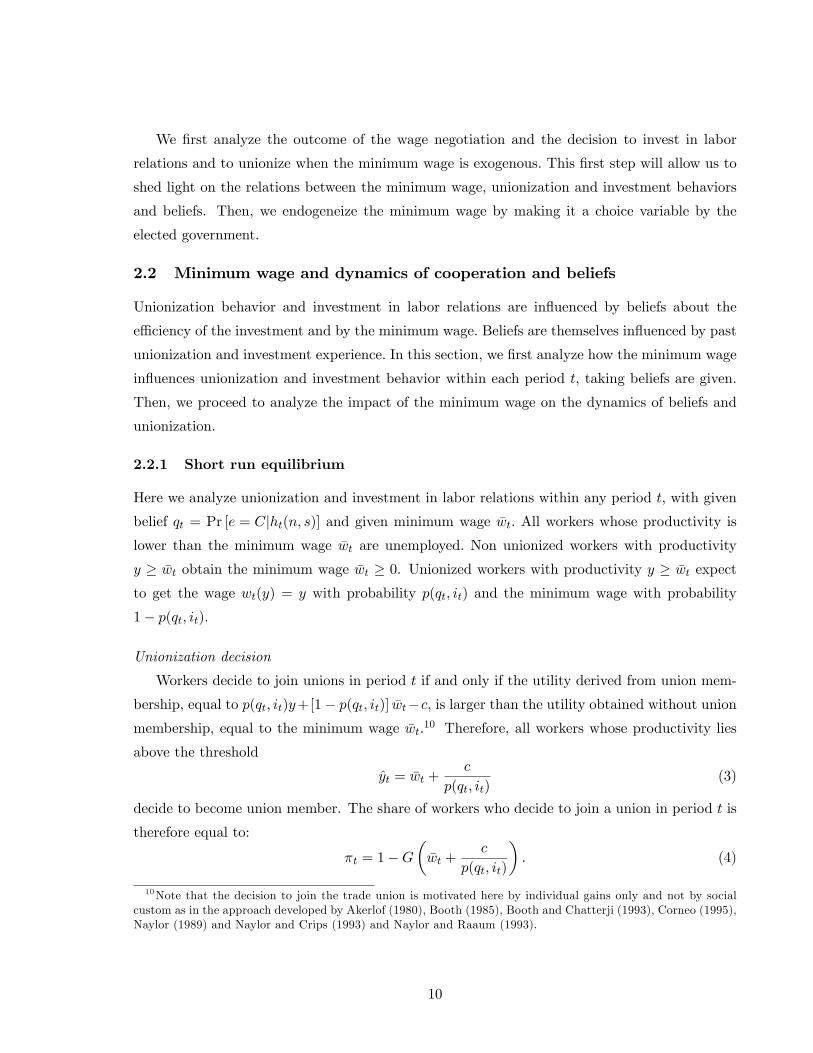
Here we analyze unionization and investment in labor relations within any period t; with given
belief qt = Pr [e = Cjht(n; s)] and given minimum wage �wt: All workers whose productivity is
lower than the minimum wage �wt are unemployed. Non unionized workers with productivity
y � �wt obtain the minimum wage �wt � 0. Unionized workers with productivity y � �wt expect
to get the wage wt(y) = y with probability p(qt; it) and the minimum wage with probability
1� p(qt; it):
Unionization decision
Workers decide to join unions in period t if and only if the utility derived from union mem-
bership, equal to p(qt; it)y+[1� p(qt; it)] �wt�c, is larger than the utility obtained without unionmembership, equal to the minimum wage �wt.10 Therefore, all workers whose productivity lies
above the threshold
yt = �wt +c
p(qt; it)(3)
decide to become union member. The share of workers who decide to join a union in period t is
therefore equal to:
�t = 1�G��wt +
c
p(qt; it)
�: (4)
10Note that the decision to join the trade union is motivated here by individual gains only and not by socialcustom as in the approach developed by Akerlof (1980), Booth (1985), Booth and Chatterji (1993), Corneo (1995),Naylor (1989) and Naylor and Crips (1993) and Naylor and Raaum (1993).
10
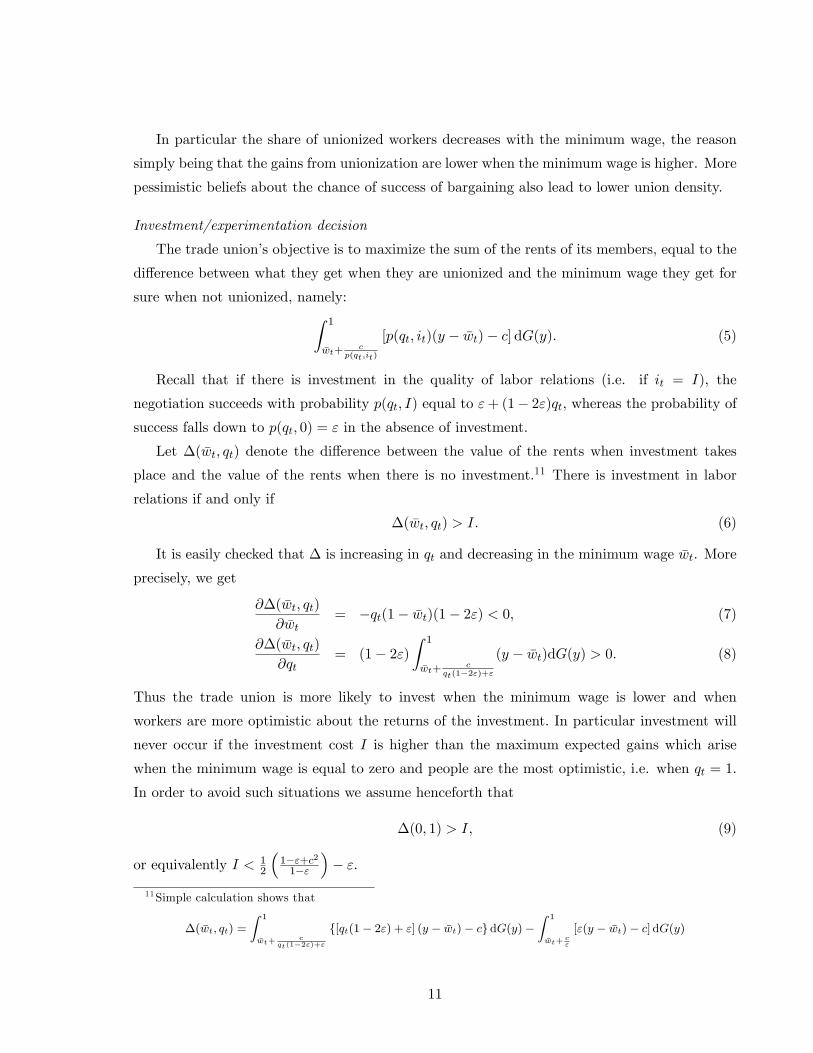
In particular the share of unionized workers decreases with the minimum wage, the reason
simply being that the gains from unionization are lower when the minimum wage is higher. More
pessimistic beliefs about the chance of success of bargaining also lead to lower union density.
Investment/experimentation decision
The trade union�s objective is to maximize the sum of the rents of its members, equal to the
di¤erence between what they get when they are unionized and the minimum wage they get for
sure when not unionized, namely:Z 1
�wt+c
p(qt;it)
[p(qt; it)(y � �wt)� c]dG(y): (5)
Recall that if there is investment in the quality of labor relations (i.e. if it = I), the
negotiation succeeds with probability p(qt; I) equal to "+ (1� 2")qt, whereas the probability ofsuccess falls down to p(qt; 0) = " in the absence of investment.
Let �( �wt; qt) denote the di¤erence between the value of the rents when investment takes
place and the value of the rents when there is no investment.11 There is investment in labor
relations if and only if
�( �wt; qt) > I: (6)
It is easily checked that � is increasing in qt and decreasing in the minimum wage �wt. More
precisely, we get
@�( �wt; qt)
@ �wt= �qt(1� �wt)(1� 2") < 0; (7)
@�( �wt; qt)
@qt= (1� 2")
Z 1
�wt+c
qt(1�2")+"
(y � �wt)dG(y) > 0: (8)
Thus the trade union is more likely to invest when the minimum wage is lower and when
workers are more optimistic about the returns of the investment. In particular investment will
never occur if the investment cost I is higher than the maximum expected gains which arise
when the minimum wage is equal to zero and people are the most optimistic, i.e. when qt = 1:
In order to avoid such situations we assume henceforth that
�(0; 1) > I; (9)
or equivalently I < 12
�1�"+c21�"
�� ":
11Simple calculation shows that
�( �wt; qt) =
Z 1
�wt+c
qt(1�2")+"
f[qt(1� 2") + "] (y � �wt)� cg dG(y)�Z 1
�wt+c"
["(y � �wt)� c] dG(y)
11

it =0
it =0
it =I
1c/ε 1 wt
πt > 0
qt
πt = 0
πt > 0
1
Figure 3: Experimentation and unionization in the (qt; �wt) plane.
The minimum wage policy and the no experimentation trap
Investment and unionization decisions depend upon beliefs and the minimum wage. Workers
unionize more when they are more optimistic about the chance of success of negotiation and
when the minimum wage is lower. And the trade union invests more to improve labor relations
when workers are more optimistic about the returns to the investment and when the minimum
wage is lower.
Figure 3 describes the short-run equilibrium for investment and unionization given (qt; �wt)
(the details underlying Figure 3 are presented in the appendix). Three regions, corresponding
to three di¤erent type of equilibria, show up:
i) when workers are optimistic and the minimum wage is low, then there is positive union
density and positive investment;
ii) when the minimum wage is low and workers are pessimistic, there is no investment to
improve labor relations, but there is positive union density, albeit lower than in the previous
situation;
iii) when the minimum wage is high, there is no investment and union density is nil.
Figure 3 illustrates that a high minimum wage can prevent the trade union from investing
in the quality of labor relations. This is more likely to occur when workers are more pessimistic
about the potential payo¤ from such investment, i.e on the cooperative nature of the environ-
12
ment.
2.2.2 The dynamics of beliefs, unionization and experimentation
We now proceed to analyze the dynamics of beliefs, investment and unionization when the
minimum wage is exogenously �xed at some level w; for all periods t � 0: According to �gure3, there are potentially three di¤erent possible steady states:
i) A steady state where i = I and � > 0,
ii) A steady state where i = 0 and � > 0,
iii) A steady state where i = � = 0:
Suppose �rst that there is no investment in period t = 0: In this case, the economy reaches
its steady state immediately since beliefs are never revised thereafter. This case occurs if the
initial value of the belief, q0; is such that the net gain of investment is negative in period zero,
i.e. if �( �w; q0) � I; or equivalently if
q0 < �q = fqj�( �w; q) = Ig
since �( �w; q) is increasing in q: As shown in �gure 3, two possible steady states are possible
in this situation, corresponding to cases i) and ii). If the minimum wage is su¢ ciently low, i.e.
if �w < 1 � c" ; the economy is stuck in a steady state where the share of unionized workers is
positive, equal to 1 � c" � �w: If the minimum wage is above 1 � c
" , the economy is stuck in a
steady state with zero union density.
Now suppose that
q0 > �q:
and that the minimum wage is su¢ ciently low that experimentation occurs in period t = 0: In
this case, the dynamics of experimentation may lead the economy to converge towards a steady
state with positive union density and investment. However, such optimistic beliefs in period zero
are not su¢ cient to insure that the steady state with positive investment will indeed be reached.
More speci�cally, when q0 > �q; the economy converges toward such steady state with a
positive probability, which will shown below to depend both upon the minimum wage �w and
upon q0:
Note �rst that if negotiation succeeds in period zero, then we must have: q1 = Prt=1 (e = C) >
0 and p1(1; 1) > p0: This implies that the expected return from investment at date 1, �( �w; q1);
is higher than in period zero. Thus
q1 > q0:
13
The same increase in workers�optimism occurs between periods t and t+ 1 occurs when nego-
tiation succeeds in period t:
Overall, the dynamics of beliefs when there is investment, is fully described by:
qt+1 =
8><>:qt if qt � �q
(1�")qt(1�")qt+"(1�qt) > qt with probability 1� " if qt > �q
"qt"qt+(1�")(1�qt) < qt with probability " if qt > �q;
(10)
if the economy is type-C, and
qt+1 =
8><>:qt if qt � �q
(1�")qt(1�")qt+"(1�qt) > qt with probability " if qt > �q
"qt"qt+(1�")(1�qt) < qt with probability 1� " if qt > �q;
(11)
if the economy is type-N:
>From now on we shall concentrate on the case where the economy is truly cooperative
(type-C). A �rst implication of the updating equation (10) in that case, is that if it so happens
that experimentation keeps occurring forever, then as the experimentation history expands, the
reference type ends up being learned with probability 1. More formally, the continuous mapping
theorem (see Acemoglu et al, 2006) implies that s ! (1 � ")t as t ! 1 when experimentation
occurred in all periods 0; 1; :::; t� 1;which in turn implies that
limt�!1
Pr [e = Cjht(t; s)] = limt�!1
q0
q0 + ("1�")
t(1�2")(1� q0)= 1:
It can be shown similarly that limt�!1 Pr [e = Cjht(t; s)] = 0 if e = C.A second implication of the updating equation (10), is that the probability of uninterrupted
experimentation (and therefore of convergence toward full learning) increases with the value of
the initial beliefs q0: For example, if q0 is larger than the threshold value �q below which there is
no investment, but close enough to �q; the probability that there is investment in period zero, but
then no investment in subsequent periods, can be high. To see this, imagine that q0 > �q but that
negotiation fails in period zero (this occurs with probability "). Then, equation (10) implies that
q1 < q0: If q1 is smaller than �q; which will occur if q0 is close enough to �q; investment is equal to
zero in period one. In that case, the economy falls in a no-investment/no-experimentation trap
in period 1, after one period of experimentation, and from period zero this case is perceived to
occur with probability ".
For higher values of q0 it will take more than one failure to bring the economy to a no-
investment/no-experimentation trap. Such a scenario can occur after period 1 when there are
successive failures for higher values of q0: More precisely, we can show:
14

Proposition 1: If the economy is of the cooperative type (e = C) and if q0 > �q; then the
economy avoids the no-investment/ no-experimentation trap with probability Q(q0; w) which is
increasing in q0 and decreasing in w:
Proof: Let T (q0; �q) be de�ned by
'(T; qo) = �q;
where:
'(T; qo) =1
1 + (1�q0q0)(1�"" )
T:
Since ' is decreasing in T and increasing in q0; then T (q0; �q) is increasing in q0 and decreasing
in �q:
Now the ex ante expected probability that qt will eventually fall below �q, which in turn will
lead to a no-investment/no-experimentation trap, is equal to12:
�P (q0; �q) =
Pn�0
Ps�n�T (q0;�q)
2
�ns
�(1� ")s"n�sP
n�0Ps�n
�ns
�(1� ")s"n�s
:
In particular it is easy to see that �P (q0; �q) is decreasing in T; and therefore decreasing in q0 and
increasing in �q; and therefore
Q(q0; w) = 1� �P (q0; �q)
is increasing in q0 and decreasing in q and therefore in the minimum wage w: QED.
Thus, when the economy is truly cooperative, the economy is more likely to converge to-
ward a steady state equilibrium with positive investment and union density if initial beliefs are
su¢ ciently optimistic and the minimum wage is su¢ ciently low. Moreover, we can state that:
Result 1: In steady state, aggregate welfare of workers is higher in the equilibrium with positive
investment in the quality of labor relations than in the equilibrium without investment.
Proof:
Aggregate welfare of workers in period t is equal to the sum of wages minus the unionization
costs and the investment costs in the quality of labor relations:
Wt =
�G
��w +
c
p(qt; it)
��G( �w)
��w +
Z 1
�w+ cp(qt;it)
[p(qt; it)y + [1� p(qt; it)] �w � c]dG(y)� it:
12Here we use the fact that
qt = Pr [e = Cjht(n; s)] =1
1 + ( 1�q0q0)( 1�"
")n�2s
:
15

When �w + cp(qt;it)
is greater than 1, then aggregate welfare is equal to:
Wt = [1�G( �w)] �w � it: (12)
A steady state equilibrium with positive investment in the quality of labor relations can exist
only if the economy is truly cooperative and if �w+ c1�" < 1. Assuming that these two conditions
are ful�lled, the probability p(qt; it) that bargaining succeeds at date t; is equal to 1� " if thereis investment in the quality of labor relations. Then, steady state welfare is
W I =
�G
��w +
c
1� "
��G( �w)
��w +
Z 1
�w+ c1�"
[(1� ")y + " �w � c]dG(y)� I:
If there is no investment, then p(qt; it) is equal to " and steady state welfare amounts to
W 0 =
( �G��w + c
"
��G( �w)
��w +
R 1�w+ c
"["y + (1� ") �w � c]dG(y) when �w + c
" < 1�G��w + c
"
��G( �w)
��w otherwise.
:
Using the two last equations and the de�nition of �( �w; q) given in footnote 11 it can easily be
checked that W I > W 0 since �( �w; 1) > I: QED.
2.3 Optimal minimumwage and the multiplicity of steady-state social regimes
In this section we endogeneize the minimum wage as being chosen by a utilitarian government.
We begin to de�ne the optimal minimum wage set by the government in every period. Then,
we proceed to analyze the short-run equilibrium, when the belief about the e¢ ciency of the
investment in labor relations is taken as given. Finally, we study the dynamics of beliefs and
investment and we show that the model generates multiple (long-term) social regimes.
2.3.1 The ex-ante social welfare function and the optimal minimum wage
It is assumed that the government, contrary to the trade union, does not observe the productivity
of each individual. This assumption is meant to capture in a simple way the fact that trade unions
gather information, thanks to the bargaining process, that is not available to the government.
The cost of unionization, c, and/or the cost of investment in labor relations, I; can be interpreted
as the cost of information obtained by the trade union.
Since the government does not observe productivity, the minimum wage can only be the
lowest bound of the wage distribution. The election process is represented by a probabilistic
voting model which implies, under some assumptions assumed to be ful�lled, that the elected
16
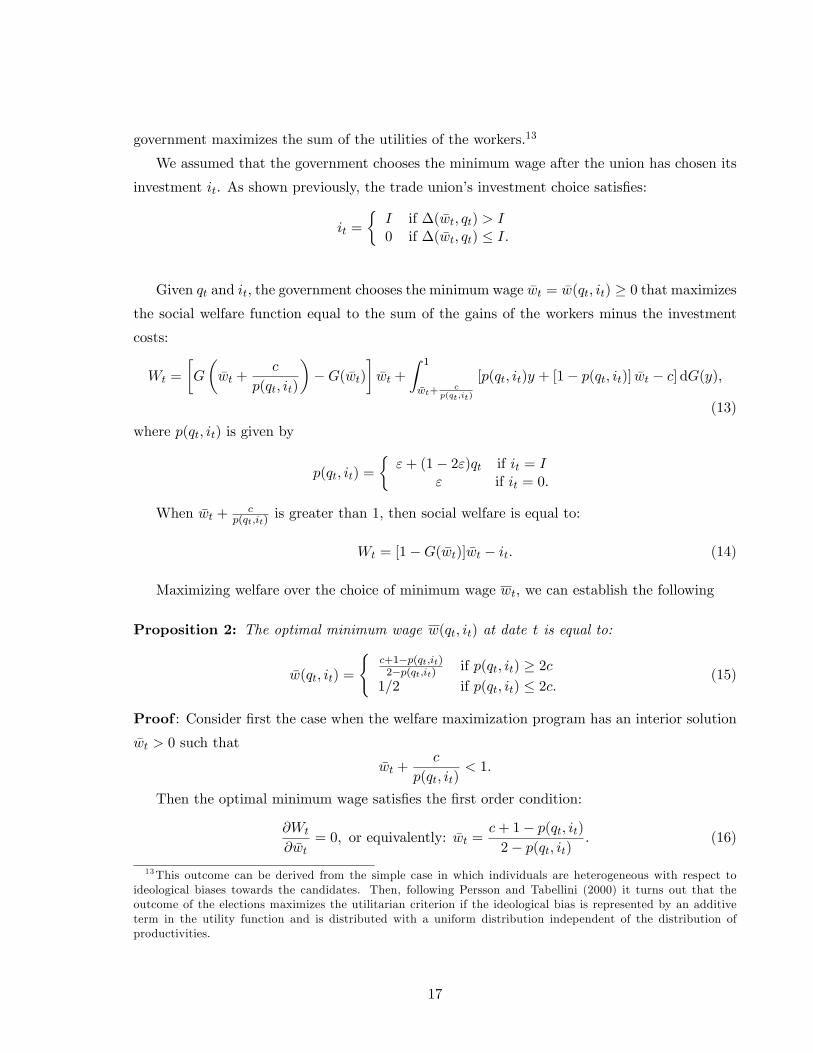
government maximizes the sum of the utilities of the workers.13
We assumed that the government chooses the minimum wage after the union has chosen its
investment it. As shown previously, the trade union�s investment choice satis�es:
it =
�I if �( �wt; qt) > I0 if �( �wt; qt) � I:
Given qt and it; the government chooses the minimum wage �wt = �w(qt; it) � 0 that maximizesthe social welfare function equal to the sum of the gains of the workers minus the investment
costs:
Wt =
�G
��wt +
c
p(qt; it)
��G( �wt)
��wt +
Z 1
�wt+c
p(qt;it)
[p(qt; it)y + [1� p(qt; it)] �wt � c]dG(y);
(13)
where p(qt; it) is given by
p(qt; it) =
�"+ (1� 2")qt if it = I
" if it = 0.
When �wt + cp(qt;it)
is greater than 1, then social welfare is equal to:
Wt = [1�G( �wt)] �wt � it: (14)
Maximizing welfare over the choice of minimum wage wt; we can establish the following
Proposition 2: The optimal minimum wage w(qt; it) at date t is equal to:
�w(qt; it) =
(c+1�p(qt;it)2�p(qt;it) if p(qt; it) � 2c1=2 if p(qt; it) � 2c:
(15)
Proof : Consider �rst the case when the welfare maximization program has an interior solution
�wt > 0 such that
�wt +c
p(qt; it)< 1:
Then the optimal minimum wage satis�es the �rst order condition:
@Wt
@ �wt= 0; or equivalently: �wt =
c+ 1� p(qt; it)2� p(qt; it)
: (16)
13This outcome can be derived from the simple case in which individuals are heterogeneous with respect toideological biases towards the candidates. Then, following Persson and Tabellini (2000) it turns out that theoutcome of the elections maximizes the utilitarian criterion if the ideological bias is represented by an additiveterm in the utility function and is distributed with a uniform distribution independent of the distribution ofproductivities.
17

The solution �wt is truly interior if
c+ 1� p(qt; it)2� p(qt; it)
+c
p(qt; it)< 1;
or equivalently
p(qt; it) > 2c:
Now suppose that
p(qt; it) � 2c;
then the optimal minimum wage �wt maximizes
Wt = [1�G( �wt)] �wt:
Note that in this case@Wt
@ �wt= 1� 2 �wt;
which is positive if �wt < 1=2 and negative otherwise. Thus in this case the optimal minimum
wage is simply
�wt =1
2;
which establishes the proposition. QED.
By using the value of �wt de�ned in equation (15) into equation (4), we get:
Corollary 1: The unionization rate at date t is given by:
�t =
(p(qt;it)�2c
p(qt;it)[2�p(qt;it)] if p(qt; it) � 2c0 if p(qt; it) � 2c:
; (17)
In particular we see that:
@�t=@pt � 0:
In other words, the more optimistic workers are about the quality of labor relations at date t;
the more they unionize at that date.
2.3.2 Short run equilibrium
We now proceed by backward induction. Consider �rst the government�s choice of minimum
wage for given beliefs and union investment. Proposition 2 gives us the answer, namely:
If it = 0; then the probability that bargaining succeeds is p(qt; 0) = " and the government
sets
�w(qt; 0) =
�c+1�"2�" if " � 2c1=2 if " � 2c:
18
If it = I; the government will choose
�w(qt; I) =
(c+1�["+(1�2")qt]2�["+(1�2")qt] if "+ (1� 2")qt � 2c1=2 if "+ (1� 2")qt � 2c:
(18)
which is decreasing in qt since c < 1:
Now, moving back one step, the union will choose to invest, i.e it = I; whenever
D(qt) > I; (19)
where
D(q) =
Z 1
�w(q;I)+ cq(1�2")+"
f[q(1� 2") + "] [y � �w(q; I)]� cg dG(y)
�Z 1
�w(q;0)+ c"
f" [y � �w(q; 0)]� cg dG(y):
Using the fact that D(q) is increasing in q; the above inequality de�nes a lower bound
~q = fqjD(q) = Ig
on beliefs,14 below which the union does not invest and therefore does not experiment. Obviously,
an equilibrium with positive investment cannot exist if the investment cost is higher than the
expected gains from investment when people are most optimistic, i.e. when qt = 1: To avoid this
possibility, we henceforth assume that
D(1) > I:
Then, either qt < ~q; in which case the union does not invest and therefore the government sets
minimum wage �wt = minf1=2; c+1�"2�" g; or qt > ~q in which case the union invests, the government
sets
�wt =c+ 1� ["+ (1� 2")qt]2� ["+ (1� 2")qt]
< 1=2;
and the union experiments at date t: Since the minimum wage is lower in the second case, union
density is higher in that case.
2.3.3 Comparative static results
Using Proposition 2 and plugging the equilibrium value of the minimum wage back into the
expressions for welfare, employment and output, we can establish interesting comparative static
14 It can be checked that ~q is larger than the threshold value of q below which the wage �w(qt; I) = 1=2. Thisis because nobody is unionized if the wage is equal to 1/2 and it is then never worth investing in the quality oflabor relations.
19

results on how these three measures of aggregate performance vary with workers�belief on the
type of the economy.
.
Result 2: Employment and aggregate output are non-decreasing with the previous period�s belief
in the cooperative nature of the economy.
Proof : Note that aggregate employment is simply given by
Et =
�1�G( �wt) = 1�c
2�p(qt;it) if p(qt; it) � 2c12 otherwise.
Thus Et is non-decreasing in p(qt; it) and thus in p(qt�1; it�1) according to Lemma 1 and to
Corollary 1. Similarly, aggregate output
Yt =
Z 1
�wt
ydG(y)
is non-decreasing in p(qt�1; it�1) since �wt is non-increasing in p(qt�1; it�1). QED.
When many workers were unionized in the previous generation and when the trade union has
just invested to improve the quality of labor relations, the government can set a low minimum
wage because current expected gains of unionization are high. This situation, which is favorable
to employment and output, is also good for aggregate welfare which is equal to total wages net
of total unionization and investment costs if the true nature of the economy is cooperative:
Result 3: When the economy is type-C, aggregate workers�welfare is non-decreasing with the
previous generation�s belief
Proof : Past belief has no impact on current welfare if qt is such that there is no investment
in the current period, i.e. if qt � ~q. Let us now suppose that qt > ~q and that there is an
equilibrium with positive investment in period t: Then, using the envelop theorem the derivative
of Wt (de�ned equation (13)) at the optimal value of �wt reads
dWt
dp(qt; it)=
( R 1�wt+
cp(qt;it)
(y � �wt)dG(y) > 0 if p(qt; it) � 2c0 otherwise.
Since from Lemma 1 p(qt; it) increases with p(qt�1; it�1) when the trade union invests, Wt also
increases with p(qt�1; it�1) if p(qt; it) � 2c: QED.Thus, when the true nature of the economy is cooperative, more optimistic past beliefs about
the cooperative nature of the economy and the e¢ ciency of investment, favor current involvement
in collective action, and leads to higher social welfare because the action of trade unions is more
e¢ cient than the minimum wage to �ght against the monopsony power of employers.
20
2.3.4 The dynamics of union density, minimum wage and investment in coopera-tion
This section analyzes the joint dynamics of union density, minimum wages and investment in
the quality of labor relations. We are particularly interested in the existence of multiplicity of
steady-state equilibria: equilibria with positive investment in the quality of labor relations, low
minimum wage and high unionization (a �Scandinavian� equilibrium) and equilibria without
investment in the quality of labor relation, and with low unionization and high minimum wage
(�French�equilibrium).
�French�equilibrium
When initial beliefs about the nature of the economy, q0 = Prt=0 (e = C) ; are pessimistic,
the economy can be stuck in a situation with zero investment. This occurs for sure if q0 � ~q:
This situation persists over time since the absence of experimentation in period t = 0 prevents
the updating of beliefs in period 1; and then in the subsequent periods 2; ::;1: The minimumwage remains high, equal to
�w = minf1=2; c+ 1� "2� " g;
and union density is equal to
� = maxf0; "� 2c"(2� ")g:
�Scandinavian�equilibria
When initial beliefs are su¢ ciently optimistic, i.e. when q0 > ~q, investment in period zero is
positive. Then, social experimentation takes place. From our analysis in the previous subsection,
we know that with ex-ante probability
�P (q0; ~q) =
Pn�0
Ps�n�T (q0;~q)
2
�ns
�(1� ")s"n�sP
n�0Ps�n
�ns
�(1� ")s"n�s
;
the economy will end up in a �French�trap, but with probability�1� �P (q0; ~q)
�it will converge
toward the �Scandinavian�steady state.
If the economy reaches the �Scandinavian�steady state, the economy had to be of a coop-
erative type (otherwise, the economy could not have converged toward this steady state by the
Continuous Mapping Theorem). The probability of success of negotiation is then equal to 1� ":The minimum wage and the trade union density are consequently given by
�w� =c+ "
1 + "<1
2; �� =
1� "� 2c(1� ")2 > � � 0:
Welfare comparison
21

Consider a type-C economy so that the steady state with positive investment can be reached
when the initial beliefs satisfy q0 > ~q: Then, we know from Result 2 that aggregate welfare
is increasing with p(qt; it). Since p(qt; it) is higher in the equilibrium with positive investment
than in the equilibrium with zero investment, aggregate welfare is higher in the �Scandinavian�
steady state equilibrium than in a �French�one.
The following proposition summarizes the above discussion:
Proposition 3: Assume a type-C economy. Then, there exists a steady state equilibrium,
with positive investment in the quality of labor relations, high unionization rate and low minimum
wage. There also exist steady state equilibria with zero investment, low union density and high
minimum wage. In the steady state with positive investment, welfare is higher than in the
steady-state without investment.
If initial beliefs q0 that the environment is cooperative are lower than ~q; the economy is stuck
in a bad equilibrium with higher minimum wage �wt = minf1=2; c+1�"2�" g; lower unionization rate,and no investment in the quality of labor relations.
If q0 > ~q; the economy converges towards the equilibrium with positive investment in the qual-
ity of labor relations, lower minimum wage �w� = c+"1+" ; higher unionization rate,with probability
1� �P (q0; ~q) that increases with q0.
It is worth stressing that the dynamics of investment in cooperation, of unionization and
of the minimum wage, are all driven by the updating of workers�beliefs. A high current mini-
mum wage policy favors convergence towards the �low� equilibrium with no unionization and
investment, as it deters experimentation and thereby leads to future minimum wage increases.
3 Empirical relation between cooperation and state regulationin the labor market
This section documents the empirical correlation between beliefs in cooperation and the extent
of state regulation of minimum wages at the expense of labor organizations. The model pre-
dicts that individuals rely directly on state intervention rather than on negotiation when beliefs
about the scope of cooperation in the labor market are pessimistic. But conversely, by directly
regulating wages, the state discourages individuals from engaging in social experimentation and
thereby learning about the quality of labor relations. In this section, we try to document on
this two-way relationship.
22

3.1 State regulation of wages and union membership
We �rst stress the existence of a strong negative correlation between state intervention to set
minimum wages and the propensity of workers to get unionized. We �rst show this negative
correlation in cross-OECD-country panel regressions over the period 1975-2003. We then look
at the same correlation but focusing on the United States. More speci�cally, we exploit the
heterogeneity in the evolution of minimum wage levels across the di¤erent American states since
the mid-1990s to look at the joint dynamics between unionization behavior and minimum wage.
3.1.1 Evidence from OECD countries
A - Data on state regulation of minimum wages
To measure the stringency of state regulation of minimum wages we construct a composite
index. This index intends to measure the extent to which the minimum wage is a constraint
that binds on collective and individual wage bargaining. A �rst component of this index is the
stringency of the minimum wage legislation, including the existence of legal minimum wages and
the extent of potential derogations. A second component is the level of the minimum wage. Data
are borrowed from the International Labor Organization (ILO) and from the OECD database.
The ILO database provides detailed description of the di¤erent legal procedures to set minimum
wages. The OECD database provides information concerning the level of real minimum wages
and the ratio of minimum wages relatively to average wages and median wages. The indicators
are brie�y described below, the full description being reported in Appendix A.2.
Minimum wage legislation
We start by looking at the stringency of minimum wage legislations. This is measured by
two main indicators: i�) minwage_legal measures the existence of a legal statutory minimum
wage, and if not, the degree of coverage of the minimum wage set by collective bargaining; 2�)
minwage_dispersion measures the degree of dispersion in minimum wages across ages, quali�-
cations, regions, sectors or occupations. We scale each of these two indicators between zero and
one, a higher value indicating more stringent law enforcement.
Figure 4 shows the �rst indicator, minwage_legal, which captures the existence of a legal
statutory minimum wage and the extent to which minimum wages negotiated in collective bar-
gaining are extended to all workers. The indicator minwage_legal equal to 1 if a statutory
minimum wage exists, 0.5 if instead the wage �oor is directly bargained over by unions and
then extended, and 0 otherwise. We report the average value of this indicator for the period
1980-2003. A high degree of cross-country variation shows up along this dimension. A �rst
23
group of countries, namely Scandinavian countries, do not have any legal minimum wage, and
no legal automatic extension of the negotiated wage �oors. Wage �oors are determined as part
of the collective agreements between unions, and then they apply to workers covered by these
collective agreements only. A similar group of countries, made up of Austria, Germany and
Italy, do not have any legal statutory minimum wages. But legal dispositions stipulate to what
extent the negotiated wage �oors should be extended to all other workers. Lastly, a legal statu-
tory minimum wage is implemented by most Mediterranean and Anglo-Saxon countries. In the
United States, this tradition dates back at least to the 1938 Fair Act while it is more recent in
United Kingdom which established a legal minimum wage in 1999.
Figure 5 shows the indicator minwage_dispersion which measures the extent of dispersion
and derogations in minimum wage setting. Minimum wage can di¤er by ages, quali�cations,
regions, sectors or occupations. A more constraining minimum wage legislation is one that
leaves little room for derogations and dispersion. We measure this characteristic by constructing
two sub-indexes for age dispersion and other kind of derogations. The sub-indexes are ranked
between 0 and 1, a higher score indicating that the country provides little derogation. The sub-
index of dispersion across ages is constructed as follows. The score is equal to 1 if there is no
provision at all for sub-minimum wages. It is equal to 0.5 if derogations are restricted to workers
younger than 18 years old or if the derogation is less than half the o¢ cial minimum wage. And
it takes on the value 0 if the derogations can be extended to people older than 18 years or/and
if the sub-minimum wages are lower than half the standard wage �oor. The sub-index for other
derogations equal 0 if the minimum wage is allowed to di¤er along at least the three dimensions
of regions, sectors and occupations, 0.33 if there are two types of distinctions, 0.67 for one type
of distinction, and 1 if no dispersion at all is allowed. The indicator minwage_dispersion is the
average of these two sub-indexes.
Figure 5 shows a great deal of cross-country heterogeneity in the minwage_dispersion indi-
cator over the period 1980-2003. Countries like France leaves no scope for derogations based on
age, occupation, or industry. Other countries allow for subminimum wages. Thus, special wage
�oors extend up to age 24 in Sweden and to age 22 years in the Netherlands. The Netherlands
accepts a reduction up to 40 percent of standard minimum wage at 17 years old. Nordic coun-
tries let unions negotiate the wage �oor at the industry level, without any automatic extension
to other parts of the economy.
Henceforth, we measure the stringency of the overall minimum wage legislation using the
composite indicator minwage_legislation, obtained by multiplying the indicator of legal de-
termination of the minimum wage, minwage_legal, by the indicator of potential dispersion,
minwage_dispersion.
24

0.2
.4.6
.81
Lega
l ver
sus
nego
ciat
ed w
age
floor
s
Usa Tk Sp Pt Pol Nth Mx Jp Ire Hg Gre Fra Czr Cd Aus Uk Ita Ger Bg Aut Swd Nw Fin Dk
Figure 4: Legal statutory minimum wages or the degree of extension of negotiated wage �oors.Period: 1980-2003.
0.2
.4.6
.81
Dis
pers
ion
in w
age
floor
s
Hg Fra Pt Gre Aut Usa Sp Czr Bg Mx Ita Tk Pol Nw Nth Jp Fin Uk Ger Dk Ire Cd Aus Swd
Figure 5: Degree of dispersion in wage �oors by ages, quali�cations, regions, sectors or occupa-tions. Period 1980-2003.
25
Minimum wage levels
We measure the minimum wage level by the index minwage_level de�ned as the ratio of the
minimum wage over the median wage in the economy. Minimum wage levels are provided by the
OECD database for all years since the mid-1970s. The OECD only reports countries which have
a legal statutory minimum wage. We thus complete these data by using Neumark and Wascher
(2004)�s indicators for other countries. These data cover two time periods, the late 1970s and
the 2000s. The exact de�nition of the minimum wage variables used to calculate the real
value of national minimum wages, is reported in the Appendix. As mentioned above, minimum
wage levels display some degree of dispersion within most countries. The OECD database and
Neumark and Washer reports the average value for full-time minimum wage workers who are
not subject to any derogations, as a percentage of average wages of full-time workers in the
corresponding sector (see Immervoll, 2007, and Neumark and Washer, 2004).
Union density
We measure workers�involvement in unions by using the unionization data provided by the
OECD at a yearly frequency since the 1960s. We also use data from Boeri et al. (2003) to track
back the evolution of unionization rates since the early 1950s. We should be clear at this point
that our primary focus is on workers�propensity to cooperate and to group into associations
rather than rely on state intervention to guarantee their wage. In this regard, union density
appears to be a more relevant indicator than union coverage rates. Obviously, the coverage
indicator provides information regarding the bargaining power of unions, and as a matter of
fact the role of unions in regulating wages becomes fairly high in some countries due to the
automatic extension of negotiated wages to all sectors, even if the union density rate is really
low. However the coverage indicator also captures the extent of state intervention in setting
wages, since negotiated wages are extended by law to the di¤erent sectors of the economy.
Thus this indicator does not truly re�ect workers�preference for direct negotiations over the
alternative of relying on state intervention.
B - Cross-country correlation between union density and state regulation of
minimum wage
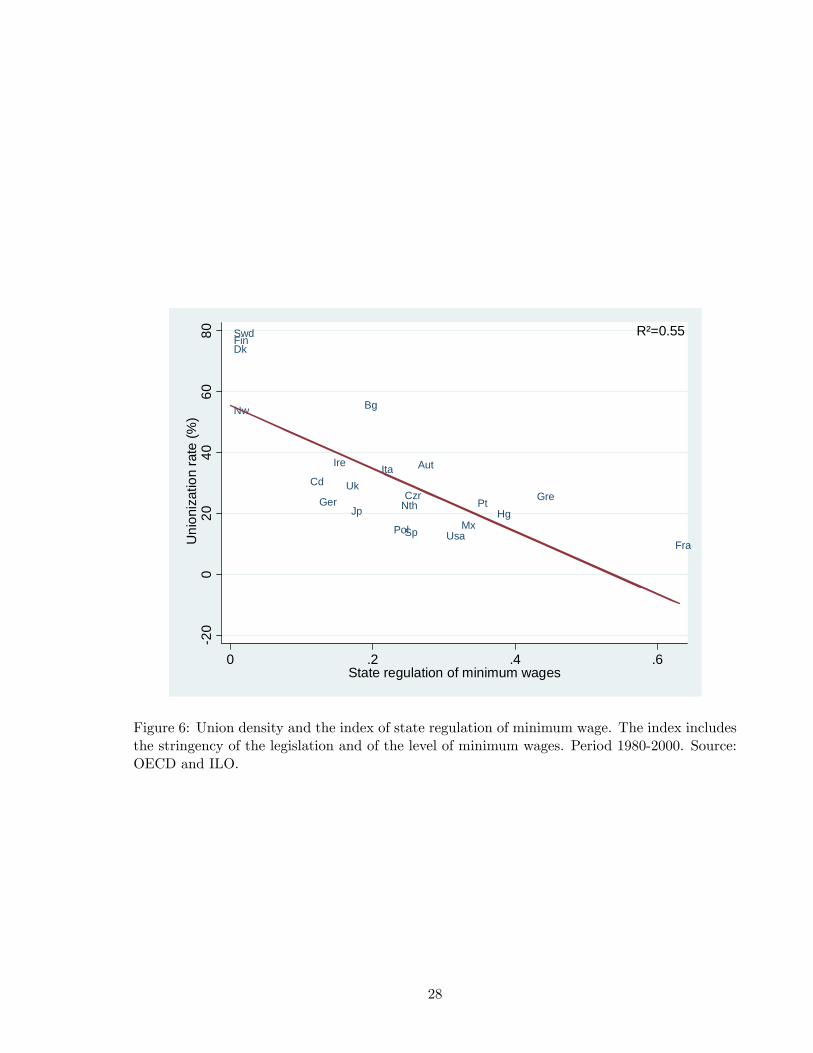
Figure 6 depicts the cross-country correlation between workers�involvement in unions and
the degree of state regulation of wage �oors in OECD countries on average over the period 1980-
2003. We construct the composite index of the extent of state regulation of minimum wages by
combining information on the stringency of the legislation minwage_legislation and information
26

on the minimum wage levels minwage_level. The global composite index minwage is de�ned as
the product between the two indexes minwage_legislation and minwage_level.
The vertical axis shows the average union densities by country over that period. Nordic
countries display the highest unionization rates over that period, with a 82 percent rate in
Sweden and a 77 percent rate in Denmark. Countries such as Austria and Germany fall in the
middle part of the picture with union density rates at around 40 percent. Anglo-Saxon countries
like United-Kingdom or Canada, belong to the same middle group. And Mediterranean countries
show the lowest unionization rates, with less than 10 % in France or Spain. Note that Italy is a
clear outlier, with a unionization rate close to 40 %.
The horizontal axis shows the composite index minwage index measuring state regulation of
minimum wage. As we can see on the Figure, the correlation between the composite index of
wage regulation and unionization rates is strongly negative. Nordic countries which have very
high unionization rates also display the weakest state regulations. There is no legal minimum
wage in these countries: wage �oors are negotiated at industry level, and there is a substantial
amount of dispersion in wage �oors across regions, industries, quali�cations and ages. The same
picture holds for Continental countries like Austria and Germany, which combine relatively high
union density rates and the absence of statutory minimum wage. In contrast, Mediterranean
countries display the highest level of state intervention to set minimum wages. Countries like
France not only set minimum wages by law but they also limit the scope for derogations and for
direct negotiations by social partners. The one clear exception among Mediterranean countries
is Italy. This country does not have a statutory minimum wage, hence its lower ranking in
terms of our index of state regulation. However, in Italy, wage �oors negotiated at the industry
level are automatically extended to other industries. Finally, we see noticeable di¤erences within
the group of Anglo-Saxon countries. Those with high index of state regulation like the United
States are also characterized by low union densities. In contrast, Great-Britain appears to have
a relatively high union density and a lower index of state regulation, which in turn results both,
from unions being so powerful prior to the 1980s and the fact that wage �oors were negotiated
by wage councils before 1993.
We explore this correlation pattern further by running OLS regressions between unionization
rates and our index of state regulation of the minimum wage. To maximize the number of
observations, we run this estimation over three time periods, computing the average of the
composite index respectively over the periods 1980-84, 1990-94 and 2000-2003. We also look at
the correlation between unionization rates and the two sub-indexes which capture respectively
the existence of a legal statutory minimum wage and the degree of dispersion in minimum wages.
We evaluate the correlations between unionization and the two sub-indexes taken separately, and
27
Aut
Bg
CdCzr
DkFin
Fra
Ger GreHg
Ire Ita
JpMx
Nth
Nw
Pol
Pt
Sp
Swd
Uk
Usa
20
020
4060
80 U
nion
izat
ion
rate
(%)
0 .2 .4 .6State regulation of minimum wages
R²=0.55
Figure 6: Union density and the index of state regulation of minimum wage. The index includesthe stringency of the legislation and of the level of minimum wages. Period 1980-2000. Source:OECD and ILO.
28

between unionization and the interaction terms between these sub-indexes and the indicator
measuring the level of minimum wages.
Table 1- Column (1) reports the cross-country estimated correlation between unionization
rates and the extent of state regulation of minimum wage over the period 1980-2003. This corre-
lation is highly negative, and statistically signi�cant at the 1 percent level. Almost 45 percent of
the cross-country variation observed in the state regulation index is associated with di¤erences
in unionization rates. Table 1- Columns (2)-(5) show that the same negative correlation pattern
holds when we look at the two sub-indexes, or when we combine these sub-indexes with the
level of minimum wage. Overall, this �rst table suggests a strong negative correlation between
unionization rates and the extent to which the state strictly regulates minimum wage.
Table 1: Cross-country correlation between state regulation of minimum wage and union density:OECD countries 1980-2003. OLS.Dependent variable State regulation of minimum wages
Compositeindex
(1)
Legal(2)
Dispersion(3)
Legal*Level
(4)
Dispersion*Level
(5)
Unionization rate-.518***
(.083)-1.568***
(.156)-.587***
(.134)-.606***
(.099)-.214***
(.099)R2 .441 .658 .262 .442 .102Observations 58 58 58 58 58
C - Time variation
The negative correlation between union density and state regulation of minimum wage also
appears to hold over the time period 1980-2003 within countries. Countries which have experi-
enced the sharpest decline in union densities are also those that have tightened state regulation
of wage �oors the most. A striking example is the United Kingdom where wage �oors used to
be set by unions before the country embraced a statutory minimum wage in 1999 to o¤set the
decline of union bargaining power. What happened is that the unionization rate had fallen from
50 % in 1980 to less than 30% in the late 1990�s, in part as a result of Margaret Thatcher�s
crackdown on strikes in 1982. Meanwhile, the political pressure from the workers to get a legal
minimum wage has gained momentum, leading Tony Blair to introduce a statutory minimum
wage. Of course the negative relationship can run both ways. It might be the case that union
densities have mainly increased in countries where statutory minimum wages are absent, like
Scandinavian countries, because workers cannot rely on state regulation and have strong incen-
tives to coordinate themselves to defend their wages. Conversely, the decline in union densities
29

could have triggered changes in minimum wage legislations.
Table 2 reports the within correlation between the evolution of the composite index of state
regulation of minimum wages and the evolution of union density. We focus on two time periods,
the early 1980s and the early 2000s, to allow for enough time variation. The regressions control
for country �xed e¤ects and linear time trends.
Table 2 - Column (1) reports the within correlation between contemporaneous values of
unionization rate and state regulation of minimum wage. A strong negative correlation shows
up, the e¤ect being statistically signi�cant at the one percent level. Table 2 - Column (2) reports
the correlation between the index of state regulation of minimum wage and the lagged value of
union density. When looking at state regulation in the early 1980�s, we use union density in the
early 1970s (1970-74). The estimated coe¢ cient is strongly negative and statistically signi�cant
at one percent level. Lower unions rates during the 70�s are associated with more stringent
minimum wage regulation by the state a decade or two later. This result might account for the
rising political support in favor of an increase in statutory minimum wages in countries where
the bargaining power of unions is declining. This is typically the case of the United States, as
we show below.
Table 2: Time variations in unionization rates and state regulation of minimum wages. OECDcountries: 1980-2003. OLS
Dependent variableState regulation of minimum wages
(Composite index)(1) (3)
Unionization rate-1.089***
(.312)
Unionization rate (-1)-0.528**
(.262)Country �xed e¤ects Yes*** Yes***
Time dummies Yes*** Yes***
Observations 36 36
3.1.2 Evidence from the United States
The United States were the �rst country to implement a statutory minimum wage after the
enactment of the Fair Labor Standard Act in 1938. As the title of the act makes it clear, the
statutory minimum wage was aimed at o¤setting the negative e¤ects of the Great Depression by
granting workers a fair wage guarantee. The historian Jonathan Grossman relates the following
story about the birth of the Fair Act : �While President Franklin Roosevelt was in Bedford,
Mass., campaigning for reelection, a young girl tried to pass him an envelope. But a policeman
30

threw her back into the crowd. Roosevelt told an aide, "Get the note from the girl." Her note read,
I wish you could do something to help us girls....We have been working in a sewing factory,...
and up to a few months ago we were getting our minimum pay of $11 a week... Today the
200 of us girls have been cut down to $4 and $5 and $6 a week. To a reporter�s question, the
President replied, "Something has to be done about the elimination of child labor and long hours
and starvation wages." � (in Public papers and Addresses, 1936).
Similarly, since the 1990s, partly as a result of workers�di¢ culty to organize and defend
wages, the United States have experienced a steady rise in minimum wages at the state and
federal levels. The federal minimum wage remained unchanged at $3.35 from 1981 to 1990,
when it was raised up to $3.80. During the eighties, states such as Alaska, Connecticut and
Massachusetts began to set a higher minimum wage and by 1989, 15 states had their minimum
wage higher than the federal one. After the rise in federal minimum wage up to $4.25 in 1991, as
many as 10 states (and DC) began to implement �oors above the federal level. A considerable
increase in the federal level up to $5.15 in 1997 reduced the number of states with �oors higher
than the federal minimum. From 1997 to July 2007, the federal minimum wage has remained
stable at $5.15. But no less than 32 states began to set their minimum wage above the federal
minimum wage. Since 2007, the Federal government is catching-up by raising the federal level
up to $5.85 in 2007, and it should raise it again up to $7.25 in July 2009.
Figure 7 shows that this evolution pattern of minimum wage is negatively correlated with the
evolution pattern of union density since the 1990s. The horizontal axis shows time di¤erences in
the evolution of the federal minimum wage, while the vertical axis reports the time di¤erences
in the evolution of the average unionization rate in the United States. We smooth out short run
�uctuations by taking �ve year averages in 1990, 1995, 2000, and a three year average for the
period 2005-2007. While average union density has dropped by 50 percent over the whole period,
the federal minimum wage has increased by 50.6 percent over that same period. In Appendix
A.3, Figures A.3, A.3, A.3, A.3 and A.3 report the same evolution pattern of minimum wage
and union density at the state levels. It turns out that all states are characterized by a negative
correlation between the evolution of union density and that of the minimum wage. Naturally,
this dynamics could be driven by speci�c state e¤ects and speci�c state time trends. We thus
explore further this correlation pattern by running OLS estimates that control for these factors.
Table 3 shows the results from regressing minimum wages over union densities in the cross-
US-state panel. In this table, we control for state �xed e¤ects and state speci�c time trends.
We are thus looking at the within correlation between minimum wage levels and union rates.
The estimates cover the period 1997-2007, when a large bulk of states decided to increase their
minimum wage. Table 3 - Column (1) and (2) report the results for states that had a minimum
31

44.
55
5.5
6M
inim
wag
e le
vel (
$)
7.5
88.
59
9.5
1010
.511
11.5
Uni
on d
ensi
ty ra
te (%
)
1990 1992 1994 1996 1998 2000 2002 2004 2006period...
Figure 7: Evolution of the federal minimum wage and the average union rate (private sector) inthe United States.
wage above the federal level between 1997 and 2007. We see strongly negative coe¢ cients,
which are statistically signi�cant at the one percent level in the speci�cation with state �xed
e¤ects (Column (1)) and at the 5 percent level in the speci�cation including state speci�c trends
(Column (2)). The coe¢ cients are also economically signi�cant. The �rst speci�cation suggests
that a 1 dollar increase in the minimum wage is associated with a 12 percent decrease in union
density. Table 3 - Column (3) - (4) report the estimates for all states, including states which
have sticked to the federal minimum wage level during that period. The correlations between
minimum wage levels and union densities remain negative and statistically signi�cant. But these
coe¢ cients are smaller than in columns (1) and (2) respectively, suggesting that the decrease in
union density has been higher in states which have increased their minimum wages above that
of the federal state.
3.2 Quality of labor relations
We now document on the main channel of the model linking union membership, investment in
cooperation on the labor market, and state regulation of the minimum wage.
32

Table 3: Time variation in union density and minimum wage in the United States: 1997-2007
Dependent variableMinimum wages(States with wage �oorshigher than the federal one)
Minimum wages(All States)
(1) (2) (3) (4)
Union density-.125***
(.017)-.038**
(.017)-.120***
(.016)-.030**
(.016)
State �xed e¤ects Yes*** Yes*** No Yes***
State speci�c trends No Yes*** No Yes***
R2 .63 .85 .63 .88Observations 430 430 451 451
3.2.1 Correlation between the quality of labor relations, union membership andstate regulation of wages
We measure the perceived level of cooperation in the labor market by the quality of the relation-
ship between workers and managers. We �rst use the Global Competitiveness Reports, a survey
sent out to thousands of executives each year across more than 50 countries. Among other ques-
tions, executives are asked to respond to the following statement: �Labor/employer relations
are generally cooperative�. Responses may vary from 1 for strong disagreement to 7 for strong
agreement. One may of course worry about this only re�ecting the perception of executives.
We thus use additional information from the International Social Survey program (ISSP), which
asks similar questions but for all categories of citizens. The question is the following: �In all
countries there are di¤erences or even con�icts between di¤erent social groups. In your opinion,
how much con�ict is there between management and workers in your country?� Responses are
equal to 1 for �very strong con�ict�, 2 for �strong con�ict�, 3 for �not very strong con�ict�, and
4 for �no con�ict at all�. Henceforth we shall focus on workers�answers only, to contrast them
with the executives�survey.
Figure 1 reports the correlation between the executives�beliefs in cooperative labor relations
and the unionization rates across OECD countries in 2000. As it turns out, the correlation
is strongly positive. We then perform the same exercise but looking at workers� beliefs in
cooperative labor relations. The same correlation shows up in Figure 8. Thus, it appears that
higher union density is associated with higher beliefs in cooperation by both managers and
workers.
The picture is completely reversed when we look at the correlation between beliefs in the
quality of labor relations and the degree of state regulation of the minimum wage. Figure
2 reports the correlation between state regulation and the executives�beliefs, whereas Figure
33

9 reports the correlation between state regulation and workers� beliefs. In either case, the
correlations are strongly negative, suggesting that beliefs in cooperation are more optimistic in
countries with lower state regulation of the labor market.
Table 4 presents the results of the associated OLS regression. Column 1 reports the positive
correlation between the quality of labor relation and union density in 2000. We measure the
degree of cooperation by the GCR index which provides more observations, even if the correlation
pattern is lower than that obtained with the ISSP index. Column 1 shows that the R2 is 0.33,
and union density is statistically signi�cant at the one percent level. The second column shows
that the correlation between the quality of labor relation and union density remains statistically
signi�cant at the �ve percent level when one controls for the unemployment rate and traditional
labor market institutions taken from Nickell et al. (2001). Columns 3 and 4 report the strong
negative correlation between the GCR index of the quality of labor relation and our index of state
regulation of the minimum wage in the 2000s. The negative correlation is highly statistically
signi�cant at the one percent level even when one controls for the unemployment rate and other
labor market institutions in Column 4, none of which appear to be statistically signi�cant.
Table 4: Quality of labor relations in OECD countries: 2000s. OLS estimatesDependent variable Quality of labor relation
(1) (2) (3) (4)
Unionization rate2.091***
(.716)2.140**
(.912)State regulationof minimum wages
-3.339***
(.876)-2.821***
(.827)
Unemployment rate-7.301*
(3.802)-12.625**
(4.170)
Replacement rate.555(.941)
.422(.860)
Bene�t duration-.466(.570)
.235(.437)
Employment protection-.098(.289)
.152(.259)
Tax wedge-1.810(1.682)
-.366(1.052)
R2 .34 .56 .46 .74Observations 18 18 18 18
Now clearly, the causality between beliefs in cooperation and the extent of state regulation,
can run both ways. On the one hand, one should expect higher support for state intervention
in countries where beliefs in cooperative labor relations are weaker. Figure 10 documents this
point by looking at the correlation between the fraction of population who believe that it is
34

Aut
Czr
Fra
GerHg Jp
Nw
Pol Sp
Uk
Usa
020
4060
80U
nion
den
sity
.3 .4 .5 .6 .7 .8Cooperative Labor Relations: Workers
R²=0.62
Figure 8: Correlation between Union density and Workers�s beliefs in Cooperative labor rela-tions. OECD and ISSP 1999 database.
not the government�s responsibility to set wages, and beliefs in cooperative labor relations. The
indicator of support for wage regulation by the state is drawn from the 1996 publication of the
International Social Survey program database. There, we focus on the following question: �Here
are some things the government might do for the economy. Please show which actions you are
in favor of and which you are against: control wages by law?�. The answers are ranked from
1, for a strong agreement, to 5 for a strong disagreement. Figure 10 shows, on the vertical
axis the mean answer to this question for each country, and on the horizontal axis the index of
beliefs in cooperative labor relations. The correlation between these two variables turns out to
be strongly negative with 41 percent of the variation in public support for state regulation of
wages across countries being associated with di¤erences in beliefs about the cooperative nature
of labor relations.
35
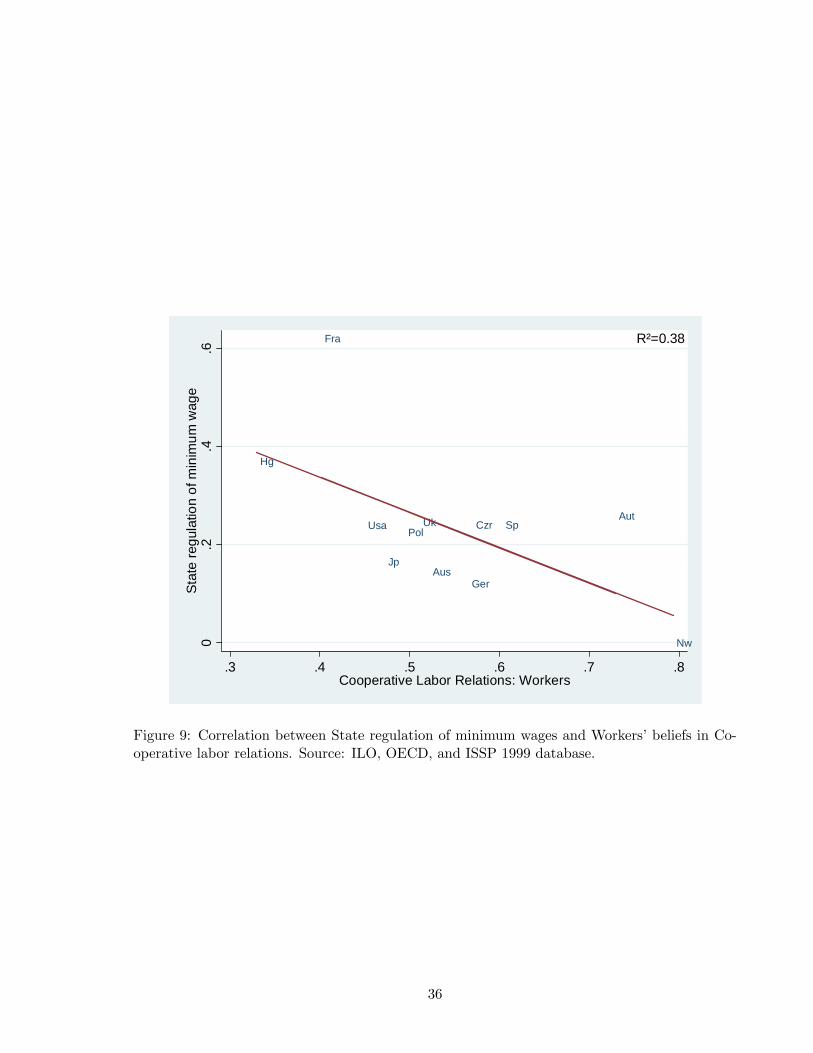
Aus
AutCzr
Fra
Ger
Hg
Jp
Nw
PolSpUkUsa
0.2
.4.6
Stat
e re
gula
tion
of m
inim
um w
age
.3 .4 .5 .6 .7 .8Cooperative Labor Relations: Workers
R²=0.38
Figure 9: Correlation between State regulation of minimum wages and Workers�beliefs in Co-operative labor relations. Source: ILO, OECD, and ISSP 1999 database.
36

Aus
Cd
Fra
Ger
Ire
Ita
Jp
Nw
Nz
Sp
Swd
Uk
Usa
22.
53
3.5
Is it
the
role
of t
he s
tate
to re
gula
te w
ages
?
3 4 5 6 7Cooperative Labor Relations
R²=0.41
Figure 10: Correlation between the extent of cooparative labor relation (GCR 1999) and theshare of people who disagree with the folling question: "Is it the role of the government todirectly set wages?" (ISSP 1996).
37

3.2.2 Investment in cooperation and the quality of labor relations
This section documents on the relationship between unions�investment in cooperation and the
quality of labor relations. The model predicts a strongly positive correlation between the two.
We measure the investment in cooperation by using two main indicators. The �rst indicator
is the degree of workplace presence of unions. The workplace appears indeed to be the main
location for service provision to union members and for providing protection and support during
the negotiation with management. Strong workplace representation thus directly a¤ects the
bene�ts from union membership and also the extent to which voice and cooperation prevail over
exit in labor relations. We measure the workplace presence of unions by using the indicator
of Checchi and Lucifora (2002) for the 1990s. The indicator ranges from 0 to 1, with a higher
score suggesting a higher representation of unions in all workplaces. The second indicator of
investment in cooperation is the degree to which unions try to coordinate and centralize their
decisions. We expect that beliefs in cooperation and union membership are higher wherever
unions have been able to create and defend centralized institutions of collective bargaining with
employers. We measure this using the coordination index of Checchi and Lucifora (2002) for the
1990s. The index combines information about the degree of centralization in wage bargaining
and wage coordination across the main workers unions, on a quinquennial base. The indicator
include two vertical and horizontal dimensions in negotiations. The vertical dimension captures
how bargaining is divided between di¤erent levels (national, industry, �rm) within a union con-
federation. The horizontal dimension captures the number of union confederations. The index is
ranked between 0 and 1, a higher score indicating a greater level of centralization/coordination.
According to this criteria, France has a low score because workers union confederations are
highly divided and enterprise bargaining has greater importance than sectorial and national
bargaining. In contrast, Nordic countries have a much greater score. This is not necessarily due
to more centralization, since a trend towards decentralization has occurred in these countries
since the eighties. But the degree of coordination between unions confederations is much greater
compared to other countries.
Figure 11 reports the correlation between the indicator of workplace presence of unions and
the perceived quality of labor relations measured by the Global Competitiveness Reports 1999.
Figure 12 reports the same correlation pattern between the quality of labor relations and the
degree of coordination and centralization of negotiations between trade unions. In both cases,
steady positive correlations show up, suggesting that the quality of labor cooperation is strongly
associated with investment in cooperation by unions. Approximately 40-50 percent of the cross-
country heterogeneity in the quality of labor relations could be associated with di¤erences in
38

Aut
Bg
Dk
Fin
Fra
Ger
Ire
Ita
Nw
Sp
Swd
Uk
.2.4
.6.8
1W
orkp
lace
pre
senc
e of
uni
ons
3 4 5 6 7Cooperative Labor Relations
R²=0.41
Figure 11: Correlation between the workplace presence of unions and the quality of labor rela-tions. Sources: Checchi and Lucifora (2002) and CGR (1999).
the unions�e¤orts to be present in �rms locally and to coordinate and centralize negotiations
nationally.
3.3 State regulation of wages, social experimentation and cooperation
3.3.1 Historical evidence
Our model predicts history dependence in beliefs about cooperation: in particular, for given
initial beliefs, di¤erent cooperative equilibria might emerge depending upon the history of suc-
cesses or failures of negotiations between unions and �rms. Crouch (1993) provides overwhelming
evidence of such historical dependence in the development of unions and the quality of labor
relations.
Unionization rates were quite comparable across European countries at the end the 19th
century, ranging from 3 percent in Netherlands, 4 percent in Norway, 5 percent in Sweden, 6
percent in France to 13 percent in UK and Denmark. But the development of unions and of
cooperation on the labor market has been deeply in�uenced by the subsequent social history of
39

Aut
Bg Dk
Fin
Fra
Ger
Ire
Ita
Nth
Nw
Swd
Uk23
45
Cen
traliz
atio
n an
d co
ordi
natio
n of
neg
otia
tions
3 4 5 6 7Cooperative Labor Relations
R²=0.54
Figure 12: Correlation between the centralization and coordination of negotiation and the qualityof labor relations. Sources: Checchi and Lucifora (2002) and CGR (1999).
40

agreements and con�icts between �rms and union workers.
Remarkably enough, labor relations were fairly hostile in Denmark in the 19th century, and
the Great Lock-Out of 1898 is probably the single biggest industrial dispute in Europe over
the 19th century. However this dispute led to a social pact between organized labor and �rms,
whereby unions would recognize the private property of �rms by capitalists, and in exchange,
capitalists and workers unions would negotiate wages directly on a bilateral basis, without any
state intervention. Ever since, the unionization rate has steadily risen in Denmark and this
country displays one of the highest quality of labor relation in the 2000s. The same picture
holds for Belgium, Austria, Germany, United Kingdom and Sweden. According to Crouch,
labor relations in these countries used to be highly con�ictual. But precisely this encouraged
employers and the state to design institutions aimed at involving unions in the regulation of
labor markets in order to contain social disruption. This evolution pattern departs from that
of France where central governments, whether from the right or from the left, have remained
traditionally suspicious vis-a-vis unions and have therefore priviledged centralized negotiations
at the government level, for example during the Front Populaire in 1936 or more recently with
the Grenelles Agreement in the aftermath of May 1968.
Table 5 provides quantitative evidence regarding the impact of the historical state involve-
ment on the development of the quality of labor relations. There, we bear on Crouch�s analysis
of the attitudes of the states towards unions in Europe during the 19th century15 Crouch classi-
�es states in three categories. The �rst category comprises states that were most hostile to the
development of unions and consequently more prone to directly regulate labor market and settle
disputes through centralized decisions. This group includes the main catholic strongholds in Eu-
rope, namely France, Italy, Spain and Portugal. Crouch account for this fact by stressing that
in these countries the central government needed to assert its authority over the Catholic church
and to confront all forms of organized interests, including worker organizations. The second
category comprises �ve countries where the state was rather neutral vis-a-vis labor organization
and would consequently let them directly with �rms. This is the case of Belgium, Denmark,
Norway, Sweden, Finland, UK and Ireland. Finally, the third category consists of countries
where the State would encourage union involvement in the regulation of labor markets. This
category includes Austria, Germany, Netherlands, Switzerland. In particular, the Austrian and
German governments were �rst to set up elected workers commissions to run pensions and social
insurance schemes as of the 1880s.
Table 5 shows the correlation between the 1999 GCR index of quality of labor relation
15Blanchard and Philippon (2006) show that these initial attitudes of the states towards union might alsoexplain current unemployment rates.
41

and the initial interplay between the State and unions. The cluster of countries with hostile
states is taken as the reference. Table 5 - Column 1 shows that the quality of labor relation in
1999 is positively correlated with the fact of initially belonging to the second or third category
of neutral and supportive states towards unions. The OLS coe¢ cients are statistically highly
signi�cant and the R2 is .55. Table 5 - Column 2 shows that the correlation remains statistically
signi�cant when one controls for contemporaneous values of unemployment and other labor
market institutions, none of these latter variables being statistically signi�cant.
Table 5: Quality of labor relations in OECD countries in 2000s and attitudes of the state towardsunions in the 19th century
Dependent variable Quality of labor relation GCR index(1) (2)
State attitudes towardsearly unions in the 19th
Hostile = 1 Reference Reference
Neutral = 11.121***
(.301)1.122**
(.425)
Supportive = 11.516***
(.447)1.754**
(.652)
Unemployment rate-6.549(5.709)
Replacement rate1.148(.950)
Bene�t duration-1.720(1.141)
Employment protection-.258(.603)
Tax wedge-1.864(2.040)
R2 .55 .74Observations 14 14
3.3.2 The e¤ect of past minimum wages and unionization rates on current beliefsin cooperation
Here we provide additional quantitative evidence on the in�uence of past minimum wage policies
and past unionization rates on current beliefs towards labor relations. For that purpose, we use
the General Social Survey database which provides information on Americans�attitudes towards
labor institutions as well as detailed information on the country of origin of their ancestors and
the wave of immigration to which they belong. This database covers the period 1972-2004 and
provides information on the birth place and the country of origin of the respondent�s forebears
42

since 1977. The GSS variable for the country of origin reads as follows: �From what countries
or part of the world did your ancestors come?�. Origins cover nearly all European countries.
The GSS also asks whether the respondent has con�dence in labor unions, namely: �Would
you say you have a great deal of con�dence, only some con�dence, or hardly any con�dence at all
in organized labor institutions?�. We measure the extent of con�dence in unions with a dummy
variable equal to 1 if the respondent answers �a great deal of con�dence�, and to zero otherwise.
We also have information on whether the respondent belongs to a labor union or not.
We use the information about the past union densities and the existence of statutory min-
imum wage in the home country from the early 1950s. Note that we do not have data on the
level of minimum wage, but only on the existence of statutory wage �oor in some countries such
as France or the United States. To assess the e¤ect of minimum wage institutions on current
attitudes towards unions, we focus on second and �rst generations of Americans born after 1950,
and whose parents or themselves are likely to have been in�uenced by these institutions. In order
to get interpretable results, we restrict attention to countries of origin with more than 15 obser-
vations, which leaves us with the following set of countries of origins: Austria, France, Germany,
Ireland, Italy, Japan, Netherlands, Sweden, and the United Kingdom. The data description are
reported in the Appendix.
Table 6 - Line (I) reports the probit marginal estimates of the e¤ect of past levels of union-
ization rate in the home country on current level of trust in unions, and on the probability of
belonging to a union. We control for age (age squared), gender, number of years of education,
income categories, and the number of years of education of the parents. Standard errors are
clustered at the level of the country of origin. Column (1) shows a strong correlation between
past union rates in the country of origin and the probability that the respondent has con�dence
in unions now. The relation is statistically signi�cant at the one percent level. The size of the
e¤ect is also large, with a one percent increase in past union rates in the home country being
associated with 0.18 percent increase in the probability that the respondent has a great deal
of con�dence in this institution. Column (2) reports the correlation between past unionization
rate in the home country and the current probability of belonging to a union. The correlation
is also positive and statistically signi�cant at the one percent level. Remarkably enough, past
union density is a main predictor of current unionization behavior, and its e¤ect is one order of
magnitude higher than most other individual characteristics.16
Table 6 - Line (II) reports the correlation between past regulation of minimum wages by
16Similar results about the in�uence of the country of origin on beliefs are found in Rice and Feldman (1997) andmany others (see: Fernandez and Fogli (2005), Fernandez (2007) and Algan and Cahuc (2006) for a presentationof this literature).
43

the state in the country of origin and current unionization behavior in the United States. As
reported in Column (I), that the country of origin had a statutory legal minimum wage in the
early 1950s strongly reduces the probability that the respondent trusts unions.
Table 6: Historical labor market institutions in the home country and current unionizationattitudes of Americans by country of origin. Probit estimates
Con�dence in unions (=1)(1)
Union membership (=1)(2)
Union density (I)in home country 1950
.186***
(.057).248**
( .113)N 1175 1015R2 .030 .019Legal minimum wage (II)in home country 1950
-.447***
( .139)-.192( .178)
N 928 871R2 .054 .021
Marginal e¤ects with robust standard error GSS : ***:1%, **: 5%, *: 10Additional controls: gender, age, education, income category
3.3.3 Experimentation and update of beliefs in cooperation
We just provided evidence to the e¤ect that beliefs about unions are in�uenced by past union-
ization rates and past minimum wage policies. This �nding is consistent with the predictions
of the model concerning the persistent e¤ect of historical institutions on current beliefs. Now
the model also stresses that this historical dependence runs through a learning process and the
resulting updating of beliefs. In this section, we provide evidence of this updating of beliefs.
To measure the evolution of beliefs across generations, we use information on the waves of
immigration of the respondents. Respondents are asked if they are born in the United States
and how many of their parents and grand-parents were born in the country. The answer to
the question on parents birthplace is scaled at 0 if both parents are born in the US, at 1 if
only the mother is born in the US, and at 2 if only the respondent�s father is born in the
country. The answer on grand-parents birthplace is scaled from 0 to 4 indicating the number
of grandparents born in the US. To get representative samples, we merge the �rst and second
generations Americans into one group, and the third and fourth generations Americans into
another group.
To assess the beliefs about unions in the home country, we use the respondents�answers to
the following question from the World Values Survey database (which is quite similar to the
question in GSS database): �Do you have a great deal of con�dence, quite a lot of con�dence,
44

not very much con�dence or none at all con�dence in unions?�. We create a dummy variable
equal to one if the respondent answers �a great deal of con�dence�or �quite a lot of con�dence�,
and to zero otherwise.
Table 7 reports the probit estimates of the probability that Americans do have con�dence in
unions. We focus on �rst and second generation Americans. The coe¢ cients associated with the
country of origin correspond to the marginal probit estimates. To explore further the speci�c
role of the country of origin in the formation of beliefs, we control for individual characteristics,
including age, age squared, employment status and income category. Americans with Swedish
origins are taken as the reference group. The �rst result is that the country of origin plays
a statistically signi�cant role on the level of con�dence in unions. All the country of origin
dummies are statistically signi�cant at the one percent level. Moreover, the coe¢ cients are
economically sizeable. For instance, the probability that Americans with French origins have
con�dence in unions is 10 percent lower than for Americans with Swedish origins.
We then explore the extent to which these beliefs are consistent with those that prevail in
the country of origin and we are interested in their rate of convergence. Figure 13 reports the
correlation between the current level of con�dence in unions in the country of origin and the
corresponding level of con�dence of the �rst and second generations Americans originating from
that country. The horizontal axis reports the fraction of individuals who have con�dence in
unions in the country of origin, whereas the vertical axis reports the fraction of Americans who
trust unions depending on their country of origin. The �gure shows a strongly positive correlation
between these two variables, equal to 0.38, with 20 percent of the variation in Americans�beliefs
towards unions being associated with di¤erences in beliefs across countries of origin. Moreover,
the variance in Americans�beliefs in unions across di¤erent countries of origin is quite large,
with the share of con�dence in unions ranging from 0.05 percent to 0.25 percent.
We then assess the convergence in beliefs by focusing on older waves of immigration. Figure
14 reports on the vertical axis the level of con�dence in unions of third and fourth generations
Americans, and on the horizontal axis the level of con�dence in the country of origin. In contrast
to Figure 13 above, here the correlation between the beliefs of third and fourth generations
Americans and the beliefs in the corresponding home country is close to zero and no longer
signi�cant. Moreover, the variance in the level of con�dence across third and fourth generations
Americans from di¤erent countries of origin is much lower compared to the �rst and second
generations Americans, the range of variation now lying in the interval [0:075; 0:145].
45

Aut
Cd
Fin
Fra
Ger
Ire
Ita
Jp
Pt
Sp
Swd
Uk
.05
.1.1
5.2
.25
Con
fiden
ce in
labo
r uni
ons:
1st
2sd
gen
erat
ion
Am
eric
ans
.2 .3 .4 .5 .6Confidence in labor unions in the home country
R²=0.20
Figure 13: Con�dence in unions in the home country and by Americans of �rst or secondgenerations. Source: WVS 1980-2000, GSS 1977-2004.
46

Cd
Fin
Fra
Ger
Ire
ItaJp
Pt
Sp
Swd
Uk
.06
.08
.1.1
2.1
4C
onfid
ence
in la
bor u
nion
s: 3
d4t
h ge
nera
tion
Amer
ican
s
.2 .3 .4 .5 .6Confidence in labor unions in the home country
R²=0.01
Figure 14: Con�dence in unions in the home country and by Americans of third or fourthgenerations. Source: WVS 1980-2000, GSS 1977-2004.
47

Table 7: Con�dence in unions of 1st and 2sd generation Americans by country of origin. Marginale¤ects
Con�dence in unions =1Coe¤ Std Error
Austria -.071*** (.004)Canada -.108*** (.003)Finland -.028*** (.007)France -.109*** (.008)Germany -.091*** (.007)Ireland -.071*** (.004)Italy -.043*** (.009)Japan -.088*** (.013)Portugal -.068*** (.019)Spain -.099*** (.012)Sweden ReferenceUnited Kingdom -.089*** (.003)Pseudo-R2 .070Observations 921Marginal e¤ects with robust standard error. GSS databaseControls: age, age2, education, employment status, income***:1%, **: 5%, *: 10%
4 Conclusion
In countries with high union density and highly cooperative labor relations, the state is less
prone to regulating the minimum wage. In such countries, there is no need for a legal minimum
wage because social partners negotiate wages directly. In contrast, in countries with strong
state regulation of the minimum wage, social dialogue is not very e¤ective and union density
is low. Our paper develops an explanation for these contrasting situations. We argue that
strong state regulation of the minimum wage crowds out social experimentation and learning
about cooperation. This crowding out in turn progressively undermines cooperation and leads
economies towards steady-state equilibria with bad labor relations and high minimum wage
regulations. From this perspective, state regulation of the minimum wage can have large long
run costs that have been largely disregarded by the economic literature so far. The importance of
the contrast between Scandinavian countries, which display good labor relations and good labor
market performance on the one hand, and Mediterranean countries with poor labor relations
and poor labor market performance on the other hand, suggests that such costs might actually
be large.
48

References
[1] Acemoglu, A., Aghion, P., Lelarge, C., Van Reenen, J. and Zilibotti, F., 2007, Technology,
Information and the Decentralization of the Firm, Quarterly Journal of Economics, 122,
1759-1800.
[2] Akerlof, G., 1980, A Theory of Social Custom of Which Unemployment May Be One Con-
sequence, Quarterly Journal of Economics 95, 749-775.
[3] Algan, Y. and Cahuc, P., 2007, Social Attitudes and Economic Development: An Epidemi-
ological Appraoch, Working Paper CEPR.
[4] Algan, Y. and Cahuc, P., 2006, Civic Attitudes and Labor Market Institutions, American
Economic Journal, Forthcoming.
[5] Blanchard, O., and Philippon, T., 2006, The Quality of Labor Relations and Unemploy-
ment, MIT Working Paper 2006.
[6] Boeri, T., Brugiavini, A., Calmfors, L., 2001, The Role of Unions in the Twenty-First
Century, Oxford University Press.
[7] Booth, A., 1985, The Free Rider Problem and a Social Custom Model of Trade Union
Membership, Quarterly Journal of Economics 100, 253-261.
[8] Booth, A. and M. Chatterji, 1993, Reputation, Membership and Wages in an Open Shop
Trade Union, Oxford Economic Papers 45, 23-41.
[9] Checchi, D. and Lucifora, C., 2002, Union Density, the Economic Roles of Unions and
Institutions, Economic Policy, vol 17(2), pp. 362-408.
[10] Corneo, G., 1995, Social Custom, Management Opposition and Trade Union Membership,
European Economic Review 39, 275-292.
[11] Crouch, C., 1993, Industrial Relations and European State Traditions. Clarendon Press,
Oxford.
[12] Fernandez, R., 2007, Culture and Economics, New Palgrave Dictionary of Economics, 2nd
edition, edited by Durlauf, S. and Blume, L., Palgrave Macmillan (Basingstoke and New
York)
[13] Fernandez, R. and Fogli, A., 2005, Culture: An Empirical Investigation of Beliefs, Work,
and Fertility, Federal Reserve Bank of Minneapolis, Research Department Sta¤Report 361.
49

[14] Freeman, R. and Medo¤, J. 1984, What Do Unions Do?, New-York, Basic book.
[15] Guiso, L., Sapienza, P. and Zingales, L., 2004, The Role of Social Capital in Financial
Development, The American Economic Review, vol 94(3), pp. 526-556.
[16] Guiso, L., Sapienza, P. and Zingales, L., 2007, Long Term Persistence, Working Paper,
University of Chicago.
[17] Hirshman, O., 1970, Exit, Voice, and Loyalty: Responses to Decline in Firms, Organiza-
tions, and States, Harvard University Press,
[18] Knack, S. and Keefer, P., 1997, Does Social Capital Have an Economic Payo¤, A Cross-
Country Comparison, Quarterly Journal of Economics, vol.112, pp. 1251-1288.
[19] La Porta, R., Lopez-de-Silvanes, F., Shleifer, A., and Vishny, R., 1997, Trust in Large
Organizations, American Economic Review, vol 87, pp. 333-38.
[20] Lindbeck, A., Nyberg S., Weibull, J.W., 1999. Social Norms and Economic Incentives in
the Welfare State, Quarterly Journal of Economics 114, 1-35.
[21] Naylor, R., 1989, Strikes, Free Riders, and Social Customs, Quarterly Journal of Economics
104, 771-785.
[22] Naylor, R. and M. Cripps, 1993, An Economic Theory of the Open Shop Trade Union,
European Economic Review 37, 1599-1620.
[23] Naylor, R. and 0. Raaum, 1993, The Open Shop Union, Wages and Management Opposition,
Oxford Economic Papers 45, 589-604.
[24] Neumark, D. and Wascher, W., 2004, Minimum Wages, Labor Market Institutions and
Youth Employment: A Cross-Sectional Analysis, Industrial and Labor Relations Review,
vol. 57(2), 223-248.
[25] Ostrom, E., 2005, Policies That Crowd Out Reciprocity and Collective Action, in Gintis,
H., Bowles, S., Boyd, R., Fehr, E., (eds), Moral Sentiments and Material Interests, MIT
Press, chapter 9, pp. 253-275.
[26] Persson, T. and Tabellini, G., 2000, Political Economics, MIT Press.
[27] Putnam, R., 1993, Making Democracy Work, Princeton University Press, Princeton, NJ.
[28] Putnam, R., 2000, Bowling Alone: The Collapse and Revival of American Community.
New York: Simon and Schuster.
50
[29] Rice, T., and Feldman, J., 1997, Civic Culture and Democracy from Europe to America,
Journal of Politics, pp. 1143-72.
[30] Tabellini, G., 2005, Culture and Institutions: Economic Development in the Regions of
Europe, IGIER working paper n�292.
[31] Tabellini, G., 2007a, Institutions and Culture, Presidential lecture at the meeting of the
European Economic Association, Budapest.
[32] Tabellini, G., 2007b, The Scope of Cooperation: Norms and Incentives, mimeo, IGIER.
[33] Tocqueville, A., 1835, Democracy in America, Penguin Classics edition 2003.
51

A Appendix
A.1 Typology of short run equilibria in the (qt; �wt) plane
Let us assume that qt = Pr [e = cjht(n; s)] and �wt are exogenous.
>From equations (2) and (4), we know that the measure of unionized workers is positive if and only
if
1� �wt � c" > 0 when it = 0;
1� �wt � cqt(1�2")+" > 0 when it = I:
(A1)
>From equation (6) we know that there is investment in labor relations if and only if
�( �wt; qt) > I: (A2)
Since function � is decreasing with �w and increasing with q; condition (A2) de�nes an area in the
(qt; �wt) plane whose frontier is upward sloping. There is positive investment for values of ( �wt; qt) above
the frontier and no investment for values of ( �wt; qt) below the frontier.
For values of ( �wt; qt) below the frontier, there is zero investment and condition (A1) implies that the
measure of unionized workers is positive if and only if �wt > 1� c" :
For values of ( �wt; qt) above the frontier, there is positive investment and (A1) implies that the measure
of unionized workers is positive if and only if �wt > 1� cqt(1�2")+" : Since it turns out that
�(1� c
qt(1� 2") + "; qt) = 0;
union density is necessarily positive for values of ( �wt; qt) compatible with positive investment.
A.2 Minimum wage regulations in OECD countries
The data on minimum wages come from the OECD database and Neumark and Wascher (2004) for the
levels, and from the International Labor Organization (ILO) for the legislation.
� Minimum wage legislations
The legislation di¤ers mainly depending on the existence of a legal statutory minimum wages, and
the dispersion of minimum wages. These distinctions are documented below.
1. Method of setting
We �rst measure the extent to which minimum wages are directly set by law or by collectively agreed
minimum wages negotiated between social partners. Column 2 of table 8 indicates whether wage
52
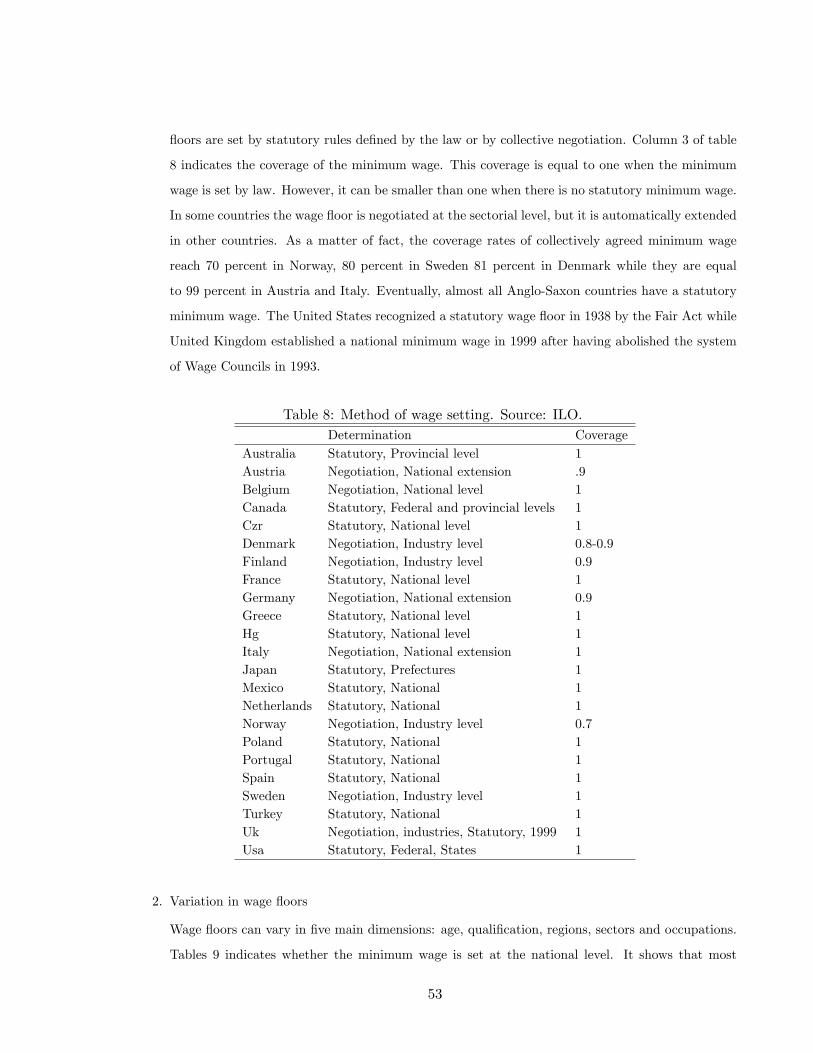
�oors are set by statutory rules de�ned by the law or by collective negotiation. Column 3 of table
8 indicates the coverage of the minimum wage. This coverage is equal to one when the minimum
wage is set by law. However, it can be smaller than one when there is no statutory minimum wage.
In some countries the wage �oor is negotiated at the sectorial level, but it is automatically extended
in other countries. As a matter of fact, the coverage rates of collectively agreed minimum wage
reach 70 percent in Norway, 80 percent in Sweden 81 percent in Denmark while they are equal
to 99 percent in Austria and Italy. Eventually, almost all Anglo-Saxon countries have a statutory
minimum wage. The United States recognized a statutory wage �oor in 1938 by the Fair Act while
United Kingdom established a national minimum wage in 1999 after having abolished the system
of Wage Councils in 1993.
Table 8: Method of wage setting. Source: ILO.Determination Coverage
Australia Statutory, Provincial level 1Austria Negotiation, National extension .9Belgium Negotiation, National level 1Canada Statutory, Federal and provincial levels 1Czr Statutory, National level 1Denmark Negotiation, Industry level 0.8-0.9Finland Negotiation, Industry level 0.9France Statutory, National level 1Germany Negotiation, National extension 0.9Greece Statutory, National level 1Hg Statutory, National level 1Italy Negotiation, National extension 1Japan Statutory, Prefectures 1Mexico Statutory, National 1Netherlands Statutory, National 1Norway Negotiation, Industry level 0.7Poland Statutory, National 1Portugal Statutory, National 1Spain Statutory, National 1Sweden Negotiation, Industry level 1Turkey Statutory, National 1Uk Negotiation, industries, Statutory, 1999 1Usa Statutory, Federal, States 1
2. Variation in wage �oors
Wage �oors can vary in �ve main dimensions: age, quali�cation, regions, sectors and occupations.
Tables 9 indicates whether the minimum wage is set at the national level. It shows that most
53

countries with a statutory minimum wage opt to set a single wage at the national level. Exceptions
are Canada and the United States which sets minimum wages at both the federal and the regional
level. In the United States, some States, mainly in the South, do not implement the Federal law
and others set the minimum wage above the federal �oor. In Canada, each province sets its own
minimum wage, leading to a wide gap in statutory minimum wages. In Japan, the minimum wage
is set at the prefecture level, with some di¤erent wages for di¤erent industries in a given prefecture.
Mexico lies in between, the minimum wage being set at the regional level, but with only three
broad regions and a quite narrow gap between di¤erent regional levels.
We also report the potential existence of sub-minimum rates for young workers and trainees. Such
sub-minimum rates are quite common in OECD countries since they concern around half of them.
Countries which exclude such provisions are: Czech Republic, Greece, Hungary, Japan and Mexico.
But signi�cant di¤erences exist among countries authorizing sub-minimum wage provisions. The
�rst di¤erence lies in the range of ages covered by the provision. Basically provisions would extend
until 24 years old in Sweden or 22 years in Netherlands while such reductions are permitted only
for workers younger than 17 years in France and 18 years in Ireland. The second di¤erence is the
extent of reductions. United-Kingdom stands as a polar case with no minimum wage for people
younger than 21 years. The Netherlands accepts a reduction up to 40 percent of standard minimum
wage at 17 years old while the wage �oor is set at 80 percent of the standard minim wage in France
or Spain for this age.
� Minimum wage levels
The level of the minimum wages measured by the OECD refers in general to a full-time workers in
the industry. The data for countries without statutory minimum wage �oors correspond to the same
de�nition, borrowed from Neumark and Wascher (2004).
Australia
The federal minimum weekly wage divided by the median gross weekly earnings of full-time work-
ers. Prior to 1997, the federal minimum is extrapolated based on Metal Industry Award C14 wages and
National Wage Case decisions. Source: OECD Minimum Wage Database. Method of setting: An in-
dependent Commission (Australian Industrial Relations Commission or AIRC) is responsible for setting
the federal minimum wage via an annual Safety Net Review. Although some state-level legislation also
exists, the federal minimum wage is applicable to the majority of Australian workers. Other provisions:
Minimum wages may di¤er by industry and occupation if the AIRC approves applications to vary mini-
54

Table 9: Variations in wage-setting. Source: ILO.Variations by: Subminimum (Age limits, % of standard minimum wage)
Australia Industries,Regions, Occupation, AgeAustria Industries, Occupation, Age No
Belgium Age20:94%, 19: 88%, 18: 82%17: 76%, <17: 70%
Canada Industries, regions,occupations NoCzr Occupation NoDenmark Industry, Age <18: 40%Finland Industries, Age, Occupations NoFrance Age 17: 90%, <17: 80%Germany Region, Age, Quali�cations TraineesGreece Age, Marital status, Quali�cations NoHg No NoItaly Industry, Age TraineesJapan Industry, Age, Occupation NoMexico No No
Netherlands Age22: 85%, 21: 72,5%, 20: 61,5%, 19: 52,5%,18: 45,5%, 17: 39,5%, 16:34,5%, 15: 30%
Norway Industry, age, Occupation NoPoland No NoPortugal Age <18: 75%Spain Age <18: 89%, suppressed in1998Sweden Industry,Age, Occupation <24: 89%Turkey Age <16: 85%Uk Industry,Age <21: 0%, Change in 1999Usa Age, Job tenure No
55
mum award rates from the federal level. There is also a youth subminimum, with rates ranging from 40
percent to 85 percent of the adult minimum depending on age.
Belgium
The minimum monthly wage for workers aged 21 and over divided by the median gross monthly
earnings of full-time workers. Source: OECD Minimum Wage Database. Method of setting: The private-
sector minimum wage (Revenue Minimum Mensuel Moyen Garanti) is set via a biennial national collective
bargaining agreement between social partners (employers and unions) within the Conseil National du
Travail. This minimum wage is then made mandatory for the entire private sector by royal decree.
Between collective bargaining agreements, the minimum wage is indexed to the consumer price index,
with a formula that adjusts up the minimum two months following a cumulative 2 percent increase in
the CPI. Other provisions: The laws provide for a subminimum wage for employees less than 21 years of
age. This subminimum wage is 70 percent of the adult minimum for employees aged 16 or under, with
the proportion rising by 6 percentage points for each extra year of age.
Canada
Weighted average of provincial hourly minimum wage levels (weighted by the size of the labor force
in each province) divided by median gross hourly earnings of full-time workers. Source: OECD Minimum
Wage Database. Method of setting: Minimum wages are set separately in each province and territory
either by minimum wage boards or by the Lieutenant-Governor in Council. Other provisions: In most
provinces, a single minimum wage applies to workers aged 16 and over. An exception is Ontario, which
allows a slightly lower minimum wage rate to be paid to students under 18 years of age.
Denmark
The average hourly minimum wage divided by an average hourly wage. Source: Dolado, et al. (1996).
Method of setting: There is no legally-mandated national minimum wage. Instead, minimum hourly wage
rates are set via centralized industry-level collective bargaining agreements, which may be supplemented
by agreements at the plant level. Other provisions: Minimum wages may vary considerably at the industry
level. In addition, workers under 18 years of age are generally subject to a lower minimum wage.
Finland
Average monthly minimum wage divided by an average monthly wage. Source: Dolado, et al. (1996).
Method of setting: There is no legislated national minimum wage. Instead, minimum wage rates are set
via centralized industry-level collective bargaining agreements. The law requires all employers (including
non-union employers) to pay the minimum rates contained in these collective bargaining agreements.
Other provisions: Minimum wages may vary considerably at the industry level.
France
56

Gross annual equivalent of the annual minimum wage divided by median gross annual earnings of
full-time workers in the private and semi-private sector. Source: OECD Minimum Wage Database.
Method of setting: The minimum wage (Salaire Minimum Interprofessional de Croissance, or SMIC) is
set by the government. Administrative procedures are used to adjust the SMIC each July to re�ect both
consumer price increases and real wage increases in the hourly wages of manual workers. In addition, the
government has sometimes enacted additional increases in the minimum wage. Other provisions: Limited
youth subminimum wage rates are applicable to workers under the age of 18. Speci�cally, workers aged
16 can be paid 80 percent of the adult minimum, while workers aged 17 can be paid 90 percent of the
adult minimum for six months.
Germany
Average monthly minimum wage divided by an average monthly wage. Source: Dolado, et al. (1996).
Method of setting: There is no legislated national minimum wage. Instead, minimum wage rates are
set via industry-speci�c collective bargaining agreements. These agreements can be extended to all
employers in the industry if the workforce of the employers directly a¤ected by the agreement comprises
at least 50 percent of the total workforce in that industry. In addition, the government may call for a
Hauptausschu� commission (consisting of the government, employers, and employees) to set minimum
wage levels in industries where unions represent only a minority of employees. Other provisions: Minimum
wages may vary considerably at the industry level. Some industry agreements include youth subminimum
wage rates.
Greece
Minimum daily wage for an unquali�ed single worker with no work experience (converted to an hourly
rate by assuming an 8 hour work day) divided by the mean hourly wage in manufacturing. Source: OECD
Minimum Wage Database. Method of setting: The national minimum wage level is negotiated annually
by representatives of the General Confederation of Greek Workers and the main employer organizations
(facilitated by arbitration if necessary). The negotiated level is routinely rati�ed by the Ministry of Labor
and is applicable to all workers. Other provisions: The minimum wage varies slightly by tenure and by
marital status.
Ireland
Minimum gross hourly wage divided by median weekly earnings of full-time employees (converted to
an hourly rate). Source: OECD MinimumWage Database. Method of setting: The government enacted a
national minimum wage in April 2000. This minimum wage is reviewed annually by the independent Low
Pay Commission, which then recommends an increase for consideration by the government. Prior to that
legislation, statutory minimum wages were set by Joint Labour Committees in a limited number of low-
57

wage industries. These Labour Committees consisted of equal numbers of representatives of employers
and workers appointed by the Labour Court and a chairman appointed by the Minister for Enterprise,
Trade, and Employment. Other provisions: Under current law, workers under the age of 18 can be paid
70 percent of the adult minimum wage.
Italy
Average minimum monthly wage divided by an average wage. Source: Dolado, et al. (1996). Method
of setting: There is no legislated national minimum wage. Instead, minimum wage rates typically are set
via industry-speci�c national collective bargaining agreements, which then are applicable to all workers
in the industry. Other provisions: Minimum wages may vary considerably at the industry level. Some
industry agreements include youth subminimum wage rates. Japan De�nition of minimum wage variable:
Weighted average of prefectural hourly minimum wage levels (weighted by the size of the labor force in
each prefect) divided by median gross monthly earnings (converted to hourly basis using average monthly
hours worked). Source: OECD Minimum Wage Database.
Netherlands
Minimum weekly earnings for persons aged 23 to 64 divided by median gross annual earnings of
full-time employees (divided by 52). Source: OECD Minimum Wage Database. Method of setting: The
minimum wage (Minimumloon) is set by law and is normally updated in January and July of each year
based on the average increase in wages negotiated in the private sector. The government may choose to
suspend or alter the increase if the unemployment rate is above a certain level. Other provisions: The
laws provide for a subminimum wage for employees less than 23 years of age. This subminimum wage
ranges from 85% of the adult minimum for employees aged 22 to 30 percent for those less than 17.
Norway
Average minimum hourly wage divided by an average wage. Source: Dolado, et al. (1996).
Method of setting: There is no legislated national minimum wage. Instead, minimum wage rates typ-
ically are set via industry-speci�c national collective bargaining agreements, which can then be extended
to cover all workers in the industry. Other provisions: Minimum wages may vary considerably at the
industry level.
Portugal
Minimum monthly wage for nonagricultural workers aged 20 and over divided by median gross annual
earnings of full-time workers (divided by 12). Source: OECD Minimum Wage Database. Method of set-
ting: The minimum wage (Salário Minimo Nacional) is set annually by the government after consultation
with the Permanent Commission for Social Cooperation. Other provisions: Under current law, workers
under the age of 18 can be paid 75% of the adult minimum wage. Prior to 1987, workers aged 18 and 19
58

were also eligible for subminimum wage rates.
Spain
Minimum monthly wage for workers aged 18 and over divided by median gross annual earnings of
full-time workers (divided by 12). Source: OECD Minimum Wage Database. Method of setting: The
minimum wage (Salario Minimo Interprofesional) is set annually by government decree, with the amount
of any increase determined by the Council of Ministers. Other provisions: Under current law, all workers
aged 16 and over are subject to the adult minimum wage. Prior to 1999, workers under the age of 18
could be paid less than the adult minimum wage.
Sweden
The average hourly minimum wage divided by an average hourly wage. Source: Dolado, et al. (1996).
Method of setting: There is no legislated national minimum wage. Instead, minimum wage rates typically
are set via industry-speci�c national collective bargaining agreements, which then are applicable to all
workers in the industry. Other provisions: Private sector agreements typically specify separate minimum
wage rates for adult workers (ages 24 and above) and youths.
United Kingdom
Beginning in 1999, national hourly minimum wage divided by median hourly earnings of full-time
adult employees. Source: OECD Minimum Wage Database. Prior to 1993, the average minimum wage
in Wages Council sectors divided by an average wage. Source: Dolado, et al. (1996). There was no
minimum wage from August 1993 through March 1999. Method of setting: Under current law, minimum
wage levels are reviewed regularly based on recommendations from the independent Low Pay Commission.
Prior to 1993, minimum wages were set in 25 certain industries by Wage Councils, which were originally
set up to protect low-wage workers who were not covered by collective bargaining agreements. Other
provisions: Under current law, workers aged 18 to 21 may be paid about 85 percent of the current adult
minimum wage; workers under age 18 are exempt from the minimum wage. Prior to 1993, minimum
wage rates di¤ered substantially by industry, age, and region. Beginning in 1986, all workers under age
21 were exempt from minimum wage laws.
United States
Federal minimum hourly wage divided by median usual weekly earnings of full-time employees (con-
verted to an hourly rate by assuming a 40 hour full-time workweek). Source: OECD Minimum Wage
Database. Method of setting: The national minimum wage level is set by the government and can only
be updated by legislative action. Other provisions: States have the ability to set a minimum wage above
the federal level. Subminimum wage rates may be paid to selected full-time students and newly-hired
youths (for 90 days).
59
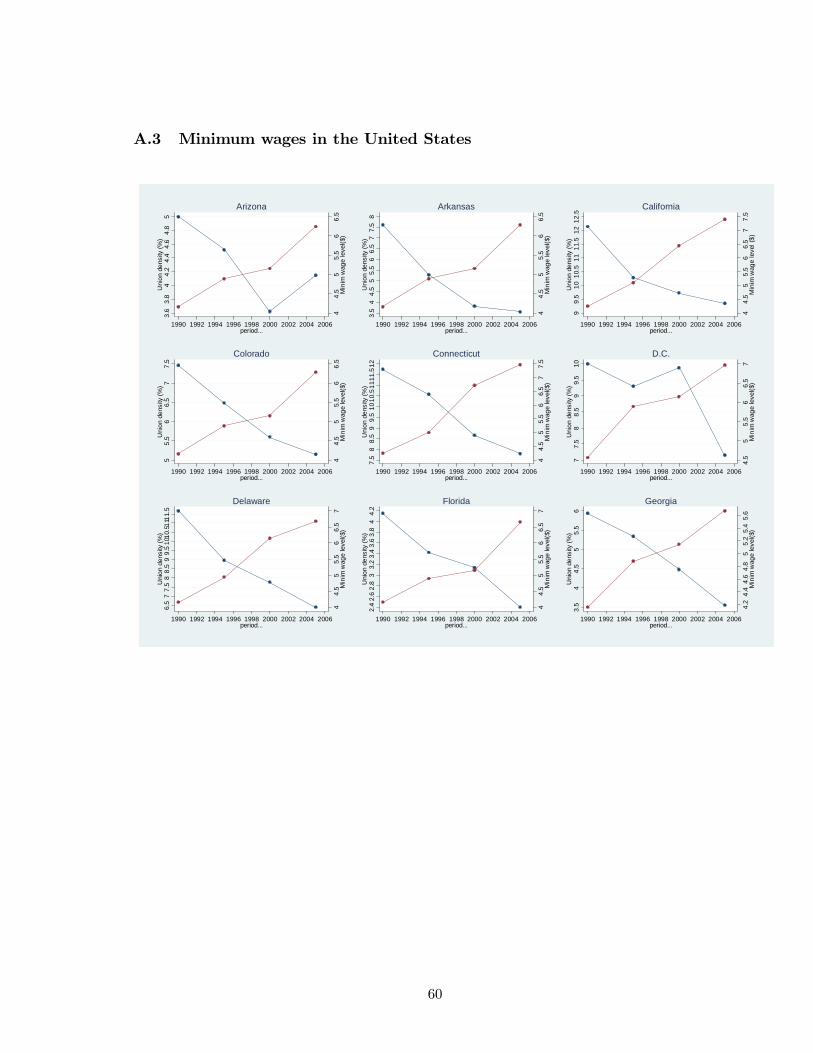
A.3 Minimum wages in the United States
44.
55
5.5
66.
5M
inim
wag
e le
vel($
)
3.6
3.8
44.
24.
44.
64.
85
Uni
on d
ensi
ty (%
)
1990 1992 1994 1996 1998 2000 2002 2004 2006period...
Arizona
44.
55
5.5
66.
5M
inim
wag
e le
vel($
)
3.5
44.
55
5.5
66.
57
7.5
8U
nion
den
sity
(%)
1990 1992 1994 1996 1998 2000 2002 2004 2006period...
Arkansas
44.
55
5.5
66.
57
7.5
Min
im w
age
leve
l ($)
99.
510
10.5
1111
.512
12.5
Uni
on d
ensi
ty (%
)
1990 1992 1994 1996 1998 2000 2002 2004 2006period...
California
44.
55
5.5
66.
5M
inim
wag
e le
vel($
)
55.
56
6.5
77.
5U
nion
den
sity
(%)
1990 1992 1994 1996 1998 2000 2002 2004 2006period...
Colorado
44.
55
5.5
66.
57
7.5
Min
im w
age
leve
l($)
7.5
88.
59
9.5
1010
.511
11.5
12U
nion
den
sity
(%)
1990 1992 1994 1996 1998 2000 2002 2004 2006period...
Connecticut
4.5
55.
56
6.5
7M
inim
wag
e le
vel($
)
77.
58
8.5
99.
510
Uni
on d
ensi
ty (%
)
1990 1992 1994 1996 1998 2000 2002 2004 2006period...
D.C.
44.
55
5.5
66.
57
Min
im w
age
leve
l($)
6.5
77.
58
8.5
99.
510
10.5
1111
.5U
nion
den
sity
(%)
1990 1992 1994 1996 1998 2000 2002 2004 2006period...
Delaware
44.
55
5.5
66.
57
Min
im w
age
leve
l($)
2.4
2.6
2.8
33.
23.
43.
63.
84
4.2
Uni
on d
ensi
ty (%
)
1990 1992 1994 1996 1998 2000 2002 2004 2006period...
Florida
4.2
4.4
4.6
4.8
55.
25.
45.
6M
inim
wag
e le
vel($
)
3.5
44.
55
5.5
6U
nion
den
sity
(%)
1990 1992 1994 1996 1998 2000 2002 2004 2006period...
Georgia
60

4.5
55.
56
6.5
7M
inim
wag
e le
vel($
)
1616
.517
17.5
1818
.519
19.5
2020
.5U
nion
den
sity
(%)
1990 1992 1994 1996 1998 2000 2002 2004 2006period...
Hawaii
4.2
4.4
4.6
4.8
55.
25.
45.
6M
inim
wag
e le
vel($
)
3.5
44.
55
5.5
66.
57
Uni
on d
ensi
ty (%
)
1990 1992 1994 1996 1998 2000 2002 2004 2006period...
Idaho
44.
55
5.5
66.
57
7.5
Min
im w
age
leve
l($)
11.5
1212
.513
13.5
1414
.515
15.5
16U
nion
den
sity
(%)
1990 1992 1994 1996 1998 2000 2002 2004 2006period...
Illinois
4.5
55.
56
6.5
7M
inim
wag
e le
vel($
)
77.
58
8.5
99.
510
Uni
on d
ensi
ty (%
)
1990 1992 1994 1996 1998 2000 2002 2004 2006period...
D.C.
4.2
4.4
4.6
4.8
55.
25.
45.
6M
inim
wag
e le
vel($
)
1011
1213
1415
1617
18U
nion
den
sity
(%)
1990 1992 1994 1996 1998 2000 2002 2004 2006period...
Indiana
4.5
55.
56
6.5
Min
im w
age
leve
l($)
77.
58
8.5
99.
510
Uni
on d
ensi
ty (%
)
1990 1992 1994 1996 1998 2000 2002 2004 2006period...
Iowa
4.2
4.4
4.6
4.8
55.
25.
45.
6M
inim
wag
e le
vel($
)
88.
59
9.5
1010
.511
11.5
12U
nion
den
sity
(%)
1990 1992 1994 1996 1998 2000 2002 2004 2006period...
Kentucky
44.
55
5.5
66.
57
Min
im w
age
leve
l($)
5.5
66.
57
7.5
88.
59
Uni
on d
ensi
ty (%
)
1990 1992 1994 1996 1998 2000 2002 2004 2006period...
Maine
44.
55
5.5
66.
5M
inim
wag
e le
vel($
)
7.5
88.
59
9.5
1010
.511
Uni
on d
ensi
ty (%
)
1990 1992 1994 1996 1998 2000 2002 2004 2006period...
Maryland
61

44.
55
5.5
66.
57
7.5
Min
im w
age
leve
l($)
7.5
88.
59
9.5
10U
nion
den
sity
(%)
1990 1992 1994 1996 1998 2000 2002 2004 2006period...
Massachusetts
44.
55
5.5
66.
57
Min
im w
age
leve
l($)
1414
.515
15.5
1616
.517
17.5
1818
.519
Uni
on d
ensi
ty (%
)
1990 1992 1994 1996 1998 2000 2002 2004 2006period...
Michigan
44.
55
5.5
66.
5M
inim
wag
e le
vel($
)
9.5
1010
.511
11.5
1212
.513
13.5
1414
.5U
nion
den
sity
(%)
1990 1992 1994 1996 1998 2000 2002 2004 2006period...
Minnesota
46
Min
im w
age
leve
l($)
9.5
1010
.511
11.5
1212
.513
Uni
on d
ensi
ty (%
)
1990 1992 1994 1996 1998 2000 2002 2004 2006period...
Missouri
44.
55
5.5
6M
inim
wag
e le
vel($
)
56
78
910
1112
Uni
on d
ensi
ty (%
)
1990 1992 1994 1996 1998 2000 2002 2004 2006period...
Montana
4.2
4.4
4.6
4.8
55.
25.
45.
6M
inim
wag
e le
vel($
)
4.5
55.
56
6.5
7U
nion
den
sity
(%)
1990 1992 1994 1996 1998 2000 2002 2004 2006period...
Nebraska
44.
55
5.5
66.
5M
inim
wag
e le
vel($
)
1212
.513
13.5
1414
.515
15.5
Uni
on d
ensi
ty (%
)
1990 1992 1994 1996 1998 2000 2002 2004 2006period...
Nevada
44.
55
5.5
6M
inim
wag
e le
vel($
)
4.2
4.4
4.6
4.8
55.
25.
45.
6U
nion
den
sity
(%)
1990 1992 1994 1996 1998 2000 2002 2004 2006period...
New Hamphire
4.5
55.
56
6.5
7M
inim
wag
e le
vel($
)
11.5
1212
.513
13.5
1414
.515
15.5
16U
nion
den
sity
(%)
1990 1992 1994 1996 1998 2000 2002 2004 2006period...
New Jersey
62

44.
55
5.5
6M
inim
wag
e le
vel($
)
4.24
.44.
64.8
55.
25.4
5.65
.86
6.2
Uni
on d
ensi
ty (%
)
1990 1992 1994 1996 1998 2000 2002 2004 2006period...
New Mexico
44.
55
5.5
66.
57
Min
im w
age
leve
l($)
15.5
1616
.517
17.5
18U
nion
den
sity
(%)
1990 1992 1994 1996 1998 2000 2002 2004 2006period...
New York
44.
55
5.5
6M
inim
wag
e le
vel($
)
1.8
22.
22.
42.
62.
83
3.2
3.4
3.6
Uni
on d
ensi
ty (%
)
1990 1992 1994 1996 1998 2000 2002 2004 2006period...
North Carolina
44.
55
5.5
6M
inim
wag
e le
vel($
)
3.5
44.
55
5.5
6U
nion
den
sity
(%)
1990 1992 1994 1996 1998 2000 2002 2004 2006period...
North Dakota
44.
55
5.5
66.
5M
inim
wag
e le
vel($
)
1011
1213
1415
16U
nion
den
sity
(%)
1990 1992 1994 1996 1998 2000 2002 2004 2006period...
Ohio
4.2
4.4
4.6
4.8
55.
25.
45.
6M
inim
wag
e le
vel($
)
33.
54
4.5
55.
56
6.5
7U
nion
den
sity
(%)
1990 1992 1994 1996 1998 2000 2002 2004 2006period...
Oklahoma
44.
55
5.5
66.
5M
inim
wag
e le
vel($
)
89
1011
1213
1415
Uni
on d
ensi
ty (%
)
1990 1992 1994 1996 1998 2000 2002 2004 2006period...
Pennsylvania
4.5
55.
56
6.5
77.
5M
inim
wag
e le
vel (
$)
88.
59
9.5
1010
.511
Uni
on d
ensi
ty (%
)
1990 1992 1994 1996 1998 2000 2002 2004 2006period...
Rhode Island
4.2
4.4
4.6
4.8
55.
25.
45.
6M
inim
wag
e le
vel (
$)
2.5
33.
54
4.5
5U
nion
den
sity
(%)
1990 1992 1994 1996 1998 2000 2002 2004 2006period...
South Dakota
63

4.2
4.4
4.6
4.8
55.
25.
45.
6M
inim
wag
e le
vel (
$)
33.
23.
43.
63.
84
4.2
4.4
4.6
4.8
Uni
on d
ensi
ty (%
)
1990 1992 1994 1996 1998 2000 2002 2004 2006period...
Texas
4.2
4.4
4.6
4.8
55.
25.
45.
6M
inim
wag
e le
vel (
$)
2.5
33.
54
4.5
55.
5U
nion
den
sity
(%)
1990 1992 1994 1996 1998 2000 2002 2004 2006period...
Utah
4.2
4.4
4.6
4.8
55.
25.
45.
6M
inim
wag
e le
vel (
$)
33.
54
4.5
55.
56
6.5
Uni
on d
ensi
ty (%
)
1990 1992 1994 1996 1998 2000 2002 2004 2006period...
Virginia
4.5
55.
56
6.5
77.
58
Min
im w
age
leve
l ($)
1212
.513
13.5
1414
.515
15.5
1616
.5U
nion
den
sity
(%)
1990 1992 1994 1996 1998 2000 2002 2004 2006period...
Washington
44.
55
5.5
6M
inim
wag
e le
vel (
$)
1011
1213
1415
1617
Uni
on d
ensi
ty (%
)
1990 1992 1994 1996 1998 2000 2002 2004 2006period...
West Virginia
44.
55
5.5
66.
5M
inim
wag
e le
vel (
$)
1010
.511
11.5
1212
.513
13.5
14U
nion
den
sity
(%)
1990 1992 1994 1996 1998 2000 2002 2004 2006period...
Wisconsin
4.2
4.4
4.6
4.8
55.
25.
45.
6M
inim
wag
e le
vel (
$)
5.5
66.
57
7.5
88.
5U
nion
den
sity
(%)
1990 1992 1994 1996 1998 2000 2002 2004 2006period...
Wyoming
64