can lean six sigma be used to improve the specimen … · summary the use of business ... chapter...
TRANSCRIPT

Can Lean Six Sigma be used to improve the Specimen
Sample Process Flow within the NDTC Laboratory?
By
Paul Thomas Murray
Student’s No: 11266831
Supervisor: Gaye Stephens
Health Informatics
Trinity College Dublin
A Dissertation submitted to the University of Dublin, in Partial Fulfilment of the Requirements for the
degree of Master of
Science in Health Informatics
September 2013

ii
Declaration
I declare that the work described in this dissertation is, except where otherwise stated,
entirely my own work, and has not been submitted as an exercise for a degree at this or
any other university.
Signed: ____________________________________________
Paul Murray
Date: 04/09/2013

iii
Permission to lend and/or copy
I agree that Trinity College Library may lend or copy this dissertation upon request.
Signed: ____________________________________________
Paul Murray
Date: 04/09/2013

iv
Acknowledgements
The author would like to thank the following for their contribution and support in making this
dissertation possible.
Firstly, I would like to thank my supervisor Gaye Stephens, for her advice, patience, guidance and
encouragement when working through the process of creating this Dissertation. Gaye took no
prisoners, when commenting on my work and always pushed me to achieve my potential, I was very
lucky to have such a dedicated supervisor.
The MSc HI Course Director Lucy Hederman and all the course lecturers for their commitment to
excellence and who were always willing to offer help if needed. Thank you for making this course
such a memorable experience. To my classmates who started out as my peers and became my
friends, I would never have made it this far if it wasn’t for their support.
The NDTC staff and Senior Management Team who offered support and assistance when needed,
in particular to Patrick Lynch my friend and manager, who always asked about my progress, never
commented when I had to take study leave and who, time and time again offered guidance and
support when needed. To the NDTC Laboratory staff, who shared their knowledge, gave their time,
who took part in interviews, Questionnaires, in general just put up with me, but mostly for their
invaluable support throughout the year. In particular, Siobhan Stokes Principle Biochemist, the key
stakeholder for the Lean Six Sigma (LSS) Project, Sinead McNamara Senior Biochemist who took
so much time out of her busy schedule to enlighten me, to Maura Kehoe Senior Biochemist, who
was always the voice of reason and most of all, to my good friend Louise Lawlor Senior Biochemist,
who worked tirelessly with me through all of the LSS process improvement projects, for her patience
(in putting up with my stupid questions), good humour (once again, in putting up with my stupid
questions) and who when under pressure herself, gave her time and experience to support the
successful completion of the LSS initiatives and of this dissertation.
My family and friends, for their support and assistance, especially Amy and Alex who having to worry
about their own third level course work gave me the inspiration, encouragement, and support, to
keep going. To Edyta Truszkowska, who was always honest with her comments, asked all the tough
questions, (for the coffee breaks, when studying in the 1937 Reading Room) and for giving me the
motivation to stay the course when I needed it.

v
SUMMARY
The use of Business Process Management Systems (BPMS) to improve the continuity of service has
been shown in industry, service and health care environments. The purpose of this research paper is
to investigate the possible benefits of applying a BPMS such as Lean Six Sigma (LSS) in the
National Drug Treatment Centre (NDTC) Laboratory.
The current challenges the NDTC Laboratory face are a moratorium on the recruitment of new staff,
so none of the existing staff can be replaced, if they leave or take a career break. An increased
number of Specimen Sample testing requests (over one million routine tests conducted in 2012),
with an average increase of 37.49% from 2012 to 2013 and the pressure of sustaining a 48 hour
Turn-Around Time (TAT), these and the constant pressure of maintaining an accredited Laboratory
are having a negative effect on staff morale.
A series of interviews were conducted with the Senior Laboratory Team, consequently ten processes
where defined where it was believed that LSS could be used to improve the Laboratory Specimen
Sample Process Flow. A template was developed using a selection of LSS tools which could be
reused on different Laboratory process problems. The template was divided into five different stages
Define, Measure, Analysis, Implement and Control, this LSS methodology is known as DMAIC and
allowed for the problems in the ten processes to be identified.
The project was divided into two Phases; Phase I was completed in July 2013 and Phase II is
currently in the Analysis stage and is scheduled to be completed in January 2014.
The process improvements demonstrated a 50% reduction in time for some of the processes, a
complete reduction in transcriptions errors, as several of the process improvements are now fully
automated and controlled by the Laboratory Management Information System (LIMS). Based on
figures in 2012 for the offsite storage and retrieval of Laboratory reports, which are now no longer
paper based, the Laboratory will make substantial cost savings this year and exponentially over time
as shown by similar projects carried out by the Mayo Clinic (Mayo Clinic, 2007) and the Louisiana
State Police Crime Laboratory (Richard, Kupferschmid, 2011).
A survey in the form of a questionnaire was conducted to examine the attitudes and perceptions of
the Laboratory staff and to measure the user acceptance of the LSS interventions. Overall the
findings indicated the staff did believe the implementations were an improvement to the process
work flow, they rated the efficiency of the proposed solution as high or very high.

vi
The Implementation of LSS has demonstrated that a coherent approach to continuous improvement
(Pepper, Spedding, 2010) has been achieved within the NDTC Laboratory. By reducing and
eliminating waste and identifying the value streams, the NDTC Laboratory can provide an effective
framework for producing systematic improvements with a reduction in effort (de Koning, 2006) and
costs.

vii
Table of Contents
Chapter One: Introduction ..................................................................................................................... 1
1.1 The NDTC Laboratory..................................................................................................................1
1.1.1 Problems in the Value Stream Process Flow ....................................................................... 1
1.1.2 NDTC Quality Control (QC) and Quality Assurance (QA) standards ................................... 2
1.1.3 Laboratory Accreditation ....................................................................................................... 3
1.1.4 Legal Requirements .............................................................................................................. 5
1.2 Overview of Dissertation..............................................................................................................7
1.3 Rational behind the Proposed Lean Six Sigma Interventions.....................................................7
1.4 Project Goals................................................................................................................................8
Chapter Two: Literature Review ........................................................................................................... 9
2.1 Introduction ..................................................................................................................................9
2.2 Search Strategy .........................................................................................................................10
2.3 Business Process Management Systems: ................................................................................11
2.3.1 The Origins of Business Process Management Systems .................................................. 11
2.3.2 Henry Ford’s Mass Production System .............................................................................. 12
2.3.3 Lean..................................................................................................................................... 13
2.3.4 Just-In Time......................................................................................................................... 13
2.3.5 Total Quality Management (Deming’s PDCA) .................................................................... 13
2.3.6 Business Process Reengineering....................................................................................... 14
2.3.7 Six Sigma ............................................................................................................................ 14
2.3.8 StuderGroup’s Hardwiring Excellence ................................................................................ 15
2.3.9 Evidence-Based Management............................................................................................ 16
2.3.10 Boeing Lean Production System....................................................................................... 17
2.3.11 Lean Six Sigma ................................................................................................................. 18
2.4 Lean Six Sigma Tools ................................................................................................................21
2.4.1 DMAIC Problem Solving ..................................................................................................... 21
2.4.2 Spaghetti Diagram .............................................................................................................. 21

viii
2.4.3 Value Stream Map .............................................................................................................. 22
2.4.4 Project Selection Diagram .................................................................................................. 23
2.4.5 Workflow Diagram............................................................................................................... 24
2.5 Lean Six Sigma in Laboratories.................................................................................................25
2.5.1 Lean Six Sigma Case Study ............................................................................................... 25
2.6 Challenges to Lean Six Sigma Projects ....................................................................................29
2.7 Success Factors for Lean Six Sigma.........................................................................................31
2.8 Conclusions................................................................................................................................34
Chapter Three: Methodology ............................................................................................................... 36
3.1 Introduction ................................................................................................................................36
3.2 Choice of Methodology ..............................................................................................................36
3.3 Purpose of Literature Review ....................................................................................................37
3.4 Methodology used in Case Studies ...........................................................................................37
3.4.1 Template Used in Case Studies ......................................................................................... 38
3.5 Interviews and Data Selection Requirements............................................................................39
3.6 Limitation of Research Methodology .........................................................................................41
Chapter Four: Research ...................................................................................................................... 42
4.1 Introduction ................................................................................................................................42
4.2 Research Design........................................................................................................................42
4.2.1 Four key requirements ........................................................................................................ 42
4.2.2 Phase I: The First Five processes Identified for Improvement by the Laboratory Senior
Management Team ...................................................................................................................... 43
4.2.3 Phase II: The Second Five processes Identified for Improvement by the Laboratory Senior
Management Team ...................................................................................................................... 44
4.3 Overview of Specimen Sample Value Stream...........................................................................45
4.3.1 Process Map of the NDTC Laboratory Specimen Sample Journey ................................... 45
4.3.2 Spaghetti Diagram - NDTC Laboratory Specimen Sample Journey .................................. 45
4.3.3 Value Stream Map - NDTC Laboratory Specimen Sample Journey (AS IS) ..................... 47
4.4 Phase I: Process 1: TF4 Form used to Record Specimen Sample Reference logs.................48
4.4.1 Define: TF4 Form used to Record Specimen Sample Reference logs .............................. 49

ix
4.4.2 Measure: TF4 Form used to Record Specimen Sample Reference logs........................... 51
4.4.3 Analyse: TF4 Form used to Record Specimen Sample Reference logs............................ 53
4.4.4 Implement: TF4 Form used to Record Specimen Sample Reference logs........................ 54
4.4.5 Control: TF4 Form used to Record Specimen Sample Reference logs............................. 57
4.5 Phase I: Process 2: The Sample Disposal Log .........................................................................58
4.5.1 Define: The Sample Disposal Log ...................................................................................... 58
4.5.2 Measure: The Sample Disposal Log................................................................................... 58
4.5.3 Analysis: The Sample Disposal Log ................................................................................... 58
4.5.4 Implementation: The Sample Disposal Log........................................................................ 58
4.5.5 Control: The Sample Disposal Log ..................................................................................... 58
4.6 Phase I: Process 3: North West Analytical (NWA) Statistical Analysis.....................................59
4.6.1 Define: North West Analytical (NWA) Statistical Analysis Process.................................... 59
4.6.2 Measure: North West Analytical (NWA) Statistical Analysis Process ................................ 61
4.6.3 Analyse: North West Analytical (NWA) Statistical Analysis Process ................................. 62
4.6.4 Implement: North West Analytical (NWA) Statistical Analysis Process ............................. 63
4.6.5 Control: New Lean Six Sigma North West Analytical (NWA) Statistical
Analysis Process .......................................................................................................................... 66
4.7 Phase I: Process 4: Electronic Reporting Section.....................................................................67
4.7.1 Define: Electronic Reporting Section .................................................................................. 67
4.7.2 Measure: Electronic Reporting Section .............................................................................. 67
4.7.3 Analysis: Electronic Reporting Section ............................................................................... 71
4.7.4 Implementation: Electronic Reporting Section.................................................................... 72
4.7.5 Control: Electronic Reporting Section................................................................................. 74
4.8 Phase I: Process 5: Stock Tracking and Reporting Process.....................................................75
4.8.1 Define: Stock Tracking and Reporting Process.................................................................. 75
4.8.2 Measure: Stock Tracking and Reporting Process .............................................................. 77
4.8.3 Analysis: Stock Tracking and Reporting Process............................................................... 77
4.8.4 Implementation: Stock Tracking and Reporting Process.................................................... 78
4.8.5 Control: Stock Tracking and Reporting Process................................................................. 83

x
4.9 Conclusions................................................................................................................................83
Chapter Five: Results and Analysis..................................................................................................... 84
5.1. Introduction ...............................................................................................................................84
5.2 Factors that Influenced using Lean Six Sigma ..........................................................................84
5.2.1 Laboratory Quality Control Management Methodologies ................................................... 84
5.2.2 Stakeholder Involvement .................................................................................................... 87
5.2.3 Resistance to change.......................................................................................................... 87
5.2.4 Legal Requirements ............................................................................................................ 88
5.3 Analysis of Results.....................................................................................................................89
5.3.1 Process 1: TF4 Form used to Record Specimen Sample Reference logs......................... 89
5.3.2 Process 2: The Sample Disposal Log................................................................................. 91
5.3.3 Process 3: North West Analytical (NWA) Statistical Analysis ............................................ 92
5.3.4 Process 4: Electronic Reporting Section ............................................................................ 93
5.3.5 Process 5: Stock Tracking and Reporting Process ............................................................ 93
5.3.6 Specimen Samples Processed in 2012 .............................................................................. 94
5.3.7 Specimen Samples Processed in 2013 .............................................................................. 95
5.3.8 Turnaround Times (TAT)..................................................................................................... 96
5.3.9 Laboratory Transcription Errors ........................................................................................ 100
5.4 User Acceptance Analysis .......................................................................................................101
5.4.1 Questionnaire.................................................................................................................... 101
5.4.2 Interviews .......................................................................................................................... 106
5.5 Cost and Benefits.....................................................................................................................108
5.5.1 Costs of Consumables for Laboratory Reporting ............................................................. 109
5.5.2 Evidence of Cost Benefit Analysis .................................................................................... 109
5.6 Conclusion ...............................................................................................................................111
Chapter Six: Discussion & Conclusions ............................................................................................ 114
6.1. Introduction .............................................................................................................................114
6.2 Summary of Findings and Results of Lean Six Sigma Implementation ..................................114
6.3 Limitations of Research ...........................................................................................................116

xi
6.4 Recommendations for Present and Future Work ....................................................................117
REFERENCES .................................................................................................................................. 119
APPENDICES.................................................................................................................................... 125
Appendix I: Phase II of Lean Six Sigma Interventions ..................................................................125
7.1 Phase II: Process 6: Controlled Drugs Tracking .....................................................................125
7.1.1 Define: Controlled Drugs Tracking.................................................................................... 125
7.1.2 Measure: Controlled Drugs Tracking ................................................................................ 126
7.1.3 Analysis: Controlled Drugs Tracking................................................................................. 129
7.1.4 Implementation: Controlled Drugs Tracking ..................................................................... 129
7.1.5 Control: Controlled Drugs Tracking................................................................................... 129
7.2 Phase II: Process 7: The Instrument Maintenance Processes for the Analysers ...................130
7.2.1 Define: The Instrument Maintenance Processes for the Analysers ................................. 130
7.2.2 Measure: The Instrument Maintenance Processes for the Analysers.............................. 130
7.2.3 Analysis: The Instrument Maintenance Processes for the Analysers .............................. 132
7.2.4 Implementation: The Instrument Maintenance Processes for the Analysers................... 132
7.2.5 Control: The Instrument Maintenance Processes for the Analysers ................................ 132
7.3 Phase II: Process 8: Analyser Calibration ...............................................................................133
7.3.1 Define: Analyser Calibration ............................................................................................. 133
7.3.2 Measure: Analyser Calibration.......................................................................................... 133
7.3.3 Analysis: Analyser Calibration .......................................................................................... 133
7.3.4 Implementation: Analyser Calibration ............................................................................... 133
7.3.5 Control: Analyser Calibration ............................................................................................ 133
7.4 Phase II: Process 9: The Recording of Laboratory Telephone Enquiry Calls.........................134
7.4.1 Define: The Recording of Laboratory Telephone Enquiry Calls ....................................... 134
7.4.2 Measure: The Recording of Laboratory Telephone Enquiry Calls ................................... 134
7.4.3 Analysis: The Recording of Laboratory Telephone Enquiry Calls.................................... 134
7.4.4 Implementation: The Recording of Laboratory Telephone Enquiry Calls......................... 134
7.4.5 Control: The Recording of Laboratory Telephone Enquiry Calls...................................... 134
7.5 Phase II: Process 10: Confirmatory Analysis ..........................................................................135

xii
7.5.1 Define: Confirmatory Analysis........................................................................................... 135
7.5.2 Measure: Confirmatory Analysis ....................................................................................... 135
7.5.3 Analysis: Confirmatory Analysis........................................................................................ 135
7.5.4 Implementation: Confirmatory Analysis ............................................................................ 135
7.5.5 Control: Confirmatory Analysis ......................................................................................... 135
Appendix II: Laboratory Forms and Documentation......................................................................136
Appendix III: Basic Flowchart Shapes ...........................................................................................140
Appendix IV: Diagram of Dissertation............................................................................................141
Appendix V: Process 3: North West Analytical (NWA) Statistical Analysis Module......................142
Appendix VI: Sysnergy Health - Cut Off Levels (Urine samples) ..................................................148
Appendix VII: Process 4: Code For Electronic Reporting Module.................................................149
Appendix VIII: Process 4: Electronic Reporting Section - Oasis New Storage Boxes 2012.........155
Appendix IX: Process 4: Electronic Reporting Section - Oasis New Storage Boxes 2013...........157
Appendix X: Process 4: Electronic Reporting Section...................................................................158
Appendix XI: Questionnaire ...........................................................................................................159
Appendix XII: Statistical Analysis...................................................................................................162

xiii
LIST OF FIGURES
Figure 1.1: INAB Testing and Calibration Categories (NDTC, 2013)
Figure 1.2: NDTC Laboratory Accreditation (NDTC, 2013)
Figure 2.1: Boeing Quality Management System and Lean (Arkell, 2003)
Figure 2.2: Improvement opportunities can occur within the processes (Six Sigma) or between the
processes (Lean) (Snee, 2010)
Figure 2.3: Lean and Six Sigma diffusion in healthcare, articles over time (DelliFraine, et al., 2010)
Figure 2.4: Spaghetti diagram showing the steps travelled to complete a process, (Richard,
Kupferschmid, 2011)
Figure 2.5: Value Stream Map (VSM) of the LSPCL DNA Process (Richard, Kupferschmid, 2011)
Figure 2.6: Project Improvement implementation selection diagram (Snee, Hoerl, 2007)
Figure 2.7: Part of a Sample process map (using Workflow diagrams) showing the last 4 process
steps (level 1) and the corresponding detail under each step (level 3) (Richard, Kupferschmid, 2011)
Figure 2.8: This Spaghetti diagram shows the steps travelled (approximately 12,687 feet or 2.4
miles) before the LSS implementation (Richard, Kupferschmid, 2011)
Figure 2.9: This Spaghetti diagram shows the new process flow (approximately 7879 feet or 1.5
miles) the LSS implementation (Richard, Kupferschmid, 2011)
Figure 4.1: Develop a plan of action, which will manage performance while the Lean Six Sigma
intervention is being implemented (Mayo Clinic, 2007)
Figure 4.2: Level 1 - Process Flowchart Laboratory Specimen Sample Journey
Figure 4.3: Spaghetti Diagram – NDTC Laboratory Specimen Sample Journey
Figure 4.4: NDTC Laboratory Specimen Sample Value Stream Map
Figure 4.5: Specimen Sample Workflow Diagram before LSS
Figure 4.6: TF4 Form – Sample Reference Log
Figure 4.7: Decanting barcoded Vial into barcoded Test Tube
Figure 4.8: NDTC Spaghetti Diagram of Specimen Sample Journey
Figure 4.9: TF4 Form – Sample Reference Log Lifecycle before LSS
Figure 4.10: Specimen Sample Workflow Diagram after LSS
Figure 4.11: Screenshot of Labware LIMS TF4 Form
Figure 4.12: Crystal Report Design of Main Report and SubReport for TF4 Form
Figure 4.13: TF4 Form – Sample Reference Log Lifecycle after LSS

xiv
Figure 4.14: Screenshot of the Laboratory Electronic Report (LER) Application
Figure 4.15: Calibrator for each drug type is decanted into an Aliquot which in then placed in the
Analyser
Figure 4.16: QC’s are then run on the Analyser to establish the system is within control
Figure 4.17: CF3 MS Excel Spreadsheet
Figure 4.18: Exclude failed Quality Controls (QC) from Statistical Analysis
Figure 4.19: Template for QC_PROJECT folder
Figure 4.20: Print Preview of Report in Labware LIMS
Figure 4.21: Tray folder in Labware LIMS
Figure 4.22: Workflow - New Stock Tracking and Reporting
Figure 4.23: Inventory Manager - Stock within Labware LIMS
Figure 4.24: Inventory Manager - Audit history of one lot of reagent
Figure 4.25: Inventory Manager Report – Inventory Stock Details
Figure 4.26: Alerting System within the Inventory Manager Module
Figure 5.1: TF4 Form – Sample Reference Log Lifecycle
Figure 5.2: TF4 Form – New Sample Reference Log Lifecycle
Figure 5.3: The two NWA processes, MANUAL was before LSS intervention and AUTO was after
LSS intervention
Figure 5.4: Samples received by the NDTC Laboratory in 2012 and 2013
Figure 5.5: Factors Effecting Laboratory Turnaround Times (TAT)
Figure 5.6: (Q1 - Q3) User satisfaction with how the LSS project was implemented (%)
Figure 5.7: (Q4) Satifaction with how the LSS project was implemented (%)
Figure 5.8: (Q5 - Q7) Satifaction with the LSS process improvements in relation to human error,
process time and quality (%)
Figure 5.9: (Q8 - Q10) Satifaction in relation to the existing issues within the Laboratory, staffing,
workload, and morale (%)
Figure 6.1: Laboratory Turnaround Times (TAT) since the deployment of the last Lean Six Sigma
intervention
Figure 7.1: Pharmatrust Website https://pharmatrust.imb.ie
Figure 7.2: TF3 Analyser Batch Form
Figure 7.3: New Sample Reference Log TF4 Form

xv
Figure 7.4: NWA TF12 – QC Control Study Statistics Record Form
Figure 7.5: New NWA TF12 Form
Figure 7.6: New NWA CF3 Form
Figure 7.7: Standard Flowchart Symbols and Their Usage (Edrawsoft, 2013)
Figure 7.8: Diagram of Dissertation
Figure 7.9: Synergy Health - Cut Off Levels (Urine samples) (Synergy Health Laboratory Services,
2012)
Figure 7.10: OASIS GROUP 2012 List of Document Boxes Stored offsite
Figure 7.11: OASIS GROUP 2013 List of Document Boxes Stored offsite
Figure 7.12: OASIS GROUP Pricing Document

xvi
LIST OF TABLES
Table 1.1: Controlled Drugs and Drug Precursors Irish, European and International Legislation
Table 2.1: The Five Stages of Business Process Reengineering (Muthu et al, 1999)
Table 2.2: The Five ways to reduce variance in leadership (Studer, 2005)
Table 2.3: The Informed Decisions Toolbox (IDT) (Rundall, et al., 2007)
Table 2.4: The Seven Principles of Lean Six Sigma (Richard, Kupferschmid, 2011; Brett, Queen,
2005)
Table 2.5: Lean Principles in a laboratory environment (Mayo Clinic, 2007)
Table 4.1: The First Five Case Studies identified during Interviews
Table 4.2: The Second Five Case Studies identified during Interviews.
Table 4.3: Information for Statistical Analysis entered into Labware LIMS Product Specs Module
Table 4.4: MS Excel Spreadsheet CF3
Table 5.1: The Six Basic Westgard Rules (QCNet, 2008)
Table 5.2: The amount of time taken to generate and send a set of reports for the Client Result
Reporting Process
Table 5.3: The amount of Specimen Samples received for 2012
Table 5.4: The amount of Specimen Samples processed to date for 2013
Table 5.5: The Turnaround Times (TAT) for the available data for 2012
Table 5.6: The Turnaround Times (TAT) for the available data for 2013
Table 5.7: Transcription errors in the Phase I Processes before LSS
Table 5.8: Questionnaire Data Analysis
Table 5.9: The Laboratory Costs of Printing and Reporting May 2012 to April 2013
Table 5.10: Cost Details of Oasis Offsite Storage for 2012
Table 5.11: Cost Details of Oasis Offsite Storage for 2013
Table 5.12: Comparison between TAT and Specimen Samples between June - July 2012 & June -
July 2013
Table 5.13: The Details of Offsite Storage for 2012
Table 5.14: The Projected Details of Offsite Storage for 2013
Table 5.15: The Projected Details of Offsite Storage for 2014
Table 7.1: Reagent bottles and their assigned positions in the Analyser Carousel

xvii
ABBREVIATIONS
5S’s Sort, Straighten, Scrub/Shine, Standardise, Sustain
BPR Business Processing Re-engineering
CODIS Combined DNA Index System
COPQ Costs of Poor Quality
CSF Critical Success Factors
CTS Critical To Success
CTQ Critical To Quality
DAIS Drugs and Aids Information System
DMAIC Define, Measure, Analyse, Improve, Control
DNA Deoxyribonucleic Acid
DFSS Design For Six Sigma
DTCB Drug Treatment Centre Board
EDDP 2-Ethylidene-1,5-Dimethyl-3,3-Diphenylpyrrolidine
HSE Health Service Executive
ICT Information Computer Technology
IDT Informed Decision Toolbox
IEQAS Irish External Quality Assessment Scheme
ISMS Information Management Security Systems
ISO International Standards Organisation
IT Information Technology
LCMS Liquid Chromatography Mass Spectrometry
LER Laboratory Electronic Reporting
LIMS Laboratory Information Management Systems
LSPCL Louisiana State Police Crime Laboratory
LSS Lean Six Sigma
MScHI Masters in Health Informatics

xviii
NDTC National Drug Treatment Centre
NIJ National Institute of Justice
NWA Northwest Analytical
PCI Payment Card Industry
PDCA Plan, Do, Check, Act
PDF Protected Document Form
PDSA Plan, Do, Study, Act
QA Quality Assurance
QC Quality Control
QMS Quality Management Systems
RIM Records and Information Management Systems
SAMHSA Substance Abuse and Mental Health Services Administration
SLA Service Level Agreement
SOP Standard Operating Procedures
SPC Statistical Process Control
TAT Turnaround Time
TPS Toyota Production System
TQM Total Quality Management
UKNEQAS United Kingdom National External Quality Assessment Scheme
UOM Uncertainty Of Measurement
VAT Value Added Tax
VSM Value Stream Mapping
VTC Voice of the Customer

1
Chapter One: Introduction
1.1 The NDTC Laboratory
The National Drug Treatment Centre (NDTC) formally known as The Drug Treatment Centre
Board (DTCB) provides a drug analysis service to the Health Service Executive (HSE) addiction
services, general practitioners, hospitals (general, psychiatric and maternity), juvenile detention
centres, the Dublin Drug Court, the Probation and Welfare Services and voluntary agencies
(Addictionireland, 2012).
The NDTC laboratory performed approximately 1,020,257 routine tests in 2012, for 269 Clinics
on approximately 11,425 patients. These figures do not include non-routine tests (pH, Glucose,
Pregnancy test – HCG, Ethyl Glucoronide – ETG) and confirmatory Analysis, of which there
were approximately 31,573 tests in 2012 on 5,885 specimen samples received in 2012. The
majority of the laboratory testing is done by a urine screening method known as immunoassay.
These screening assays look for groups of drugs such as opiates, benzodiazepines, cannabis,
cocaine, amphetamines, EDDP (methadone metabolite) and 6-acetylmorphine. Immunoassay is
a qualitative method which indicates only the presence or absence of a drug/drug class in a
sample.
Each test by immunoassay has a defined cut-off level, above which the test is deemed positive
indicating that the presence of a drug/drug class was detected above the cut-off level. If a test
result falls below the cut-off level, the result is deemed negative indicating that the drug/drug
class was not detected above the cut-off level. Screening assays are not always 100% specific,
i.e. a drug that has a similar structure can cause a false positive on the assay (cross reactivity).
In this case the sample can be subjected to further Analysis by a technique known as Mass
Spectrometry; this can then confirm the presence or absence of the specific drug or compound
in the sample. In order to perform this confirmatory Analysis the sample must be compared to a
reference standard for the drug. Many of the drugs being confirmed are controlled substances.
These controlled drug reference standards are normally ordered from a supplier in the UK.
1.1.1 Problems in the Value Stream Process Flow
The issues identified from initial interviews conducted with the Senior Laboratory Team
highlighted several problems in the Value Stream. The Value Stream is used to track the flow of
materials and information throughout the process flow (Richard, Kupferschmid, 2011), which

2
included areas where there was duplication of effort and the risk of transcription errors. There
were issues with the tracking and reporting systems deployed by the laboratory at the time of
the interviews. These systems were a combination of paper based forms, MS Excel spread
sheets, and MS Word documents, some of which were stored in a document management
application called Paradigm II, while others were stored in various locations on the File Server
(CHEOPS) and the Laboratory Information Management System (LIMS) which is referred to as
Labware LIMS.
These data repositories were found to be cumbersome when retrieving information and the data
was not automatically linked to a specimen sample or batch of specimen samples that had been
tested. These largely paper based processes required the printing of reports and generated
copious amounts of paper which had to be indexed, managed and eventually stored securely
off-site for accreditation purposes. This amounted to a significant cost in both staff time and the
NDTC finance budget.
It was possible to utilise some of the features of Labware LIMS to improve the tracking and
reporting systems currently used by the NDTC. The possibility to digitally save documentation
and store reports addressed the need to print and store documents off-site.
The Laboratory’s main avenue of reporting has changed over the last six years from paper based
reporting to mostly electronic reporting systems today. The Laboratory has several different types of
electronic reporting requirements. The Laboratory Labware LIMS server communicates directly with
the NDTC Electronic Patient System (EPS) and creates a view of the results for the clinical staff
within the NDTC. A similar approach is in place for the HSE Drugs and Aids Information System
(DAIS); results are encapsulated in Extended Mark-up Language (XML) and are sent via a secure
Virtual Private Network (VPN) connection. The Laboratory also has its own Internet based reporting
system known as the Laboratory Electronic Reporting (LER), this system allows registered users in
clinics to login remotely and check results. The current trend to move away from paper based
records and reporting, including the faxing and posting of reports, to electronic reporting via
Electronic Health Records (EHR) was highlighted by Vest, Yoon, Bossak, (2012) in their paper in the
British Medical Journal (BMJ).
1.1.2 NDTC Quality Control (QC) and Quality Assurance (QA) standards
A Laboratory Quality Control (QC) is a statistical process used to monitor and evaluate the
Analysis that produces results. The NDTC Laboratory adheres to strict QC and Quality
Assurance (QA) standards. Approximately 3% of all samples run in the Laboratory are quality
controls. In order to assess performance and to ensure the highest confidence in test results,
3
the laboratory is involved in two external Quality Assurance schemes, the United Kingdom
National External Quality Assessment Scheme (UKNEQAS) and the Irish External Quality
Assessment Scheme (IEQAS) (NDTC, 2013).
1.1.3 Laboratory Accreditation
The NDTC Laboratory is accredited by the Irish National Accreditation Board (INAB) to
ISO/IEC17025. The ISO/IEC 17025 standard is the main standard used in testing and calibration
laboratories.
The ISO/IEC 17025 standard is aimed at improving the ability to consistently produce valid results
and it has management and technical requirements.
Management requirements are primarily related to the operation and effectiveness of the quality
management system within the laboratory, while technical requirements address the ICT Services,
competence of staff, methodology and test/calibration equipment.
The Laboratory is audited annually by a team of Irish and international external auditors from Irish
National Accreditation Board (INAB), to maintain the ISO/IEC 17025 standard. In 2012, the
Laboratory successfully applied to extend the scope of accreditation to include drugs of abuse in oral
fluids, Ethyl Glucuronide in urine and Cannabis confirmatory Analysis in urine. The NDTC Laboratory
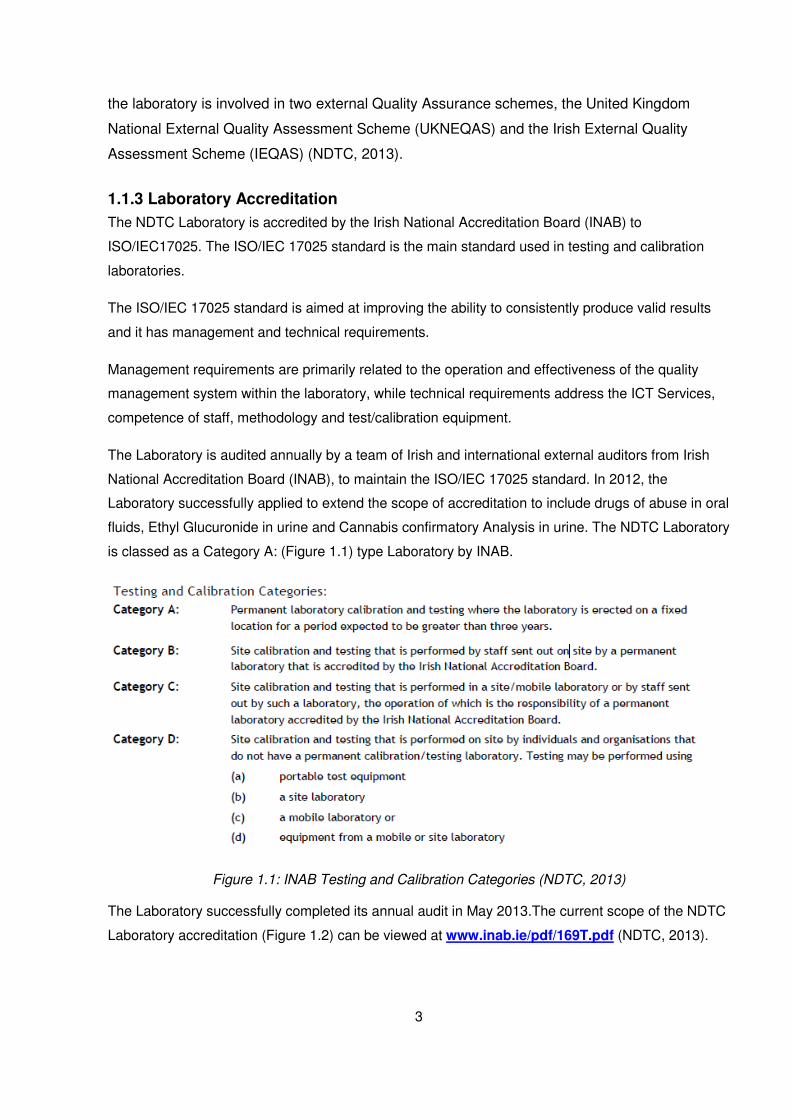
is classed as a Category A: (Figure 1.1) type Laboratory by INAB.
Figure 1.1: INAB Testing and Calibration Categories (NDTC, 2013)
The Laboratory successfully completed its annual audit in May 2013.The current scope of the NDTC
Laboratory accreditation (Figure 1.2) can be viewed at www.inab.ie/pdf/169T.pdf (NDTC, 2013).

4
Figure 1.2: NDTC Laboratory Accreditation (NDTC, 2013)

5
1.1.4 Legal Requirements
The NDTC Laboratory is required to obtain a controlled drug license and a license for precursor
chemicals. To obtain a controlled Drugs license the NDTC were required to demonstrate compliance
to the requirements for security, storage and documentation, as set out in the regulations of the
Misuse of Drugs Acts 1977 and 1984.
Controlled drugs are any substance listed in the Misuse of Drugs Acts 1977 and 1984, they are
defined as a substance with a potential for misuse and or abuse. Controlled drugs Licenses are
issued under the Misuse of Drugs Acts and are legally required before controlled drugs can be
Imported/Exported or used for calibration or Quality Control (QC) purposes by a Laboratory.
A Precursor chemical is a substance that is used in the illicit manufacturing of a controlled drug and
in 2010 the Irish Medical Board was nominated as the authority for Licensing, registration and
Import/Export Authorisation for Precursor chemicals (Irish Medicines Board, 2013).
The NDTC are also required to comply with other Irish, European and International Legislation listed
in table 1.1.

6
Regulation (EC) No 273/2004 of the European Parliament and of the Council on drug precursors (internal trade within the Community)
Council Regulation (EC) No 111/2005 laying down rules for the monitoring of trade between the Community and third countries in drug precursors
Commission Regulation (EC) No 1277/2005 of 27 July 2005 laying down implementing rules for Regulation (EC) No 273/2004 of the European Parliament and of the Council on drug precursors and for Council Regulation (EC) No 111/2005 laying down rules for the monitoring of trade between the Community and third countries in drug precursors.
EU Regulations on Drug precursors: European Commission (http://ec.europa.eu/taxation_customs/customs/customs_controls/drugs_precursors/legislation/index_en.htm)
Council Regulation (EC) No 111/2005 of 22 December 2004 laying down rules for the monitoring of trade between the Community and third countries in drug precursors (managed by DG TAXUD).
Regulation (EC) No 273/2004 of the European Parliament and of the Council of 11 February 2004 on drug precursors (managed by DG ENTERPRISE).
Commission Regulation (EC) No 297/2009 of 8 April 2009 amending Regulation (EC) No 1277/2005 laying down implementing rules for Regulation (EC) No 273/2004 of the European Parliament and of the Council on drug precursors and for Council Regulation (EC) No 111/2005 laying down rules for the monitoring of trade between the Community and third countries in drug precursors.
Commission Regulation (EU) No 225/2011 of 7 March 2011 amending Commission Regulation (EC) No 1277/2005 laying down implementing rules for Regulation (EC) No 273/2004 of the European Parliament and of the Council on drug precursors and for Council Regulation (EC) No 111/2005 laying down rules for the monitoring of trade between the Community and third countries in drug precursors was published in the OJEU L 061/2011 of 8 March 2011.
International Narcotics Control Board (http://www.incb.org/incb/convention_1988.html)
1: United Nations Convention Against Illicit Traffic in Narcotic Drugs and Psychotropic Substances 1988
Reference: International Narcotics Control Board (http://www.incb.org/incb/convention_1971.html)
2: Convention on Psychotropic Substances
Reference: International Narcotics Control Board (http://www.incb.org/incb/convention_1961.html)
3: Single Convention on Narcotic Drugs, 1961
Irish Statute Book (http://www.irishstatutebook.ie/1982/en/si/0321.html)
Misuse of Drugs (Safe Custody) Regulations 1982 Table 1.1: Controlled Drugs and Drug Precursors Irish, European and International Legislation

7
1.2 Overview of Dissertation
Chapter Two of this dissertation looks at the evolution and the current state of Business Process
Management Systems (BPMS) and the current trends in Healthcare and Clinical Laboratories to
adopt a Lean Six Sigma (LSS) type of intervention to improve performance.
Chapter Three explores the Methodology used in answering the research question. Can Lean
Six Sigma be used to improve the Specimen Sample Process Flow within the NDTC
Laboratory?
Chapter Four examines the research processes used in the implementation of Phase I of the
LSS Case Studies in the NDTC Laboratory.
Chapter Five provides an Analysis of the results of the LSS interventions used in the Case
Studies for this dissertation.
Chapter Six discusses the results of the LSS implementation and the limitations of the research,
the on-going and possible future work.
1.3 Rational behind the Proposed Lean Six Sigma Interventions
The Implementation of Lean principles and Six Sigma methodologies introduces the possibility
of identifying a coherent approach to continuous improvement (Pepper, Spedding, 2010). To
correctly implement a quality improvement implementation, a holistic approach is required one
which optimises the process for the whole system by putting the right interventions in the correct
place (Pepper, Spedding, 2010), by reducing and eliminating waste and the identification of
value streams which when implemented within the NDTC Laboratory provided an effective
framework for producing systematic improvements and a reduction in effort (de Koning, 2006).
With the current budgetary restraints placed on the public sector spending and in particular the
health services, interventions like those detailed in this dissertation could only be realised by the
use of in house resources. In the past funding was available for the procurement of outside
business process analysts to complete these tasks.
• Under the Public Service Agreement 2010-2014 (Croke Park Agreement) there is a
moratorium on recruitment, which means that any member of staff who leaves is no
longer, replaced. The processes in place prior to the LSS project where implemented
when there was a full contingency of Laboratory staff and a reduced amount of
specimen sample testing requests. These processes put increased pressure on the

8
Laboratory staff, by implementing the LSS initiatives it reduced some of the workload for
the laboratory staff and reduced the “wasteful steps” (Lean Principles) within the
Laboratory value stream.
• The implementation of the LSS interventions will reduce costs over time within the NDTC
by recording information electronically and thus eliminating the production of paper
reports which had to be stored off-site indefinitely and at a significant cost.
• “The laboratory is accredited to the ISO 17025 standard and it is important that all of
tracking systems used maintain detailed records for all chemicals and reagents used in
testing. This includes LOT numbers, expiry dates and certificates” (Addictionireland,
2012). It was commented on by INAB during their annual audit in 2012, that the
Laboratory was “heavily reliant on paper based systems” and that it should strive to
move towards electronically recording its current tracking and reporting systems, this
maybe a future requirement for INAB accreditation.
• For accreditation purposes INAB have highlighted that it now requires that stock control
systems must be fully auditable (the process used by the NDTC was not) this would lead
to a non-conformance and needed to be corrected before the next INAB audit, which
took place on the 21st of May 2013.
1.4 Project Goals
The aim of the NDTC Laboratory’s LSS project was to help to facilitate the Laboratory with
implementing process changes that could, where possible lead to a paperless environment,
improve efficiency by streamlining the process flow of a specimen sample through the
Laboratory and to increase the Laboratory’s operational effectiveness.
To enable the Laboratory to sustain and possibly improve the level of service it currently
provides to its customers at a time when demand and expectations are perennially increasing.
By applying a LSS multi-faceted implementation in a Clinical Laboratory environment, using new
technology, available resources and personnel, it is believed that this substantially increased the
operational effectiveness of the NDTC Laboratory and where possible met the requirements set
out by the customer (Senior Laboratory Team), to reduce costs, increase production and
improve staff morale.

9
Chapter Two: Literature Review
2.1 Introduction
Quality improvement management and Business Process Management Systems (BPMS) have
for a long time been conceived of as important strategies for maintaining competitive advantage
by improving process performance, enhancing client, or customer satisfaction and allowing for
the generation of more revenue or reducing costs (Snee, 2010).
The use of BPMS have successfully gained acceptance in industry throughout the world
(Nonthaleerak and Hendry, 2005). Their application has been varied in terms of location and the
quality improvement implementation needed to address the problem (Vest, Gamm, 2009;
Richard, Kupferschmid, 2011). Their use in healthcare and laboratory services is relatively new
(Taner, Sezen, Antony, 2007; Richard, Kupferschmid, 2011. When they have been applied
successfully in healthcare and laboratories they have led to a reduction in costs, increased
patient satisfaction, a reduction in scheduling delays and a reduction of waste (Taner, Sezen,
Antony, 2007; Mayo Clinic, 2007).
The NDTC laboratory is interested in improving their processes. The author’s motivation to
research and apply BPMS methods is based on the Mayo Clinic Laboratories report in 2007
and the Louisiana State Police Crime Laboratory in 2011 Both of these laboratories successfully
applied the BPMS methods called Lean and Lean Six Sigma (LSS) in their laboratories.
The goals of the Mayo Medical Laboratory were to improve operational performance by
reducing costs, faster testing times for customers and improve quality in the laboratory. They
reduced variability in performance, improved staff safety, and morale, reduced the production
times for developing new tests and also reduced errors during the development and
implementation of new tests (Mayo Clinic, 2007). Similarly, the Louisiana State Police Crime
Laboratory (LSPCL) aimed to reduce problems such as backlogs, extended turnaround times
(TAT) that exceeded a year and low productivity (Richard, Kupferschmid, 2011).
For the purpose of this literature review I will refer to these process changing methodologies as
“Business Process Management Systems (BPMS)”, as there are many different terms used to
describe these methodologies, for example Snee, 2010 refers to them as a “Business
Improvement Methodology”, Nonthaleerak and Hendry, 2005 talk about “Quality management”,
Chakrabarty, Kay, 2007 use the phrase “Quality Improvement Program” and Vest, Gamm, 2009
refer to the use of process changing methodologies as “ Transformation Strategies”.

10
Initially in this literature review there is a description of various BPMS methods which have
evolved over the years leading to LSS that is in use today. The BPMS methods discussed here
were selected because of a connection to LSS or Healthcare.
Business Process Management Systems
� The Origins of Business Process Management Systems � Henry Ford’s Mass Production System � Lean � Just-In Time � Total Quality Management (Deming’s PDCA) � Business Process Reengineering � Six Sigma � StuderGroup’s Hardwiring Excellence � Evidence-Based Management � Boeing Lean Production System � Lean Six Sigma
The review concludes with a description of the tools, challenges, and success factors for the
LSS method which was the BPMS method of choice for this research.
2.2 Search Strategy
The methodology used to conduct this literature review involved searching publication
databases such as the Trinity College Dublin (TCD) Library, Google Scholar, The International
Journal of Lean Six Sigma, PubMed, BioMed Central and Emerald Insight for literature that
examined the evolution, adoption and current use of LSS and other business process
management methodologies in healthcare and the public sector, and in particular laboratory
services.
The initial search was restricted to the phrase “Lean Six Sigma and Laboratories”, but these
database searches produced poor results. Expanding the search to include Quality
Management, Quality Laboratories, Six Sigma, Lean, Lean Laboratories, Lean Principles, Total
Quality Management, and Lean Six Sigma, proved more productive.

11
2.3 Business Process Management Systems:
The manufacturing industry have since the 1930’s used structured scientific methods to streamline
production, reduce variability in outcomes and have used statistical methods to measure quality and
standardise production (DelliFraine, et al., 2010).
There have been many different BPMS used in manufacturing over the last one hundred years, such
as Lean, Just-In-Time, Total Quality Management (TQM), Business Process Reengineering,
StuderGroup’s Hardwiring Excellence, Evidence-based management, Six Sigma and Lean Six
Sigma (DelliFraine, et al., 2010; Chiarini, 2011; DelliFraine, et al., 2010; Snee, 2010).
2.3.1 The Origins of Business Process Management Systems
The origins of BPMSs are largely based on the automobile industry and in particular the evolution of
Lean manufacturing in post-World War II Japan. Initially the automobile industry was a craft based
production system, which relied on a highly skilled workforce to produce exactly what the customer
requested, one item at a time and at great expense. To make automobiles available to the mass
populous another alternative had to be initiated, this gave birth to mass production (Walmack, et al,
1990).
Mass Production used purpose built machines manned by semi-skilled workers and produced
standardised products in large quantities. To ensure the production systems ran smoothly extra
safeguards had to be in place. This included extra workers, large inventories of stock and large
areas for the storage of produced cars to ensure that there were always supplies ready to meet
demand (Walmack, et al, 1990).
The Mass Production systems where expensive to run, prone to breakdowns which would halt the
entire production line and staff morale was low as the semi-skilled workers found the work to be
repetitive and monotonous as the products produced were of similar type. Today most of the
automobile industry production systems are based on the Lean Toyota Production System, which
allows for the efficient production of highly crafted products without the added expense and rigid
products produced in a standard Mass Production line (Walmack, et al, 1990).
The methods can be broadly classified as Top-down or Bottom-up approaches. Top-down concerns
mainly improving processes whereas Bottom-up concentrates on solving process flow problems.
The need for BPMS is usually initiated because the business goals within the organisation are not
being realised, this type of approach to finding a solution to a business problem is usually
approached using a top-down process methodology. BPMS improvement projects can also be
initiated because performance gaps have been identified in production.

12
The type of approach used to resolve these shortfalls would be classed as a bottom-up process
methodology. When developing a business improvement process solution, the question that should
be considered is should the problem be approached from a top-down or bottom-up business solution
design (Snee, 2010).
Business process or process flow types of problems can be addressed using a BPMS such as Lean
Six Sigma, Lean, Six Sigma, Total Quality Management, StuderGroup’s Hardwiring Excellence or
other types of BPMS. Six Sigma for example can be used for solving complex business process
problems. To find the wasteful steps in a process the use of a Value Stream Mapping tool is
required, these are usually associated with Lean and can help identify where the business goals or
performance gaps in a system are located (Snee, 2010). For a holistic approach a combination of
Lean and Six Sigma methodologies can be used. Lean can be used to identify non-value added
activities, or may uncover more complex problems. It is when Six Sigma and Lean are combined that
a more complete solution is presented, one which addresses the problems discovered in badly
designed business process systems or delays or waste identified in production flow systems. These
will be discussed later in the LSS section (Snee, 2010).
To understand how LSS has evolved into the state of the art BPMS that is in use today, it helps to
examine some of the other types of BPMS that have been used in the past, some of which are still in
use today.
2.3.2 Henry Ford’s Mass Production System
Henry Ford understood the limitations of the craft production system; two of the main issues were
the workforce had to be highly skilled and craft production system yielded very low production
volume, about 1,000 models a year.
The Ford Model T car allowed Ford to produce a product that was user friendly, easy to repair and
was easy to manufacture, the interchangeable parts, simplicity and easily assembly of the Model T
were the innovations that made the assembly line possible.
This allowed Ford to reduce costs; he no longer needed the skilled craftsmen and replaced them
with semi-skilled assemblers who would stay in the same assemble area all day and parts would be
delivered to them. Ford realised that this was not very efficient and changed the process by having
the workers become proficient in one part of assembly and then moving the workers from one
assembly point to the next assembly point and building the Model T in stages, this innovation
reduced the task cycles. Ford realised that this change although more productive still had its
problems as some workers worked faster than others and this could create bottle necks and the
constant movement of workers from one assemble point to the next created a lot of wasted time. In
1913 Ford introduced the moving assembly production line; this meant that the cars would move

13
from one assembly point to the next until the car reached the end of line fully finished (Womack,
Jones, Roos, 1990).
2.3.3 Lean
Lean process methodologies are based on the Japanese car industry and in particular on the Toyota
Production System (TPS). The term “Lean thinking” was first coined by Wormack and Jones in 1996
in reference to Toyota’s improvement production processes used in the manufacture of cars.
The Toyota Production System (TPS) started after World War II and was pioneered by Taiichi Ohno.
Japan was faced with a shortage of raw materials and finances for its manufacturing production
industries, so for these industries to have a competitive chance with their western counterparts the
employees at Toyota were charged with reducing waste were possible and developed a business
process methodology based on this concept.
In Lean production the term waste was defined as “anything other than the minimum amount of
equipment, materials, parts, space and time which are absolutely essential to add value to the
product” (Russell, Taylor, 2000). The Toyota Production System (TPS) eventually became the
prominent car manufacturing production methodology at the time (Pepper, Spedding, 2010).
2.3.4 Just-In Time
One of the influencing factors for the adoption of Lean production methodology in the West was the
publication of the book “the Machine that changed the world” by Womack, et al., 1990. The
European and US car manufacturing industries began adopting and adapting the Japanese car
production process methodologies and by changing these methodologies to suit western culture they
could remain competitive with the Japanese car manufacturing industry. The new western
methodology was known as Just-In-Time and was modelled on the Japanese Toyota Production
System (TPS), these systems led to the development of the Lean principles methodology (Womack,
et al., 1990; Pepper, Spedding, 2010).
2.3.5 Total Quality Management (Deming’s PDCA)
Dr Edward Deming created the Plan Do Check Action (PDCA) cycle during his lectures in Japan in
1950 and 1951. He developed the concept of plan-do-check-action or PDCA cycle, Deming based
the PDCA cycle on Walter Shewhart's scientific method, Specification Production Inspection Cycle
(SPIC) developed in 1939. Demings PDCA cycle was adopted by the Japanese and developed into
a management tool and became an integral part of the Japanese Quality Control (QC), Total Quality
Control (TQC) and business process activities.
14
In 1986 Deming developed the PDCA model for the USA, the new abbreviated version was used as
a learning and improvement tool and was based on the original Shewhart model and was known as
the Plan Do Study Act (PDSA) cycle. This was updated in 1994 and 2009 to include methods that
would support improvement and change, this version of the PDSA cycle was known as the “Model
for Improvement" (Moen, Norman, 2006).
2.3.6 Business Process Reengineering
Business Process Reengineering was popular in the 1990’s but has decreased in recent years with
only the term reengineering remaining (Osayawe, Ehigie, McAndrew, 2005). It was a methodology
designed to leverage Information Technology and to downsize companies while sustaining
performance, Hammer and Champy, 1993 are credited with developing the first complete
implementation design for Business Process Reengineering. Business Process Reengineering was
based on a top down implementation design driven by senior management and delivered
improvements to quality, cost, service and speed by focusing on the processes. Business Process
Reengineering also focused on the Voice of the Customer (VTC) and in the latter stages the
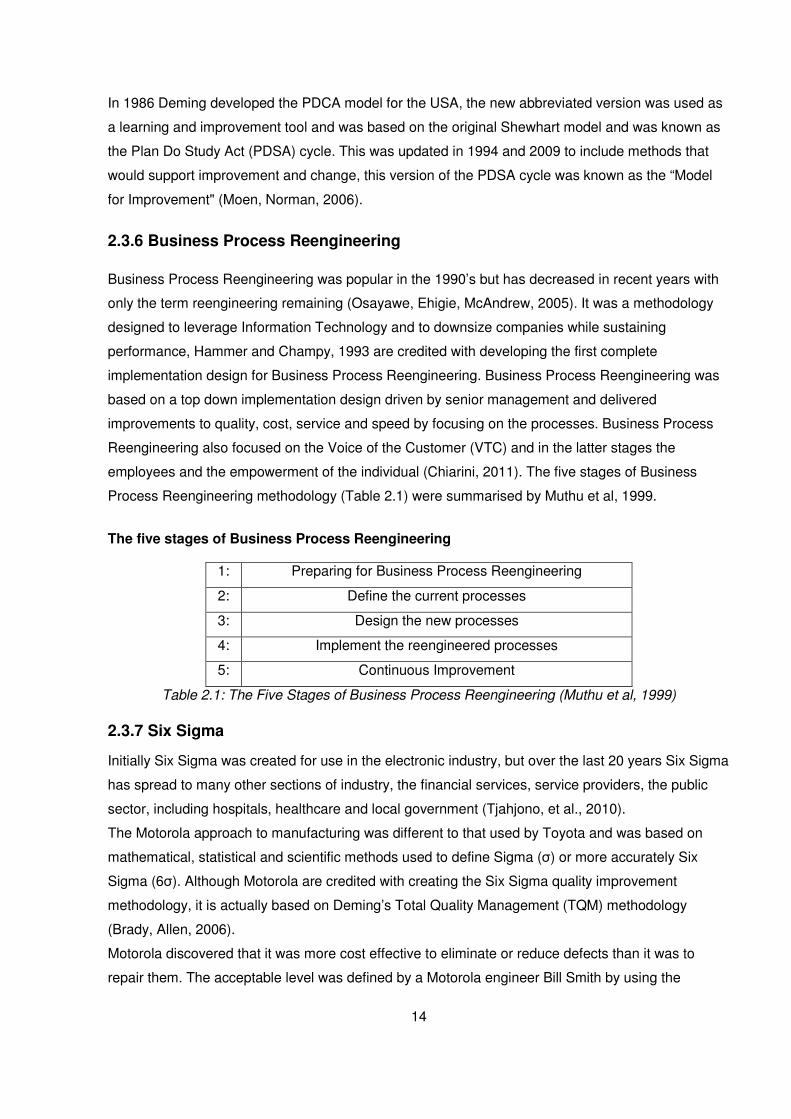
employees and the empowerment of the individual (Chiarini, 2011). The five stages of Business
Process Reengineering methodology (Table 2.1) were summarised by Muthu et al, 1999.
The five stages of Business Process Reengineering
1: Preparing for Business Process Reengineering
2: Define the current processes
3: Design the new processes
4: Implement the reengineered processes
5: Continuous Improvement
Table 2.1: The Five Stages of Business Process Reengineering (Muthu et al, 1999)
2.3.7 Six Sigma
Initially Six Sigma was created for use in the electronic industry, but over the last 20 years Six Sigma
has spread to many other sections of industry, the financial services, service providers, the public
sector, including hospitals, healthcare and local government (Tjahjono, et al., 2010).
The Motorola approach to manufacturing was different to that used by Toyota and was based on
mathematical, statistical and scientific methods used to define Sigma (σ) or more accurately Six
Sigma (6σ). Although Motorola are credited with creating the Six Sigma quality improvement
methodology, it is actually based on Deming’s Total Quality Management (TQM) methodology
(Brady, Allen, 2006).
Motorola discovered that it was more cost effective to eliminate or reduce defects than it was to
repair them. The acceptable level was defined by a Motorola engineer Bill Smith by using the

15
statistical equation Six Sigma (6σ) which equates to 3.4 defects per one million units. Six Sigma is
the point where the cost of eliminating/repairing the defect is greater than the cost of living with the
defect; it was the acceptable point of imperfection or defects in Motorola’s production line. It is
estimated that the implementation of the Six Sigma quality improvement methodology in Motorola
has saved the company over $16 billion (Brett, Queen, 2005).
Six Sigma was designed to improve processes by focusing on quality and reducing defects. As a
statistically based methodology which improves quality by eliminating variance, Six Sigma relies on
creating a near perfect process and repeating it a million times with as little deviation or variance as
possible, regardless of whether it is a process performed on a factory production line or a service
that is being provided in a financial institution or in healthcare. Six Sigma methodologies are about
finding things that are Critical to Quality (CTQ) and focusing on reducing variance in processes that
affect customers. This approach can have the negative result of slowing down processes and
making them more rigid and resistant to change (Devane, 2003).
2.3.8 StuderGroup’s Hardwiring Excellence
StuderGroup’s Hardwiring Excellence is different from other business process management projects
in that it was not developed within a manufacturing environment but in contrast was developed in a
healthcare environment by Quint Studer. Unlike most of the other business process management
methodologies in was designed from a healthcare service improvement perspective as opposed to
production improvement objective. The StuderGroup transformation strategies and techniques focus
on taking a customer-focused and employee-centred approach to service problems. They
incorporate the training of staff and adopting leadership behaviour modelling, eliminating variance
among leaders resulting in a better quality of service and financial benefits for Hospitals where it is
successfully deployed (Vest, Gamm, 2009).
The StuderGroup’s Hardwiring Excellence is focused on management concepts such as motivation,
building social networks within the organisation, objective and evidence based management, user
feedback and learning (Spaulding, Gamm, Griffith, 2010).
Studer proposes that by adopting the StuderGroup’s Hardwiring Excellence methodology there are
five ways (Table 2.2) to reduce variance in leadership.

16
The Five ways to reduce variance in leadership
1: Use a common agenda format for all meetings across the organisation, based on people,
service, quality, finance and growth.
2: The Goals of your organisation should be aligned to the critical success factors and
based on measurable results.
3: The information that each department head disseminates to members of their
departments is the same so that throughout the organisation each employee hears the
same information.
4: Choose a common selection method when recruiting new employees.
5: Leaders throughout the organisation should be trained to respond uniformly to questions
raised by members within their departments.
Table 2.2: The Five ways to reduce variance in leadership (Studer, 2005)
By incorporating the reduction of variances in management and providing training that promotes
leadership competencies this can promote successful health care organisations (Studer, 2005).
The limitations of successfully measuring the effects of StuderGroup’s Hardwiring Excellence
methodologies were highlighted by Vest and Gamm in 2009, in their review of the effectiveness of
transformation strategies in healthcare. Based on a multi-site study of the implementation of the
StuderGroup’s Hardwiring Excellence project undertaken by Meade, Bursell and Ketelsen in 2006,
which looked at the effectiveness of nurse rounding, bed side visits, patient light usage, patient falls
and patient satisfaction, Vest and Gamm suggested that no firm conclusions could be made as to
the effectiveness of this methodology (Vest, Gamm, 2009; Meade, Bursell, Ketelsen, 2006).
Alternatively, Spaulding, Gamm and Griffith, 2010, suggest that there is evidence that human
resources-focused quality improvement implementations in particular StuderGroup’s Hardwiring
Excellence can have significant benefits when promoting organisational change in hospitals
(Spaulding, Gamm, Griffith, 2010).
2.3.9 Evidence-Based Management
Evidence-based management was described by McDaniel and Lanham, 2009 as “. . . the idea that
managers should adopt practices that scientific inquiry has shown to be effective”. There is now a
drive within healthcare, for managers to use evidence-based management tools to increase the
quality and accountability of the services they provide and to increase operational efficiency
(DelliFraine, et al., 2010).

17
To assist healthcare managers to overcome the issues identified by Evidence-based management,
Rundall, et al., 2007 developed the Informed Decisions Toolbox (IDT), which are a set of tools
arranged into six steps (Table 2.3) that help healthcare managers make informed decisions by
taking control of the decision making process (DelliFraine, et al., 2010).
The Informed Decisions Toolbox (IDT)
Step 1: Framing the question
Step 2: Finding sources of information
Step 3: Assessing the accuracy of the evidence
Step 4: Assessing the applicability of the evidence
Step 5: Assessing the "actionability" of the evidence
Step 6: Determining if the information is adequate
Table 2.3: The Informed Decisions Toolbox (IDT) (Rundall, et al., 2007)
2.3.10 Boeing Lean Production System
Boeing created their Lean Production system (Figure 2.1) by combining their production systems
with their quality management systems to achieve a LSS process management methodology which
delivers customer satisfaction. Boeing believes that it is everyone’s responsibility to ensure that they
never create, accept or pass on a defect to the customer (Arkell, 2003).
Figure 2.1: Boeing Quality Management System and Lean (Arkell, 2003)
18
2.3.11 Lean Six Sigma
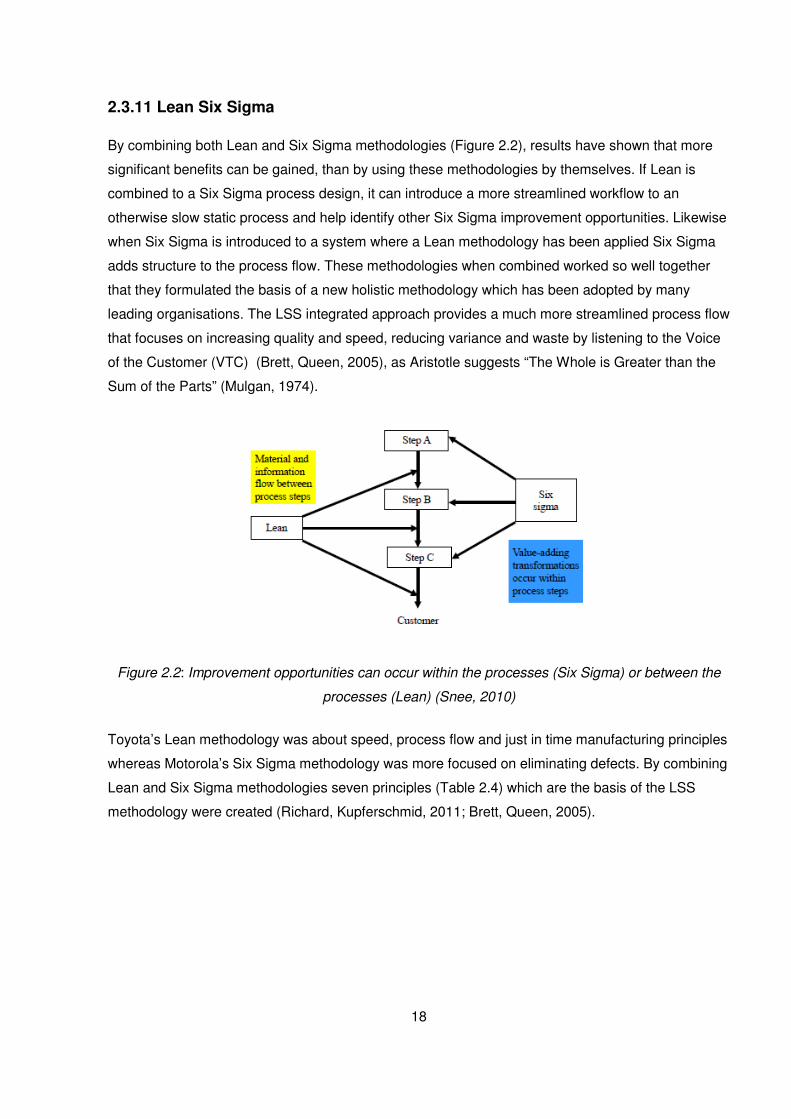
By combining both Lean and Six Sigma methodologies (Figure 2.2), results have shown that more
significant benefits can be gained, than by using these methodologies by themselves. If Lean is
combined to a Six Sigma process design, it can introduce a more streamlined workflow to an
otherwise slow static process and help identify other Six Sigma improvement opportunities. Likewise
when Six Sigma is introduced to a system where a Lean methodology has been applied Six Sigma
adds structure to the process flow. These methodologies when combined worked so well together
that they formulated the basis of a new holistic methodology which has been adopted by many
leading organisations. The LSS integrated approach provides a much more streamlined process flow
that focuses on increasing quality and speed, reducing variance and waste by listening to the Voice
of the Customer (VTC) (Brett, Queen, 2005), as Aristotle suggests “The Whole is Greater than the
Sum of the Parts” (Mulgan, 1974).
Figure 2.2: Improvement opportunities can occur within the processes (Six Sigma) or between the
processes (Lean) (Snee, 2010)
Toyota’s Lean methodology was about speed, process flow and just in time manufacturing principles
whereas Motorola’s Six Sigma methodology was more focused on eliminating defects. By combining
Lean and Six Sigma methodologies seven principles (Table 2.4) which are the basis of the LSS
methodology were created (Richard, Kupferschmid, 2011; Brett, Queen, 2005).

19
The Seven Principles of Lean Six Sigma:
1: Listen to the Voice of the Customer (VTC)
2: Identify the processes and the steps required in the process flow
3: Improve the process flow
4: Remove waste and non-value steps from the process flow
5: Eliminate Variance
6: Seek to improve the elements of the process by involving people and improving technology
and equipment
7: Use a systematic improvement framework when implementing change
Table 2.4: The Seven Principles of Lean Six Sigma (Richard, Kupferschmid, 2011; Brett, Queen,
2005)
LSS can be applied to virtually any process, when it is applied to paper or electronic documentation
or a Records and Information Management (RIM) system; it can lead to improvements in customer
service, reduced costs, more efficient response times and overall greater total quality management
(Brett, Queen, 2005).
There are many Business Process Management Methodologies in use in healthcare today, but LSS
although being a relatively new BPMS, is proving to be popular in healthcare and DelliFraine, et al.,
2010 suggest that by the number of articles on the application of LSS in healthcare, that this trend is
rising (Figure 2.3).
Figure 2.3: Lean and Six Sigma diffusion in healthcare, articles over time (DelliFraine, et al., 2010)
After reviewing and considering the various BPMS methods described above and their application to
various domains, the LSS method was deemed the most suitable one to use in the research

20
described here. In the following sections some of the LSS tools are reviewed, how Lean and Six
Sigma can be used in a Laboratory environment and the relevant challenges and success factors
are described.

21
2.4 Lean Six Sigma Tools
2.4.1 DMAIC Problem Solving
The DMAIC structured problem-solving methodology is used as top down approach, starting at
Senior Management level it is generally used in most LSS projects and is an iterative process that
once completed may be repeated again to add another level of improvement. By using a DMAIC
approach it allows LSS projects to be structured, clearly defined and provides standardised results
when implemented correctly (Keller, Pyzdek, 2005).
• Define the problem
• Measure the Problem
• Analyse how the problem can be resolved
• Implement the solution
• Control the intervention and look for improvements
2.4.2 Spaghetti Diagram
A spaghetti diagram (Figure 2.4) is one of the tools used for measuring in a LSS project. It is used to
track the movement in a process flow and for identifying waste or non-value steps in a process flow
(Richard, Kupferschmid, 2011).
Figure 2.4: Spaghetti diagram showing the steps travelled to complete a process, (Richard,
Kupferschmid, 2011)

22
2.4.3 Value Stream Map
The last input of the define stage is the Current State Value Stream Map (Figure 2.5). The Value
Stream was developed as a Lean tool and is used to track the flow of materials and information
throughout the process flow. In the example below the rectangles represents a process that needs to
be completed and the triangles represent areas where a process can stop and work can build up.
Figure 2.5: Value Stream Map (VSM) of the LSPCL DNA Process (Richard, Kupferschmid, 2011)

23
2.4.4 Project Selection Diagram
Project section process diagram (Figure 2.6) is an effective tool to identify a process problem, decide
on what type of improvement implementation is required and the best tool to use to provide the
solution to the process improvement (Snee, Hoerl, 2007).
Figure 2.6: Project Improvement implementation selection diagram (Snee, Hoerl, 2007)

24
2.4.5 Workflow Diagram
A process flow or process map diagram is an important element during the Define and Analysis
stages of DMAIC and these are best represented using workflow diagrams. A level 1 Process Map is
used to present a high level view of the process flow and a level 3 Process Map (Figure 2.7) is used
to define a detailed or low level representation of a single process (Richard, Kupferschmid, 2011).
The meaning of the symbols used in these diagrams can be found in Appendix II.
Figure 2.7: Part of a Sample process map (using Workflow diagrams) showing the last 4 process
steps (level 1) and the corresponding detail under each step (level 3) (Richard, Kupferschmid,
2011)

25
2.5 Lean Six Sigma in Laboratories
By applying a BPMS such as LSS in a laboratory environment, it is possible to deliver and maintain
quality laboratory results, reduce costs, introduce faster turnaround times on testing results, while
maintaining quality of service and customer satisfaction (Mayo Clinic, 2007; Richard, Kupferschmid,
2011).
The use of Lean Principles (Table 2.5) and how they can be applied in a laboratory environment can
be broken down into five main areas, these are:
Lean Principles in a laboratory environment
The Value principle which can be defined as having the value attributes of a control system
process such as quality, speed, cost, it is something that is important to the client, something that
a customer would pay for.
The Value stream for each value process identified is used to identify and eliminate the wasted
steps used in these processes.
The Flow principle is used to enable the process or service to continuously flow through
process steps once the waste has been removed.
The Pull Principle is used to enable a continuous flow of the processes by identifying when a
task is completed or when an intervention is required allowing the process to become as fully
automated as possible.
The final principal is an iterative process, one of continuous improvement, looking at ways to
reduce the number of steps in a process, increase the quality, or reliability of the process for the
client.
Table 2.5: Lean Principles in a laboratory environment (Mayo Clinic, 2007)
2.5.1 Lean Six Sigma Case Study
LSS has been successfully deployed to laboratories for the purpose of managing problems such as
backlogs, extended turnaround times (TAT), and low productivity. The Louisiana State Police Crime
Laboratory (LSPCL) undertook such a project in 2008 to address issues such as poor productivity,
severe backlogs, and turnaround times that exceeded a year. In 2008 the LSPCL was awarded a
National Institute of Justice (NIJ) efficiency improvement grant of $600,000, with the following goals
to provide solutions that could be adopted nationally.
1: Reduce DNA testing turnaround times by 50%
2: Double productivity.

26
3: Reduce the DNA case backlog 50%
4: Increase the number of Combined DNA Index System (CODIS) National DNA Database hits.
By adopting a LSS Methodology all of the targets were achieved.
1: DNA testing turnaround times were reduced from 258 days down to 129 days within 3 years and
down to 59 days in 2011.
2: Productivity was increased to 100 requests completed a month and increased further to 175 in
2011.
3: These quality improvement implementations help reduce the backlog of requests initially down to
850 requests and eventually down to 152 requests in 2011.
4: The Increased DNA information on the CODIS database has increased the number of hits on
CODIS database to 748 in 2011.
LSS enabled the LSPCL to create an efficient business like structure within a laboratory
environment, one that could deliver timely and accurate DNA analyses for their customers.
The LSPCL not only achieved the goals set out by the National Institute of Justice (NIJ), they
achieved their own departmental goals by completely eliminating backlogs, completing 100% of all
DNA forensic casework submitted each year and reduced DNA turn-around-time to 60 days.
The LSPCL LSS project focused on three levels of improvement.
Level 1: Communication
Develop better, more efficient communication between the LSPCL and other agencies. This was
achieved by cancelling unneeded tests, prioritising backlogged cases. The LSPCL created electronic
DNA test request forms to equip agencies for easier future submissions. The DNA test request forms
could only be processed if they were completed correctly, by adopting a culture of reducing Costs of
Poor Quality (COPQ), they ensured that all the submissions received were completed correctly.
Level 2: Outsourcing
To reduce the backlog of forensic casework, the LSPCL temporarily outsourced some of the
backlogged DNA Analysis casework to outside agencies. They outsourced training of new
technicians and analysts to external agencies. All quality control and validation of laboratory

27
equipment was outsourced, these changes allowed the LSPCL to purchase technology to help
reduce DNA Analysis time.
Level 3: Improve DNA forensic Analysis Workflow
By applying LSS business management principles to the laboratory allowed the LSPCL to improve
productivity and increase Analysis capacity. The introduction of new technology to automate
processes and the outsourcing of clerical administration tasks, allowed the DNA staff to concentrate
on casework and Analysis.
The success of this LSS quality improvement implementation has led to other laboratories
conducting similar LSS projects and has been adopted by the Department of Public Safety Services
and the National Institute of Justice (NIJ) as a template for similar productivity challenges in DNA
forensic laboratories.
An example of how spaghetti diagrams can be used in a LSS project to identify waste in a
laboratory, can been seen in Figure 2.8, which shows the process flow before LSS and Figure 2.9
which shows the process flow after LSS initiatives were applied. The diagrams show the steps
involved in the Analysis of a sexual assault case, they are used to scrutinise the system from end to
end, and this technique is called Value Stream Mapping (VSM) (Richard, Kupferschmid, 2011).
Spaghetti diagrams from the Louisiana State Police Crime Laboratory (LSPCL) LSS project in 2008:
Figure 2.8: This Spaghetti diagram shows the steps travelled (approximately 12,687 feet or 2.4
miles) before the LSS implementation (Richard, Kupferschmid, 2011)

28
Figure 2.9: This Spaghetti diagram shows the new process flow (approximately 7879 feet or 1.5
miles) the LSS implementation (Richard, Kupferschmid, 2011)
In the diagrams above, the different steps of the process are represented by different colours and
one step equals approximately to two feet and takes one second to travel. The total distance
travelled before the LSS improvement phase was 12,687 feet which would equate to a time of 106
minutes of time spent travelling (the length of time of the process flow) per sexual assault case. The
new process flow for a sexual assault case after the LSS quality improvement implementation was
reduced to approximately 7879 feet or 1.5 miles (Figure 2.9). The LSPCL deals with an average of
400 sexual assault cases a year, this means that the motion waste from this process before the LSS
improvement phase was 42,400 minutes a year or 34% of an employee’s time (based on an
employee working 40 hours a week for 52 weeks) (Richard, Kupferschmid, 2011).

29
2.6 Challenges to Lean Six Sigma Projects
There is very little literature detailing implementation failures of LSS projects. This could lead one to
conclude that LSS is an effective BPMS and provides the desired quality improvements.
Alternatively the lack of such articles could indicate a publication bias towards successful business
process management quality improvement projects (DelliFraine, Langabeer II, Nembhard, 2010).
Some of the bias and resistance towards LSS methodologies are based on how the quality
improvement was executed, if for example stock was reduced in a highly intensive production
environment, this could expose the organisation to greater risk while putting unnecessary pressure
on staff and in turn alienating them from the quality improvement implementation (Pepper, Spedding,
2010).
The new software tools developed for use in LSS can be counterproductive for example Value
Stream Mapping (VSM) software, limits the detail of the process flow collected and detracts from the
system Analysis, as compared to the traditional pencil and paper approach as Value Stream
Mapping (VSM) should be quick and simple (Sheridan, 2000).
Resistance to change is another factor that should be taken into consideration when undertaking any
BPMS project. Atkinson 2013 claims that research in organisational development show that 90 per
cent of cultural change programmes fail to reach or maintain their goals. Furthermore new
organisational changes resulting from mergers or acquisitions have poor success rates with between
56% – 70% failing to achieve the objectives they initially planned for, stating that the main reason for
failure was resistance to cultural change. It is important to realise that in some cases a person’s first
reaction to change is to personalise it “How will this affect me?”, “Will I be able to use the new
system?” (Atkinson, 2013).
BPMS’s such as Lean, Six Sigma, and Lean Six Sigma have been deployed in healthcare over the
last 15 years. There have been claims that these initiatives have led to improvements to the quality
of healthcare services by improving clinical outcomes, quality of care and financial performance.
DelliFraine, Langabeer II and Nembhard, 2010, conducted a comprehensive literature review of
Lean, Six Sigma and Lean Six Sigma in healthcare to assess what empirical evidence existed in the
literature published between 1999 and 2009 to support such claims. They suggest that there are
significant statistical and analytical gaps in the BPMS literature and that the evidence is very weak to
support claims that healthcare quality actually improved. Of the 177 articles reviewed they found that
only 34 articles reported outcomes and of these only 11 articles used statistical Analysis to test if
there had been any improvement to the quality of the healthcare services after the project was
completed.

30
DelliFraine, Langabeer II and Nembhard, 2010, propose that a better demonstration of the
effectiveness of business process management quality improvement implementations could be
demonstrated by conducting a detailed statistical Analysis on specific areas highlighted for
improvement before and after the BPMS is deployed. This would help provide evidence that the
quality improvements were due to the BPMS project and no other factors.
In conclusion the literature suggests that it is unclear that these Business Process Management
improvement projects actually improve the quality of the healthcare services and that more studies
on the failure to effectuate LSS projects in healthcare should be conducted. The literature produced
from these publications could be used as valuable teaching aids to healthcare professionals
undertaking future business process management improvement projects (DelliFraine, Langabeer II,
Nembhard, 2010). To correctly execute a LSS quality improvement implementation, a holistic
approach is required one which optimises the process for the whole system by putting the right
interventions in the correct place (Pepper, Spedding, 2010).

31
2.7 Success Factors for Lean Six Sigma
The introduction of a BPMS has been shown to successfully improve the tracking of specimen
samples and stock, reduce the number of non-conformance due to human error by incorporating
error proofing. The Mayo Clinic, 2007, achieved this by identifying areas during the initial analyses
phase where value stream breakdowns occurred and removing non value added steps and replacing
these with mistake proofing processes or flows and making continuous improvements where needed
(Mayo Clinic, 2007).
LSS has the benefits of the business philosophy of the Toyota Production System (TPS) and
Motorola’s process improvement paradigm, which has seen it successfully deployed in healthcare,
laboratories, financial services, industry, the public sector, local government and the U.S.
Department of Defence. When Lean and Six Sigma are combined together they offer an extremely
powerful tool which offers sustainable and continuous improvements in efficiency, waste elimination,
quality and customer service (Pepper, Spedding, 2010; Richard, Kupferschmid, 2011).
The argument against deploying a LSS BPMS to a services environment is based on the belief that
within the services environment it is hard to identify processes, as many are unseen and intangible
and are very hard to measure. This presumption has been shown to be unfounded, as LSS has
been successfully deployed in healthcare, financial services and local government (Hensley, Dobie,
2005).
By deploying a BPMS like LSS to a healthcare environment it has been shown to lead to improved
resource utilisation, reduce redundancies, bottle-necks in services have diminished and has led to
the removal of wasteful processes. Overall Total Quality Management (TQM) has been shown to
improve, resulting in improved working conditions and greater patient and physician satisfaction and
a reduction in costs (Chakrabarty, Tan, 2007).
Vest and Gamm, 2009 from their studies have concluded that the implementation of a variety of
BPMS’s have been successfully deployed improving both healthcare and services. Improvements
seen after BPMS’s such as LSS were deployed in Laboratory environments have also produced
quantifiable results, such as reduced batch sizes, improvements in staff scheduling reorganisation in
correlation with the arrival of samples. These improvements were achieved by using tools like
DMAIC and Value Stream Mapping (VSM) (Vest, Gamm, 2009; Mayo Clinic, 2007).
Snee, 2010 argues that LSS success can be contributed to the use of the DMAIC improvement tool
which he states “is arguably the best (improvement framework) available today” and also how LSS
can be used to focus on finding the variables that account for the variation in a process. When these
key variables are identified the process can be effectively altered.

32
The Critical Success Factors (CSF) to successfully deploying and sustaining improvement initiatives
lies in strong leadership, using the best people and a holistic improvement methodology. The
supporting infrastructure should be put in place at the beginning of the project and the improvement
implementation should be treated like any other business process within the organisation. It should
have a budget, strategy, management reviews, communication, and a reward system. The
infrastructure in place should be sustainable, to ensure a culture of continuous improvement (Snee,
2010).
Snee, (2010) suggests that there are a number of principle critical success factors that contribute to
successfully deploying a business process management methodology and that all these principles
can be found within the LSS paradigm.
• A sense of urgency
• Leadership
• Think in terms of processes (all work is a process)
• Recognise variation and eliminate where possible
• Improvement in performance
• Focus on the most important issues
• Financial Benefits
• Sustainability
• Celebrate the successes
The Critical Success Factors (CSF) subscribed to by Snee, 2010, are similar to those of
Chakrabarty, Tan, 2007, who suggested that for a Six Sigma methodology to be successful the
following Critical Success Factors (CSF) should be considered.
• Management commitment
• Training
• Cultural change
• The Voice of the Customer (VTC)
• Improvement in Performance
• Financial Benefits
• Understanding the processes

33
By comparing the Critical Success Factors suggested by Snee 2010, and those suggested by
Chakrabarty, Tan, 2007, it can be shown that the lists are nearly identical. Chakrabarty, Tan, 2007,
further more suggest that based on the results of their literature review, that the most import Critical
Success Factors (CSF) from the articles reviewed were.
• Management commitment
• Training
• Cultural change
• Financial benefits
Richard and Kupferschmid, 2011, also suggest that both the commitment of the management team
and cultural change were Critical Success Factors (CSF) for their LSS improvement implementation.
The key success factors for the NDTC LSS project included a combination of those suggested by
Chakrabarty, Tan, 2007 and Snee, 2010, but not exclusively all those listed.
1. Management commitment
2. Listening to the Voice of the Customer (VTC)
3. Understanding the processes to identify the most important problems
4. Improvement in performance
5. Training and managing resistance to change (Cultural change)
6. Financial Benefits
7. A need to initiate change (not necessarily, “a sense of urgency”)
As stated earlier LSS methodologies have been successfully deployed across a full spectrum of
industries and services, companies and organisations including, The U.S. Department of Defence,
the Louisiana State Police Crime Laboratory, General Electric, Merck, Du Pont, Johnson & Johnson,
W.R. Grace, Honeywell, Boeing, Bank of America, Rolls Royce and many more (Snee, Hoerl, 2003;
Snee, Hoerl, 2005; Richard, Kupferschmid, 2011; Arkell, 2003).

34
2.8 Conclusions
The key factors to the successful completion of a LSS project suggested by Richard and
Kupferschmid, 2011, is the wiliness to accept change by the participants of the improvement
implantation and the commitment of the management team to the project and to the completion of
the project.
Although both Lean and Six Sigma methodologies have evolved separately, Pepper, 2007 suggests
that a more amalgamated methodology with closer integration between the two methodologies must
be achieved, one that should be based on a theoretical and scientific foundation (Pepper, 2007).
Improvement opportunities are developed by identifying the business process deficiencies and not
looking at which is the best approach to solving the problem (Lean or Six Sigma) as this is
unproductive, improvement is the issue. A holistic approach using both Lean and Six Sigma
methodologies is needed to effectively solve these problems, “Improvement opportunities occur
between and within process steps” (Snee, 2010). Pepper and Spedding, 2010, concluded from their
research that the findings showed evidence that there was no clear framework for the
implementation of LSS and a new approach needs to be used, one that optimises Lean and Six
Sigma methodologies as a whole.
Richard and Kupferschmid, 2011, following their successful LSS project stated that although their
LSS process improvement implementations were conducted by LSS experts, a standard framework
of tools could be custom defined from the lessons learnt, depending on the intervention required.
One of the project requirements requested by the U.S. Department of Justice was that the
improvements to the process flow could be replicated to other forensic DNA laboratories. Richard
and Kupferschmid, 2011, suggested that the tools and concepts used successfully by the LSPCL
could be used and replicated as needed, which would allow for the use of a standard methodology
for similar laboratories.
To address the needs of the NDTC it was decided from the evidence provided in the Literature
Review that Lean Six Sigma would be the BPMS most in line with the requirements of the NDTC.
Lean Six Sigma tools like Value Stream Mapping, Spaghetti Diagrams, and Process Flow Diagrams
were used effectively to identify defects and waste in the process flow as well as listening to the
VTC. The approach adopted by the project team was to use these diagrams and the DMAIC tool as
a template on the processes identified and selected for improvement by the customer (Senior
Laboratory Team).

35

36
Chapter Three: Methodology
3.1 Introduction
The methodology used for this dissertation was to conduct a literature review on current and past
BPMS’s focusing in particular on LSS. A serious of interviews with the key stake holders within the
NDTC Laboratory was undertaken to identify processes within the Laboratory where significant
improvement could be made by the implementation of a LSS intervention. A Value Stream Map
(VSM) of the specimen sample process flow within the Laboratory was created (Figure 4.4) and the
processes were identified within the specimen sample process flow. A template was designed and a
series of case studies based on the areas of the process flow where the customer believed
significant improvements to the NDTC Laboratory could be achieved by using a BPMS such as LSS
to improve productivity, reduce paper based reports and forms, reduce costs and reduce
transcription errors.
3.2 Choice of Methodology
To achieve some of the requirements identified during the initial Waste Walk and interviews
conducted as part of the LSS intervention required the building of several prototype development
modules by a System Analyst in Labware for the current Labware LIMS application used by the
NDTC. All of the of these prototype modules have been fully tested and successfully deployed to
production by the NDTC ICT Department and the NDTC Senior Biochemists as part of Phase I of the
LSS Project.
Qualitative and quantitative measurements of the current processes identified in the case studies of
the before and after states of the LSS implementation were conducted where possible, to evaluate
the errors introduced by the current paper based processes and to highlight the true benefits of
pursuing continuous improvement activities (Tran, Thang. 2011). To better demonstrate the
effectiveness of a BPMS quality improvement, as suggested by DelliFraine, Langabeer II and
Nembhard, 2010, a statistical Analysis on specific areas highlighted for improvement was
conducted, measuring the before and after states following the LSS process changes, with the
purpose of providing where possible evidence that the quality improvements were due to the BPMS
intervention and not other factors. Non-structured feedback interviews were conducted with the
Senior Biochemists responsible for the production systems and process flow within the Laboratory
and the Laboratory Quality Control Manager. A questionnaire was conducted with the NDTC

37
Laboratory staff to rate the level of satisfaction with the process improvements and to determine if
the initial aims of the BPMS project had been addressed.
3.3 Purpose of Literature Review
A literature review was undertaken to examine the existing research done in this area and to identify
where these BPMS’s have been successfully deployed or have failed and to help identify possible
pitfalls that may be encountered when such methodologies are deployed to the NDTC Laboratory.
The literature review examined how other Laboratories conducted similar interventions and at how
they adopted LSS methodologies and the approach they used to meet their objectives. Current and
past BPMS’s and in particular LSS Laboratory Quality Management systems were reviewed
3.4 Methodology used in Case Studies
The approach used by the author was to map the current Value Stream of the specimen sample
process flow within the NDTC Laboratory. Once the Value Stream was mapped the individual
processes within the specimen sample process flow were identified and areas where LSS could be
used to eliminate waste, identify bottlenecks in the process flow and reduce errors were discussed
with the Senior Laboratory Team.
A template for the design of the Case studies (see Section 3.4.1) was developed based on the
Design, Measure, Analysis, Implement and Control (DMAIC) Methodology used in LSS and the
steps below were used to populate the template for each of the Case Studies.
The first step in the LSS project used within the NDTC Laboratory was to gather baseline data and
to start mapping the current process flow of a specimen sample through the Laboratory and identify
the different processes which occur within the Laboratory (4.3 Overview of Specimen Sample Value
Stream).
The second step was to measure the individual processes identified for the LSS interventions within
the process flow, this involved measuring how the tasks were performed within a process, the time
taken to complete the process or the quality of the process in relation to the number of transcription
errors in the urine specimen sample process flow through the Laboratory. LSS was also used to
identify gaps which occur within the different processes and also within the process flow (between
the processes) and create a plan that would allow for the implementation of process improvements.
Thirdly an Analysis was conducted of the processes identified for improvement by the Senior
Laboratory Team, where the process could be improved by leveraging Information Technology (IT),
eliminating deviations or reducing errors by deploying a LSS intervention.

38
The next step was to deploy the identified improvements either within the process flow, within the
processes, or both, using the resources available.
After the implementation phase, the Laboratory Quality Control team were assisted with the creation
of Standard Operating Procedure (SOP) documentation, and training. Measurements of the new
process were taken and compared to the process prior to the LSS process improvement, to identify
the benefits of the process change and to validate that the interventions had improved the process
flow.
3.4.1 Template Used in Case Studies
The Template used in the case studies is based on the LSS methodology of Design, Measure,
Analysis, Implement, and Control (DMAIC).
3.4.1.1 Define
Conduct a Waste Walk (observing the process while in production and identifying the waste in the
process) (Mayo Clinic, 2007)
Motivation – Why is this Case Study Important?
Voice of the Customer (VTC) – Interviews
What necessitates the intervention, cost, time, or to reduce waste
What objectives are to be achieved?
3.4.1.2 Measure
Document the system/process flow from start to finish (Mayo Clinic, 2007)
Define the current “As is” Process
Produce a Value Stream Map
Measure – The time a process takes to complete and the process flow
3.4.1.3 Analysis
Analysis the “As Is” and document how to correct problems

39
Define future state and envision how the process will function when the waste has been removed
(Mayo Clinic, 2007).
3.4.1.4 Implementation
Implement the LSS intervention and measure the Key Performance Indicators (Mayo Clinic, 2007).
3.4.1.5 Control
Once the project is effectuated a review of the new process should be undertaken periodically (Mayo
Clinic, 2007), with new Implementations – It is not always possible to introduce a total process
change in the first instance (Figure 4.1). Some interventions must be performed in iterations
(different stages) before they can be fully deployed (Mayo Clinic, 2007).
Figure 4.1: Develop a plan of action, which will manage performance while the Lean Six Sigma
intervention is being implemented (Mayo Clinic, 2007)
3.5 Interviews and Data Selection Requirements
A key component that LSS methodology emphasises, is the need to listen to the Voice of the
Customer (VTC) (George, George, 2003), to achieve this, a serious of interviews were initially
conducted with the Senior Laboratory Team.
Once a process was identified where a LSS intervention (Case Study) could be used to make
significant improvement to specimen sample Value Stream, a Case Study was undertaken and a
member of the Senior Laboratory Team was assigned to the individual Case Study.
Interviews were conducted with the Biochemists responsible for that particular process, throughout
the lifecycle of the Case study to insure that the Voice of the Customer (VTC) was always heard.

40

41
3.6 Limitation of Research Methodology
LSS as a Business Process Management System can be deployed very quickly and effectively when
adequate resources are available. Due to the timeframe set out for this Masters in Health Informatics
(MSc HI) Dissertation and the limited resources available within the NDTC as discussed in the
introduction, this project was divided into two Phases. Phase I was conducted between March 2013
and July 2013 for the inclusion in this Dissertation and Phase II is planned to be conducted from
August 2013 to January 2014, the define stage for some of the processes in Phase II have been
included in Appendix I. The five process issues selected for Phase I from the initial ten processes
highlighted by Laboratory Senior Management team have been resolved and solutions to the
process problems have been fully deployed to production. It was deemed that these five processes
selected for Phase I would yield substantial benefits within the Laboratory and that they should be
used as Case Studies for the purpose of this Dissertation.

42
Chapter Four: Research
4.1 Introduction
The approach adopted to address issues faced by the NDTC in regards to, reduce costs, the
increased number of specimen sample requests received, staff shortages (due to the current
moratorium on recruitment) and extended turn-around times (TAT), was to use a BPMS approach to
address some of the issues. The goal was to create interventions that would allow the services
provided to be conducted in a timely, accurate manor and meet the needs of the customer.
To achieve these goals LSS was used to identify areas within the main Value Stream process flow
where changes could be leveraged to enhance the processes and process flow and eliminate waste.
4.2 Research Design
Listening to the Voice of the Customer (VTC) through a series of interviews conducted with the
NDTC Laboratory Principle Biochemist and Senior Biochemists, four key requirements became
apparent for the success of the project (see 4.2.1 below). During the course of these interviews 10
processes were identified (Table 4.1 and Table 4.2) where if a LSS intervention were initiated it was
believed that significant improvement to the specimen sample Value Stream would be realised.
The project was split into two different phases, Phase I of the project would be run over five months
from February 2013 to July 2013 and would aim at resolving the first 5 of the 10 process
improvement areas identified by the customer and Phase II of the project would be run over the
following five months August 2013 to January 2014 and would focus on improving the remaining five
processes identified by the customer.
4.2.1 Four key requirements
1. Reduce paper by developing a paperless environment.
2. Improve process performance.
3. Reduce human errors.
4. Create processes that can cope with the increasing number of specimen sample requests.

43
4.2.2 Phase I: The First Five processes Identified for Improvement by the
Laboratory Senior Management Team
Process Information Case Studies
Sample Reference Log The Sample Reference Log is a
record of a Batch of urine
specimens known as samples
prepared by the Laboratory
staff for Analysis.
Process 1 – Page 48
Sample Disposal Log Sample trays are currently
stored in the Laboratory Cold
Room awaiting disposal. The
current process is to update a
MS Word document "The
Sample Disposal Log" and store
the documents on the Server.
Process 2 – Page 58
No Longer needed due to the
implementation of Process 1
NWA Statistical Reports A North West Analytical (NWA)
statistical Analysis is conducted
on an Analyser when one of the
following states occurs.
1: A new LOT of Calibrator is
used on one of the Analysers.
2: A new LOT of Reagent is used
on one of the Analysers.
3: A new LOT of Quality
Controls (QC) are used on one
of the Analysers.
4: If a Quality Control (QC) is
failing.
Process 3 – Page 59
Electronic Reporting Reporting Section - all reports
are printed and after 4 months
are stored securely offsite, at
considerable expense. By
storing these reports
electronically it is hoped that
this will negate the need to
print off paper based reports.
Process 4 – Page 67
New Stock Tracking and
Reporting
When New Stock is used in the
NDTC Laboratory each box is
examined and checked against
the Delivery Docket. Stock may
consist of individual
assignments of Reagents,
Calibrators and Quality Controls
or a combination of them. A
stock taking exercise is
conducted each month.
Process 5 – Page 75
Table 4.1: The First Five Case Studies identified during Interviews.

44
4.2.3 Phase II: The Second Five processes Identified for Improvement by the
Laboratory Senior Management Team
Process Information Case Studies
Controlled Drug Tracking Controlled Drugs Tracking
requirements and the control
system processes used by the
NDTC Laboratory to meet the
legal requirements for the use
of these drugs.
Process 6:
Appendix I – Page 125
In Development Phase
Instrument Maintenance All analysers must be checked
and calibrated each morning. At
present this process is recorded
in a TF3 form which is
generated by Pardigm II and
stored on the Server.
Process 7:
Appendix I – Page 130
Not Initiated at Present
Analyser Calibration At the end of each day details
of what has happened on the
Analysers must be recorded.
The analyser software does not
facilitate the export of this
information into the (LIMS).
Process 8:
Appendix I – Page 133
Not Initiated at Present
Laboratory Telephone Enquiries The current process is to record
telephone queries by hand on a
printed MS Word document
form (LR04). These forms are
collated on a MS Excel Spread
sheet and a monthly Analysis
performed by the Laboratory
Customer Service Department.
Process 9:
Appendix I – Page 134
Not Initiated at Present
Confirmatory Analysis Testing for example
confirmatory Analysis list of
samples, currently these
reports are printed off, it is
hoped that these could go back
into Labware LIMS.
Process 10:
Appendix I – Page 135
Not Initiated at Present
Table 4.2: The Second Five Case Studies identified during Interviews.

45
4.3 Overview of Specimen Sample Value Stream
The first step in the LSS intervention used in the NDTC was to identify the specimen sample Value
Stream in the Laboratory. Once the process flow of the specimen sample was identified a process
flow chart was created (Figure 4.2) to map the process flow of a specimen sample through the
Laboratory. The Value Stream map (Figure 4.4) is used to identify the processes that add value to
the process flow and also to highlight areas of waste within the process flow. The Senior Laboratory
Team selected 10 processes where a change could bring substantial benefits in cost, time and staff
morale within the Laboratory. These processes were then examined using the LSS DMAIC tool to
measure the existing processes and define how they could be changed.
4.3.1 Process Map of the NDTC Laboratory Specimen Sample Journey
Figure 4.2: Level 1 - Process Flowchart Laboratory Specimen Sample Journey
4.3.2 Spaghetti Diagram - NDTC Laboratory Specimen Sample Journey
The specimen samples journey is mapped out on a Spaghetti Diagram (Figure 4.3) from when it
arrived at the delivery hatch to when it was moved to the cold room awaiting disposal.
1: Samples arrive in vials, either via the lift and are delivered by a courier (External Samples) or via a
pneumatic shoot (Internal Samples).
2: The samples are unpacked at the delivery hatch.
3: Samples are sorted onto trays (approximately 50 samples per tray).

46
4: The trays are then moved to a counter beside fume hoods where they are stored before
decanting.
5 – 5a: The samples are decanted into test tubes and two identical barcodes are used one is placed
on the Vial (step 5) and one is placed on the test tube (step 5a).
6 – 6a: The trays of Vials are taken to the Book-in Laboratory and the Sample information is inputted
into Labware LIMS (step 6). The test tubes are placed in racks which hold 10 Test Tubes and these
are moved to the not for processing counter (step 6a) and wait there until the Vials have been
booked into Labware LIMS by the Lab Aides.
7 – 7a: Once Booked-in the trays of Vials are moved to a trolley (step 7) and the Test Tubes are
moved to the ready for processing counter (step 7a).
8 – 8a: The trolley containing the trays of Vials is moved the cold room and kept for 2 weeks before
being disposed of (step 8). The test tubes are placed in one of the two AU2700 Analysers and the
required tests are carried out on the samples (step 8a).
9: When all tests have been run and the results validated the test tubes are disposed of.
Figure 4.3: Spaghetti Diagram – NDTC Laboratory Specimen Sample Journey.
10: Once the tests are completed, checked and validated the Laboratory sends the results via Clinic
reports to its customers. The Laboratory prints a hardcopy of every Clinic report and these printed
Clinic reports are kept indefinitely and are eventually moved to offsite storage. If a customer requires
a faxed Clinic report or mailed Clinic report another copy of the report is printed and sent to the
customer.
The Laboratory has several electronic methods in which their customers can receive Clinic reports.
For a customer to access their Clinic reports electronically they are required to register their Clinic
with the Laboratory and an account for that Clinic will be created by the Laboratory. Once the
customer is a registered user of the NDTC Laboratory Electronic Reporting (LER) application they
can securely login and check results over the Internet.

47
If the customer has access to the Health Services Executive (HSE) network and is a registered user
of the HSE’s Drugs Aids Information System (DAIS), they can access their Clinic reports or if the
customer has access to the NDTC network and is a registered user of the NDTC’s Electronic Patient
System (EPS), they will have access to their Clinic reports electronically.
4.3.3 Value Stream Map - NDTC Laboratory Specimen Sample Journey (AS IS)
Figure 4.4: NDTC Laboratory Specimen Sample Value Stream Map
The above stages were the Define (D) and Measure stages (M) of the DMAIC methodology, the next
stage was to Analyse (A) the process flow to show areas of waste, errors, deviations within the
processes and non-productive activities. These were highlighted to the Senior Laboratory Team
using a Value Stream Map (VSM) Figure 4.4 and a plan for improvement undertaken. The
Implementation (I) phase of the project is where the improvements and process changes identified
during the Analysis (A) phrase of the DMAIC process are implemented. The final part of the DMAIC
process is the Control (C) phase which concentrates on continuously improving the process, that
may have not been possible to carry out earlier because the initial implementation phase needed to
be in place first. The Control (C) stage of the project is where Standard Operating Procedures (SOP)
are defined and put in place; it is the phase of constant revisiting the activities performed within the
process and improving them.

48
4.4 Phase I: Process 1: TF4 Form used to Record Specimen Sample
Reference logs
The Sample Reference Log is a record of a batch of urine specimens known as samples prepared
by the Laboratory for Analysis (Figure 4.5). A batch can contain up to three trays and each tray
contains up to 50 urine samples. The trays are sorted by clinics and can contain several samples
from different clinics. When a sample or a group of samples are received into the Laboratory they
are arranged on trays and grouped together by clinics, sometimes the samples from one clinic may
spread across several trays.
Figure 4.5: Specimen Sample Workflow Diagram before LSS
To record which samples were processed in a batch, a TF4 form (Figure 4.6) is generated by the
Lab Aide responsible for booking in that batch of samples. A TF4 form is a word document template
that is filled in by the Lab Aide to record what samples are being processed in a batch. The TF4 form
(Sample Reference Log) contains details of which Trays are being used, what samples are being
processed on that Tray, the clinic the samples belong too, and the number of samples that are being
tested for that clinic.
Once the Lab Aide has completed the initial part of the TF4 form, the form is then saved to the
Laboratory document server in a shared folder. When a Batch has been completed and the Quality

49
Control checks have been conducted for the batch of samples tested, the TF4 form is reviewed by a
Biochemist. The Biochemist then generates Clinic reports from within Labware LIMS for each of the
clinics based on the results of tests carried out on that batch and prints a copy of Clinic reports for
each Clinic. The TF4 form is checked for transcription errors against the Clinic reports and once all
errors have been corrected the batch is validated as complete by the Biochemist. The Biochemist
then completes their section of the TF4 form and saves the completed version of the TF4 form to the
Laboratory document server and also prints a hard copy of the TF4 form. A hardcopy of the reports
are printed and the TF4 form is signed by the Biochemist and attached to the reports which are
stored in the Laboratory for six months and are then sent offsite for long term storage.
Figure 4.6: TF4 Form – Sample Reference Log
4.4.1 Define: TF4 Form used to Record Specimen Sample Reference logs
1: Samples are delivered in Vials at delivery hatch in main Laboratory.
2: Samples unpacked and sorted onto Sample trays. Each Sample tray contains approximately 50
samples.
3: Sample trays are moved to storage trolley waiting decanting.

50
4: Sample trays are moved into fume cupboards and are decanted into test tubes (Process 5a in the
Spaghetti Diagram, see Figure 4.8) which are held in racks, each holds ten test tubes. Both the Vials
and the test tubes are bar-coded with matching barcodes when they are decanted (Figure 4.7).
Figure 4.7: Decanting barcoded Vial into barcoded Test Tube
5: The Vials are moved to the book-in area, were the information relating to the samples is entered
into Labware LIMS. The information includes the Client name, date of birth, Clinic requesting test
and the barcode on the Vial is scanned into Labware LIMS using a barcode scanner.
5a: The Test Tubes are moved from the fume cupboards to the counter were they are stored in the
Not-Ready tray. They are stored there until all the Vials on the Sample tray are booked into Labware
LIMS.
6: The Vials are taken to the book-in area, where the Barcodes are scanned into Labware LIMS and
the information about the sample is recorded i.e. Clinic, Client details, tests requested, tray and
batch ID. Once a batch has been booked in, a TF4 Form (Figure 4.6) is created.

51
Figure 4.8: NDTC Spaghetti Diagram of Specimen Sample Journey
4.4.2 Measure: TF4 Form used to Record Specimen Sample Reference logs
1: A batch consists of approximately 150 samples or 3 trays, each tray can hold up to 50 samples.
The amount of time it takes for three trays to be filled, creating a batch, can take anywhere between
20 minutes and 2 hours and depends on the amount of samples delivered.
2: A TF4 form is generated by the Lab Aides after all samples in a batch are Booked-in and requires
all information to be entered manually, this takes approximately 10 minutes.
3: Each analyser runs approx. 100 samples at a time (this process, depending on how many
different tests are required per sample, takes approximately 40 minutes.
4: After each process of 100 hundred samples are run a QC check must be analysed to validate the
results of the previous Samples, each QC check takes approximately 20 minutes to run.
5: The remaining part of the batch (up to 50 samples) must wait for the QC results to be approved
and these Samples are then processed taking approximately 40 minutes to complete.
6: Once again a QC check is run to validate the results (approximately 20 Minutes).
7: The TF4 form is compared to the Clinic reports and checked for transcription errors by the
Biochemists and if there are no errors the results are validated, this takes approximately 10 minutes
to complete.
8: Clinic reports are generated on the Labware LIMS application and then printed (approximately 20
minutes).
9: The TF4 form is attached to the printed results report and these files are stored in a storage folder
and eventually moved to offsite storage after six months (Figure 4.9).

52
TF4 form (Sample Reference Log) Lifecycle (Before Lean Six Sigma Intervention 160 Minutes)
Fig
ure 4.9: TF4 Form – Sample Reference Log Lifecycle before LSS

53
4.4.3 Analyse: TF4 Form used to Record Specimen Sample Reference logs
Issues Identified: TF4 Form used to Record Specimen Sample Reference logs
1: A tray or 2 trays maybe fully tested, that is, they have been analysed and a QC check has been
run on the analyser, but the results cannot be processed as completed because the whole batch has
not been run (a batch usually contains 3 trays (150 samples)), this creates a bottleneck and the
Biochemist must wait an average of 60 minutes extra before they can start validating results.
2: The information recorded in the TF4 forms is entered manually by the Lab Aides after the book-in
process is complete. Because the information is entered manually there is always a risk of
transcription errors being made by the Lab Aides and not being identified by the Biochemists during
validation. This can lead to result reports being sent to customers with errors and omission of
results.
3: All of the information that the TF4 forms contain exists electronically in Labware LIMS in several
different locations.
4: A bottleneck will always be created by a batch which contains over a hundred samples as the
analysers run 100 samples between each QC run.
5: If a clinic has less than 50 samples to be tested, the process will take over 160 minutes before a
Clinic report can be generated because reports cannot be generated until the entire batch is
completed.

54
4.4.4 Implement: TF4 Form used to Record Specimen Sample Reference logs
The new LSS process flow required making changes to the process flow and removing waste. In this
instance waste within the process flow could be defined as unnecessary time spent waiting for a
batch run to complete before the validation part of the process could be completed (Figure 4.10).
Waste was also defined within the process by the need to check for transcription errors, as the TF4
forms could be generated by Labware LIMS and require no manual data entry by the Lab Aides.
Figure 4.10: Specimen Sample Workflow Diagram after LSS
Process Change 1: Lab Aides now process Samples in trays (50 Samples per tray) and no longer
use a batch (3 trays) system.
Process Change 2: A module was developed within Labware LIMS that would take the information
entered by the Lab Aide during the Book-in phase and the validation information entered by the
Biochemist and generate a completed TF4 form (Figure 4.11) eliminating transcription errors that
may have occurred when the TF4 forms were completed manually.
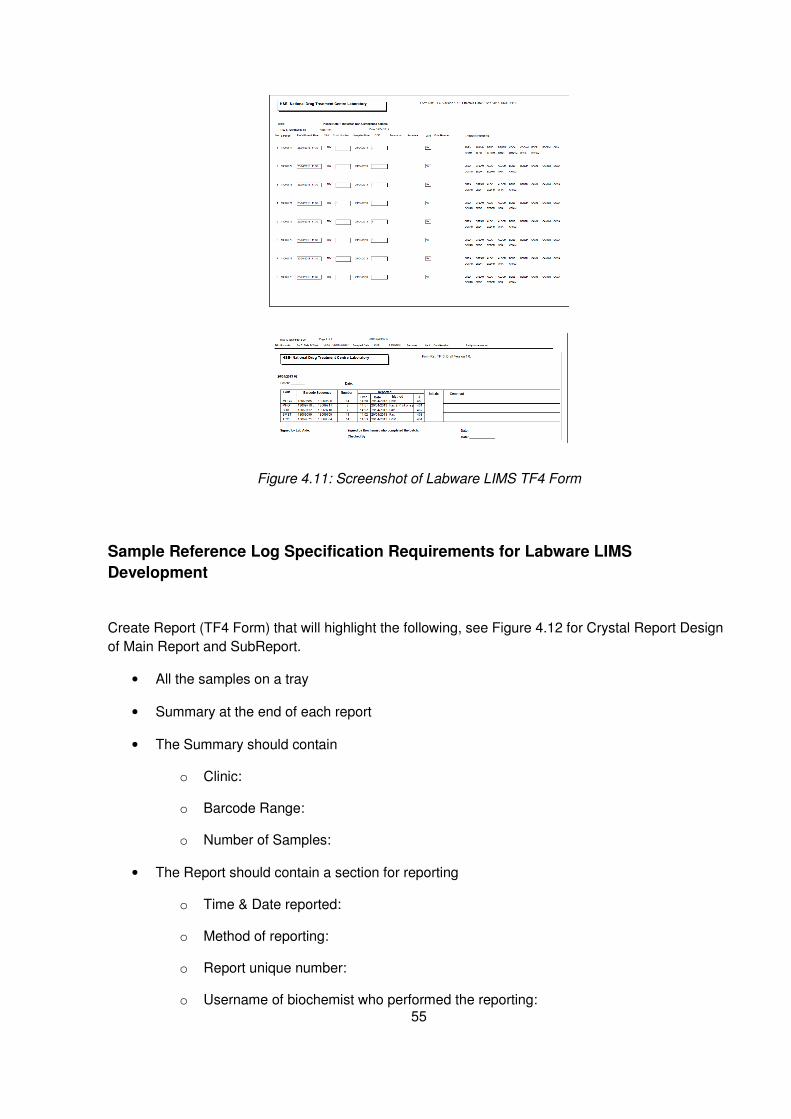
55
Figure 4.11: Screenshot of Labware LIMS TF4 Form
Sample Reference Log Specification Requirements for Labware LIMS
Development
Create Report (TF4 Form) that will highlight the following, see Figure 4.12 for Crystal Report Design
of Main Report and SubReport.
• All the samples on a tray
• Summary at the end of each report
• The Summary should contain
o Clinic:
o Barcode Range:
o Number of Samples:
• The Report should contain a section for reporting
o Time & Date reported:
o Method of reporting:
o Report unique number:
o Username of biochemist who performed the reporting:

56
Figure 4.12: Crystal Report Design of Main Report and SubReport for TF4 Form
Process Change 3: All TF4 forms are now signed electronically by the biochemist and their
credentials are verified by Labware LIMS.
Lean Six Sigma Stage I - TF4 Form – Sample Reference Log Lifecycle (80 Minutes) After Lean
Six Sigma Interventions

57
Figure 4.13: TF4 Form – Sample Reference Log Lifecycle after LSS
4.4.5 Control: TF4 Form used to Record Specimen Sample Reference logs
The Clinic reports are accessible to the NDTC customers depending on what the customer
requirements are and what services they subscribe too. It is envisioned that in the near future the
generation of hardcopy reports will no longer be needed and that all customers (including the HSE
DAIS users) will access the results online via the NDTC’s Laboratory Electronic Reporting (LER)
application (Figure 4.14). The TF4 forms currently generated by Labware LIMS will no longer need
to be printed off as these will be stored electronically on the file and print Server (CHEOPS).
Figure 4.14: Screenshot of the Laboratory Electronic Report (LER) Application

58
4.5 Phase I: Process 2: The Sample Disposal Log
The LSS intervention outlined for Process 2: The Sample Disposal Log was never actuated. As
discussed in the literature review earlier, when using a BPMS like LSS as opposed to Lean or Six
Sigma or another BPMS, it can help identify other improvement opportunities (Brett, Queen, 2005)
and in this instance Process 1: (TF4 Form used to Record Specimen Sample Reference logs)
incorporated the solution to the issues defined in the initial interviews with the customer (the Senior
Laboratory Team) for this process.
A request was made by the Senior Laboratory Team to design an application or develop a module in
Labware LIMS that could be used to effectively manage the process of recording and tracking
analysed specimen samples which were queued for disposal.
4.5.1 Define: The Sample Disposal Log
A urine specimen sample is only regarded as being valid for testing purposes up to two weeks after
the specimen sample has been analysed. The current process is to update a MS Word document
"The Sample Disposal Log" and store the documents on the Laboratory file server (CHEOPS).
4.5.2 Measure: The Sample Disposal Log
Lab Aides manually track and record the batch of samples that are moved to a storage fridge
awaiting disposal. Because the information was entered manually there is always risk of transcription
errors being made by the Lab Aides.
4.5.3 Analysis: The Sample Disposal Log
Develop a module in Labware LIMS that would facilitate the recording of the movement of specimen
samples through the Laboratory. A hand held device (barcode scanner) could be used to record or
update the sample trays; these trays are stored in the Laboratory cold room.
4.5.4 Implementation: The Sample Disposal Log
The changes made to the new Labware LIMS module implemented as part of the LSS
improvements for Process 1, allowed the Lab Aides to use Labware LIMS to track each tray through
the Laboratory and this process is now part of the Book-in lifecycle of Process 1 and required no
further development.
4.5.5 Control: The Sample Disposal Log
This process of manually recording the disposal of specimen samples is now part of process 1 and
the process of recording the disposal of specimen samples is now fully incorporated into Labware
LIMS.

59
4.6 Phase I: Process 3: North West Analytical (NWA) Statistical
Analysis
The North West Analytical (NWA) statistical Analysis conducted in the NDTC Laboratory is used for
control studies of statistical records to set limits of pass or fails and QCs. The QC systems used in
the NDTC Laboratory and in other clinical laboratories are based on the Westgard rules (see 5.2.1
Laboratory Quality Control Management Methodologies), these rules enable the Biochemist to
ascertain if the tests they are performing are "in control" and reportable or are "out of control"(Carroll,
Pinnick, Carroll, 2003).
North West Analytical provide Statistical Process Control (SPC) software that integrates with major
manufacturing systems including Labware LIMS and over 3,000 manufacturers world-wide use NWA
analyse plant data for certification, regulatory compliance and cost reduction (North West Analytics,
2013).
4.6.1 Define: North West Analytical (NWA) Statistical Analysis Process
A NWA statistical Analysis is conducted on an analyser when one of the following states occurs.
1: A new LOT of calibrator is used on one of the Analysers.
A calibrator is a standard level of a drug and is used to verify the +/- cut off detection levels for that
drug type. Calibrators are stored in the Laboratory refrigerators in bottles, the bottles are taken from
the refrigerators each morning, and a calibrator for each drug type is decanted into an aliquot which
in then placed on the Analyser (Figure 4.15). QCs are then run on the analyser to establish the
calibration level of this drug type on the analyser (Figure 4.16).
Figure 4.15: Calibrator for each drug type is decanted into an Aliquot which in then placed in the
Analyser

60
Figure 4.16: QC’s are then run on the Analyser to establish the system is within control
2: If a QC is failing.
QCs are run on the analysers first thing in the morning following the calibration of the analysers and
a QC is run after approximately 100 specimen samples are tested on the analysers.
3: If a new LOT of reagent is used on one of the analysers.
A reagent is an Assay (a type of test). Reagents are stored in refrigerated units inside of the
analysers; these are changed only when needed.
4: A new LOT of QC is used on one or both of the analysers.
QCs are similar to calibrators, but the concentration of drugs is +/- 25% of the cut off for each assay
(i.e. 75% or 125% of the calibrator). They are included with the specimen samples during a
specimen sample run. QCs produce the mean standard deviations (SD) above or below the mean. A
failure is recorded when a result is three standard deviations (3’S) above or below the mean. A
warning is recorded when a result is two standard deviations (2’S) above or below the mean.

61
4.6.2 Measure: North West Analytical (NWA) Statistical Analysis Process
Stage 1:
Each time a new NWA statistical Analysis is run for one or both of the analysers a new TF12 form
must be completed. The TF12 form contains details of the results of a statistical Analysis which is
calculated on a CF3 Microsoft (MS) Excel spreadsheet which is generated in Labware LIMS. To
perform a statistical Analysis on the CF3 Microsoft (MS) Excel spreadsheet, a selection of 30 QC
results are selected from Labware LIMS, these QCs must contain no failures (a failure is any QC
with a +/- 3’SD result). If one of the QCs is a failure, this QCs must be manually removed, Labware
LIMS is once again requested to return 30 QCs and this process continues until 30 QCs without any
failures are returned.
Stage 2:
The following statistical analyses are carried out on the 30 QCs using the CF3 Microsoft (MS) Excel
spreadsheet.
• Calculation of the Mean
• Calculation of the Standard Deviation
Stage 3:
The statistical Analysis information generated in a MS Excel Spreadsheet, based on the 30 QC
results is then entered into the CF12 form manually and can contain transcription errors.
Stage 4:
The statistical Analysis results are entered into a section of Labware LIMS called Product
Specification and details three standard deviations (3’S) below the mean and the three standard
deviations (3’S) above the mean are recorded (Table 4.3). Likewise the reason for the change e.g. a
new control LOT has been added, is recorded.
Product Specification Reason for new Control LOT
Minimum (Mean -) -3 Standard Deviations
Maximum (Mean +) +3 Standard Deviations
Low Control (Mean -) -2 Standard Deviations
High Control (Mean +) +2 Standard Deviations
Average Mean
Table 4.3: Information for Statistical Analysis entered into Labware LIMS Product Specs Module

62
Stage 5:
The CF3 Microsoft (MS) Excel spreadsheet is then printed and attached to the TF12 form (see
Appendix III).
Stage 6:
The statistical Analysis values (mean and SD) are then entered into the analysers.
4.6.3 Analyse: North West Analytical (NWA) Statistical Analysis Process
The statistical Analysis is manually carried out on an Microsoft (MS) Excel spreadsheet CF3 form
(Figure 4.17) this could lead to calculation errors.
Figure 4.17: CF3 MS Excel Spreadsheet
There was also the possibility that multiple statistical Analysis processes would have to be
performed on the analysers over a relatively short period of time, for example if LOTs of calibrators
had to be changed on day 1, an NWA statistical Analysis would have to be conducted. If on day 2 a
new LOT of QCs had to be added then a second set of NWA statistical Analysis would have to run
and so forth.

63
Issues Identified: North West Analytical (NWA) Statistical Analysis Process
1: The system is a manual paper based system prone to human error and generating unnecessary
forms and Microsoft (MS) Excel spreadsheets which have to be stored offsite.
2: Statistical Analysis is not conducted on a regular basis and the analysers must reach a stage
were the QCs are failing or new LOTs are being used before a new statistical Analysis is conducted,
i.e. mean and SD do not reflect the current conditions.
3: During a recent audit by the Irish National Accreditation Board (INAB) the Laboratory was advised
to change its current statistical Analysis process, as statistical Analysis may not have been
performed on an analyser for a long period of time. The auditor pointed out that if such a case
occurred, then the statistical Analysis for that analyser could not be considered valid.
4: The current manual calculation for the statistical Analysis process is prone to calculation and
transcription errors.
5: The process for obtaining 30 QC results without failures can take a Biochemist a consider amount
of time to generate.
4.6.4 Implement: North West Analytical (NWA) Statistical Analysis Process
To address some of the issues identified with this process, several different solutions needed to be
put in place to eliminate waste and streamline the process.
Process Change 1: Was to change the parameters for carrying out an NWA statistical Analysis,
rather than waiting for an event to occur that would initiate a NWA statistical Analysis, it was agreed
that an NWA statistical Analysis would be carried out each month and a TF12 form updated once a
month regardless of LOT changes.
This action was based on recommendations from the INAB auditors who pointed out that an
analyser could run for six months without having a NWA statistical Analysis conducted, depending
on the batch of calibrators, QCs or reagents being used. They deemed it better to update monthly on
scheduled basis and incorporate changes made during the month if nessessary.
Process Change 2: Labware LIMS was programmed to have the option to exclude failed QCs, that is
where a QC is 3 or more standard deviations (3’S) outside the norm, this change makes it possible

64
for the Biochemist to get 30 QCs returned in the first instance as opposed to the old system of
querying Labware LIMS repeatedly until 30 QCs were returned without any fails.
Process Change 3: Once Labware LIMS returns the 30 QCs, the Biochemist has the option to
update the QC specs within Labware LIMS automatically. The Biochemist can select one or both
analysers to run a NWA statistical Analysis on and the statistics are calculated by Labware LIMS,
removing the possibility of human error in calculating the results (see Appendix IV for Source Code
used). The Biochemist enters the reason for conducting the NWA statistical Analysis into Labware
LIMS and completes the TF12 form.
Process Change 4: The new NWA Labware LIMS Module records the date and time when the NWA
was carried out and has a search facility function.
Process Change 5: Labware LIMS will save the automatically generated NWA Analysis TF12 form to
the QC_PROJECT folder on the (CHEOPS) Server.
To achieve the process changes required software specification requirements were sent to Labware
and a senior Labware system Analysts was assigned to develop the Labware LIMS application to
the NDTC requirements.
4.6.4.1 NWA Specification Requirements for Labware LIMS Development
• Design Method for sending QCs across to NWA, 30 QCs required with option to exclude
failures. QC results are similar to samples and results should be compiled into folders
according to QC type.
• Calculate the Mean and Standard Deviation for each QC.
• Labware LIMS to Create Charts – Warning limits set at 2 Standard Deviations (2SD) limits
and Control limits set at 3 Standard Deviations (3SD) which is failures.
• An update note needs to be added when updating the statistical Analysis (Free text) this is to
use for recording the reason for updating e.g. “New Reagent or New Quality Control (QC)
has been applied”. Create a Crystal Report to record QC updates.
• Charts in NWA need to be checked and relevant rules added – i.e. Westgard Rules can be
applied if required.
• The Date Range should be incorporated into the NWA so that a Biochemist can search for
samples which only run on a certain date e.g. 01/02/2013
• Only compile statistical Analysis updates to QCs that are within the control limits, no 3SD
(failures), see Figure 4.18.

65
Figure 4.18: Exclude failed Quality Controls (QC) from Statistical Analysis
4.6.4.2 NWA Specification Requirements for QC_PROJECT folder on the Server
• A filter needs to be created for showing only open projects (QC LOTs) in Labware LIMS
• Query Tag feature needed see Figure 4.19 for folder template.
Figure 4.19: Template for QC_PROJECT folder

66
4.6.5 Control: New Lean Six Sigma North West Analytical (NWA) Statistical
Analysis Process
The NWA statistical Analysis is now fully deployed to the production environment and like all LSS
projects is subject to review and enhancements where possible. In the near future the next process
change will involve the TF12 form which will be no longer be printed, instead it will be generated by
Labware LIMS and many of the fields that are currently filled in by hand will be populated with data
from Labware LIMS, the TF12 forms will be automatically stored as a PDF documents on the
(CHEOPS) Server.

67
4.7 Phase I: Process 4: Electronic Reporting Section
All specimen sample result reports are currently printed and after six months are stored securely
offsite. The Laboratory is required to keep a printed record so that the principles of measurements in
use on the day the specimen sample was analysed are captured.
4.7.1 Define: Electronic Reporting Section
The different parameters for each tray or batch are recorded with details of the barcode used, the
chain of custody, unique ID, the clinic, the Biochemist who ran the report, the client details, and the
type of assay carried out (urine or saliva testing).
The Cut-Off levels for positive and negative results are set in accordance with the guidelines of the
Substance Abuse and Mental Health Services Administration (SAMHSA). The reports also record
the UOM (uncertainty of measurement); each Laboratory is responsible for these levels).
4.7.2 Measure: Electronic Reporting Section
4.7.2.1 Level 3 Process flows for NDTC Laboratory Reporting
To understand the process flow for reporting it was necessary to examine the different types of
reports generated and the processes in the production of each report.
4.7.2.2 All Reports Are First Printed
1: Before reports are printed, the Biochemist must cross-check the number of sample results for
each clinic on a TF4 form against the numbers for that clinic on the tray work list provided with the
batch.
2: If there are samples for a clinic being reported which were logged into the Labware LIMS system
but did not run, these samples have an un-received status, if the un-received sample(s) were
booked-in the day before Analysis of the other samples this date is included when printing the clinics
results report (Figure 4.20) .
3: The report appears in a preview format before printing. Select print, to print the report.

68
Figure 4.20: Print Preview of Report in Labware LIMS
4: The results print in a report format which is generated with a unique identification number.
5: The biochemist checks each report sheet for the clinic. The Biochemist then ensures the client
samples are booked into the correct clinic, all tests/non-conformances are included in the clinic
report.
6: Non-conformance forms are only issued for samples which could not be booked into the Labware
LIMS system and/or samples from DAIS clinics. The biochemist also checks the final statistics for
each clinic on the last page to ensure the number of tests analysed is correct.
4.7.2.3 Process for Fax Reporting
1: The reporting method (F) for Fax is recorded on the TF4 form. Before faxing, the report is checked
against the Results Reporting List (AR4) to ensure that the report is being sent to the correct agreed
fax number and that the report has been printed correctly, i.e. multiple client results per page or
separate client per page report.
2: Fax the report and await confirmation / transmission verification report. Once a fax confirmation
receipt has been received, the Biochemist checks the details are correct by marking the time which
the fax was received by the recipient, the clinic name and the fax report result are marked as “OK”.
3: When the confirmation(s) have being received only then will the biochemist attach the fax
confirmation sheet to the report. The time, date, and Biochemist initials are entered on to the TF4
form with the date and stored on server.
69
4: If the secure fax number on AR4 is not working or is busy, the report and the fax sheet are stapled
together and placed with the batch. The clinic reports are reprinted in duplicate or a copy made of
the original report. The original report is posted to the clinic and the copy of report is stored in the
batch file.
4.7.2.4 Process for Posting Reports
1: The reporting method (P) for Post is recorded on the TF4. The report is printed twice, one copy of
the report is posted to the relevant clinic, and the second copy of the report is retained with the batch
documentation. The date and time are recorded as the time the report was printed. The time, date
and Biochemist initials are entered on the TF4 form and stored on the (CHEOPS) Server.
2: If results on a specific client have been requested by a clinic to which the results have already
been reported, a copy of the existing report is made and posted. The copied report is stamped with
the copy and date stamp.
4.7.2.5 Process for the Electronic Patient System (EPS) Reporting
1: The reporting method (E) for EPS is recorded on the TF4 and Internal NDTC clinics are
automatically reported into the EPS system once the results have been authorised in Labware LIMS.
2: The reports for these clinics should be printed out and filed with the relevant batch. There is no
requirement to send hard copy reports to the internal clinics unless hard copies have been
requested or as stated in AR4 form. The time, date and Biochemist initials are entered on the TF4
form and stored on the (CHEOPS) Server.
4.7.2.6 Process for Drugs and Aids Information System (DAIS) reporting through Labware
LIMS
1: The reporting method (D) for DAIS is recorded on the TF4. DAIS results are sent automatically
through Labware on the Labware Scheduler, currently located on the (ARTEMIS) Server.
2: Once the samples have been authorised the Scheduler will pick up the result automatically and
send them to the DAIS system electronically.
3: In the Labware LIMS TRAY folder each sample should each have a light green star beside it once
the reports have been printed and the samples should each have a light green star beside them to
indicate that the result was successfully sent electronically to DAIS (Figure 4.21).

70
Figure 4.21: Tray folder in Labware LIMS
4: The time, date and Biochemist initials are entered on to the TF4 form which is stored on the
(CHEOPS) Server.
4.7.2.7 Process for using the Laboratory Electronic Reporting (LER) Application
1: The reporting method (L) for LER is recorded on the TF4 form. The clinic results report is printed
from Labware LIMS for the LER and retained with the batch.
2: The time, date and Biochemist initials are entered on to the TF4 form which is stored on the
(CHEOPS) Server.
4.7.2.8 Process for Drug Court Results Reporting
1: Results for Drug Court clients are reported to their attending clinics as normal. The Drug Court
Nurse sends a fax request on a Thursday evening for the clients attending court the following week.
A one month’s cumulative report for each client is faxed to the Drug Court when requested.
4.7.2.9 Process for Chain of Custody & Probation reporting
1: All positive samples require confirmatory Analysis.
All samples which have been assigned Chain of Custody or Probation status are reported by Post.

71
4.7.2.10 Process for Filing Reports once they have been sent to Customer
1: Once the TF4 form has been completed, it is printed and the biochemist signs and dates the form
on the day it was completed.
2: All the documentation (see Appendix III) is filed into a brown batch folder with date and batch id
(see Appendices XI)
• TF4 form,
• TF11 form (externals)
• Tray ID sheets
• NCF’s
• Clinic reports
• Copy of Chain of Custody form where relevant
• AF30 forms where relevant
3: The brown batch folder is filed into the next available archive box in date order.
4: The electronic documentation is stored by date in folders on the on the (CHEOPS) Server for
example \\Daily_ Batch_Documentation\ 2011\September\28\TF4_28_11_2011.xls.
5: The senior Biochemist responsible for routine testing checks the TF20 form, when satisfied all the
information is correct, it is stored on the (CHEOPS) Server.
4.7.3 Analysis: Electronic Reporting Section
A copy of all result reports are printed filed and stored for six months in the Laboratory office. After
six months these reports are then stored in storage boxes and shipped off site to a storage company
where they are stored indefinitely in case they need to be retrieved.
If result reports need to be posted or faxed to a clinic then a second copy of the report are printed for
this purpose.
The challenges to implementing an Electronic Reporting solution required significant changes to the
Laboratory technical infrastructure, to accommodate the storage of such large amounts of data.

72
The Biochemist is required to print a TF4 form to check and validate that all the result reports are
correct and contain the correct amount of specimen samples for the correct clinics. The Biochemist
manually fills in the form and this form is then checked by a senior Biochemist to insure that the
information is correct; this process can be prone to transcription errors depending on the amount of
specimen sample requests and the number of Lab Aides, Biochemists and their workload.
Issues Identified: Electronic Reporting Section
1: Large amounts of paper and printer supplies used.
2: Storage requirements for the printed reports will exponentially increase as the reports that are
printed (all reports) must be stored offsite.
3: The time and cost involved with printing, filing and searching reports make this process a good
candidate for a LSS intervention.
4: Requests for hard copies of reports can take days to reach the Client.
4.7.4 Implementation: Electronic Reporting Section
Process Change 1: The Laboratory Information Computer Technology (ICT) infrastructure was
moved from Physical Servers to Virtual Servers. This allowed ICT department to allocate resources
such as processing power, Random Access Memory (RAM) and storage space to any of the
Laboratory Servers as needed. The virtualisation of the Servers allows for the future expansion of
the capacity and resources for the Laboratory infrastructure with little or no downtime to the
production environment.
Process Change 2: The implementation of redundant Laboratory Virtual Servers which would allow
the Laboratory to stay operational in the event of a failure of the production servers.
Process Change 3: All result reports will be generated automatically in Labware LIMS. This negates
the need to print any result reports other than those that need to be sent by fax or post.
Process Change 4: The TF4 reporting form is automatically completed with the clinic, barcode
range, no. of samples, unique report ID, method of reporting, time & date reported and user ID of the
reporting Biochemist. The information is now generated by Labware LIMS and is no longer manually
completed by hand, reducing transcription errors and time.
This project was deployed to production on the 31/05/2013 and was initially tested and monitored
and ran in parallel with the existing electronic reporting system, until the 21/06/2013 when it was fully
deployed to production.

73
4.7.4.1 Specification Requirements for Electronic Reporting
1: Labware LIMS to generate a Protected Document Form (PDF) for all result reports and this file to
be stored on a secure location on the Laboratory (CHEOPS) Server.
2: All PDF result reports generated in Labware LIMS should have a unique filename which should
contain the client reference number, tray, clinic and the date the report was initially generated.
3: All PDF result reports should be automatically saved once the result report has been generated in
Labware LIMS.
4: All PDF result reports should be retrievable through a Search mechanism within Labware LIMS
and searches can be conducted by date, tray, clinic and/or barcode.
5: Labware LIMS will now automatically generate a TF4 reporting form with the TRAY check list
once the reports have been generated.
6: The generated TF4 reporting form will automatically fill with the clinic, barcode range, no. of
samples, unique report ID, method of reporting, time & date reported and user ID of the reporting
Biochemist.
Below is a list of the Sections in Labware LIMS where changes were made to complete the
specification requirements (see Appendix V, for full list of code).

74
4.7.5 Control: Electronic Reporting Section
The Laboratory is currently trying to encourage all its customers to switch to Internet based LER
system, they are setting up a process where individual Court Reports can be made available on the
LER for use by the Courts. The current practise of printing reports and sending them by registered
post is expensive. This is a slow process of change and as some GP practices do not have Internet
access, this may not be realised fully in the near future.

75
4.8 Phase I: Process 5: Stock Tracking and Reporting Process
Requirements Statement
When New Stock arrives into the NDTC Laboratory each box is examined and checked against the
Delivery Docket. Stock may consist of individual assignments of reagents, calibrators and QCs or a
combination of them. This process is completed manually and the data is not captured in Labware
LIMS. The stock taking process is carried out monthly and can take up a substantial amount of time
and resources in the Laboratory. It was requested that a more automated process be put in place to
monitor the stock, alert when stock is low and be fully integrated into Labware LIMS (Figure 2.2).
4.8.1 Define: Stock Tracking and Reporting Process
New Stock is checked against the delivery docket to verify that the quantities correspond. The stock
details are recorded in a Microsoft (MS) Excel spreadsheet called Kit Stock.xls. The details recorded
consist of LOT Numbers and the manufacturers Barcode. LOT Numbers are generated by the
manufacturers and used as reference to track which batch a particular LOT came from. Many boxes
may arrive with the same Manufactures Barcode and LOT numbers and so a unique NDTC Barcode
and Number are generated for each box and recorded in the CF3 (Table 4.4) Microsoft (MS) Excel
Spreadsheet.
The expiry date is recorded and the State type of the Stock. Stock may arrive in two different states
either ready or not-ready. A ready LOT of stock can be used in the analyser while a not-ready LOT
of stock must be prepared for usage in the analyser, once the stock is prepared it is issued a new
Barcode and expiry date as prepared solutions then expire sooner than the non-ready LOT of stock.
The details of the prepared stock are recorded in the CF3 form.

76
Figure 4.22: Workflow - New Stock Tracking and Reporting
Test Name Barcode Kit Lot# Lot# Expiry Date in
Use
Date Lot
in Use
Prepared
Date
Prepared
By
AU2700
Barcode
Type of
test
recorded
e.g.
alcohol,
cocaine
etc.
Type of
Reagent,
QC or
calibrator
used
Lot#
Barcode,
e.g.
H120049
Can be
the the
same as
Lot# or
new
NDTC
Barcode
for
solutions
Lot#
Number
from
supplier
Supplier
Expiry
date of
Lot#
Date the
Calibrator
or
Reagent
was in
use
Will be
different
for not-
Ready
Solutions
Date
Solution
prepared
for not-
Ready
Lot#
If not
ready
who
prepared
Solution
Barcode
for
Analyser
e.g.
C0000003
Table 4.4: MS Excel Spreadsheet CF3

77
4.8.2 Measure: Stock Tracking and Reporting Process
Once a month a full inventory of stock is taken before new stock can be ordered and a list of all the
stock in storage is created in a Microsoft (MS) Excel spreadsheet. This inventory process can take
up to two days depending on who is conducting the audit and how many people are assisting. Once
the inventory process is completed the information is then entered into a Microsoft (MS) Excel
spreadsheet known as a TF3 form and this is then printed off.
The Biochemist responsible for stock control that month checks the TF3 form and judges what stock
will need to be ordered to ensure that there is enough stock available for the next month and that the
stock has not expired and will not expire before the next inventory of stock. Ordering of stock is
based on experience and not on the levels used in previous months.
There is no audit trail on the usage of stock during the month.
When new stock arrives in Laboratory it is checked against delivery docket and once the Biochemist
has been confirmed that the order is correct it is entered into the Kit-Stock Microsoft (MS) Excel
spreadsheet. If there is a problem with the order the details are passed on to a senior Biochemist
who contacts the supplier to get the error corrected. A barcode is then generated for the new LOT of
stock and the information is recorded in the TF3 form. The stock is then stored in the cold room and
is used when needed.
4.8.3 Analysis: Stock Tracking and Reporting Process
Once a month a full inventory of stock is taken and a list of all the stock in storage is created in a
Microsoft (MS) Excel spreadsheet. There are a several problems with this method of stock control.
Issues Identified: Stock Tracking and Reporting Process
1: It requires the Biochemist to be aware of the current stock in storage during the month as all the
stock for certain reagent or calibrator maybe used up or may have exceeded its expiry date before
the monthly inventory of stock is completed.
2: The manual system relies on the experience of the Biochemists knowing what tests have been
performed that month and what stock may be required or should be ordered before the monthly
inventory of stock take.
3: If too much stock is ordered and not used the stock can go out of date, this can be very expensive
and also leads to the risk of out of date stock being used in the analysers by junior staff, these errors
might not be realised until the QC stage of the specimen sample process flow and may require the
reprocessing of one or many batches of specimen samples.

78
4: For accreditation purposes INAB have highlighted that it now requires that stock control systems
must be fully auditable (the current process is not) this would lead to a non-conformance and
needed to be corrected before the next INAB audit in May 2013.
The goal of this LSS intervention was to look at improving the quality assurance systems within the
Laboratory and not necessarily the performance time of the stock tracking and reporting process.
4.8.4 Implementation: Stock Tracking and Reporting Process
To best facilitate all the requirements of the customer (the Senior Laboratory Team) it was deemed
necessary to develop the LSS intervention within Labware LIMS. The development of the Inventory
Management module within Labware LIMS was used to complete this task.
The specification requirements for this process change were given to Labware and a senior system
Analysis was assigned to the NDTC to provide a solution that would meet these requirements.
4.8.4.1 Specification Requirements for Inventory Manager
1: Alerting function should be in place for when stock has expired or is nearing expiration date.
2: The Inventory Manager should keep a detailed audit trail and track what stock has been added,
what stock has been taken away or used, when it was used, by whom it was used and all entries
must be time stamped.
3: The Inventory Manager must be able to generate a current stock report when required.
4: Replace the Microsoft (MS) Excel spreadsheet and record the information relating to new stock
directly into Labware LIMS.
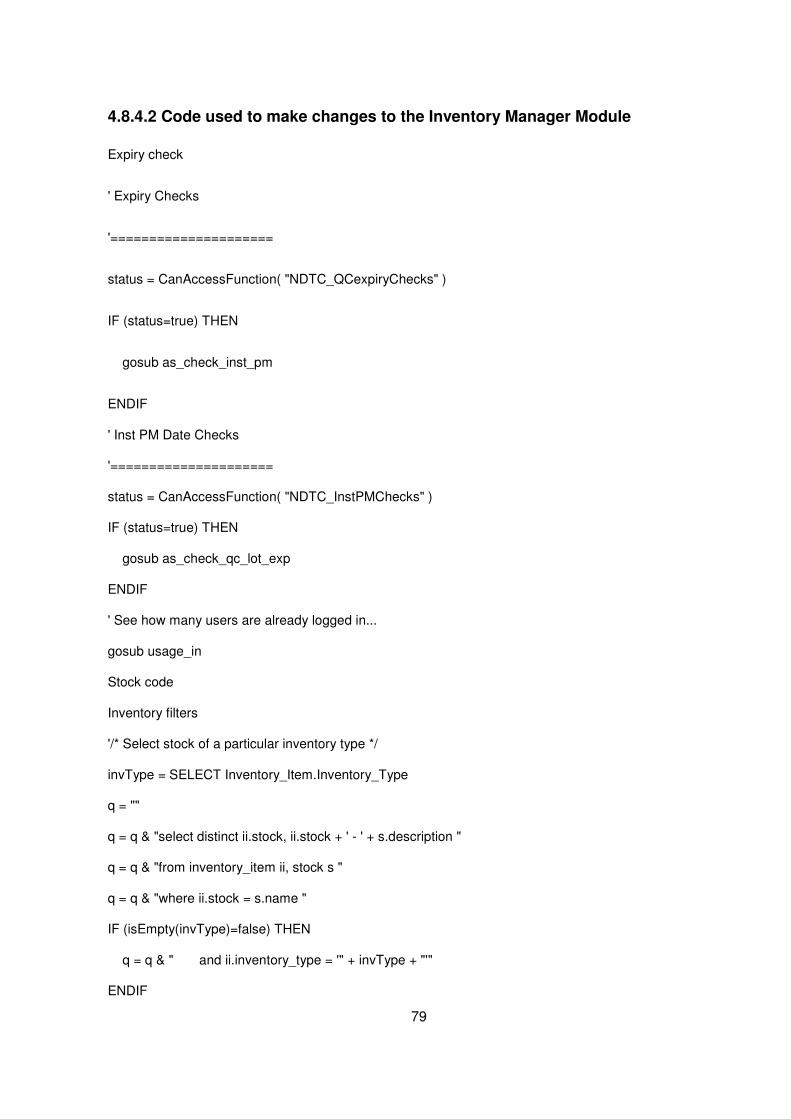
79
4.8.4.2 Code used to make changes to the Inventory Manager Module
Expiry check
' Expiry Checks
'=====================
status = CanAccessFunction( "NDTC_QCexpiryChecks" )
IF (status=true) THEN
gosub as_check_inst_pm
ENDIF
' Inst PM Date Checks
'=====================
status = CanAccessFunction( "NDTC_InstPMChecks" )
IF (status=true) THEN
gosub as_check_qc_lot_exp
ENDIF
' See how many users are already logged in...
gosub usage_in
Stock code
Inventory filters
'/* Select stock of a particular inventory type */
invType = SELECT Inventory_Item.Inventory_Type
q = ""
q = q & "select distinct ii.stock, ii.stock + ' - ' + s.description "
q = q & "from inventory_item ii, stock s "
q = q & "where ii.stock = s.name "
IF (isEmpty(invType)=false) THEN
q = q & " and ii.inventory_type = '" + invType + "'"
ENDIF

80
status = SQL(q, "stockArray")
Return stockArray
Process Change 1: The Inventory Manager Module was developed within Labware LIMS, this is now
used to record all inventory activity (Figure 4.23), and this new module replaced the Microsoft (MS)
Excel spreadsheet used to record the stock each month.
Figure 4.23: Inventory Manager - Stock within Labware LIMS
Process Change 2: A full audit history of reagents, calibrators and other inventory stock is now used
to record all activity of inventory stock (Figure 4.24). The Inventory Manager module can now be
checked for when new stock was added.
Figure 4.24: Inventory Manager - Audit history of one lot of reagent
Process Change 3: The new Inventory Manager can be searched for specific stock by a Biochemist
and the Biochemist now controls all of the records for the inventory, these records are updated in
real time, so there is no need for a monthly inventory stock taking exercise.

81
4: Process Change 4: The reporting functionality of the Inventory Manager allows for ad hoc reports
to be generated by a Biochemist detailing active stock, stock due to expire and summary reports
used for ordering of stock (Figure 4.25).
Figure 4.25: Inventory Manager Report – Inventory Stock Details

82
5: Process 5: The Inventory Manager Module in Labware LIMS has been programmed with an
alerting system. This alerting system opens an alert window if stock is nearing expiration date or if
stock is out of date. The new Inventory Manager alerting system should prevent out of date stock
being used in an analyser as all stock must be accounted for before it is taken out of storage. By
alerting the Biochemist to stock nearing expiration, allows the Biochemist to order and replace stock
before it ever reaches its expiry date (Figure 4.26).
Figure 4.26: Alerting System within the Inventory Manager Module
The inventory stock taking is no longer required because the usage of all stock is now tracked
electronically, the inventory stock taking each month could take up to two days and could require
several members of the Laboratory staff to assist with the audit. The process of stock tracking is now
recorded in real time as the stock is taken form storage and there is no longer a requirement to have
a monthly inventory stock take.
83
4.8.5 Control: Stock Tracking and Reporting Process
This project was deployed to the Test environment on the 15/04/2013 for initial testing and
monitoring. When testing was completed it was then deployed to the Production environment on the
10/05/2013. The temporary Microsoft (MS) Excel spreadsheet used during the monthly stock taking
was replaced by the Labware LIMS Inventory Manager Module and all data was entered directly into
Labware LIMS. The CF3 form is now stored electronically and is no longer required to be printed off
and stored offsite.
The new Inventory Manager will be improved upon to give real time details of all stock usage before
September 2013. A statistical Analysis section will be added to the Inventory Manager module to
Analysis the usage of different types of stock and a Clinical Decision Support System (CDSS) will be
used to predict the requirements for stock inventory based on past usage, these changes are
currently being tested in the Phase II Process 6 (Controlled Drug Tracking) were they will also be
used.
It is envisioned that once such systems are in place the task of inventory management may be out
sourced to the supplies and finance department of the NDTC, freeing up Biochemists to do scientific
work and reducing their current administrative duties.
4.9 Conclusions
This concludes Phase I of the LSS process improvement project; all process development
improvements have been fully deployed to production and will continuously be improved upon as
part of the quality improvement mechanisms of the Control stage of LSS. Phase II of the LSS
process improvement project started in August 2013 and is expected to be completed in January
2014, the define stage for the processes in Phase II have been included in Appendix I.

84
Chapter Five: Results and Analysis
5.1. Introduction
The goal of this Results and Analysis Chapter is to evaluate and measure where possible, the
outputs before and after the LSS interventions. In this section of the Dissertation the aim is to
analyse the data formalised in Chapter 4, and see if these process changes achieve the objectives
of the customer and the project team as discussed in Chapter 1.
This Chapter will measure comparisons, in particular, between the reductions in time the processes
take to complete, costs of creating reports and the offsite storing of paper records as compared to
storing the information electronically. The reduction in transcription errors, these were measured
against the number of transcription errors previously recorded for non-conformance purposes. A
review of the process changes made for quality control and accreditation purposes was likewise
conducted.
The measurement of usability, accessibility, and audit-ability from the end-users perspective is an
important element of any LSS project. Labware LIMS now has replaced several manual processes, it
records who created/edited forms, reports and other system changes. User feedback on the impact
that these changes have made for accreditation purposes and for tracking transcription errors were
addressed by conducting non-structured interviews with the Senior Laboratory Team responsible for
quality control and the production environment.
To assess the level of user satisfaction and user acceptance, a questionnaire was designed. The
questionnaire asked all the Laboratory staff, to rate their level of satisfaction with the LSS strategy
used and their impression of the LSS process changes. The questionnaire also asked have the
initiatives deployed in Phase I of the "Improving the Specimen Sample Process Flow" aided the
Laboratory team in maintaining their targets, even with the staff shortages and an increase in the
number of specimen sample test requests and has morale improved because of the changes.
5.2 Factors that Influenced using Lean Six Sigma
5.2.1 Laboratory Quality Control Management Methodologies
The QC used to validate that an instrument is operating within design parameters should
likewise indicate that the results produced are reliable (QCNet, 2008).
The main requirements of a Laboratory QC system are that the system is documented,
understood by the people using it, that it is reliable and supports continuous improvement. The
Laboratory as an entity should consist as a total system and not a series of activities and

85
uncoordinated processes. A quality system should be seen as a total system that can be
subjected to review and audits both internal and external (Badrick, 2008).
A QC product used in a Laboratory for validation can be a liquid or a freeze-dried material and is
made up of one or more analytes/drugs of a known concentration and is usually tested the
same as specimen samples. QCs are run on a regular basis because a test system can fail or
begin to malfunction anytime since the last QC was run (QCNet, 2008).
Quality Control (QC) Statistical Analysis
The QC statistics most commonly used by a Laboratory are the Mean and the Standard
Deviation [s]. The Mean or average is the best estimate of the value of an analyte used for that
control. The Standard Deviation provides an estimate of the consistency of the test and the
Standard Deviation can also be used to monitor daily performance.

86
Westgard Rules
Dr James Westgard published an article on Laboratory QC in 1981, this was based on principles in
statistical control used in industry, and this article became the basis for QC statistical Analysis in
laboratories. It was based on six rules (Table 5.1) which can be used individually or in combination
to determine the quality of an analytical run and are known as the Westgard Rules (Westgard, et al.,
1981). Several Westgard rules are currently used in the NDTC Laboratory (Rule 12s, Rule 13s) see
Table 5.1 below and NWA is used to monitor these.
WESTGARD RULES
Rule 12s This is a warning rule that is violated when a single control observation is
outside the ±2s (Standard Deviations) limits.
Rule 13s This rule identifies unacceptable random error or possibly the beginning of
a large systematic error. Any QC result outside ±3s violates this rule.
Rule 22s
This rule identifies systematic error only. The criteria for violation of this
rule are:
• Two consecutive QC results
• Greater than ±2s
• On the same side of the mean
Rule R4s
This rule identifies random error only, and is applied only within the current
run. If there is at least a 4s difference between control values within a
single run, the rule is violated for random error.
Rule 31s
The criteria which must be met to violate this rule are:
• Three consecutive results
• Greater than 1s
• On the same side of the mean
Rule 41s
The criteria which must be met to violate this rule are:
• Four consecutive results
• Greater than 1s
• On the same side of the mean
Table 5.1: The Six Basic Westgard Rules (QCNet, 2008)

87
5.2.2 Stakeholder Involvement
The reason for applying a BPMS in the NDTC was driven by the Voice of the Customer (VTC), and
helping the customer (in this instance the customer was the Senior Laboratory Team) identify where
significant improvements can be made to the Laboratory specimen sample Value Stream. The
customer’s specified areas where improvements to process flow could be made and also identified
problem areas within the processes where possible changes could be of significant importance.
The moratorium on recruitment of new staff which was implemented under the Public Service
Agreement 2010-2014 (Croke Park Agreement) has meant no new or replacement staff are recruited
when staff leave, take career breaks or go on maternity leave, which has put increased pressure on
the Laboratory team who are required to do more work, with less staff.
In May 2013 for example there were 3 members of staff on maternity leave, 1 member of staff on 3
weeks annual leave, and 1 member of the Laboratory Team on a 1 year career break from a total of
12 permanent staff.
5.2.3 Resistance to change
Resistance to change was a factor that was not anticipated at the beginning of this LSS project, as
the initial interviews were with the Senior Laboratory Team and they were open to change, this did
cause minor delays when implementing some changes.
Atkinson, 2013 claims that research in organisational development show that 90 per cent of cultural
change programmes fail to reach or maintain their goals. Likewise new organisational changes
resulting from mergers or acquisition have poor success rates with between 56 – 70 per cent failing
to achieve the objectives they initially planned for, stating that the main reason for failure was
resistance to cultural change (Atkinson, 2013).
Although there was very little resistance to change encountered, the adoption of some positive
strategies had to be enacted to ensure that the resistance to change did not become an issue.
• Communication with the entire Laboratory team was vital. All the process changes were
explained that were to be deployed and the expectations of the positive impact that would be
achieved once these changes were fully implemented. Explaining what the impact of some of
these changes would have on an individual basis and listening to their ideas gave them a
sense of being part of the project.

88
• Another strategy utilised where possible resistance to change could have been an issue was
to have the Laboratory team members who were committed to the success of the project,
carry out the initial testing and let them find potential flaws. Once these risks had all been
eliminated, the LSS intervention was put into production and ran in parallel with the old
process.
• Once the process was bedded down in the production environment and was working within
design parameters, the Standard Operating Procedure (SOP) documentation was created on
how the system is intended to operate. The LSS intervention was presented to all the
members of the Laboratory Team. If staff members had any reservations these were
addressed by demonstrating that the system was already working in production.
It was important to understand that the initial reaction to change for many people is to personalise it
“How will this affect me?”, “Will I be able to use the new system?”, and this should be taken into
account when deploying new changes (Atkinson, 2013).
5.2.4 Legal Requirements
The NDTC Laboratory is required to obtain a controlled drug license and a license for precursor
chemicals. To obtain a controlled Drugs license the NDTC are required to demonstrate compliance
to the requirements for security, storage, and documentation, as set out in the regulations of the
Misuse of Drugs Acts 1977 and 1984. The system and process changes adopted during this LSS
project were conducted in compliance to this legislation and the process changes in both the
production and the test environments were audited by INAB on the 23rd of May 2013 and where
found to be compliant with Laboratory best practice.

89
5.3 Analysis of Results
5.3.1 Process 1: TF4 Form used to Record Specimen Sample Reference logs
This process involved changing from a batch system which relied on a process lifecycle of three
trays (150 specimen samples) to be analysed before the final stage of the process could be
completed and reports sent to the NDTC customer. The Sample Reference Log process lifecycle
before LSS Intervention (Figure 5.1) took up to 160 Minutes to complete.

90
Figure 5.1: TF4 Form – Sample Reference Log Lifecycle
The new LSS intervention changed from the traditional batch process lifecycle to a tray system. This
change removed unnecessary waste, by eliminating the time spent waiting for a batch to complete
before results could be reported to customers. Test result reports can be reported now once a tray
has been analysed. The new Sample Reference Log (Figure 5.2) process lifecycle takes 80 minutes
to complete, a reduction in time of 50%.
Figure 5.2: TF4 Form – New Sample Reference Log Lifecycle
In the previous batch system process, the information recorded in the Sample Reference Logs (TF4
forms) was entered manually by the Lab Aides after the book-in process was completed. Because
the information was entered manually there was always a risk of transcription errors occurring. The
Sample Reference Logs (TF4 forms) were then checked visually by the Biochemists. There was
always a risk of errors not being identified by the Biochemists during validation, which in turn has led
to reports being sent to customers with errors.
The new Labware LIMS module implemented as part of the LSS intervention generates the
completed Sample Reference Logs (TF4 forms) which are then completed by a Biochemist which
has eliminated transcription errors in this process.

91
5.3.2 Process 2: The Sample Disposal Log
Initially a request was made by the Senior Laboratory Team to design an application or develop a
module in Labware LIMS that could help them effectively manage the process of recording and
tracking analysed specimen samples which were queued for disposal. A urine specimen sample is
classed as being valid for testing purposes for up to two weeks after the specimen sample has been
received.
The changes made to the new Labware LIMS module implemented as part of the LSS
improvements for Process 1, allowed the Lab Aides to use Labware LIMS to track each tray through
the Laboratory. This process is now part of the Book-in lifecycle of Process 1 and required no further
development, this is common in Lean projects where wasteful processes are identified and removed
from the Value Stream (Mayo, 2007).

92
5.3.3 Process 3: North West Analytical (NWA) Statistical Analysis
A NWA statistical Analysis was performed on both Olympus AU2700 analysers to compare the QC
updates for primary QC low and the primary QC high for both analysers. A comparison NWA
statistical Analysis was conducted on two different processes, one before the LSS intervention and
one using the LSS intervention. The test was conducted for the primary QC for both low and high on
both analysers.
Test one was completed on the analysers using the Standard Operating Procedure (SOP) used in
the Laboratory without the LSS intervention. Test two was completed after the using the LSS
intervention on the NWA process.
The purpose of the testing was to validate that the data produced by both systems produced the
same statistical Analysis results and that the new automatic updating system was working correctly
within design parameters. Secondly the testing was conducted to verify the process time of each
process system (Figure 5.3), that is the before LSS intervention (manual process) and the after LSS
intervention (automatic process). The Bar Chart below shows the time savings with the new LSS
intervention, a saving of 13:44 Minutes (approximately 50% reduction in process time).
Figure 5.3: The two NWA processes, MANUAL was before LSS intervention and AUTO was after
LSS intervention

93
5.3.4 Process 4: Electronic Reporting Section
Directly generating and storing the client reports electronically has had significant performance
improvements for the Result Reporting Process (Table 5.2).
Table 5.2: The amount of time taken to generate and send a set of reports for the Client Result
Reporting Process
A full cost Analysis was conducted and the details of these findings are outlined in section 5.5 Cost
and Benefits below.
5.3.5 Process 5: Stock Tracking and Reporting Process
This LSS intervention was a quality process improvement initiative focusing at improving the quality
assurance systems within the Laboratory and not necessarily the performance time of the stock
tracking and reporting process, this process change was required for accreditation purposes. INAB
had highlighted that stock control systems must now be fully auditable and that if changes were not
made to the current process this would lead to a non-conformance and needed to be corrected
before the next INAB audit in May 2013.
The previous manual Stock Tracking and Reporting process was based on a manual monthly stock
taking protocol and this was replaced with a newly developed module for Labware LIMS which
tracks all the Laboratory stock for certain reagents, QCs and calibrators in real time, and alerts the
Laboratory team when stock is nearing its expiration date. This allows the Biochemist plenty of time
to replenish supplies. This system was designed to help prevent Laboratory staff from inadvertently
using expired stock.
There have been instances were expired stock had been used in an analyser and all the specimen
samples had to be retested, likewise, instances have occurred where stock has not been available
for an analyser for several days, and this analyser was offline while new stock was purchased.
These types of incidents occur very rarely and would therefore not make the basis for a reasonable
quantifiable Analysis study.

94
5.3.6 Specimen Samples Processed in 2012
The total amount of specimen sample requests received by the NDTC Laboratory in 2012 was
134,871 (Table 5.3), with an average of 11,239 samples processed per month for the year 2012.
Year Month Samples Received
2012 JAN 10223
2012 FEB 9253
2012 MAR 10086
2012 APR 8760
2012 MAY 10353
2012 JUN 9718
2012 JUL 11202
Subtotal Total for Jan - July 69,595
2012 AUG 13065
2012 SEP 11438
2012 OCT 14085
2012 NOV 15054
2012 DEC 11634
2012 Total for 2012 134,871
Table 5.3: The amount of Specimen Samples received for 2012

95
5.3.7 Specimen Samples Processed in 2013
The amount of specimen sample requests received by the Laboratory for 2013 (January to July) was
108,168 (Table 5.4) and the average amount of samples per month was 15,452. Compared to 2012
(January to July) the Laboratory received 69,595 specimen sample requests, and the average
amount of specimen samples per month was 9,942 (Table 5.3). This shows that in 2013 there has
been an increase of 37.49% in the average amount of samples received per month for the periods
January to July.
The NDTC took over the contract for all HSE specimen samples in October 2012; this has led to an
average increase of 47.80% (Figure 5.4) since October 2012 in specimen sample requests received
by the NDTC. No extra resources other than the LSS interventions have been made available to
cope with the increased demand.
year Month Samples
received
2013 JAN 17224
2013 FEB 15175
2013 MAR 14472
2013 APR 16429
2013 MAY 16993
2013 JUN 12792
2013 JUL 15083
2013 AUG
2013 SEP
2013 OCT
2013 NOV
2013 DEC
2013 Total 108168
Table 5.4: The amount of Specimen Samples processed to date for 2013

96
Figure 5.4: Samples received by the NDTC Laboratory in 2012 and 2013
5.3.8 Turnaround Times (TAT)
The Service Level Agreement (SLA) that the NDTC aspire to is a TAT of 48 hours. This time also
includes weekends and out of hours (17:30 – 08:30 when the NDTC is closed) and may not be a
true reflection of the TAT in terms of the amount of time a specimen sample spends in the NDTC
Laboratory actively being processed. The TAT was classed as a non-conformance by INAB during a
recent audit and it was suggested that the NDTC Laboratory should consider changing the TAT as
“48 hours was not realistic with the current staffing levels”. The TAT is currently being revised as part
of Phase II of this project and changes to the NDTC SLA and to how the TAT is calculated will be
implemented in August 2013.
The TAT is recorded in two different stages within the NDTC Laboratory, and then the two stages
are added together to create the total TAT for the specimen sample.
• The Lab Aide Stage is calculated from when a specimen sample is received and ends when
the specimen sample is Booked-in to Labware LIMS.
• The Biochemist Stage is calculated from the when the specimen sample is Booked-in to
Labware LIMS and ends when the results are reported.
The TAT for the available data for 2012 (Table 5.5) shows that a total of 134,871 specimen samples
were processed in the Laboratory, with an average TAT of 35.17 hours per specimen sample.

97
WEEK LAB AIDE
BIOCHEMIST
TAT
01/01/2012 22.11 21.87 34.38
09/01/2012 20.63 17.02 38.35
16/01/2012 20.5 29.38 51.23
23/01/2012 22.47 14.28 36.15
30/01/2012 21.48 15.7 36.97
06/02/2012 21.22 12.21 34.97
13/02/2012 19.78 12.3 32.11
20/02/2012 15.88 10.28 22.49
27/02/2012 n/a n/a n/a
05/03/2012 n/a n/a n/a
12/03/2012 n/a n/a n/a
19/03/2012 n/a n/a n/a
26/03/2012 n/a n/a n/a
02/04/2012 n/a n/a n/a
09/04/2012 n/a n/a n/a
16/04/2012 n/a n/a n/a
23/04/2012 21.98 15.27 38.16
30/04/2012 25.36 13.59 40.14
07/05/2012 23.96 20.3 44.89
14/05/2012 18.95 15.68 36.14
21/05/2012 20.27 16 37.17
28/05/2012 25.94 20.24 46.2
04/06/2012 20.15 13.75 27.76
11/06/2012 15.57 19.5 36.31
18/06/2012 11.25 23.27 35.09
25/06/2012 15.79 30.28 46.81
02/07/2012 18.98 22.96 35.47
09/07/2012 17.09 36.28 54.09
16/07/2012 19.63 14.99 31.88
23/07/2012 19.42 20.02 31.45
30/07/2012 22.35 11.36 35.28
Average for Jan - July 20.03 18.54 37.54
06/08/2012 13.03 28.2 41.93
13/08/2012 6.11 7.55 14.05
20/08/2012 10.07 7.61 18.01
27/08/2012 n/a n/a n/a
03/09/2012 15.12 10.24 26.22
10/09/2012 3.82 14.28 18.2
17/09/2012 12.54 18.88 31.91

98
24/09/2012 9.21 20.98 30.53
01/10/2012 7.03 11.76 19.06
08/10/2012 6.55 14.95 21.67
15/10/2012 4.53 15.21 19.44
22/10/2012 13.4 20.27 36.36
29/10/2012 10.56 12.07 22.93
05/11/2012 15.44 19.42 31.74
12/11/2012 19.77 26.82 41.23
19/11/2012 33.43 44.32 80.41
26/11/2012 18.9 11.65 25.27
03/12/2012 13.93 8.33 19.27
10/12/2012 12.45 12.32 25.26
17/12/2012 27.23 9.87 38.29
24/12/2012 51.86 12.91 60.97
31/12/2012 28.97 42.16 61.08
Average for 2012 18.06 18.1 35.17
Table 5.5: The Turnaround Times (TAT) for the available data for 2012
The TAT for the available data up until July 2013 shows that a total of 108,168 specimen samples
(Table 5.4) were received in the Laboratory with an average TAT of 55.52 hours per specimen
sample (Table 5.6). In comparison to the same period in 2012 (January 2012 – July 2012) where
there was a total of 69,595 specimen samples received (Table 5.3) with an average TAT (from the
available data for 2012) of 37.54 hours per specimen sample (Table 5.5).
Although this reflects a 44.48% increase in the TAT for 2013, when it is taken in the context that the
amount of specimen samples received has increased by 38.75%, the amount of downtime in the first
half of the year due to ICT system changes (Figure 5.5) and the NDTC Laboratory were down 33%
of their fulltime staff (from 12 to 8 members of staff during most of this period) it is not a true
reflection of the TAT for 2013.
The last LSS Phase I interventions went into production in June 2013, by comparing Figures from
June 2013 to July 2013 with figures from the same period in 2012, it can be seen in Table 5.11
below that there was a decrease in the average TAT for these two months of .11(0.3%).

99
WEEK LAB AIDE BIOCHEMIST TAT
07/01/2013 18.38 13.51 32.85
14/01/2013 25.04 17.3 42.98
21/01/2013 33.98 19.53 54.57
28/01/2013 46.89 29.94 78.29
04/02/2013 82.03 14.84 100.62
11/02/2013 64.21 21.19 88.29
18/02/2013 35.04 22.24 58.22
25/02/2013 23.81 10.85 35.32
04/03/2013 15.96 12.67 27.61
11/03/2013 64.01 33.47 98.02
18/03/2013 51.35 7.4 59.78
25/03/2013 75.56 6.64 85
02/04/2013 64.38 12.85 77.36
08/04/2013 38.17 21.88 60.96
15/04/2013 19.06 20.28 39.88
22/04/2013 23.38 46.31 69.61
29/04/2013 27.09 84.89 112.3
06/05/2013 20.8 22.91 44.48
13/05/2013 24.6 32.09 56.05
20/05/2013 12.47 31.17 44.04
27/05/2013 20.22 25.63 45.76
04/06/2013 42.88 22.93 65.4
10/06/2013 14.69 30.83 45.59
17/06/2013 13.93 8.65 23.18
24/06/2013 9.8 13.01 22.57
01/07/2013 19.84 15.09 35.63
08/07/2013 13.41 17.74 31.26
15/07/2013 22.32 22.81 45.17
22/07/2013 20.07 10.09 29.16
Average for 2013 32.53 22.37 55.52
Table 5.6: The Turnaround Times (TAT) for the available data for 2013
A factor which should be considered when analysing the figures for 2013 is the impact of ICT system
downtime has had on the Laboratory due to development, testing, and deployment of the new
Laboratory Virtual Server environment. The Virtual Server project started in January 2013 and the
final phase of deployment was finished in May 2013. The LSS Interventions were deployed to
production between the end of May 2013 and June 2013. In June 2013 the TAT started to reflect a
positive change (Figure 5.5).
The Line Chart in Figure 5.5 below shows the average TAT in hours per specimen sample request
for each week from week beginning 07th of January 2013 to week ending the 22nd of July 2013 and is

100
indicated by the green line on the chart. The blue line on the chart represents the Lab Aides time
spent on the Specimen Sample process flow and is measured from when a specimen sample is
delivered into the Laboratory to the time when it is booked-in. The red line on the chart represents
the Biochemists time spent on the specimen sample process flow and the TAT for their part of the
process which is measured from when a specimen sample is booked-in until the result is validated
and sent to the customer.
The peaks on the Line Chart for specimen sample TAT below (Figure 5.5) highlight the effects that
ICT downtime and staff shortages have had on the TAT for the first six months of 2013.
Figure 5.5: Factors Effecting Laboratory Turnaround Times (TAT)
5.3.9 Laboratory Transcription Errors
There have been 220 Transcription errors in the Laboratory between January 2012 and July 2013, of
these 35 have been in relation to the processes in Phase I (Table 5.7) that were changed as part of
the LSS project. Since the deployment of the LSS there have been no transcription errors with any of
the processes in phase I of the LSS project.
Non Conformances Batch Removal
Sample Disposal Log
Electronic Report Inventory NWA
Jan - Dec 2012 12 1 7 5 6
Jan - May 2013 2 0 1 0 1
Total 14 1 8 5 7
Table 5.7: Transcription errors in the Phase I Processes before LSS

101
Keeping in line with the LSS methodology of reducing waste and divergence, the processes were
changed where possible from manual human entry systems to automated systems, for example the
NWA statistical analysis calculations are in most part completed by Labware LIMS and in the Record
Specimen Sample Logs process the TF4 form is now generated and populated by Labware LIMS.
Human error is a complex subject to understand and there are several factors that should be
considered when designing and implementing technology solutions (Woods, 2010). In his book
Behind Human Error, Woods, 2010, states that the “clumsy use of computer technology” can
increase the potential for human error.
5.4 User Acceptance Analysis
To access the level of user acceptance a triangulated approach was used during Phase I of the LSS
Project, this consisted of interviews with the senior members of the Laboratory team, development of
new process interventions and user feedback on the project in the form of a questionnaire.
The interview stage involved taking note of the Senior Laboratory Team’s comments and suggests,
the building of prototype process systems and refining these systems based on user feedback.
These systems, once they were refined, were later deployed to production. To complete the
assessment of user acceptance and involvement, a Questionnaire was designed around gauging the
level of satisfaction the Laboratory team had with the new changes to the specimen sample process
flow and if they were satisfied that the LSS interventions had enabled them to manage the burden of
having to process extra samples with a reduced team. The Questionnaire looked at how the
Laboratory teams rated the level of morale within the Laboratory since the LSS interventions where
implemented.
A series of non-structured closing interviews were also conducted with the Senior Laboratory Team
to ascertain if the changes made during Phase I had met their expectations and needs, as outlined
in the initial interviews that were conducted before and during the Phase I of the LSS Project.
5.4.1 Questionnaire
The questionnaire was comprised of ten Likert-like questions based on the premise of user
satisfaction and following Bertram’s, 2006, guide on how to use a questionnaire using the Likert
scale to analyse ordinal data. Although the Likert Scale is a highly reliable scale, there are some
drawbacks with using it. Respondents may agree with questions in order to please the person
conducting the study. There is the possibility that respondents will avoid using extreme responses
and they may not be honest with their responses (Bertram, 2006). The questionnaire included two
open ended questions allowing the users to add addition comments or suggest alternative areas of
improvement (see Appendix XI).

102
The analysis of the data from the questionnaire was compiled using R, a language and environment
for statistical computing (r-project.org, 2013). A Chi-Squared test was carried out on the data and the
calculated P values were correlated using the R application to a probability of less than 0.05
(Appendix XII) indicating that the observed data is not significantly different (Higgins, Green, 2011).
Questions one to three were concerned with the participant’s impression of how the LSS
interventions were implemented and how they adapted to the change (Figure 5.6). Question four
measured the usability of the new process changes (Figure 5.7). Questions five through seven
measured the participant’s satisfaction with the potential benefits the improvements made to the
process flow (Figure 5.8) and questions eight to ten measured how the participant’s felt the changes
had impacted on the existing issues within the Laboratory, in relation to staffing, workload, and
morale (Figure 5.9). Questions eleven and twelve were open ended questions and allowed the
participant’s to make suggestions of how LSS could be used elsewhere in the Laboratory and any
addition comments the user wished to make (Table 5.8).
Overall how would you rate your level of Satisfaction with… Very Low Low
Neither Low nor High High
Very High Median Responses
Q1
…the levels of communication during the implementation phase of the Lean Six Sigma interventions? 0% (0) 0% (0) 25% (3)
66.6% (8)
8.4% (1) 1 12
Q2 …how the transition from the old system to the new system was implemented? 0% (0) 0% (0) 25% (3)
50% (6) 25% (3) 3 12
Q3 …your transition of moving from the old system to the new system? 0% (0) 0% (0) 25% (3)
41.7% (5)
33.3% (4) 3 12
Q4 …the usability of the new process changes? 0% (0) 0% (0) 0% (0) 58.3% (7)
41.7% (5) 0 12
Q5 …the reduction in the amount of transcriptions errors? 0% (0) 0% (0) 9.1% (1)
72.7% (8)
18.2% (2) 1 11
Q6 …the amount of time saving these enhancements have had on how you perform your daily tasks? 0% (0) 0% (0) 0% (0)
41.7% (5)
58.3% (7) 0 12
Q7
…the audit-ability of the new enhancements in relation to accreditation and the ISO 17025 standard? 0% (0) 0% (0) 16.7% (2)
66.6% (8)
16.7% (2) 2 12
Q8 …how the new process changes have helped working with reduced levels of staff? 8.4% (1) 8.3% (1) 16.7% (2)
66.6% (8) 0% (0) 1 12
Q9
…the new process changes in relation to coping with the extra specimen samples the Laboratory receives? 0% (0) 9.1% (1) 9.1% (1)
54.5% (6)
27.3% (3) 1 11
Q10 …the levels of staff morale since the new process changes have been deployed? 0% (0) 0% (0) 58.3% (7)
41.7% (5) 0% (0) 0 12
Q11 Would there be a benefit for Lean Six Sigma interventions in other areas of the Laboratory?
No 16.7% (2)
Yes 83.3% (10) 6 12
Table 5.8: Questionnaire Data Analysis
The questionnaire was conducted in August 2013 and included a description of the LSS
interventions. The questionnaire was anonymous and completely voluntary and the Laboratory team
understood the questions being asked. The response rate to the questionnaire was 100% with all 12
members of the Laboratory team completing the questionnaires.

103
In relation to the users opinion of how Phase I of the LSS project was implemented (questions one to
three), 75% of all staff rated their satisfaction as high to very high and 25% said their level of
satisfaction was neither high nor low. While 23.8% of Biochemists and 20% of Lab Aides claimed
their level of satisfaction was very high, in relation to the communication, the change from the old
processes to the new LSS processes, and the ease in which they went from using the old process to
using the new LSS processes.
Figure 5.6: (Q1 - Q3) User satisfaction with how the LSS project was implemented (%)
Question four rated the user’s level of satisfaction with the usability of the new LSS interventions,
100% of the Laboratory team rated their satisfaction as high or very high, with 42.8% of Biochemists
and 40% of Lab Aides rating their satisfaction with the usability of the new processes as very high.

104
Figure 5.7: (Q4) Satisfaction with how the LSS project was implemented (%)
Questions five through seven measured the participant’s satisfaction with the potential benefits the
LSS process improvements may have had in relation to human error, process time and quality
systems. 91% of the Laboratory team rated their satisfaction with these improvements as high or
very high, with 23.8% of Biochemists and 40% of Lab Aides rating their level of satisfaction as very
high (Figure 5.8).
Figure 5.8: (Q5 - Q7) Satisfaction with the LSS process improvements in relation to human error,
process time, and quality (%)

105
The final set of Likert-like questions (questions eight to ten) looked at the level of satisfaction in
relation to some of the issues which had been identified in the Laboratory, staffing, the increased
number of specimen samples received by the Laboratory and the level of morale of the Laboratory
team after the LSS implementation. In relation to the issues in the Laboratory prior to the LSS
intervention 61.1% of the Laboratory team rated their level of satisfaction as high or very high, with
4.8% of Biochemists and 13.3% of Lab Aides rating their satisfaction as very high. It is worth noting
that 8.3% of the Laboratory team rated their level of satisfaction as low or very low and 27.8% rated
their level of satisfaction as neither high nor low (Figure 5.9).
Figure 5.9: (Q8 - Q10) Satifaction in relation to the existing issues within the Laboratory, staffing,
workload, and morale (%)

106
On question eleven 83.3% of the Laboratory team believed that LSS interventions could be used
elsewhere in the Laboratory. Some of the suggestions were in confirmatory analysis techniques,
control drugs (Phase II, process 6), the stock ordering system, and the CF3 form for the reagents on
AU2700 analysers.
The additional comments section (question twelve), contained some positive feedback and
suggested that the systems seemed more “simplified and quicker, “there was a good level of
communication during the project”, “the improvements were positive”, “staff morale has improved
slightly” and that the improvements have made “work easier”, another factor which was highlighted
was “the return of staff from maternity leave”.
5.4.2 Interviews
The initial interviews with the Senior Laboratory Team provided the information needed to define the
areas where significant improvement could be made and influenced the design of the proposed LSS
intervention. The Senior Laboratory Team were positive about the concept and put forward the 10
scenarios where LSS could positively contribute to performance in specific areas of the Laboratory.
Some of the Senior Biochemists would have been in favour of using LSS for a wider spectrum of
work than was envisaged for Phase I and Phase II of this project had the resources been available.
During the course of the project some members of staff were less enthusiastic about certain LSS
interventions and concerns about certain issues were raised during some of the interview sessions.
Scenarios were discussed during the prototype testing and deployment stages of some of the LSS
interventions, where design changes may have been useful. At the time it was deemed by the
project team, that the disadvantages outweighed the advantages of implementing some of these
changes at that point in the project. LSS is about constant improvement, any changes, issues or
problems could always be addressed during the later Control stage of the LSS project.
The closing interviews provided mainly positive feedback, from the Senior Laboratory Team, all the
team felt that the improvements had made a positive, tangible impact on the Specimen Sample
Process Flow, but felt that extra resources were needed, and that the Laboratory staff were still
under a lot of pressure. It was also commented that, had the LSS process changes not been in place
at certain points in June, when staffing levels had been reduced even further, the Laboratory would
not have been able to cope with the amount of specimen sample test requests received. The LSS
had highlighted areas where new innovations could be utilised beyond Phase I and Phase II such as
“electronic faxing” and “integrating the LCMS and confirmatory analysis into Labware LIMS”. The
Senior Laboratory Team were positive about continuing on the work in Phase II of the LSS project.

107

108
5.5 Cost and Benefits
The costs of storage and filing of reports for the NDTC Laboratory has now been reduced
substantially, if funding became available in the future the historical data which is stored offsite by
the OASIS GROUP at an annual cost of approximately €3157.44 per annum (506 Boxes @ €0.52
per Month), could be scanned into the new electronic reporting system and negate the need for
these services completely. The following information relates to the costs incurred for the old
reporting process before the LSS intervention and most of these costs will no longer be incurred by
the NDTC as of June 2013.
The NDTC store Laboratory reports which are older than six months securely offsite and use the
services provided by the OASIS Group a company that specialise in the secure management and
storing of both paper based and electronic data records. The OASIS Group have been accredited to
the International Standards Organisation (ISO) 9001 which is the internationally recognised
standard for Quality Management Systems (QMS), the ISO 27001 standard which is the
international standard for Information Management Security Systems (ISMS) and the Payment Card
Industry (PCI) Data Security Standard which requires the company to adherence to a set of specific
security standards. The OASIS Group continually assess the integrity of their information systems
and insure that they are legally compliant and achieve customer satisfaction (OASIS GROUP, 2013).
OASIS Group Pricing Services for the NDTC – Document & Management Storage
Standard Oasis Box, per Month Rate: €0.52
Add & Track new Box Rate: €0.75
Add & Track new File Rate: €0.45
Handling Charge per Box or File – in/Out Rate: €1:00
For the first 10 boxes delivered/collected Rate: €8.00
Each additional box/file Rate: €1.00
Special Delivery – Within 3 hours Rate: €35:00
Out of Office Hours Delivery Rate: €60:00
Weekend/Bank Holiday Delivery Rate: €80:00
OASIS Standard Archive Box Rate: €2:50
(Delivery/Collection 08:30hrs to 17:00hrs) Copy of original pricing quote can be found in Appendices
X and all prices exclude Value Added Tax (VAT).

109
5.5.1 Costs of Consumables for Laboratory Reporting
The consumables used in the Laboratory for the year prior to the deployment of the first LSS
intervention to the production environment can be seen in Table 5.9 below. This table refers to items
that are directly related to Laboratory reporting and will not be required in the same quantity in the
future as the majority of reports will now be dealt with electronically.
Laboratory Reporting Expenses (excluding Posting &
Faxing Costs) May 2012 to April 2013
Quantity Unit Cost Total
HP 42x ink cartridges 4 €235.00 €940.00
TN3170 3 €110.00 €330.00
Brown Folders 28 €9.80 €274.40
Box Paper 65 €25.00 €1,625.00
Box small window private and confidential envelopes 7 €30.00 €210.00
Pack Connect Plastic Pockets 4 €6.80 €27.20
A4 Envelopes window + non window 2 €43.36 €86.72
HP 78A Laserjet Print Cartridge 2 €98.00 €196.00
Box A5 Sized Envelopes 2 €11.60 €23.20
TN 2120 Ink Cartridge PLUS drum for fax/printer in main lab 4 €86.00 €344.00
Non tear envelopes 6 €86.00 €516.00
Total Costs for May 2012 to April 2013 €4,572.52 Table 5.9: The Laboratory Costs of Printing and Reporting May 2012 to April 2013
5.5.2 Evidence of Cost Benefit Analysis
The final stage of the new Electronic Reporting process went Live on the 1st of June 2013 and the
full benefits of the cost saving that will benefit the NDTC will not be fully realised until 2014. The
following cost Analysis based on the periods of January 2012 to December 2012 (Table 5.10) and
from January 2013 to July 2013 (Table 5.9) shows the potential cost savings the NDTC will achieve.
There has been a reduction in the number of new boxes containing Laboratory reports being stored
offsite, 48 new boxes in 2012 (Table 5.10) and 27 new boxes in 2013 (Table 5.11). All reports are
stored electronically as of the 1st of June 2013, so no new boxes of paper reports will be created for
offsite storage.

110
Oasis Storage Boxes 2012 Unit Cost Quantity Total Cost
Cost of registering on Database 0.75 48 €36.00
Refile a Box 1.00 29 €29.00
Access Box 1.00 29 €29.00
Fuel Surcharge per Journey 1.11 2 €2.22
Price of Cardboard Box 2.50 48 €120.00
Storage of Boxes (See Table 5.12) 0.52 - €2,588.04
Delivery (First 10 x €8+ €1 per extra Box) 29 €27.00
Pickup (First 10 x €8+ €1 per extra Box) 29 €27.00
Total Costs for Oasis Storage Service 2012 €2,858.26
Table 5.10: Cost Details of Oasis Offsite Storage for 2012
A total of 29 boxes were required to be returned for the yearly INAB audit in 2012 (Table 5.10) and a
total of 54 boxes were required to be returned for the yearly INAB audit in 2013 (Table 5.11).
Oasis Storage Boxes - Jan - July 2013 Unit Cost Quantity Total Cost
Cost of registering on Database 0.75 27 €20.25
Refile a Box 1.00 54 €54.00
Access Box 1.00 54 €54.00
Fuel Surcharge per Journey 1.11 3 €3.33
Price of Cardboard Box 2.50 27 €67.50
Storage of Boxes (See Table 5.13) 0.52 - €1,813.76
Delivery (First 10 x €8+ €1 per extra Box) 53.00 53 €51.00
Delivery (First 10 x €8+ €1 per extra Box) 1.00 1 €8.00
Pickup (First 10 x €8+ €1 per extra Box) 54.00 54 €52.00
Total Costs for Oasis up to July (7 Months) €2,123.84
Addition 5 Months Storage: To End of Year 0.52 2530 €1,315.60
Total Costs for Oasis Storage Service 2013 €3,439.44
Table 5.11: Cost Details of Oasis Offsite Storage for 2013
Table 5.11 is a breakdown of the costs incurred for the storage and retrieval of paper based reports
up to the 31st of July 2013, there will be a further 5 months storage charge for the remaining part of
2013. The new Electronic Reporting Process will mean that there will no longer be a requirement for
the storing of new paper reports offsite, as all future reports will be stored electronically.
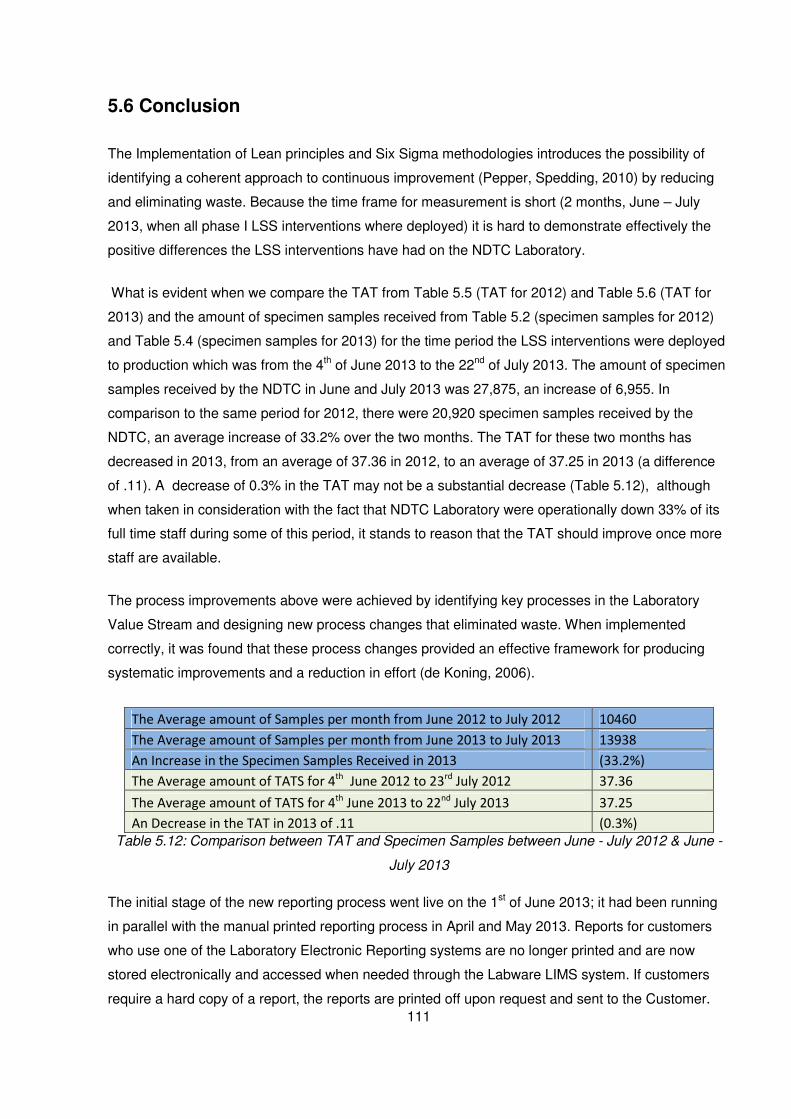
111
5.6 Conclusion
The Implementation of Lean principles and Six Sigma methodologies introduces the possibility of
identifying a coherent approach to continuous improvement (Pepper, Spedding, 2010) by reducing
and eliminating waste. Because the time frame for measurement is short (2 months, June – July
2013, when all phase I LSS interventions where deployed) it is hard to demonstrate effectively the
positive differences the LSS interventions have had on the NDTC Laboratory.
What is evident when we compare the TAT from Table 5.5 (TAT for 2012) and Table 5.6 (TAT for
2013) and the amount of specimen samples received from Table 5.2 (specimen samples for 2012)
and Table 5.4 (specimen samples for 2013) for the time period the LSS interventions were deployed
to production which was from the 4th of June 2013 to the 22nd of July 2013. The amount of specimen
samples received by the NDTC in June and July 2013 was 27,875, an increase of 6,955. In
comparison to the same period for 2012, there were 20,920 specimen samples received by the
NDTC, an average increase of 33.2% over the two months. The TAT for these two months has
decreased in 2013, from an average of 37.36 in 2012, to an average of 37.25 in 2013 (a difference
of .11). A decrease of 0.3% in the TAT may not be a substantial decrease (Table 5.12), although
when taken in consideration with the fact that NDTC Laboratory were operationally down 33% of its
full time staff during some of this period, it stands to reason that the TAT should improve once more
staff are available.
The process improvements above were achieved by identifying key processes in the Laboratory
Value Stream and designing new process changes that eliminated waste. When implemented
correctly, it was found that these process changes provided an effective framework for producing
systematic improvements and a reduction in effort (de Koning, 2006).
The Average amount of Samples per month from June 2012 to July 2012 10460
The Average amount of Samples per month from June 2013 to July 2013 13938
An Increase in the Specimen Samples Received in 2013 (33.2%)
The Average amount of TATS for 4th
June 2012 to 23rd
July 2012 37.36
The Average amount of TATS for 4th
June 2013 to 22nd
July 2013 37.25
An Decrease in the TAT in 2013 of .11 (0.3%)
Table 5.12: Comparison between TAT and Specimen Samples between June - July 2012 & June -
July 2013
The initial stage of the new reporting process went live on the 1st of June 2013; it had been running
in parallel with the manual printed reporting process in April and May 2013. Reports for customers
who use one of the Laboratory Electronic Reporting systems are no longer printed and are now
stored electronically and accessed when needed through the Labware LIMS system. If customers
require a hard copy of a report, the reports are printed off upon request and sent to the Customer.

112
There is evidence to suggest that had the LSS Electronic Report process improvement not been
initiated there would have been a substantial increase in the cost associated with offsite storage of
paper records. In the first quarter of 2012 there were a total of 18 new boxes sent for offsite storage
(Table 5.13), in the same period of 2013 there were a total of 27 new boxes sent for offsite storage,
this is in line with a 33.2% increase in Specimen Sample testing requests as discussed earlier.
There were a further 30 new boxes sent for offsite storage in the latter part of 2012 (Table 5.13)
whereas in 2013 there were no new boxes sent for offsite storage as all reports for April, May, June
and July were stored electronically. In April and May 2013 the new process improvement ran in
parallel with the paper based process, all electronic reports for this period were validated and the
paper reports destroyed.
As part of the continuous improvement process of LSS the outsourcing of a scanning service to scan
the historical documentation will be investigated so this data can be stored electronically and the
existing paper records destroyed, to avoid accruing unnecessary costs in 2014 (Table 5.15).
Oasis Storage Costs 2012
No. of New
Boxes
Total No. of Boxes in
Storage Cost
05/11/2012 14 479 €498.16
25/07/2012 16 465 €483.60
02/04/2012 18 449 €933.92
01/01/2012 0 431 €672.36
Total
31/12/2012 48 479 €2,588.04
Table 5.13: The Details of Offsite Storage for 2012
Oasis Storage Costs 2013
No. of New
Boxes
Total No. of Boxes in
Storage Cost
01/08/2013 0 506 €1,315.60
12/03/2013 27 506 €1,315.60
01/01/2013 0 479 €498.16
Total
31/12/2013 27 506 €3,129.36
Table 5.14: The Projected Details of Offsite Storage for 2013
Oasis Storage Costs 2014
No. of New
Boxes
Total No. of Boxes in
Storage Cost
01/01/2014 0 506 €3,157.44
Total
31/12/2014 0 506 €3,157.44
Table 5.15: The Projected Details of Offsite Storage for 2014

113
Finally looking at the data from the recent Questionnaire on user satisfaction in relation to the LSS
interventions, 100% of the participants rated the usability of the new LSS process changes as high
or very high. On how the Laboratory team felt Phase I of the LSS interventions were implemented,
75% of the users scored this as high or very high. When asked about how they rated their
satisfaction with the benefits the LSS improvements had made to the different processes, 91% of the
Laboratory team rated this as high or very high, the Lab Aides being more in favour of the
interventions with 40% of them rating the benefits as very high. On whether the LSS interventions
improved morale and the other issues with staffing and the extra demands on productivity, overall
61% of the participants rated their level of satisfaction as high or very high.
The positive comments from the closing interviews with the Senior Laboratory Team indicated a high
level of user acceptance. The new LSS processes “freed up the Senior Biochemist to manage the
production system”, “the processes seem quicker and it’s easier to find stuff, as it cuts out searching
through boxes of paper records”, and “the Laboratory has become more compartmentalised, with the
systems working like a factory process, without interruptions”. Comments like these, three months
after Phase I went into production, are good quality indicators that the system changes are still
perceived as being affective and according to Davis, Bagozzi, Warshaw, 1989, perceived usefulness
strongly influences people’s user acceptance of Computer Technology.

114
Chapter Six: Discussion & Conclusions
6.1. Introduction
One of the objectives of this dissertation was to conduct some qualitative and quantitative research
analysis on the deployment of LSS BPMS in a Healthcare environment. It was likewise believed that
the findings produced in this dissertation should adhere to the recommendation of DelliFraine,
Langabeer II and Nembhard, 2010, who suggested that the effectiveness of BPMS could be
achieved by conducting a detailed statistical analysis on the specific areas highlighted for
improvement and measuring the processes before and after the BPMs improvement was
implemented.
This paper contributes towards knowledge by providing a template of how LSS can be successfully
implemented in a small Clinical Laboratory in a time of budgetary restraints and without the need of
outsourcing to private vendors and by creating a domain specific standard that could be used as a
building block by other Laboratories.
6.2 Summary of Findings and Results of Lean Six Sigma
Implementation
The clinical Laboratory Value Stream is made up of many different processes which have a
symbiotic relationship with the process flow as well as the other processes. Documenting and being
aware of the entire Value Stream is at the centre of capturing the current “As Is” system (Mayo,
2007), so that changes can be effectively and efficiently implemented. If not enough planning has
gone into the LSS Intervention this can have negative implications on the entire process flow. This
was highlighted in the planning of this LSS project. By deploying the “TF4 Form used to Record
Specimen Sample Reference logs” (Process 1) first, the changes introduced by this LSS intervention
completely negated the need to proceed with the proposed LSS intervention “The Sample Disposal
Log” (process 2).
The Sample Disposal Log (process 2) has now been removed from the Laboratory Value Stream
process flow, had the decision been made to implement the Sample Disposal Log (process 2)
without looking at the Value Stream in its entirety the proposed intervention would have been
unnecessary. The proposed solution for the Sample Disposal Log (process 2) involved the
development of a new Module in Labware LIMS, the purchasing of new handheld barcode scanners
and the development of a new electronic Sample Disposal Log. This would have been an example of
over production/over processing which is where a BPMS such as Lean and LSS are effective, by

115
identifying and eliminating these wasteful processes, as they have no value to the customer (Mayo,
2007).
The ease of access to Internet based services has put increased pressure on the NDTC Laboratory,
as customer expectations have changed with the advent of Internet based services. Customers now
expect the delivery of test results much sooner than they previously did with paper based systems,
their expectations of the usability, quality and security of Internet based patient systems have
likewise increased (Hogg, Laing, Winkelman, 2003).
Using the traditional paper based systems (Fax and Posting) for sending test reports to customers
had a TAT of on average 4 days. When all of the LSS interventions identified in this research are
implemented it will be possible to reduce the specimen sample TAT to 4 hours for customers using
the Laboratory Electronic Reporting (LER), the NDTC Electronic Patient System (EPS) or the Health
Service Executive’s (HSE) DAIS application, based on the time of day of the delivery of the sample
to the Laboratory. The current customer Service Level Agreement (SLA) for the NDTC Laboratory is
a TAT of 48 hours.
Improvements since LSS Implementation:
• Reduced batch sizes which have reduced process time by 50%
• A reduction in Transcription errors by conducting a “Root Cause Analysis” and where
possible mistake proofing the Information Technology (IT) interventions.
• Improved the NWA Statistical Analysis process for the Quality Control systems
• Introduced a new Stock Inventory Management System
• Leveraged Technology to provide an IT infrastructure that facilitated the storage of
electronic documents, reducing paper and taking the Laboratory closer to a paperless
reporting system
• Decrease in TATs since the first LSS intervention was deployed to production. The
TATs have remained consistently under 48 hours (Figure 6.1).
• Reports are now accessible from within Labware LIMS, linking directly to the clinic by
the date of test request. This allows the Biochemists to follow up on queries on results
by being able to access the system and customer report simultaneously.

116
Figure 6.1: Laboratory Turnaround Times (TAT) since the deployment of the last Lean Six Sigma
intervention
6.3 Limitations of Research
One of the main restraints on this project was the lack of funding available to make structural
changes within the Laboratory. The only way to eliminate time wasted due to movement would be to
restructure the entire layout of the Laboratory.
Unfortunately the Laboratory has evolved over many years and the location of the analysers,
worktops and fume cupboards are more because of necessity rather than practicality. After the initial
waste walk was conducted it was clear there were many areas where if changes could be made to
the layout of the Laboratory it could lead to a massive reduction in the amount of time wasted from
unnecessary movement.
The other limitation of this research was time, although I had the luxury of working in the same
building as the Laboratory, I found it difficult to devote time during my normal working hours to the
LSS process changes and had to spend some of my personal time implementing these
interventions.
The lack of a dedicated LSS project team, had the staff resources been available to allocate staff to
this project on a full time basis, we would have achieved a lot more in a much shorter time frame.

117
6.4 Recommendations for Present and Future Work
Some of the comments from the closing interviews for Phase I with the Senior Laboratory Team
were interesting and although generally positive they highlight issues with the process of change that
were not anticipated, for example it was commented that
• “The inventory management process now seemed much longer and needed to be simplified”
• “The Biochemists needed retraining on the new LSS processes which the Lab Aides use”
• “The new tray system had introduced another step for the Biochemists in the process flow,
should a repeat test be required on a sample!”
Other issues were not identified when the Value Stream was being mapped.
• The inventory process required improvements to quality and control, speed and simplicity
were not a requirement.
• Likewise, replacing the old batch process with the new tray process, put in error correction
systems which did not take into account that requests for repeated tests can be raised if the
results and not satisfactory.
These are lessons that have been learnt for Phase II of the LSS project. The issues identified by the
Senior Laboratory Team are being addressed as part of the Control phase of LSS (LSS is about
continuous improvement).
The NDTC has been given approval for the recruitment of a replacement Senior Biochemist for the
role of Laboratory Customer Service Manager. It is envisioned that when the Laboratory Customer
Service role is filled in 2013 that a new drive will be initiated as part of the continuous improvement
process of LSS, to encourage our existing and new customers to move away from the traditional
printed and fax report systems and towards one of the Electronic Reporting systems the Laboratory
subscribe too.
The research undertaken in the literature review, would suggest that there would seem to be
disparity in the choice of BPMS and there is no standard framework for the deployment of Lean, Six
Sigma or LSS and this would seem to be the same in current Health sector (Pepper, Spedding,
2010).
In their literature review, DelliFraine, Langabeer II and Nembhard, 2010, claimed that there has been
a gap in the demonstration of good statistical analysis to prove that a BPMS such as Lean Six Sigma

118
does improve the quality of healthcare services. This is not the case with this dissertation or the
NDTC Laboratory LSS project, who followed the recommendations of Pepper, Spedding, 2010, in
conducting a the LSS improvement project focusing on the Laboratory Value Stream as a complete
system, with the aim of the project being to put the correct interventions in the right place.

119
REFERENCES
Addictionireland, Drug Analysis Laboratory: A guide to service users.
http://www.addictionireland.ie/_fileupload/general/Drug_Analysis_Laboratory._A_Guide_for_Service
_Users._DEC_2010.pdf, accessed 30/10/2012)
Antony, J., (2004), "Some pros and cons of Six Sigma: an academic perspective". The TQM
Magazine 16.4 (2004): 303-306.
Arkell, D., (2003), "Built-in quality: Better, faster, cheaper—but most of all, better". Boeing Frontiers,
Volume 02, Issue 03 (July, 2003). [online] Available at:
<http://www.boeing.com/news/frontiers/archive/2003/july/i_ca1.html> [Accessed February 12, 2013]
Atkinson, P., (2013), "Managing resistance to change". [online] Available
at:<http://www.philipatkinson.com/OD_Managing_Resistance_TChange_Champions_OD_Consultan
ts_30.pdf> [Accessed May 30, 2013].
Badrick, T., (2008), "The Quality Control System". The Clinical Biochemist Reviews, 29 (Supplement
(i)), S67.
Brady, J. E., Allen, T. T., (2006), "Six Sigma literature: a review and agenda for future research".
Quailty and Reliability engineering International 2006, 22:335-367.
Bertram, D., (2006), ”Likert Scales …are the meaning of life”. [online] Available at:
<http://poincare.matf.bg.ac.rs/~kristina//topic-dane-likert.pdf> CPSC 681 – Topic Report ,pp.1-
10,2006 [Accessed August 14, 2013].
Brett, C., Queen, P., (2005), "Streamlining enterprise records management with lean Six Sigma."
INFORMATION MANAGEMENT JOURNAL-PRAIRIE VILLAGE- 39.6 (2005): 58.
Carroll, T, Pinnick, H, Carroll, W., Probability and the Westgard Rules, Ann Clin Lab Sci Winter,
2003, 33:113-114.
Chakrabarty, A., Kay, C.T., (2007). "The current state of six sigma application in services".
Managing Service Quality, 17(2), pp. 194-208.
Chiarini, A., (2011), "Japanese total quality control, TQM, Deming's system of profound knowledge,
BPR, Lean and Six Sigma". International Journal of Lean Six Sigma. 2(4), pp. 332-355.

120
Christianson, J. B., Warrick, L.H., Howard, R, Vollum, J., (2005). "Deploying Six Sigma in a health
care system as a work in progress". J Qual Patient Saf. 2005;31(11):603-613.
Davis, F. D., Bagozzi, R. P., Warshaw, P. R., (1989). "User acceptance of computer technology: a
comparison of two theoretical models". Management science, 35(8), 982-1003.
de Koning, H., Verver, J. P. S., van den Heuvel, J., Bisgaard, S. and Does, R. J. M. M. (2006), Lean
Six Sigma in Healthcare. Journal for Healthcare Quality, 28: 4–11. doi: 10.1111/j.1945-
1474.2006.tb00596.x.
DelliFraine, J. L., Langabeer II, J. R., Nembhard, I. M., (2010), "Assessing the Evidence of Six
Sigma and Lean in the Health Care Industry". Quality Management in Health Care. 19(3):211-225,
July/September 2010.
Devane, T., (2003), "Integrating lean six sigma and high-performance organizations: leading the
charge toward dramatic, rapid, and sustainable improvement". Vol. 4. Pfeiffer, 2003.
Edrawsoft, 2013. Standard Flowchart Symbols and Their Usage. [online] Available at:
<http://www.edrawsoft.com/flowchart-symbols.php> [Accessed August 11, 2012].
George, M. L., George, M., (2003), "Lean Six Sigma for Service". New York: McGraw-Hill, 2003.
Hammer, M., Champy, J., (1993), "Re-engineering the Corporation: A Manifesto for Business
Revolution". Harper Business, New York, NY.
Hensley, R. L., Dobie, K., (2005), “Assessing readiness for six sigma in a service setting”, Managing
Service Quality, Vol. 15 No. 1, pp. 82-101.
Higgins, J. P. T., Green, S. (editors). (2011), "Cochrane Handbook for Systematic Reviews of
Interventions Version 5.1.0 [updated March 2011]". The Cochrane Collaboration, Available at:
<http://www.cochrane-handbook.org> [Accessed August 31, 2013].
Hogg, G., Laing, A., Winkelman, D., (2003). The professional service encounter in the age of the
internet: an exploratory study. Journal of Services Marketing, 17(5), 476-494.
Irish Medicines Board, (2013), "Controlled Drugs and Precursor Chemicals". [online] Available at:
<http://www.imb.ie/EN/Medicines/Controlled-Drugs-and-Precursor-Chemicals.aspx> [Accessed May
30, 2013].

121
Keller, P. A., Pyzdek, T. (2005). "Six Sigma Demystified: a self-teaching guide". New York: McGraw-
Hill.
McDaniel, R., Lanham, H. J., (2009) "Evidence as a tool for managerial action: a complex adaptive
systems view". Health Care Management Rev. 2009;34 (3):216-218.
Mayo Clinic, Innovations in the Clinical Laboratory, (2010), "An Overview of Lean Principles in the
Laboratory", 2007. [online] Available at:
<http://www.mayomedicallaboratories.com/articles/whitepapers/whitepapers.html> [Accessed Nov
05, 2012].
Pepper. M.P.J, Spedding. T.A,. (2010). "The evolution of lean Six Sigma", Emerald 27, 2010.
Meade, C. M., Bursell, A.L., Ketelsen, L., (2006), "Effects of nursing rounds: on patients' call light
use, satisfaction, and safety". Am J Nurs 2006, 106:58-70. quiz 70-51.
Moen, R., Norman, C., (2006). Evolution of the PDCA cycle.
Mulgan, R. G., (1974) "A Note on Aristotle's Absolute Ruler". Phronesis 19.1 (1974): 66-69.
Muthu, S., Whitman, L., Hossein, S.C., (1999), “Business process reengineering: a consolidated
methodology”, Proceedings of the 4th Annual International Conference on Industrial Engineering
Theory, Applications, and Practice, US Department of the Interior – Enterprise Architecture, US
Department of the Interior, Washington, DC.
National Drug Treatment Centre (NDTC), Drug Analysis Laboratory ., (2013)."Drug Analysis
Laboratory: A guide to service users"'. [online] Available at:
<http://www.addictionireland.ie/_fileupload/general/HSE_NDTC_Drug_Analysis_Laboratory_A_Guid
e_to_Service_Users_4th_Ed.pdf> [Accessed March 20, 2013].
Nonthaleerak, P. and Hendry, L. (2005), “Six sigma: literature review and key future research areas”,
LUMS Working Paper Series, June, pp. 1-66.
North West Analytics., (2013), Overview, Quality Analyst. [online] Available at:
<http://www.nwasoft.com/products/nwa-quality-analyst> [Accessed May 12, 2013].
Osayawe, E. B., McAndrew, E. B., (2005), “Innovation, diffusion and adoption of total quality
management (TQM)”, Management Decision, Vol. 43 No. 6, pp. 925-40.

122
OASIS GROUP, 2013. Accreditations. [online] Available at: <http://www.oasisgroup.eu/about-
us/awards.387.html> [Accessed July 28, 2013].
Pepper, M., (2007), “A supply chain improvement methodology for the process industries A supply
chain improvement methodology for the process industries”. PhD thesis, School of Management
and Marketing, University of Wollongong.
Pepper. M.P.J, Spedding. T.A,. (2010). "The evolution of lean Six Sigma", Emerald 27, 2010.
QCNet, (2008), "Basic Lessons in Laboratory Quality Control - QC Workbook 2008". [online]
Available at: <http://www.qcnet.com/Portals/50/PDFs/QCWorkbook2008_Jun08.pdf> [Accessed
January 10, 2013].
Richard, M,. Kupferschmid, T. D,. (2011). "Increasing Efficiency of Forensic DNA Casework Using
Lean Six Sigma Tools", U.S. Department of Justice, 2008-DA-BX-K188. Document No.: 235190.
r-project.org., (2013), ”An Introduction to R”. [online] Available at: <http://cran.r-
project.org/doc/manuals/r-release/R-intro.pdf> [Accessed August 14, 2013].
Rundall, T. G., Martelli, P. F., Arroyo, L, McCurdy, R., Graetz, I., Neuwirth, E.B., Curtis, P.,
Schmittdiel, J., Gibson, M., Hsu, J., Butler, P. W., (2007) "The informed decisions toolbox: tools for
knowledge transfer and performance improvement”. Journal, Healthcare Management. 2007;
52(5):325-343.
Russell, R. S., Taylor, B. W., (2000), "Operations Management". Prentice-Hall, Englewood Cliffs, NJ.
Snee. R. D,. Hoerl, R.W., (2003), "Leading Six Sigma – A Step-by-step Guide Based on Experience
with GE and Other Six Sigma Companies". Financial Times/Prentice-Hall, New York, NY.
Snee. R. D,. Hoerl, R. W., (2005), "Six Sigma Beyond the Factory Floor – Deployment Strategies for
Financial Services, Health Care, and the Rest of the Real Economy". Financial Times Prentice-Hall,
New York, NY.
Snee. R. D,. (2010). "Lean Six Sigma - getting better all the time", International Journal of Lean Six
Sigma, Vol. 1 Iss: 1 pp. 9 - 29.
Spaulding, A.C., Gamm, L. D., Griffith, J.M., (2010), "Studer unplugged: identifying underlying
managerial concepts." Hospital Topics 88.1 (2010): 1-9.

123
Studer, Q., (2005) "Reducing leader variance." Healthcare Financial Management: Journal of the
Healthcare Financial Management Association 59.10 (2005): 114-116.
Synergy Health Laboratory Services, 2012. Laboratory Investigations Handbook - Version 1.1.
[online] Available at:
<http://www.synergyhealthplc.com/sites/default/files/Laboratory%20Investigations%20Handbook%2
0-%20Version%201.1.pdf> [Accessed August 14, 2013].
Taner, M. T., Sezen, B., & Antony, J,. (2007). "An overview of six sigma applications in healthcare
industry". International Journal of Health Care Quality Assurance, 20(4), 329-340.
Tjahjono. B, Ball. P, Vitanov. V.I, Scorzafave. C, Nogueira. J, Calleja. J, Minguet. M, Narasimha. L,
Rivas. A, Srivastava. A, Srivastava. S, Yadav. A,. (2010), "Six Sigma: a literature review",
International Journal of Lean Six Sigma, Vol. 1 Iss: 3 pp. 216 - 233
Tran, Thang, M.S., Implementation of Lean Six Sigma principles in an analytical research and
development chemistry Laboratory at a medical device company, California State University,
Dominguez Hills, 2011, 101 pages; AAT 1496059
Vest, J. R., & Gamm, L. D,. (2009). "A critical review of the research literature on Six Sigma, Lean
and studergroup’s hardwiring excellence in the United States: the need to demonstrate and
communicate the effectiveness of transformation strategies in healthcare". Implement Sci, 4(35), 1-9.
Vest, J. R., Yoon, J., Bossak, H. B.,(2012), "Changes to the electronic health records market in light
of health information technology certification and meaningful use". J Am Med Inform Assoc
2013;20:2 227-232.
Westgard, J.O., Barry, P. L., Hunt M.R., Groth, T., (1981), "A Multi-Rule Shewhart Chart For Quality
Control In Clinical Chemistry". CLIN. CHEM. 27/3 493-501.
Womack, J., Jones, D.T., Roos, D., (1990), "The Machine that Changed the World". Rawson
Associates, New York, NY.
Womack, J., Jones, D. T., (1996), "Lean Thinking: Banish Waste and Create Wealth in Your
Corporation". Simon and Schuster, London.
Woods, D. D., (2010), "Behind human error". Ashgate Publishing, 2010.

124

125
APPENDICES
Appendix I: Phase II of Lean Six Sigma Interventions
7.1 Phase II: Process 6: Controlled Drugs Tracking
Controlled Drugs Tracking requirements and the control system processes used by the NDTC
Laboratory to meet the legal requirements for the use of these drugs.
7.1.1 Define: Controlled Drugs Tracking
1: Currently the date the drugs were opened is not always recorded; it is hoped that this would be
enforced by the proposed ICT intervention.
2: The expiry date is recorded in the excel spread sheet but there is no way of alerting the
Biochemists when the drugs are out of date or when they are approaching their expiry date. It is
envisioned that the proposed system would have an alerting function, either via email or the
proposed integration with the alerting functions of either of the current Laboratory IT applications,
Labware LIMS the Laboratory information system or Paradigm 2 the Laboratory document
management system and task scheduler.
3: Not all drugs have expiry dates, some drugs have a retest date, the Laboratory is required to
request a certificate of Analysis from the suppliers to verify that the batch is still stable for use in the
testing of drugs. This certificate is usually emailed to the Laboratory. It is envisioned in the proposed
system that this process could be automated and that the certificates are stored within the
application.
4: Every drug should have a certificate Analysis form stored with it, currently these are hardcopies
and stored in folder. It is envisioned that the application will store these in a live list in PDF format
and these will be accessible from within the application.
5: The drugs have a finish date; this is sometimes not recorded in the Microsoft (MS) Excel
spreadsheet. The new application will have an ICT intervention that will inform the Biochemist when
a particular type of drug is nearing its expiry date. The application will monitor the end date of drugs
and class drugs unusable if these drugs reach their finish date and alert the user. These drugs will
be moved to an archive list along with licenses and certificate Analysis forms, if a user tries to check

126
these drugs out for testing they will be issued an alert from the ICT intervention telling them that the
drugs have expired and shouldn’t be used for testing.
6: Currently the drugs are moved to different fridges, these movements are not recorded on the
current Microsoft (MS) Excel spreadsheet, the application should record all moment of drugs once
they have been logged into the Laboratory, the person responsible for moving them and the time
and date they were moved.
7: Certain drugs can only be kept out of refrigerated storage for a limited period of time, all drugs will
be issued with barcodes, a workstation with a barcode scanner will be used to scan all drugs as they
are checked out and in the storage facility. A proximity scanner will be used to monitor who
accessed the storage areas, this data will be recorded in the application. The ICT intervention will
alert the user and all members of Biochemistry team should a drug be in danger of being
contaminated. If the drug is classed as contaminated it will be flagged by the system, removed from
the live list and will require proof of destruction authorised by a senior Biochemist.
8: Currently the amount of drugs used are not recorded, it is envisioned that the system will require
that the quantity of drugs used are recorded each time a user checks the drugs out and back in, this
will also require the recording of the amounts of spillage etc.
9: The quantity of drugs that are currently in stock is not tracked, it is envisioned that the new
application will have an ICT intervention that will inform the Biochemist when a particular type of
drug is running low and start an automated process for the importation of a new supply of drugs
when needed.
10: A reporting facility is required, that will automatically generate reports on a Daily/weekly/monthly
basis as well as ad hoc reports when required.
These reports will detail information such as, the amount of drugs in stock, who has used them and
when they were used, if drugs have been moved to different storage location and information on
licenses and expiry dates.
It is envisioned that this reporting facility will have the ability to directly send these reports via email if
required.
7.1.2 Measure: Controlled Drugs Tracking
This LSS intervention is currently in the define and measurement stage and requirements
specifications have been sent to Labware LIMS requesting the requirements for the development of

127
a Tracking and Reporting Inventory Module and it is envisioned that the Controlled Drugs Tracking
Inventory Manager will be ready for deployment to the test environment by July 2013.
1: In order to possess controlled drugs it is necessary have a licence for possession of the drug.
There are three types of licences that the NDTC normally has possession of:
1) Licence to possess precursors
2) Licence to possess Schedule 1 and Schedule 2 controlled drugs
3) Licence to possess Schedule 3 and Schedule 4 drugs.
The licences must be applied for annually and can be applied for through the IMB’s Pharmatrust
Website https://pharmatrust.imb.ie.
2: Determine the supplier for the required drug and contact the supplier to confirm whether the drug
is controlled or not controlled, including the expected time of delivery, price, carriage and cost of a
controlled licence where appropriate.
3: Fill out the order as detailed in SOP AP8 for both the controlled or non-controlled drugs and send
the order to the supplier according to SOP AP8.
4: A licence to import a controlled drug must be applied for through the IMB’s Pharmatrust Website
https://pharmatrust.imb.ie.
5: Log into IMB’s Pharmatrust Website and add the number of vials of the preparation you are
getting, e.g. if you want 1 ampoule of Anhydroecgonine Methyl ester 1mg/ml enter 1 in the quantity
box (Figure 7.1)

128
Figure 7.1: Pharmatrust Website https://pharmatrust.imb.ie
6: If you have more substances/preparations to apply for repeat the above again. When finished
click on submit application. An email will be sent to the license holder (Principal Biochemist) when
application has been successfully submitted.
7: When the application has been approved a “Certificate of Licence to Import” and the “Licence to
import” will be sent to the annual Licence holder. The Certificate of Licence to import should be sent
to the supplier along with a cover letter referencing the purchase order no of the controlled drug
order.
8: When the controlled drugs are received into the Laboratory, the back of the Licence to Import
should be filled in when the controlled drugs have been received in the Laboratory according to the
instructions detailed on the back of the form.
9: The controlled drugs are recorded in the (CHEOPS) Server in the folder \Controlled
Drugs\Controlled Standards Log and are stored securely and as directed.

129
10: Any Certificates of Analysis received with the drug substances should be filed in the Drug
Substances Certificate of Analysis Folder. To find the licence numbers of annual NDTC licences,
click on the “My Quotas” tab in pharmatrust.
7.1.3 Analysis: Controlled Drugs Tracking
7.1.4 Implementation: Controlled Drugs Tracking
7.1.5 Control: Controlled Drugs Tracking

130
7.2 Phase II: Process 7: The Instrument Maintenance Processes for
the Analysers
The successful deployment of the North West Analytical (NWA) Statistical Analysis, Electronic
Reporting Section, and Sample Reference Log projects have addressed some issues initially
identified by the customer in regards to this process problem and will be re-examined after the
Controlled Drugs Tracking project is completed.
7.2.1 Define: The Instrument Maintenance Processes for the Analysers
All samples that are processed as part of a batch by the analysers are recorded in a TF3 form which
is generated by Labware LIMS (Figure 7.2).
Figure 7.2: TF3 Analyser Batch Form
7.2.2 Measure: The Instrument Maintenance Processes for the Analysers
The TF3 form may be incorporated into the Electronic Reporting Section project and this will negate
the need for a LSS intervention as all issues initially identified will be addressed.
1: On delivery, each reagent kit box is checked ensuring the expiry date is in date and acceptable to
the Senior Biochemist in Routine Testing. The reagent boxes should be initialled and dated by a
Biochemist and are stored in the cold room. The delivery docket received must be given to the
Senior Biochemist in Routine Testing.

131
2: When a new reagent is required for the analyser, both reagents labelled R1 and R2 are removed
from their boxes and labelled with identical barcodes. The reagent barcodes are found on the
Calibrator/Reagent barcode roll in the main Laboratory.
3: Both reagents are prepared as per manufacturer’s instructions (refer to kit inserts).
4: Once reagents are prepared, the following is handwritten on the reagent bottles:
• Date prepared
• Expiry date
• LOT number
• Initials of Biochemist who prepared the reagent
5: The prepared reagents are stored in Fridge 5 located in the main Laboratory until required for use
on the analysers. When the new reagents are ready to be used on the analysers the “in use” date
must be recorded on the R1 and R2 reagent bottles.
6: One clean dry bottle is used for each RI and R2 reagent. The Reagent bottles come in various
sizes (30ml, 60ml, and 120ml) and the size of bottle used depends on the volume of reagent used
daily.
7: The R1 / R2 reagent is poured into the corresponding R1 and R2 labelled bottles for each test.
Each bottle should be filled to the maximum volume mark and NEVER above this mark.

132
8: Ensure the analyser is in ‘Standby mode’. Remove the Reagent R1 and R2 covers. Remove any
old reagent bottles and insert the new reagent R1 and R2 bottles into their assigned positions on the
carousel; these are as shown in (Table 7.1).
Test Positions
Opiate 1
Benzodiazepines 3
Cannabis 5
Amphetamine 6
Cocaine 7
Creatinine 9
Alcohol 11
6-Acetyl Morphine 10
EDDP 48
Table 7.1: Reagent bottles and their assigned positions in the Analyser Carousel
9: When the checking process is being performed the reagent status screen shows a red box
indicating that checking is being performed. A blue screen appears when it has finished checking
the reagents and states “Checked”.
10: On the reagent status screen, click on test display icon. A test orientated screen appears which
shows the position, volume of reagent in ml and number of shots available for all reagents. If a
reagent is in the incorrect position, a yellow line will appear through the reagent.
11: The reagents are now ready for calibration, attach CF3 to the AU2700 Weekly Calibration and
Maintenance sheet (CF1) or to the AU2700 Calibration Sheet (CF2) depending on what
circumstance the reagent is being changed. Reasons for any change must be recorded on the CF2
form.
12: If the new reagent has a different LOT number from the previous reagent used refer to SOP
TP23, as statistical calculations will need to be updated.
7.2.3 Analysis: The Instrument Maintenance Processes for the Analysers
7.2.4 Implementation: The Instrument Maintenance Processes for the Analysers
7.2.5 Control: The Instrument Maintenance Processes for the Analysers

133
7.3 Phase II: Process 8: Analyser Calibration
At the end of each day details of what has happened on the Analysers must be recorded. The
analyser software does not facilitate the export of this information into Labware LIMS. The analysers
contain only the past 30 days of records all older records is deleted. The information is recorded on
paper forms at the end of each day.
7.3.1 Define: Analyser Calibration
There are a total of 6 forms that must be completed at the each day for each Analyser. If the forms
were electronically recorded it would get negate the need for paper records, ideally if the software
used by the Analyser could send the data directly to Labware LIMS it would save the need to record
the data manually on paper.
7.3.2 Measure: Analyser Calibration
7.3.3 Analysis: Analyser Calibration
7.3.4 Implementation: Analyser Calibration
7.3.5 Control: Analyser Calibration

134
7.4 Phase II: Process 9: The Recording of Laboratory Telephone
Enquiry Calls
7.4.1 Define: The Recording of Laboratory Telephone Enquiry Calls
The current process is to record these by hand on a printed MS Word document form (LR04). These
forms are collated on a MS Excel Spread sheet and a monthly Analysis performed by the Laboratory
Customer Service department, over 200 calls a month. A report is generated and presented to the
board each month.
It is envisioned that an electronic form could be produced to replace LR04 form currently used to
record information about Telephone Enquiry Calls and the results could be recorded directly into
LIMS and a report Generated for the board.
7.4.2 Measure: The Recording of Laboratory Telephone Enquiry Calls
7.4.3 Analysis: The Recording of Laboratory Telephone Enquiry Calls
7.4.4 Implementation: The Recording of Laboratory Telephone Enquiry Calls
7.4.5 Control: The Recording of Laboratory Telephone Enquiry Calls

135
7.5 Phase II: Process 10: Confirmatory Analysis
7.5.1 Define: Confirmatory Analysis
Currently all reports are printed off for testing a Confirmatory Analysis list of samples on the LCMs or
the GCMS, it is hoped that these could go back into Labware LIMS and be stored digitally.
7.5.2 Measure: Confirmatory Analysis
The successful deployment of the LSS intervention Electronic Reporting Section will accommodate
the electronic recording of Confirmatory Analysis Reports.
7.5.3 Analysis: Confirmatory Analysis
7.5.4 Implementation: Confirmatory Analysis
7.5.5 Control: Confirmatory Analysis

136
Appendix II: Laboratory Forms and Documentation
Process 1: TF4 Form used to Record Specimen Sample Reference logs
Figure 7.3 New Sample Reference Log TF4 Form

137
Process 3: North West Analytical (NWA) Statistical Analysis
Figure 7.4: NWA TF12 – QC Control Study Statistics Record Form

138
Process 3: North West Analytical (NWA) Statistical Analysis
Figure 7.5: New NWA TF12 Form

139
Process 3: North West Analytical (NWA) Statistical Analysis
Figure 7.6: New NWA CF3 Form

140
Appendix III: Basic Flowchart Shapes
Figure 7.7: Standard Flowchart Symbols and Their Usage (Edrawsoft, 2013)

141
Appendix IV: Diagram of Dissertation

142
Appendix V: Process 3: North West Analytical (NWA) Statistical
Analysis Module '**************************************************************************************************************** '****** This subroutine finds all samples and bracketing QC samples for the selected sample. '****** Its purpose is to build a folder so that the user can see the samples and its associated QCs '****** In general, QC samples are used for the samples that ran before it and for the samples that '****** run after it '**************************************************************************************************************** ClearArray("res") 'FieldArray structure: '1 FieldName '2 FieldLabel '3 DataType (Text, Number, Integer, Boolean, List, File, Date, Time, Title, DateTime) '4 DefaultValue '5 LinkTable '6 MaxSize '7 ListName '8 EntryMode (UserEntry, MandatoryEntry, DisplayOnly, TitleEntry) '9 DependsOn '10 FormulaSub formName = "QC_FOLDER" title = "QC Control Samples Selection Criterio" width = 400 height = 400 clinicID = "" 'fieldsArray[1,1] = "PROJECT" 'fieldsArray[1,2] = "Project" 'fieldsArray[1,3] = "Text" 'fieldsArray[1,4] = "" 'fieldsArray[1,5] = "PROJECT" 'fieldsArray[1,8] = "MandatoryEntry" 'fieldsArray[2,1] = "ANALYSER" 'fieldsArray[2,2] = "Analyser" 'fieldsArray[2,3] = "List" ''fieldsArray[2,7] = "" 'fieldsArray[2,8] = "MandatoryEntry" 'fieldsArray[2,10] = "ANLYSR_LS2" 'fieldsArray[3,1] = "SHOW" 'fieldsArray[3,2] = "Show" 'fieldsArray[3,3] = "List" 'fieldsArray[3,4] = "ALL" 'fieldsArray[3,7] = "SHOW_QCS" 'fieldsArray[3,8] = "MandatoryEntry" 'fieldsArray[4,1] = "NUM_SAMP" 'fieldsArray[4,2] = "Number of Samples" 'fieldsArray[4,3] = "Integer" 'fieldsArray[4,4] = "10" 'fieldsArray[4,7] = "" 'fieldsArray[4,8] = "MandatoryEntry" 'CreateDialog(formName, title, fieldsArray, "valuesArray", "QC_FOLDER", width, height) status = UserDialog("QC_PROJECT", "valuesArray", , ,) IF (dialogcanceled) THEN Return "0" ENDIF proj = valuesArray[ 1 ] inst = valuesArray[ 2 ] type = valuesArray[ 3 ] numSmps = valuesArray[ 4 ]

143
analName = valuesArray[5] projTemp = Select Project.template Where Name = proj Order by template q = "" q = q + "select r.sample_number, r.result_number " q = q + "from sample s, result r, test t " q = q + "where s.sample_number = r.sample_number " q = q + " and s.sample_number = t.sample_number " q = q + " and t.test_number = r.test_number " q = q + " and r.status in ( 'E', 'M', 'A','R' ) " q = q + " and s.project = '" + str(proj) + "' " IF (projTemp <> "QC_TEMP") Then q = q + " and t.instrument = '" + str(inst) + "' " ENDIF if (type="OK") then q = q + " and r.in_spec = 'F' " endif if (type="EXCLUDED") then q = q + " and r.in_spec = 'T' " endif If (notEMPTY(analName)) Then q = q + " and t.Analysis = '" + analName + "'" Endif q = q + "order by t.prep_date desc " SQL( q, "rLst" ) num = ubound( rLst, 1 ) oldSmp = 0 smpCnt = 0 resString = "" for i = 1 to num smp = rLst[ i, 1 ] if (oldSmp<>smp) then oldSmp = smp smpCnt = smpCnt + 1 endif if (smpCnt<=numSmps) then res[ i ] = rLst[ i, 2 ] resString = resString + rLST[i,2] + "|" endif next i if (numSmps>smpCnt) then msgbox( "Warning: Only " + str(smpCnt) + " QCs found" ) endif return restring CODE for subroutine: MNU_FM_HIS_DATA' =============================================================================== ' - PRODUCT_SPEC.DESCRIPTION ("SD = ...") ' - PRODUCT_SPEC.LO_CONTROL_1 (Mean - 2SD) ' - PRODUCT_SPEC.HI_CONTROL_1 (Mean + 2SD) ' =============================================================================== status = clearArray("alst") status = clearArray("arr") status = clearArray("clst") status = clearArray("gradeFields") status = clearArray("gradeValues") status = clearArray("iLst") status = clearArray("parameters") status = clearArray("prodFieldName") status = clearArray("prodFieldValue") status = clearArray("specFieldNameArray") status = clearArray("specFieldValueArray")

144
status = clearArray("stageFields") status = clearArray("stageValues") status = clearArray("xValues") status = clearArray("yValues") status = clearArray("Values") status = CanAccessFunction( "DTCBQCSpecUpdate" ) if (status=false) then txt = "You do not have access to this function." + chr(10) + chr(13) + chr(10) + chr(13) txt = txt + "Please contact the LIMS administrator" msgbox( txt ) return endif if (selectedFolder<>"QC_PROJECT") then msgbox( "Error: Wrong folder type" ) return endif class = select folder.object_class if (class<>"RESULT") then msgbox( "Error: Folder must be a RESULT folder" ) return endif chartNo = getIncrement( "CHART_NO" ) prod = select sample.product proj = select sample.project if (isEmpty(prod)) then msgbox( "Error: QC sample must be associated with a product" ) return endif ' Make sure that the selected results are stored in the folder table ' ===================================================== performWindowMethod( , "save" ) ' Get the possible Analysis ' ====================== q = "" q = q + "select distinct r.Analysis " q = q + "from folder_objects fo, result r " q = q + "where fo.object_id = r.result_number " q = q + " and fo.folder = '" + selectedFolder + "' " q = q + "order by 1 " numA = SQLSelect( q, "Which Analysis", "aLst", "T" ) status = OpenProgressDialog( "Calculation Progress", "Processing", "T") for i = 1 to numA anl = aLst[ i, 1 ] per = i / numA * 100 status = UpdateProgressDialog( anl, per ) ' Get the result records... ' =================== q = "" q = q + "select r.result_number, t.prep_date, r.entry, t.instrument, r.sample_number " q = q + "from folder_objects fo, result r, test t " q = q + "where fo.object_id = r.result_number " q = q + " and r.test_number = t.test_number " q = q + " and fo.folder = '" + selectedFolder + "' " q = q + " and t.Analysis = '" + anl + "' " q = q + " and t.status = 'A'" q = q + "order by t.prep_date, r.result_number " SQL( q, "rLst" ) num = ubound( rLst, 1 ) ClearArray("res") ClearArray("xValues")

145
ClearArray("yValues") ClearArray("parameters") ClearArray("values") for j = 1 to num res[ j ] = rLst[ j, 1 ] xValues[ j ] = rLst[ j, 2 ] yValues[ j ] = rLst[ j, 3 ] next j ' Sort out the chart labels etc ' ======================= inst = rLst[ 1, 4 ] SQL( "select description from instruments where name = '" + str(inst) + "' ", "iLst" ) instLabel = iLst[ 1, 1 ] comment = str(instLabel) + ", QC Type: " + str(prod) + ", Lot: " + str(proj) + ", Test: " + str(anl) parameters[ 2 ] = "yVariableDescription" values[ 2 ] = comment parameters[ 1 ] = "xVariableDescription" values[ 1 ] = "Date" ' Add project comments ' =================== q = "" q = q + "select chart_comment " q = q + "from x_project_comments " q = q + "where project = '" + str(proj) + "' " q = q + "order by order_number desc " SQL( q, "cLst" ) title = cLst[ 1, 1 ] if (isEmpty(title)) then title = "" endif ' Open the histogram (hidden) ' ================= inc = getIncrement( "HISTOGEN" ) histo = "CHART" + str(anl) + str(inc) ' Make sure each time we run we get a different chart object status = HistogramChartOpen( histo, yValues, comment, , , "T" ) ' status = HistogramChartOpen(name,chartPoints,title,parameters,values, hide) if (status=false) then msgbox( lastError ) endif wait( 1 ) status = HistogramChartCalculations( histo ) if (status=false) then msgbox( lastError ) else lowerCapabilityLimit = RoundTo(lowerCapabilityLimit, 2) measurementMean = RoundTo(measurementMean, 2) upperCapabilityLimit = RoundTo(upperCapabilityLimit, 2) standardDeviation = RoundTo(standardDeviation, 2) ' Store the calcs in a temporary table ' ============================== q = "" q = q + "insert into x_histo_calcs " q = q + "(chart_no, project, instrument, Analysis, lower_limit, mean_value, upper_limit, standard_dev, num_qcs ) " q = q + "values " q = q + "( " + str(chartNo) + ", '" + str(proj) + "', '" + str(inst) + "', '" + str(anl) + "', " + str(lowerCapabilityLimit) + ", " + str(measurementMean) + ", " + str(upperCapabilityLimit) + ", " + str(standardDeviation) + ", " + str(numberOfSamples) + " ) " SQL( q ) ' Store the samples used in calculating the stats ' =======================================

146
for j = 1 to num resNo = rLst[ j, 1 ] smpNo = rLst[ j, 5 ] q = "" q = q + "insert into x_histo_results " q = q + "(chart_no, sample_number, result_number ) " q = q + "values " q = q + "( " + str(chartNo) + ", " + str(smpNo) + ", " + str(resNo) + " ) " SQL( q ) next j endif next i closeProgressDialog() q = "" q = q + "select Analysis, lower_limit as '-3SD', mean_value, upper_limit as '+3SD', standard_dev as 'SD', num_qcs " q = q + "from x_histo_calcs " q = q + "where chart_no = " + str(chartNo) num = SQLSelect( q, "Select Tests to Update", "arr", "T" ) status = ClearArray("specFieldNameArray") status = ClearArray("specFieldValueArray") status = ClearArray("stageFields") status = ClearArray("stageValues") status = ClearArray("gradeFields") status = ClearArray("gradeValues") for i = 1 to num anl = arr[ i, 1 ] minVal = arr[ i, 2 ] nomVal = arr[ i, 3 ] maxVal = arr[ i, 4 ] standardDeviation = arr[ i, 5 ] ' Ian Snell 05/03/2008 ' Round to 2 decimal places ' ======================= minVal = RoundTo(minVal, 2) nomVal = RoundTo(nomVal, 2) maxVal = RoundTo(maxVal, 2) specFieldNameArray[ i, 1 ] = "PRODUCT" specFieldNameArray[ i, 2 ] = "CLASS" specFieldNameArray[ i, 3 ] = "GRADE" specFieldNameArray[ i, 4 ] = "STAGE" specFieldNameArray[ i, 5 ] = "SPEC_TYPE" specFieldNameArray[ i, 6 ] = "SAMPLING_POINT" specFieldNameArray[ i, 7 ] = "ANALYSIS" specFieldNameArray[ i, 8 ] = "COMPONENT" specFieldNameArray[ i, 9 ] = "RULE_TYPE" specFieldNameArray[ i, 10 ] = "MIN_VALUE" specFieldNameArray[ i, 11 ] = "MAX_VALUE" specFieldNameArray[ i, 12 ] = "NOMINAL_VALUE" specFieldNameArray[ i, 13 ] = "SPEC_RULE" specFieldNameArray[ i, 14 ] = "X_CHART_NO" specFieldNameArray[ i, 15 ] = "DESCRIPTION" specFieldNameArray[ i, 16 ] = "LO_CONTROL_1" specFieldNameArray[ i, 17 ] = "HI_CONTROL_1" specFieldValueArray[ i, 1 ] = prod specFieldValueArray[ i, 2 ] = "R" specFieldValueArray[ i, 3 ] = inst specFieldValueArray[ i, 4 ] = "NONE" specFieldValueArray[ i, 5 ] = "NONE" specFieldValueArray[ i, 6 ] = "NONE" specFieldValueArray[ i, 7 ] = anl specFieldValueArray[ i, 8 ] = "Result Value" specFieldValueArray[ i, 9 ] = "N" specFieldValueArray[ i, 10 ] = minVal specFieldValueArray[ i, 11 ] = maxVal specFieldValueArray[ i, 12 ] = nomVal specFieldValueArray[ i, 13 ] = "MIN <= Result <= MAX" specFieldValueArray[ i, 14 ] = chartNo

147
specFieldValueArray[ i, 15 ] = "SD = " & str(standardDeviation) specFieldValueArray[ i, 16 ] = val(nomVal) - (2 * standardDeviation) specFieldValueArray[ i, 17 ] = val(nomVal) + (2 * standardDeviation) stageFields[ i, 1 ] = "PRODUCT" stageFields[ i, 2 ] = "GRADE" stageFields[ i, 3 ] = "SAMPLING_POINT" stageFields[ i, 4 ] = "STAGE" stageFields[ i, 5 ] = "SPEC_TYPE" stageFields[ i, 6 ] = "ANALYSIS" stageValues[ i, 1 ] = prod stageValues[ i, 2 ] = inst stageValues[ i, 3 ] = "NONE" stageValues[ i, 4 ] = "NONE" stageValues[ i, 5 ] = "NONE" stageValues[ i, 6 ] = anl next i gradeFields[ 1 ] = "PRODUCT" gradeFields[ 2 ] = "GRADE" gradeFields[ 3 ] = "SAMPLING_POINT" gradeValues[ 1 ] = prod gradeValues[ 2 ] = inst gradeValues[ 3 ] = "NONE" if (num>0) then status = UpdateProduct( prod, , , gradeFields, gradeValues, stageFields, stageValues, specFieldNameArray, specFieldValueArray, "UPDATE", "T" ) if (status) then txt = str(prod) + " new version created" + chr(10) + chr(13) + chr(10) + chr(13) + "Do you want to make it active?" ans = PromptForYesNo( txt ) if (ans="Yes") then prodFieldName[ 1 ] = "ACTIVE" prodFieldValue[ 1 ] = true promptText = "Enter Audit Reason" status = PromptForAuditReason(promptText, "PRODUCT") status = UpdateProduct( prod, prodFieldName, prodFieldValue, , , , , , , "UPDATE", "F" ) if (status) then txt = str(prod) + " is now active" msgbox( txt ) else msgbox( lastError ) endif endif else msgbox( lastError ) endif endif

148
Appendix VI: Sysnergy Health - Cut Off Levels (Urine samples)
Figure 7.9: Synergy Health - Cut Off Levels (Urine samples) (Synergy Health Laboratory Services,
2012)

149
Appendix VII: Process 4: Code For Electronic Reporting Module
SUBROUTINE REP_CLIN_C_S This routine prompts the user for report criteria the report itself is genearted in the validation subroutine for the dialog (VAL_REP_CL) '**************************************************************************************************************** '****** Created 21/12/2005 I. Snell '**************************************************************************************************************** 'FieldArray structure: '1 FieldName '2 FieldLabel '3 DataType (Text, Number, Integer, Boolean, List, File, Date, Time, Title, DateTime) '4 DefaultValue '5 LinkTable '6 MaxSize '7 ListName '8 EntryMode (UserEntry, MandatoryEntry, DisplayOnly, TitleEntry) '9 DependsOn '10 FormulaSub formName = "RE_CLINIC" title = "Please Enter Details" width = 687 height = 476 clinicID = "" fieldsArray[1,1] = "CLINIC_ID" fieldsArray[1,2] = "Clinic ID" fieldsArray[1,3] = "Text" fieldsArray[1,4] = ClinicId fieldsArray[1,5] = "X_CLINIC" fieldsArray[1,8] = "MandatoryEntry" fieldsArray[2,1] = "PER_PAGE" fieldsArray[2,2] = "One patient per page?" fieldsArray[2,3] = "Boolean" fieldsArray[2,8] = "UserEntry" fieldsArray[2,9] = "CLINIC_ID" fieldsArray[2,10] = "SET_PRIN" fieldsArray[3,1] = "REP_TYPE" fieldsArray[3,2] = "Report Type" fieldsArray[3,3] = "List" fieldsArray[3,7] = "REP_TYPE" fieldsArray[3,8] = "MandatoryEntry" fieldsArray[4,1] = "START_DATE" fieldsArray[4,2] = "Start date" fieldsArray[4,3] = "Date" fieldsArray[4,4] = date() fieldsArray[4,8] = "UserEntry" fieldsArray[5,1] = "END_DATE" fieldsArray[5,2] = "End date" fieldsArray[5,3] = "Date" fieldsArray[5,4] = Date() fieldsArray[5,8] = "UserEntry" fieldsArray[6,1] = "STATS" fieldsArray[6,2] = "Include Statistics?" fieldsArray[6,3] = "Boolean" fieldsArray[6,4] = "T" fieldsArray[6,8] = "UserEntry" fieldsArray[7,1] = "FIRST_ID" fieldsArray[7,2] = "First Barcode" fieldsArray[7,3] = "Text" fieldsArray[7,4] = "" fieldsArray[7,5] = "DTCB_BARCODE" fieldsArray[7,8] = "UserEntry" fieldsArray[8,1] = "LAST_ID" fieldsArray[8,2] = "Last Barcode" fieldsArray[8,3] = "Text" fieldsArray[8,4] = "" fieldsArray[8,5] = "DTCB_BARCODE" fieldsArray[8,8] = "UserEntry" fieldsArray[9,1] = "CHAIN_CUST" fieldsArray[9,2] = "Include Chain Of Custody Statement?" fieldsArray[9,3] = "Boolean" fieldsArray[9,4] = "F"

150
fieldsArray[9,8] = "UserEntry" fieldsArray[10,1] = "X_PRINT" fieldsArray[10,2] = "Print" fieldsArray[10,3] = "Text" fieldsArray[10,8] = "DisplayOnly" fieldsArray[10,9] = "CLINIC_ID" fieldsArray[10,10] = "GET_PRINT_DT" ' status = CreateDialog(formName, title, fieldsArray, "valuesArray", "VAL_REP_CL_S", width, height) status = CreateDialog(formName, title, fieldsArray, "valuesArray", "VAL_REP_PDF", width, height) IF (dialogcanceled) THEN Return ENDIF SUBROUTINE REP_CLIN_PDF status = UserDialog( "FIND_PDF", "void", , , "T" ) USER DIALOG find_pdf trayDate = select find_pdf.tray_on if (isEmpty(trayDate)) then return endiftDate = left(str( trayDate ), 10 ) ' SQL( "select tray_id from x_trays where tray_id like '" + tDate + "%' order by tray_id ", "lst" ) q = "" q = q & "select distinct s.x_tray " q = q & "from sample s, x_reports r " q = q & "where s.report_number = r.report_number " q = q & " and r.ext_link is not null " q = q & " and s.x_tray like '" + tDate + "%' " q = q & "order by s.x_tray " SQL( q, "lst" ) return lst SUBROUTINE VAL_FIND_PDF path = "\\cheops\lab_documents\" clinic = select find_pdf.clinic chart = select find_pdf.chart barcode = select find_pdf.barcode startDate = select find_pdf.from endDate = select find_pdf.to tray = select find_pdf.tray IF ( isEmpty(clinic) and isEmpty(chart) and isEmpty(barCode) and isEmpty(tray) and isEmpty(startDate) and isEmpty(endDate) ) THEN RETURN true ENDIF ' Find the matching reports ' ===================== q = "" q = q & "select distinct s.report_number, r.changed_on as [Printed On], r.description, r.clinic, r.ext_link " q = q & "from sample s, x_reports r " q = q & "where s.report_number = r.report_number " q = q & " and r.ext_link is not null " IF (isEmpty(clinic)=false) THEN q = q & " and r.clinic = '" & str(clinic) & "' " ENDIF IF (isEmpty(chart)=false) THEN q = q & " and s.x_patient = '" & str(chart) & "' " ENDIF IF (isEmpty(barcode)=false) THEN q = q & " and s.text_id = '" & str(barcode) & "' " ENDIF IF (isEmpty(tray)=false) THEN q = q & " and s.x_tray = '" & str(tray) & "' " ENDIF IF (isEmpty(startDate)=false) THEN q = q & " and r.changed_on > " & OdbcDateTimeStamp( startDate ) ENDIF IF (isEmpty(endDate)=false) THEN q = q & " and r.changed_on < " & OdbcDateTimeStamp( endDate ) ENDIF q = q & " order by 2 desc " SQL( q, "reportArr" ) num = ubound( reportArr, 1 ) IF (num=0) THEN txt = "No reports found" msgbox( txt ) RETURN false ENDIF

151
number = SQLSelect( q, "Select a report(s) to View", "repArr", "T",, "F") IF (number>0) THEN FOR i = 1 to number file = repArr[ i, 5 ] fullFilePath = str(path) & str(file) status = ShellCommand( fullFilePath, "OPEN", "F" ) NEXT i ENDIF RETURN false SUBROUTINE VAL_REP_PDF clinicID = select re_clinic.clinic_id repType = select re_clinic.rep_typeperPage = select re_clinic.per_page stats = select re_clinic.stats startDate = select re_clinic.start_date endDate = select re_clinic.end_date recdflag = select re_clinic.recd_flag chncust = select re_clinic.CHAIN_CUST ' Changed IGS 17/01/2006 ' ===================== secs = (24 * 60 * 60) - 1 endDate = DateTimeAdd( endDate, secs ) ' endDate = DateAdd(endDate, 1) startDateODBC = OdbcDateTimeStamp(startDate) endDateODBC = OdbcDateTimeStamp(endDate) first = select re_clinic.first_id last = select re_clinic.last_id IF (repType="BARCODE") THEN if ( (isEmpty(first)=false) and (isEmpty(last)=false) ) then if (first>last) then msgbox( "Invalid barcode range (last<first)" ) return false endif q1 = "select count(*) " q2 = "from sample " q3 = "where text_id between '" q4 = str(first) + "' and '" + str( last ) + "' " q5 = " and x_clinic <> '" + str(clinicID) + "' " ' IGS: 18-04-2011 ' ============= q6 = " and sample_number > 0 " q = q1 + q2 + q3 + q4 + q5 + q6 status = SQL(q,"cLst") cnt = cLst[ 1, 1 ] if (cnt>0) then msgbox( "Invalid barcode range (samples from wrong clinic)" ) return false endif selSampQuery = "SELECT DISTINCT TEXT_ID FROM SAMPLE " selSampQuery = selSampQuery & " WHERE text_id between '" + str(first) + "' and '" + str(last) + "' " else msgbox( "Invalid barcode range" ) return false endif reportTxt = "BARCODE: " & str(first) & " - " & str(last) ELSEIF (repType = "SAMPLE") THEN selSampQuery = "SELECT DISTINCT BARCODE FROM REPORT_RESULTS " selSampQuery = selSampQuery & " WHERE [Clinic] = '" & clinicID & "'" selSampQuery = selSampQuery & " AND [DATE SAMPLED] >= " & startDateODBC selSampQuery = selSampQuery & " AND [DATE SAMPLED] < " & endDateODBC reportTxt = "SAMPLED DATE: " & str(startDate) & " - " & str(endDate) ELSEIF (repType = "TEST_INC") THEN selSampQuery = "select distinct s.text_id, s.status " selSampQuery = selSampQuery & "from sample s, result r " selSampQuery = selSampQuery & "where s.x_clinic = '" + clinicID + "' " selSampQuery = selSampQuery & "and s.text_id = r.text_id " selSampQuery = selSampQuery & "and " selSampQuery = selSampQuery & "( (r.entered_on between " + startDateODBC + " AND " + endDateODBC+ ") " selSampQuery = selSampQuery & " or ( (s.status='U' ) and (s.login_date between " + startDateODBC + " AND " + endDateODBC + ")) " selSampQuery = selSampQuery & ") " reportTxt = "TESTED DATE (inc U): " & str(startDate) & " - " & str(endDate) ELSEIF (repType = "TEST") THEN miniHost = false if (miniHost) then

152
selSampQuery = "SELECT DISTINCT BARCODE FROM REPORT_RESULTS " selSampQuery = selSampQuery & " WHERE [Clinic] = '" & clinicID & "'" selSampQuery = selSampQuery & " AND ( " selSampQuery = selSampQuery & " (tested_date >= " & startDateODBC & " AND tested_date < " & endDateODBC + ") " ' Include none-compliance samples ' ==================================================== selSampQuery = selSampQuery & " or " selSampQuery = selSampQuery & " ( (tested_date is null) and ([Date Sampled] >= " & startDateODBC & " AND [Date Sampled] < " & endDateODBC + ") )" selSampQuery = selSampQuery & " ) " else selSampQuery = "select distinct s.text_id " selSampQuery = selSampQuery & " from sample s, result r " selSampQuery = selSampQuery & " where s.x_clinic = '" & clinicID & "' " selSampQuery = selSampQuery & " and s.text_id = r.text_id " selSampQuery = selSampQuery & " and r.entered_on between " & startDateODBC & " and " & endDateODBC endif reportTxt = "TESTED DATE: " & str(startDate) & " - " & str(endDate) ELSE msgbox("No report type selected.") ' Keep the dialog open ' ================== return false ENDIF status = SQL(selSampQuery, "arraySampTextID", 0, "F") numSamp = UBOUND(arraySampTextID, 1) ' Don't generate the report if there are no samples ' ========================================= IF (numSamp = 0) THEN msg = "No samples." msgbox(msg) ' Keep the dialog open ' ================== return false ELSE ' Generate a report number and file name ' ================================ path = "\\CHEOPS\LAB_DOCUMENTS\" status = DirExists( path ) IF (status=false) THEN status = DirNew( path ) ENDIF reportNumber = getIncrement( "gClinicReport" ) id = "00000000" & str(reportNumber) id = right( id, 8 ) fileName = str( id ) & ".pdf" fullFileName = str( path ) & str( id ) & ".pdf" clearArray( "keyFields" ) clearArray( "keyValues" ) clearArray( "fieldsArr" ) clearArray( "valuesArr" ) keyFields[ 1 ] = "REPORT_NUMBER" keyValues[ 1] = reportNumber fieldsArr[ 1 ] = "DESCRIPTION" fieldsArr[ 2 ] = "CLINIC" fieldsArr[ 3 ] = "EXT_LINK" valuesArr[ 1 ] = str(reportTxt) valuesArr[ 2 ] = str(clinicID) valuesArr[ 3 ] = str(fileName) status = InsertTable( "X_REPORTS", keyFields, keyValues, fieldsArr, valuesArr ) strSampIDText = "" textIDcsv = "" reportName = "FINAL_CLINIC" '** CC 2005-09-04 Build string list of text_ids for i = 1 to numSamp strSampIDText = strSampIDText & arraySampTextID[i,1] & "|" next i '** CC 2005-09-04 Remove last "|" lenSampIDText = len(strSampIDText) - 1 strSampIDText = left(strSampIDText, lenSampIDText) status = ClearArray("argArray") status = ClearArray("valArray") argArray[1] = "@PrintUser" argArray[2] = "REPORT_RESULTS.BARCODE"

153
argArray[3] = "@start_date" argArray[4] = "@end_date" argArray[5] = "@stats" argArray[6] = "@rep_type" argArray[7] = "@NewPage" argArray[8] = "@firstBarcode" argArray[9] = "@lastBarcode" 'argArray[10] = "@RecdFlag" argArray[10] = "@showChainOfCustody" argArray[11] = "VERSIONS.TABLE_NAME" argArray[12] = "SAMPLE.TEMPLATE" argArray[13] = "@reportID" valArray[1] = USER valArray[2] = strSampIDText valArray[3] = startDate valArray[4] = endDate valArray[5] = stats valArray[6] = repType valArray[7] = perPage valArray[8] = first valArray[9] = last 'valArray[10] = recdflag valArray[10] = chncust valArray[11] = "ANALYSIS" valArray[12] = "DAIS|INT_LAB|ROUTINE" valArray[13] = reportNumber printerName = "" status = RunReport(reportName, argArray, valArray, fullFileName, printerName ) ShellCommand( fullFileName, "OPEN", "F" ) IF (status=true) THEN FOR i = 1 TO numSamp txtID = arraySampTextID[ i, 1 ] q = "" q = q & "UPDATE SAMPLE " q = q & "SET REPORT_NUMBER = " & str(reportNumber) & " " q = q & "WHERE TEXT_ID = '" & str(txtID) & "' " q = q & " AND REPORT_NUMBER = 0 " IF (user<>"SNELLI") THEN status = SQL( q, "void" ) IF (status=false) THEN msgbox( lastError ) ENDIF ENDIF NEXT i ENDIF ENDIF ' Keep the dialog open ' ================== return false

154

155
Appendix VIII: Process 4: Electronic Reporting Section - Oasis New
Storage Boxes 2012
Barcode Alternate
Code Add Date Status Date
538363 325 02/04/2012 02/04/2012
538364 326 02/04/2012 02/04/2012
538365 327 02/04/2012 02/04/2012
538366 328 02/04/2012 02/04/2012
538367 329 02/04/2012 02/04/2012
538368 330 02/04/2012 02/04/2012
538369 331 02/04/2012 02/04/2012
538373 335 02/04/2012 02/04/2012
538404 QR7 02/04/2012 02/04/2012
538405 QR8 02/04/2012 02/04/2012
538374 336 02/04/2012 02/04/2012
538375 337 02/04/2012 02/04/2012
538376 338 02/04/2012 28/05/2013
538391 CS21 02/04/2012 28/05/2013
538392 CS22 02/04/2012 28/05/2013
538370 332 02/04/2012 02/04/2012
538371 333 02/04/2012 02/04/2012
538372 334 02/04/2012 02/04/2012
538395 CR22 25/07/2012 25/07/2012
723554 CR23 25/07/2012 25/07/2012
723555 CR24 25/07/2012 28/05/2013
538377 339 25/07/2012 28/05/2013
538378 340 25/07/2012 28/05/2013
538379 341 25/07/2012 28/05/2013
538380 342 25/07/2012 28/05/2013
538381 343 25/07/2012 28/05/2013
538382 344 25/07/2012 28/05/2013
538383 345 25/07/2012 28/05/2013
538384 346 25/07/2012 28/05/2013
538385 347 25/07/2012 28/05/2013
538386 348 25/07/2012 28/05/2013
538387 349 25/07/2012 28/05/2013
538393 CR20 25/07/2012 25/07/2012
538394 CR21 25/07/2012 25/07/2012
538403 RR21 05/11/2012 28/05/2013
723556 353 05/11/2012 28/05/2013

156
723557 354 05/11/2012 28/05/2013
723558 355 05/11/2012 28/05/2013
723559 356 05/11/2012 28/05/2013
723560 357 05/11/2012 28/05/2013
723561 358 05/11/2012 28/05/2013
723562 359 05/11/2012 28/05/2013
723641 MED 11 05/11/2012 05/11/2012
723642 MED 12 05/11/2012 05/11/2012
723643 RR 20 05/11/2012 05/11/2012
538388 350 05/11/2012 28/05/2013
538389 351 05/11/2012 28/05/2013
538390 352 05/11/2012 28/05/2013
Figure 7.10: OASIS GROUP 2012 List of Document Boxes Stored offsite

157
Appendix IX: Process 4: Electronic Reporting Section - Oasis New
Storage Boxes 2013
Barcode Alternate
Code Add Date Status Date
723563 360 12/03/2013 28/05/2013
723564 361 12/03/2013 28/05/2013
723565 362 12/03/2013 28/05/2013
723566 363 12/03/2013 28/05/2013
723567 364 12/03/2013 28/05/2013
723568 365 12/03/2013 28/05/2013
723569 366 12/03/2013 28/05/2013
723570 367 12/03/2013 28/05/2013
723571 368 12/03/2013 28/05/2013
723572 369 12/03/2013 28/05/2013
723573 370 12/03/2013 28/05/2013
723574 371 12/03/2013 28/05/2013
723575 72 12/03/2013 28/05/2013
723576 373 12/03/2013 28/05/2013
723577 374 12/03/2013 28/05/2013
723631 00CS24 12/03/2013 28/05/2013
723632 00CS23 12/03/2013 28/05/2013
723644 00CR25 12/03/2013 28/05/2013
723645 00CR26 12/03/2013 28/05/2013
723646 00CR27 12/03/2013 28/05/2013
723647 00CR28 12/03/2013 28/05/2013
723648 00CR29 12/03/2013 28/05/2013
723649 00RR24 12/03/2013 28/05/2013
723650 RR22 12/03/2013 28/05/2013
723651 12/03/2013 28/05/2013
723652 00CS25 12/03/2013 28/05/2013
723653 13 12/03/2013 12/03/2013
Figure 7.11: OASIS GROUP 2013 List of Document Boxes Stored offsite

158
Appendix X: Process 4: Electronic Reporting Section
Figure 7.12: OASIS GROUP Pricing Document

159
Appendix XI: Questionnaire
The use of Lean Six Sigma in the NDTC Laboratory
Questionnaire
Consent by subject for participation in Research Protocol
Protocol Number: ____________________ Subject Name: ________________ Title of Protocol: Can Lean Six Sigma methodologies be used to improve the tracking and reporting systems in the DTCB Laboratory? Principal Investigator: Paul Murray Phone: 01 6488621 You are being asked to participate in a research study. In order to decide whether or not you want to be part of this research study, you should understand enough about its risks and benefits to make an informed judgement. This process is known as informed consent. This consent form gives detailed information about the research study which will be discussed with you. Once you understand the study, you will be asked to sign this form if you wish to participate. I. NATURE OF DURATION OF PROCEDURE(S)
The study will be undertaken by Paul Murray the ICT Manager for the DTCB and the purpose of this study is ascertain your opinion of the control processes currently used in the DTCB Laboratory where Lean Six Sigma was used to improve processes, the Value Stream and reduce waste.
II. POSSIBLE ALTERNATIVES:
You may choose not to participate as participation is voluntary. -----------------------------------------------------------------------------------------------------
AGREEMENT TO CONSENT
The research project and the treatment procedures associated with it have been fully explained to me. All experimental procedures have been identified and no guarantee has been given about the possible results. I have had the opportunity to ask questions concerning any and all aspects of the project and any procedures involved. I am aware that participation is voluntary and that I may withdraw my consent at any time. Confidentiality of records concerning my involvement in this project will be maintained in an appropriate manner. When required by law, the records of this research may be reviewed by government agencies and sponsors of the research. I, the undersigned, hereby consent to participate as a subject in the above described project conducted at the National Drug Treatment Centre. I have received a copy of this consent form for my records. I understand that if I have any questions concerning this research, I can contact the Principal Investigator listed above. If I have any questions concerning my rights in connection with the research, I can contact the Ethics Committee of the Nation Drug Treatment Centre. After reading the entire consent form, if you have no further questions about giving consent, please sign where indicated. Principal Investigator: ___________________ Signature of Subject: ___________________

160
Witness:___________________ Date:___________ Time:________ am/pm (circle)
The use of Lean Six Sigma in the NDTC Laboratory Questionnaire
Below is a List of Improvements to Routine processing system that were
introduced during the Lean Six Sigma Project
· TF4 Removed, ‘batches’ no longer require counting, catalogue clinics and write up, TF4 available at the end of the tray check report · Trays – system now operates using trays and not batches. Samples can be processed from the analysers quicker – Tray approx. 50 samples, batch approx.: 150-200 samples. · Batch paperwork – no longer needs to be check against tray check report by Biochemists · All ‘paperwork’ saved to Server (L:\ Drive) (printed TF4, tray check no longer required). Easy access to reports for checking – no need for the recall of boxes stored offsite. · Electronic reporting: All clinic reports automatically save as PDFs. Reports for LER are saved internally and DAIS reports do not require printing. · All reports processed and can be searched for in Labware LIMS. The need to recall boxes for original reports not required · NWA: Statistical updates are generated automatically. Excel sheet manual calculations & paperwork no longer required, reducing time and errors. · System alerts when QCs are close to expiry dates
· Inventory: Recorded in Labware LIMS, audit trail available, no longer saved to MS Excel
Spread sheets, transcription errors reduced.

161
The use of Lean Six Sigma in the NDTC Laboratory
Questionnaire
Clinical Department: Laboratory
The National Drug Treatment Centre
www.Addictionireland.ie
Description: Questionnaire for the staff of the NDTC Laboratory to ascertain their level of Satisfaction
with the Lean Six Sigma interventions made to the Specimen Sample Process flow.
Participant ID No:
Laboratory Department Role
Agent Name Paul Murray (ICT Manager, NDTC)
Over all how would you rate your level of Satisfaction with…
Very Low Low
Neither
Low nor
High
High Very High
…the levels of communication during the implementation phase of the Lean Six Sigma interventions?
…how the transition from the old system to the new system was implemented?
…your transition of moving from the old system to the new system?
…the usability of the new process changes?
…the reduction in the amount of transcriptions errors?
…the amount of time saving these enhancements have had on how you perform your daily tasks?
…the audit-ability of the new enhancements in relation to accreditation and the ISO 17025 standard?
…how the new process changes have helped working with reduced levels of staff?
…the new process changes in relation to coping with the extra specimen samples the Laboratory receives?
…the levels of staff morale since the new process changes have been deployed?
Would there be a benefit for Lean Six Sigma interventions in other areas of the Laboratory? Yes: No:
If ‘Yes’ Give details
Additional comments:

162
Appendix XII: Statistical Analysis
.
ID Discipline Q1 Q2 Q3 Q4 Q5 Q6 Q7 Q8 Q9 Q10 Q11 Details Comments
1 Lab Aide 4 4 4 4 5 5 4 4 5 3 YES
2 Lab Aide 4 4 4 4 5 5 4 4 5 3 YES
3 Lab Aide 4 5 5 5 4 4 4 2 3 3 YES *
4 Lab Aide 4 4 5 5 4 5 4 4 4 3 YES
5 Lab Aide 3 4 4 4 4 5 3 4 4 4 YES
6 Biochemist 3 3 3 4 4 4 3 4 4 4 NO
7 Biochemist 4 3 3 4 4 5 5 4 4 3 YES ** **
8 Biochemist 3 5 5 5 4 5 4 3 N/A 4 YES * ***
9 Biochemist 4 4 5 5 3 4 4 1 2 3 YES
10 Biochemist 4 4 3 5 4 4 4 3 5 4 YES ****
11 Biochemist 5 5 4 4 N/A 4 4 4 4 3 YES *****
12 Biochemist 4 3 4 4 4 5 5 4 4 4 NO
Table 7.1: Questionnaire Raw Data
R Application Data
Number of cases in table: 12 Number of factors: 2 Test for independence of all factors: Chisq = 1.0286, df = 2, p-value = 0.5979 Chi-squared approximation may be incorrect > DisQ1=table(Discipline,Q1) > DisQ2=table(Discipline,Q2) > DisQ2 Q2 Discipline 3 4 5 Biochemist 3 2 2 Lab Aide 0 4 1 > summary(DisQ2) Number of cases in table: 12 Number of factors: 2 Test for independence of all factors: Chisq = 3.771, df = 2, p-value = 0.1517 Chi-squared approximation may be incorrect > DisQ3=table(Discipline,Q3) > DisQ3 Q3 Discipline 3 4 5

163
Biochemist 3 2 2 Lab Aide 0 3 2 > summary(DisQ3) Number of cases in table: 12 Number of factors: 2 Test for independence of all factors: Chisq = 2.9486, df = 2, p-value = 0.2289 Chi-squared approximation may be incorrect > DisQ4=table(Discipline,Q4) > summary(DisQ4) Number of cases in table: 12 Number of factors: 2 Test for independence of all factors: Chisq = 0.009796, df = 1, p-value = 0.9212 Chi-squared approximation may be incorrect > DisQ5=table(Discipline,Q5) > summary(DisQ5) Number of cases in table: 12 Number of factors: 2 Test for independence of all factors: Chisq = 4.286, df = 3, p-value = 0.2322 Chi-squared approximation may be incorrect > DisQ6=table(Discipline,Q6) > summary(DisQ6) Number of cases in table: 12 Number of factors: 2 Test for independence of all factors: Chisq = 1.6555, df = 1, p-value = 0.1982 Chi-squared approximation may be incorrect > DisQ7=table(Discipline,Q7) > summary(DisQ7) Number of cases in table: 12 Number of factors: 2 Test for independence of all factors: Chisq = 1.7143, df = 2, p-value = 0.4244 Chi-squared approximation may be incorrect > DisQ8=table(Discipline,Q8) > summary(DisQ8)

164
Number of cases in table: 12 Number of factors: 2 Test for independence of all factors: Chisq = 3.771, df = 3, p-value = 0.2872 Chi-squared approximation may be incorrect > DisQ8=table(Discipline,Q8) > DisQ9=table(Discipline,Q9) > summary(DisQ9) Number of cases in table: 12 Number of factors: 2 Test for independence of all factors: Chisq = 3.771, df = 4, p-value = 0.4378 Chi-squared approximation may be incorrect > DisQ10=table(Discipline,Q10) > summary(DisQ10) Number of cases in table: 12 Number of factors: 2 Test for independence of all factors: Chisq = 1.6555, df = 1, p-value = 0.1982 Chi-squared approximation may be incorrect > DisQ11=table(Discipline,Q11) > DisQ11 Q11 Discipline NO YES Biochemist 2 5 Lab Aide 0 5 > summary(DisQ11) Number of cases in table: 12 Number of factors: 2 Test for independence of all factors: Chisq = 1.7143, df = 1, p-value = 0.1904 Chi-squared approximation may be incorrect > matrix(Discipline,Q1)