can information that raises voter expectations improve...
TRANSCRIPT

Can information that raises voter expectations improve
accountability? A �eld experiment in Mali
Jessica Gottlieb∗
Stanford University, Political Science
May 4, 2012
DRAFT: Please do not circulate or cite without author's permission
Abstract
This paper studies the political e�ects of a particular type of information intervention: one
that improves voter expectations of government capacity. I argue that if citizens systematically
underestimate what their government is capable of, then voting on the basis of performance is of little
consequence, and politicians in turn have little incentive to perform well. I report evidence from a
randomized �eld experiment in Mali that tests whether improving voter information about the scope
of government e�ects voting behavior. A civic education course was provided to 370 villages in 64
randomly assigned municipalities dispensing information on the responsibilities of local government
and the basics of democratic accountability to all treated villages, with an additional component on
relative government performance to half of treated villages. A survey was then conducted in the
64 treated and 31 control municipalities. Voting simulations show that people in treated villages
are more likely to vote based on performance: a poor-performing candidate had to pay more to
buy votes of citizens in treated communities, and the votes of citizens in control communities were
more easily swayed by dimensions such as kinship or gift-giving. Suggestive evidence points to two
possible mechanisms underlying this behavior: treatment raised expectations of local government
and improved coordination among voters. A behavioral outcome measure � the likelihood that
villagers challenge local leaders at a town hall meeting � con�rms the positive treatment e�ects
found in the survey measures.
∗Email: [email protected]. Website: www.stanford.edu/~jgott. I am grateful for invaluable guidance and supportfrom James Fearon, Beatriz Magaloni, Jeremy Weinstein, and Saumitra Jha, and for comments and suggestions frommembers of the IGC Working Group on Political Economy, FSI Action Fund seminar, and Stanford Comparative PoliticsWorkshop. This research would not have been possible without the superior research assistance of Sidi Zeda and PeterLeFrancois as well as the tireless e�orts of the Malian instructors and enumerators who crossed rivers and mountains tocollect data. I thank the National Science Foundation, the International Growth Centre, the Freeman Spogli Institute,and Stanford University for �nancial support. All errors are my own.
1

The recent emergence of free and fair elections in many developing countries has frequently failed to
produce the expected increase in government accountability. Information asymmetries between voters
and political elites are a key determinant of democratic failure. For voters to discipline leaders at the
ballot box, they must have a minimum level of information, both about the candidates for whom they
are voting and the democratic system in which they participate. Particularly in developing countries,
this information is often lacking, which may help explain poor reform. The relationship between voter
information and political behavior is poorly understood, however. Empirical studies show di�erent kinds
of information have widely varying e�ects on political outcomes (Pande, 2011).
This paper studies the e�ects of a particular type of information intervention: one that improves voter
expectations of government capacity. I argue that if citizens systematically underestimate what their
government is capable of, then evaluating politicians on the basis of performance is of little consequence.
Politicians in turn are stripped of incentives to perform and a bad governance equilibrium ensues.
I report evidence from a randomized �eld experiment in Mali that tests whether improving voter
information about the scope of government impacts voting behavior. A civic education course was
provided to 370 villages in 64 randomly assigned municipalities. The course dispensed information on
the responsibilities of local government and the basics of democratic accountability to all treated villages,
with an additional component on relative government performance to half of treated villages. A survey
was then conducted in the 64 treated and 31 control municipalities. Voting simulations show that people
in treated villages are more likely to vote based on performance: a (hypothetical) poor-performing
candidate had to pay more to buy votes of citizens in treated communities, and the votes of citizens
in control communities were more easily swayed by dimensions such as kinship or gift-giving. Some
evidence points to two possible mechanisms underlying this behavior: treatment raised expectations of
local government and improved coordination among voters. Behavioral outcomes such as participation
in civic activities and challenging local leadership are also measured in the experimental sample. While
survey results are the focus of this paper, I brie�y discuss treatment e�ects on one behavioral outcome,
the likelihood of challenging leaders at a town hall meeting, to add con�dence to the �ndings.
The theoretical literature suggests strongly that information about government performance is a
necessary condition for political accountability (Ferejohn 1986; Besley 2006). When voters are well-
informed about how politicians govern, they can make welfare-enhancing decisions at the ballot box.
With uncertainty about politicians' performance, good performers cannot guarantee reelection so it
is harder to motivate it. Poor-performing or unrepresentative politicians do not get sanctioned as
often as they would in a higher-information setting. This intuition is closely related to modernization
theory which links education more broadly to democracy. Explaining early evidence of the correlation
2

between literacy and democratic stability, Lipset (1959) says education �increases [the] capacity to make
rational electoral choices.� Similarly, Almond and Verba (1963) recognize that formal institutions are
not su�cient to sustain democracy, which also requires a civic culture. Their democratic citizen is not
only one who is �active in politics,� but also one who is �well informed� and makes decisions �on the
basis of careful calculation as to the interests and the principles he would like to see furthered.� Finally,
providing information directly to voters can reduce their vulnerability to in�uence by political brokers.
Villalon (1999) and Beck (2008) show the importance of brokers, especially in reaching under-informed
populations.
Empirical studies support these theoretical claims of the positive e�ects of information on voter
behavior and politician performance (Besley and Burgess 2002; Ferraz and Finan 2008a; Reinikka and
Svensson 2005).1 Finkel and Smith (2011) show that civic education, in particular, had salutary political
e�ects in Kenya such as increasing knowledge, values and participatory inclinations as well as eventually
creating opinion leaders who transmit new ideas within their networks. And Kramon (2011) �nds that
more educated voters in Kenya are less likely to prefer vote-buying candidates. However, recent informa-
tion experiments in India (Banerjee et al., 2010a), Mexico (Chong et al., 2012) and Brazil (de Figueiredo
et al., 2011) suggest that conveying information to voters about the misbehavior of politicians does not
always have the intended e�ect of encouraging voters to sanction corrupt incumbents, particularly in
low- and middle-income democracies. In the India study, an anti-corruption information campaign had
no e�ect on voter behavior; in the Mexico study, information about corrupt incumbents led voters to
turn out less and not necessarily to sanction more; and in Brazil, publicizing an incumbent's corruption
charges had no e�ect on turnout or sanctioning. If voters already believe their candidates are corrupt, or
think little is at stake in local government, then it is not surprising that providing additional information
about government misconduct has no e�ect on voter behavior. Or in the cases of Mexico and Brazil,
providing information about performance can even increase voter apathy or disillusionment.
I argue in the next section that a di�erent type of information may be necessary to shift voter
behavior in such settings: information about the stakes or capacity of government as opposed to actual
government activity. Particularly in developing countries, voters are likely to underestimate the value
of democratic government�either because of a history of unresponsive autocratic regimes, or because
information asymmetries are severe and voters know little about the true capacity of government. There
is some survey evidence on the value citizens place on democracy in developing nations. Among the 20
countries in the 2008 Afrobarometer survey, twenty percent of respondents say they approve of one-party
1Keefer and Khemani (2011) is an exception. They �nd that increased radio access in Benin does improve publicservice provision, but the responsible mechanism is not improved government accountability but rather improved householdinvestment in children's education.
3

rule and �fteen percent of military rule. When asked directly, 70 percent say democracy is preferable to
other kinds of government, and similarly, only 60 percent of respondents gave this answer in the 2008
Latinobarometer survey. When asked how satis�ed they are with the way democracy is working in their
own country, an average of 48 percent of Afrobarometer respondents said they were satis�ed compared
to 58 percent of respondents in the 2007 Eurobarometer surveys across 31 European countries. One
potential explanation for this ambivalence toward democracy is beliefs about the weakness of electoral
accountability: about half of Afrobarometer respondents say elections do not enable voters to remove
from o�ce leaders who do not do what the people want.
If voters underestimate the value of government, their calculus at the voting booth will di�er from
that of voters who perceive a more important role of government in their lives. I argue that information
that raises voter expectations (aspirations) of government performance should make performance-based
voting more likely, thereby improving accountability. Two types of information can raise voter expec-
tations: information about what governments are legally responsible for doing and information about
what governments are capable of doing, e.g. what resources they have at their disposal. Especially
where there are multiple levels of government such as in decentralized systems, voters may be uncer-
tain about which level of government is responsible for providing a particular public service, and that
uncertainty can bene�t elected o�cials at the ballot box. Voters may also be uncertain about the size
of the government budget or the types of projects the government is capable of implementing, making
proper evaluations of performance di�cult. One of the treatment conditions in the Mexico experiment
cited earlier provides evidence that budget information can produce e�ects on voter behavior. When
information was disseminated on the total amount of money allocated to local governments and the
amount spent by year end, voters turned out more and sanctioned the incumbent more often when the
percentage of funds spent was low (Chong et al., 2012).
One potential reason that previous information interventions contribute to voter apathy rather than
increased sanctioning may be that the information provided con�rms voter beliefs about their own
poor-performing politicians without providing hope that better politicians exist. In the information
experiments in Brazil and Mexico, only performance information about candidates in the voter's district
was provided. Ferraz and Finan's (2008b) evaluation of the Brazilian audit program, on the other hand,
shows that when a larger set of performance data is publicly released, voters sanction corrupt incumbents
more often. Similarly, results from another experimentally assigned information campaign in the Dehli
slums accord with theoretical expectations: access to information increases voter turnout and vote share
for better performing incumbents (Banerjee et al., 2010b). In this case, voters received details about
legislator responsibilities as well report cards for multiple candidates allowing them to better calibrate
4
their expectations. The di�erence in outcomes between these two studies and the ones cited earlier may
be attributable to the fact that voters in the latter case received proof that some politicians were less
corrupt than their own.
The experiment described in this paper consists of two treatment conditions re�ecting two di�erent
information interventions that policymakers might practically choose to administer. The �rst treatment
consists of a basic civic education course that provides both types of information previously described.2
In particular, participants learn about the responsibility of local governments to provide a menu of public
goods, and they learn about the average size of local government budget in their region. If voters are
constrained by uncertainty about government capacity as well as uncertainty about actual government
performance, then this basic civics course is not su�cient on its own. Even if voters learn what they
can expect of their government, they cannot properly evaluate politicians when they are uncertain
about the incumbent's performance record. A second treatment condition provides the civics course
plus additional information about relative government performance. This has the advantage of giving
participants new information about the incumbent's performance record as well as reinforcing what
voters can expect of their governments. Because the performance information is relative to how other
comparable governments are performing, participants learn even more about what their government is
capable of or what is in the feasible set of government actions.
One motivation for studying these two types of interventions is practical: for policymakers, the
decision to produce each type of intervention is distinct. Civics curricula can be taught over a long
period of time without being updated, and can be distributed uniformly across the country. Relative
performance information, on the other hand, needs to be updated frequently, tailored to particular
districts, and is costly to collect, not to mention potentially politically contentious. While the research
design does not permit a direct comparison of these two information interventions since the second
treatment condition is a combination of the two,3 we can robustly make the following assessments: 1)
whether basic civic education is su�cient to change the political outcomes being studied, and 2) whether
a combination of the interventions produces e�ects that are signi�cantly di�erent from just providing the
�rst. If we assume additivity in the treatments, we can make conjectures about whether the �rst type of
information intervention is necessary for the second to be successful or whether the relative performance
information can achieve e�ects on its own.
The next section develops a theory of the impact of information about potential government per-
2See Gine and Mansuri (2011) for an example of an experimental intervention that provided civic information, inparticular on the importance of voting and the secret ballot. In treated Pakistani communities, women turned out moreand exercised more independence in candidate choice.
3A third treatment with only relative performance information would have been optimal, but only two treatments werepossible given resource constraints and power considerations.
5
formance on voter behavior. It then derives predictions and observable implications tested later in the
paper. The third section outlines the research design, explaining how the experiment was implemented.
The fourth section speci�es the measurement strategy and the �fth performs analyses of the data. I
discuss results in the �nal section.
Theory
As recognized by Barro (1973), politicians face powerful temptations to act against the public interest for
private gain. In a democracy, voters can control such temptations or better align politician actions with
their own interests through the electoral mechanism. Either by sanctioning poor-performing incumbents
or selecting candidates with good reputations, voters can in�uence the actions of politicians. However,
information asymmetries between the the voter and the politician can lead to problems of adverse
selection and moral hazard. In both cases, government accountability is weakened and the voter is less
well o�.
Voting decisions in a competitive democracy can be characterized as prospective in which the voter
selects the candidate whose expected future performance they prefer, or retrospective in which the
voter evaluates incumbent politicians according to some threshold or criteria (see Fearon 1999). The
availability of information conditions the ability of voters to make sound judgments. In the �rst case,
if there is poor information about candidate quali�cations or insu�cient performance records to build a
reputation, then candidates become less distinguishable from one another. Adverse selection may occur
in which undesirable politicians are elected to government more often than voters would prefer. In the
second case, poor information about incumbent government performance also results in worse outcomes
for voters in equilibrium. Moral hazard describes the situation in which politicians can act corruptly
without electoral retribution because voters do not have precise enough information to sanction them.
I argue in this paper that a new type of information asymmetry a�ects the voter's ability to hold
politicians accountable. Not only are voters uncertain about past government performance, they can
also be uncertain about government capacity. I formalize this argument by extending classic moral
hazard models of accountability (Barro, 1973; Ferejohn, 1986; Fearon, 1999; Besley, 2006). I focus
on the sanctioning mechanism rather than selection because information about government capacity
more clearly a�ects voter's performance evaluation of politicians than beliefs about candidate types.
The selection models rely on voters distinguishing between good and bad types of candidates, which
increased expectations of government should not, at least initially, help them do.
Before introducing uncertainty about capacity, I review the logic of the classic moral hazard models.
6

Voters condition their electoral decisions on government performance in the previous term, which they
usually infer from some measure of their own welfare. Voters have a decision rule that allows them
to translate perceived government performance into an action. The simplest rule is a cut point (as in
Fearon 1999): if welfare exceeds a certain level, voters favor the incumbent, but if welfare falls below
that cut point or performance standard then voters prefer the challenger. In Fearon's model, voters
face a trade-o�. They want to set the cut point as high as possible to extract maximum utility from
the incumbent, but setting it too high will discourage the incumbent, giving him incentive to shirk or
under-perform. An important comparative statics result is that the more precision with which voters
know actual government policy, the higher they will set the cut point. In equilibrium, incumbents in a
high-information setting will perform better due to this increased threat from voters. The predictions of
the model substantiate the empirical �ndings cited earlier that increased access to information improves
government accountability.
Modeling the problem in this way makes two implicit assumptions that while innocuous in some con-
texts, may be problematic in others. First, the above setup assumes the primary dimension along which
voters make decisions is a performance criterion, which is not necessarily the case in many developing
country settings where gift-giving or ethnic ties can prevail. Second, it is implicit that voters have full
information about government capacity. For voters to generate an appropriate cut point, they must know
what optimal government performance looks like. In other words, for voters to be able to accurately
evaluate their slice of the pie, they must know how big the pie is. Incomplete or biased information
about government capacity will in�uence voter choice of a cut point with implications for their ability
to appropriately sanction politicians. I argue that this is an unexplored aspect of the information story:
information asymmetries about the capacity of government can also impact the voters' ability to control
politicians.
Results of the household survey conducted in Mali in conjunction with the experiment provide some
evidence that voters often prioritize other dimensions than government performance in their vote choice,
and that knowledge of government capacity is low. While 64 percent of people said they prioritized
performance when deciding who to vote for, 48 percent said the receipt of gifts from candidates was
the primary criteria other people use when voting.4 Given the potential stigma attached to admitting
that gifts have more sway than performance in one's own vote choice, the latter �gure is likely a better
approximation of the truth. When asked why people would not vote on performance, about half of
respondents said a lack of information, a quarter said the government is not capable of doing much and
4Because these criteria are not generally mutually exclusive, respondents were asked to rank criteria in order of impor-tance rather than choose just one.
7
another quarter said people vote based on personal needs and interests. More than a third of people
did not know the local government has a budget to invest in the commune and about half are under
the false impression that the local budget is insu�cient to �nance even small development projects such
as a well.In Mali's 2008 Afrobarometer survey, more people said local government was bad at providing
information about the budget than providing information about their actual projects. Comparing Mali
to other African countries in the Afrobarometer survey, Mali scores better than average on subjective
measures such as these evaluating government provision of civic information. However, on objective
measures of civic information such as the ability to name the local MP and the Finance Minister, Mali
scores twelfth and eighteenth out of nineteen.
If the assumptions about performance-based voting and complete information about budgets are
relaxed, information can in�uence voter behavior in new and important ways. Instead of just improving
the electorate's perception of actual government performance, information can also improve voter beliefs
about potential government performance. Especially if voters in developing country settings typically
underestimate local government capacity, providing new information about what local governments
can do or are responsible for doing should change voter beliefs. First, increasing information about
government capacity should improve the selection of cut points by voters, or increase the minimum
standard of governance that voters require in order to re-elect incumbents. Second, by changing beliefs
about the capacity of local government, information should make the performance dimension more salient
relative to other voting criteria.
In related work, James Fearon and I formalize these intuitions with an electoral model that takes
into account voter uncertainty about the size of the public budget. We consider a single village that
either has a representative voter or can be assumed to all vote as one. The village votes whether to
keep or drop the incumbent politician in successive elections at times t = 1, 2, . . .. The politician gets
w < 1 every period he is in o�ce which includes both a wage and other informal bene�ts to o�ce.
With probability p ∈ (0, 1) the politician has an available budget of size 1 (relative to w) that would be
su�cient to provide a public good in the village such as a well or improvements to a community school
or clinic.
The politician knows if the funds are available while the village does not. This is justi�ed in the
current context where voters know there is a commune-level budget that can fund public goods, but
they do not know if there is enough in any given period to support a public good project in their speci�c
village. They also do not know the nature of coalition politics on the council that might randomly decide
whether their speci�c village could get a project. We also assume villages cannot observe the whole set
of public goods provided to all villages in the entire commune. This is another aspect of poor voter
8

information about government performance.
In each period, the politician observes whether funds are available and then chooses whether to build
the project and how much to dispense in campaign gifts, x < w. His period payo� is w − x+ 1 if funds
are available but he does not build a project and w − x if he does build an available project. After
observing the amount of gifts dispensed and whether a project is built, the voter chooses to keep or drop
the incumbent. The village's payo� is g + x if a project is built and x otherwise. g > 1 is the village's
value of the public good, re�ecting its positive externalities and assuming the village prefers the project
than having the money to spend on other things. Future payo�s are discounted by δ ∈ (0, 1) each period,
assuming for simplicity that a politician receives zero each subsequent period after getting kicked out of
o�ce.
Given this setup and forcing a Markov equilibrium with stationary strategies, the voter can condition
re-election on both the value of the gifts provided in the campaign, and on the whether a new public
good is built in the village. This gives the voter essentially two feasible �electoral control strategies.� We
call the �rst the peanuts strategy where the voter conditions their vote only on the receipt of campaign
gifts. The second, we call the big ticket strategy in which the voter conditions her vote on gifts and the
public good, voting against the incumbent if the public good is not provided. In both strategies, we
assume retrospective voting using a cut point or threshold.
Since the voter observes xt in period t, suppose the voter conditions re-election only on whether
x ≥ k, where k > 0 is the cut point. (Here, we assume the incumbent is liquidity constrained and so
cannot provide more than w in gifts in each campaign). The incumbent's payo� for supplying k in gifts
each period is then
V PI = (1− p)(w − k + δV PI ) + p(w − k + 1 + δV PI ) = w−k+p1−δ
The incumbent prefers to provide k each period rather than shirk and get kicked out of o�ce when
w − k + δV PI ≥ w, or
k ≤ δ(w + p).
So, the maximum the village can get each period from this �peanuts� equilibrium is the smaller of w
and δ(w + p). Note that while some accountability is possible here in the form of private transfers, no
public goods are provided even when they are available.
Alternatively, the village can vote against the incumbent if he fails to distribute xt ≥ k in gifts or
if he fails to deliver a public good. In this incentive scheme, the incumbent loses o�ce with probability
1− p in each period even if he is complying, making it harder to motivate him to provide public goods.
This is the cost of the moral hazard problem arising from the voter's uncertainty of the size of the budget
for their particular village.
9

The incumbent's payo� under this �big ticket� scheme is
V BTI = (1− p)w + p(w − k + δV BTI ) = w−pk1−δp .
Incentive compatibility requires that the incumbent's payo� from providing the gifts and project in
a period when the project is available is at least as great as what he could get by providing zero gifts,
consuming the project money, and losing o�ce. Thus,
w − k + δV BTI ≥ w + 1, or
k ≤ δ(w + p)− 1.
This is impossible when δ(w+p) ≤ 1, which is more likely the lower is p or the belief that the budget
is su�cient to fund a public good in the village. The problem here is that the public good is thought to
be rare enough that if the voter were to condition on it, the politician would almost always do better
to shirk or not provide either gifts or public goods and get kicked out of o�ce. In this case, the village
does better employing the �peanuts� electoral strategy which at least ensures them gifts in every period.
In fact, in this incentive scheme, politicians' ability to consume the funds for public goods is implicitly
used to give them a stronger incentive to provide things of value to voters in the form of gifts or other
more fungible goods. Thus, if the availability of large projects is in fact low, or if voters incorrectly
believe that funds are rarely adequate, then it may be impossible to induce politicians to provide public
goods when they are available. Voters may have to settle for inducing politicians to compete by o�ering
campaign gifts or other personal services.
From this discussion, I derive the following testable predictions:
H1 : Increasing voter information about potential government performance, p, will increase the
cut point at which poor-performing candidates are sanctioned.
H2 : Since the �big ticket� equilibrium does not exist for small enough p, increasing voter infor-
mation about potential government performance will increase the likelihood of voting along
the performance dimension.
In this setup, the village or voter is a unitary actor and votes as if they are decisive. One aspect
of the voter's decision that the model (and others like it) does not capture is the e�ect of a voter's
belief about how other people will vote. This may make sense where voting is anonymous such that
choosing one candidate over another has no immediate or material bene�t. However, in the Malian
context as in many other developing democracies, there are threats to anonymity. For instance, about
20 percent of individuals surveyed thought that their vote choice could be discovered with some positive
probability. And, because electoral precincts are often coterminous with village boundaries, election
results are knowable at the village level so entire villages can be sanctioned by politicians.
10

For the case in which the actor is the voter not the village, imagine one voter has information that p
is high. Under the �big ticket� strategy, he should kick out an incumbent who does not provide a public
good. A second voter has a di�erent belief: that p is low. This voter instead conditions his vote only
on gifts and decides to keep the incumbent. If enough villagers are like the second voter, the incumbent
will win and distribute gifts to his supporters. In this case, there is a real cost to the �rst voter choosing
the �big ticket� strategy, and he would only want to do so if he thought enough other voters were doing
the same.
In the presence of vote-buying or patronage politics and some ability of the candidates to punish
voters, the voter's decision can be conceived of as a coordination problem. Speci�cally, it resembles
a stag hunt in game-theoretic terms in which there are two equilibrium outcomes: cooperation over a
risky, but mutually preferred option or mutual defection for a less-preferred, but safer option. In the
�rst equilibrium, voters coordinate on voting for a high-performing candidate and (sometimes) receive
the preferred public goods. In the second equilibrium, voters instead opt for the more certain outcome,
voting for a low-performing candidate in exchange for a small gift or patronage.
If the assumption of a unitary and decisive voter is relaxed, a voter's decision calculus can be in-
�uenced by their beliefs about how others will vote. A voter is more likely to hold the government
accountable for public goods provision, or apply the �big ticket� strategy, when they believe others are
also using that strategy. A private information signal will cause a voter to update his own belief about
the value of p. If the signal is public, it will also cause him to update his belief about other voters'
value of p. Where an individual's participation is contingent on the participation of others, Chwe (2001)
shows that a particular kind of communication, namely communication that creates common knowledge,
allows people to e�ectively solve the coordination problem.
Common knowledge is a phenomenon in which everyone knows that everyone else knows something,
knows that everyone else knows they know it, and so on, ad in�nitum. This is distinct from mutual
knowledge in which a group of people know the same thing but are unaware of what other people in
the group know. Common knowledge can be created through a public announcement of information
among a group of people who are aware of each other's receipt of the information. If there are strategic
complementarities to participation in an action, e.g. higher payo�s the more people participate, then a
public signal can increase participation not only by changing beliefs about the underlying payo�s, but
by changing beliefs about the likelihood of that outcome. For example, Yanagizawa (2009) shows that
in Rwanda, participation in violence was increased by radio propaganda not only by increasing beliefs
about the underlying value of violence, but by increasing beliefs about the extent to which others would
participate.
11

If we conceive of the voter's choice as a coordination problem, then there are strategic complemen-
tarities to voting based on performance. Gains to disciplining the leader based on public goods provision
only accrue if enough people are voting this way. As such, we might expect that a more widely dissem-
inated signal would have a greater e�ect on voter behavior. For example, a poorly disseminated signal
may a�ect a voter's own beliefs, but have insu�cient e�ect on his beliefs about others (so the voter rea-
sons similarly to how he would without the information signal). A widely disseminated signal, however,
will change both an individuals own valuation of p as well as their beliefs about other's valuation of p.
This discussion suggests the following hypothesis:
H 3: The more public the information signal, the greater the treatment e�ect on voter behavior.
Research design
This project examines the impact of a new kind of information on voter behavior by manipulating voter
information through a randomly assigned intervention in one emerging democracy, Mali. Preliminary
research in Mali suggests why the type of information provided in previous empirical studies and experi-
ments may not be su�cient to induce change in voter or government behavior: voters have systematically
low expectations of government. This is not a surprising �nding in light of a number of features of Mali
that are often consistent with other young democracies.
In a new democracy, voter expectations are largely informed by the behavior of previous governments.
In the case of Mali, the previous government was a military regime which was not representative of or
responsible to its subjects. If elected o�cials continue to perform poorly, voters will have no reason to
update their expectations of government. This is particularly likely in countries like Mali with low levels
of education and poor information infrastructure such that people have little opportunity to learn about
the new system of democratic governance. Many newly democratized nations are also relatively unequal
and have small middle classes such that interests of the powerful elite diverge from the poor majority.
Further, this poor majority was on the sidelines of the transition to democracy in Mali which occurred
due to a combination of outside pressure and elite bargaining rather than a concerted push from below.
Democratic since 1992,5 Mali remains highly rural and economically underdeveloped. Malians are
twice as poor and half as literate as those in the average sub-Saharan African country, with a literacy
rate in Mali of 24 percent and GNI per capita at 500 USD. This apparent failure of democracy to im-
prove development outcomes cannot be attributed to weaknesses in the formal democratic institutions
5On March 22, 2012, Mali underwent a military coup jeopardizing its status as a stable democracy. After about threeweeks, the country was returned to civilian rule albeit with continuing involvement from the junta responsible for the coup.
12

themselves. Not only have Malian elections been deemed free and fair, but there have been two peaceful
transitions of power between parties and there is relatively high media freedom and freedom of associa-
tion. To better understand how democracy is failing in Mali, I examine the role of voter low expectations
in reducing government accountability. I do so by systematically raising voter expectations and studying
the e�ect.
A Malian policy innovation permits me to manipulate voter beliefs within independent and locally-
governed units. In 1996, Mali decentralized politically and territorially. The 703 newly demarcated
communes would democratically elect councils with autonomous control over local budgets. The average
population of a rural commune is 13,000. Cross-sectional data collected by the government demonstrate
there is signi�cant variation in local government performance in the extent to which public goods are
provided. One analysis suggests some of that variation can be attributed to access to information and
political competitiveness at the local level (Gottlieb, 2010).
While local government decisions occur at the commune level, organizational capacity exists at an
even lower level � the village. Communes are subdivided into an average of 15 villages. A customary vil-
lage chief resides in each village and is an important interlocutor between the villagers and the commune
government. For example, village chiefs frequently attend budget and planning meetings and play an
important role in tax collection. Communes vary greatly in population density and size. In the largest
communes, the distance from one village to another can be as much as a day's walk. The intervention
will be carried out at the village level rather than at the commune level to ensure broader access to
information.
In the following sections I describe a �eld experiment in rural communes in Mali to test the theory
that information that su�ciently raises citizen expectations can have an important e�ect on governance.
Because I randomly assign groups to treatment, I overcome endogeneity problems which are of concern
in this case. In the absence of random assignment, the treatment e�ect would likely be biased upward.
Well-informed voters may have more information precisely because their government is better behaved.
Or some unobserved factor such as strong social networks may cause both informed citizens and well-
behaved governments. By randomly assigning an informational �treatment,� I can identify whether
information de�cits have an important e�ect on failures of democratic accountability at the local level
in Mali.
Mali is in some ways an easy test of the hypotheses because voters are particularly under-informed and
have demonstrated low expectations of local government. As a result, the generalizability of the �ndings
are limited to places that, like Mali, exhibit low levels of information about government capacity. The
�ndings may be most relevant in countries that are also decentralized and where voters are uncertain
13

about the division of responsibilities between di�erent levels of government. In addition, rural and
isolated populations are likely to be most a�ected by information asymmetries regarding government
budgets and government authority.
The treatments: two types of information interventions
Both treatment conditions consist of a civics course conducted at the village level. Voluntary participants
receive a series of 3-hour sessions conducted by a trained Malian instructor in the local language. This
mode of dissemination rather than radio or posted signs was motivated by the low level of comprehension
found in preliminary surveys. A review of existing civic education e�orts in Mali found a lack of any
systematic form of civic education.6 Students receive some information about government in high school,
but fewer than 3 percent of respondents in the household survey report having �nished secondary school.
Course sessions strike a balance between prepared materials (pre-recorded audio and color posters)
to maximize homogeneity of treatment, and interactive exercises (role plays and question and answer
sessions) to maximize comprehension among participants.
There are two treatment groups (T1, T2) and one control group of equivalent sizes. The control
group does not receive any intervention. T1 receives basic civic information over 2 course sessions while
T2 receives an additional session on relative government performance, totaling 3 course sessions. In the
�rst two course sessions, participants learn about the average size of local government budgets in their
region. They also learn about the division of responsibilities among the di�erent levels of government.
To increase the likelihood of changing voter beliefs about government capacity the intervention includes
examples of communes in which the community successfully held the local government accountable.
The addition of relative performance information in the second treatment condition is partly moti-
vated by the fact that voters may be subject to two types of information asymmetries. If voters lack
information not only about government capacity, but also about actual government performance, then
the �rst intervention may not be su�cient on its own. Even high aspirations among citizens may have
no e�ect if voters cannot properly evaluate whether government has met their expectations. Partici-
pants receive information about how their government performed relative to other local governments,
some of which is collected by the course participants themselves. Performance indicators include rate of
tax recovery in the village, number of commune meetings attended by the village chief, and number of
development projects built by the commune in the village.
Another motivation for studying these two types of interventions is practical since policymakers may
6Civic education was o�cially eliminated during the Traoré regime in 1972 and reintroduced in 2009. Evidence of thisreintroduction was not apparent at the time of the study.
14

be faced with a choice between implementing a civics course or collecting and disseminating performance
data on politicians. The two interventions are not entirely distinct theoretically, however, because relative
performance information not only gives a sense of the incumbent's performance record, it also helps set
voter expectations. The design permits us to answer the following questions: 1) is the basic civic
education component su�cient to change the political outcomes under study, and 2) does a combination
of the two types of information interventions produce e�ects that are signi�cantly di�erent from just
providing the �rst?7 Resource constraints and power considerations precluded a third treatment group
providing only relative performance information without the basic civics course. This means we cannot
directly answer the question of whether relative performance information is su�cient to change the
political outcomes we care about. However, if we assume additivity in the two treatments, we can
conjecture whether the �rst type of information intervention is necessary for the second to be successful
or whether the relative performance information can achieve signi�cant e�ects on its own.
Sample
The experimental sample consists of 95 communes in the �ve districts of Kati, Koulikoro, Segou, Macina,
Baraoueli. Each commune is randomly assigned to one of three groups: control, T1 or T2. Without
a priori expectations about the relative strength of the two treatments, I maximized power by making
each of the three groups the same size. A blocked randomization design strati�ed the sample prior
to randomization on three variables related to information provision and government accountability:
geographic region, whether the mayor elected in 2009 is an incumbent, and a composite commune-
level development index8. Due to budget and time constraints, studying all villages in each commune
(average 18 villages per commune) was not feasible. Balancing requirements for power and practical
considerations, I chose to randomly sample 6 villages per commune in each of the groups.9 Six of the
sample communes have fewer than 6 villages, so all villages are sampled in those communes. The total
number of villages in the experimental sample is 556.10
7Because no group received a 3-course treatment with only basic civics information (and no relative performanceinformation), we cannot cleanly distinguish between the e�ect of the addition of relative performance information and thee�ect of a longer treatment.
8The development index is produced by UNDP's Observatoire de Développement Humain Durable and includes measuresof electri�cation, telecommunication, population size and public goods.
9The village that serves as the commune seat is always included among the 6 villages. Because the consent of the mayorwas required to work in the commune, and because the mayor generally resides or at least has close ties in the communeseat, I was advised that it would be politically di�cult to exclude the commune seat from the sample.
10One commune is missing observations for one of the six villages due to refusal by the chief to allow the enumeratorsto work there.
15
Compliance
Participants voluntarily self-selected into the course following a village-wide assembly that provided
details about the course and an open invitation to participate. Participants di�er systematically from
non-participants within the treatment communes. Some details about participants such as age and occu-
pation were collected during the intervention itself. I combine this with additional data from the survey,
inferring participation from answers to two survey questions about knowledge of a civics intervention in
the village and participation in that civics intervention. About 43 percent of participants were women
and the average age of participants was 45, higher than the average adult age of about 40 years old
among survey respondents. Participants are better socially connected than non-participants: about 48
percent of self-reported participants say they are related to the chief compared to only 34 percent among
other respondents. They are less likely to be from a minority ethnic group in their village and are more
educated. 70 percent of self-reported participants say they attended some school while only 56 percent
of other respondents report any schooling experience.
An average of 30 villagers participated in the course in each village. With a little over 1000 residents
and 200 households in the average village, this is a small proportion of course participants. Therefore,
it may seem surprising if any impacts of the intervention are detected by the survey instrument which
samples a mostly random sample of households regardless of participation in the course. Because local
leaders were assumed to be more likely to participate in the course, leaders are oversampled in the survey.
In addition, tight-knit social networks within villages are an important conduit of information. In an
experimental information intervention in Pakistan, for example, treatment e�ects were just as large on
treated women as they were on their untreated female neighbors (Gine and Mansuri, 2011).
One characteristic of Malian villages that facilitates the spread of information is the concession, a
compound or a grouping of households comprised of members of the same extended family. Households
of the same concession live in close proximity, often encolsed by a single wall. The women generally
prepare food together while the men will often farm the same or neighboring plots of land. The Pakistani
experiment found that information only traveled successfully within networks of the same gender, which
is likely similar in Mali. However, this experiment unlike theirs targets both men and women and
succeeded in reaching almost equivalent numbers of each gender.
A follow-up survey in a random sample of treated villages in the Koulikoro region investigated the
distribution of participants among concessions. Participants in the course came from concessions with
14 adult members on average. Accounting for concessions that sent multiple members to participate in
the course, about 95 adult members of the village share a concession with at least one course participant.
16
This is equivalent to about 38 percent of the reported adult population. Thus through the spread of
information within concessions, treatment could have indirectly reached a relatively high proportion of
the village, to say nothing of the potential for information to spread between concessions. During this
follow-up survey, a small number of participants and non-participants were asked about information
dissemination regarding the civics course. About half of participants said they spoke about the course to
others, and about a third of non-participants said they learned something about the course from people
in their community.
Measurement strategy
A household survey measures levels of civic knowledge, beliefs about government capacity and behavior
in hypothetical voting simulations11. The survey samples 10 households (one person randomly selected
per household) in each of the 6 sample villages. Of the 10 households, 6 are selected randomly with gender
balance among men and women and a randomization method that ensures geographic representation
across the village. The remaining 4 household surveys are targeted at local leaders: the women's leader,
the youth leader, the head of the village association, and the village assistant elected during the civics
course (or a reasonable alternative in control villages). These leaders were targeted with the intention
of better capturing civic activity. The assumption is that if there are changes to civic activity in a
given village, these leaders are more likely to be involved in such activities or at least know about them.
This design also permits a study of the di�erential impacts of the course on leaders relative to ordinary
households.
Randomized �eld experiments in the �eld of governance and accountability are relatively new. Many
of the �rst �eld experiments in the development arena evaluated impacts of programs or interventions on
health and welfare outcomes. A child's weight or days in school, or a farmer's repayment rate on a loan is
fairly straightforward to measure. Measuring the political outcomes in this project is more complicated.
For each hypothesis, there may be several outcomes that together build an evidence base for evaluation
of treatment e�ects. In these cases, I follow the work of Casey, Glennerster, and Miguel (2010) who
use summary measures, or mean e�ects indices, to assess the e�ects of a community-driven development
program on a range of social and political outcomes. When there are multiple outcomes assessing a single
hypothesis, I perform a mean e�ects analysis. I construct a summary index by averaging standardized
treatment e�ect sizes of each of the component outcomes. As suggested by Anderson et al. (2008), the
11Measuring actual voting behavior would be ideal, however, the next municipal election occurs only in 2014. Whilebehavior in hypothetical voting simulations will not perfectly predict actual voting behavior, the survey measurement wasdesigned in such a way as to minimize bias and the ability of the respondent to game the questions.
17

component outcomes that comprise the index are demeaned by subtracting the control group mean and
then converted into e�ect sizes by dividing by the control group standard deviation. An index that
equally weights each component is then used to assess the average treatment e�ect of a combination of
outcomes on each individual hypothesis.12
Though outcomes are measured at the individual, village and commune levels, analyses will use the
commune as the unit of analysis (unless otherwise speci�ed), averaging over outcomes when necessary.
Accounting for blocked randomization, average treatment e�ects will be estimated using the following
equation:
ˆATEj = 1N ∗
N∑b=1
(yTjb − yCb)
where b is the block assigned to each commune in randomization, N is the total number of blocks (31
or 32), yCb is the average outcome in the control group in block b, and yTjb is the average outcome
in treatment group j ∈ {T1, T2, T} in block b ∈ [1, 32]. When comparing T to C, yTjb =yT1b+yT2b
2 .
Standard errors will be calculated using the standard deviation of the di�erence in means between Tj
and C by block.
Because the number of sample communes is not divisible by 3, one block has 2 observations rather
than 3. By random chance, these observations are in the 2 treatment groups. In general, the incomplete
block will be dropped from the analysis.
For some analyses, I run additional speci�cations with controls at the commune, village, and indi-
vidual levels. Commune-level controls include baseline characteristics on which the randomization was
strati�ed � mayor incumbency and poverty level � as well as whether the commune is an arrondissement
seat13 or peri-urban14. Table 1 shows the di�erence in the mean value of these variables across groups. I
include the two variables used for strati�cation since exact matching was not possible across all blocking
variables simultaneously. The balance table also includes two additional variables that are used in test-
ing for di�erential treatment e�ects: whether the commune council has a majority party and number of
villages in the commune. In only one case is there a signi�cant di�erence in pre-treatment characteris-
tics: there are more peri-urban communes in T2 than control. Individuals in peri-urban environments
should be better informed than those in rural areas due to better access to schools and information
12Such a procedure provides a more robust case for the evaluation of each hypothesis because it safeguards againstcherry-picking only the con�rmatory outcomes and also generates a multidimensional measure for each outcome.
13Arrondissement is the next higher administrative division after commune. Before decentralization, the arrondissementwas the lowest level of administration. Communes that are the former seat of an arrondissement tend to be more developedbecause of prior investments in health, education and other infrastructure.
14I de�ne a commune as peri-urban if it is both contiguous with Bamako and densely populated. There are 5 communesin the sample of 95 that �t this description. Based on observations made during the study, these communes are quitedi�erent from the rest of the sample. For example, employment is much higher (even if much of it is in the informal sector),many more residents are new migrants from rural areas rather than autochtones, and material wealth is greater.
18

Table 1: Baseline comparison between randomly assigned groups
Mean for control T1 - C T2 - C NIncumbent mayor 0.226 0.055 0.055 63
(0.111) (0.111)Wealth index 0.031 0.029 0.039 63
(0.183) (0.185)Arrondissement 0.387 -0.168 -0.106 63
(0.116) (0.120)Peri-urban 0.000 0.063 0.094* 63
(0.044) (0.053)Majority party 0.258 0.054 0.148 63
(0.115) (0.119)Number of villages 17.645 -0.645 2.824 63
(2.717) (3.360)Standard errors in parentheses. Signi�cance levels: * p<0.10, ** p<0.05, *** p<0.01.
infrastructure. If it is the case that treatment is less e�ective for more informed participants, then the
treatment should work less well in peri-urban communes, biasing against a signi�cant �nding.
Village- and individual-level controls are characteristics that may in�uence the outcomes of interest
such as level of civic information and voting behavior, but should not be a�ected by treatment. Due to
lack of data, these variables are measured at the time of the post-treatment survey. However, they are
generally static and will proxy for baseline characteristics. Village-level characteristics include distance
of the village to the commune seat and number of concessions in the village. Individual-level controls
include age, schooling, whether the respondent is one of the four targeted leaders, gender, minority
status15, radio listenership, assets (TV and vehicle), relationship to the chief, size of concession, and
travel outside the village.
Data analysis plan
After receiving the data but prior to analyzing it, I developed a data analysis plan that speci�ed which
measures I would use to test di�erent hypotheses. As discussed by Casey et al. (2010), the registration
of data analysis plans prior to data analysis ties the hands of researchers and prevents cherry-picking of
positive results. Appendix 1 features a table linking hypotheses to measurable outcomes and summarizing
the results of each test. This paper does not discuss all hypotheses, but I include them in the appendix
for completeness.
1563 percent of survey respondents belong to the Bambara ethnic group with the next largest group being the Peulhat 12 percent. Villages tend to be relatively ethnically homogenous, so I am more interested in whether someone is aminority within a village rather than whether they are a minority ethnic group among Malians on the whole. For lackof disaggregated census data on ethnicity, I code a survey respondent as a minority if they belong to an ethnic group towhich less then a quarter of the other survey respondents in that village belong. Using this coding scheme, 12 percent ofrespondents are coded as minorities.
19
Analysis
Did the intervention work to improve civic information?
First, I analyze whether the intervention improved civic information in treated communes compared to
control communes. To do so, I create an information index that combines the survey questions testing the
respondent's civic information as pre-speci�ed the data analysis plan. These include questions about the
local government council such as the mayor's name and party; knowledge of the �restitution publique�, a
local accountability measure discussed during the course; and how informed they are of local government
activities.
Table 2 presents the e�ect of treatment on the information index for 5 di�erent econometric spec-
i�cations. Model 1 is the basic speci�cation, analyzing e�ects of both treatment conditions on the
information index using a paired t-test as described in the previous section. Models 2-5 test whether
any treatment e�ect is robust to the inclusion of control variables. Especially given the small number
of observations in the basic speci�cation, the controls can also serve to soak up some of the variation,
potentially improving estimates of the treatment e�ect. Models 2-5 are regressions of the information
index on treatment status employing �xed e�ects for block to account for the strati�ed randomization
of communes to treatment groups. Model 2 adds enumerator �xed e�ects. Model 3 adds commune-level
controls. Model 4 adds village-level controls and Model 5 individual-level controls.
In Models 1 - 3, the unit of analysis is the commune or commune pair. In Models 4 and 5, the unit
of analysis is the individual. Because randomization occurred at the level of the commune and not the
individual, the model accounts for clustering of individuals within villages and villages within communes.
Green and Vavreck (2008) analyze alternative estimation approaches for cluster-randomized experiments
and conclude that random e�ects regressions produce standard errors that are more reliable than robust
cluster standard errors. While random e�ects regressions produce treatment estimates that are more
e�cient than aggregate-level OLS, they �nd standard errors are downwardly biased, particularly when
the number of clusters is small.
To permit the inclusion of village- and individual-level controls and to compare treatment estimates
across speci�cations, Models 4 and 5 analyze individual-level data with a mixed model �t using restricted
maximum likelihood.16 Random e�ects are modeled at the commune and village levels to account for
dependence among individuals within villages and among villages within communes. Here, random rather
than �xed e�ects are used because communes and villages were chosen at random from a larger set so
we can assume that speci�c commune or village e�ects are uncorrelated with assignment to treatment.
16I use the xtmixed command in Stata.
20

Commune-level e�ects of treatment yc are estimated using the following equation:
yc = β0 + β1T1c + β2T2c +X′
cΠ +W′
cΓ + εc
where Xc is a vector of commune-level controls and Wc is a �xed e�ect for block, the unit on which
randomization was strati�ed.
Individual-level e�ects of treatment yivc for individual i in village v are estimated using the following
equation:
yivc = β0 + β1T1c + β2T2c +X′
cΠ + Z′
vcΓ + S′
ivcΣ +W′
cΓ + αc + γvc + εivc
where Zvc is a vector of village-level controls, Sivc is a vector of individual-level controls, αc are
random e�ects for commune and γvc are random e�ects for village.
In every case, there is a positive e�ect of both treatment conditions on the information index, but the
e�ect is not signi�cant in the base model for T1. Signi�cance is achieved for the coe�cient on T1 only
in Models 4 and 5 when village or individual level controls are included; the e�ect of T2 is signi�cant
in all models. The magnitude of the coe�cient estimates of the average treatment e�ect remain fairly
stable until the village-level controls are included. Unsurprisingly, the distance from the village seat has
a large and negative e�ect on information levels. Once this variation is controlled for, the size of the
treatment e�ect increases.
Though the addition of individual-level controls in Model 5 has little bearing on the estimation of
treatment e�ects, most have signi�cant and predictable correlations with the information index. Level
of information is increasing in age, amount of schooling, leadership status, wealth, relation to the chief,
and radio listenership. Information is decreasing for women and individuals who spent at least a month
in the past year outside the village which may be because they were traveling outside the commune so
know less about local politics. These relationships in the data provide con�dence that the information
index is a valid measure.
While there is no signi�cant di�erence between the e�ects of T1 and T2, it is not surprising that the
coe�cient for T2 is always larger and more signi�cant than that of T1. Participants in T2 communes
received more information during treatment, both because they had a longer course (3 rather than 2
sessions) and because they received a new type of information in the third course. The standard deviation
of the dependent variable for the aggregate-level data is 0.15. Treatment e�ects vary from about one
third to nearly a half of a standard deviation depending on the speci�cation.
Another aspect of the intervention's impact on voter information and beliefs is whether the treatment
had noticeable e�ects on knowledge about what normatively �correct� voter behavior is. The course
21

Table 2: E�ect on information indexVariable Coe�cient
M1 M2 M3 M4 M5T1 0.049 0.034 0.039 0.088** 0.086**
(0.042) (0.031) (0.035) (0.035) (0.035)T2 0.062* 0.069** 0.070** 0.111*** 0.099***
(0.039) (0.034) (0.035) (0.035) (0.035)Incumbent -0.008 -0.068 -0.122
(0.172) (0.169) (0.174)Wealth index -0.035 0.069 0.081
(0.150) (0.149) (0.150)Arrondissement 0.044 0.046 0.057
(0.050) (0.049) (0.050)Peri-urban 0.021 -0.127 -0.096
(0.088) (0.095) (0.095)Village distance -0.130*** -0.112***
(0.009) (0.009)Concessions 0.000 -0.000
(0.000) (0.000)Age 0.022***
(0.005)Schooling 0.169***
(0.012)Leader 0.170***
(0.014)Woman -0.351***
(0.014)Minority -0.015
(0.020)Radio listening 0.042***
(0.005)Own TV 0.051***
(0.015)Own vehicle 0.035**
(0.015)Chief relation 0.079***
(0.014)Concession size 0.001
(0.002)Travel -0.073***
(0.018)Intercept -0.034 -0.042 -0.048 0.259* -0.066
(0.028) (0.040) (0.057) (0.140) (0.144)N 31 95 95 5,452 4,813Enumerator FE N Y Y Y YStandard errors in parentheses. Signi�cance levels: * p<0.10, ** p<0.05, *** p<0.01.
22

highlighted the importance of voting for a candidate based on performance. Although there was no
explicit discussion of vote-buying during the course, an anti-vote-buying sentiment could have been
inferred by respondents. The survey asked whether the respondent had ever received a gift from a
candidate during an election. About 57 percent of individuals in the control group said they never
had while this number was higher in T1 (61%) and T2 (65%). The di�erence between the control
group and T2 is signi�cant at conventional levels, and di�erences become greater and more signi�cant
with the introduction of controls. It is unlikely that there was any real di�erence in gift-giving in 2009
between treated and control communes due to randomization. This evidence implies that the information
treatment likely strengthened the norm against vote-buying or for performance-based voting, causing
people to be less likely to admit to receiving gifts from candidates.
Did the intervention increase voters' valuation of the performance dimension?
I use evidence from two voting simulations conducted during the survey to evaluate the hypotheses
about the e�ect of civic information on voter behavior. In each voting simulation, the respondent is
given a choice between two candidates who are described by the enumerator. The �rst simulation
measures the respondent's valuation of a high-performing candidate by testing the price at which their
vote can be bought by a low-performing candidate. There is evidence that treatment makes votes more
expensive to buy. The second simulation measures the salience of two dimensions � shared kinship and
the village chief's political preference � relative to the performance dimension. Here, there is evidence
that treatment makes the performance dimension more salient relative to these other voting criteria.
For the following analyses, only surveys in which the voting simulation of interest occurred �rst
in the survey are considered. To mitigate priming e�ects and the in�uence of behavior in the �rst
simulation on the second, the order of the two simulations was randomly assigned for each survey prior
to implementation. The simulation could occur either at the beginning of the survey, just after questions
about demographic information, or toward the end. When analyses are run on the full set of data, robust
treatment e�ects disappear. Intervening questions between the �rst and second simulations may explain
this phenomenon. Questions about how the respondent conditions their vote, about the corruptness of
leaders and about government performance are examples of what may be priming respondents to answer
di�erently when the voting simulation occurs toward the end of the survey.
One indication of priming from survey questions is the presence of treatment e�ects for a question
about campaign gift acceptance at the beginning of the survey and the lack of any treatment e�ect for
a similar question at the end of the survey. As previously discussed, signi�cantly more respondents in
the control group admitted to receiving campaign gifts. This question occurred toward the beginning
23
of the survey. Toward the end of the survey, the respondent was asked to rank order dimensions along
which they vote and dimensions along which other people vote. Most respondents say they rank gifts
as one of the least important criteria (after performance, for example). However, most respondents say
other people rank gifts as the most important criteria. The di�erence between how respondents say
they behave compared to how they say others behave is one measure of honest reporting, with greater
distance indicating greater �dishonesty.� Since there were signi�cant treatment e�ects on responses
to the �rst question about receipt of campaign gifts, we should expect there to be treatment e�ects
on how respondents answer this second question. In other words, treatment should make respondents
more aware that voting based on gift receipt is socially undesirable, so there should be less honest
reporting in the treatment groups. The fact that there is no treatment e�ect on honest reporting
provides some evidence that intervening survey questions are priming respondents to what is socially
desirable, impacting questions that come later in the survey.
H1 : Increasing information about potential government performance will increase the cut
point at which poor-performing candidates are sanctioned
In the theory presented earlier, the cut point k at which voters sanction incumbents is increasing in p in
both the �peanuts� and �big ticket� equilibrium. I have shown that treatment increased voter knowledge
with respect to local government capacity, essentially an exogenous positive shock to p. We should
then see voters sanctioning at higher cut points in the treated groups. One voting simulation in the
survey gives respondents a choice between a high-performing candidate and a low-performing candidate
in a hypothetical election.17 The low-performing candidate o�ers the respondent a series of monetary
gifts in exchange for their vote. Choosing the high-performing candidate at higher o�ers from the low-
performing candidate is equivalent to sanctioning the low-performing candidate more often, or under a
wider range of parameters. Thus, we generate support for H1 if treatment causes the voters to choose
the high-performing candidate at higher o�ers from the low-performing candidate.
When initially given the choice, 74 percent of survey respondents choose the high-performing candi-
date.18 these respondents are asked whether they would switch their vote to the other (low-performing)
candidate if he o�ered a gift of about 1 USD. If the respondent refuses, there are 3 consecutive amounts
o�ered up to 20 USD. On average, 22.1% of these respondents agree to switch their vote for some amount
17The �high-performing� candidate is described as the current mayor who built a development project in the communeevery year of his mandate, but does not give gifts to supporters. The �low-performing� candidate is described as someonewho only makes promises to do better than the current mayor, saying he will build wells in all villages in the commune ifelected.
18This relatively high vote share for the low-performing candidate may be attributed to anti-incumbency bias which isquite high in Mali, or the fact that the �high-performing� candidate was explicitly said not to give gifts to supporters.
24

of money19 � slightly but insigni�cantly more in the control group (23.7%) than the 2 treatment groups
(22.2%, 20.4%).
The number of respondents who admit to be willing to switch their vote is likely an underestimate
due to social desirability bias. One strong indication of social desirability bias in the survey is the vast
di�erence in how respondents say campaign gifts a�ect their own vote choice compared to others in
their community. Respondents self-report prioritizing gifts over all other possible voting criteria only 7
percent of the time, while 48 percent say other people prioritize gifts in their voting decisions. Women
respondents appear less subject to social desirability biases, perhaps because they are less likely to
participate in politics or are less used to speaking about politics, especially with strangers. Women, for
example, are much more likely to report receipt of campaign gifts (48%) compared to men (33%). They
are also more likely to report deciding on whom to vote for based on gifts (11%) compared to men (4%).
Women are also signi�cantly less �dishonest� using the measure described earlier. Re-examining the
proclivity of just female respondents to switch their vote for some amount of money, a more substantial
treatment e�ect emerges. 41 percent of female respondents in the control group agree to switch their
vote for some amount of money compared to only 34% in T1 and 31% in T2. The di�erence between
T2 and control is signi�cant at the 5% level.
Figure 1 shows the average price for which a vote can be bought by the low performing candidate
in each treatment group with statistical signi�cance bars at the 5% signi�cance level.20 This analysis is
performed only among respondents who said they were willing to sell their vote at some price. If anything,
treatment made respondents somewhat less likely to agree to sell their vote, so this speci�cation should
only bias the estimated treatment e�ect downward. On average, votes are more expensive to buy in
the treatment groups than in control. Treatment increases the price by about 1 USD in T1 and about
2 USD in T2, more than a one-quarter standard deviation change. The e�ect on vote price of T2 is
signi�cant at conventional levels whereas T1 is not.21 The di�erence in vote price between T1 and T2
is not statistically signi�cant.
19Signi�cant predictors of willingness to switch one's vote include being a woman, having less education, and not beinga leader. Interestingly, respondents of ethnic minority status in the village are signi�cantly less likely to say they could bebought o�. This result supports the idea that gifts are less credible or a less meaningful signal when the giver is from adi�erent ethnic or kin network.
20Statistical signi�cance bars display pair-wise statistical signi�cance using the visual overlap test proposed in Schunn(1999).
21These results hold when di�erent prices are imputed for missing values or respondents who were unwilling to sell theirvote. The point estimate for the treatment e�ects �uctuate depending on the imputed price, but the coe�cients remainlarge and the e�ect of T2, statistically signi�cant.
25

Figure 1: Votes more expensive to buy in treated groups
H2 : Increasing information about potential government performance will increase the
likelihood of voting along the performance dimension
The theory also predicts that low values of p, or a low enough likelihood that there are su�cient funds
in the budget for a public good project in their village, will make the �big ticket� incentive scheme
less feasible. The information intervention should thus increase the likelihood that a voter uses the �big
ticket� electoral strategy. A second test examines whether the respondents in the treated group are more
likely to vote based on performance criteria. In another voting simulation, two candidates described to
the respondent are made purposefully ambiguous on the performance dimension. Candidate A built
a well during his tenure as mayor � a concrete but relatively meager public goods record, while the
Candidate B held annual public budget debates during his tenure as mayor. Each survey respondent
was randomly assigned to one of three versions of this vignette: baseline, kin and chief support. The
baseline condition presented the two candidates previously described and asked the respondent to choose
one. In the kin condition, the descriptions were exactly the same except Candidate A was also given
the same last name as the respondent, a strong signal that he is of the same kin group. In the chief
condition, Candidate A was said to have the backing of the respondent's village chief.
The following analysis focuses on the change in mean vote share for Candidate A across each of
the survey conditions. Assuming that kinship and chief support are two salient dimensions for Malian
voters, the mean vote share is expected to be higher in the kin and chief support conditions compared
to the baseline. A di�erence-in-di�erence estimation analyzes treatment e�ects, or whether the change
26

Table 3: E�ect of treatment on voting criteria
Mean vote share for Candidate AControl T1 T2
Baseline 0.288 0.315 0.427Kin 0.419 0.404 0.346Chief support 0.376 0.361 0.357
First di�erencesControl T1 T2
Di�erence (Kin - Baseline) 0.132*** 0.090** -0.081*(0.039) (0.040) (0.043)
Di�erence (Chief - Baseline) 0.088** 0.046 -0.070(0.039) (0.036) (0.044)
Di�erence-in-di�erencesT1 - C T2 - C T2 - T1
Kin condition -0.049 -0.208*** -0.170***(0.053) (0.055) (0.051)
Chief condition -0.047 -0.154** -0.116**(0.051) (0.057) -(0.053)
Standard errors in parentheses. Signi�cance levels: * p<0.10, ** p<0.05, *** p<0.01.
in Candidate A's vote share across survey conditions is di�erent for the treatment and control groups.
A smaller di�erence in vote share for Candidate A between the baseline and other conditions can be
interpreted as the performance dimension being more salient. Thus, H2 is con�rmed if this di�erence is
smaller for the treatment groups than for control. Table 3 presents the mean vote share for Candidate
A across each condition and across treatment groups, the di�erences in means between each survey
condition, and the di�erence-in-di�erence estimates.
The di�erence-in-di�erence estimation shows a negative treatment e�ect on the likelihood of respon-
dents to vote along the kinship or chief support dimensions.22 Voters in the control group were more
likely to vote for Candidate A when he was either a kin or had the chief's backing than they were in
the treatment groups. For the kin condition, the more salient of the two, voters in control communes
are 21 percent more likely to be swayed by the kin dimension than in T2 communes and 5 percent more
likely than in T1 communes. The di�erence-in-di�erence estimator is signi�cant for T2 but not for T1.
In addition, the di�erence between the e�ect of T2 and T1 is signi�cant in this case.
The kin and chief dimensions should be most salient for people who stand to bene�t from membership
in a local social network. For instance, aligning with the chief's preference would only be a good strategy
22An additional indication of the relative valuation of the performance dimension by survey respondents is how theyrank voting criteria. About 63 percent of people in the control group rank performance �rst (before gift-giving, kinship,and village chief support) compared to about 65 percent of respondents in each treatment group. The positive e�ect oftreatment is not signi�cant at conventional levels in either case. As previously discussed, priming may be a concern. Ifintervening questions primed respondents to what was socially desirable, then the high rates at which people say theyprioritize performance may mask underlying treatment e�ects.
27

for someone who believed their well-being to be linked with the chief's well-being. The survey asks
whether the respondent is a relative of the chief which is a strong indication of membership in local
social networks. As expected, the kin and chief dimensions are more salient among respondents who say
they are relatives of the chief. In the control group, Candidate A receives 22 percent more of the votes
under the kin condition compared to the baseline condition among the chief's relatives compared to only
a 7 percent bump among non-relatives. Re-running the di�erence-in-di�erence analysis featured in Table
3 among the subset of self-reported relatives of the chief (39 percent of the respondents), treatment e�ects
are larger and more signi�cant. The di�erence-in-di�erence estimators become signi�cant for T1 where
they were not in the full sample of respondents. This analysis implies that treatment has a larger e�ect
on reducing voting along non-performance dimensions when those other dimensions are most salient.
Did the intervention change behavior?
Soon after the completion of the civics course, a subset of communes in the experimental sample con-
ducted a special town hall meeting called a �restitution publique� with funding and technical assistance
from the German aid agency (GIZ). During these meetings, commune leaders provide a �nancial and
administrative account of the previous year to members of all the villages in the commune. This is one of
the only formal opportunities for villagers to exchange with commune leadership. However, substantive
participation in past meetings has been quite low according to GIZ. They attribute the low quality of
participation to lack of information and fear of speaking in public. Using the subsample of communes
that conducted town hall meetings following the civics course, I assess treatment e�ects on actual villager
behavior during the meetings. Trained observers record details of the way in which attendees at the
meetings participate. I analyze here the extent to which participants intervene during the meeting to
challenge the leadership in some way.
Because the subset of communes receiving a town hall meeting is not a random sample, we have to
rule out the possibility of selection bias. GIZ originally budgeted for the entire experimental sample
to receive a town hall meeting between March and June of 2011. Due to budget constraints, they
funded meetings in only one-third of communes in the original experimental sample. The criteria they
used in selecting these communes included the recency of previous town hall meetings, organizational
capacity in the geographic area, and relationships with higher-level authorities. While some of these
criteria might in�uence our dependent variable of civic participation at the meetings, all of them are
orthogonal to whether or not a commune was treated. A balance test on pre-treatment characteristics
reveals no signi�cant di�erence in the communes that received and did not receive a town hall meeting on
any dimension including poverty level, population size, mayor incumbency, competitiveness of elections,
28

presence of local radio, or remoteness.
In the subsample of communes holding a town hall meeting, 8 are in the control group, 13 in T1, and
12 in T2. Trained observers who were blind to treatment status attended each meeting and recorded
details of all participant interventions. For the dependent variable of interest, number of challenges to
leadership, I code as 1 each time a participant at the meeting intervened with a complaint or challenge
to the commune government. Regressing this dependent variable on an indicator of treatment, Table 4
reports the average treatment e�ect on the number of town hall participant interventions per commune.
Because of the small number of observations, exact p values are also calculated using randomization
inference and compared to the asymptotic approximations. The e�ect is positive in every case, with
treatment increasing the number of challenges on average by almost half. The e�ect is only signi�cant at
the 10 percent level when comparing the pooled treated groups with the control, which is not surprising
given the very small sample size.
Table 4: Average treatment e�ect on challenges to leadership during town hall
Mean number of challenges by groupControl T1 T2
Challenges 4.125 5.93 5.83N 8 13 12
Mean di�erencesDi�erence p value (2-sided) exact p†
T1 - C 1.80 0.125 0.148T2 - C 1.71 0.109 0.178T - C 1.76 0.086 0.113†Exact p values calculated using randomization inference.
Women were far less likely than men to intervene during the town hall meetings. Only about 5 percent
of all meaningful interventions (questions, comments, challenges) came from female participants. Of the
three women in the sample who openly challenged their leadership during the meetings, all were from
treated communes and originated from villages that received treatment.
Mechanisms
The analyses of hypothetical voting behavior suggest that the civics course increased the value and
salience of the performance dimension. If public goods are strictly preferred to private goods such
as gifts or patronage, two plausible mechanisms may explain how the civics course is a�ecting voting
behavior: raised expectations and improved voter coordination. First, treatment may be increasing the
voter's individual valuation of public goods relative to private goods through higher expectations of
feasible local public goods policies. Second, treatment may be increasing the voter's expectation that
29

other voters will opt for the public goods candidate, thus improving the ability of voters to coordinate
on their jointly preferred option. Both mechanisms are explored using available data.
Raising expectations
Following the data analysis plan, a composite index of relevant survey items is created to perform a mean
e�ects analysis of treatment e�ects on voter expectations. Component survey questions include whether
the local government is responsible for providing a range of public goods, beliefs about the size of the
local budget and number of expected future projects, and beliefs about how democracy works. Table 5
reports treatment e�ects using the same �ve model speci�cations as Table 2. Again, treatment e�ects
are all positive, but they are only signi�cant at conventional levels in Model 4. There is no signi�cant
di�erence in the outcome measure between T1 and T2.
Improving voter coordination
The theory section describes the voter's choice as a coordination problem in which he can get a small
value with high probability if he chooses a candidate giving gifts or patronage, or he can get the higher-
valued public goods only if enough other people coordinate on voting for the better-performing candidate.
The civics course could plausibly increase voters' ability to coordinate during elections. It could improve
voter expectations of how other people will vote by providing public information to a group of voting-age
citizens in a village that di�uses to some extent through communication after the course. It may also
generate new norms regarding public communication about political issues. Alternatively, voters in a
village may already be coordinating on voting for a shared kin or on the chief's preferred candidate. If
this is the case, the treatment which was shown to reduce reliance on these two dimensions in favor of
performance could also reduce the extent to which voters coordinate on voting for a kin or the chief's
candidate.
These implications are tested in the data by examining responses to the second voting simulation.
Respondents were not only asked which candidate they would vote for, but what they predicted the
candidate vote share in their village would look like. One aspect of voter coordination is assessed by
comparing voter predictions of the vote share for Candidate A with actual vote share for Candidate A
in their village. Recall that voters received three di�erent versions of Vignette B (baseline, kin and chief
support conditions), so the analysis will also be conducted separately among participants receiving the
same version.
Accuracy of prediction is measured by the variance of voters' guesses around the true vote share.
Comparing the mean squared error or mean distance of the voter's prediction from the truth in each
30

Table 5: E�ect on expectations index
Variable Coe�cientM1 M2 M3 M4 M5
T1 0.031 0.027 0.028 0.046* 0.047(0.036) (0.024) (0.026) (0.028) (0.028)
T2 0.015 0.040 0.037 0.047* 0.045(0.036) (0.024) (0.026) (0.028) (0.028)
Incumbent -0.015 -0.032 -0.093(0.129) (0.136) (0.141)
Wealth index 0.009 0.043 0.019(0.113) (0.120) (0.121)
Arrondissement 0.030 0.034 0.036(0.038) (0.040) (0.040)
Peri-urban 0.084 0.017 0.032(0.066) (0.072) (0.073)
Village distance -0.024*** -0.019***(0.005) (0.005)
Concessions 0.000** 0.000*(0.000) (0.000)
Age -0.005(0.003)
Schooling 0.053***(0.008)
Leader 0.019*(0.010)
Woman -0.154***(0.010)
Minority -0.002(0.014)
Radio listening 0.018***(0.003)
Own TV 0.021*(0.011)
Own vehicle 0.019*(0.011)
Chief relation 0.015(0.010)
Concession size -0.001(0.002)
Travel -0.028**(0.013)
Intercept 0.002 0.057* 0.061 0.133 0.077(0.026) (0.031) (0.042) (0.111) (0.114)
N 31 95 95 5,452 4,813Enumerator FE N Y Y Y YStandard errors in parentheses. Signi�cance levels: * p<0.10, ** p<0.05, *** p<0.01.
31
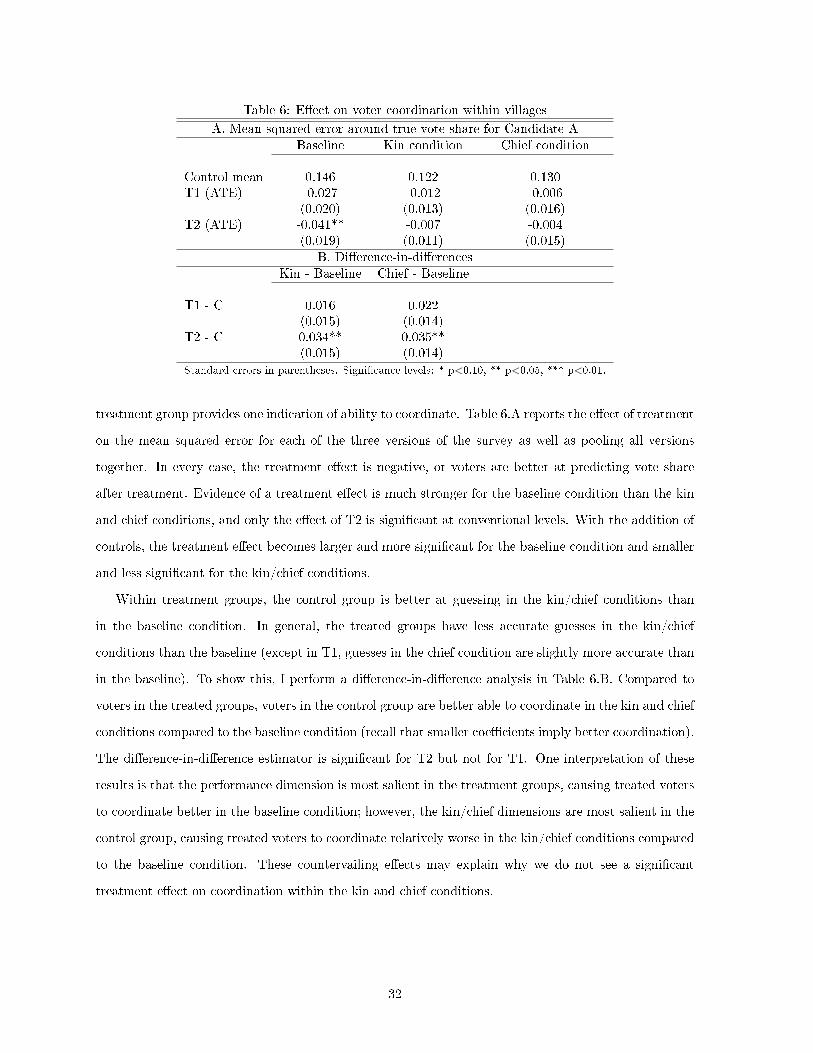
Table 6: E�ect on voter coordination within villages
A. Mean squared error around true vote share for Candidate ABaseline Kin condition Chief condition
Control mean 0.146 0.122 0.130T1 (ATE) -0.027 -0.012 -0.006
(0.020) (0.013) (0.016)T2 (ATE) -0.041** -0.007 -0.004
(0.019) (0.011) (0.015)B. Di�erence-in-di�erences
Kin - Baseline Chief - Baseline
T1 - C 0.016 0.022(0.015) (0.014)
T2 - C 0.034** 0.035**(0.015) (0.014)
Standard errors in parentheses. Signi�cance levels: * p<0.10, ** p<0.05, *** p<0.01.
treatment group provides one indication of ability to coordinate. Table 6.A reports the e�ect of treatment
on the mean squared error for each of the three versions of the survey as well as pooling all versions
together. In every case, the treatment e�ect is negative, or voters are better at predicting vote share
after treatment. Evidence of a treatment e�ect is much stronger for the baseline condition than the kin
and chief conditions, and only the e�ect of T2 is signi�cant at conventional levels. With the addition of
controls, the treatment e�ect becomes larger and more signi�cant for the baseline condition and smaller
and less signi�cant for the kin/chief conditions.
Within treatment groups, the control group is better at guessing in the kin/chief conditions than
in the baseline condition. In general, the treated groups have less accurate guesses in the kin/chief
conditions than the baseline (except in T1, guesses in the chief condition are slightly more accurate than
in the baseline). To show this, I perform a di�erence-in-di�erence analysis in Table 6.B. Compared to
voters in the treated groups, voters in the control group are better able to coordinate in the kin and chief
conditions compared to the baseline condition (recall that smaller coe�cients imply better coordination).
The di�erence-in-di�erence estimator is signi�cant for T2 but not for T1. One interpretation of these
results is that the performance dimension is most salient in the treatment groups, causing treated voters
to coordinate better in the baseline condition; however, the kin/chief dimensions are most salient in the
control group, causing treated voters to coordinate relatively worse in the kin/chief conditions compared
to the baseline condition. These countervailing e�ects may explain why we do not see a signi�cant
treatment e�ect on coordination within the kin and chief conditions.
32

Di�erential e�ects
This section tests whether treatment e�ects depend systematically on the strength of the treatment,
initial levels of information, and the level of party competition in a commune. The theory generated
one observable implication for di�erential treatment e�ects related to the public-ness of the information
signal. I operationalize a test of this hypothesis and analyze two additional heterogeneous treatment
e�ects. First, since treatment is working through the introduction of new information, then treatment
should have greater e�ects on less informed populations. In Kenya for example, a national civic education
program was found to have greater e�ects on Kenyans with less education and less access to information
than the average (Finkel and Smith, 2011). Second, there are competing hypotheses regarding the
relationship between political competitiveness and access to information, so I test whether treatment
works better in more or less competitive places. The experiment was designed to capture main e�ects
of the civics course. Further slicing the data in search of di�erential treatment e�ects risks diluting the
power of the original analysis: as the number of hypotheses tested in the data is multiplied, so too are
the chances of �nding con�rmatory tests. As such, evidence for all four heterogeneous treatment e�ects
should be considered suggestive and not given the same weight as evidence for the main e�ects.
H3 : The more public the information signal, the greater the impact on voter behavior
The main results provide evidence that the information intervention increased an individual's likelihood
of voting for the performance-based candidate. If it also increased an individual's expectation that other
people would change their voting behavior in the same way, then a stronger or more widely dispersed
signal should elicit greater e�ects. This prediction is tested in the data by measuring treatment strength
as proportion of villages per commune treated.
The civics course is a public signal that was provided to some proportion of the relevant voting
bloc of citizens in every commune. The participants in the course were made aware of how many other
villages in their commune received the course. Because only six villages were treated in every commune
and communes vary in size, some communes had a majority of their villages treated while some had
a minority of their villages treated. Table 7 reports treatment e�ects conditional on the proportion of
villages per commune treated. I regress the dependent variable of the price at which the respondent is
willing to sell their vote to the low performing candidate (in USD) on the treatment indicators and an
interaction term between the treatment indicators and an indicator of whether a majority of villages
in the commune received treatment. Because communes in which a majority of villages are treated are
also smaller in size, the e�ects might be driven by some other aspect of small communes such as wealth
or population size. To address this, a wealth index and population size are controlled for in Model 2.
33

In Model 3, I introduce all individual, village, and commune level controls from the most fully speci�ed
model in Table 2.
There is some evidence of a di�erential treatment e�ect. The coe�cients on the interaction terms
are all large and positive, though only signi�cant for T2 in the model with all controls. What is striking
is the di�erence in magnitude of the treatment e�ect in communes where a majority vs. a minority
were treated. For example, in the basic model for T1, treatment had no e�ect in communes where a
minority of villages were treated, but in communes in which a majority of villages were treated, the
low-performing candidate had to pay 1.37 USD more than in the control group to get the respondent
to vote for him. The di�erence is more pronounced for T2 where the mean e�ect on WTA is 3.26 USD
in communes in which a majority of villages were treated compared to 0.86 USD where a minority of
villages were treated.
Table 7: E�ect of information conditional on signal strength on WTA (in USD)
Variable Coe�cientM1 M2 M3
T1 0.003 -0.160 -0.692(1.311) (1.286) (1.790)
T2 0.863 0.328 -1.349(1.317) (1.283) (1.746)
Majority treated -0.696 -0.875 -1.184(1.708) (1.653) (2.626)
Majority x T1 2.062 1.961 2.324(2.118) (2.059) (3.032)
Majority x T2 3.091 3.141 8.600**(2.415) (2.348) (4.265)
Population 0.000 0.000(0.000) (0.000)
Wealth index -8.554** -6.841(3.948) (5.200)
Intercept 7.473*** 7.334*** 2.407(0.938) (1.127) (6.102)
N 95 95 392R2 0.117 0.212Other controls N N YStandard errors in parentheses.
Signi�cance levels: * p<0.10, ** p<0.05, *** p<0.01.
Treatment e�ects conditional on baseline knowledge
If treatment is indeed working through people acquiring new information about their government, then it
should be less e�ective among people or places that are already well-informed. Since the experiment did
not include a baseline survey, prior information levels are not directly observed. Comparing treatment
e�ects conditional on how respondents answered survey questions about civic information is problematic
34
because the treatment impacted self-reported levels information as well as the outcomes of interest in
similar ways. As a proxy for pre-treatment levels of information, I use an indicator of whether the survey
respondent came from a commune seat or not. This does not su�er the same endogeneity problems as
post-treatment measures of information because treatment should not a�ect whether a survey respondent
lives in the commune seat. Residing in the commune seat is highly correlated with reported levels of
information: individuals in the commune seat score one-third of a standard deviation higher on the
information index.
Conditioning on residence in the commune seat, I examine di�erential treatment e�ects on the
willingness-to-pay question. First, people residing in the commune seat were less willing to sell their
vote at any price. 90 percent of respondents residing in the commune seat never agreed to sell their
vote compared to only 83 percent of respondents residing outside the commune seat. Table 8 reports
treatment e�ects on willingness to ever sell one's vote in columns one and two. Among outlying villages,
there is evidence of a positive e�ect of both treatment conditions, signi�cant only for T2. For respon-
dents in the commune seat, there is no evidence of a signi�cant treatment e�ect and coe�cients go in
the opposite direction.
Because of this signi�cant di�erence in the proportion of people willing to sell their vote at some price,
I take it into account when measuring treatment e�ects on the willingness-to-accept outcome. Instead
of dropping observations for people unwilling to sell their vote as before, I assign them a high price. The
price I choose for this test is one that would have come next on the price scale, or double the highest price
that was o�ered. The test works similarly for higher prices, but the higher the price, the less we observe
variation in other responses. Columns 3 and 4 report treatment e�ects on this new willingness-to-accept
variable for the two populations of interest: respondents residing inside and outside the commune seat.
Here again, there is evidence of a positive treatment e�ect in outlying villages, signi�cant only for T2,
and no e�ect for respondents residing within the commune seat. Respondents living in and outside of
the commune seat di�er on other dimensions as well, so additional causal mechanisms could be working
in the same direction. However, given the distances between the commune seat and outlying villages
as well as the concentration of information infrastructure inside the commune seat, I argue that this is
a reasonable proxy for prior levels of information which should explain at least some of the variation
behind the heterogeneous treatment e�ects.
Information conditional on competition
Increased levels of competition in democracies has been shown to reduce corruption (Ferraz and Finan,
2011; Rose-Ackerman, 1978), undermine clientelism (Magaloni et al., 2007; Weitz-Shapiro, 2012), increase
35

Table 8: E�ect of information conditional on residence in commune seatWillingness to sell vote Price of vote
Outlying villages Commune seat Outlying villages Commune seatControl mean 0.813 0.911 15,549.79 18,230.38T1 0.018 -0.016 516.168 -229.301
(0.023) (0.041) (553.894) (778.475)T2 0.032* -0.023 1104.568 ** -327.419
(0.019) (0.032) (451.807) (626.778)N 95 95 95 95Standard errors in parentheses. Signi�cance levels: * p<0.10, ** p<0.05, *** p<0.01.
pro-growth policies (Besley et al., 2010), and limit state exploitation by political parties (Grzymaªa-
Busse, 2007). We might also expect that higher levels of competitiveness increase a voters likelihood of
voting based on a performance dimension since sanctions are more credible in a competitive environment.
The relationship between information and competition is less clear. One could reasonably argue that they
are substitutes or complements in the production of accountability. On the one hand, party competition
may substitute for voter access to information because parties will discipline each other and provide
useful performance information to voters. If this were the case, then information interventions would
be less e�ective in competitive systems because voters already get the information they need from
competing parties. On the other hand, party competition may complement voter access to information.
For example, parties may be better able to compete and mobilize voters when costs to disseminating
information are lower. Or if voters know they have a real choice between competitive candidates or
parties, then information would mean more to them than if a single party had a monopoly on political
power. If this were the case, then information interventions should work better in more competitive
areas.
The variation in political competitiveness among Mali's local governments provides an opportunity to
test the nature of this conditional relationship. Mali's local governments are run by a council of directly
elected representatives and an indirectly elected mayor. Councilmembers are allocated seats based on
proportional representation. Because the mayor and major policies are voted upon using majority rule
within the council, a party with a majority of seats on the council has a virtual monopoly on political
power. As an indicator of political competitiveness, sample communes are thus divided into those with
a majority party on the commune council (about one-third) and those without.
Table 9 reports the conditional e�ect of information on both voter expectations and voter behavior.
The dependent variable in columns 1 and 2 is the expectations index described earlier. The dependent
variable in columns 3 and 4 is the willingness-to-accept measure indicating the amount a poor-performing
candidate would have to pay to win a vote from the respondent. To assess the conditional treatment
36

e�ect on these outcomes, I regress each independent variable on the treatment indicator, an indicator
of whether there is a majority party on the town council and an interaction term. Models 1 and 3 are
basic speci�cations in which the commune is the unit of analysis. Models 2 and 4 use all controls from
the most fully speci�ed model in Table 2, so the individual is the unit of analysis.
Table 9: E�ect of information conditional on political competitiveness
Expectations index WTA (in USD)M1 M2 M3 M4
T1 0.087** 0.078** 1.314 0.554(0.041) (0.038) (1.184) (1.577)
T2 0.104** 0.100** 2.190* 0.929(0.043) (0.039) (1.242) (1.576)
Majority party 0.036 0.067 1.600 0.118(0.066) (0.057) (1.919) (2.318)
Majority party x T1 -0.179** -0.057 -1.497 0.531(0.084) (0.077) (2.453) (3.000)
Majority party x T2 -0.228*** -0.139* -0.926 2.461(0.082) (0.075) (2.381) (2.948)
Intercept -0.009 0.004 6.778*** -0.603(0.029) (0.128) (0.839) (5.570)
N 95 4,813 95 392R2 0.287 0.086Block �xed e�ects Y Y Y YOther controls N Y N YStandard errors in parentheses. Signi�cance levels: * p<0.10, ** p<0.05, *** p<0.01.
The test provides strong evidence of a complementary relationship for the voter expectations index.
This echoes the �nding in Gottlieb (2010) in which access to local radio had a greater positive e�ect
on local public goods provision where parties were most competitive. In Models 1 and 2, the coe�cient
on the interaction term is very large and signi�cant for both T1 and T2 in the base model though
loses signi�cance for T1 with the addition of controls. Further, the coe�cient on the treatment e�ect is
larger and more signi�cant in this speci�cation than when the interaction term was left out. There is
no evidence of an interactive e�ect for the willingness-to-pay variable. The coe�cient on the interaction
term is negative as before, but it is small and insigni�cant.
These results can be interpreted to mean that treatment signi�cantly increased voter expectations
in communes where there is no majority party on the town council. Conversely, treatment signi�cantly
reduced voter expectations in communes where there is a majority on the town council, or little political
competition. These divergent results were perhaps masking the presence of a treatment e�ect in the
initial test without the interaction term. Although the experiment was not designed to robustly test
di�erential treatment e�ects, post hoc reasoning can support why such di�erent e�ects emerge. In places
where voters have a real opportunity to vote out the incumbent, learning about the prospect of better
37

governance should raise their expectations. However, where voters are faced with an incumbent party
that has a monopoly on political power, they may instead become more resigned knowing there is little
they can do to e�ect change in their local government.
Unintended consequences on leader behavior
There is evidence that the civics course impacted citizens in a variety of ways: they are more likely
to vote based on performance, have higher expectations of their local government, and challenge their
local leadership more often. How will local governments respond as a result? On the one hand, elected
leaders might act more responsibly, knowing they are now being scrutinized by voters. On the other
hand, leaders might make more of an attempt to hide their misbehavior from more watchful citizens.
Surveys with elected local government o�cials from each of the sample communes generate some evidence
for how leadership responds to the introduction of a civic information course, at least in the short-term.
A list experiment in the survey measures the likelihood of leaders to campaign on transparency. It
does so by asking how many of the following strategies they will use in the next election:
1. Give gifts to your party faithful
2. Win the support of village chiefs by o�ering them things
3. Develop ideas for the betterment of your commune
4. Campaign for transparency in the management of the commune budget
In a random half of surveys, the fourth strategy is removed. The outcome of interest is the mean di�erence
between how many strategies leaders choose when given the transparency option and when not given
the transparency option as evidence of whether the leader cares about campaigning on transparency or
thinks it is a good way to mobilize voters. Treatment e�ects are analyzed by examining the di�erence
in this mean di�erence between treatment groups.
Table 10 shows the results of a di�erence in di�erence estimation for each treatment group as well
as the treatment groups combined. The di�erence-in-di�erence estimator in the �rst row shows some
evidence of a negative treatment e�ect on government transparency. As expected, there is strong evidence
that the number of strategies leaders say they participate in increases when the transparency option is
added. Treatment has no e�ect on the number of strategies chosen when the transparency option is
absent. However, when the transparency strategy is added to the menu of options, leaders in treated
communes appear less likely to opt for that strategy than leaders in control communes. In the �rst column
38

Table 10: Mean number of strategies chosen by leader in list experiment
Variable Coe�cientT1 + T2 T1 T2
Transparency x Treat -0.81 -0.46 -0.43(0.508) (0.673) (0.376)
Transparency 1.25 1.10 1.38(0.398)*** (0.466)** (0.495)***
Treat -0.08 -0.30 -0.01(0.337) (0.436) (0.229)
Intercept 1.83 1.91 1.76(0.271)*** (0.304)*** (0.321)***
N 93.00 62.00 62.00R2 0.26 0.32 0.34Standard errors in parentheses. Signi�cance levels: * p<0.10, ** p<0.05, *** p<0.01.
where the combined treatment groups are compared to the control group, a leader in a control commune
chooses 3.11 strategies on average when the transparency option is available whereas the average leader
in a treated commune chooses 2.22 strategies. The coe�cient on the di�erence-in-di�erence estimator
in this analysis is signi�cant at p = 0.117, close to conventional levels of signi�cance.
A second indication of government response to treatment is the frequency with which they hold public
meetings. Leaders are asked during the survey and probed for details of each event to improve accuracy
of the responses. Table 11 shows the average treatment e�ect on the frequency of public meetings held
by leaders. Again, leaders in treated communes appear less transparent. Particularly in T2, they hold
fewer public meetings post-treatment.
Table 11: Frequency of public meetings held by incumbent post-treatment
Control mean 7.19T1 (ATE) -2.61
(1.64)T2 (ATE) -2.90
(1.52)*Standard errors in parentheses. Signi�cance levels: * p<0.10, ** p<0.05, *** p<0.01.
Discussion
Taken together, these analyses provide strong evidence of an e�ect of the more intensive information
treatment (T2) on voting behavior, weak evidence of an e�ect of the less intensive treatment (T1) on
voting behavior, and strong evidence that the intervention worked to improve civic information. I �nd
support for two di�erent mechanisms explaining changes in voting behavior: increased expectations,
particularly in more politically competitive communes, and improved voter coordination. Since these
39
�ndings are all generated by survey measures, one concern might be the relevance of the intervention
for behavioral outcomes. Using observations at town hall meetings, I demonstrate that the survey-based
�ndings are consistent with treatment e�ects on actual behavior. People in the treatment groups were
signi�cantly more likely to challenge their local leadership at these meetings. There is also suggestive
evidence that elected leaders become less transparent in response to treatment. Leaders in treated
communes appear less likely to campaign on transparency and hold fewer public meetings.
Hypotheses regarding di�erential treatment e�ects are also evaluated in the data. There is supportive
evidence that treatment works better when provided to a majority of villages in the commune suggest-
ing that voters are considering the way other people will behave when they make their own electoral
decisions. As expected, I �nd treatment has bigger e�ects on voting behavior among the least informed
populations � those living in villages outside the municipal seat. Finally, I �nd evidence of a comple-
mentary relationship between political competitiveness and information. Treatment has a signi�cant
positive impact on voter expectations among communes where no party holds a majority of seats on
the commune council and a signi�cant negative impact on expectations where there is a monopoly on
political power.
While there is little di�erence in treatment e�ects between T1 and T2 for the information and ex-
pectations outcomes, the di�erences are large and sometimes signi�cant for the tests on voting behavior.
Comparing actual course participants23 in T1 communes versus T2 communes provides another estima-
tion of the di�erence in e�ects between treatment groups. Con�rming the previous �ndings, there is no
signi�cant di�erence between T1 and T2 among course participants for the information and expectations
indices. However, among these self-reported course participants, T2 has a signi�cantly larger e�ect in
the voting simulations and improves coordination among voters signi�cantly more than T1.
The �ndings are suggestive of an additive e�ect of information about government capacity and
performance. Information about government capacity works to change expectations, but is not su�cient
to induce changes in behavior. To a�ect voting behavior, additional information about government
performance is required. In analyses of the willingness-to-accept variable, the magnitude of the e�ect of
T2 is about twice as big as that of T1. In other words, T2 increases a voter's valuation of the performance
dimension about twice as much as T1. If the e�ects of the information interventions are indeed additive,
then the �ndings suggest that the relative performance information on its own would not be su�cient to
produce changes in behavior. But together with information about government capacity, the two types
of information generate signi�cant change.
23Course participants are identi�ed by their answer to a question on the survey regarding recent participation in a civicscourse.
40

The results of this study may interest donors, NGOs and policymakers facing the challenge of improv-
ing democratic accountability. Whether governments are engaged in corruption or fail to be responsive
to citizen demands, a key barrier to progress is the inability of citizens to make informed decisions at
the ballot box. Previous studies have shown that expanding access to information is a relatively cheap
and e�ective way of improving electoral accountability. This project shows a new type of information
is important to provide as part of information campaigns, in addition to information about politician
performance. For citizens to adequately evaluate politicians, they require civic information about the
responsibilities of government and the size of the budget. Evidence of negative impacts on government
transparency provide a cautionary tale of potentially perverse consequences of increasing voter informa-
tion. Further research could help determine whether these are merely short-term e�ects, and whether
voters will eventually sanction non-transparent politicians providing incentives for transparency in the
long-term. The results of this experiment demonstrate that even a very brief civics course can e�ectively
convey both information about what governments can and should do, generating signi�cant impacts on
the way people say they will vote and on whether they challenge their leadership.
41

References
Almond, Gabriel A. and Sidney Verba. 1963. The Civic Culture. Boston: Little, Brown.
Anderson, Lisa R., Jennifer M. Mellor, and Je�rey Milyo. 2008. �Inequality and public good provision:
An experimental analysis.� The Journal of Socio-Economics 37: 1010�1028.
Banerjee, Abhijit, Donald Green, Jennifer Green, and Rohini Pande. 2010a. �Can Voters be Primed to
Choose Better Legislators? Experimental Evidence from Rural India.� Presented and the Political
Economics Seminar, Stanford University, May 2010.
Banerjee, Abhijit, Selvan Kumar, Rohini Pande, and Felix Su. 2010b. �Do Informed Voters Make Better
Choices? Experimental Evidence from Urban India.�
Barro, Robert J. 1973. �The control of politicians: an economic model.� Public Choice 14 (1): 19�42.
Beck, Linda J. 2008. Brokering democracy in Africa: The rise of clientelist democracy in Senegal.
Palgrave Macmillan.
Besley, Timothy. 2006. Principled agents?: the political economy of good government. New York: Oxford
University Press.
Besley, Timothy and Robin Burgess. 2002. �The Political Economy of Government Responsiveness:
Theory and Evidence from India.� Quarterly Journal of Economics 117 (4): 1415�51.
Besley, Timothy, Torsten Persson, and Daniel M. Sturm. 2010. �Political competition, policy and growth:
theory and evidence from the US.� Review of Economic Studies 77 (4): 1329�1352.
Casey, Katherine, Rachel Glennerster, and Edward Miguel. 2010. �Experimental Evidence on External
Aid in Sierra Leone.� Presented at the December 2010 meeting of the Working Group on African
Political Economy.
Chong, Alberto, Ana De La O, Dean Karlan, and Leonard Wantchekon. 2012. �Looking Beyond the
Incumbent: The E�ects of Exposing Corruption on Electoral Outcomes.� Center for Economic Policy
Research DP8790.
Chwe, Michael. 2001. Rational Ritual: Culture, Coordination and Common Knowledge. Princeton:
Princeton University Press.
de Figueiredo, Miguel F.P., F. Daniel Hidalgo, and Yuri Kasahara. 2011. �When Do Voters Punish
Corrupt Politicians? Experimental Evidence from Brazil.�
42

Fearon, James. 1999. �Electoral Accountability and the Control of Politicians: Selecting Good Types
versus Sanctioning Poor Performance.� In Adam Przeworski, Susan C. Stokes, and Bernard Manin,
(eds.) �Democracy, accountability, and representation,� Cambridge: Cambridge University Press, pp.
55�97.
Ferejohn, John. 1986. �Incumbent performance and electoral control.� Public choice 50 (1): 5�25.
Ferraz, Claudio and Frederico Finan. 2008a. �Electoral Accountability and Corruption: Evidence from
the Audits of Local Governments.� IZA Discussion Paper No. 2843.
Ferraz, Claudio and Frederico Finan. 2008b. �Exposing Corrupt Politicians: The E�ects of Brazil's
Publicly Released Audits on Electoral Outcomes.� Quarterly Journal of Economics 123 (2): 703�745.
Ferraz, Claudio and Frederico Finan. 2011. �Electoral Accountability and Corruption: Evidence from
the Audits of Local Governments.� American Economic Review 101 (4): 1274�1311.
Finkel, S.E. and A.E. Smith. 2011. �Civic Education, Political Discussion, and the Social Transmission of
Democratic Knowledge and Values in a New Democracy: Kenya 2002.� American Journal of Political
Science 55 (2): 417�435.
Gine, Xavier and Ghazala Mansuri. 2011. �Together we will: Evidence from a �eld experiment in on
female voter turnout in Pakistan.� World Bank Policy Research Working Paper No. 5692.
Gottlieb, Jessica. 2010. �Is democracy working? Determinants of local government performance (failure)
in Mali.� Presented at the Working Group on African Political Economy, Pomona College, CA, May
2010.
Green, Donald P. and Lynn Vavreck. 2008. �Analysis of cluster-randomized experiments: A comparison
of alternative estimation approaches.� Political Analysis 16 (2): 138�152.
Grzymaªa-Busse, Anna M. 2007. Rebuilding Leviathan: Party competition and state exploitation in
post-communist democracies. Cambridge: Cambridge Univ Press.
Keefer, Philip and Stuti Khemani. 2011. �Mass Media and Public Services: The E�ects of Radio Access
on Public Education in Benin.� World Bank Policy Research Working Paper 5559.
Kramon, Eric. 2011. �Why Do Politicians Buy Votes When The Ballot Is Secret? Theory And Experi-
mental Evidence From Kenya.� Presented at the WGAPE meeting in December 2011.
Lipset, Seymour Martin. 1959. �Some social requisites of democracy: Economic development and political
legitimacy.� The American Political Science Review 53 (1): 69�105.
43

Magaloni, Beatriz, Alberto Diaz-Cayeros, and Frederico Estévez. 2007. �Clientelism and portfolio di-
versi�cation: a model of electoral investment with applications to Mexico.� In Herbert Kitschelt and
Steven Wilkinson, (eds.) �Patrons, Clients, and Policies: Patterns of Democratic Accountability and
Political Competition,� Cambridge: Cambridge University Press, pp. 182�205.
Pande, Rohini. 2011. �Can informed voters enforce better governance? Experiments in low-income
democracies.� Annual Review of Economics 3 (1): 215�237.
Reinikka, Ritva and Jakob Svensson. 2005. �Fighting corruption to improve schooling: evidence from a
newspaper campaign in Uganda.� Journal of the European Economic Association 3 (2-3): 259�267.
Rose-Ackerman, Susan. 1978. Corruption: A study in political economy. Academic Press.
Schunn, Christian D. 1999. �Statistical signi�cance bars (SSB): A way to make graphs more inter-
pretable.� Unpublished manuscript.
Villalon, Leonardo A. 1999. �Generational changes, political stagnation, and the evolving dynamics of
religion and politics in Senegal.� Africa today pp. 129�147.
Weitz-Shapiro, Rebecca. 2012. �What Wins Votes: Why Some Politicians Opt Out of Clientelism.�
American Journal of Political Science .
Yanagizawa, David. 2009. �Propaganda and con�ict: Theory and Evidence From the Rwandan Geno-
cide.� Job market paper.
44

Appendix 1: Linking hypotheses to measurable outcomes
Hypothesis Outcome Measures Results
The implementation of the
civics course e�ectively
increased voter beliefs
about local government's
potential to bene�t them.
Q37-41, 53-4, 57: Evaluates voter knowledge of
local government's responsibilities and capacity.
Expectations index:
T1 & T2: Weakly con�rmed for
full sample;
T1 & T2: Strongly con�rmed
when interaction term with
majority party is included
Q65-Q69: Evaluates voter understanding of how
democracy works.
Q63: Assesses beliefs about the anonymity of
voting.
Q74: Asks about retrospective voting.
Q86: Asks which development projects they
expect of current local government.
New beliefs about
government capacity will
increase the cut-point at
which voters sanction
incumbents.
Candidate vignette A: Evaluates the voter's
willingness to pay for a high-performing politician.
T1: Weakly con�rmed;
T2: Strongly con�rmed
Candidate vignette B: Evaluates the saliency of
the performance dimension versus 2 others.
T1: Weakly con�rmed;
T2: Strongly con�rmed
Q70,76: Voters rank dimensions along which they
and their neighbors vote.
Null �nding
Believing gains from
high-performing politicians
to be greater, voters should
be more willing to incur
costs to learn about actual
government performance.
Q42-49: Evaluates voter knowledge of local
council.
Information index:
T1: Strongly con�rmed;
T2: Strongly con�rmedQ55, 75: Evaluates voter knowledge/awareness of
local government performance/activities.
Town hall meeting: Rate of participation. Null �nding
Event log: Rate of participation in village and
commune meetings.
Null �nding
Increased expectations will
engender greater
dissatisfaction of current
local government
performance and lead to
more instances of civic
activity such as organizing
or petitioning local o�cials.
Q60-2: Preference for alternatives to democracy. Null �nding
Q77-84, 87: Elicits voter satisfaction/trust of
local government performance.
T1: Weakly con�rmed;
T2: Weakly con�rmed
Q27-31 & Event log: Have you organized with
other people to address a problem or contacted a
local leader of any sort.
Survey Q's: Weakly con�rmedfor T2
Event log: Null �nding for T1 &
T2
Town hall meeting: Likelihood of petitioning
leaders.
T1 & T2 pooled: Strongly
con�rmed
Increased knowledge about
government capacity among
voters will lead to more
transparency of local
government.
Q50: Did the government inform people more
often about local meetings.
Null �nding
Politician survey: Frequency of public meetings. T1: Weakly con�rmed;
T2: Strongly con�rmed
List experiment in politician survey: Assesses the
extent to which politicians will campaign on a
message of transparency.
T1: Weakly con�rmed;
T2: Weakly con�rmed
45