can information influence the social insurance
TRANSCRIPT

Policy Research Working Paper 8658
Can Information Influence the Social Insurance Participation Decision
of China’s Rural Migrants?John GilesXin MengSen Xue
Guochang Zhao
Development Economics Development Research GroupNovember 2018
WPS8658P
ublic
Dis
clos
ure
Aut
horiz
edP
ublic
Dis
clos
ure
Aut
horiz
edP
ublic
Dis
clos
ure
Aut
horiz
edP
ublic
Dis
clos
ure
Aut
horiz
ed

Produced by the Research Support Team
Abstract
The Policy Research Working Paper Series disseminates the findings of work in progress to encourage the exchange of ideas about development issues. An objective of the series is to get the findings out quickly, even if the presentations are less than fully polished. The papers carry the names of the authors and should be cited accordingly. The findings, interpretations, and conclusions expressed in this paper are entirely those of the authors. They do not necessarily represent the views of the International Bank for Reconstruction and Development/World Bank and its affiliated organizations, or those of the Executive Directors of the World Bank or the governments they represent.
Policy Research Working Paper 8658
This paper uses a randomized information intervention to shed light on whether poor understanding of social insur-ance, both the process of enrolling and costs and benefits, drives the relatively low rates of participation in urban health insurance and pension programs among China’s rural-urban migrants. Among workers without a contract, the information intervention has a strong positive effect
on participation in health insurance and, among younger age groups, in pension programs. Migrants are responsive to price: in cities where the premiums are low relative to earnings, information induces health insurance participa-tion, while declines are observed in cities with high relative premiums.
This paper is a product of the Development Research Group, Development Economics. It is part of a larger effort by the World Bank to provide open access to its research and make a contribution to development policy discussions around the world. Policy Research Working Papers are also posted on the Web at http://www.worldbank.org/research. The authors may be contacted at [email protected].

Can Information Influence the Social Insurance Participation
Decision of China’s Rural Migrants?∗
John Giles,† Xin Meng,‡ Sen Xue§ and Guochang Zhao¶
JEL Classification Codes: H53, H55, J46, J61, O15, O17, O53, P35
Keywords: Migration, Social Insurance, Information, Randomized Controlled Trial
∗The impact evaluation supporting this study is registered in the AEA RCT Registry (AEARCTR-0003265)and the human Subjects IRB was approved by the Australian National University Ethics Committee(2013/688). The authors are grateful for financial support from the following sources: the AustralianResearch Council (LP140100514), which has provided the core funding for the RUMiC surveys; the Re-search Support Board and Jobs Umbrella Trust Fund at the World Bank which funded the informationintervention implemented in this paper. Further, Giles is grateful for support from the Southwestern Uni-versity of Finance and Economics under the 111 Project Research Base (B16040) administered by China’sMinistry of Education.†Lead Economist, Development Economics Research Group, The World Bank. 1818 H St NW, Washington,DC 20433. (tel. +1-202-906-0192; e-mail: [email protected])‡Professor, Research School of Economics, ANU College of Business and Economics, The Australian NationalUniversity. (e-mail: [email protected])§Assistant Professor, Institute for Economic and Social Research, Jinan University. (e-mail:[email protected])¶Assistant Professor, Research Institute of Economics and Management, Southwestern University of Financeand Economics. (e-mail: [email protected])
1 Introduction
One well-documented and common feature of economic development involves a structural
change in which labor moves from agriculture to non-agricultural sectors, and from rural to
urban areas. With higher productivity, incomes and standards of living rise, but individuals
and families are often exposed to new sources of risk. Declines in fertility and increased
population mobility, which frequently accompany structural change, make traditional means
of risk-coping through support of family members less reliable. Lack of insurance against
risk in urban areas may make migration plans temporary and limit the extent to which
rural migrants make permanent decisions (and investments) related to their future in the
city. Rising average incomes and improvements in administrative capacity, however, enable
governments to introduce social insurance systems capable of helping their citizens face a
range of uncertainties, including potential adverse health and employment shocks and the
risk of poverty in old age.
Even as governments recognize the importance of providing social insurance to their pop-
ulations, implementation may be fraught with both poor understanding of social insurance
programs among intended beneficiaries and institutional features that create disincentives
to participate. Mandating participation by firms and employees, and even by the informal
sector, is fraught with the problem that enrolling in social insurance may reflect a choice.
Research on Latin American economies, for example, contains numerous examples in which
the high “labor tax wedge” associated with employer-based social insurance creates incen-
tives for both firms and workers to “exit” from the formal sector (Levy, 2008; Perry et al.,
2007).1
Globally, China’s rural-urban migrants are one of the largest populations of informal
sector workers not covered by social insurance. As of 2015, there were 160 million rural
migrants working in China’s cities, of whom 130 million had moved within the past 15
years (Frijters et al., 2015). While the sheer number of migrants is unprecedented, it is not
sufficient to offset current labor shortages in urban areas. Migrant labor supply is limited
by policies that treat migrants as ‘guest workers’ in cities, which leads to shorter migration
spells than if migrants viewed their moves to be permanent (Meng, 2012). Recognizing that
continued increases in the supply of labor to urban areas requires facilitating longer-term
migration, China’s government has initiated reforms aiming to increase migrant participation
in urban employee health insurance and pension programs. Recently introduced laws, the
Labor Contract Law (2008) and Social Insurance Law (2011), require employers to make
contributions to health, unemployment and work injury insurance and pensions for migrant
1Outside of a few studies in Latin America, existing research on program participation focuses mainly ondeveloped countries (see, for example, Ashenfelter, 1983; Chetty and Saez, 2013; Chetty et al., 2013; Grogger,2003).
2

workers. Although these new laws have been in place for ten and seven years, respectively,
migrant participation remains low. The 2015 wave of the Rural-Urban Migration in China
survey (RUMiC), for example, indicates that only 30 percent of migrant workers were enrolled
in urban health insurance or pension programs.
What explains the slow progress in expanding migrant participation in urban social in-
surance programs? Earlier research has highlighted the following contributing factors: poor
incentives for local governments to enforce laws, the possibility that employers try to avoid
making contributions to employee social insurance accounts, and the lack of enthusiasm
among migrants for participation, which may be due to the fragmented nature of the system
and consequent lack of geographic portability of enterprise contributions (Meng and Man-
ning, 2010; Meng, 2012; Giles et al., 2013; Gallagher et al., 2014). Posessing little or no
prior experience with urban employee social insurance schemes, China’s migrants may lack
full understanding of the potential benefits from enrollment and participation in these pro-
grams.2 More importantly, given the complexity of the social insurance schemes (the costs,
benefits, as well as enrollment procedures), which vary across regions and by type of job,
migrants may find it difficult to maneuver through these complications and simply decide
against participation.3 Lack of knowledge about the benefits and costs of insurance or in-
ability to figure out how to enroll may then interact with strong employer preferences for
avoiding contributions to generate the current low levels of participation.
This paper exploits a field experiment to assess the extent to which lack of information
about urban employee health insurance and pension programs contributes to low participation
among rural migrants. The study utilizes the existing Rural-Urban Migration in China
(RUMiC) longitudinal survey and a random selection of approximately 35% of respondents
from the 2015 survey round who were provided detailed information regarding the costs and
future benefits of participating in the health insurance and pension programs available in their
respective cities. Respondents were also informed as to whether social insurance programs
were portable or not in the event that they moved home or to another city, and how to
contact the representatives in local social-protection bureaus responsible for enforcing laws
and regulations governing employer participation. In the following wave of the RUMiC survey,
implemented later in 2016, respondents were then asked about their actual and planned
participation in these insurance programs.
Over the full RUMiC sample, the average information intervention effect is not statis-
tically significantly different from zero. Consistent with a pre-specified plan to examine
2While many migrants had prior experience with health insurance through China’s New Rural CooperativeMedical System (NRCMS), evaluations have found that this system increased health system participation,but afforded little protection against financial risk (Wagstaff and Lindelow, 2008; Wagstaff et al., 2009).
3Gallagher et al. (2014) find that a high share of migrants understand that they are eligible to participate insocial insurance, but it is unlikely that migrants understand program details or benefits.
3

heterogeneity across workers with and without a contract, however, this “zero average effect”
masks considerable heterogeneity across cities and workers in formal and informal sectors.
For individuals with an employment contract (formal sector employment), program participa-
tion rates were already quite high at 76% for health insurance and 74% for pension programs
in 2015. For this subgroup the intervention had a limited effect. By contrast, for the 68%
of workers in the informal sector, the information intervention led to a 3.2 percentage point
increase in enrollment in health insurance, which is a 23% increase from the baseline 13.8%
enrollment rate. Informal sector migrants in cities with low relative premiums were even
more responsive to the information intervention: we observe 6.7 and 11.2 percentage point
increases in health insurance participation among migrants in cities at the 25th and 10th
percentiles of the relative premium distribution, respectively.
The effect of the intervention on pension program participation is also positive and sig-
nificant for those informal sector workers young enough to contribute for the fifteen year
minimum necessary to reap full benefits from the program.4 We find a 3.9 percentage point
increase for young informal employees, which is an economically significant 26% increase
from their baseline 15% enrollment rate. Interestingly, for those older workers who could
not work long enough to reap full pension benefits, the information intervention led to in-
creased earnings by roughly half the minimum required employer contribution to individual
pension accounts, which suggests that older workers may share the value of forgone pension
contributions with their employers.
In contrast with the decision to participate in health insurance, pension program partici-
pation is not sensitive to the city-wide relative premium. One explanation for the difference
in responsiveness may derive from the fact that health insurance available from rural counties
(through an NRCMS policy) is a closer substitute for urban employee health insurance than
the subsidized new rural pension for urban employee pensions.5
The paper adds to a growing body of research investigating how information frictions
influence individual behavior in different settings (e.g., Chetty et al., 2009; Liebman and
Luttmer, 2015; Bergman, 2015). The canonic approach exploits relatively inexpensive inter-
ventions that enable individuals to make more informed decisions, and thus ‘nudge’ them into
4Without fifteen years of participation at retirement age, older workers effectively lose employer contributionsand, at mandatory retirement age, may only withdraw their own deposits to an employee account.
5Even as it requires the beneficiary to cover costs of returning to one’s home county when ill, and thelikelihood of receiving lower quality health care, with lower reimbursement rates, from a rural health facility((WHO, 2010; Muller, 2016)), NRCMS insurance still offers some relief from the risks of current healthshocks. The new rural pension program, by contrast, only provides a basic benefit of 60 to 100 RMB Yuanper month (9 to 15 US dollars), and is insufficient to insure against poverty in old age. Further, even thoughreceiving basic benefits from both the new rural pension program (NRPP) and the urban pension programis not allowed under current law, this is not enforced or well-understood, and thus migrants may expect therural program to complement any receipts from the urban employee pension program. Thus, it is not clearthat these two programs are not substitutes.
4
optimal choices that they might not otherwise make (Chetty, 2015). Among these studies
those which are closest to this one examine the role of information on participation in health
insurance programs by informal sector workers and the poor in both developing and devel-
oped countries (see, for example, Thornton et al., 2010; Das and Leino, 2011; Guthmuller
et al., 2014; Wagstaff et al., 2016). Most of these studies, however, fail to find a positive
impact of information alone on health insurance participation, and even when subsidies are
included with information the impact on health insurance participation is not judged to be
economically significant (Wagstaff et al., 2016).
This study makes several contributions to the literature on social insurance participation.
First, it provides strong evidence from a large developing country on a population, rural
migrants, whose social insurance participation will likely shape the country’s urbanization
process in fundamental ways. The positive and economically meaningful impacts of the infor-
mation intervention on the decisions of workers lacking contracts suggest that participation
can be increased by as much as 23-26% by simply raising awareness among China’s rural
migrants of both the benefits of social insurance programs, and how to participate in them.
Second, even older individuals, who cannot receive full benefits from participating in the
pension program, experienced wage increases after the information intervention. This pro-
vides the first analytical evidence suggesting collusion between employers and employees to
avoid social insurance participation, which has long been suspected by economists working
in China, and points to design flaws in the current pension scheme. Third, the impact of
improving understanding of social insurance among China’s rural migrants may be stronger
when paired with incentives: the interaction of a price effect and provisions of information
on health insurance participation suggests that premium subsidies might be a means of ex-
panding coverage.6 Fourth, while previous studies tend to examine either decisions related
to pensions or health insurance, this paper examines the impact on participation in both
programs. By doing so, we are able to examine how information and prices differentially
affect participation in programs differing in design features, and insuring against risks with
different time horizons. Our findings indicate that the responsiveness of the information
intervention differs considerably with the availability of potential substitutes.
The paper is structured as follows. Section 2 presents background on migration and the
migrant social insurance participation decision. Next, section 3 introduces the main data
source, the randomized information intervention, and the empirical approach. Results are
presented in section 4 and then a final section discusses policy implications and directions
for future research.
6Instead of using randomized subsidies to identify the interaction of price and information, as in (Guthmulleret al., 2014; Thornton et al., 2010; Wagstaff et al., 2016), this paper first controls for potentially endogeneouscity-fixed effects and then identifies the heterogeneous effect of the information by interacting the treatmentwith the city-wide relative prices of health insurance and pensions.
5

2 Migrant Social Insurance Participation
Rural-urban migration has played a significant and well-appreciated role in China’s economic
growth miracle (Bosworth and Collins, 2008; Tombe and Zhu, 2015). During the 1990s and
2000s, rural China was an abundant source of young workers (16-25 years of age), who
supported the growth of labor-intensive industries. Despite their significant contributions,
migrants are treated as “guest workers” in cities under China’s household registration (hukou)
system: the social insurance programs and services benefitting urban locals are either not
available to migrants, or are unsubsidized and much more expensive. Lack of access to social
insurance in cities leads migrants to return to rural areas when sick or unemployed, to raise
their families or to care for elderly family members (see, for example, Giles and Mu, 2007;
Meng, 2012). Consequently, hukou restrictions shorten the duration of migrant stay in cities
(which currently average to 8-9 years), limits the potential stock of migrant labor supply in
cities as older migrants return home, and thus exacerbates a labor shortage and contributes
to rising labor costs.
Recognizing that permanent migration may help to solve labor shortage problems, the
central government has introduced laws and regulations requiring employers to contribute to
the social insurance accounts of migrant employees. The 2008 Labor Contract Law stipulates
that all workers are entitled to participate in urban social insurance programs, that details
of the schemes should be explicitly written into labor contracts and that all migrant workers
should have a written contract (Gallagher et al., 2014; Meng, 2017). In 2010, the central
government provided new guidelines on pension portability, which allows migrants to transfer
12% of their employer’s contribution, in addition to their own contributions, to accounts either
in new migrant destinations or in their home counties (State Council, 2009). In mid-2011
a new Social Insurance Law explicitly stipulated that employees should participate in social
insurance programs, and that the self-employed may participate voluntarily. Further, fines
may be imposed on employers who fail to make contributions to their employees’ accounts
in a timely manner (National People’s Congress, 2011).
Despite efforts of the central government, the urban social insurance participation rates of
migrant workers in urban programs remain low. Evidence from the RUMiC survey suggests
only a modest increase in pension and health insurance participation rates over the period
from 2008 to 2016 (see Panels A and B of Figure 1). By 2016 the health insurance and
pension participation rates for the full sample were both just over 34%, with higher rates
for employees than the self-employed. Among employees (Panels C and D of Figure 1),
it is evident that higher participation rates are strongly associated with having a written
contract. Participation rates among individuals without written contracts are similar to
those of the self-employed. While participation among employees increased between 2011
and 2012, when fines were imposed on employers who failed to contribute their share to
6

social insurance payments (see Panel 2 of Appendix Table A.1), the rate of increase was
slow until 2015. Between 2015 and 2016 there was another significant increase within the
RUMiC sample, which is likely driven by the information intervention that is the focus of
this paper. There are several potential reasons for slow progress in increasing participation
among migrants.
First, although the central government has passed laws and developed policies aimed at
increasing the health insurance and pension participation rates of migrants, implementation
details and the enforcement of laws and regulations are left to local governments. As local
leaders are generally evaluated based on how well they meet growth targets, the prospect
of rising labor costs is a frequent concern and reduces incentives to enforce laws requiring
employers to make payroll contributions. Unless they are particularly law-abiding, employers
have no incentive to make voluntary contributions when enforcement is not effective. Previous
studies have found that formal sector firms, which are more likely to face inspections (par-
ticularly state-owned enterprises, foreign invested and joint venture firms), generally provide
written contracts to their workers and make social insurance contributions to their employees
(Giles et al., 2013; Li and Freeman, 2015). The majority of migrant workers, however, are
not working in large, formal sector firms.
Second, the financing of social insurance schemes is also left to local governments, but
decentralized administration continues to limit portability of social insurance accounts, and
thus limits migrant willingness to participate. While payments made by firms and young,
healthy migrants are positive contributions to local health insurance and pension funds, most
local governments are reluctant to transfer funds to other regions when migrants relocate as
this would have immediate budgetary consequences. The main sticking point centers on how
the employer portion of accounts is handled. Although they comprise two-thirds to 75% of
total health insurance and pension fund accounts, a migrant is only able to transfer 12%
of employer contributions. Further, even transfering one’s own contributions when moving
faces hurdles as the fund manager accepting the transfer is required to match the employer
contribution if it is not transferred, and this is a stipulation that destination governments
almost never accept. These obstacles to portability mean that migrants, with relatively short
time-horizons in the city, have weaker incentives to participate in social insurance than local
residents (Giles et al., 2013).
Third, as program details are formulated by local governments, rules vary along multiple
dimensions: by type of insurance, by type of employment, and, more importantly, across
regions – the program specifics that a migrant finds in a new city are very likely to be differ-
ent from those learned through prior experience. Program specifics, including premium and
benefit levels, are both complicated and vary considerably accross cities, and are frequently
7

neither available nor understandable to migrant workers.7 As an example of program com-
plexities, Appendix A.2 summarizes information on the costs and benefits of health insurance
and pensions for two of the 13 cities in which the information intervention was implemented.8
These simplified policy details were summarized after a careful reading of the city-level web-
sites and confirmed with follow-up phone conversations with city-level bureaucrats charged
with managing the programs. In the face of such complexity and incomplete information,
migrants are left to make uninformed decisions. Combined with short time horizons in the
city, they may find it easier to opt out, especially when employers offer to collude with em-
ployees to avoid participating. Further, nearly a third of migrants are self-employed and the
costs of participating for this group are even higher as they must make both the employer
and employee contributions.
Finally, even as bringing rural residents into urban social insurance schemes is an explicit
policy objective, existing rural programs may be viewed as substitutes for “expensive” urban
insurance schemes. With respect to health insurance, 81 percent of rural migrants in the
baseline (2015) survey were enrolled in the New Rural Collective Medical System (NRCMS)
program. Even as it is a highly imperfect substitute for coverage through the urban em-
ployee health insurance program, the existence of this alternative may contribute to delays
in enrolling in the urban program.
In this paper, we examine migrant participation in urban health insurance and pension
schemes. The two programs have been available to employed registered residents of the city
since the 1990s, but have only encouraged participation of rural-urban migrants since the
New Labor Contract Law in 2008. Although the programs vary significantly in terms of
premia and benefits across cities, all cities required joint employer-employee contributions
to these programs at the time of the information intervention. With respect to the urban
employee health insurance program, nominal employee and employer contributions average
2% and 6%, respectively. The urban employee pension scheme has a greater burden, with
individuals contributing at least 8% of their monthly earnings while employers contribute 14-
21% of the average wage in the firm. At retirement, only those workers who have contributed
for at least 15 years may receive a full pension that includes employer contributions. Those
workers who have contributed for less than 15 years may still receive a lump sum payment
from their own accummulated contributions, but they will not receive a pension payment,
nor the employers’ contribution, which will remain with the city pension authorities.
7When designing this intervention, one of the co-authors put in considerable effort to find details on policiesand procedures for each of the 15 RUMiC cities. Apart from Guangzhou, Dongguan and Shenzhen, websiteinformation for other cities was either not up-to-date or difficult to understand. When local social welfarebureaus were contacted by phone, there was typically either no answer or a long queue (more than 20-30minutes wait-time to speak with a representative).
8The information for the remaining cities is available upon request from the authors.
8

3 Research Design and Sample
As discussed above, local cadres’ promotion incentives, the lack of portability, the lack of
certainty in policies relating to the future for migrants and their families, and the complexity
of social insurance schemes may all contribute to low participation rates among China’s
migrant workers. This paper focuses on the extent to which information about schemes and
enrollment processes affects participation in urban pension and health insurance programs.
The data used in this study come from the Rural-Urban Migration in China (RUMiC) survey.
3.1 The RUMiC Survey
The Rural-Urban Migration in China (RUMiC) survey is a longitudinal study with nine
rounds: the initial wave was carried out in 2008, with additional rounds conducted an-
nually during each of the last 8 years. Migrants are surveyed in 15 cities, including such
coastal migrant destinations as Guangzhou, Shenzhen, Dongguan, Shanghai, Wuxi, Nan-
jiang, Hangzhou, and Ningbo, as well as major cities in interior regions, including Chengdu,
Chongqing, Wuhan, Hefei, Bengbu, Zhengzhou and Luoyang. Unlike other surveys of migrant
workers in China, in which migrants are sampled primarily by urban residential address, the
RUMiC uses a workplace sampling strategy. In contrast with urban local residents, rural
migrants frequently move to cities alone and often live in factory dormitories or other work-
places. Even in cases in which migrants bring their families to the city, high urban rents
deter them from living in the type of urban residences that comprise standard sample frames
(such as those maintained by the National Bureau of Statistics). More conventional urban
household sampling frames tend to yield a biased sample of migrants, over-representing those
who are more affluent, have longer tenure and more secure positions in the city than the “rep-
resentative” migrant. By using a sampling frame based on a census of work-places, RUMiC
avoids this bias.9
Although RUMiC is designed as a longitudinal survey, the young and mobile nature of the
migrant population leads to some attrition between annual survey waves. To maintain sample
size, the RUMiC team randomly draws a refreshment sample for each wave, designated as
a “New Household Sample.” Thus, the RUMiC survey has two sub-samples in each year:
the non-attrited households from the previous year’s sample (“old-households”), and a new
representative refresher sample (“new households”) (Meng, 2013). The implementation of
the RUMiC surveys normally begins in late March to early April each year, after migrants
return from visiting their homes during the Chinese New Year. Because tracking takes time
and there is also a need to draw and enumerate refresher samples, the survey typically runs
for 6-8 months and is completed by November. This paper uses RUMiC survey data from
9For detailed discussion of RUMiC sampling procedure, see Gong et al. (2008).
9
the 2015 and 2016 waves. In the 2016 survey round, the information inervention end-line,
28.3 percent of respondents from the 2015 baseline had attrited from the sample.
3.2 Information Intervention
To provide relevant information to migrants randomly selected for treatment, pamphlets were
developed through extensive consultations with relevant program managers and staff respon-
sible for administering health insurance and pension programs in each city. This pamphlet
discusses city-specific features of health insurance and pension programs, and summarizes
program rules, which vary significantly across cities and for different categories of employ-
ment (e.g., wage employment and self-employment). In discussions with local bureaucrats,
the rules, premiums, and the benefits for each type of worker (as shown in Online Appendix
A.2) were verified. Online Appendix A.3 provides an example of the easy-to-understand pam-
phlet provided as a guide to workers in Dongguan. In addition, the pamphlets use lay terms
to highlight the risk-management benefits of participating in pension and health insurance
programs.
The information intervention was implemented between early December 2015 and the
end of January 2016. The city-specific information pamphlets were distributed to a ran-
domly selected sample of 35% of the 2015 RUMiC sample in 12 of 15 survey cities (and the
randomization was done within cities). As the Shanghai RUMiC sample size is significantly
larger than the rest of the cities, we randomly selected 25% rather than 35% of the 2015
sample for treatment. This decision was driven by cost and time considerations.10
The information intervention was implemented by 33 enumerators, of which 64% were
university students (either undergraduate or graduate) and the rest were RUMiC survey
firm enumerators.11 In each city, enumerators received classroom and field training from one
of the coauthors over a two day period. In the intervention, enumerators first presented a
small gift and an information pamphlet to each of the randomly selected sample respondents.
After a short introduction, the enumerator read a brief summary of the benefits and costs of
participating in pension and health insurance programs from the first page of the pamphlet.
10The 2015 survey was completed later than previous rounds, and the Guangzhou and Zhengzhou surveys ranthrough the end of 2015 with data available even later. These cities were not included in the interventionbecause there was not sufficient time to both distribute the pamphlets and allow respondents time to reactbefore the 2016 RUMiC survey. In addition, within the 13 included cities, households lacking a workingmigrant worker, defined as someone with a rural hukou and currently working and not retired (aged 16-55for women and 16-60 for men), are excluded from the random selection for the intervention sample. Further,8 households (from both treatment and control groups), were not included because their homes were toofar from the city center. In total we excluded 304 households, which accounted for 6.9% of households inthe 13-city sample.
11Of the 13 cities, 8 used enumerators from the survey firm and 5 used students. When students were usedas enumerators, a person from the survey firm was hired to accompany students to the enumeration site toinsure that the target respondent was interviewed.
10

The enumerator next identified key characteristics of the respondent to determine which of
the more detailed program information and enrollment procedures to highlight, including
whether he/she is a wage employee or self-employed, and whether or not he/she holds local
hukou.12 Using these characteristics, the enumerator located the programs and policies that
applied to the respondent and provided him/her with detailed and relevant information.
After doing this, the enumerator then pointed out the contact details (address and phone
number) for social insurance related consultations at the local Bureau of Labor and Social
Security. Finally, the respondent was asked whether he/she had any further questions. If so,
the enumerator answered the question(s) and if not, the respondent was informed that there
would be a confirmation phone-call made from survey headquarters to confirm the receipt of
the gift and pamphlet. The total information delivery process was designed to take less than
25 minutes.
When respondents were not found on a first effort, enumerators followed a protocol that
required repeated efforts at contact by phone or SMS every two to three days over a two-
week period. To increase the probability of contact, calls were made at different times of the
day. An individual was only classified as attrited if no contact was made after two weeks of
successive efforts. Conditional on participating in the 2015 survey round, only 6-7% of the
respondents who were randomly assigned for the information treatment did not receive the
pamphlet.
The 2016 RUMiC survey (the 9th wave) began in late March 2016, two months after the
information intervention, and was completed eight months later in November 2016. In addi-
tion to the normal survey questions, those respondents to whom the pamphlet was delivered
were also asked to confirm whether they received the pamphlet, and whether they under-
stood the information provided in the pamphlet. All respondents (in both the treatment
and control groups) were asked whether they intended to participate in health insurance and
pension programs in 2016 if they were not already covered. Participation, both intended and
actual, are the main outcome variables in the analysis below. We include social insurance
participation intentions for two reasons. First, as the information treatment (pamphlet deliv-
ery) occurred not long before the 2016 survey round began in some cities, it is possible that
respondents interviewed at that time simply did not have sufficient time to enroll in pension
or health insurance. Indeed, when we estimate actual participation against survey month
and city fixed effects, survey month has a strong positive effect on participation: the later the
follow-up survey was implemented in 2016, the more likely that the respondent had enrolled.
Intention to participate, on the other hand, shows a weak negative correlation with survey
month. Second, use of intended behavior is not uncommon in the literature on information
12‘Local hukou’ (local residential registration) could be either rural or urban, as long as it is located withinthe metropolitan region. Thus, although RUMiC targets rural-urban migrants, it does include some “local”rural migrants.
11

interventions and decisions related to social insurance, particularly when not enough time
has passed to observe actual decisions. Liebman and Luttmer (2015), for example, similarly
examine how an information intervention affects future intentions over when to draw social
security benefits in the US.13
Concerns related to attrition are also relevant when considering use of an information
experiment jointly with the RUMiC survey. Due to the young and mobile nature of the
migrant population, attrition across RUMiC waves is a possible concern. From 2015 to 2016,
the attrition rate was 28.3%, which is similar to the 28% reported in (Chetty and Saez,
2013). Nevertheless, as the information intervention was implemented in the 2015 sample
while the outcome of interest (insurance participation) was recorded in the 2016 wave, one
might worry that attrition could affect randomization. To check this concern, a balance test
is conducted in the data subsection and robustness checks employ sample selection models
and reweighting approaches to examine potential attrition bias.
3.3 Estimation Strategy and the Model
Assuming implementation protocols were followed and that a balance test is passed, the
random assignment of the information intervention allows us to identify whether poor under-
standing of the urban health insurance and the pension programs and enrollment procedures
reduces the likelihood that respondents participate in them. We also model the decision
to participate in social insurance as a function of a city fixed-effect, exogenously provided
information and initial period participation, firm and individual characteristics. The binary
choice, Y1ij, of whether to participate in health insurance and pension programs, is modeled
as:
Y1ij = α + βTij + θY0ij + X′0ijγ + W′0ijκ+ δj + εij, (1)
where the subscripts 0 and 1 indicate variables measured in the pre-treatment (2015) and
post-treatment (2016) survey rounds, respectively. Y0ij is a lagged (pre-treatment) participa-
tion indicator; Tij indicates that individual i in city j was assigned to receive the information
treatment between the 2015 and 2016 survey rounds; X0ij is a set of pre-treatment (2015)
individual-level controls, which include age,14 gender, education, marital status, number of
children, whether an individual is self-employed, an interaction between the self-employed
13In a robustness check, we examine results using actual participation as the dependent variable to estimatethe model.
14In addition to age in years, we also include two indicator variables: whether the respondent is a womanand over 40, and a man and over 45, respectively. These threshold indicators are included because pensionrules mandate that participants cannot receive full benefits without paying the premium for 15 years, andthe retirement age for migrant women and men in China is 55 and 60 years, respectively. As they cannotexpect to receive full benefits, individuals already within 15 years of the retirement age threshold may haveless motive to participate in a pension program.
12

indicator and lagged participation, and indicators for whether he/she would remain in the
city permanently if policy permitted and whether he/she is working or not. W0ij is a set
of pre-treatment firm size and ownership indicator variables for the employer of individual
i; and δj are city fixed effects, which control for both time invariant city-level factors and
within city changes between years 0 (2015) and 1 (2016), including systematic changes in the
costs and benefits of the health insurance and pension schemes.15 The coefficient of interest
in equation (1) is β, the average treatment effect of exposure to the information intervention.
Existence, or lack, of a written employment contract introduces one potential source
of heterogeneous impacts. In design of the intervention and at the pre-analysis stage, the
team anticipated that the effect of providing information about social insurance will differ
considerably depending on whether a respondent has an employment contract. As shown
in Figure 1, health insurance and pension participation rates for those with employment
contracts in 2015 were 72%, while participation was only 13% for those without a written
contract. As it is likely that those without a written contract will be most affected by the
information intervention, we estimate equation (1) including an indicator for “no written
contract” in 2015, NC0ij, and the interaction of NC0ij and the treatment indicator, Tij:
Y1ij = α + βTij + πNC0ij + ϕTij ∗NC0ij + θY0ij + X′0ijγ + W′0ijκ+ δj + εij, (2)
In this specification, the coefficients of interest are β, which indicates the treatment effect
for individuals with a written contract in 2015, and β + ϕ, treatment effect for individuals
without a written contract in 2015. ϕ indicates whether or not the treatment effects for the
two groups differ.
Subsequent to the intervention, recognition of the variation in premiums across cities
and apparent heterogeneity in responses to treatment, led the team to examine whether the
effects of providing information varied with relative premia.16 Another plausible factor influ-
encing participation decisions are the magnitudes of premiums relative to earnings for health
insurance and pension programs. As will become apparent in our discussion of results below,
premiums vary considerably by city, and information may interact with price in influencing
the decision to participate. To this end, we next estimate models in which the treatment
indicator, Tij, is interacted with a city relative price (premium) variable:
15As the randomization was implemented separately in each of the 13 cities in the sample and city level costsand benefits vary significantly, the baseline model includes the set of city fixed effects, δj , along with thetreatment indicator and lagged participation. Further, as randomization into treatment was implemented atthe household level, we equally weight each household in the following analysis to provide efficient estimates(Athey and Imbens, 2017). Household members may also share cost and benefits of social insurance inChina, and social insurance participation is a joint decision of household members, especially for poormigrant households.
16While examining this dimension of heterogeneity was not part of a pre-analysis plan, the cities (and all thedifferences across them) were chosen as part of the pre-analysis as they were part of the baseline survey.
13

Y1ij = α + βTij + φTij ∗ Pj + θY0ij + X′0ijγ + W′0ijκ+ δj + εij, (3)
where Pj is the premium required for self-employed individuals in city j divided by the city
average monthly earnings of migrants in the RUMiC sample.
The premium paid by the self-employed is used for three reasons. First, an employee
may participate in the health insurance or pension programs at the self-employed price if
employers are not participating. Second, labor markets are competitive, and when employers
participate, costs associated with employer contributions are passed on to employees through
a lower monthly salary net of social insurance contributions. Thus, the self-employed pre-
mium is a base price that provides a reasonable proxy for the cost of participation faced by
both employees and self-employed migrants. Finally, even as the self-employed and employee
contributions differ, these premiums vary simlarly across cities.
The coefficients of interest from Equation (3) are β and φ. As the city fixed effect
controls for city premium levels, the coefficient on the treatment*premium interaction, φ,
identifies how the treatment effect varies with the city level relative premium. β is the
average treatment effect when the relative price is zero.
Finally, we estimate a model including a full set of interactions: the contract indicator
and its interaction with the treatment, as in Equation (2), the city premium (captured by
city fixed effects) and the city premium interacted with the treatment, as in Equation (3),
as well as interactions between city premium, contract, and treatment, or:
Y1ij =α + βTij + φTij ∗ Pj + ϕTij ∗NC0ij + λNC0ij ∗ Pj + µTij ∗NC0ij ∗ Pj
+ πNC0ij + θY0ij + X′0ijγ + W′0ijκ+ δj + εij, (4)
3.4 Summary Statistics and Balance Test
Balance tests and summary statistics are presented in Table 1. In panel A, a balance test is
shown for all the control variables in the full sample of the base year (2015), and the test for
2015 respondents remaining in the 2016 wave is shown in Panel B.
The first two columns of Panel A present mean values of key variables for control and
treatment groups, separately, in the base year and column 3 shows the difference between the
two groups. From these summary statistics it is evident that all individual characteristics are
similar across the treatment and control groups in the base year. However, some imbalances
are observed for firm level characteristics: workers in the treatment group are more likely to
be in small firms than their counterparts in the control group and the treatment group has a
slightly higher share of workers in foreign/joint venture firms. Further, the share of treatment
and control group is not balanced in Shanghai. Because of these imbalances, controlling for
these characteristics in the estimations is important. Panel B presents the same balance test
14

for the panel respondents in the 2016 sample, where we observe results similar to those for
the 2015 full sample.
Panel C presents the summary statistics for the total 2016 sample as well as for those
with and without an written contract, separately. Column 7 shows that the average age of
respondents is 37. Note that 18% of women and 15% of men are above the age thresholds
at which beginning participation could not lead to full pension benefits at retirement. Men
comprise 57% of the respondents, and the average years of schooling of respondents is nearly
9 years and 75% of the sample are married, and have 1.16 children. Nearly all respondents,
99.6%, were working in the previous year, with 36% self-employed, and hukou policy per-
mitting, 64% would prefer to stay in the city permanently. When comparing those with a
contract (Column 8) to those without (Column 9), it is clear that migrants in the formal
sector (with a written contract) are younger, more educated, more likely to be men, less
likely to be married and have fewer children. Employees with a contract are more likely to
work in large firms (with more than 100 workers) than those without a contract. In addition
more than 60% of workers with a contract work in firms that are state/collectively owned,
domestic private, or foreign/joint venture firms. The corresponding share for those without
contracts is only 19%.
4 Results
4.1 Intention-to-Treat Estimates
As the information intervention was randomly assigned, we use an ‘assignment to treatment’
indicator to estimate the intention-to-treat (ITT) effect. Table 2 presents the OLS estima-
tion of equation (1) in Panel A, and it is evident that, after controlling for base year health
insurance and pension participation, the average effect of assignment to the information in-
tervention is zero (model 1), and the effect does not change as base period individual controls
and firm-level controls are added in models (2) and (3), respectively. As the RUMiC survey
is sampled through workplaces, standard errors in all models are clustered at the workplace
of the household head.
Heterogeneity of Treatment with Contract Status. This average zero impact, however,
masks considerable heterogeneity in the effect of the information intervention on individuals
with and without written employment contracts. To examine this difference, Panel B of
Table 2 presents the OLS estimates of equation (2). The bottom line of the panel shows
the treatment effect on individuals without contracts by adding the coefficient on treatment
(β) to that on the interaction between treatment and the indicator for not having a contract
15

in the base year (2015) (ϕ in equation (2)). The brackets under the treatment effects are
p-values from F-tests for significance of β + ϕ. Coefficients on the indicator variable for
“no contract” suggest that individuals without a written contract in 2015 were less likely to
participate in both health insurance and pensions. From the coefficient on the no-contract-
treatment interaction term it is evident that for health insurance participation, the impact of
the information intervention is significantly different for respondents with and without con-
tracts in 2015. For those with contracts in the base year, there is no information intervention
effect. Given that before the intervention 77% of our sample with written contracts already
had health insurance, this should not be a surprise. The effect on those without contracts,
though, is positive and statistically significant. On average the intervention increased health
insurance participation for those previously without a contract by 3.2 percentage points, or
a 23.2 percent increase over the 2015 participation rate of this group (which was 13.8%).
Participation in pensions, however, was not affected by the information intervention,
regardless of whether the individual had a contract or not. This result was puzzling at first,
and led us to explore heterogeneity in treatment effects with age of the recipient in a post hoc
analyses: one explanation lies with the fact that a fairly large proportion of the sample was
within 15 years of retirement age (18% of men and 15% of women) and could not enjoy the
full benefits of pension participation. To examine this possibility, those individuals within
fifteen years of the retirement age are excluded. For this restricted sample, the estimated
results for the average treatment effects and heterogeneous effects are reported in Panel C
of Table 2. Although the information intervention had a zero average effect for this group,
the impact for those without a written contract is positive and statistically significant. In
particular, for “young” individuals without a contract, the intervention increased pension
participation by 3.9 percentage points, or a 25% increase in the participation rate of this
group.
To understand the difference in treatment responses to pension participation of the
“young” and “old” samples, we examined the wage responses to treatment for each group and
show results in Table (3). To do this, we estimate models of ln(wage) in 2016 on the infor-
mation treatment, 2015 ln(wage), and standard city fixed effects in model 1. Pre-treatment
(2015) individual level controls (age, age-squared, gender, years of schooling, marital status
and number of children) are included in model 2, and model 3 includes pre-treatment firm
size and ownership indicator variables. With inclusion of the lagged ln(wage) term, the co-
efficient on the treatment may be interpreted as the contribution of the intervention to the
increase (or decrease) in wages in the following period.17 In the bare bones estimates (model
1) and models with a full set of pre-treatment controls (model 3), we find that older employees
17One might alternatively estimate this change by regressing the change in log wage on pre-treatment vari-ables.
16

(within 15 years of retirement), experience a 7.2 percent wage increase with treatment even
as their pension program participation remains unchanged. We observe no similar increase
in the wage earned by the younger sample, even as they increase participation in the urban
employee pension program. Thus, while older workers can expect to gain less from pension
enrollment, the information intervention appears to have facilitated a bargaining outcome in
which they have split the surplus from not participating with their employers. In the RUMiC
cities, where the average employee contribution is 8% and the employer contributes between
14% and 21%, the magnitude of the “bargained” outcome makes intuitive sense: employers
grant some higher return to employees, but generally less than half of the mandated employer
contribution.18 As both employers and employees lose contributions made to the urban em-
ployee pension fund on behalf of older employees, it is incentive compatible for both older
workers and their employers to engage in this type of bargaining.
Heterogeneity of Treatment with the Relative Premium. Apart from possessing
a contract, differences in relative premium levels across cities may also introduce heterogene-
ity in the treatment effect. To understand the potential for this heterogeneity, Figure 2 plots
the unconditional city-level treatment effect versus the relative premiums for health insur-
ance and pension programs, respectively.19 A significant negative relationship is observed
for health insurance: in cities with a higher relative premium the unconditional treatment
effect was negative between 2015 and 2016, while in cities with a low premium, we observed
a positive increase in participation. With respect to pensions, one observes no association
between participation and premiums, but this is driven by one city, Luoyang. Excluding
Luoyang one also observes a negative relationship, but this is much weaker than for health
insurance. Thus, it is plausible that in cities where premiums were high, migrants decided
to withdraw from social insurance once informed of prices and benefits, whereas participa-
tion rates increased subsequent to receiving information in those cities where premiums were
relatively low.
To allow for the treatment effect to vary with local health insurance and pension premi-
ums, equation (3) is next estimated and results are presented in Panel A of Table 4. Recall
that in this specification, the included city fixed effects control for differences in labor market
conditions across cities, the average earnings of migrants and in the unobserved city-level
18Based on conversations with both migrants and their employers, researchers have believed that this bargain-ing outcome exists (Giles et al., 2013; Meng, 2017), but the wage response of older workers who cannot fullybenefit from pension participation offers the first corroborating empirical evidence that informed workersmay bargain with employers for higher wages.
19Specifically, we first obtain coefficients from the health insurance and pension participation models esti-mated with city-specific information treatment indicators (city dummies interacted with the informationtreatment) in models that control for the city fixed effects and then plot the coefficients on the city-treatmentinteractions against the city-level relative health insurance and pension premiums, respectively.
17
differences in characteristics of migrants attracted to the city. The interaction of the relative
price (or relative premium) with the treatment thus allows us to identify variation in treat-
ment effects with the relative cost of insurance. The coefficient on the relative premium and
the treatment interaction term for health insurance is negative in all three specifications. The
baseline model suggests that after controlling for the relative price level (through the city
fixed effect), the price elasticity on the treated group is a negative 0.94, indicating that 1%
increase in the relative health insurance premium reduces participation by 0.94 percentage
points. Controlling for individual observables increases the price elasticity to 1.11, and in
the third model, when firm size and ownership characteristics are also included, the price
elasticity increases to 1.18. Next, in Panel B of Table 4, additional interactions of the in-
formation treatment, city-level relative premium and contract status are included, and we
note that the price elasticity among employees without a contract is of greater magnitude at
negative 1.56. Evident also in Figure 3, the treatment effect for health insurance is of larger
magnitudes in cities with lower relative premiums. As calculated at the bottom of Table 4
the treatment effect increases from 2.9 percentage points at the median relative price (0.075)
to 6.7 and 11.2 percentage points at the 25th and 10th percentiles of the city-relative pre-
mium distribution, respectively.20 When premiums are relatively low, information frictions
may inhibit health insurance participation. At the same time when the premiums are high
and participants lack information because part of the premium is paid by the employer, some
may make an uninformed decision to participate. Upon receiving more accurate information
and recognizing that their wages could be higher if they do not participate, some employees
may withdraw from the urban health insurance program.
One might be concerned that job-switching may drive movement toward non-participation
in cities where health insurance premiums are high. Of individuals who exited from health
insurance programs between 2015 and 2016, only 15% had started a new job since the infor-
mation intervention, and these were evenly distributed across all cities. Thus, it is unlikely
that involuntary changes in employment in high premium cities can explain the effect of
higher relative premiums on participation in health insurance.
In contrast to the role of relative price in the impact of information on health insurance
participation decision, there is no evidence that the relative pension premiums interact with
information to influence participation in pension programs. Coefficients on the information
treatment interacted with the relative premium are not statistically significant for pensions
(Panel A of Table 4), even after excluding Luoyang, the outlier in Figure 2. Even among
respondents without a contract, as evident in Panel B of Table 4, the treatment effect does
not vary with relative pension premiums.
20As the base 2015 participation rate in urban employer health insurance was 13.8% for employees withouthealth insurance, this reflects 21, 49 and 81 percent increases in participation rates as relative healthinsurance premia decline from the median to the 25th and 10th percentiles.
18

Why do we observe a difference between health insurance and pension participation re-
sponsiveness to relative premiums? An imperfect substitute, in the form of health insurance
through the new rural collective medical system (NRCMS), is available for migrant workers
in their home counties. Although migrants face the cost and inconvenience of a return mi-
gration trip when ill, this may be viewed as a reasonable, if highly imperfect substitute for
the urban employee health insurance program.21
4.2 Treatment-on-the-Treated
As discussed in Section 3, roughly 7% of respondents who were assigned to the treatment
group did not receive a pamphlet and explanation of the benefits from participating in health
insurance and pensions. While a rather small proportion, estimates of the effect of treatment
on the treated tend to be larger in magnitude than “reduced form” intent-to-treat estimates.
To estimate the treatment-on-treated, we employ an instrumental variables approach in which
the variable Tij in equations (1), (2), (3), and (4) is an indicator of actual receipt of a pamphlet
and information, and assignment to the treatment is used as an instrument. The results for
the four equations are presented in Table 5. As one would expect, with a strong correlation
between intended and actual treatment, the instrument is quite strong and there is no reason
to be concerned with weak instrument bias.22
For health insurance, shown in Panel A, the estimated treatment effects are larger than
intention to treat effects, as one might expect, and qualitatively very similar. For example,
controlling for city-varying price effect, the average treatment on the treated effect is 9.9
percentage points in model 3 (sixth column of Table 5), whereas the intention to treat effect
is 9.1 percentage points (see model 3 under health insurance as reported in Panel A of Table
4). For the subgroup of individuals without contracts in the base year, controlling for the
city-varying price effect, the treatment effect on the treated is 16.4 percentage points while
the intention to treat effect is 14.7 percentage points (see model 3 of equation (4) as reported
in column 3 of Panel B in Table 4).
Panel B of Table 5 shows the comparable treatment-on-treated results for the pension pro-
gram participation decision of respondents young enough to make 15 years of contributions
before reaching retirement age. With this restricted sample, the treatment-on-the-treated
effect for individuals without a contract is positive and statistically significant at the slightly
larger magnitude as those shown for the intention-to-treat effect in Table 2. As in the estima-
tion for intention-to-treat effects, the treatment-on-treated estimates also suggest that there
21As of 2015, nearly 81 percent of rural migrants reported that they had NRCMS insurance in their homecounties. It is notable that when an indicator for NRCMS participation in 2015 is included as a covariate,results examining the decision to participate in urban employee health insurance are stronger.
22As the F-statistics are over 1000, we do not report these values in Table 5. The first stage estimationresults are available upon request.
19

is no effect of the information intervention on pension participation for the total sample.23
4.3 Assessing the Potential for Bias Due to Attrition
Due to the mobile nature of the migrant population, one observes considerable attrition be-
tween RUMiC waves. Between 2015 and 2016 the sample attrition rate was 28.3%, thus it is
reasonable to consider whether attrition might affect both randomization and the interpre-
tation of our results. To examine this question, we first compare Panels A and B of Table 1.
From the table, note that most individual characteristics are balanced for the total sample
as well as for the panel respondents, hence, they should also be balanced for those who at-
trit after the 2015 wave. The imbalances in firm-level control variables and in city dummy
variables across control and treatment groups are quite similar for both the total sample and
the stayers, suggesting no significant variation in imbalances between stayers and attritors.
Although we do not observe a difference in the balance test between the attritors and
the stayers, attrition may still affect our randomization in unobserved ways. To examine
the extent to which this is the case, we first employ a Heckman sample selection correction
model to control for attrition bias. More specifically, we estimate an attrition equation. For
equations (2) and (3), the sample selection models are specified as:
Pr(Attij) = α + βTij + πNC0ij + φTij ∗NC0ij + θijY0ij + X′0ijγ + W′0ijκ+ Z′λ+ δj + εij,
and
Pr(Attij) = α + βTij + φTij ∗ Pj + θijY0ij + X′0ijγ + W′0ijκ+ Z′λ+ δj + εij,
(5)
where Z is a set of instruments identifying attrition and all the other variables are the
same as in equations (2) and (3). The results obtained from equation (5) are then used to
calculate an Inverse-Mills ratio, which, in turn, is included in the estimation of equation (2)
to control for potential sample selection bias. The instruments used in equation (5) follow
a strategy of using respondent baseline attitudes toward the survey to predict attrition (e.g.
Mu, 2006) and are drawn from two questions answered by enumerators in the 2015 survey.
The first question is “Do you think the respondent was careful and serious in answering
the questions? 1. very serious throughout the survey; 2. fair; 3. not very serious.” An
indicator variable is set equal to one if the enumerator reported that the respondent was
“very serious throughout the survey” or “fair.” The second question asked “To what extent
do you think the respondent’s answers are reliable? 1. very reliable; 2. relatively reliable; 3.
fair; 4. relatively not reliable; and 5. not reliable.” For this instrument, an indicator variable
is set equal to one if the response was ‘very reliable’, ‘relatively reliable’ or ‘fair,’ and zero
23The results are available upon request from the authors.
20

otherwise. These two variables reflect individuals’ engagement with the survey, which should
not be directly related to the decision to participate in insurance.
A respondent’s level of trust in the social insurance system and own trustworthiness
may be positively correlated, and so one might worry that trustworthiness revealed in these
answers could be correlated with whether an individual participates in the social insurance
programs, rendering these variables problematic. To overcome this potential problem, the
vector of individual controls, X1ij, includes a self-assessed indicator of trust in some models
to directly control for this potential channel through which the exclusion restriction would
be violated.24 As this question on trust was only answered by individuals who were present
at the time of the 2015 survey, the sample with responses on trust is reduced by one-third.
We estimate the sample selection correction model for equations (2) and (3) using the
Heckman two-step method and confidence intervals are estimated using a bootstrap with
1,000 replications. The selected results of the first stage estimation of equation (5) are
reported in Online Appendix A.4. For the full sample estimation, the two instruments are
jointly statistically significant with signs and magnitudes that are intuitively reasonable.
Those who are regarded as serious about the survey and with answers to questions judged to
be more reliable are also more likely to participate in the next survey round. The weak-IV
F-tests for the two specifications are 14.36 and 14.18. For the smaller sample that includes
the trust measure, the IVs are weaker with F-test statistics of 11.25
The selected results for the sample selection correction model of equations (2) and (3)
are reported in Table 6. The results reported in Panel A include the full sample without
controlling for trust, Panel B uses the sample individuals with the trust measure and includes
the trust variable among controls, while Panel C uses the trust sample and does not control
for trust. The results in Panel A show that controlling for sample selection bias does not
change our main results. The coefficient on the level of intention to treat controlling for city
premium varying treatment effect is 10.6 percentage points as opposed to the 9.1 percentage
points in the model not controlling for attrition bias. In addition, the sample selection
correction term, λ, is statistically insignificant. In the case of equation (2), the intention
to treat effect for those without a contract in the base year is 3.7 (0.001-0.071) percentage
points, instead of 3.2 percentage points when not controlling for attrition.
When we exclude individuals with missing trust variable (the sample size falls from 6,396
to 4,037 in the first step estimation and from 4,587 to 2,881 in the second step) and controlling
24The question on trust reads “In general, do you think majority of people can be trusted or one should becareful when dealing with people in general? 1. Majority of people can be trusted; 2. One should alwaysbe careful; 3. Do not know”. We define the ‘trust’ dummy variable as those who answer “1”.
25We also used instruments separately. While the IV in the trust sample passes the rule of thumb test forstrong instrument, the F-test on reliableness IV is 6.9. The second stage results do not differ much fromthose reported below. These results are available upon request from the authors.
21

for trust (Panel B of Table 6), the estimated intention to treat effect for equation (3) with
control for price-varying treatment effect falls from 10.6 percentage points for the full sample
to 9.2 percentage points. For equation (2), the intention to treat effect for individuals without
contracts in the base year fell from 3.7 percentage points for the full sample to 2.9 percentage
points for the trust sample and it is no longer statistically significant at the 5% level. These
changes in estimated effects are driven by reduction in the sample size. Moving to Panel
C (with the trust sample and excluding the trust variable among the set of regressors, X),
the estimated intention to treat effect does not change from that with controlling for trust
estimation, suggesting that our results from the sample selection correction model are robust
to a potential violation of exclusion restriction.
We further test the potential attrition bias by using an inverse probability weighting
(IPW) method suggested by Fitzgerald et al. (1998). The simple approach assumes that
selection is only explained by observables. Equation 5 is first re-estimated without the in-
strumental variables, Zij, and then the inverse of predicted probabilities is used to weight
each individual in the full sample, including both attritors and stayers. These weights are
then used to estimate Equations (2) and (3) to obtain the sample selection corrected esti-
mates of the treatment effect. The estimated results using this IPW re-weighting method
are reported in Panel D of Table 6, and provide further confirmation that our estimates are
unlikely to suffer from appreciable attrition bias. While neither approach above provides
an iron-clad control for attrition related to unobservables, we are reassured by the fact that
results from both of these commonly used methods point to very minor and statistically
insignificant bias in the same direction.
4.4 Other Robustness Checks
In this subsection, we further test the robustness of our estimated treatment effects. First,
as we note above the dependent variable in the participation models includes 2016 both
actual and stated intentions to participate. The main reason for this is that, in some cities,
the survey was conducted only a short time after the information intervention, and some
respondents who received the information treatment may not have had enough time to act
on an intention to change their behavior. This is evident in Figure 4, where the survey month
is plotted first against the proportion of respondents who increased actual participation in
health insurance and pension programs between 2015 and 2016, and second, against the
proportion of those who indicated that they intended to participate in 2016. As duration
between the intervention and 2016 survey round increases with the 2016 survey month, the
figure shows that actual additional participation increases with duration between surveys
while the intention to participate decreases.
To examine whether the treatment effect has the same trend when using actual partici-
22

pation, we estimate equations (2) and (3) as ordered-probit models, in which the dependent
variable is replaced by a variable with 3 categories: those who did not participate and have
no reported intention to participate in 2016 are coded as zero, those with intention to partic-
ipate before the end of 2016 are coded as 1, and those who actually participated are set to 2.
Selected marginal effects are reported in Table 7. Panel A reports the marginal effects from
health insurance models and Panel B reports the marginal effects from pension participation
estimates.
After controlling for price-varying treatement effects and lagged participation, as in equa-
tion (3) (and shown in columns 5 and 6 of Table 7), the groups which were assigned to the
information intervention have a higher proportion of respondents both intending to partici-
pate and actually participating. The increase in actual participation is 6.4 percentage points,
while the increase in intention to participate is 0.5 percentage points. Both effects are pre-
cisely estimated at the 5% significance levels. The relatively low intention to participate
effect reflects the 5.1 percent of respondents from the full sample who indicated intention to
participate in 2016, but who have not yet enrolled. The 0.5 percentage point is roughly 9.7%.
Thus, the assignment to the treatment induced around 9.7% more respondents to intend to
participate relative to the control group. We report two sets of results for equation (2):
the treatment and treatment interacted with the base-year no-contract indicator (Columns 1
and 2) and the treatment interacted with both base-year contract and base-year no-contract
indicators (Columns 3 and 4). We use this approach because it is not easy to conduct a joint
test in ordered probit estimation. Columns 3 and 4 confirm the size of the treatment effect
for each group as well as the precision of the estimates. These results show that assignment
to the treatment increases both intention to participate and actual participation for those
without a written contract in the base year.
Second, recognizing that workers without a contract also inlcude the self-employed, one
might be concerned that the stronger result among workers without a contract is driven by
self-employment and not presence of a contract. To assess this, we split the sample into
those who are wage-employed and self-employed at baseline in 2015, and estimate separately.
In Table 8, we show that the magnitude of the “no contract effect” is larger among the
wage employed and still significant at the 10% level. The direction of the treatment effect is
similar for the self-employed group, and the magnitude is still economically, if not statistically,
significant. This leads us to conclude that the information intervention had most purchase
among wage-employees without a contract in 2015.
Third, because the proportion of the sample randomly selected for the pamphlet distri-
bution differs between Shanghai and the rest of the cities, we test whether this may affect
our results by adding an interaction term between the assignment to the treatment and the
Shanghai dummy. We also estimate an equation with Shanghai excluded from the sample.
23
These results together with the original estimation of Equation (3) are reported in Panel A
of Table 9. Comparing results across the panel, it is clear that the difference in sampling
proportion between Shanghai and other cities does not affect the estimated treatment effect.
The fourth sensitivity test examines potential spillover effects. Although the information
experiment is based on random assignment, it is possible that some individuals are working
in large workplaces where members of both the treatment and control groups are present, and
information may be spread from treated individuals to those who are in the control group.
Similarly, migrants who move from the same sending county to the same destination city are
often part of the same network, and within such a network, information may flow between
members of the treatment and control groups. To test for these types of spillover effects
we generate two dummy variables: one indicating individuals from a workplace where both
treated and control respondents coexist (mixed firm); the other indicating that a home-county
network has members of both control and treatment groups (mixed home-county). These
two dummy variables are then interacted with the treatment assignment dummy variable.
Three different specifications are estimated for equation (3): 1. including the mixed firm
dummy and its interaction term with the assignment to treatment; 2. including the mixed
home-county dummy and its interaction term; 3. including both mixed-firm and mixed-home
county dummies together with their interaction terms with assignment to the treatment. The
results are presented in Panel B of Table 9. As can be seen from these results, spillover effects
are not affecting our main results.
5 Conclusions
In both China and the international policy communities there is broad recognition that
social insurance has an important role to play in the process of economic development and
urbanization. Indeed, the 2019 World Development Report (World Bank, 2019) emphasizes
the importance of extending social insurance coverage to informal sector workers, which in
China are primarily rural-urban migrants lacking formal contracts. There is a tendency for
those providing policy advice, however, to simply assume that “mandating participation”
in a social insurance scheme will be sufficient to cover informal sector workers. The China
experience, however, should offer caution to the belief that mandates alone will suffice to
raise participation. Informal sector workers, including new migrants from the countryside
are often not participating in urban employee social insurance schemes for a number of
reasons. Finding a way to bring such informal sector workers into social insurance systems,
even with mandates and a government with relatively high administrative capacity, may
pose a challenge for policy makers in many settings. Results from this paper suggest that
lack of information may contribute to reducing participation among those workers who lack
24
contracts, and that providing information may be a relatively low cost means of raising
coverage.26
The China example also raises the prospect that fiscally decentralized systems targeting
different populations may lead to only nominal “universal coverage.”27 While most migrants
have access to insurance through their home counties, through the New Rural Collective
Medical System (NRCMS), accessing subsidized care requires returning home when ill or
suffering an injury. Thus, in practice, it is often not feasible for rural migrants to access care
through NRCMS insurance. Even with lower reimbursement rates and less certain quality at
rural clinics, existence of this alternative likely contributes to price sensitivity when receiving
information about the urban employee health insurance system. In cities where relative
premiums are low, lack of information deters participation in health insurance, whereas in
places where premiums are relatively high, the same lack of information actually leads to
higher levels of participation.
This information intervention was particularly effective for informal sector employees
who did not have a written contract in the base year. For this group, the base year rate of
participation in the urban employee health insurance program was relatively low at 13.8%.
With assignment to information treatment, the participation of this group increased by 3.2
percentage points. The treatment effect also varied considerably with the city relative health
insurance premium, with the treatment effect increasing from 2.9 percentage points at the
median relative premium to 6.7 and 11.2 percentage points as the relative premium declined
to the 25th and 10th percentiles of the city relative premium distritubion. In the context of
the findings of Wagstaff et al. (2016) and Thornton et al. (2010), this constitutes a dramatic
increase within one year, and offers promise of boosting participation through relatively low
cost education drives aimed at informing informal sector workers about the benefits of health
insurance and other forms of social insurance.
Information interventions alone, however, are unlikely to bring full urban health insurance
coverage to the rural migrant population. A one year boost in coverage of 3.2 percentage
points still leaves more than 80 percent of migrants without employment contracts lacking
health insurance coverage in the cities where they work. While further research may demon-
strate the potential for information interventions to have a cumulative effect over time and
to be reinforced by steps to reduce the transaction costs associated with enrolling (Capuno
et al., 2016), we view it likely that institutional reforms unifying health insurance programs
26In spite of mandates, some employers may simply decide not to make contributions on behalf of theiremployees. This may be particularly likely for smaller firms facing little likelihood of an audit from thelabor bureau.
27Yu (2015) among others have declared China’s success in providing universal health insurance to 1.3 billionpeople, yet as survey-based research has confirmed, rural migrants tend to remain without coverage or arecovered by rural policies that are difficult to exercise when working and living in distant cities.
25
across urban and rural areas and providing premium subsidies for lower income workers may
be necessary to approach full coverage.
With respect to pension program participation, the effect of providing information was
also positive and significant for informal sector workers young enough to contribute for suf-
ficient time to receive a full benefit at retirement. Unlike health insurance, pension program
participation does not vary with relative premiums, but this likely reflects the fact that the
new rural pension program, with low basic benefits, is not perceived to be a substitute for
pension insurance under the urban employee pension scheme. Further, and in contrast to
the rural and urban health insurance programs, receiving a benefit from the urban employee
pension system may not preclude expectations of receiving accrued benefits under the new
rural pension as well.
The wage response to the treatment effect offers corroborating evidence that older infor-
mal sector workers bargain with employers over wages in lieu of enrollment in the mandated
urban employee pension program. While the information treatment increases the likelihood
that informal employees more than fifteen years from retirement age will enroll in the ur-
ban employee pension, the treatment has no effect on the participation of older workers. A
positive treatment effect on wage of 7.2%, however, is consistent with a bargained outcome
in which an employer offers a higher wage to informal workers in lieu of contributions to a
pension that brings fewer benefits to both. With respect to China’s urban employee pension
program, this suggests that formal participation may be increased if workers with fewer than
fifteen years in the program are able to draw on both employer and employee contributions
at retirement. More broadly, the pension results suggest that while providing program and
process information may be a low cost means of increasing enrollment, success in expand-
ing participation in a social insurance program also requires careful attention to incentives
embedded in program details.
References
Ashenfelter, O. (1983). Determining participation in income-tested social programs. Journal of theAmerican Statistical Association 78 (383), 517–525.
Athey, S. and G. Imbens (2017). The econometrics of randomized experiments. In A. V. Banerjeeand E. Duflo (Eds.), Handbook of Field Experiments, Volume 1 of Handbook of Economic FieldExperiments, Chapter 3, pp. 73–140. North-Holland.
Bergman, P. L. S. (2015). Parent-child information frictions and human capital investment: Evi-dence from a field experiment. CESifo Working Paper 5391, CESifo Group Munich.
Bosworth, B. and S. Collins (2008). Accounting for growth: Comparing China and India. TheJournal of Economic Perspectives 22 (1), 45–66.
26

Capuno, J. J., A. D. Kraft, S. Quimbo, C. R. Tan, and A. Wagstaff (2016). Effects of price,information, and transactions cost interventions to raise voluntary enrollment in a social healthinsurance scheme: A randomized experiment in the Philippines. Health Economics 25 (6), 650–662.
Chetty, R. (2015). Behavioral economics and public policy: A prgramtic perspective. AmericanEconomic Review 105 (5), 1–33.
Chetty, R., J. N. Friedman, and E. Saez (2013). Using differences in knowledge across neighborhoodsto uncover the impacts of the EITC on earnings. American Economic Review 103 (7), 2683–2721.
Chetty, R., A. Looney, and K. Kroft (2009). Salience and taxation : Theory and evidence. AmericanEconomic Review 99 (4), 1145–1177.
Chetty, R. and E. Saez (2013). Teaching the tax code: Earnings responses to an experiment withEITC recipients. American Economic Journal: Applied Economics 5 (1), 1–31.
Das, J. and J. Leino (2011). Evaluating the rsby: Lessons from an experimental informationcampaign. Economic and Political Weekly 46 (32), 85–93.
Fitzgerald, J., P. Gottschalk, and R. Moffitt (1998). An analysis of sample attrition in panel data:The Michigan panel study of income dynamics. Journal of Human Resources 33 (2), 251–99.
Frijters, P., R. Gregory, and X. Meng (2015). The role of rural migrants in the Chinese urbaneconomy. In C. Dustmann (Ed.), Migration: Economic Chanage, Social Challenge, pp. 33–67.Oxford University Press.
Gallagher, M., J. Giles, A. Park, and M. Wang (2014). China’s 2008 Labor Contract Law: Imple-mentation and implications for China’s workers. Human Relations 39 (1), 197–235.
Giles, J. and R. Mu (2007). Elderly parent health and the migration decision of adult children:Evidence from rural China. Demography 44 (2), 265–288.
Giles, J., D. Wang, and A. Park (2013). Expanding social insurance coverage in urban China.Research in Labor Economics 37, 123–179.
Gong, X., T. Kong, S. Li, and X. Meng (2008). Rural-urban migrants: A driving force for growth.In L. Song and W. T. Woo (Eds.), China’s Dilemma. Asia Pacific Press.
Grogger, J. (2003). The effects of time limits, the EITC, and other policy changes on welfare use,work, and income among female-headed families. The Review of Economics and Statistics 85 (2),394–408.
Guthmuller, S., F. Jusot, and J. Wittwer (2014). Improving takeup of health insurance program:A social experiment in France. The Journal of Human Resources 49 (1), 167–194.
Levy, S. (2008). Good Indentions, Bad Outcomes: Social Policy, Informality and Economic Growthin Mexico. Washington: Brookings Institution Press.
Li, X. and R. Freeman (2015). How does China’s new labor law affect floating workers? BritishJournal of Industrial Relations 53 (4), 711–735.
27

Liebman, J. B. and E. F. P. Luttmer (2015). Would people behave differently if they better under-stood social security? Evidence from a field experiment. American Economic Journal: EconomicPolicy 7 (1), 275–299.
Meng, X. (2012). Labor market outcomes and reforms in China. The Journal of Economic Per-spectives 26 (4), 75–101.
Meng, X. (2013). Rural-urban migration. In C. F. Ross Garnaut and L. Song (Eds.), China: A NewModel for Growth and Development, pp. 179–198. the Australian National University E-Press.
Meng, X. (2017). The Labor Contract Law, macro conditions, self-selection, and labor marketoutcomes for migrants in China. Asian Economic Policy Review 12 (1), 45–65.
Meng, X. and C. Manning (2010). The great migration in China and Indonesia – trend and in-stitutions. In X. Meng and C. Manning with S. Li and E. Effendi (Ed.), The Great Migration:Rural-Urban Migration in China and Indonesia, pp. 1–22. Edward Elgar Publishing Ltd.
Mu, R. (2006). Income shocks, consumption, wealth, and human capital: Evidence from Russia.Economic Development and Cultural Change 54 (4), 857–892.
Muller, A. (2016). Hukou and health insurance coverage for migrant workers. Journal of CurrentChinese Affairs 45 (2), 53–82.
National People’s Congress (2011). Social insurance law (in Chinese). Government Document 35.
Perry, G., W. Maloney, O. Arias, P. Fajnzylber, A. Mason, and J. Saavedra-Chanduvi (2007). In-formality: Exit and Exclusion. World Bank Latin American and Caribbean Studies. Washington:The World Bank.
State Council (2009). Pension insurance portability issues for workers of urban firms (in Chinese).Government document.
Thornton, R. L., L. E. Hatt, E. M. Field, M. Islam, F. S. Diaz, and M. A. Gonzalez (2010). Socialsecurity health insurance for the informal sector in Nicaragua: A randomized evaluation. HealthEconomics 19, 181–206.
Tombe, T. and X. Zhu (2015). Trade, migration and productivity: A quantitative analysis of China.Working Paper 542, University of Toronto.
Wagstaff, A. and M. Lindelow (2008). Can insurance increase financial risk? The curious case ofhealth insurance in China. Journal of Health Economics 27 (4), 990–1005.
Wagstaff, A., M. Lindelow, G. Jun, X. Ling, and J. Qian (2009). Extending health insurance to therural population: An impact evaluation of China’s New Cooperative Medical Scheme. Journalof Health Economics 28 (1), 1–19.
Wagstaff, A., H. T. H. Nguyen, H. Dao, and S. Bales (2016). Encouraging health insurance for theinformal sector: A cluster randomized experiment in Vietnam. Health Economics 25 (6), 663–674.
WHO (2010). China’s new health plan targets vulnerable. Bulletin of the World Health Organiza-tion 88 (1).
Yu, H. (2015). Universal health insurance coverage for 1.3 billion people: What accounts for China’ssuccess? Health Policy 119, 1145–1152.
28

Table 1: Balance Tests and Summary Statistics
2015 Sample 2016 Panel Sample
Panel A: 2015 Balance Test Panel B: 2016 Balance Test Panel C: 2016 Summary Stats
W/t With
Control Treated Diff Control Treated Diff Total Contract Contract
Main Outcomes
Health Insurance with Intention 0.418 0.435 0.016 0.424 0.225 0.768
Pension with Intention 0.429 0.442 0.013 0.434 0.237 0.773
Health Insurance excl. Intention 0.371 0.376 0.005 0.372 0.159 0.742
Pension excl. Intention 0.381 0.376 -0.006 0.379 0.172 0.738
Baseline Indiv. Charact.
2015 Health Insurance 0.339 0.337 -0.002 0.361 0.370 0.009 0.364 0.141 0.751
2015 Pension 0.338 0.348 0.010 0.357 0.381 0.024 0.365 0.155 0.730
Age 34.98 35.41 0.430 37.08 37.26 0.190 37.14 38.20 35.30
(10.39) (10.50) (10.12) (10.16) (10.13) (10.27) (9.62)
Woman aged >40 0.149 0.164 0.015 0.179 0.185 0.006 0.181 0.219 0.114
Men aged >45 0.114 0.115 0.002 0.144 0.149 0.004 0.146 0.155 0.130
Years of Schooling 8.965 8.997 0.032 8.898 8.996 0.099 8.932 8.413 9.831
(3.13) (3.12) (3.16) (3.14) (3.15) (3.06) (3.11)
Dummy for Males 0.567 0.570 0.003 0.565 0.586 0.021 0.572 0.559 0.595
Dummy for Being Working 0.996 0.997 0.001 0.995 0.997 0.002 0.996 0.994 1.000
Written Contract 0.370 0.360 -0.009 0.368 0.363 -0.005 0.366 0.000 1.000
Self-Employed 0.305 0.318 0.013 0.354 0.367 0.014 0.358 0.564 0.000
Willing to Stay Permanently 0.615 0.615 0.000 0.646 0.640 -0.006 0.644 0.656 0.622
Married 0.697 0.706 0.009 0.749 0.742 -0.007 0.746 0.787 0.677
Number of Children 1.068 1.096 0.028 1.159 1.165 0.006 1.161 1.256 0.997
(0.90) (0.89) (0.88) (0.88) (0.88) (0.87) (0.87)
Firm Level Controls
Firm Size 4.528 4.342 -0.187** 4.323 4.204 -0.119 4.281 3.186 6.178
(2.62) (2.51) (2.58) (2.50) (2.55) (2.19) (1.94)
Firm Ownership
State and collective 0.070 0.063 -0.007 0.072 0.068 -0.004 0.071 0.028 0.145
Domestic private 0.272 0.254 -0.017 0.246 0.231 -0.015 0.241 0.150 0.398
Foreign and joint venture 0.088 0.106 0.017* 0.090 0.110 0.020* 0.097 0.015 0.239
Self-employed 0.561 0.568 0.008 0.584 0.583 0.000 0.583 0.802 0.204
Other 0.009 0.009 0.000 0.008 0.008 0.000 0.008 0.004 0.015
City Indicators
Dongguan 0.065 0.069 0.004 0.059 0.064 0.005 0.061 0.025 0.122
Shenzhen 0.065 0.066 0.001 0.071 0.072 0.001 0.071 0.051 0.107
Luoyang 0.065 0.067 0.002 0.076 0.078 0.002 0.077 0.084 0.064
Hefei 0.089 0.093 0.004 0.085 0.096 0.011 0.088 0.114 0.044
Bengbu 0.044 0.045 0.002 0.043 0.040 -0.003 0.042 0.061 0.009
Chongqing 0.086 0.092 0.007 0.089 0.106 0.017* 0.095 0.100 0.087
Shanghai 0.131 0.087 -0.044*** 0.125 0.084 -0.041*** 0.111 0.113 0.108
Nanjing 0.088 0.088 0.000 0.091 0.071 -0.020** 0.084 0.077 0.096
Wuxi 0.044 0.048 0.004 0.042 0.048 0.005 0.044 0.021 0.085
Hangzhou 0.091 0.095 0.004 0.080 0.088 0.009 0.083 0.080 0.088
Ningbo 0.047 0.051 0.004 0.041 0.048 0.007 0.043 0.029 0.068
Wuhan 0.095 0.101 0.005 0.096 0.097 0.000 0.096 0.120 0.055
Chengdu 0.092 0.097 0.005 0.102 0.108 0.007 0.104 0.125 0.067
No. of Observations 4244 2152 3005 1582 4587 3112 1475
P-value of F-test for Joint Sig. 0.138 0.236
Source: RUMiC Migrant Survey 2015 and 2016, RUMiC Information Intervention Field Experiment, 2016.Note: Standard deviation in parentheses. Significance codes: *** p<0.01, ** p<0.05, * p<0.1.
29
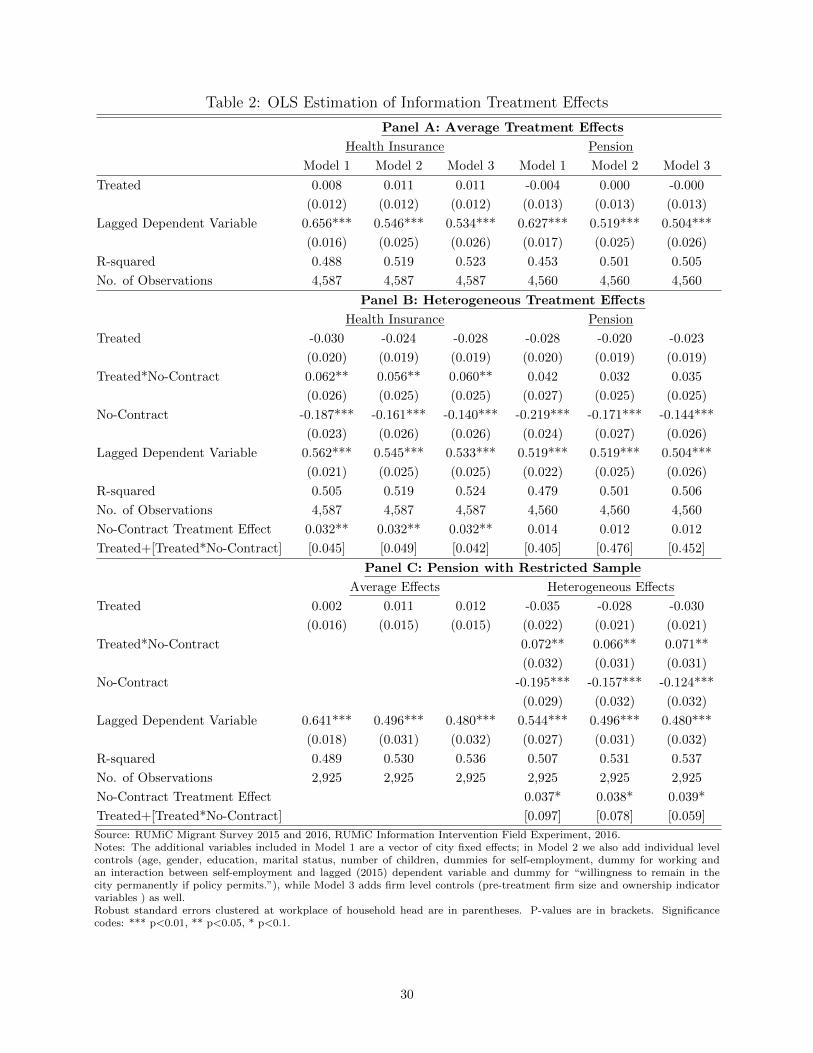
Table 2: OLS Estimation of Information Treatment Effects
Panel A: Average Treatment Effects
Health Insurance Pension
Model 1 Model 2 Model 3 Model 1 Model 2 Model 3
Treated 0.008 0.011 0.011 -0.004 0.000 -0.000
(0.012) (0.012) (0.012) (0.013) (0.013) (0.013)
Lagged Dependent Variable 0.656*** 0.546*** 0.534*** 0.627*** 0.519*** 0.504***
(0.016) (0.025) (0.026) (0.017) (0.025) (0.026)
R-squared 0.488 0.519 0.523 0.453 0.501 0.505
No. of Observations 4,587 4,587 4,587 4,560 4,560 4,560
Panel B: Heterogeneous Treatment Effects
Health Insurance Pension
Treated -0.030 -0.024 -0.028 -0.028 -0.020 -0.023
(0.020) (0.019) (0.019) (0.020) (0.019) (0.019)
Treated*No-Contract 0.062** 0.056** 0.060** 0.042 0.032 0.035
(0.026) (0.025) (0.025) (0.027) (0.025) (0.025)
No-Contract -0.187*** -0.161*** -0.140*** -0.219*** -0.171*** -0.144***
(0.023) (0.026) (0.026) (0.024) (0.027) (0.026)
Lagged Dependent Variable 0.562*** 0.545*** 0.533*** 0.519*** 0.519*** 0.504***
(0.021) (0.025) (0.025) (0.022) (0.025) (0.026)
R-squared 0.505 0.519 0.524 0.479 0.501 0.506
No. of Observations 4,587 4,587 4,587 4,560 4,560 4,560
No-Contract Treatment Effect 0.032** 0.032** 0.032** 0.014 0.012 0.012
Treated+[Treated*No-Contract] [0.045] [0.049] [0.042] [0.405] [0.476] [0.452]
Panel C: Pension with Restricted Sample
Average Effects Heterogeneous Effects
Treated 0.002 0.011 0.012 -0.035 -0.028 -0.030
(0.016) (0.015) (0.015) (0.022) (0.021) (0.021)
Treated*No-Contract 0.072** 0.066** 0.071**
(0.032) (0.031) (0.031)
No-Contract -0.195*** -0.157*** -0.124***
(0.029) (0.032) (0.032)
Lagged Dependent Variable 0.641*** 0.496*** 0.480*** 0.544*** 0.496*** 0.480***
(0.018) (0.031) (0.032) (0.027) (0.031) (0.032)
R-squared 0.489 0.530 0.536 0.507 0.531 0.537
No. of Observations 2,925 2,925 2,925 2,925 2,925 2,925
No-Contract Treatment Effect 0.037* 0.038* 0.039*
Treated+[Treated*No-Contract] [0.097] [0.078] [0.059]
Source: RUMiC Migrant Survey 2015 and 2016, RUMiC Information Intervention Field Experiment, 2016.Notes: The additional variables included in Model 1 are a vector of city fixed effects; in Model 2 we also add individual levelcontrols (age, gender, education, marital status, number of children, dummies for self-employment, dummy for working andan interaction between self-employment and lagged (2015) dependent variable and dummy for “willingness to remain in thecity permanently if policy permits.”), while Model 3 adds firm level controls (pre-treatment firm size and ownership indicatorvariables ) as well.Robust standard errors clustered at workplace of household head are in parentheses. P-values are in brackets. Significancecodes: *** p<0.01, ** p<0.05, * p<0.1.
30

Table 3: ln(Wage) Regression Results for Pension Eligible and Non-Eligible Wage Earners
Sample of “older” workers Sample of “younger” workers
Model 1 Model 2 Model 3 Model 1 Model 2 Model 3
Assigned to Treatment 0.072** 0.058* 0.072** 0.012 0.014 0.012
(0.033) (0.033) (0.034) (0.027) (0.026) (0.026)
Lagged ln(Wage) 0.343*** 0.301** 0.294** 0.649*** 0.584*** 0.575***
(0.123) (0.123) (0.121) (0.049) (0.051) (0.051)
Individual controls No Yes Yes No Yes Yes
Firm level controls No No Yes No No Yes
City fixed effects Yes Yes Yes Yes Yes Yes
Observations 381 381 381 705 705 705
R-squared 0.476 0.499 0.517 0.436 0.462 0.468
Source: RUMiC Migrant Survey 2015 and 2016, RUMiC Information Intervention Field Experiment, 2016.
Notes: “Older” workers are those workers within fifteen years of retirement age (men over 45, and women over 40), and who
cannot expect to receive the employer contribution as part of their pension. “Younger” workers (men and women who are under
45 and 40, respectively) can expect to receive full benefits at retirement. The additional variables included in Model 1 are a
vector of city fixed effects; in Model 2 we also add individual level controls (age, age squared, gender, education, marital status,
number of children), while Model 3 adds firm level controls (pre-treatment firm size and ownership indicator variables ) as well.
Robust standard errors clustered at workplace of household head level are in parentheses. Significance codes: *** p<0.01, **
p<0.05, * p<0.1.
31

Table 4: OLS Estimation of Treatment Effects with Relative Premium Interactions
Panel A: Average Treatment Effects
Health Insurance Pension
Model 1 Mode 2 Model 3 Model 1 Mode 2 Model 3
Treated 0.073** 0.087*** 0.091*** -0.009 0.001 -0.006
(0.032) (0.031) (0.032) (0.047) (0.046) (0.046)
Treated*Price -0.939** -1.105*** -1.176*** 0.067 0.060 0.110
(0.436) (0.425) (0.426) (0.276) (0.263) (0.263)
Lagged Dependent Variable 0.655*** 0.544*** 0.532*** 0.641*** 0.496*** 0.480***
(0.016) (0.025) (0.026) (0.018) (0.031) (0.032)
R-squared 0.489 0.520 0.524 0.489 0.530 0.536
No. of Observations 4,587 4,587 4,587 2,925 2,925 2,925
Panel B: Heterogeneous Treatment Effects
Health Insurance Pension
Model 1 Mode 2 Model 3 Model 1 Mode 2 Model 3
Treated 0.026 0.030 0.034 0.027 0.037 0.030
(0.042) (0.041) (0.041) (0.066) (0.065) (0.064)
Treated*No-Contract 0.118* 0.112* 0.113* -0.043 -0.048 -0.047
(0.065) (0.064) (0.064) (0.094) (0.091) (0.091)
Treated*Price -0.878 -0.858 -0.985* -0.385 -0.404 -0.374
(0.589) (0.584) (0.582) (0.400) (0.391) (0.385)
No-contract dummy -0.139*** -0.121** -0.088* -0.070 -0.029 -0.004
(0.047) (0.047) (0.047) (0.063) (0.066) (0.066)
No-contract*Price -0.799 -0.702 -0.862 -0.739** -0.750** -0.707**
(0.636) (0.619) (0.612) (0.353) (0.344) (0.349)
No-contract*Price*Treated -0.679 -0.689 -0.616 0.693 0.683 0.709
(0.856) (0.848) (0.849) (0.551) (0.528) (0.525)
Lagged Dependent Variable 0.558*** 0.542*** 0.529*** 0.546*** 0.500*** 0.484***
(0.021) (0.025) (0.026) (0.026) (0.032) (0.032)
R-squared 0.507 0.521 0.526 0.508 0.532 0.538
No. of Observations 4,587 4,587 4,587 2,925 2,925 2,925
No contract treated price effect -1.557** -1.547** -1.601*** 0.308 0.279 0.335
[0.013] [0.012] [0.010] [0.402] [0.421] [0.337]
No contract treatment effect
At median premium 0.029* 0.027* 0.028* 0.031 0.033 0.034
[0.077] [0.084] [0.072] [0.173] [0.143] [0.123]
At 25th percentile premium 0.067** 0.066** 0.068** 0.022 0.025 0.025
[0.002] [0.002] [0.002] [0.409] [0.350] [0.349]
At 10th percentile premium 0.112*** 0.110*** 0.114*** 0.014 0.017 0.015
[0.002] [0.002] [0.002] [0.684] [0.607] [0.642]
Source: RUMiC Migrant Survey 2015 and 2016, RUMiC Information Intervention Field Experiment, 2016.Notes: The additional variables included in Model 1 are a vector of city fixed effects; in Model 2 we alsoadd individual level controls (age, gender, education, marital status, number of children, dummies for self-employment, dummy for working and an interaction between self-employment and lagged (2015) dependentvariable and dummy for “willingness to remain in the city permanently if policy permits.”), while Model 3adds firm level controls (pre-treatment firm size and ownership indicator variables ) as well.Robust standard errors clustered at workplace of household head are in parentheses. P-values are in brackets.Significance codes: *** p<0.01, ** p<0.05, * p<0.1.
32

Table 5: Effect of Treatment on the Treated (IV Results)
Panel A: Health Insurance Model 1 Model 2 Model 3 Model 1 Model 2 Model 3
Without Price Interaction: Eq 1 With Price Interaction: Eq 3
Received a Pamphlet 0.009 0.012 0.011 0.079** 0.094*** 0.099***
(0.013) (0.013) (0.013) (0.035) (0.034) (0.034)
Received a Pamphlet*Price -1.009** -1.188*** -1.263***
(0.465) (0.452) (0.452)
No. of Observations 4,587 4,587 4,587 4,587 4,587 4,587
Without Price Interaction: Eq 2 With Price Interaction: Eq 4
Received a Pamphlet -0.031 -0.026 -0.029 0.048 0.032 0.038
(0.021) (0.020) (0.020) (0.046) (0.045) (0.045)
Received a Pamphlet*No-Contract 0.066** 0.059** 0.064** 0.104 0.125* 0.126*
(0.027) (0.026) (0.026) (0.071) (0.071) (0.071)
No. of Observations 4,587 4,587 4,587 4,587 4,587 4,587
No-Contract Treatment Effect 0.035** 0.033** 0.035** 0.152*** 0.157*** 0.164***
RP+[RP*No-Contract] [0.043] [0.048] [0.040] [0.005] [0.003] [0.002]
Panel B: Pension Model 1 Model 2 Model 3 Model 1 Model 2 Model 3
Without Price Interaction: Eq 1 With Price Interaction: Eq 3
Received a Pamphlet 0.002 0.012 0.013 -0.009 0.002 -0.006
(0.017) (0.016) (0.016) (0.049) (0.047) (0.047)
Received a Pamphlet*Price 0.068 0.060 0.111
(0.280) (0.267) (0.266)
Observations 2,925 2,925 2,925 2,925 2,925 2,925
Without Price Interaction: Eq 2 With Price Interaction: Eq 4
Received a Pamphlet -0.038 -0.030 -0.033 0.030 0.041 0.033
(0.024) (0.023) (0.023) (0.072) (0.071) (0.070)
Received a Pamphlet*No-Contract 0.076** 0.070** 0.075** -0.047 -0.052 -0.052
(0.034) (0.032) (0.032) (0.102) (0.098) (0.098)
Observations 2,925 2,925 2,925 2,925 2,925 2,925
No Contract treatment effect 0.038* 0.040* 0.042* -0.017 -0.011 -0.019
RP+(Rp*No contract) [0.096] [0.076] [0.057] [0.804] [0.868] [0.778]
Source: RUMiC Migrant Survey 2015 and 2016, RUMiC Information Intervention Field Experiment, 2016.Notes: The additional variables included in Model 1 are a vector of city fixed effects; in Model 2 we alsoadd individual level controls (age, gender, education, marital status, number of children, dummies for self-employment, dummy for working and an interaction between self-employment and lagged (2015) dependentvariable and dummy for “willingness to remain in the city permanently if policy permits.”), while Model 3adds firm level controls (pre-treatment firm size and ownership indicator variables ) as well.Robust standard errors clustered at workplace of household head are in parentheses. P-values are in brackets.Significance codes: *** p<0.01, ** p<0.05, * p<0.1.
33

Table 6: Correcting for Potential Attrition Bias
Panel A: Heckman two-step model – Total sample
Contract Interaction Price Interaction
Treated -0.018 0.106
[-0.060,0.026] [0.035,0.177]
Treated*Contract -0.018
[-0.060,0.026]
Treated*No-Contract 0.055 0.037
[0.001,0.105] [0.001,0.071]
Treated*Health Insurance Price -1.289
[-2.245,-0.336]
F-Statistics 14.36 14.36 14.18
Panel B: Heckman two-step model - Trust sample with trust control
Contract Interaction Price Interaction
Treated -0.019 0.092
[-0.063,0.023] [0.008,0.165]
Treated*Contract -0.019
[-0.063,0.023]
Treated*No-Contract 0.048 0.029
[-0.011,0.110] [-0.009,0.068]
Treated*Health Insurance Price -1.190
[-2.185,-0.118]
F-Statistics 10.60 10.60 10.45
Panel C: Heckman two-step model – Trust sample but no trust in model
Contract Interaction Price Interaction
Treated -0.020 0.091
[-0.063,0.023] [0.009,0.165]
Treated*Contract -0.020
[-0.063,0.023]
Treated*No-Contract 0.048 0.029
[-0.010,0.110] [-0.009,0.066]
Treated*Health Insurance Price -1.186
[-2.187,-0.127]
F-Statistics 10.97 10.97 10.81
Panel D: Correcting sample attrition bias by re-weighting
Health Insurance Pension
Treated 0.101*** -0.031 0.003 -0.032
(0.033) (0.020) (0.047) (0.023)
Treated*Price -1.350*** 0.046
(0.437) (0.266)
Treated*No-Contract 0.061** 0.069**
(0.026) (0.032)
No. of Observations 4,587 4,587 2,925 2,925
Source: RUMiC Migrant Survey 2015 and 2016, RUMiC Information Intervention Field Experiment, 2016.Notes: All regressions are using the Model 3 specification (see note to Table 2). For Heckman model, the 95%bootsraping percentile confidence intervals are in the square brackets, which are calculated by pair clusterbootstrap with 1000 replications. The sample size of Panel A is 4,587, and the sample size of Panels B andC is 2,881. For reweigting results, robust standard errors clustered at workplace of household head are inparentheses. Significance codes: *** p<0.01, ** p<0.05, * p<0.1.
34
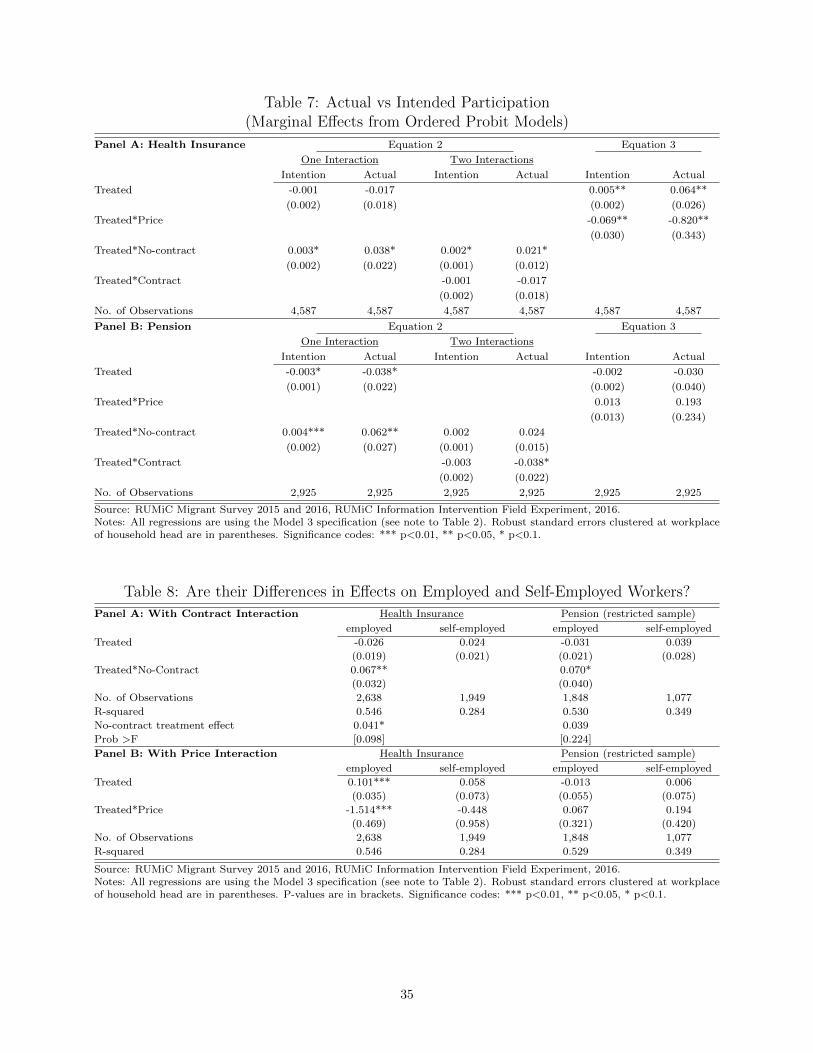
Table 7: Actual vs Intended Participation(Marginal Effects from Ordered Probit Models)
Panel A: Health Insurance Equation 2 Equation 3
One Interaction Two Interactions
Intention Actual Intention Actual Intention Actual
Treated -0.001 -0.017 0.005** 0.064**
(0.002) (0.018) (0.002) (0.026)
Treated*Price -0.069** -0.820**
(0.030) (0.343)
Treated*No-contract 0.003* 0.038* 0.002* 0.021*
(0.002) (0.022) (0.001) (0.012)
Treated*Contract -0.001 -0.017
(0.002) (0.018)
No. of Observations 4,587 4,587 4,587 4,587 4,587 4,587
Panel B: Pension Equation 2 Equation 3
One Interaction Two Interactions
Intention Actual Intention Actual Intention Actual
Treated -0.003* -0.038* -0.002 -0.030
(0.001) (0.022) (0.002) (0.040)
Treated*Price 0.013 0.193
(0.013) (0.234)
Treated*No-contract 0.004*** 0.062** 0.002 0.024
(0.002) (0.027) (0.001) (0.015)
Treated*Contract -0.003 -0.038*
(0.002) (0.022)
No. of Observations 2,925 2,925 2,925 2,925 2,925 2,925
Source: RUMiC Migrant Survey 2015 and 2016, RUMiC Information Intervention Field Experiment, 2016.Notes: All regressions are using the Model 3 specification (see note to Table 2). Robust standard errors clustered at workplaceof household head are in parentheses. Significance codes: *** p<0.01, ** p<0.05, * p<0.1.
Table 8: Are their Differences in Effects on Employed and Self-Employed Workers?
Panel A: With Contract Interaction Health Insurance Pension (restricted sample)
employed self-employed employed self-employed
Treated -0.026 0.024 -0.031 0.039
(0.019) (0.021) (0.021) (0.028)
Treated*No-Contract 0.067** 0.070*
(0.032) (0.040)
No. of Observations 2,638 1,949 1,848 1,077
R-squared 0.546 0.284 0.530 0.349
No-contract treatment effect 0.041* 0.039
Prob >F [0.098] [0.224]
Panel B: With Price Interaction Health Insurance Pension (restricted sample)
employed self-employed employed self-employed
Treated 0.101*** 0.058 -0.013 0.006
(0.035) (0.073) (0.055) (0.075)
Treated*Price -1.514*** -0.448 0.067 0.194
(0.469) (0.958) (0.321) (0.420)
No. of Observations 2,638 1,949 1,848 1,077
R-squared 0.546 0.284 0.529 0.349
Source: RUMiC Migrant Survey 2015 and 2016, RUMiC Information Intervention Field Experiment, 2016.Notes: All regressions are using the Model 3 specification (see note to Table 2). Robust standard errors clustered at workplaceof household head are in parentheses. P-values are in brackets. Significance codes: *** p<0.01, ** p<0.05, * p<0.1.
35

Table 9: Additional Sensitivity Tests
Panel A: Test for difference in sampling proportion for Shanghai
Health Insurance Pension
Original IncludeSH*Treat
Excl. SH Original IncludeSH*Treat.
Excl. SH
Treated 0.091*** 0.089*** 0.088*** -0.006 -0.016 -0.018
(0.032) (0.033) (0.033) (0.046) (0.046) (0.046)
Treated*Price -1.176*** -1.122** -1.105** 0.110 0.197 0.211
(0.426) (0.466) (0.465) (0.263) (0.275) (0.275)
Treated*Shanghai -0.015 -0.053
(0.043) (0.061)
No. of Observations 4,587 4,587 4,064 2,925 2,925 2,596
R-squared 0.524 0.524 0.516 0.536 0.536 0.533
Panel B: Test for spillover effect
Health Insurance Pension
Firmspillover
Home-cntyspillover
Both Firmspillover
Home-cntyspillover
Both
Treated 0.087*** 0.118*** 0.113*** -0.010 0.012 0.013
(0.033) (0.035) (0.037) (0.046) (0.048) (0.048)
Treated*Price -1.170*** -1.035*** -1.029*** 0.151 0.193 0.212
(0.426) (0.424) (0.425) (0.265) (0.266) (0.267)
Mixed-firm -0.016 -0.015 -0.014 -0.013
(both treated & control) (0.019) (0.019) (0.023) (0.023)
Treated*Mixed-firm 0.019 0.019 0.010 -0.012
(0.027) (0.027) (0.036) (0.035)
Mixed-home cnty -0.015 -0.015 0.001 0.001
(both treated & control) (0.015) (0.015) (0.018) (0.018)
Treated*Mixed-home cnty -0.051* -0.050* -0.049 -0.050
(0.027) (0.027) (0.032) (0.032)
No. of Observations 4,587 4,587 4,587 2,915 2,915 2,915
R-squared 0.524 0.525 0.525 0.536 0.536 0.537
Source: RUMiC Migrant Survey 2015 and 2016, RUMiC Information Intervention Field Experiment, 2016.Notes: All regressions are using the Model 3 specification (see note to Table 2). Robust standard errors clustered at workplaceof household head are in parentheses. Significance codes: *** p<0.01, ** p<0.05, * p<0.1.
36
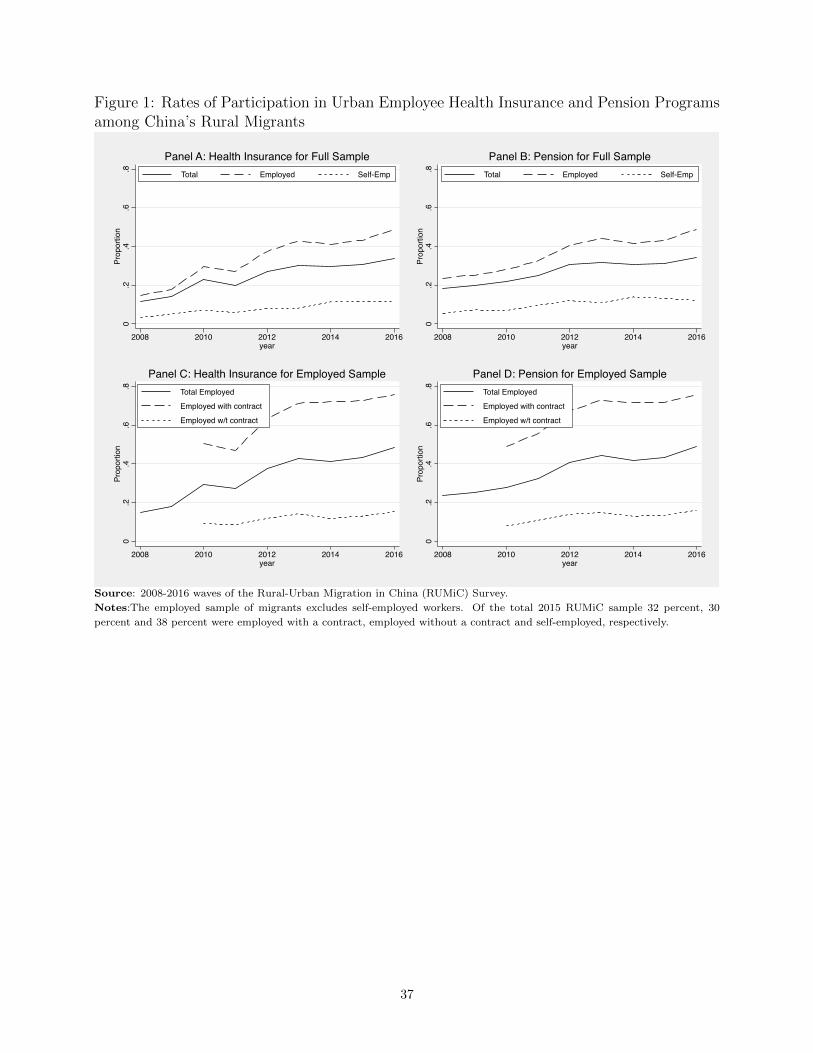
Figure 1: Rates of Participation in Urban Employee Health Insurance and Pension Programsamong China’s Rural Migrants
0.2
.4.6
.8Pr
opor
tion
2008 2010 2012 2014 2016year
Total Employed Self-Emp
Panel A: Health Insurance for Full Sample
0.2
.4.6
.8Pr
opor
tion
2008 2010 2012 2014 2016year
Total Employed Self-Emp
Panel B: Pension for Full Sample
0.2
.4.6
.8Pr
opor
tion
2008 2010 2012 2014 2016year
Total Employed
Employed with contract
Employed w/t contract
Panel C: Health Insurance for Employed Sample
0.2
.4.6
.8Pr
opor
tion
2008 2010 2012 2014 2016year
Total Employed
Employed with contract
Employed w/t contract
Panel D: Pension for Employed Sample
Source: 2008-2016 waves of the Rural-Urban Migration in China (RUMiC) Survey.
Notes:The employed sample of migrants excludes self-employed workers. Of the total 2015 RUMiC sample 32 percent, 30
percent and 38 percent were employed with a contract, employed without a contract and self-employed, respectively.
37

Figure 2: How Does the City-Level Information Treatment Effect Vary with Relative Premi-ums?
-.1
-.05
0.0
5.1
.15
Cha
nge
in h
ealth
ins.
par
ticip
atio
n
0 .02 .04 .06 .08 .1Health Ins. Premiun
Health Insurance Participation
-.1
-.05
0.0
5.1
Cha
nge
in p
ensi
on in
s. p
artic
ipat
ion
.1 .15 .2 .25 .3Pension Ins. Premiun
Pension Program Participation-.
1-.
050
.05
.1C
hang
e in
pen
sion
ins.
par
ticip
atio
n
.1 .15 .2 .25Pension Ins. Premiun
Pension Program Participation (excl. Luoyang )
Source: 2015 and 2016 waves of the Rural-Urban Migration in China (RUMiC) Survey, and RUMiC Information
Intervention Survey, 2016.
Notes:An estimated city-level treatment effect is plotted against the relative premium for the urban employee
health insurance and pension programs in the city. The relative premium is calculated as the premium required
for self-employed workers to participate divided by the city-wide average monthly earnings of migrants. The city-
level treatment effects are coefficients from the health insurance and pension participation models estimated with
city-specific information treatment indicators (city indicators interacted with the information treatment) in models
that control for the city fixed effects.
38
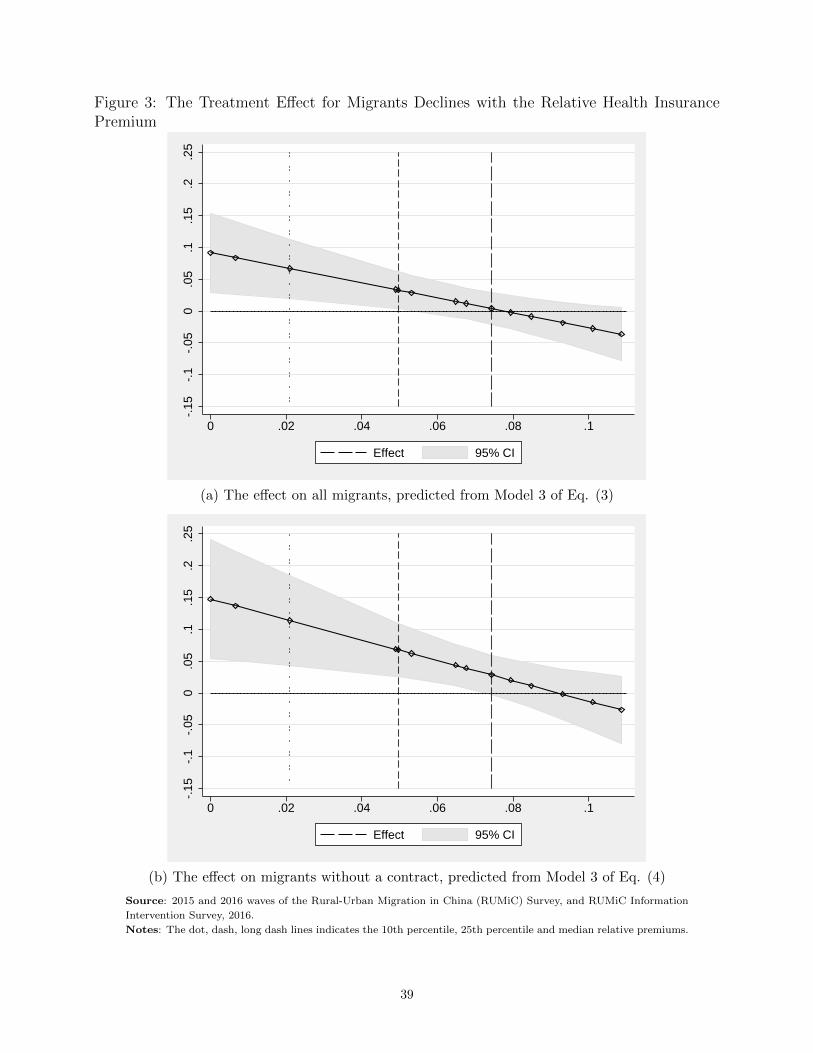
Figure 3: The Treatment Effect for Migrants Declines with the Relative Health InsurancePremium
-.15
-.1
-.05
0.0
5.1
.15
.2.2
5
0 .02 .04 .06 .08 .1
Effect 95% CI
(a) The effect on all migrants, predicted from Model 3 of Eq. (3)
-.15
-.1
-.05
0.0
5.1
.15
.2.2
5
0 .02 .04 .06 .08 .1
Effect 95% CI
(b) The effect on migrants without a contract, predicted from Model 3 of Eq. (4)
Source: 2015 and 2016 waves of the Rural-Urban Migration in China (RUMiC) Survey, and RUMiC Information
Intervention Survey, 2016.
Notes: The dot, dash, long dash lines indicates the 10th percentile, 25th percentile and median relative premiums.
39

Figure 4: Change in Actual and Intended Participation Over Survey Months
0.0
2.0
4.0
6.0
8.1
Perc
ent
3 4 5 6 7 8 9 10Survey Month
Increase in health ins.linear fit of the increaseIntention to participatelinear fit of intention
Health
0.0
5.1
.15
Perc
ent
3 4 5 6 7 8 9 10Survey Month
Increase in pensionlinear fit of the increaseIntention to participatelinear fit of intention
Pension
Source: 2015 and 2016 waves of the Rural-Urban Migration in China (RUMiC) Survey, and RUMiC Infor-
mation Intervention Survey, 2016.
Notes:The figures above show the change in actual and intended participation in health insurance and
pension programs, respectively.
40

Online Appendix
The following tables and figures are intended for a supplementaryappendix to be made available on-line.
A-1

Online Appendix A.1 Summary Statistics
Table A.1: Annual Participation Rates in Pension Programs and Health InsurancePanel 1: Full Sample Panel 2: 2008 and New Sample Panel 3: 2008 and Old Sample
Panel A: Overall participationTotal Employee Self-emp Total Employee Self-emp Total Employee Self-emp
Panel A1: Health insurance
2008 11.50 14.71 3.24 11.50 14.71 3.24 11.50 14.71 3.242009 14.14 17.97 5.19 14.04 16.83 5.25 14.30 20.39 5.132010 22.75 29.48 7.12 20.52 24.90 6.47 25.00 35.05 7.552011 20.09 27.33 5.91 18.23 22.26 7.30 21.34 31.40 5.252012 27.28 37.46 7.86 31.35 39.02 7.98 25.23 36.48 7.822013 30.16 42.99 8.22 27.26 35.93 6.16 31.50 46.89 8.912014 29.71 41.12 11.38 28.32 35.31 12.06 30.40 44.62 11.142015 30.78 43.28 11.48 29.36 36.10 11.87 31.48 48.00 11.362016 33.72 48.62 11.63 31.19 40.34 8.93 34.85 53.45 12.40
Panel A2: Pension
2008 18.53 23.58 5.46 18.53 23.58 5.46 18.53 23.58 5.462009 19.82 25.26 7.24 20.24 24.53 6.85 19.12 26.79 7.642010 21.66 27.99 6.94 18.53 22.11 7.05 24.83 35.13 6.862011 24.83 32.62 9.59 24.48 28.98 12.28 25.06 35.54 8.312012 30.82 40.57 12.02 33.19 40.06 12.13 29.61 40.90 11.992013 31.85 44.14 10.87 28.44 36.17 9.64 33.44 48.56 11.292014 30.95 41.54 13.93 29.27 35.43 14.87 31.79 45.25 13.602015 31.38 43.11 13.21 30.45 37.30 12.55 31.84 46.94 13.412016 34.11 48.92 12.12 31.66 40.71 9.59 35.22 53.70 12.85
Panel B: Participation Rate among Employeeswith without with without with without
overall contr. contr. overall contr. contr. overall contr. contr
Panel B1: Health insurance
2010 29.48 50.65 9.20 24.90 42.79 8.09 35.05 59.76 10.632011 27.33 47.16 8.59 22.26 39.11 6.62 31.40 53.49 10.222012 37.46 63.18 11.88 39.02 63.03 13.36 36.48 63.27 11.002013 42.99 71.44 14.21 35.93 64.20 9.51 46.89 75.17 17.172014 41.12 72.08 11.85 35.31 64.97 9.10 44.62 76.08 13.662015 43.28 72.68 13.08 36.10 61.84 10.77 48.00 79.57 14.692016 48.62 75.92 15.32 40.34 67.61 10.15 53.45 80.43 18.62
Panel B2: Pension
2010 27.99 48.98 7.94 22.11 39.22 6.23 35.13 60.22 10.162011 32.62 55.73 10.81 28.98 49.04 10.29 35.54 61.03 11.242012 40.57 67.41 14.01 40.06 64.33 14.10 40.90 69.48 13.952013 44.14 72.93 14.85 36.17 64.10 9.54 48.56 77.49 18.182014 41.54 71.61 12.96 35.43 63.33 10.73 45.25 76.30 14.442015 43.11 71.85 13.54 37.30 63.60 11.38 46.94 77.11 15.052016 48.92 75.77 16.06 40.71 67.93 10.21 53.70 80.03 19.77
Source: RUMiC Migrant Survey 2008 and 2016.
A-2

OnlineAppendix
A.2
Examples
of
City-L
evelHealth
Insu
rance
and
Pension
Details
Tab
leA
.2:
Bas
icfe
ature
sof
hea
lth
insu
rance
and
pen
sion
schem
esin
Shen
zhen
.S
hen
zhen
Hea
lth
Insu
ran
ceP
ensi
on
Cost
Em
plo
yee
s
First
Class:
Em
plo
yer
Contr
ibu
tion
:6.2
%of
wage
or
min
imu
mw
age
base
.E
mp
loyee
Contr
ibu
tion
:2
%of
wage
or
min
imu
mw
age
base
.M
inim
um
Wage
Base
:60
%of
city
-aver
age
emp
loyee
wage
inp
revio
us
yea
r.SecondClass:
Em
plo
yer
Contr
ibu
tion
:0.6
%of
city
aver
age
emp
loyee
wage
inp
revio
us
yea
r.E
mp
loyee
Contr
ibu
tion
:0.2
%of
city
aver
age
emp
loyee
wage
inp
revio
us
yea
r.ThirdClass:
Em
plo
yer
Contr
ibu
tion
:0.4
5%
of
city
aver
age
emp
loyee
wage
inp
revio
us
yea
r.E
mp
loyee
Contr
ibu
tion
:0.1
0%
of
city
aver
age
emp
loyee
wage
inp
revio
us
yea
r.
Em
plo
yer
Contr
ibu
tion:
13%
of
payro
ll.
Em
plo
yee
Contr
ibu
tion
:8%
of
wage.
Min
imu
mW
age
Base
:M
inim
um
wage.
Sel
f-E
mp
loyed
Min
imu
mco
stto
part
icip
ate
First
Class:
4.9
2%
of
city
aver
age
emp
loyee
wage
inp
revio
us
yea
r.SecondClass:
0.8
%of
city
aver
age
emp
loyee
wage
inp
revio
us
yea
r.ThirdClass:
0.5
5%
of
city
aver
age
emp
loyee
wage
inp
revio
us
yea
r.
Min
imu
mC
ost
toP
art
icip
ate
:21%
of
min
imu
mw
age.
Ben
efit
Inp
ati
ent
Ded
uct
ible
s:(S
am
efo
rall
thre
ecl
ass
es)
Tie
r3
Hosp
ital:
300
Yu
an
RM
B.
Tie
r2
Hosp
ital:
200
Yu
an
RM
B.
Tie
r1
Hosp
ital
or
bel
ow
:100
Yu
an
RM
B.
Rei
mb
urs
emen
tS
hare
:F
irst
an
dS
econ
dC
lass
:90%
for
all
hosp
itals
Th
ird
Cla
ss:
Tie
r3
Hosp
ital:
75%
Tie
r2
Hosp
ital:
80%
Tie
r1
Hosp
ital
or
bel
ow
:85%
Aft
erre
tire
men
t,in
div
idu
als
elig
ible
for
pen
sion
ifth
eyh
ave
mad
e15
yea
rsof
contr
ibu
tion
s.
Pen
sion
=B
ase
pen
sion
+P
ensi
on
from
ind
ivid
ual
acc
ou
nt.
Base
pen
sion
isa
fun
ctio
nof
nu
mb
erof
yea
rsp
ar-
tici
pati
ng
inth
ep
ensi
on
sch
eme,
the
tota
lof
an
-nu
al
pre
miu
ms
paid
into
the
sch
eme,
an
dth
eci
ty-
aver
age
wage
wh
enth
ep
ensi
on
isp
aid
ou
t.F
or
exam
ple
,if
ap
art
icip
ant
mad
ep
aym
ents
into
the
syst
emfo
rX
yea
rs(x≥
15),
an
dth
ep
ay
base
isth
eci
tyaver
age
wage,
then
the
base
pen
sion
ben
efit
isX
%*ci
tyaver
age
wage.
Ou
tpati
ent
Fir
stC
lass
:In
div
idu
al
acc
ou
nt
cover
sso
me
med
ical
exp
ense
wh
enth
eou
t-of-
pock
etex
pen
ses
are
more
than
5%
of
the
aver
age
city
wage
inth
ep
revio
us
yea
r,in
wh
ich
case
70%
over
this
thre
shold
may
be
reim
bu
rsed
.30%
of
exp
ense
sat
com
mu
nit
ycl
inic
sca
nb
ere
imb
urs
ed.
Tre
atm
ent
for
som
esp
ecia
ld
isea
ses
may
be
reim
bu
rsed
.S
econ
dan
dT
hir
dC
lass
:N
otr
eatm
ents
or
dru
gs
may
be
exp
ense
dfr
om
the
ind
ivid
ual
acc
ou
nt,
wit
hth
eex
cep
tion
of
som
esp
ecia
ld
isea
ses
an
dd
rugs
wh
ich
may
be
part
ially
reim
bu
rsed
.
Th
ep
ensi
on
paid
from
the
ind
ivid
ual
acc
ou
nt
=(a
ccu
mu
lati
on
inth
eacc
ou
nt)
/139.
All
of
the
em-
plo
yee
contr
ibu
tion
sare
paid
into
ind
ivid
ual
ac-
cou
nts
,an
d8/21
of
paym
ents
mad
eby
the
self
-em
plo
yed
are
paid
into
ind
ivid
ual
acc
ou
nts
.
A-3

Tab
leA
.2:
Bas
icfe
ature
sof
hea
lth
insu
rance
and
pen
sion
schem
esin
Nin
gbo.
Nin
gb
oH
ealt
hIn
sura
nce
Pen
sion
Cost
Em
plo
yee
s
UrbanEmployee
BasicMedicalIn
surance:
Em
plo
yer
Contr
ibu
tion
:11%
of
pre
vio
us
yea
rsp
ayro
ll+
5yu
an
/m
onth
Em
plo
yee
Contr
ibu
tion
:2%
ofaver
age
month
lyw
age
inp
revio
us
yea
r.M
inim
um
Wage
Base
:60%
of
city
-aver
age
emp
loyee
wage
inp
revio
us
yea
r.MigrantMedicalIn
surance:
Em
plo
yer
Contr
ibu
tion
:3.3
%of
city
-aver
age
emp
loyee
wage
inp
revio
us
yea
r.E
mp
loyee
Contr
ibu
tion
:0.6
%of
city
-aver
age
emp
loyee
wage
inp
revio
us
yea
r.
UrbanEmployee
BasicPen
sion:
Em
plo
yer
Contr
ibu
tion:
14%
of
pre
vio
us
yea
rp
ayro
ll.
Em
plo
yee
Contr
ibu
tion
:8%
ofaver
age
month
lyw
age
inp
revio
us
yea
r.M
inim
um
Contr
ibu
tion
Base
:60%
of
city
-aver
age
emp
loyee
wage
inp
revio
us
yea
r.MigrantPen
sion:
Em
plo
yer
Contr
ibu
tion:
14%
of
pre
vio
us
yea
rp
ayro
ll.
Em
plo
yee
Contr
ibu
tion
:8%
ofaver
age
month
lyw
age
inp
revio
us
yea
r.M
inim
um
Contr
ibu
tion
Base
:M
inim
um
wage.
Sel
f-E
mp
loyed
Urban
Employee
BasicMedicalIn
surance
(min
cost
topa
rtici-
pate):
7.8
%of
city
-aver
age
emp
loyee
wage
inp
revio
us
yea
r+
5yu
an
/m
onth
MigrantMedicalIn
surance
(min
cost
topa
rticipate):
3.9
%of
city
-aver
age
wage
inp
revio
us
yea
r.
UrbanEmployee
BasicPen
sion(m
incost
topa
rticipate):
14.4
%of
city
-aver
age
emp
loyee
wage
inp
revio
us
yea
r.MigrantPen
sion(m
incost
topa
rticipate):
18%
of
min
imu
mw
age.
Ben
efit
Inp
ati
ent
Ded
uct
ible
s:(S
am
efo
rb
oth
sch
emes
)T
ier
3H
osp
ital:
1200
Yu
an
RM
B.
Tie
r2
Hosp
ital:
600
Yu
an
RM
B.
Tie
r1
Hosp
ital:
600
Yu
an
RM
B.
Com
mu
nit
yC
lin
ic:
300
Yu
an
RM
B.
Rei
mb
urs
emen
tS
hare
(sam
efo
rb
oth
sch
emes
):U
nd
er35K
:80%
(85%
for
com
mu
nit
ycl
inic
s).
35K
-70K
:85%
(90%
for
com
mu
nit
ycl
inic
s).
Over
70K
:95%
UrbanEmployee
BasicPen
sion:
Aft
erre
tire
men
t,in
div
idu
als
are
elig
ible
for
ap
ensi
on
ifth
eyh
ave
mad
e15
yea
rsof
contr
ibu
tion
s.
Pen
sion
=B
ase
Pen
sion
+P
ensi
on
from
ind
ivid
ual
acc
ou
nt.
Base
pen
sion
isa
fun
ctio
nof
nu
mb
erof
yea
rsp
art
icip
ati
ng
inth
ep
ensi
on
sch
eme,
the
tota
lof
an
nu
al
pre
miu
ms
paid
into
the
sch
eme,
an
dth
eci
ty-
aver
age
wage
wh
enth
ep
ensi
on
isp
aid
ou
t.F
or
exam
ple
,if
ap
art
icip
ant
mad
ep
aym
ents
into
the
syst
emfo
rX
yea
rs(X≥
15),
an
dth
ep
ay
base
isth
eci
tyaver
age
wage,
then
the
base
pen
sion
ben
efit
isX
%*ci
tyaver
age
wage.
Ou
tpati
ent
Both
sch
emes
esta
blish
ind
ivid
ual
acc
ou
nt
wh
ich
can
cover
ou
t-p
ati
ent
exp
ense
s.T
he
ind
ivid
ual
acc
ou
nt
acc
um
ula
tion
ism
ore
inUEBMI
sch
eme
thanMMI
sch
eme.
Wh
enin
div
idu
al
acc
ou
nt
isu
sed
up
,UEBMI
sch
eme
pro
vid
ead
dit
ion
al
reim
bu
rsem
ent
on
ou
t-p
ati
ent
exp
ense
sas
follow
s.D
edu
ctib
le:
those
un
der
45:
900
Yu
an
those
aged
45
or
ab
ove:
600
Yu
an
Rei
mb
urs
emen
tsh
are
:T
ier
3h
osp
ital:
75%
Tie
rs2
an
d1
hos-
pit
al:
86%
Com
mu
nit
ycl
inic
:80%
Exp
ense
on
som
esp
ecia
ld
isea
ses
an
dd
rugs,
an
dtr
eatm
ent
can
be
part
ially
reim
bu
rsed
for
both
sch
emes
.
Th
ep
ensi
on
paid
from
the
ind
ivid
ual
acc
ount
=(a
ccu
mu
lati
on
inth
eacc
ou
nt)
/139.
All
of
the
emp
loyee
contr
ibu
tion
sare
paid
into
ind
ivid
ual
acc
ou
nts
,an
d8/21
of
paym
ents
mad
eby
the
self
-em
plo
yed
are
paid
into
ind
ivid
ual
acc
ou
nts
.
MigrantPen
sion:
Th
ep
ensi
on
sch
eme
can
be
dis
cou
nte
das
the
low
stan
dard
pen
sion
sch
eme
inN
ingb
o.
A-4

Online Appendix A.3 Pamphlet Example
~ >>>>>>> >>>>>>>>>> >>>>>>>>>>>>>>>>>> >>>>>>> > > > > >
>>>>>>> >>>>>>>>>> >>>>>>>>>>>>>>>>>> >>>>>>> > > > > >
亲爱的外来务工朋友,您知道如果您参加了东莞市的社会医
疗相养老保险,您可以获得什么福利罔?
医疗保险:
住院费用:超过起付标准以上的费用报销 35%-95% ;
门诊费用:报销 35%-70%的费用。(详情请见第2页)
养老保险: 从您退休开始,您可以按月领取养老金,直至去
世。(详情请见3页)
如果您离开东莞呢? 如果转入地同意接收,您可以将您的医疗
和养老保险带走,在新的定居地继续享受医疗,养老保险。
要想得到这些福利您需要花多少钱来参加这些保险昵?
东莞社会基本医疗和养老保险
单位雇工:医疗保险每月只需交纳15元,养老保险需缴纳您月工资的8% 。
个体户:医疗保险每月缴纳69元,养老保险每月至少缴纳5067巳。
以上只是东莞社保的大致情况,具体缴费标准和福利待遇需要根据您的具
体情况确定。 如您想了解详细的保险缴费和福利信息,请翻阅本手册。您
也可以前往东莞市各区人力资源和社会保障局(地址见最后一页)或拨打
0769-12333来了解相关情况。
一、医疗和养老保险的适合人群
无论您是雇工还是个体户,您都可以参加东莞社会基
本医疗和养老保险。
当您离开东莞时,如果转入地同意接受,您可将医
疗和养老保险转走。
二、参加东莞社会基本医疗保险
1.费用缴纳:
若您是用人单位的雇工, 2015年您每月只需缴纳
15. 02元,保费由用人单位按月代扣代缴。
若您是个体户, 2015年您每月只需缴纳69. 12 元。
2. 保险待遇:
市内医院住院报销比例:医院机 起付标准 5万兀以 5万至 10 10万至 15万以
构等级 (元) 下 万 15万 上
三级 1300 85~也 65% 45% 35~也
二级 800 90% 70% 50~也 40号也
一级及500 95~也 75~也 55~也
以下
3. 门诊报销: 在参保社区指定的社区卫生服务机构
就医,门诊费用可报销 70%。如需转诊,在转诊医院的门
诊费用可报销 35%至 70%。对于特殊疾病,门诊费用可报销
75%。详情请询问当地社保部门.
4 . 大病医疗: 在参保年度内,如您个人需要支付的住
院或特定门诊费用超过3. 5万元,您还有机会获得额外的
补助。详情请咨询当地社保部门。
~ >>>>>>> >>>>>>>>>> >>>>>>>>>>>>>>>>>> >>>>>>> > > > > > ~>-;;咽~>>>>>>> >>>>>>>>>> >>>>>>>>>>>>>>>>>> >>>>>>> > > > > >
三、参加东莞社会基本养老保险
1.费用缴纳:
如您是单位的雇工,您需按月工资的 8%缴纳保费,保
费由用人单位按月代扣。您的保费全部进入个人账户。此
外,用人单位和政府会对个人账户进行额外补贴。
如果您是个体户,您有多档保费可供选择, 2015年的
最低参保费用是每月 505.68元。您的部分保费将进入您的
个人账户,具体个人账户累计情况请咨询当地社保部门。
2. 保险待遇:
社会基本养老保险享受的方式是参保人员到达法定退
休年龄后,从办理退休起,按月领取养老金,直至死亡。
退休金额将由缴费数量、缴费年限和退休时平均工资决定
费越多、缴费年限越长,退休时社会平均工资越高,
养老金越高。
>>>>>>> >>>>>>>>>> >>>>>>>>>>>>>>>>>> >>>>>>> > > > > >
A-5

Dear migrant workers, are you aware of the benefits of purchasing social medical insurance and age pension insurance in Dongguan? Medical insurance
• Hospital and medical cover: 35% -90% of your expenditure above the minimum standard to receive benefits
• Outpatient treatment cover: 35-%70% of your expenditure ( please refer to Page 2 for more details)
Age pension insurance:
• you are entitled to get pension every month from your retirement until death. (please refer to Page 3 for more details)
• If you no longer lives in Dongguan , your previously purchased social medical and age pension insurance can be transferred to the new city you are moving to as long as it is acceptable there.
How much you need to pay to enjoy the benefit of these insurances?
Basic social medical insurance and age pension insurance
• As an employee: the cost is RMB 15 per month for medical insurance and 8% of you monthly salary for an age pension insurance
• If self-employed: the cost is RMB 69 per month for medical insurance and a minimum of RMB 506 per month for an age pension insurance
The above is the standard social insurance information for Dongguan, conditions may change and the premium and entitlement may vary depending on individual situation.
To get more information on premium and entitlement, please read information in this brochure or alternatively, you can visit any of the branch of Dongguan human resources and social insurance
bureau (see the first page for the addresses) or call on 0769-12333.
Detailed information:
1. Eligible Population: All employees and self-employed are eligible to purchase Dongguan social medical insurance and age pension insurance. When you leave in Dongguan, you can transfer your purchased social medical and age pension insurance to the new city if the new location accepts it.
2. Purchase Dongguan basic social medical insurance a) Premium: if you are an employee, the
monthly rate is RMB 15.02 in 2015, your employer will deduct this from your salary and pay on your behalf. If you are self-employed, monthly rate is RMB 69.12 in 2015
b) what’s covered? Coverage of hospitalization cost (hospital and medical cost )in urban hospital
Hospital classification
Excess (RMB)
Coverage by Total Expenditure (Thousand RMB)
<= 50 50 to 100
100 to 150
> 150
Level 3 1300 85% 65% 45% 35%
Level 2 800 90% 70% 50% 40%
<=Level 1 500 95% 75% 55% 45%
c) coverage for outpatient treatment: 70%
expenditure at designated community health and medical clinic within your insured area. When a transfer is requested, 35% to 70% expenditure at
transferred hospital. For some specific treatments, a 75% coverage applies, please visit your local social insurance office for more details.
d) Serious illness treatment: during the insured calendar year, if your out of pocket hospital and outpatient payment is over RMB 35,000, extra coverage may apply. Please visit your local social insurance office for more details.
3. Sign up for Dongguan basic social age pension insurance a) Payment rate: if you are an employee, the
monthly rate is 8% of your monthly salary, your employer will deduct this from your salary and pay on behalf. This will be paid to your personal withhold account. In addition, your employer and the government will pay extra to your personal withhold account. If you are self-employed, a few options are available . The minimum monthly rate in 2015 is RMB 505.68, partial of this personal payment will be accumulated in your personal withhold account, you can get a statement of your personal withhold account by visiting a local social insurance office.
b) Benefits: anyone who purchased age pension insurance is entitled to receive a monthly pension from when they reaches the mandatory age for retirement until their death. The pension you received is calculated based on your payment rate, length of your payment, and your salary before retirement. The more and longer you pay for the insurance and the more of salary you receive at retirement, the more of pension you will receive.
A-6

Online Appendix A.4 First-Step Results
Table A.3: The first-step results of Heckman selection ModelPanel A Panel B Panel C
(1) (2) (3) (1) (2) (3) (1) (2) (3)
Trustworthiness 0.333*** 0.333*** 0.330*** 0.245* 0.245* 0.241* 0.250* 0.250* 0.246*
(0.127) (0.127) (0.127) (0.134) (0.134) (0.134) (0.133) (0.133) (0.134)
Reliableness 0.143 0.143 0.144 0.174* 0.174* 0.175* 0.176* 0.176* 0.177*
(0.0904) (0.0904) (0.0904) (0.0967) (0.0967) (0.0967) (0.0966) (0.0966) (0.0966)
Treated 0.107 0.179 0.106 0.207 0.105 0.208
(0.0722) (0.119) (0.0750) (0.127) (0.0750) (0.127)
Treated*No-Contract -0.0363 0.0705 -0.0527 0.0529 -0.0517 0.0532
(0.0891) (0.0552) (0.0962) (0.0603) (0.0961) (0.0603)
Treated*Contract 0.107 0.106 0.105
(0.0722) (0.0750) (0.0750)
Treated*Price -1.359 -1.899 -1.911
(1.580) (1.678) (1.678)
Medical Insurance 0.382*** 0.382*** 0.380*** 0.429*** 0.429*** 0.425*** 0.432*** 0.432*** 0.428***
(0.0630) (0.0630) (0.0630) (0.0695) (0.0695) (0.0695) (0.0694) (0.0694) (0.0694)
No-Contract Dummy -0.108 -0.108 -0.122** -0.158** -0.158** -0.178*** -0.160** -0.160** -0.179***
(0.0685) (0.0685) (0.0615) (0.0763) (0.0763) (0.0688) (0.0764) (0.0764) (0.0688)
Medical Insurance*Self-employed -0.333*** -0.333*** -0.332*** -0.416*** -0.416*** -0.416*** -0.419*** -0.419*** -0.419***
(0.127) (0.127) (0.127) (0.143) (0.143) (0.143) (0.143) (0.143) (0.143)
In The Labour Force 0.233 0.233 0.233 0.497 0.497 0.491 0.489 0.489 0.483
(0.231) (0.231) (0.231) (0.527) (0.527) (0.524) (0.524) (0.524) (0.522)
Self-employed 0.464*** 0.464*** 0.464*** 0.573*** 0.573*** 0.574*** 0.575*** 0.575*** 0.575***
(0.0741) (0.0741) (0.0741) (0.0825) (0.0825) (0.0825) (0.0825) (0.0825) (0.0825)
Willing to Stay Permanently 0.170*** 0.170*** 0.170*** 0.189*** 0.189*** 0.189*** 0.189*** 0.189*** 0.189***
(0.0455) (0.0455) (0.0455) (0.0478) (0.0478) (0.0478) (0.0478) (0.0478) (0.0478)
Married 0.123* 0.123* 0.124* 0.130* 0.130* 0.130* 0.129* 0.129* 0.129*
(0.0656) (0.0656) (0.0656) (0.0701) (0.0701) (0.0701) (0.0701) (0.0701) (0.0701)
No. of Children 0.00434 0.00434 0.00383 0.00250 0.00250 0.00171 0.00412 0.00412 0.00331
(0.0371) (0.0371) (0.0371) (0.0394) (0.0394) (0.0394) (0.0394) (0.0394) (0.0394)
Age 0.0174*** 0.0174*** 0.0174*** 0.0184*** 0.0184*** 0.0185*** 0.0183*** 0.0183*** 0.0184***
(0.00400) (0.00400) (0.00400) (0.00454) (0.00454) (0.00454) (0.00454) (0.00454) (0.00454)
Dummy for Females Aged >40 -0.0396 -0.0396 -0.0387 0.0373 0.0373 0.0376 0.0359 0.0359 0.0362
(0.0794) (0.0794) (0.0794) (0.0942) (0.0942) (0.0943) (0.0942) (0.0942) (0.0943)
Dummy for Males Aged >45 -0.196** -0.196** -0.195** -0.245** -0.245** -0.247** -0.244** -0.244** -0.246**
(0.0870) (0.0870) (0.0870) (0.108) (0.108) (0.108) (0.108) (0.108) (0.108)
Years of schooling 0.00110 0.00110 0.00109 0.00488 0.00488 0.00486 0.00547 0.00547 0.00545
(0.00765) (0.00765) (0.00765) (0.00878) (0.00878) (0.00877) (0.00875) (0.00875) (0.00875)
Dummy for males 0.0710* 0.0710* 0.0708* 0.126** 0.126** 0.126** 0.126** 0.126** 0.126**
(0.0418) (0.0418) (0.0418) (0.0535) (0.0535) (0.0535) (0.0535) (0.0535) (0.0535)
Trust 0.0476 0.0476 0.0470
(0.0459) (0.0459) (0.0459)
Observations 6,396 6,396 6,396 4,037 4,037 4,037 4,037 4,037 4,037
Source: RUMiC Migrant Survey 2015 and 2016, RUMiC Information Intervention Field Experiment, 2016.Notes: Firm size and ownership controls and city fixed effects are also included in the regression. Robust standard errors clustered at household level inbrackets. Significance codes: *** p<0.01, ** p<0.05, * p<0.1.
A-7