can human movement analysis contribute to usability
TRANSCRIPT

HAL Id: hal-00659890https://hal.archives-ouvertes.fr/hal-00659890
Submitted on 14 Jan 2012
HAL is a multi-disciplinary open accessarchive for the deposit and dissemination of sci-entific research documents, whether they are pub-lished or not. The documents may come fromteaching and research institutions in France orabroad, or from public or private research centers.
L’archive ouverte pluridisciplinaire HAL, estdestinée au dépôt et à la diffusion de documentsscientifiques de niveau recherche, publiés ou non,émanant des établissements d’enseignement et derecherche français ou étrangers, des laboratoirespublics ou privés.
Can Human Movement Analysis Contribute to UsabilityUnderstanding?
Juan-Manuel Belda-Lois, Helios De-Rosario, Romà Pons, Rakel Poveda, AnaMorón, Rosa Porcar, Ana-Cruz Garcı’A, Amelia Gómez
To cite this version:Juan-Manuel Belda-Lois, Helios De-Rosario, Romà Pons, Rakel Poveda, Ana Morón, et al.. CanHuman Movement Analysis Contribute to Usability Understanding?. Human Movement Science,Elsevier, 2010, 29 (4), pp.529. 10.1016/j.humov.2010.03.005. hal-00659890

Accepted Manuscript
Can Human Movement Analysis Contribute to Usability Understanding?
Juan–Manuel Belda–Lois, Helios de–Rosario, Romà Pons, Rakel Poveda, Ana
Morón, Rosa Porcar, Ana–Cruz Garcı ´a, Amelia Gómez
PII: S0167-9457(10)00062-X
DOI: 10.1016/j.humov.2010.03.005
Reference: HUMOV 1232
To appear in: Human Movement Science
Received Date: 24 February 2009
Revised Date: 11 March 2010
Accepted Date: 17 March 2010
Please cite this article as: Belda–Lois, J., de–Rosario, H., Pons, R., Poveda, R., Morón, A., Porcar, R., Garcı ´a, A.,
Gómez, A., Can Human Movement Analysis Contribute to Usability Understanding?, Human Movement Science
(2010), doi: 10.1016/j.humov.2010.03.005
This is a PDF file of an unedited manuscript that has been accepted for publication. As a service to our customers
we are providing this early version of the manuscript. The manuscript will undergo copyediting, typesetting, and
review of the resulting proof before it is published in its final form. Please note that during the production process
errors may be discovered which could affect the content, and all legal disclaimers that apply to the journal pertain.

ACCEPTED MANUSCRIPT
Can Human Movement Analysis Contribute to
Usability Understanding?
Juan–Manuel Belda–Loisa,b,∗, Helios de–Rosarioa,b, Romà Ponsa, RakelPovedaa,b, Ana Morónc, Rosa Porcara,b, Ana–Cruz Garcíaa,b, Amelia
Gómeza,b
aInstituto de Biomecánica de Valencia. Camino de Vera s/nbCentro de Investigación Biomédica en Red en Bioingeniería, Biomateriales y
Nanomedicina (CIBER-BBN), Valencia, España.cAsociación de Familiares de Alzheimer de Valencia
Abstract
Nowadays human machine interfaces are evaluated using different methodolo-gies. These methodologies rarely consider the human movements involved inthe interaction, and if so, the movements are considered in a simplistic man-ner. Another often neglected aspect is the relationship between the learningprocess and the use of the interface. Traditional approaches of cognitivemodelling consider learning as just one continuous process. However there issome current evidence of concurrent processes on different time scales. Thispaper aims to answer, with experimental measurements, if learning actuallyimplies a set of concurrent processess, if those processes are related to the co-ordinative aspects of hand movement, and how this can vary between youngadult and elderly users. Two different interfaces, a washing machine and adomotic system, were analysed with 23 and 20 people, respectively, classifiedas men or women and elderly (over 55) or adult (between 40 and 50). Theresults of the study provide support for the existence of different concurrentprocesses in learning, previously demonstrated for motor tasks. Moreover,the learning process is actually associated with changes in movement pat-terns. Finally, the results show that the progression of the learning processdepends on age, although elderly people are equally capable of learning touse technological systems as young adults.
Keywords: usability, Fitts law, ageing
∗Corresponding author: [email protected]
Preprint submitted to Elsevier March 11, 2010

ACCEPTED MANUSCRIPT
1. Introduction
The purpose of this work is to show how human movement analysis cancontribute to an understanding of the interaction between technological de-vices and users. Research into Human Machine Interaction (HMI), beganwhen machines started to become increasingly complex. The appearance ofcomputers, with their flexibility of use and their associated complexity, wassuch an important milestone that by the mid 1980s computers became theparadigm of machine complexity.
One of the first approaches to HMI came from the application of CognitiveScience findings to interface design (Card et al., 1983). Since that time, manydifferent methodologies and models have been proposed for the analysis ofHMI.
Methodologies based on the cognitive approach rely on theories of thehuman mind that allow the analyst to make assumptions about how the userwould interact with the system. The aim here is to obtain a response whichcoincides with the behaviour of real users. There is a wide range of cognitivemodels, from the simpler ones such as GOMS (Goals Operators Methods andSelection Rules) or the Model of Human Processor (Card et al., 1983), to themore complex cognitive architectures such as ACT–R (Anderson, 1983).
Usability is another approach to HMI. It was defined in the early 1990s,and it is based on collecting data from users actively participating in theinterface assessment procedures Nielsen and Mack (1994).
Usability has many definitions, depending on the context in which it isapplied. For instance, ISO 9241-11:1997 defines usability mainly in relation tothe efficiency, performance and satisfaction of the user, because it is orientedtowards usability in the workplace. Other definitions of usability, such asthat proposed by Brink et al. (2002), put more emphasis on the ease of use,the ease of learning and the pleasure derived from use.
However, although users are given theoretical importance in assessment,usability issues are often addressed by expert design recommendations, thebest known of which are Nielsen (1994) web design guidelines. Such guide-lines sometimes rely exclusively on the experience and criteria of designersand experts, and it is not always clear how they have been validated (Healthand Human Services Dept. (U.S.), 2007).
Other approaches are based on heuristic models (Lo and Helander, 2004)
2

ACCEPTED MANUSCRIPT
founded on assumptions concerning ease of use, such as simpler products
would be easier to use, and subsequent metrics to measure that assumption.Thimbleby (2004) suggests the use of matrix algebra and Markov models forusability analysis (Thimbleby et al., 2001).
Every approach has its pros and cons, but practitioners of each one usuallybelong to different, often diverging fields.
Both the cognitive and usability approaches consider the time required tofinish a task as one of the key parameters for the assessment of the efficiencyof the interface. In fact, some methodologies (such as GOMS or the KeystrokeLevel Model) are basically focused on the estimation of the time required bythe user to perform a task. In usability analysis with users, time is always ameasurement, but there are other metrics considered too, such as the numberof steps required, or the perception of ease of use from the user’s point ofview.
Learning is also an important aspect, although it is often neglected inusability studies. Thimbleby et al. (2001) compare the behaviour of an un-trained user with a purely random system (in which any part has the sameprobability of being activated), and the behaviour of an expert with a finiteautomata. Any stage of the learning process should therefore fall betweenthe two extremes. Using this rationale, the authors obtain a theoretical curvethat should be related to the ease–of–use of the system. Although most us-ability practitioners include ease–of–learning in their definitions, they rarelyface the problem of learning directly. It is more frequent to segment usersby their skill level (Faulkner and Wick, 2005), considering in this way theaspect of ease–of–use for the whole range of learning.
Learning is at the core of many cognitive models. Under the cognitiveapproach it is often assumed that learning follows the Power Law of Practice(Rosenbloom and Newell, 1988), which establishes that the time required toperform a task decreases with the number times the action has been repeated.Many cognitive models (such as GOMS or the Key Stroke Level Mode) ex-plicitly assume that the learning process of an HMI follows this law of prac-tice. However, the Power Law of Practice has recently been questioned byresearchers from the field of motor development (Newell et al., 2006). Theseauthors argue that learning is not an activity of continuous improvement,but involves different processes at different time scales, similar to the chang-ing paradigm of motor development in children (Thelen and Smith, 1994).Newell et al. (2006) assume at least two concurrent processes: adaptation,associated with the gain in practice during one session, and learning, the
3
ACCEPTED MANUSCRIPT
gain that remains between sessions. These authors found that the decreasein gain between sessions (the first repetition of a new session is often worsethan the last repetition of the previous session) is not due to a mechanism offorgetfulness, but that the two gain rates are due to different mechanisms.
Cognitive modelling assumes that input (information coming in throughthe sensory systems), output (the action produced by the musculo–skeletalsystem) and cognition (the information processing in the brain) are separatemodules. Therefore, cognitive models more or less assume that the brainestablishes the next target from the information gathered by the sensory sys-tem (i.e. the eyes) and then it causes the body to move towards that target(i.e. see the Model of Human Processor in Card et al. 1983). It assumesthat this movement will approximately follow Fitts’ Law and that learning isproduced at “brain level” and does not affect movements. However, many au-thors now agree that brain and body are intrinsically interconnected in such away that cognitive processes cannot be separated from the body. Therefore,a relationship could be expected between the coordination components ofmovements and the learning stage, even for activities that require low motorskills, such as a simple interface use.
When dealing with HMI and elderly people, approaches differ widely.Cognitive modelling is seldom used in this case. One of the few attemptsthat has been made, involved a modification of the Keystroke Level Model(Charnes and Bosman, 1990). The kind of guidelines followed by usabilitypractitioners are usually of the type: “Keep the design as simple as possibleso that even elderly people can use it” (e.g. Dickinson et al. 2005). Manyof these approaches reduce the possibilities of the applications for the sakeof ease of use, and also limit the expertise that the user can reach. In othercases, it is assumed that elderly people refuse the use of technology. However,it is thought that this effect will tend to disappear in the future as technologybecomes diffused into daily living activities (Ahn, 2004).
This paper consists of an HMI usability study of everyday products, inwhich the learning process of elderly people is specifically considered. Thestudy aims to answer the following questions:
• Does learning imply a single process or do concurrent processes exist?
• Are coordinative aspects of movement related to learning how to usean interface?
• Can elderly people learn to operate complex technological interfaces or
4

ACCEPTED MANUSCRIPT
Adult Elder TotalMen 4 7 11Women 4 8 12Total 8 15 23
(a) Washing machine
Adult Elder TotalMen 3 7 10Women 3 7 10Total 6 14 20
(b) Domotic interface
Table 1: Participants in the studies
they require simple ones?
2. Material and methods
Two different interfaces were analysed: a low–tech interface (washing ma-chine) and a high–tech one (the tactile screen of a domotic system). Eachinterface was analysed in a different experimental context. Different instru-mentation techniques were used to assess their adequacy.
Elderly and adult users took part in both experiments. The elderly groupcomprised active people over 55 years of age; the adult group was formed bypeople between the ages of 40 and 50.
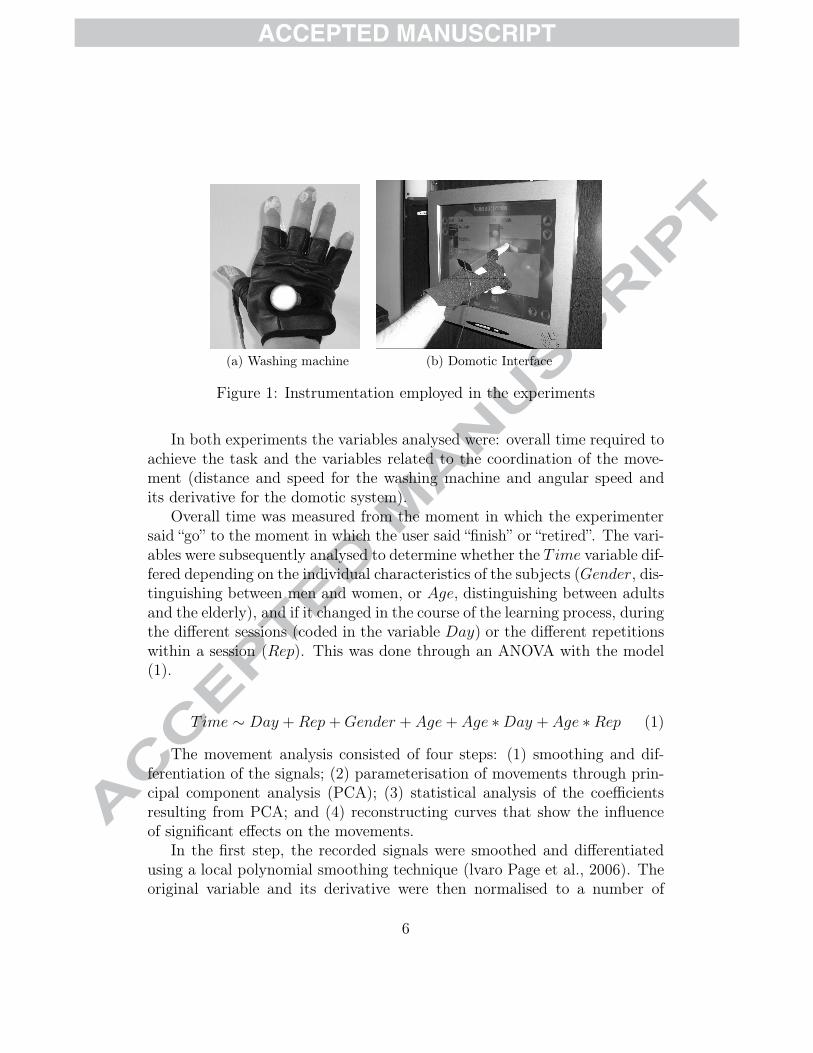
For the washing machine experiment 23 users took part in the study(Table 1a). Each user had to perform a task (AppendixA) three times onfour different days, with the days scheduled as consecutive as possible (witha difference of 1 to 5 days). 2D photogrammetry was used to analyse themovements involved in approach and withdrawal, to and from the programwheel selector. The users were instrumented with a reflective maker on thedorsal part of the hand (figure 1a). The variable of analysis was the distancefrom the hand to the program wheel control, within a range of 300 pixels inthe image, corresponding to an approximate movement of 20 cm.
For the analysis of the domotic interface, 20 users took part in the study(Table 1b). Each user had to perform three different tasks (AppendixB)with the system in three consecutive repetitions and on four different days.As was the case, in washing machine experiment, the days were scheduledas closely as possible minimum span 1 day, maximum 5 days). The userswere instrumented with an inertial sensor (I–Sens from TechNAid) (Figure1b). Three dimensional angular velocities were recorded, but the variableanalysed was the magnitude of angular velocity around the instants in whichthe users pushed any button on the touch screen.
5
ACCEPTED MANUSCRIPT
(a) Washing machine (b) Domotic Interface
Figure 1: Instrumentation employed in the experiments
In both experiments the variables analysed were: overall time required toachieve the task and the variables related to the coordination of the move-ment (distance and speed for the washing machine and angular speed andits derivative for the domotic system).
Overall time was measured from the moment in which the experimentersaid “go” to the moment in which the user said “finish” or “retired”. The vari-ables were subsequently analysed to determine whether the T ime variable dif-fered depending on the individual characteristics of the subjects (Gender, dis-tinguishing between men and women, or Age, distinguishing between adultsand the elderly), and if it changed in the course of the learning process, duringthe different sessions (coded in the variable Day) or the different repetitionswithin a session (Rep). This was done through an ANOVA with the model(1).
T ime ∼ Day + Rep + Gender + Age + Age ∗ Day + Age ∗ Rep (1)
The movement analysis consisted of four steps: (1) smoothing and dif-ferentiation of the signals; (2) parameterisation of movements through prin-cipal component analysis (PCA); (3) statistical analysis of the coefficientsresulting from PCA; and (4) reconstructing curves that show the influenceof significant effects on the movements.
In the first step, the recorded signals were smoothed and differentiatedusing a local polynomial smoothing technique (lvaro Page et al., 2006). Theoriginal variable and its derivative were then normalised to a number of
6

ACCEPTED MANUSCRIPT
samples (253 for the washing machine and 217 for the domotic interface),thus obtaining a parametric curve, expressing the measured variable and itsderivative as a function of the samples (2). This parametric curve is, in fact,a phase portrait of the movement (i.e. see Figure 3).
x(s) = f1(s)
y(s) = f2(s)(2)
In the second step, principal component analyses (PCA) were made for allthe curves, considering the value of the variables in each sample as a differentvariable and considering the different curves as different observations. Theprincipal components explaining more than 5% of variance were retained. Itwas thus possible to refer every curve to a reduced number of parameters(3): the scores of the adjustment to the PCA that we will call adjustedcoefficients (AC, ci in the equation), and the number of curves common toall the cases: the average curve (µ), and the set of curves, that we will callprincipal component curves (PCC, ξi(x, y) in the equation), which are similarto the functional principal components described by Ramsay and Silverman(1997). Every PCC is orthonormal and the mean of the AC for each PCC iszero.
f(x, y) = µ(x, y) +∑
ci · ξi(x, y) (3)
In the third step, the resulting ACs were analysed through univariateANOVA with the model (4), where T ime is the time required to perform atask, then introduced as a covariate in order to separate its effect from otherfactors. The other factors coincide with those used in (1).
ci ∼ Day + Rep + Gender + Age + Age ∗ Day + Age ∗ Rep + T ime (4)
Finally, to understand the influence of each factor on the movementcurves, we obtained the marginal means of the ACs which showed significantdifferences due to the factor under consideration. The corresponding PCCwere reconstructed with those values, and new curves were reconstructedsumming those PCC with the average curves. These reconstructed curvesare referred as “marginal mean curves”.
7

ACCEPTED MANUSCRIPT
Washing machine Domotic SystemDay <0.001 bf<0.001Rep bf<0.001 bf<0.001
Gender 0.658 bf<0.001Age bf<0.001 bf<0.001
Age*Day 0.937 bf<0.001Age*Rep 0.101 bf<0.001
Table 2: p–Values for T ime in the analysis of both systems. The conditionswhere significant differences were found are in bold face
3. Results
3.1. Time analysis
In the washing machine experiment, T ime differed depending on Day
and Rep (Table 2), which indicates that users achieved some improvement.The time required to perform a task decreased per Day and Rep (figure 2a);since, T ime has an asymptotic behaviour, the time required to perform atask on the fourth day was close to a (local) minimum. There were alsodifferences depending on Age: elderly people required more time than adultpeople (the marginal mean for elderly people is t = 20.3s, and for adult it ist = 12.3s). No differences were found per Gender (between men and women).No differences were either found for the interaction between Age ∗ Day orAge ∗ Rep.
In the experiments with the Domotic System, all factors and interactionsbetween factors affected T ime (Table 2). The effects of Day and Rep weresimilar to those of the washing machine experiment. But in this case dif-ferences were also found for Gender (women required less time than men toperform the task), and for the interactions. The time required by an elderlyperson to perform the task still decreased after the fourth session, while anadult could reach the minimum time as early as the second session (Figure2b).
3.2. Movement analysis
Figure 3 shows the phase portrait curves of both experiments, averaged forall subjects. The phase portraits define the dynamic change of the movementvariables measured in the experiments, representing their value against thevalue of their time derivative.
8

ACCEPTED MANUSCRIPT
Day
4321
35,00
30,00
25,00
20,00
15,00
10,00
5,00
3
2
1
Repetition
(a) Time required to perform the washingmachine task per repetition and per day(in seconds)
Day
4321
70
60
50
40
30
20
Adult
Elder
Age
(b) Time required to perform the domotic interfacetask per age group and day (in seconds)
Figure 2: Analysis of variable time
In the washing machine (figure 3a) three different phases can be found:
1. The approach phase: as the hand approached the button, the distancedecreased. Therefore, it is represented by the section of the curve withnegative speed values. As this phase progressed, the absolute value ofspeed decreased smoothly. That indicates a straight movement towardsthe target.
2. The manipulation phase: this phase is characterized by low distanceand speed values.
3. The withdrawal phase: its pattern generally mirrored the approachphase, with increasing positive values of speed as distance increased.However, the absolute value of speed was lower than during the ap-proach, and the speed did not increase homogeneously. This may in-dicate a hesitating movement, that was not observed in the approachphase.
The phase portrait of the domotic system (figure 3b) is different, becausein that experiment the variable recorded was not the hand position, but itsangular velocity. The hand was initially addressed towards the screen in astraight direction, and it was rotated as the target point of the screen wasapproached. Therefore, as the movement progressed, the variable measuredin this experiment (angular velocity) did not decrease, but actually increased.Two movement phases were found in this case:
9

ACCEPTED MANUSCRIPT
(a) Distance of the hand to the button vs.hand speed in the washing machine exper-iment.
(b) Absolute value of hand angular veloc-ity vs. angular acceleration in the domoticsystem experiment
Figure 3: Average phase portrait of the movements
1. Movement start: as the angular velocity increased during this phase,it is represented by the section of the curve with positive angular ac-celeration, with an initially high value that decreased as this phaseprogressed..
2. Movement end: it is the section of the curve that mirrors the previousphase.
In this case, the hesitation (uneven ratio of angular acceleration change) wasfound in the second phase.
In the washing machine experiment, there were seven PCCs that ex-plained more that 5% of variance (figure 4a), altogether accounting for 68%of the variance explained by the model. In the case of the domotic system,there were four PCC that explained more than 5% of variance, altogetheraccounting for 82% of variance explained by the model.
The results of the statistical analysis for the washing machine experiment(Table 3), show that AC1 explains the aspects related to the learning process,that is, the differences in the movement per day and repetition; AC2 explainsthe differences between user groups (elderly vs. adults and men vs. women);and there are further ACs that explain age-related and gender-related differ-ences (AC4 and AC7, respectively).
AC1 and AC2, which were significantly influenced by T ime, had a positivecorrelation with that variable. This means that those components of themovement were related to the slowness of the user doing the task. A post-
10

ACCEPTED MANUSCRIPT
(a) Washing machine (b) Domotic system
Figure 4: Variance explained by each PCC
AC1 AC2 AC3 AC4 AC5 AC6 AC7Day bf0.036 0.343 0.809 0.396 0.106 0.642 0.484Rep bf0.003 0.549 0.455 0.933 0.360 0.121 0.079Gender 0.293 bf<0.001 0.779 0.610 0.276 0.214 bf0.014Age 0.107 bf0.021 0.158 bf0.014 0.935 0.425 0.553Time bf0.001 bf<0.001 0.686 0.318 0.688 0.512 0.239Age*Day bf0.031 0.275 0.954 0.213 0.504 0.549 0.595Age*Rep 0.127 0.150 0.615 0.382 0.065 0.711 0.701
Table 3: p–Values of the univariate ANOVA per AC in the washing machineexperiment. Significative differences in bold face
hoc analysis revealed that AC1 was greater on the first day and the firstrepetition of each day, than on the two last days and the two last repetitionsof each day. The effect of the interaction between Age and Day on AC1 wasthat on the third day, this component of the movement was greater for elderlypeople, although this difference vanished on the fourth day. According to thispost-hoc analysis, AC2 was generally greater for elderly and for male users,whereas AC4 was greater for elderly, and AC7 for male.
For the Domotic system, AC1 was related to most of the analysed param-eters, while AC2 was related to group parameters: Age and Gender. AC3and AC4 explained some other details of these two parameters (table 4).
As in the case of the washing machine, the components of movementthat were influenced by T ime (all but AC3), were positively correlated to
11

ACCEPTED MANUSCRIPT
AC1 AC2 AC3 AC4Day bf<0.001 0.119 0.087 0.168Rep bf<0.001 0.690 0.860 0.399
Gender bf0.006 bf0.017 0.554 0.188Age bf<0.001 bf<0.001 bf<0.001 0.159Time bf<0.001 bf0.006 0.583 bf0.005
Age*Day bf<0.001 0.447 0.481 0.728Age*Rep 0.992 0.957 0.518 0.670
Table 4: p–Values of the univariate ANOVA per AC in the domotic systemexperiment. Significative differences in bold face
that variable, and the post-hoc analysis revealed similar effects of the factorsover all components: those that showed differences depending on Age orGender had greater averages for elderly and male. AC1, which also receiveda significant effect of Day and Repetition, was greater in the first day than inthe three following days, and decreased on significantly with every repetition.The interaction between Age and Day, however, had a different effect inthis case: the distance in AC1 between the adults and elderly, which wasthe average difference on the first day, decreased significantly on the secondday, but the average ratio was restored on the third day, and the differenceincreased on the fourth day.
As has been established in section 2, the marginal mean curves for eachfactor (figures from 5 to 8) were obtained from the marginal means of theACs which were significantly affected by the factor. For instance, to showdifferences in the movements of men and women in the washing machineexperiment (figure 6b), the marginal means of AC2 and AC7 were obtainedfor both groups, and the curves were then reconstructed using (3).
Regarding the washing machine learning process (figure 5), it can beseen that the approaching speed increased gradually during the three firstdays, but the approach movement on the fourth day was indistinguishablefrom the third. The evolution of the withdrawal movement is less clear;the curve reflects an increase in the dynamic component of the movement(variations in speed were greater). Regarding the adaptation process (relatedto repetitions), an evolution from the first to the second repetition was found,but the second and third repetitions were almost equal. These results aresimilar to those obtained in the time analysis; in other words, the reduction
12

ACCEPTED MANUSCRIPT
(a) Influence of day (marginal mean) (b) Influence of repetition (marginalmean)
Figure 5: Average phase portraits of the movement in the washing machineexperiment for the different days and repetitions, according to the ANOVAlinear model. Compare with the overall average phase portrait in 3a.
in the time required to perform the task is consistent with the increase ofspeed. Notice that, however, the increase of speed observed during differentrepetitions and days was not due to the lower task completion times, sincethe effect of T ime had been separated by introducing it as a covariate in (4).
Regarding Age, the approach movements of the elderly were slower thanthose of the adult, while withdrawal speeds were very similar (figure 6a). Thisresult is again consistent with the time analysis: elderly required more time toperform a task and their movements were slower. The results of Gender aremore surprising: women moved faster than men in both movement phases;however there were no differences in T ime. This could imply a differentmovement strategy between women and men to execute the tasks: womenwould have employed more time “thinking” about the next action, and thenperformed the movement faster, while men employed less time in thinkingand performed slower movements, resulting in similar times to accomplishthe task for both groups: different strategies yielded the same result.
For the Domotic system, AC1 was the only parameter related to thelearning process (table 4). The marginal mean curves per day and repeti-tion (figure 7) explain how the movements changed. On the first day themovements were considerably slower than on the other three days, whichshow more similar curves (figure 7a). The gain in repetition is higher, andalmost linear from one repetition to another. In order to analyse possible
13

ACCEPTED MANUSCRIPT
(a) Age (marginal mean) (b) Gender (marginal mean)
Figure 6: Average phase portraits of the movement in the washing machineexperiment for the different user groups, according to the ANOVA linearmodel. Compare with the overall average phase portrait in 3a.
relationships between day and repetition, another univariate ANOVA wasmade according to model (5), but no significant differences were found forthe interaction between Day and Rep (p–Value = 0.322).
AC1 ∼ Day + Rep + Gender + T ime + Day ∗ Rep (5)
Regarding Age, adult users moved faster than elderly users, and thisresult is consistent with the results obtained in the analysis of time, and alsowith the results obtained for the washing machine test (figure 8a). Womenmoved faster than men, which is consistent with the shorter times requiredto perform the tasks, as well as with the results obtained in the washingmachine test.
4. Discussion
First of all, it seems clear that, when using an interface, the coordina-tion aspects of movement depend on the skills acquire while actually usingit. Both for washing machines and domotic systems, movements are depen-dent on the number of days of user experience, and of the number of taskrepetitions (tables 3 and 4). Moreover, the movement pattern is related tothe time that is required to accomplish a task so that faster movements arerelated to shorter completion times. This result, despite its obviousness, iscontrast with the assumptions of some cognitive models such as the GOMS
14

ACCEPTED MANUSCRIPT
(a) Influence of day (marginal means) (b) Influence of repetitions (marginalmeans)
Figure 7: Average phase portraits of the movement in the domotic systemexperiment for different days and repetitions, according to the ANOVA linearmodel. Compare with the overall average phase portrait in 3b.
(a) Age (marginal means) (b) Gender (marginal means)
Figure 8: IAverage phase portraits of the movement in the domotic systemexperiment for different user groups, according to the ANOVA linear model.Compare with the overall average phase portrait in 3b.
15

ACCEPTED MANUSCRIPT
and the Keystroke Level Model (Card et al., 1983), as well as the ACT-R(Anderson, 1983) architecture which considers movement to be driven by theFitts’ law and, subsequently independent of the state of learning. From theresults shown it seems clear that movements and cognitive processes are notindependent. This could explain why some authors have found it difficult toadapt cognitive modelling to people with physical disabilities (Keates et al.,2002). Also, Fitts’ Law (Fitts and Radford, 1964) does not seem to be di-rectly applicable when a learning process is underway: the movements madetowards the goal depend on the learning state of the user.
Movement analysis provides more insight into usability studies: In thecase of the washing machine users, we discovered different strategies betweenthe men and women participating in the study: although no differences werefound in the time needed to accomplish the task (table 2), we did find dif-ferences in the aspects related to movements (table 3). This could imply agender differences in the way men and women perceived the information andthe way the acted to achieve the goal. This isn’t considered in other researchbased on these aspects to the knowledge of the authors.
The results obtained support the idea of concurrent processes in acquiringskills (adaptation and learning) which goes against the idea of a a uniqueprocess (learning), giving support of the theory of Newell et al. (2006). Theresults provide some evidence: changes in movements between repetitionswithin a session are different from those between sessions (figure 5). Alsothere were no interactions between variables when an explicit model wastested, meaning that the changes between repetitions were independent fromthe changes which occur between days. It can therefore be assumed thatdifferent processes are involved.
The results are also in contradiction with some generally held opinions(Dickinson et al., 2005). On the one hand, although elderly users movedslower than adults in both experiments, they were able to learn to use bothsystems effectively, including the domotic system (figure 2b). These resultsquestion certain approaches in the design of information and communicationstechnologies for the elderly, that call for oversimplification of the systems.
In relation to gender issues, men were seen to be as effective as womenin using the washing machine, and women were even better than men (2) inusing the domotic system. No gender barriers are therefore apparent for theuse of any of the products tested. However, women executed the movementsfaster than men in both cases, which may imply that each gender uses adifferent strategy.
16

ACCEPTED MANUSCRIPT
5. Conclusions
Regarding the three questions posed in the Introduction, the conclusionsreached are the following:
• Learning implies different concurrent mechanisms on different timescales, as suggested by Newell et al. (2006).
• The coordination aspects of movement depend on the learning state ofthe user as well as the state of the concurrent mechanisms related tolearning.
• Elderly people are perfectly capable of learning to use technologicaldevices, such as a general purpose domotic interface, although theyrequire more time than adults for the process.
Some other results were obtained:
• Movement analysis can provide useful information related to the use ofinterfaces, such as the different strategies used by men and women toperform a task. Movement measures are time functions that comprisefar more data than simple parameters as time consumption, or numberof errors; therefore, it is possible to find subtler differences in them de-pending on the user characteristics, or the learning process. Moreover,the dynamic characteristics of the variables can reveal the points whereusers hesitate. That information may help designers to detect the weakpoints of a system.
• Elderly people performed slower hand movements than adults, andwomen moved faster than men, when interacting with the interfacesunder study.
• The usual cognitive modelling strategies would have failed to modeluser movements during the learning phase.
AppendixA. Tasks for the tests with the user machine
Task 1
Set the program to 30º, the spin-dry at minimum speed and include theextra rinse cycle.
17
ACCEPTED MANUSCRIPT
Task 2
Set the program to the hottest temperature for washing, the spin–dryat maximum speed, and include the extra rinse cycle and the easy ironingmode.
Task 3
Set the system for washing in cold water and the timer to start in 2 hours.
Task 4
Set the pre–wash and the soak cycle.
AppendixB. Tasks for the tests with the domotic system
Task 1
Start with everything turned off. The user should switch on the movementsensor for the alarm system and the external light.
Task 2
Start with the external light turned up to 100%. The user should regulatethe power of the external light down to 0% and switch on the movementsensor.
Task 3
Start with the external light turned up to 100%. The user should openthe blinds and turn on the internal light.
References
Ahn, M., 2004. Older peoples attitudes toward residential technology: therole of technology in aging in place. Ph.D. thesis, Virginia Tech University.
Anderson, J. R., 1983. The Architecture of Cognition. Harvard UniversityPress, Cambridge, MA.
Brink, T., Gergle, D., Wood, S. D., 2002. Usability for the Web: DesigningWeb Sites that Work. Morgan Kaufman.
Card, S. K., Moran, T. P., Newell, A., 1983. The Psychology of HumanComputer Interaction. Lawrence Erlbaum Associates.
18

ACCEPTED MANUSCRIPT
Charnes, N., Bosman, E., 1990. Human Factors and Design for Older Adults,3rd Edition. Handbook of the Psychology of Ageing. Academic Press, INc.,Ch. 26, pp. 446–463.
Dickinson, A., Newell, A. F., Smith, M. J., Hill, R. L., 2005. Introducingthe internet to the over-60s: Developing an email system for older novicecomputer users. Interacting with Computers 17, 621–642.
Faulkner, L., Wick, D., 12 2005. Cross-user analysis: Benefits of skill levelcomparison in usability testing. Interacting with Computers 17 (6), 773–786.
Fitts, P. M., Radford, B., 1964. Information capacity of discrete motor re-sponses under different cognitive sets. Journal of Expermiental Psychology67, 103–112.
Health and Human Services Dept. (U.S.), 2007. Research-Based Web Designand Usability Guidelines. U.S. Government Printing Office, Washington.
Keates, S., Langdon, P., Clarkson, P. J., Robinson, P., 2002. User modelsand user physical capability. User Modeling and User-Adapted Interaction12, 139–169(31).
Lo, S., Helander, M., 2004. Developing a formal usability analysis method forconsumer products. In: Proceedings of the Third International Conferenceon Axiomatic Design. pp. 1–8.
lvaro Page, Candelas, P., Belmar, F., 2006. On the use of local fitting tech-niques for the analysis of physical dynamic systems. European Journal ofPhysics 27 (2), 273–279.
Newell, K. M., Mayer-Kress, G., Liu, Y.-T., 2006. Human learning: Powerlaws or characteristic time scales? Tutorials in Quantitative Methods forPsychology 2 (2), 66–76.
Nielsen, J., Mack, R. L., 1994. Usability Inspection Methods. John Wiley &Sons, Inc.
Nielsen, J., 1994. Designing Web Usability: The Practice of Simplicity. NewRiders Publishing, Indianapolis.
19

ACCEPTED MANUSCRIPT
Ramsay, J. O., Silverman, B. W., 1997. Applied Functional Data Analysis.Springer, New York.
Rosenbloom, P. S., Newell, A., 1988. An integrated computational model ofstimulus-response compatibility and practice. The Psychology of learningand motivation 21, 3–49.
Thelen, E., Smith, L. B., 1994. A dynamic systems approach to the develop-ment of cognition and action. MIT Press.
Thimbleby, H., Cairns, P., Jones, M., 2001. Usability analysis with markovmodels. ACM Transactions on Computer-Human Interaction 8 (2), 99–132.
Thimbleby, H., 2004. User interface design with matrix algebra. ACM Trans-actions on Computer-Human Interaction 11 (2), 181–236.
20