can airborne ultrasound monitor bubble size in chocolate?eprints.whiterose.ac.uk/89607/1/2014 -...
TRANSCRIPT

This content has been downloaded from IOPscience. Please scroll down to see the full text.
Download details:
IP Address: 194.80.232.16
This content was downloaded on 10/11/2014 at 14:57
Please note that terms and conditions apply.
Can airborne ultrasound monitor bubble size in chocolate?
View the table of contents for this issue, or go to the journal homepage for more
2014 J. Phys.: Conf. Ser. 498 012001
(http://iopscience.iop.org/1742-6596/498/1/012001)
Home Search Collections Journals About Contact us My IOPscience

Can airborne ultrasound monitor bubble size in chocolate?
N Watson1, T Hazlehurst
1, M Povey
1, J Vieira
2, R Sundara
2, J-P Sandoz
3
1School of Food Science and Nutrition, University of Leeds, UK.
2Nestlé Product Technology Centre, York, UK.
3Institute of Applied Microtechnology, HE-ARC, Switzerland.
E-mail: [email protected]
Abstract. Aerated chocolate products consist of solid chocolate with the inclusion of bubbles
and are a popular consumer product in many countries. The volume fraction and size
distribution of the bubbles has an effect on their sensory properties and manufacturing cost. For
these reasons it is important to have an online real time process monitoring system capable of
measuring their bubble size distribution. As these products are eaten by consumers it is
desirable that the monitoring system is non contact to avoid food contaminations. In this work
we assess the feasibility of using an airborne ultrasound system to monitor the bubble size
distribution in aerated chocolate bars. The experimental results from the airborne acoustic
experiments were compared with theoretical results for known bubble size distributions using
COMSOL Multiphysics. This combined experimental and theoretical approach is used to
develop a greater understanding of how ultrasound propagates through aerated chocolate and to
assess the feasibility of using airborne ultrasound to monitor bubble size distribution in these
systems. The results indicated that a smaller bubble size distribution would result in an increase
in attenuation through the product.
1. Introduction
There are many different varieties of chocolate bars available to consumers with one of the most
popular being aerated chocolate bars. Aerated chocolate bars consist of a solid bar with the inclusion
of many bubbles. The gas in the bubbles is usually a carbon dioxide mix and is added to the bars
whilst the chocolate is in a liquid state. Once the chocolate solidifies, the nitrous oxide disperses in the
atmosphere to be replaced by atmospheric gases. An important property of aerated chocolate bars is
the volume fraction of gas and the bubble size distribution. These features have a significant effect on
the production cost, sensory attributes and consumer perception of the product, therefore the bubble
size distribution is monitored during production. Current techniques to monitor bubble size in these
products consist of removing samples from the production line, breaking the bar to expose the bubbles
and making a visual observation of the bubble size distribution. This method is far from ideal as the
classification of bubble size is subjective, and can often only identify undesirable bubble sizes in
products long after the fault has occurred. There is an industry need for online real time techniques
capable of monitoring the bubble size in these products to optimise the manufacturing process, ensure
product consistency and minimise production waste. Acoustic and optical techniques do exist to
1 To whom any correspondence should be addressed.
12th Anglo-French Physical Acoustics Conference (AFPAC2013) IOP PublishingJournal of Physics: Conference Series 498 (2014) 012001 doi:10.1088/1742-6596/498/1/012001
Content from this work may be used under the terms of the Creative Commons Attribution 3.0 licence. Any further distributionof this work must maintain attribution to the author(s) and the title of the work, journal citation and DOI.
Published under licence by IOP Publishing Ltd 1

measure bubbles sizes in systems such as the fermentation process [1] but the majority of these have
only been utilised in liquid systems. Acoustic techniques are well developed and employed for
measuring dispersed phase size of droplets in emulsions [2, 3] although it should be remembered that
systems with bubbles are very different. Existing acoustic techniques comprise of either listening to
the sound of moving or collapsing bubbles (in a liquid system) or transmitting ultrasound through the
systems [4-7]. Most active transmission technique require multiple measurements on the system under
investigation and can require complex data analysis rendering them unsuitable for an online
measurement system on a fast moving production line due to the time required to make multiple
measurements and process the data.
For process monitoring in the food industry there is a need for non contact and non invasive
techniques as contact could risk contamination of the food and potentially impact the process. This
would make most acoustic techniques unsuitable as the transducers are generally in contact with the
object under inspection. One solution would be to use a non contact air coupled system. This
technique works by transmitting an acoustic pressure wave from one transducer through air, the
product under investigation and through air again before the wave is detected by the receiver. The
properties of the tested food will affect the received signal so it is possible to infer information about
this product from the characteristics of the received pulse. Airborne ultrasound systems have being
used to detect foreign bodies in food products [8] but to the authors knowledge no studies have being
performed using the technique to monitor bubble sizes in aerated chocolate products.
Computational modelling techniques exist to study how ultrasound will propagate through systems
such as aerated chocolate bars and can be used to study the effects of varying experimental parameters
such as transducer frequency and location. If a well validated model is constructed it can be used to
optimise the design process of new instrument development by performing a large number of virtual
experiments which would be costly both in time and monetary terms to perform with actual
experiments.
The purpose of this work is to use a combined experimental and modelling approach to assess the
feasibility of using airborne ultrasound to monitor bubble size distributions in aerated chocolate bars.
This was achieved by constructing two model two dimensional aerated chocolate products from straws
and comparing the acoustic results with those from a COMSOL model with the same geometry.
Straws were chosen as they have the same cross sectional area across their length so a direct
comparison can be made to the 2D computational model. Experimental measurements were then made
on two aerated chocolate bars known to have different bubble size distributions. These results were
compared with two dimensional simulation results in which the geometry is a cross sectional area with
a bubble size distribution representative of the corresponding aerated bar. The representative cross
sectional area was determined by slicing each of the aerated chocolate bars, photographing the
exposed area and using image analysis to calculate the bubble size distribution. Since the surface
topography and material property is known to affect airborne ultrasound propagation this was also
investigated experimentally in order to understand ultrasound propagation in these systems and to
determine if the variations in ultrasound results are dominated by the bubble size distribution or other
properties of the aerated product. This information will help determine the feasibility of developing an
airborne ultrasound system for online real time monitoring of bubble size distribution.
Ultimately this research will provide valuable information into the viability of using airborne
ultrasound as a method to monitor bubble size distribution in aerated chocolate bars online in real
time.
This paper will start with a description of the experimental system and how it was used followed by
how the computational model was developed. Where possible the model was constructed to represent
the experiment as closely as possible. The results and discussion will be combined into a single
section. First the experiment and simulation results will be presented and compared for the straws.
Next the experimental and simulation results will be presented and compared for the actual aerated
chocolate. The final section of the results and discussion will experimentally study the affect of the
topography and surface condition on aerated chocolate bars.
12th Anglo-French Physical Acoustics Conference (AFPAC2013) IOP PublishingJournal of Physics: Conference Series 498 (2014) 012001 doi:10.1088/1742-6596/498/1/012001
2

2. Experimental methods
2.1 Airborne ultrasound system
For all measurements a bespoke airborne ultrasound system was used. This system can be seen in
Figure 1. The set up comprises of a pair of Ultran non contact transducers (1). Three different pairs of
transducers were used. One with a central frequency of 50 KHz (NCG50-S25), one with a central
frequency of 140 KHz (NCG140-S38) and one with a central frequency of 200 KHz (NCG200-S38).
Each pair of transducers was separated by a distance of 76 mm as this is the focal distance of all
transducers. The transducers were attached to a robotic stage so they could be automatically moved
over the aerated chocolate or straws. The straws or aerated chocolate were place at the centre distance
between the transducers using a mould with the bottom cut away (2). This was to ensure that the sound
wave only travelled though air and the sample under inspection. Both transducers were attached to a
handy scope HS3 USB oscilloscope (3). This was controlled by purpose built Labview software. The
software was used to send and receive the ultrasound pulse and analyse the received signal. The
software also controlled the robotic stage. As ultrasound is highly attenuated in air both the transmitted
and received pulse were amplified using an A 303 high voltage amplifier and modulator ( A A lab
systems, Israel) (4) for the transmitted pulse and THS4022 board (Texas instruments, USA) (5) for
the received signal.
Figure 1. Airborne ultrasound system.
2.2 Experiments performed
Three sets of experiments were performed using the airborne ultrasound system:
1. Small and large straw configuration
2. Aerated chocolate bars with small and large bubble size distribution
3. B Scan along the length of an aerated bar with different surface conditions
Each set of experiments measurements were made with all three pairs of airborne ultrasound
transducers. For each transducer the transmitting frequency was selected as the central frequency of
the transducer pair (50, 140, 200 KHz). The transmitted pulse was 50 μs seconds long and had a
sinusoidal shape function with a period twice that of the transmitted pulse duration. For all
experiments only the attenuation of the ultrasound pulse was measured. Initially a measurement was
made through air alone so that all the attenuation results could be presented relative to air. For this
12th Anglo-French Physical Acoustics Conference (AFPAC2013) IOP PublishingJournal of Physics: Conference Series 498 (2014) 012001 doi:10.1088/1742-6596/498/1/012001
3

calibration measurement the transmitted amplitude was set to 0.01 V. When the straws or aerated
chocolate was placed between the transducers the transmitting amplitude was increased to 6V. Once
the measurement was made through air the received pulse was saved in the software. The amplitude of
all other received pulses from the experiments was increased so that they matched this reference
amplitude and the attenuation could be calculated. For the final set of experiments the pair of airborne
transducers was scanned along the length of an aerated chocolate bar using the bespoke robotic
platform. The purpose of these experiments was to determine the effect that the shape of the chocolate
would have on the ultrasound attenuation. This is important as few chocolate bars are flat so the effect
the shape has on ultrasound attenuation must be studied. If the shape has more of an effect than the
bubble size distribution it may make the development of a process monitoring system difficult. In
addition to studying the effect of aerated chocolate bar topography the surface condition of the
chocolate may affect the attenuation. This was studied by placing small chocolate crumbs or an oil
layer on the top and bottom of the bar for a particular area and then scanning the airborne transducers
over the length of the bar. For these experiments the transducers were positioned in the center width of
the bar and scanned along the length by 80 mm. Figure 8 A and B show the region of the bar scanned.
For each scan a measurement was made every 0.5 mm.
2.3 Result representation
There are many different methods used to analyse acoustic propagation through a system such as
speed of sound or signal frequency content but it was decided to study only the attenuation through the
straws or aerated system. This method was chosen as the ultimate aim is to develop an online real time
system so we wanted to minimize the amount of signal analysis required. This was also the rationale
as to why we only used the single central frequency for each transducer. Spectroscopy techniques are
capable and successful at measuring bubble size distributions but they require algorithms to compute
the band width and the dispersive effects of each transducer and would not be suitable using the
current system and may not be suitable for a real-time system with temporal changes. For all results
presented in this paper the peak amplitude of the received pulse was measured. This was then
compared to the amplitude of the received pulse which had only travelled through air so that the
attenuation (relative to air) could be measured for each of the experiments using the equation below.
The 600 represents the voltage increase for the transmitted pulse (0.01 to 6) and the peak amplitude
difference is the difference in amplitude between the received pulse which has travelled through air
and the pulse which had travelled through the straws or aerated chocolate bar. When measuring the
peak amplitude of the received pulse it was important that this was measured on the section of the
received wave which had travelled through the straws or aerated chocolate bar. This was achieved by
windowing the received signal. Ten measurements were made for each experiment and the average
was recorded. For each measurement the aerated chocolate bar was removed and replaced so the error
associated with repeated changes in location could be observed. For the experimental results the
attenuation on the figures is the average of the ten measurements and the error bars represent the
standard deviation.
2.4 Image analysis of aerated chocolate
The aerated chocolate was sliced so that the bubble size distribution was exposed. This was done for
two aerated chocolate bars, one which was known to include abnormally large bubbles and one which
was known to include abnormally small bubbles. The exposed cross section area was photographed
using a Canon 500D digital Camera and subsequent image analysis was performed using ImageJ [9].
The image was cropped so that only the area containing the bubbles remained; this was then enhanced
12th Anglo-French Physical Acoustics Conference (AFPAC2013) IOP PublishingJournal of Physics: Conference Series 498 (2014) 012001 doi:10.1088/1742-6596/498/1/012001
4

and converted to a binary image. A water shedding function was employed so that the individual
bubbles could be seen and the particle size function was used to calculate the average area of the
bubbles and generate an outline of the bubbles which could be used in the COMSOL model. From the
ImageJ results if we assume that the bubbles are spherical in size the average radius of the small
bubble size distribution is 0.48 mm and the average radius of the large bubble size distribution is 0.56
mm.
Figure 2. Aerated chocolate bar cross sections and representative bubble
size distributions.
3. Computation modelling
3.1 Model definition
A computational model was created using COMSOL 4.3a to simulate how ultrasound propagates
through aerated products. Four models were made, one for the small straws, one for the large straws,
one for the aerated chocolate with a small bubble size distribution and one for the aerated chocolate
with a large bubble size distribution. All models used the COMSOL transient pressure acoustics model
and were created in two dimensions. Although the actual aerated chocolate bars would be more
representative in a three dimensional model, the small element size and simulation time step required
to accurately model the acoustic propagation in 3D would increase the simulation duration to an
unacceptable time with the current computational setup.
3.2 Geometry
The Geometry of the COMSOL model can be seen in Figure 3 A, The horizontal line at the bottom
represents the transmitting transducer and the horizontal line at the top represents the receiving
transducer. Both of these lines have representative dimensions of the airborne ultrasound transducers
used for the experiments. The arrow in this diagram represents the acoustic propagation path. The
geometry of the straws can be seen in Figure 3 B and C. The size number and wall thickness of the
straws was modelled with the dimensions used in the airborne experiments. The geometry for the
aerated chocolate consisted of a rectangle with height 13 mm and width 44 mm (approximate
dimensions of aerated chocolate bars used). The two dimensional images of the small and large bubble
size distributions calculated from image analysis (Figure 2 C and 2 D) were placed in the centre of
these rectangles. The two horizontal lines (representing transmitting and receiving transducers were
separated by a distance of 76mm as was used in the experiment.
A B
C D
12th Anglo-French Physical Acoustics Conference (AFPAC2013) IOP PublishingJournal of Physics: Conference Series 498 (2014) 012001 doi:10.1088/1742-6596/498/1/012001
5

Figure 3. Computational model geometry, A: Model domain with transducers straws
and air. B: Geometry of small straws, C: Geometry of large straws.
3.3 Acoustic wave propagation
To simulate the ultrasound propagation the bottom horizontal line experienced a plane wave radiation.
Three different frequencies of this pulse were simulated; these were 50, 140 and 200 KHz. These were
the same frequencies used in the airborne experiments. Each transmitted pulse was given a duration
and shape identical to the experiments. The ultrasound pressure wave propagated through the air and
aerated chocolate in the model and was detected at the top horizontal line in Figure 3 A, this
represented the receiver transducers. The pressure was integrated across this line as is the case in
acoustic transducers.
3.4 Material properties
The three materials used in the simulations were air, chocolate and paper (for the straws). The
important information for the ultrasound propagation was the longitudinal speed of sound and the
material's density. Air is a well defined property within the software so already had the required
values. For chocolate and paper these material properties can be seen in Table 1. For the speed of
sound of the chocolate a non aerated bar of the same chocolate was produced and the speed of sound
was measured experimentally using a contact ultrasound system. The density of the chocolate was
calculated by weighing an amount of known volume. The speed of sound and density of the paper
straws was measured using similar techniques.
Table 1. Simulation material properties
Longitudinal
Speed of sound
(m/s)
Density
(Kg/m3)
Chocolate 1500 1325
Paper 1325 800
3.5 Finite element mesh
The geometry of the system was discretised using a finite element mesh. A free triangular mesh was
used for all models. An important aspect is the size and number of mesh elements utilised as this
governs the accuracy, precision and time duration of the simulation. A trade off always exists to this
extent. Adopting the method of Mylavarapu and Boddapati [10] the maximum element size used was
A B
Receive
Transmit
C
Transmit
Receive
12th Anglo-French Physical Acoustics Conference (AFPAC2013) IOP PublishingJournal of Physics: Conference Series 498 (2014) 012001 doi:10.1088/1742-6596/498/1/012001
6

the ultrasound pulse wavelength divided by ten. This results in ten elements for each cycle of the
waveform. The wavelength was calculated from the speed of sound and the transmitted frequency
used.
3.6 Solver configurations
All simulations used a single time dependent solver. The selection of the simulation time step is
important as it controls the accuracy resolution and simulation duration. Mylavarapu and Boddapati
[10] stated that the simulation time step should be less than ((wavelength/10)/speed of sound). This
approach was used in this work. The longitudinal speed of sound used in this equation was chosen as
the highest value for a given simulation (paper or chocolate) to give the smallest critical time step and
ensure mathematical stability.
3.7 Data analysis
To ensure that the simulation results could be compared directly to the experiments the measurements
were made in the same way. First a simulation was performed without the presence of the straws or
aerated chocolate geometry and the maximum amplitude of the received pulse was recorded. For all
subsequent simulations through the straws and the aerated chocolate the peak amplitude of the
received pulse was recorded so that the attenuation is decibel relative to air could be calculated.
4. Results and discussion
4.1 Model 2D straw systems
Figure 4 display the results for attenuation through the small and large straw configurations at the
three different frequencies. Generally the attenuation is greater at a higher frequency which is usual for
acoustic results as attenuation increases with the propagating frequency squared. For all frequencies
the attenuation was highest in the smaller straws. As the total height of the straws was the same the
smaller straws consisted of more straws in the height of material. This resulted in an increased number
of interfaces reflecting the sound and an overall increase in attenuation. The difference in attenuation
between the small and large straws was not identical at all frequencies. At 50 KHz there was a
difference of around 3 dB whereas at 140 and 200 KHz the differences were approximately 0.5 and 1
dB respectively. The results from the simulations with the straw geometries showed the same trends as
from the experiment. The attenuation was found to increase with frequency and the small straws had
the highest attenuation. Consistent with the experiments the difference in attenuation between the
small and large straws was greatest for the 50 and 200 KHz transducers. It should be noted that the
three different pairs of transducers used all had slightly different geometries which might influence
some of the results. Quantitatively the attenuation was found to be higher in the experimental system
and the attenuation difference between the small and large straw geometries were greater from the
simulations.
12th Anglo-French Physical Acoustics Conference (AFPAC2013) IOP PublishingJournal of Physics: Conference Series 498 (2014) 012001 doi:10.1088/1742-6596/498/1/012001
7

Figure 4. Airborne attenuation measurements
on model systems of small and large straws.
Figure 5. COMSOL attenuation simulations on
model systems of small and large straws.
These results are very encouraging as they indicate that airborne ultrasound may distinguish between a
small and large bubble size distribution in a model two dimensional system. Although inversion
methods have not been used to calculate an actual bubble size distribution from the acoustic data the
results do show that an indication of size can be taken from one simple ultrasound measurement. This
would allow for quick online determination if a sudden change had occurred in the bubble size
distribution. A system would require calibration with a known good bubble size distribution but
calibration is common practice for online monitoring systems and the advantage of a processing
monitoring system which can instantly identify a change in a product property such as bubble size has
large commercial benefits. To understand how beneficial an airborne ultrasound system would be for
monitoring bubble size distribution it is important to understand and investigate all factors of the
product which will affect ultrasound propagation so that it can be determined how accurately can the
system detect changes in the bubble size distribution. It should be noted that these experiments and
55
56
57
58
59
60
61
62
63
64
65
0 100 200
Att
enuat
ion (
dB
)
Frequency (KHz)
Large straws
Small straws
40
45
50
55
60
65
70
0 50 100 150 200 250
Att
enuat
ion (
dB
)
Frequency (KHz)
Large straws
Small straws
Error
12th Anglo-French Physical Acoustics Conference (AFPAC2013) IOP PublishingJournal of Physics: Conference Series 498 (2014) 012001 doi:10.1088/1742-6596/498/1/012001
8

simulations were only performed at two representative size distributions; more sizes and distributions
should be studied to fully determine the capability of such a system.
The computational model predicts the main features of the experiments. The use of computational
models is becoming increasingly popular since they offer many benefits. Once a model is developed
and validated with suitable experiments such as those describe here, it can then be used to aid the
understanding of the science of the system under question as well as aid the development process of a
process monitoring system. The model developed during this research could be used to simulate a
wide range of frequencies and transducer geometries to find the most suitable one for studying the
aerated product under inspection. The model can also be used to optimise parameters in the system
such as pulse repetition frequency and precise transducer location. These simulation results could then
be used to minimise the time and cost required to develop the process monitoring system and increase
the possibility of producing a successful commercial system.
4.2 Chocolate with different bubble size distributions
Experimental results from the airborne experiments on aerated chocolate bars with a small and large
bubble size distribution show that attenuation increases with frequency and is higher in the bar with
the small bubble size distribution. These results are consistent with the measurements for the model
straw system. The difference in attenuation between the small and large bubble size distributions was
found to be larger for the lower frequencies, with a generally greater differential than for the straws
experiments. Image analysis revealed that the small and large bubble sized aerated bars had
approximately the same volume fraction of gas. For the small size distribution this would result in
more scattering objects (bubbles) in the active acoustic area resulting in the observed increase in
attenuation.
Figure 6. Experimental attenuation results from airborne
ultrasound system using aerated chocolate bars with a small
and large bubble size distribution.
50
55
60
65
70
75
80
85
90
95
0 50 100 150 200 250
Att
enuat
ion (
dB
)
Frequency (KHz)
Small Bubbles
Large bubbles
Error
12th Anglo-French Physical Acoustics Conference (AFPAC2013) IOP PublishingJournal of Physics: Conference Series 498 (2014) 012001 doi:10.1088/1742-6596/498/1/012001
9

Figure 7. Simulation attenuation results from airborne
ultrasound system using aerated chocolate bars with a small
and large bubble size distribution.
Simulation results for models with representative small and large bubble size distributions (taken from
image analysis of bars) indicate that attenuation increases with frequency although very little
difference was observed for the two different bubble sizes. For all frequencies the attenuation was
greater for the small bubble size distribution but this was only really noticeable for the simulations at
200 KHz. This difference was small compared with all other experimental and simulation results
presented in this research.
The COMSOL model used was a two dimensional representation of the system and this could account
for the difference between the experimental and simulations results. The straws experiment and
models had almost identical geometry and comparable results. The geometry used in the models of the
aerated chocolate bars were much simpler than the actual real life system as the image analysis only
generated a representation of the bubble size distribution and contained far fewer bubbles than are
known to exist in the actual products. The bubble area fraction from the image analysis was 35.5% for
the small bubbles and 34% for the large bubbles. For the actual aerated products it is known that the
aerated area size fraction is around 50%. This difference is accounted for by the lack of small bubbles
detected by the image analysis technique and it may be that these small bubbles have the greatest
effect on attenuation. With more accurate image recording and processing it will be possible to build
more accurate models capable of predicting the experimental system.
4.3 Effect of chocolate surface condition
B scans along the length of the aerated chocolate bars were performed to study the effect of the
topography of the products. The surface condition was also changed on certain sections of the bars by
adding either chocolate crumbs or an oil layer. The initial results showed that the attenuation through
the aerated bars is sensitive to the bubble size distribution but it is important to understand the effect
that other product factor may have on these results. This is to determine whether the airborne
ultrasound system is actually sensitive enough to monitor bubble size distribution. The application of
chocolate crumb was used to represent what may happen in a manufacturing environment and the oil
layer was used to represent a different surface condition. The results of the B scans (Figure 8) showed
that the topography of the chocolate products has a large affect on the attenuation with a variation of
35
40
45
50
55
60
0 50 100 150 200 250
Att
enuat
ion (
dB
)
Frequency (KHz)
Small bubbles
Large bubbles
12th Anglo-French Physical Acoustics Conference (AFPAC2013) IOP PublishingJournal of Physics: Conference Series 498 (2014) 012001 doi:10.1088/1742-6596/498/1/012001
10

approximately 15 dB. The attenuation was greatest at the side of one of the domes in the bar, this is
most likely due to the incident ultrasound wave contacting an angled surface and having a larger
proportion reflected away from the receiver than transmitting through the bar. The area at the top of an
individual domed section had the lowest attenuation even though this is the region with the most
aerated chocolate that the ultrasound pulse must travel through. The crumb layer had very little effect
on the overall attenuation (Figure 8 D) with only a small increase in attenuation in this region. The oil
layers did cause an increase in attenuation but this was only small (Figure 8 E). The average
attenuation was calculated from all points along the length scan and shown in Table 2. It can be seen
here that the scans with the surface conditions had a slightly higher average attenuation but this was
only approximately 3 dB.
Table 2. Average attenuation for different surface
coatings
Average
attenuation (dB)
Standard
deviation (dB)
None 72.3 0.5
Chocolate dust 75.2 1.2
Oil 75.4 1
The attenuation results for the aerated chocolate bars showed that at different frequencies the effect of
the small and large bubble size distributions was between 3 and 12 dB. The topography of the bar
affected the attenuation by a similar magnitude meaning that any online system would need to have an
accurate way to know exactly where on the bar the acoustic measurement was made, and statistical
techniques could also be used. Although this sounds challenging this is not as difficult as it appears.
Possibilities include using a laser range finder device or using calibration and synchronization
techniques with the current airborne ultrasound system. The results for varying surface conditions
showed that these had a small effect on the attenuation but this was not as great as that caused by the
topography or bubble size. These experiments actually had extreme versions of changes in surface
properties so it is anticipated that the actual effect they would have on an industrial system would be
less.
12th Anglo-French Physical Acoustics Conference (AFPAC2013) IOP PublishingJournal of Physics: Conference Series 498 (2014) 012001 doi:10.1088/1742-6596/498/1/012001
11
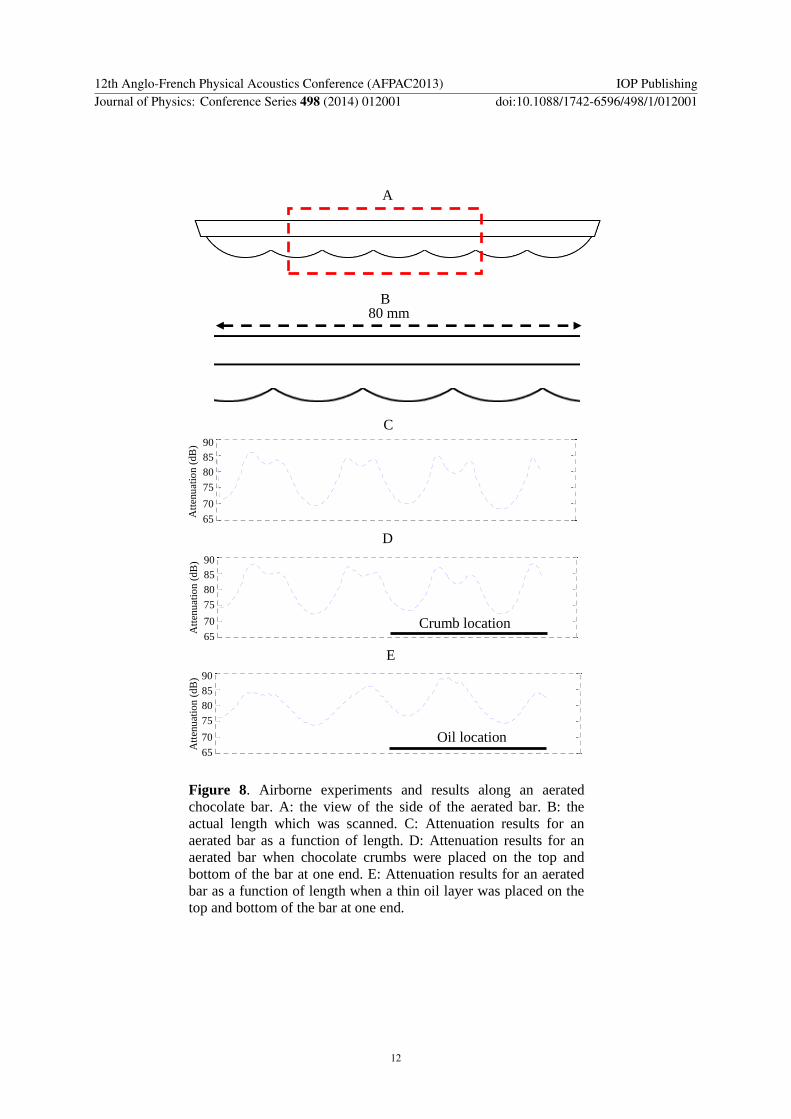
Figure 8. Airborne experiments and results along an aerated
chocolate bar. A: the view of the side of the aerated bar. B: the
actual length which was scanned. C: Attenuation results for an
aerated bar as a function of length. D: Attenuation results for an
aerated bar when chocolate crumbs were placed on the top and
bottom of the bar at one end. E: Attenuation results for an aerated
bar as a function of length when a thin oil layer was placed on the
top and bottom of the bar at one end.
B
A
E
90
85
80 75
70
65
Att
enu
atio
n (
dB
)
C
90 85
80
75
70 65
Att
enu
atio
n (
dB
)
D
90 85
80 75 70 65
Att
enu
atio
n (
dB
)
80 mm
Oil location
Crumb location
12th Anglo-French Physical Acoustics Conference (AFPAC2013) IOP PublishingJournal of Physics: Conference Series 498 (2014) 012001 doi:10.1088/1742-6596/498/1/012001
12

5. Conclusions
The purpose of this work was to determine the feasibility of using attenuation measurements by an
airborne ultrasound system to monitor bubble sizes distribution in aerated chocolate bars. A
computational model of the monitoring system and aerated chocolate was built to investigate whether
the model could predict the experimental results and be used to optimise the design process.
Experiments and simulations were performed on a 2D model system comprising of straws and aerated
chocolate bars with a small and large bubble size distributions. The effect of the chocolate bars shape
and surface properties on the ultrasound measurements was also investigated experimentally.
The results for the model two dimensional systems showed an increase in attenuation for the smaller
straws and a good qualitative comparison between the experimental and simulation results. The results
for the actual aerated chocolate bars also showed an increase in attenuation for the smaller bubble size.
The simulations of the aerated bars did not show this affect. This was attributed to the model merely
being a 2D representation of the experimental system whose image analysis may not fully represent
the actual bubble size of the aerated chocolate product. The scans along the aerated bars showed that
the shape of the bar had a great effect on the attenuation measurements but the surface condition (such
as oil layer or chocolate crumbs) had little.
From this work it is concluded that airborne ultrasound could be used to monitor bubble size
distribution in aerated chocolate products using attenuation measurements. More testing will be
required to determine how accurately the system can detect small changes as the current work only
studied two aerated products, one with a small and one with a large bubble size distribution. The
results are encouraging as they indicate that the current technique would be capable of identifying an
undesirable small or large bubble size distribution. The surface topography of the bars had a great
effect on the attenuation measurements so the location of the measurement on the product must be
known for meaningful interpretation of the results.
The computer simulations encouragingly recreated the experimental results for an identical geometry.
With more precise modeling of the aerated chocolate products it will be possible to generate three
dimensional models which could predict ultrasound propagation through the aerated bars and be used
to aid the design process for an airborne ultrasound process monitoring system.
References:
[1] Junker B, Maciejak W, Darnell B, Lester M and Pollack M 2007 Bioprocess Biosyst Eng. 30
313-326
[2] Povey M J W 1997 Ultrasonic Techniques for Fluids Characterization, Academic Press
[3] Dukhin A S and Goetz P J 2002 Ultrasound for Characterizing Colloids, Elsevier
[4] Strybulevych A, Leroy V, Scanlon M G and Page J H 2007 Soft Matter 3 1388-1394
[5] Cobus L A E B, Ross K A, Scanlon M G and Page J H 2007 j. Agric. Food. Chem. 55 8889-
8895
[6] Strybulevych A, Leroy V, Shum A L, Koksel H F, Scanlon M G and Page J H 2012 IOP
Conf. Series: Material Science and Engineering 42 012037
[7] Elmehdi H M, Page J H and Scanlon M G 2003 Journal of Cereal Science 38 33-43
[8] Pallav P, Hutchins D A and Gan T H 2009 Ultrasonics 49 244-253
[9] Abramoff M D, Magalhaes P J and Ram S J 2004 Biophotonics International 11 7 36-42.
[10] Mylavarapu P S K and Boddapati S 2011 Proceedings of the 2011 COMSOL Conference in
Bangalore
12th Anglo-French Physical Acoustics Conference (AFPAC2013) IOP PublishingJournal of Physics: Conference Series 498 (2014) 012001 doi:10.1088/1742-6596/498/1/012001
13