campus climate, diversity, and educational benefits ... campus climate, diversity, and educational...
TRANSCRIPT
1
Campus Climate, Diversity, and Educational Benefits
***** New Insights from Recent Research
New Directions for Institutional Research,Spring 2010, Vol. 145
Session # 563
Panelists
Nick Bowman, Notre Dame University (not present)Steven Chatman, University of California-BerkeleySerge Herzog, University of Nevada-RenoBerkeley Miller, San Francisco State UniversityRyan Padgett, The University of IowaSutee Sujitparapitaya, San Jose State University
AIR Forum 2010Chicago, IL, May 29 – June 2
2
Presentation Outline• Introduction (Herzog)
• Working with Large-Scale Climate Surveys (Chatman)
• Campus Climate at a Racially Mixed Institution (Miller, Sujitparapitaya)
• Gauging Freshmen Cognitive Development (Herzog)
• Impact of College Student Socialization, Social Class, and Race on Need for Cognition (Padgett)
• Q & A
2
Working with Large-Scale Climate Surveys: Reducing Data Complexity to Gain New Insights
Dr. Steve Chatman, SERU / UCUES Project Director
Office of Student Research / Office of Planning and Analysis/ Center for Studies in Higher Education
UC Berkeley
4
3
5
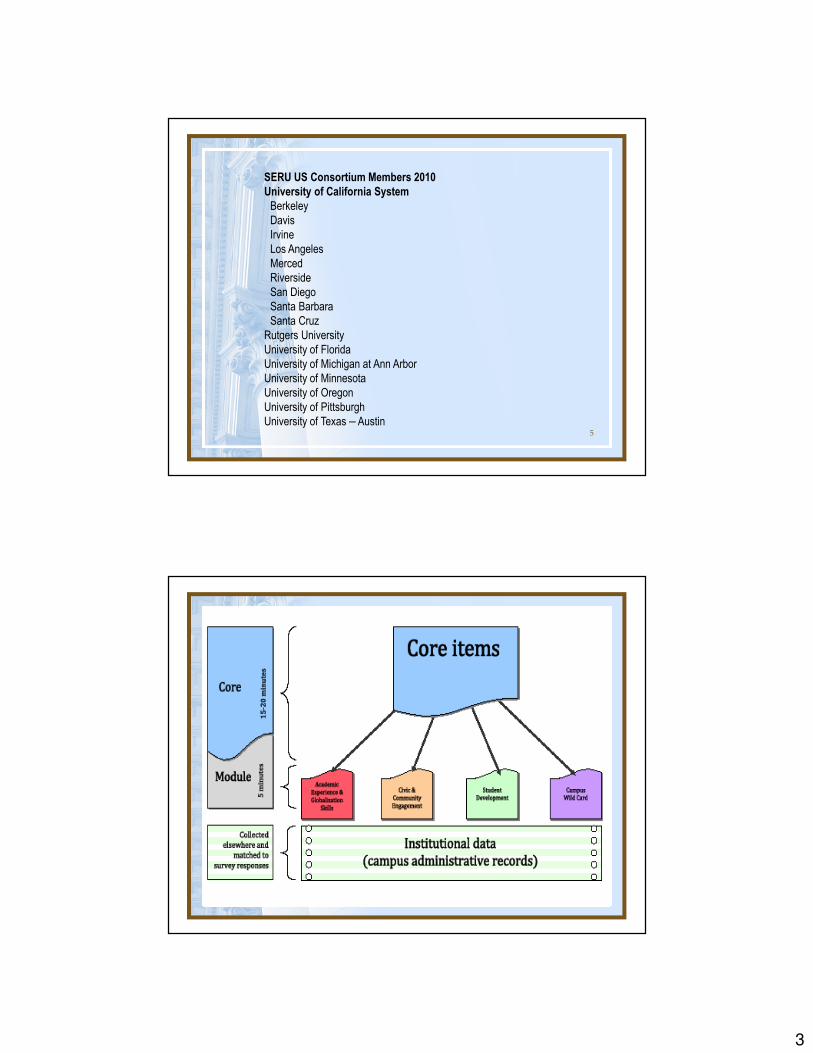
SERU US Consortium Members 2010
University of California System
Berkeley
Davis
Irvine
Los Angeles
Merced
Riverside
San Diego
Santa Barbara
Santa Cruz
Rutgers University
University of Florida
University of Michigan at Ann Arbor
University of Minnesota
University of Oregon
University of Pittsburgh
University of Texas – Austin
4
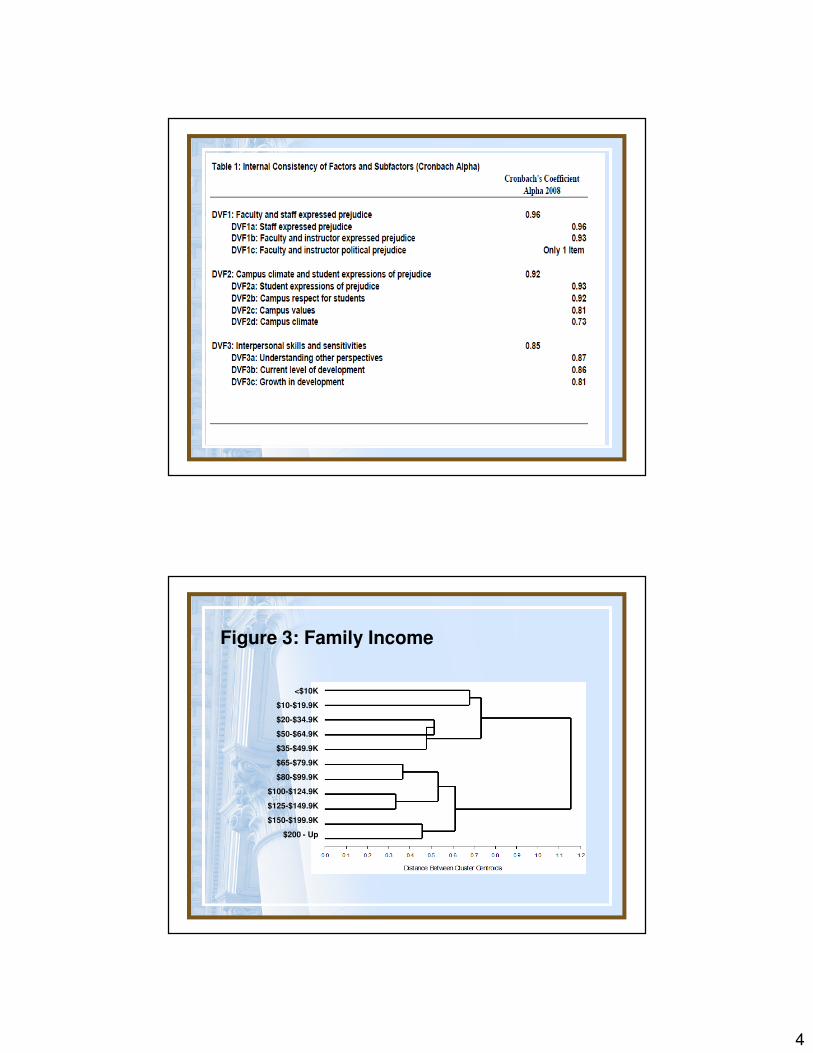
Figure 3: Family Income
<$10K
$10-$19.9K
$20-$34.9K
$50-$64.9K
$35-$49.9K
$65-$79.9K
$80-$99.9K
$100-$124.9K
$125-$149.9K
$150-$199.9K
$200 - Up
5
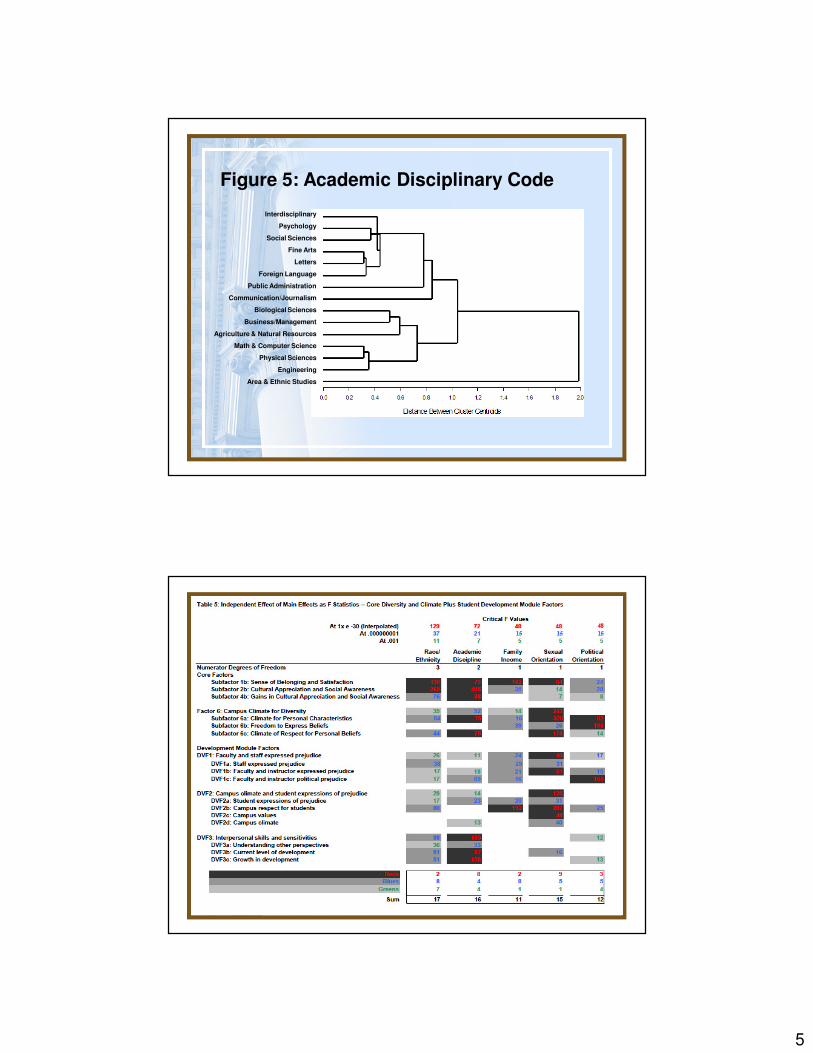
Figure 5: Academic Disciplinary Code
Interdisciplinary
Psychology
Social Sciences
Fine Arts
Letters
Foreign Language
Public Administration
Communication/Journalism
Biological Sciences
Business/Management
Agriculture & Natural Resources
Math & Computer Science
Physical Sciences
Engineering
Area & Ethnic Studies
6
Campus Climate in the 21st Century: Estimating Perceptions of Discrimination at a Racially Mixed
Institution, 1994-2006
Berkeley Miller, Ph.D.
Director of Academic Institutional Research
San Francisco State University
Sutee Sujitparapitaya, Ph.D.
Associate Vice President of Institutional Research
San Jose State University
7
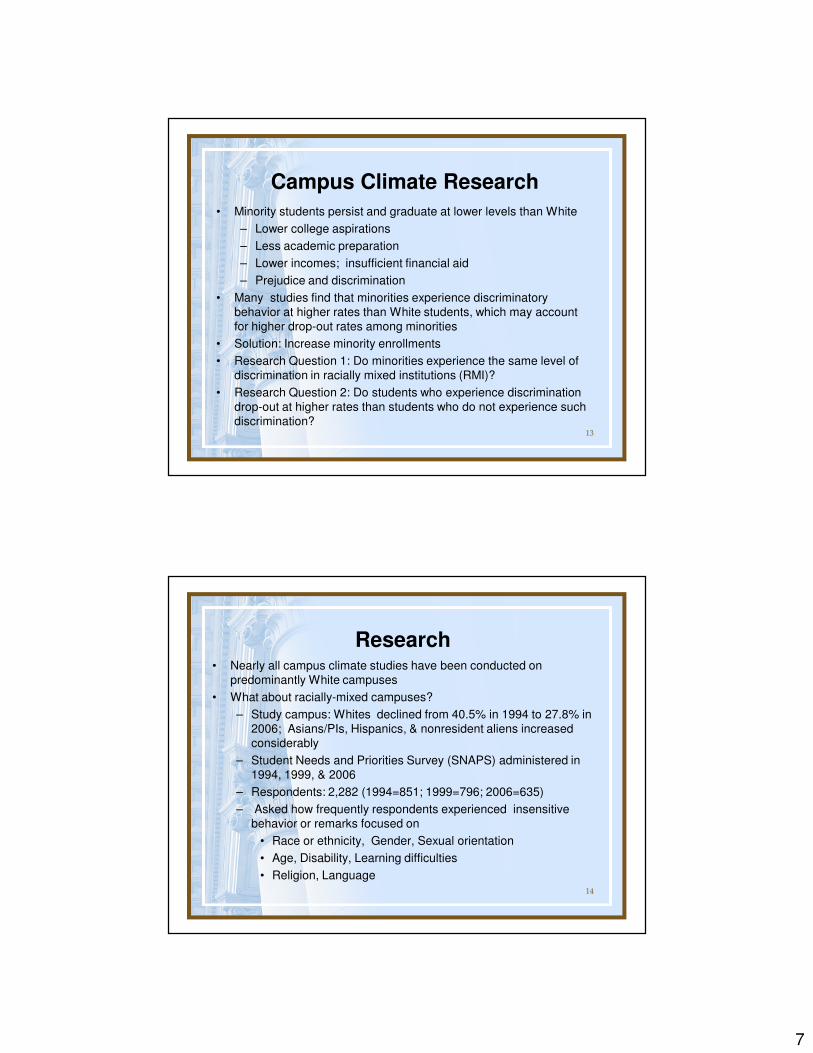
Campus Climate Research
• Minority students persist and graduate at lower levels than White
– Lower college aspirations
– Less academic preparation
– Lower incomes; insufficient financial aid
– Prejudice and discrimination
• Many studies find that minorities experience discriminatory behavior at higher rates than White students, which may account for higher drop-out rates among minorities
• Solution: Increase minority enrollments
• Research Question 1: Do minorities experience the same level of discrimination in racially mixed institutions (RMI)?
• Research Question 2: Do students who experience discrimination drop-out at higher rates than students who do not experience such discrimination?
13
Research• Nearly all campus climate studies have been conducted on
predominantly White campuses
• What about racially-mixed campuses?
– Study campus: Whites declined from 40.5% in 1994 to 27.8% in 2006; Asians/PIs, Hispanics, & nonresident aliens increased considerably
– Student Needs and Priorities Survey (SNAPS) administered in 1994, 1999, & 2006
– Respondents: 2,282 (1994=851; 1999=796; 2006=635)
– Asked how frequently respondents experienced insensitive behavior or remarks focused on
• Race or ethnicity, Gender, Sexual orientation
• Age, Disability, Learning difficulties
• Religion, Language14
8
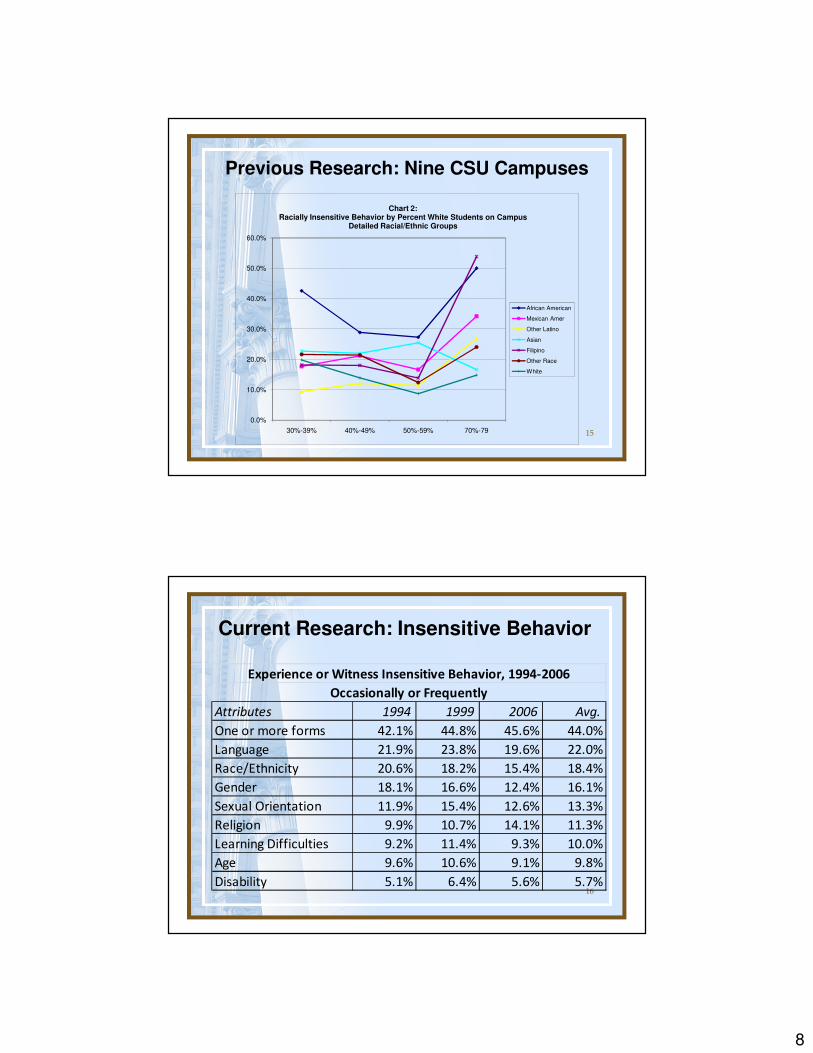
Previous Research: Nine CSU Campuses
15
0.0%
10.0%
20.0%
30.0%
40.0%
50.0%
60.0%
30%-39% 40%-49% 50%-59% 70%-79
Chart 2: Racially Insensitive Behavior by Percent White Students on Campus
Detailed Racial/Ethnic Groups
African American
Mexican Amer
Other Latino
Asian
Filipino
Other Race
White
Current Research: Insensitive Behavior
16
Attributes 1994 1999 2006 Avg.
One or more forms 42.1% 44.8% 45.6% 44.0%
Language 21.9% 23.8% 19.6% 22.0%
Race/Ethnicity 20.6% 18.2% 15.4% 18.4%
Gender 18.1% 16.6% 12.4% 16.1%
Sexual Orientation 11.9% 15.4% 12.6% 13.3%
Religion 9.9% 10.7% 14.1% 11.3%
Learning Difficulties 9.2% 11.4% 9.3% 10.0%
Age 9.6% 10.6% 9.1% 9.8%
Disability 5.1% 6.4% 5.6% 5.7%
Experience or Witness Insensitive Behavior, 1994-2006
Occasionally or Frequently
9
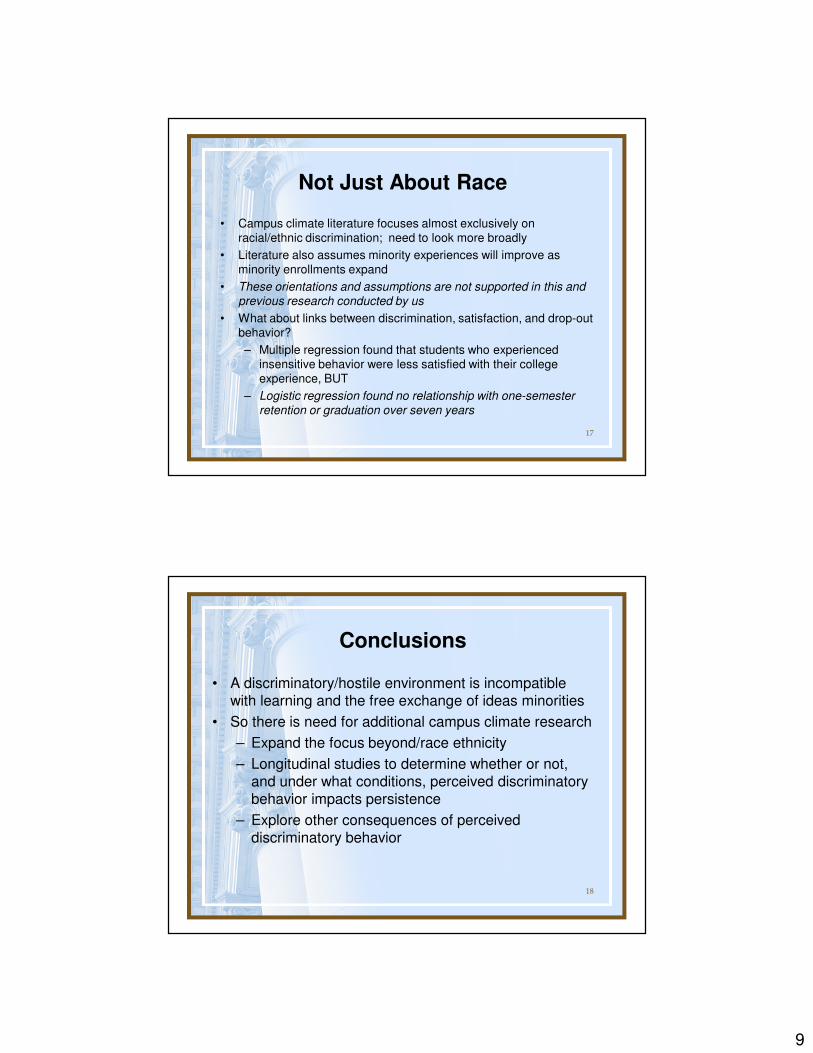
Not Just About Race
• Campus climate literature focuses almost exclusively on racial/ethnic discrimination; need to look more broadly
• Literature also assumes minority experiences will improve as minority enrollments expand
• These orientations and assumptions are not supported in this and
previous research conducted by us
• What about links between discrimination, satisfaction, and drop-out behavior?
– Multiple regression found that students who experienced insensitive behavior were less satisfied with their college experience, BUT
– Logistic regression found no relationship with one-semester
retention or graduation over seven years
17
Conclusions
• A discriminatory/hostile environment is incompatible with learning and the free exchange of ideas minorities
• So there is need for additional campus climate research
– Expand the focus beyond/race ethnicity
– Longitudinal studies to determine whether or not, and under what conditions, perceived discriminatory behavior impacts persistence
– Explore other consequences of perceived discriminatory behavior
18
10
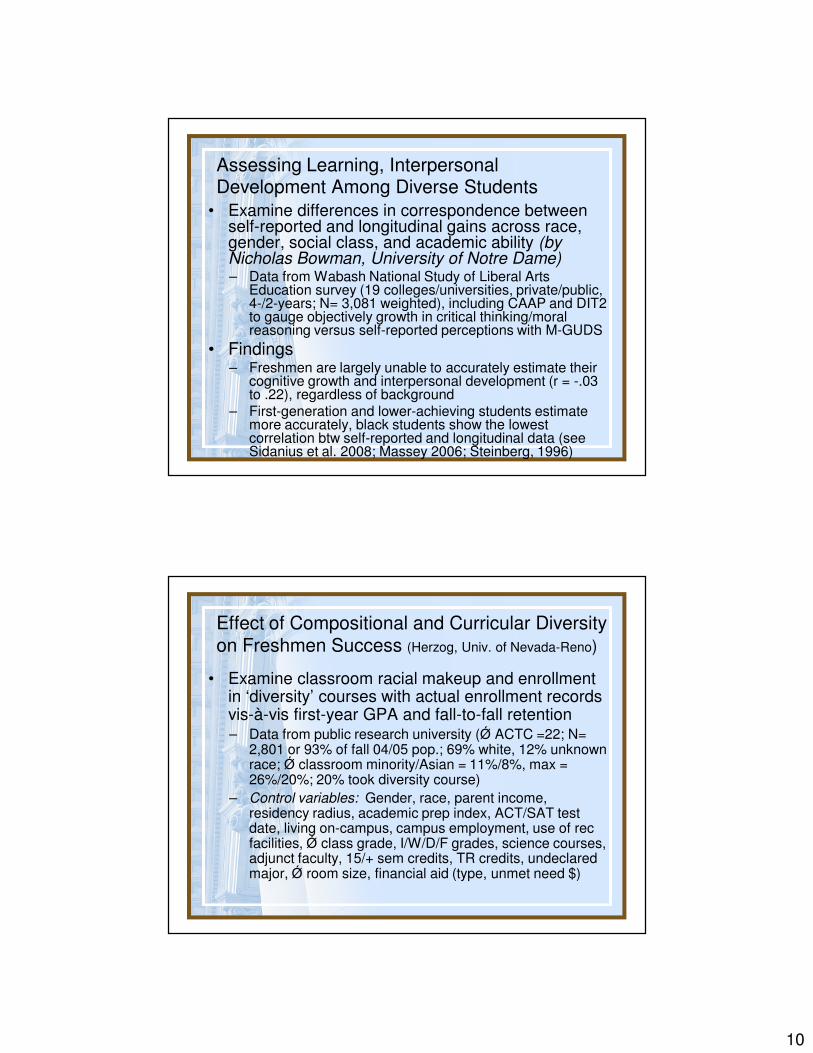
Assessing Learning, Interpersonal Development Among Diverse Students
• Examine differences in correspondence between self-reported and longitudinal gains across race, gender, social class, and academic ability (by Nicholas Bowman, University of Notre Dame)– Data from Wabash National Study of Liberal Arts
Education survey (19 colleges/universities, private/public, 4-/2-years; N= 3,081 weighted), including CAAP and DIT2 to gauge objectively growth in critical thinking/moral reasoning versus self-reported perceptions with M-GUDS
• Findings– Freshmen are largely unable to accurately estimate their
cognitive growth and interpersonal development (r = -.03 to .22), regardless of background
– First-generation and lower-achieving students estimate more accurately, black students show the lowest correlation btw self-reported and longitudinal data (see Sidanius et al. 2008; Massey 2006; Steinberg, 1996)
Effect of Compositional and Curricular Diversity on Freshmen Success (Herzog, Univ. of Nevada-Reno)
• Examine classroom racial makeup and enrollment in ‘diversity’ courses with actual enrollment records vis-à-vis first-year GPA and fall-to-fall retention– Data from public research university (Ǿ ACTC =22; N=
2,801 or 93% of fall 04/05 pop.; 69% white, 12% unknown race; Ǿ classroom minority/Asian = 11%/8%, max = 26%/20%; 20% took diversity course)
– Control variables: Gender, race, parent income, residency radius, academic prep index, ACT/SAT test date, living on-campus, campus employment, use of recfacilities, Ǿ class grade, I/W/D/F grades, science courses, adjunct faculty, 15/+ sem credits, TR credits, undeclared major, Ǿ room size, financial aid (type, unmet need $)
11
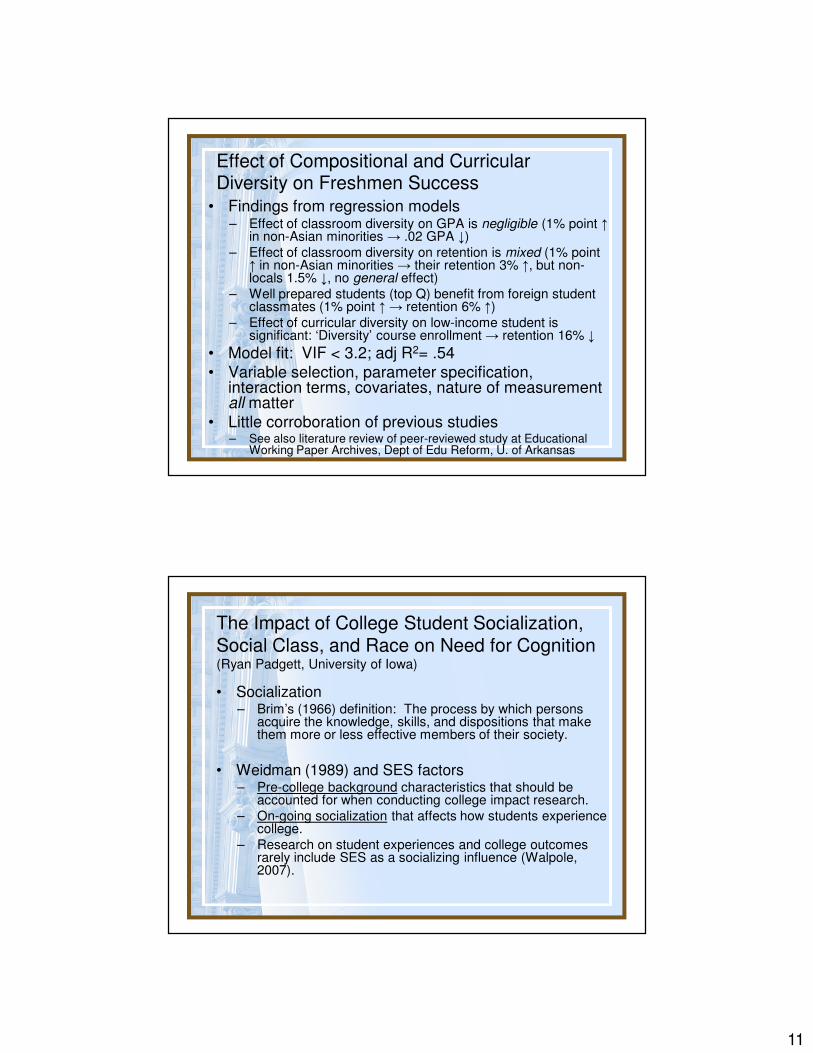
Effect of Compositional and Curricular Diversity on Freshmen Success
• Findings from regression models– Effect of classroom diversity on GPA is negligible (1% point ↑
in non-Asian minorities → .02 GPA ↓)– Effect of classroom diversity on retention is mixed (1% point
↑ in non-Asian minorities → their retention 3% ↑, but non-locals 1.5% ↓, no general effect)
– Well prepared students (top Q) benefit from foreign student classmates (1% point ↑ → retention 6% ↑)
– Effect of curricular diversity on low-income student is significant: ‘Diversity’ course enrollment → retention 16% ↓
• Model fit: VIF < 3.2; adj R2= .54• Variable selection, parameter specification,
interaction terms, covariates, nature of measurement all matter
• Little corroboration of previous studies– See also literature review of peer-reviewed study at Educational
Working Paper Archives, Dept of Edu Reform, U. of Arkansas
The Impact of College Student Socialization, Social Class, and Race on Need for Cognition(Ryan Padgett, University of Iowa)
• Socialization– Brim’s (1966) definition: The process by which persons
acquire the knowledge, skills, and dispositions that make them more or less effective members of their society.
• Weidman (1989) and SES factors– Pre-college background characteristics that should be
accounted for when conducting college impact research.– On-going socialization that affects how students experience
college.– Research on student experiences and college outcomes
rarely include SES as a socializing influence (Walpole, 2007).
12
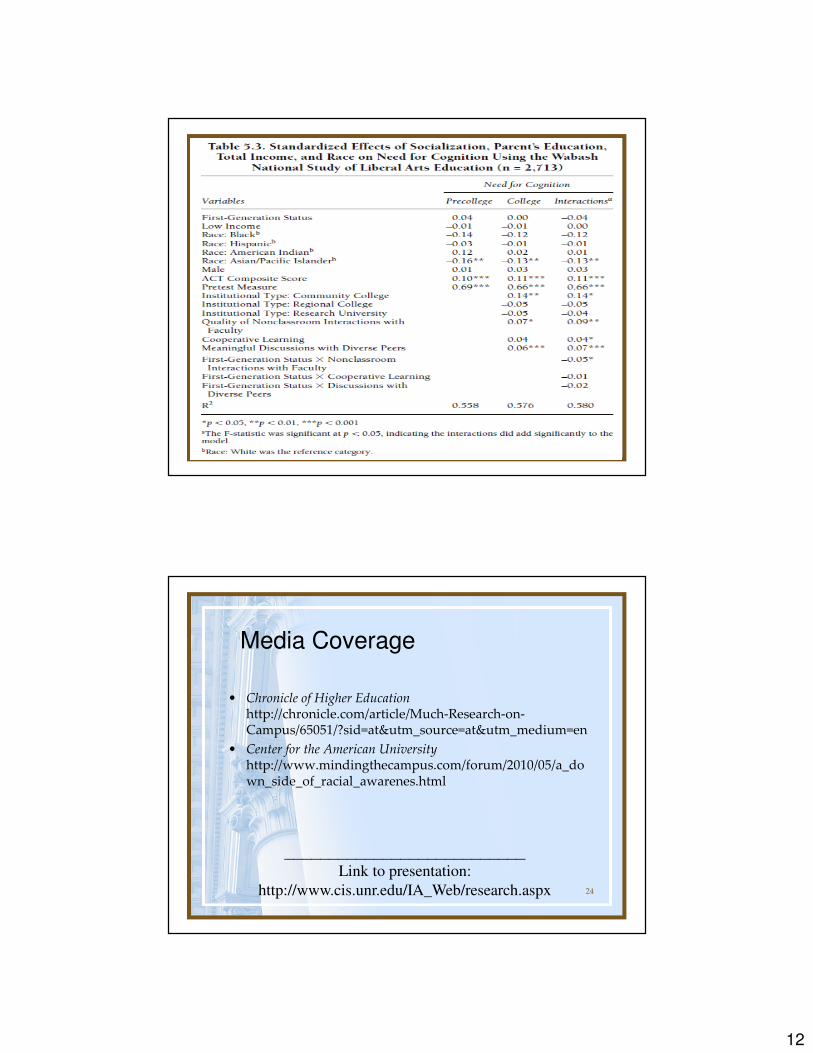
The Impact of College Student Socialization, Social Class, and Race on Need for Cognition
24
Media Coverage
• Chronicle of Higher Education http://chronicle.com/article/Much-Research-on-Campus/65051/?sid=at&utm_source=at&utm_medium=en
• Center for the American University http://www.mindingthecampus.com/forum/2010/05/a_down_side_of_racial_awarenes.html
___________________________Link to presentation:
http://www.cis.unr.edu/IA_Web/research.aspx