camilla thuge lund & søren raun, syncronic denmark · pdf filecamilla thuge lund...
TRANSCRIPT

S&OP IN
DENMARK
An investigation of the S&OP maturity level in Danish companies By Camilla Thuge Lund & Søren Raun, Syncronic May-August 2017
S&OP in DenmarkSurvey report Side 2 af 30
Content 1. Preface .............................................................................................................................................. 3
2. Executive summary ........................................................................................................................... 4
3. S&OP Assessment framework .......................................................................................................... 8
4. Method ............................................................................................................................................... 9
5. Introduction questions ..................................................................................................................... 10
5.1 Respondents divided by industry ............................................................................................ 10
5.2 Perception of S&OP as a competitive factor .......................................................................... 11
5.3 Share of companies working with S&OP ................................................................................ 12
7. People dimension ............................................................................................................................ 13
7.1 All industries ........................................................................................................................... 13
7.2 Industry specific ...................................................................................................................... 14
8. Process dimension .......................................................................................................................... 16
8.1 All industries ........................................................................................................................... 16
8.2 Industry specific ...................................................................................................................... 17
9. Structure dimension ........................................................................................................................ 19
9.1 All industries ........................................................................................................................... 19
9.2 Industry specific ...................................................................................................................... 20
10. Technology dimension ................................................................................................................ 23
10.1 All industries ........................................................................................................................... 23
10.2 Industry specific ...................................................................................................................... 24
11. Reflection questions ................................................................................................................... 26
11.1 Purpose and achieved advantages ........................................................................................ 26
11.2 Barriers to develop maturity .................................................................................................... 27
11.3 Expected S&OP investments 2017-2019 ............................................................................... 29
12. Disclaimer ................................................................................................................................... 30

S&OP in DenmarkSurvey report Side 3 af 30
1. Preface
Background
Most modern companies, introduce an integrated planning process across their global operations, with
the purpose of improving customer services, increasing plants efficiencies and reducing costs. This
process is often referred to as Sales & Operations Planning (S&OP). Sales & Operations Planning is a
companywide process, linking demand planning with supply planning, and ending up balancing and
decision making process.
Sales & Operations Planning (S&OP) is one of the key levers to growth. This is initially enabled via a
better synchronization of demand and supply. This will enable a company to link sales and supply chain,
and integrate the commercial strategy with month-by-month operations. The S&OP process is important
to any company, and supports a profitable future growth in an increasing competitive environment.
S&OP includes all business functions and levels of a company, and therefore is a stepwise process.
From first establishing it, to a world class process. Along the way, different benefits and barriers emerge,
all dependent on the level of maturity.
Purpose
The purpose of the S&OP survey has been, to investigate the current maturity level of S&OP practice
amongst Danish companies from at 360-degree perspective. Further, to seek insight on barriers to
mature, and to investigate the purpose of S&OP compared to the achieved benefits. Subsequently, to
compare findings with the results of an earlier S&OP survey carried out in 20131, and assess where
things have changed.
All this, to provide a research report that can serve as inspiration for the individual S&OP practitioner, as
to what benefits others achieve, and what barriers they experience, and finally give guidance on how to
overcome barriers.
Thank you
We would like to thank Dilf who has carried out the survey through their large network of S&OP
practitioners. Without your contribution, we would not have been able to receive as many respondents.
Further, we would like to thank our student assistant Christina Mansfeldt Rasmussen, that has helped
with the report.
Finally, we would like to thank all the persons that have spent time on answering the S&OP in Denmark
questionnaire, that provides the foundation for this report. We are grateful that you have prioritized your
scarce time, to give your perceptions of your companies’ stages within this topic. These perceptions
have made it possible for us, to conclude and guide which initiatives could be taken, to develop and
mature S&OP in Denmark further.
Any inquiries to this report can be directed to Camilla Thuge Lund at [email protected]
On behalf of the research team:
Camilla Thuge Lund, Partner Business Consulting at Syncronic
Søren Raun, Principal Consultant at Syncronic
1 Survey by the Dilf Supply Chain Panel October 2013.
S&OP in DenmarkSurvey report Side 4 af 30
2. Executive summary
The perception of S&OP as an important competitive factor, is unchanged at 83% from 20131 to 2017
indicating, that the concept ranks high amongst practitioners.
The share of companies working with S&OP has significantly increased from 56% in 20131 to 86% 2017
indicating, that significant development has happened over the last 4 years.
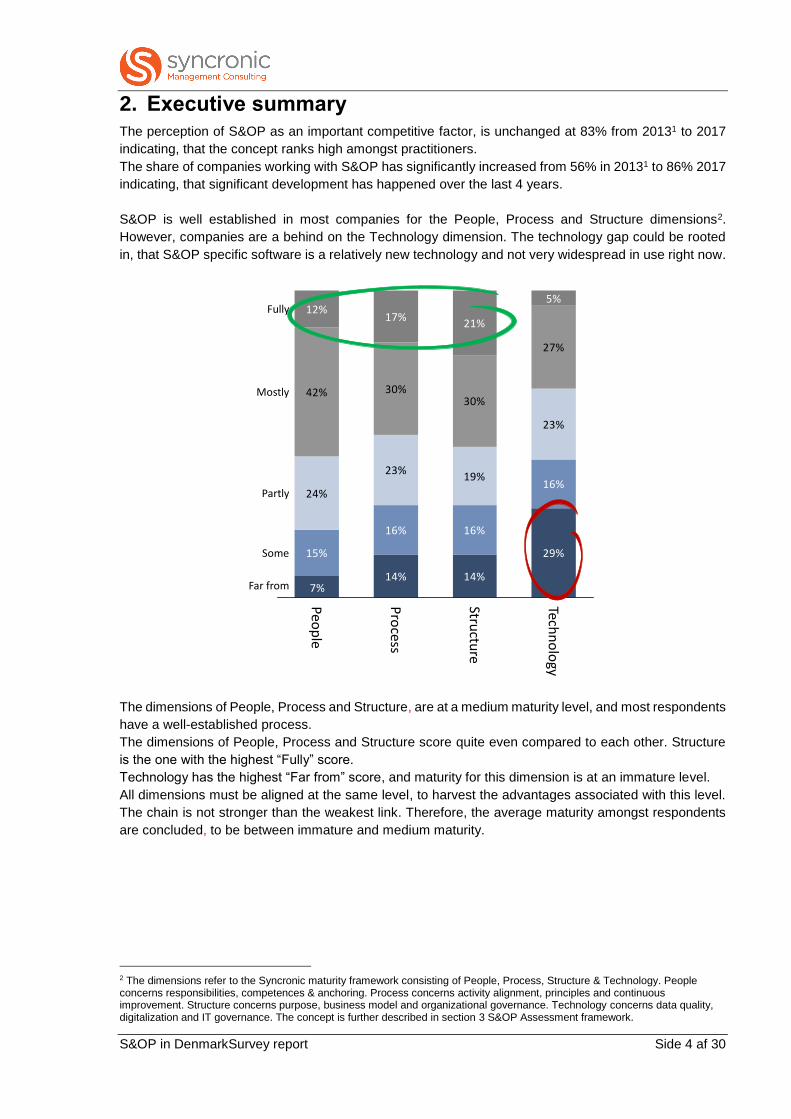
S&OP is well established in most companies for the People, Process and Structure dimensions2.
However, companies are a behind on the Technology dimension. The technology gap could be rooted
in, that S&OP specific software is a relatively new technology and not very widespread in use right now.
14% 14%
29%15%
16% 16%
16%24%
23%19%
23%
42% 30%30%
27%
12%17%
21%
5%
7%
Techn
olo
gy
Fully
Mostly
Far from
Partly
Some
Pro
cess
Peo
ple
Structu
re
The dimensions of People, Process and Structure, are at a medium maturity level, and most respondents
have a well-established process.
The dimensions of People, Process and Structure score quite even compared to each other. Structure
is the one with the highest “Fully” score.
Technology has the highest “Far from” score, and maturity for this dimension is at an immature level.
All dimensions must be aligned at the same level, to harvest the advantages associated with this level.
The chain is not stronger than the weakest link. Therefore, the average maturity amongst respondents
are concluded, to be between immature and medium maturity.
2 The dimensions refer to the Syncronic maturity framework consisting of People, Process, Structure & Technology. People concerns responsibilities, competences & anchoring. Process concerns activity alignment, principles and continuous improvement. Structure concerns purpose, business model and organizational governance. Technology concerns data quality, digitalization and IT governance. The concept is further described in section 3 S&OP Assessment framework.

S&OP in DenmarkSurvey report Side 5 af 30
16% 18% 18%
16%17% 18%
23% 18%23%
30% 33%29%
15% 14% 13%
Man
ufactu
ring
Far from
Partly
Some
Mostly
Fully
Foo
d &
be
verage
Ph
arma, h
ealthcare,
Ch
em
icals & b
iotech
There is not a clear leading industry when comparing overall maturity across dimensions. An initial
hypothesis was that Food and beverage would be leading, followed by Manufacturing and finally Pharma
etc. This hypothesis was built on that Food & beverage is the industry closest to consumers and their
demands. In our experience, new concepts seem to enter the industries closest to the consumer first,
and work its way backwards in the supply chain. In some of the detailed questions of the survey, there
is also evidence that this is true, but it is not possible to conclude on an overall level. That Pharma would
be lagging is built on, that this industry often operates with much higher product margin than the others,
therefore they usually do not have the same tight cost reduction focus need to survive. However, it is not
possible to draw any conclusion on an overall level.
For all industries, there is some companies that are quite mature and have fully adopted many of the
Best Practice principles, however there is also a large proportion that far from have adopted the
principles. Therefore, the overall conclusion is that Danish industries are quite even in maturity, however
within each industry the companies are at very different levels.
The intended purpose of S&OP points to purposes of improved capacity planning and integration, whilst
the realized advantages generally lack behind, particularly the reduction of inventories. In 2013, the
realized advantages mostly score higher than today, which could indicate that the “low hanging fruits”
are now harvested, and that the next level benefits are harder to realize.
The greatest barriers of developing S&OP are, the “Lack of leadership focus and anchoring”, and “High
degree of silo thinking” between functions. It indicates that; formulating a shared vision and calculating
and visualizing an appealing business case are difficult for most companies. Technology is also an
important barrier, which is in line with the finding of generally high immaturity in this dimension.
S&OP in DenmarkSurvey report Side 6 af 30
Regarding S&OP investments for the next 3 years: 86% of respondents expect to invest in S&OP non-
technology projects, and 79% of respondents expect to invest in S&OP technology to some, high or very
high degree. As the Technology is immature, and all dimensions should ideally be at the same level,
companies should consider to match investment plans with current maturity levels.
For the People dimension; most companies have implemented many of the principles. However, is it
notable that, having clear roles and responsibilities, remain an issue for many. Furthermore, the majority
lacks to include behavioral KPI’s.
For the Process dimension; most companies are distributing meeting minutes and decisions after the
meeting. A weakness for many is, the ability to incorporate the S&OP plan into the financial budget, and
to document the S&OP process.
For the Structure dimension; in many companies the CEO sponsors the S&OP process, Operations
owns the operations plan and Sales owns the forecast. But many lacks a clear S&OP vision, and they
lack Finance participation in the process.
For the Technology dimension; most companies have a decent quality of master and transactional data.
Whilst it is absent for most, to have software that support the critical activities of; scenario simulation,
unit conversion, dashboards and standard reports. It could be because S&OP specific software like JDA,
SAP IBP, Kinaxis and OM Partners are not yet widely in use.
Assessing correlations shows:
• That having clear roles and responsibilities leads to people following the process.
• That when the process is sponsored by the CEO, then roles and responsibilities are aligned with
the overall goals, and the S&OP process becomes the overall decision framework for the
company.
• That when the process is sponsored by the CEO, then the S&OP process focuses on the
medium to long term horizon.
• That when there is a high degree of silo thinking, then members of other departments, like
Finance and NPD, are excluded from the S&OP process.
What is positive?
It is positive that the companies working with S&OP have increased since 20131, and that the maturity
assessment shows that many companies by now, have a well-established process. This provides a good
platform, for developing further into the higher maturity levels of S&OP. As many companies are running
the process, it also becomes easier for companies to reach out across own borders, and engage in
extended S&OP collaborations with customers and suppliers. The language around S&OP becomes
more widely used, and skilled resources become easier for companies to attract.
What is a big challenge?
Lack of leadership focus and anchoring, and a high degree of silo thinking are the greatest barriers. It
corresponds well with the observation, that many are still struggling to get the basics right.
• Having a clear vision.
• Having clear roles and responsibilities that are aligned with organizational governance
and business plans.
• KPI’s are cascaded from strategy to executional level and aligned cross-functionally.
All these are fundamental to develop S&OP further.
S&OP in DenmarkSurvey report Side 7 af 30
Technology is another challenge. The S&OP process is complex as it needs to engage multiple
stakeholders and data sets, and to evaluate multiple scenarios from multiple perspectives fast to operate
efficiently. Software that can handle these requirements are now starting to appear, and hence poses,
an opportunity for companies to move to the next level.
What is important for the companies to do now?
The next step for most companies would be, to focus on closing the gap between current practice and
leading practice, and to address the top barriers, before trying to develop into the next level. The chain
is not stronger than the weakest link. All 4 dimensions needs to be at the same level to harvest the
benefits and develop to the next level. If the process has been in operation for several years it might
need to be reinforced and revitalized.
A first step could be a detailed maturity assessment where all weak spots are identified and addressed.
This should be followed up by a strategic development roadmap, and a solid business case and benefits
realization plan. This should be combined with an envisioning workshop with executive management, to
build a shared vision and secure anchoring at C-level.
A way to revitalize the process and overcome the barrier of silo thinking, could be to play the S&OP
game. This is a game, where participants debate common S&OP challenges from different functional
perspectives, make their decisions, and see the impact of these decisions on the overall company
performance.
We would advise to get the basics fixed and get overall maturity consolidated, before starting software
implementations. For technology, a starting point would be to carry out a detailed mapping of the
business requirements. This should be followed up by an assessment of different software options,
before making decisions and starting an actual implementation. However, it is crucial that companies
close the maturity gap between technology and the other dimensions.
S&OP in DenmarkSurvey report Side 8 af 30
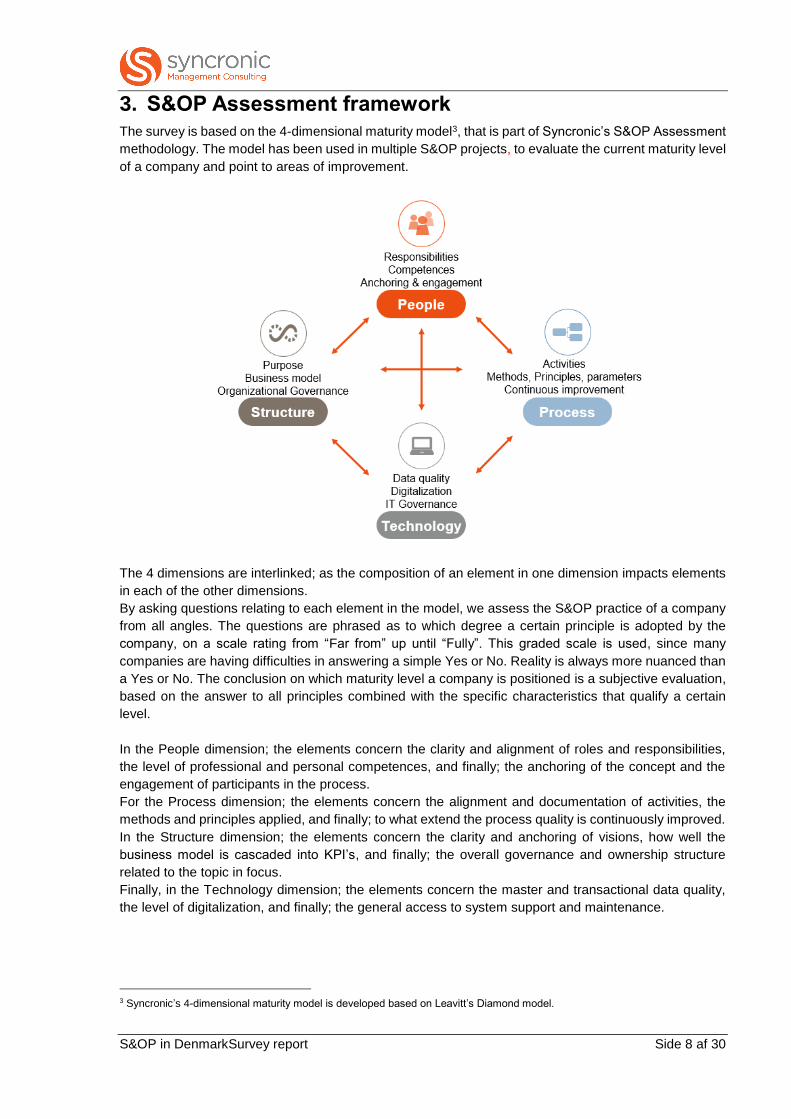
3. S&OP Assessment framework
The survey is based on the 4-dimensional maturity model3, that is part of Syncronic’s S&OP Assessment
methodology. The model has been used in multiple S&OP projects, to evaluate the current maturity level
of a company and point to areas of improvement.
The 4 dimensions are interlinked; as the composition of an element in one dimension impacts elements
in each of the other dimensions.
By asking questions relating to each element in the model, we assess the S&OP practice of a company
from all angles. The questions are phrased as to which degree a certain principle is adopted by the
company, on a scale rating from “Far from” up until “Fully”. This graded scale is used, since many
companies are having difficulties in answering a simple Yes or No. Reality is always more nuanced than
a Yes or No. The conclusion on which maturity level a company is positioned is a subjective evaluation,
based on the answer to all principles combined with the specific characteristics that qualify a certain
level.
In the People dimension; the elements concern the clarity and alignment of roles and responsibilities,
the level of professional and personal competences, and finally; the anchoring of the concept and the
engagement of participants in the process.
For the Process dimension; the elements concern the alignment and documentation of activities, the
methods and principles applied, and finally; to what extend the process quality is continuously improved.
In the Structure dimension; the elements concern the clarity and anchoring of visions, how well the
business model is cascaded into KPI’s, and finally; the overall governance and ownership structure
related to the topic in focus.
Finally, in the Technology dimension; the elements concern the master and transactional data quality,
the level of digitalization, and finally; the general access to system support and maintenance.
3 Syncronic’s 4-dimensional maturity model is developed based on Leavitt’s Diamond model.
S&OP in DenmarkSurvey report Side 9 af 30
4. Method
The survey questions are adopted from Syncronic’s 4-dimensional maturity model, and added with
introduction and reflection questions, to match the survey purpose, and to be able to compare with the
earlier survey.
The survey data collection has been conducted by Dilf, amongst selected Dilf members working within
the field of S&OP. Data collection took place via an online survey during May 10th and May 28th. The
survey was conducted anonymously.
In contrary to an assessment in a specific client project, where Syncronic completes the questionnaire,
this survey is completed by the respondents on their own. Therefore, there is a risk that respondents are
more optimistic, pessimistic or misunderstand the questions.
The survey was divided into 6 sections:
1. Introduction: Questions on which industry the respondent belongs to, and their perspective on
S&OP.
2. People: Respondents were asked to score to which degree a certain principle is adopted by their
company, on a scale from “Far from” up until “Fully”.
3. Process: Same as People.
4. Structure: Same as People.
5. Technology: Same as People.
6. Reflection: Questions on the realized advantages of S&OP and future investment plans.
After the survey closed, the response data were exported to Excel on which basis Syncronic has
conducted the detailed data analysis. The results of those findings led to conclusions that is presented
in this report. In almost every figure, red or green circles are drawn. The green ones are indicating a
positive tendency in relation to S&OP maturity, whereas the red ones are reflecting a less positive
tendency.
This report will be made public available on Dilf and Syncronic’s websites.

S&OP in DenmarkSurvey report Side 10 af 30
5. Introduction questions
86 respondents in total completed the questionnaire. 9 respondents have been excluded from the
analysis as they relate to industries not working with physical flow of goods, which is the focus of this
report. The excluded industries are the following: Branch organization, Consulting, University, Public,
Information, Security.
Furthermore, in this 2017 survey, only 66 were actively working with S&OP, and hence only these 66
have been analyzed in question 3-8, while the group of 77 has been included for analysis of questions
1-2, 9-10.
5.1 Respondents divided by industry
Question 1
What industry does your company belong to?
Answer
77 respondents that can be grouped into 3 main industry groups
• Manufacturing (27)
• Food & Beverage (18)
• Pharma, healthcare, chemicals & biotech (16)
• Other (16): Automotive, Construction, CPG, Energy, Oil & Gas, Telecom, Transport &
Warehouse, Wholesale, Wind
Conclusion
The biggest industry group are manufacturing with 27 respondents, while the other groups have 16-18
respondents.

S&OP in DenmarkSurvey report Side 11 af 30
5.2 Perception of S&OP as a competitive factor
Question 2
To what extend do you consider S&OP an important competitive factor?
6%
To a very high degree
34%34%
To a high degree
49%48%
To some degree
13%12%
To a very low degree
5%
2017
2013
Answer
83% of respondents consider S&OP as an important competitive factor, to a high or very high degree,
which is the same as in the 20131 survey.
Conclusion
The perception of S&OP as a competitive factor, has remained nearly constant in the survey from 20131
until today.

S&OP in DenmarkSurvey report Side 12 af 30
5.3 Share of companies working with S&OP
Question 3
Are your company working with S&OP?
44%
Yes
86%
56%
14%
No
2017
2013
Answer
86% of respondents are working with S&OP in 2017 whereas in 20131 the percentage was 56%.
Conclusion
The share of companies working with S&OP has increased significantly from 20131 to 2017.

S&OP in DenmarkSurvey report Side 13 af 30
7. People dimension
The respondents were asked 7 questions regarding principles in the People dimension. The principles
concerned clarity and alignment of roles and responsibilities, the level of professional and personal
competences, and finally; the anchoring of the concept and the engagement of participants in the
process.
The analysis first outlines the main findings across industries, and thereafter, looks deeper into the
industry specific findings.
7.1 All industries
Question 5
To which extend have you adopted the following principles in your company?
Answer
The principles with the highest adoption are:
• “Roles and responsibilities in the S&OP process are clear to all participants”, with a summarized
score of “Fully” and “Mostly” of 64%.
• “People participating in the S&OP process have the required interpersonal and social
competences…”, with a summarized score of “Fully” and “Mostly” of 61%.
The principles with the lowest adoption are:
• “Behavioral KPI’s are used to monitor and track…”, with a “Far from” score of 26%.

S&OP in DenmarkSurvey report Side 14 af 30
Conclusion
Having clear roles and responsibilities is a fundamental principle for all processes in any organization,
to pursue the company’s vision and goals in an effective manner. Nothing will get done properly if people
do not know what they are supposed to do. Therefore, it is positive to see that this principle is the highest
score for the people dimension. On the other hand, it is appalling that yet 36% have not fully adopted
this fundamental principle, and it is also surprising, considering the high percentage of respondents
perceiving S&OP as a competitive factor.
Personal competences are important due to the alignment, interaction and synchronization among
functions in the organization. As the process involves many people across many functions, having the
right social skills is what “glues” the process together, and hence is crucial for success. It is positive that
respondents consider their fellow participants to hold the adequate competences.
Behavioral KPI’s can be a major help in maturing the S&OP process, as it puts a spotlight on some of
the critical levers for a successful process. As Harvard Business Review phrased it in one of their blogs
“You Are What You Measure”4. Measuring participants turning up to meetings prepared, might not
directly deliver better service levels, however, together with other behavioral KPI’s, it is a pre-condition
for a well-functioning process. Measuring it and following up on performance for these KPI’s, will
influence the quality and efficiency of your S&OP process. Not many companies use it, based on the
survey. It could be, because behavioral KPI’s seam more fluffy than traditional KPI’s derived from ERP
systems. It might be difficult to convince “old school” executives, that measuring these will deliver value.
7.2 Industry specific
Question 5
To which extend have you adopted the following principles in your company?
Answer
The industry with the highest average “Fully” score across principles is the Pharma, healthcare etc.
Industry.
4 D. Ariely (2010), Column: You Are What You Measure, HBR June 2010 issue.

S&OP in DenmarkSurvey report Side 15 af 30
The industry with the highest average “Far from” score across principles is the Food & beverage industry.
In the Manufacturing industry, the principles with the highest adoption are:
• “People participating in the S&OP process have the required interpersonal and social
competences…”, with a summarized “Fully” and “Mostly” score of 62%.
• “People participating in the S&OP process have the required professional competences…”, with
a summarized “Fully” and “Mostly” score of 61%.
In the Manufacturing industry, the principle with the lowest adoption is:
• “Behavioral KPI’s are used to monitor and track adherence…”, with a “Far from” score of 19%
compared to average 26%.
In the Food & beverage industry, the principle with the highest adoption is:
• “Roles and responsibilities of the activities in the S&OP process is aligned with the overall
governance of the organization”, with a summarized “Fully” and “Mostly” score of 75%.
• “Roles and responsibilities in the activities of the S&OP process is aligned with the overall
governance of the organization”, with a summarized “Fully” and “Mostly” score of 69%.
In the Food & beverage industry, the principles with the lowest adoption are:
• “Behavioral KPI’s are used to monitor and track adherence…”, with a “Far from” score of 31%
compared to average 26%.
In the Pharma, healthcare etc. industry, the principles with the highest adoption are:
• “Participants follow and use the defined S&OP process”, with a summarized “Fully” and “Mostly”
score of 69%.
In the Pharma, healthcare etc. industry, the principle with the lowest adoption is:
• “Behavioral KPI’s are used to monito and track adherence…”, with a “Far from” score of 31%
compared to average 26%.
Conclusion
Many of the principles in the People dimension concern compliance matters. Companies within the
Pharma industry etc. have the highest “Fully” score compared to the other industries. This could be
explained by the fact that this industry is highly regulated by authorities, and therefore is used to
compliance as a discipline. Furthermore, the industry generally employs people with high education level,
that are likely capable of understanding and complying with rules.
In continuation to this, it is therefore not surprising that “Behavioral KPI’s” is the least adopted principle,
when participants prefer defined processes.
The Food & beverage industry represents a paradox in the responses. The industry has both the highest
combined “Fully” and “Mostly” score together with the highest “Far from” score for “Clear roles &
responsibilities”. This could indicate that there is large gap between the “best in class” and the less
performing companies using S&OP, which among other things could reveal a difference in the perceived
benefits of the S&OP process.
The Manufacturing industry seems to be in the middle between the two other industries, and does not
have the same clear outliers in any of the principles.

S&OP in DenmarkSurvey report Side 16 af 30
8. Process dimension
The respondents were asked 9 questions regarding principles in the Process dimension. The principles
concerned amongst others; alignment, documentation of activities, and methods applied.
The analysis first outlines the main findings across industries, and thereafter, looks deeper into the
industry specific findings.
8.1 All industries
Question 6
To which extend have you adopted the following principles in your company?
Answer
The principles with the highest adoption are:
• “Decisions made at the S&OP meeting is distributed after the meeting”, with a “Fully” score of
30%.
• “The executive S&OP meeting operates at an aggregated level and rarely focus on individual
SKU’s”, with a fully score of 27%.
The principles with the lowest adoption are:
• “The financial budget is updated with the agreed dollarized S&OP plan after the executive S&OP
meeting”, with a “Far from” score of 29%.
• “A written S&OP handbook or policy details the process, participants, responsibilities, timing and
objectives of each step in the process”, which “Far from” score of 23%.
• “The S&OP process includes an activity engaging all stakeholders, in reviewing the quality and
effectiveness of the process”, with a “Fully” score of 2%.
Conclusion
Distributing the decisions after the S&OP meeting, is essential to have an efficient process, and hence
this is a positive result. However, this is also an “easy” principle to adopt compared to some of the other
principles.

S&OP in DenmarkSurvey report Side 17 af 30
It is more notable that such a high percentage have fully adopted to operate on an aggregated level. Our
experience tells us that it can be a challenge not to discuss individual SKU’s at the S&OP meetings.
Majority of companies seams to struggle to update the financial budget with the S&OP result. This could
potentially lead to misalignment between the budget and actuals, and large positive or negative surprises
in the financial results and cashflow. For listed companies, where there is an obligation to inform the
market about significant deviations of budgets this is a serious problem. Furthermore, this misalignment,
with the lack of ongoing alignment, can bring operations out of sync with strategy. All in all, this principle
is crucial for any company’s ability to pursue its vision and targets in an efficient manner.
Having a S&OP Handbook that details out who does what, when, and reviewing the process quality
ongoingly, is a cornerstone since the S&OP process involves so many different functions. It is therefore
a shame that many companies have not adopted this principle. This could be the underlying reason, why
many companies still have unclear roles and responsibilities for S&OP as found in the earlier dimension.
8.2 Industry specific
Question 6
To which extend have you adopted the following principles in your company?
Answer
The industry with the highest average “Fully” score across principles, is the Food & beverage industry at
19%.
The industry with the highest average “Far from” score across principles, is also the Food & beverage
industry at 18%.
In the Manufacturing industry, the principles with the highest adoption are:
• “Decisions made at the S&OP meeting is distributed after the meeting”, with a summarized
“Fully” and “Mostly” score of 81%.
• “The executive S&OP meeting operates at an aggregated level and rarely focus on individual
SKU’s”, with a summarized “Fully” and “Mostly” score of 69%.
In the Manufacturing industry, the principle with the lowest adoption is:

S&OP in DenmarkSurvey report Side 18 af 30
• “The financial budget is updated with the agreed dollarized S&OP plan after the executive S&OP
meeting”, with a “Far from” score of 38% compared to average 29%.
• “The executive S&OP meeting includes a review of business performance…”, with a “Far from”
score of 31% compared to average 18%.
In the Food & beverage industry, the principle with the highest adoption is:
• “Process activities are aligned with other processes, regarding timing, frequency and horizons”,
with a summarized “Fully” and “Mostly” score of 63%.
In the Food & beverage industry, the principles with the lowest adoption are:
• “A written S&OP handbook or policy details the process, participants, responsibilities, timing and
objectives of each step in the process”, with a “Far from” score of 38% compared to average
23%.
• “The financial budget is updated with the agreed dollarized S&OP plan after the executive S&OP
meeting”, with a “Far from” score of 31% compared to average 29%.
In the Pharma, healthcare etc. industry, the principles with the highest adoption are:
• “Decisions made at the S&OP meeting is distributed after the meeting”, with a summarized
“Fully” and “Mostly” score of 69%.
• “New product introductions and retirements are included in the S&OP process”, with a
summarized “Fully” and “Mostly” score of 69%.
In the Pharma, healthcare etc. industry, the principle with the lowest adoption is:
• “The S&OP process includes an activity engaging all stakeholders in reviewing the quality and
effectiveness in the process”, with a “Far from” score of 31% compared to average 18%.
Conclusion
Food & beverage having the highest average of “Fully” score can be explained since the companies are
closer to the end consumer than the other industries. Hence, the industry face the demanding
requirements passed on from consumers through retailers. Since the industry also has the highest score
of “Far from”, it could indicate that the industry is quite differentiated in maturity.
It is worth noticing that the lack of documentation and budget integration, that were identified as a trend
for all industries is also obvious in this industry.
It is a paradox that despite low adoption of a S&OP Handbook, the industry has a high adoption in
process alignment. Again, this could be explained by industry sales through retailer often are driven by
campaigns, which has forced sales and supply chain to collaborate closely and aligning their activities
to meet customer demands. Therefore, the need for establishing formal documentation is taken over by
the need to simply operate in an aligned manner.
In the Manufacturing industry, most companies have adopted the principle of distributing meeting
minutes, which could indicate a higher level of discipline in the process. The industry also seems to be
good, at working at an aggregated level. It could be because their product structures and way of selling,
is different from the two other industries.
In the Pharma, healthcare etc. industry, the strength seems to be the distribution of meeting minutes,
and the inclusion of NPD’s. The latter is undoubtedly since this industry has, a very long product
development horizon, and that it takes years to build up and get new production facilities quality
approved. In the other end, when patents run out and products are delisted, this is closely planned as it
has significant impact on CAPEX, and the ability to meet customer demands. Like the other industries,
Pharma, healthcare etc. also struggles to get the S&OP plan updated into their budgets.
S&OP in DenmarkSurvey report Side 19 af 30
9. Structure dimension
The respondents were asked 7 questions regarding principles in the Structure dimension. The principles
concerned amongst others clarity and anchoring of visions, how well the business model is cascaded
into KPI’s, and finally; the overall governance and ownership structure related to the topic in focus.
The analysis first outlines the main findings across industries, and thereafter, looks deeper into the
industry specific findings.
9.1 All industries
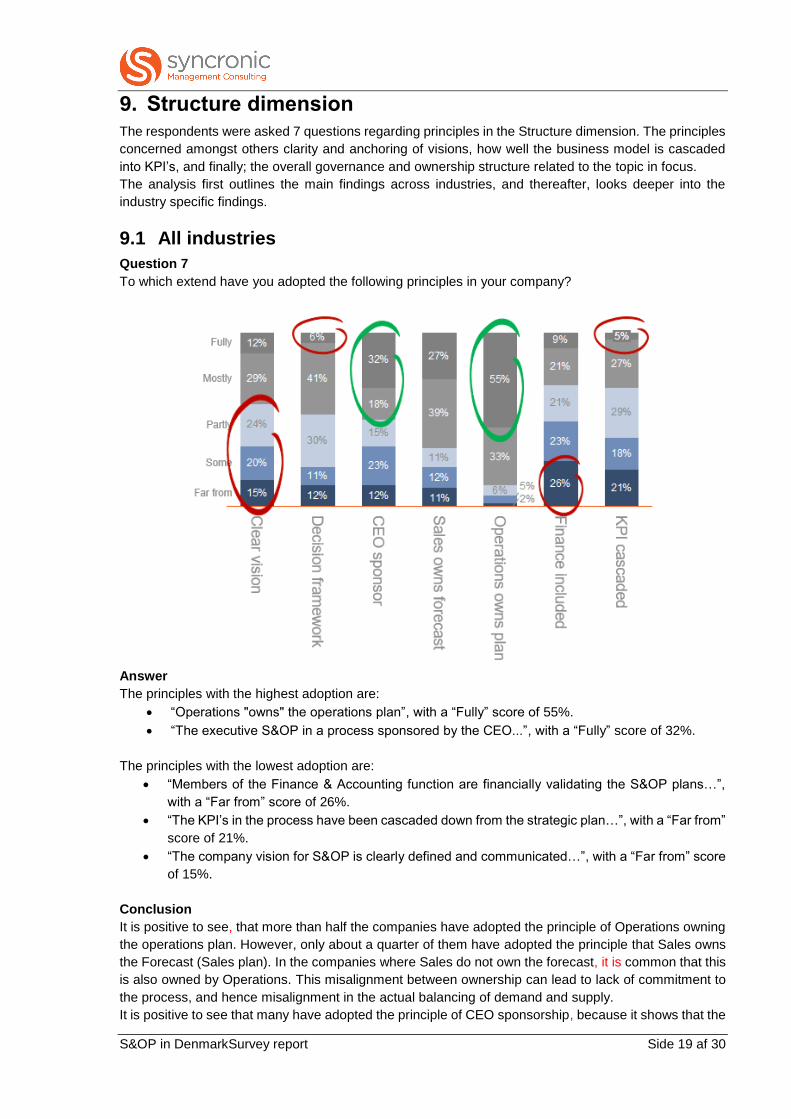
Question 7
To which extend have you adopted the following principles in your company?
Answer
The principles with the highest adoption are:
• “Operations "owns" the operations plan”, with a “Fully” score of 55%.
• “The executive S&OP in a process sponsored by the CEO...”, with a “Fully” score of 32%.
The principles with the lowest adoption are:
• “Members of the Finance & Accounting function are financially validating the S&OP plans…”,
with a “Far from” score of 26%.
• “The KPI’s in the process have been cascaded down from the strategic plan…”, with a “Far from”
score of 21%.
• “The company vision for S&OP is clearly defined and communicated…”, with a “Far from” score
of 15%.
Conclusion
It is positive to see, that more than half the companies have adopted the principle of Operations owning
the operations plan. However, only about a quarter of them have adopted the principle that Sales owns
the Forecast (Sales plan). In the companies where Sales do not own the forecast, it is common that this
is also owned by Operations. This misalignment between ownership can lead to lack of commitment to
the process, and hence misalignment in the actual balancing of demand and supply.
It is positive to see that many have adopted the principle of CEO sponsorship, because it shows that the
S&OP in DenmarkSurvey report Side 20 af 30
strategic importance of the process is recognized and supported. However, on the other hand it is a
shame that many then have not fully adopted this critical principle.
Having a clear vision seems to be an achilleas heel for many, the adoption is much lower than for CEO
sponsorship. One should think that with the CEO governing the process, the target and vision is clarified
and communicated. Maybe the opposite happens because the knowledge is kept inside the S&OP
meeting, where participants feel informed, hence communication suffers. Similar with the poor adoption
of the principle regarding KPI’s. When a company lacks both clear vision and structured break down of
strategy into KPI’s, it often leads to many inefficiencies and poor performance in the company. Simply
because employees lack insight in where they are aiming, and just steer by their personal KPI’s that are
not aligned strategically. It leads to sub-optimization and silo thinking.
Lastly, the analysis of the Process dimension revealed that, only a very little percentage of the companies
update their financial budget and business plan after a S&OP meeting. It is therefore not surprising that
finance members only to a small degree, are included in the S&OP process. Only in few of the
companies, does Finance and Accounting validate the S&OP plans, as a part of the S&OP process. By
not including the relevant functions in the S&OP, it might be harder for the companies, to fully take
advantage of S&OP.
9.2 Industry specific
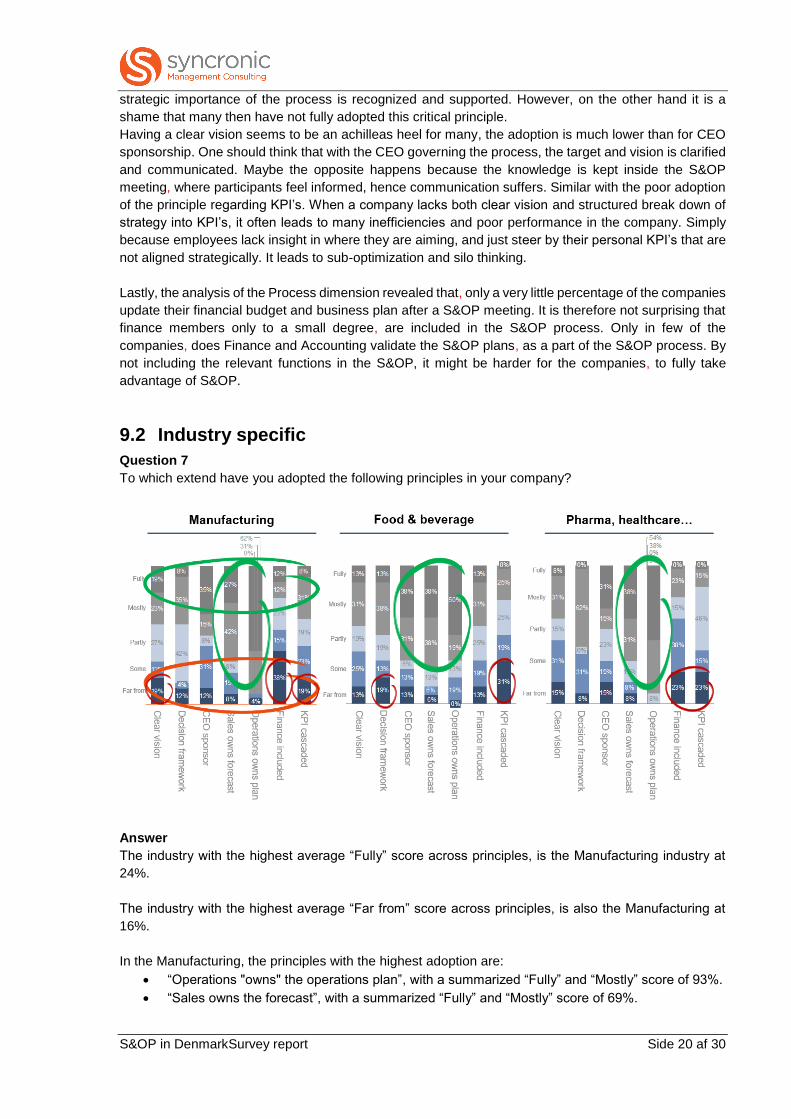
Question 7
To which extend have you adopted the following principles in your company?
Answer
The industry with the highest average “Fully” score across principles, is the Manufacturing industry at
24%.
The industry with the highest average “Far from” score across principles, is also the Manufacturing at
16%.
In the Manufacturing, the principles with the highest adoption are:
• “Operations "owns" the operations plan”, with a summarized “Fully” and “Mostly” score of 93%.
• “Sales owns the forecast”, with a summarized “Fully” and “Mostly” score of 69%.
S&OP in DenmarkSurvey report Side 21 af 30
In the Manufacturing industry, the principle with the lowest adoption is:
• “Members of the Finance & Accounting function are financially validating the S&OP plans…”,
with a “Far from” score of 38%, compared to average of 26%.
• “The KPI’s in the process have been cascaded down from the strategic plan…”, with a “Far from”
score of 31%, compared to an average of 21%.
• “The company vision for S&OP is clearly defined and communicated…”, with a “Far from” score
of 19%, compared to an average of 15%.
In the Food & beverage industry, the principles with the highest adoption are:
• “Sales owns the forecast”, with a summarized “Fully” and “Mostly” score of 76%.
• “Operations owns the operation plan”, with a summarized “Fully” and “Mostly” score of 69%.
• “The executive S&OP in a process sponsored by the CEO...”, with a summarized “Fully” and
“Mostly” score of 69%.
In the Food & beverage industry, the principles with the lowest adoption are:
• “The KPI’s in the process have been cascaded down from the strategic plan…”, with a “Far from”
score of 19%, compared to an average of 21%.
• “The executive S&OP is the framework for decision making for all major demand/supply issues”,
with a “Far from” score of 19% compared to an average of 12%.
In the Pharma, healthcare etc. industry, the principles with the highest adoption are:
• “Operations owns the operation plan”, with a summarized “Fully” and “Mostly” score of 92%.
• “Sales owns the forecast”, with a summarized “Fully” and “Mostly” score of 69%.
In the Pharma, healthcare etc. industry, the principle with the lowest adoption is:
• “The KPI’s in the process have been cascaded down from the strategic plan…”, with a “Far from”
score of 23%, compared to an average of 21%.
• “Members of the Finance & Accounting function are financially validating the S&OP plans…”,
with a “Far from” score of 23%, compared to average of 26%.
Conclusion
The Manufacturing industry has the highest average “Fully” score amongst the industries. This could be
explained since this industry employs many engineers, that through their education are used to think in
structures and hence easily adopt and comply with these principles.
Manufacturing is also the industry with the highest average “Far from” scores, therefore the industry is
differentiated in maturity. It is surprising that cascading KPI’s has low adoption, and much lower than
average.
The overriding strengths in the industry seems to be, the principles of Operations ownership, and that
the process is sponsored by the CEO. Remarkable, is the exclusion of finance from the S&OP process,
which is high and above average.
In the Food & beverage industry, the strengths seem to be Sales owning the forecast, Operations owns
the operations plan, and the CEO sponsoring the process. New market demand, and company
responses and techniques often hit this industry before the others. Therefore, it is not surprising that this
industry has a higher adoption of the Sales ownership and CEO sponsorship than the other industries.
The weaknesses seem to be cascading KPI’s and using S&OP as the decision framework. It corresponds
well with our experience that this industry tends to focus less on formal rules. The supply chain is often
running at a higher speed and is more dynamic, as it deals with consumer demands. Sometimes
important decisions must be taken right away to meet customer demands, and hence these decisions
are taken outside the formal process. But instead of bypassing the process it is advisable to improve the
efficiency and quality of the process, to act more agile and flexible and hence be capable of handling
S&OP in DenmarkSurvey report Side 22 af 30
dynamic demand and supply issues. Referring to the Process dimension, the Food & beverage industry
also has lower adoption of principles, for review and continuous improvement of the S&OP process.
In the Pharma, healthcare, chemicals & biotech industry the strengths yet again seem to be, the
principles of Sales owning the forecast, and Operations owning the operations plan. The weaknesses
are related to the inclusion of Finance and cascading KPI’s.
S&OP in DenmarkSurvey report Side 23 af 30
10. Technology dimension
The respondents were asked 8 questions regarding principles in the Technology dimension. The
principles concerned amongst others master and transactional data quality, the level of digitalization,
supporting features, and finally; the general access to system support and maintenance.
The analysis first outlines the main findings across industries, and thereafter, looks deeper into the
industry specific findings.
10.1 All industries
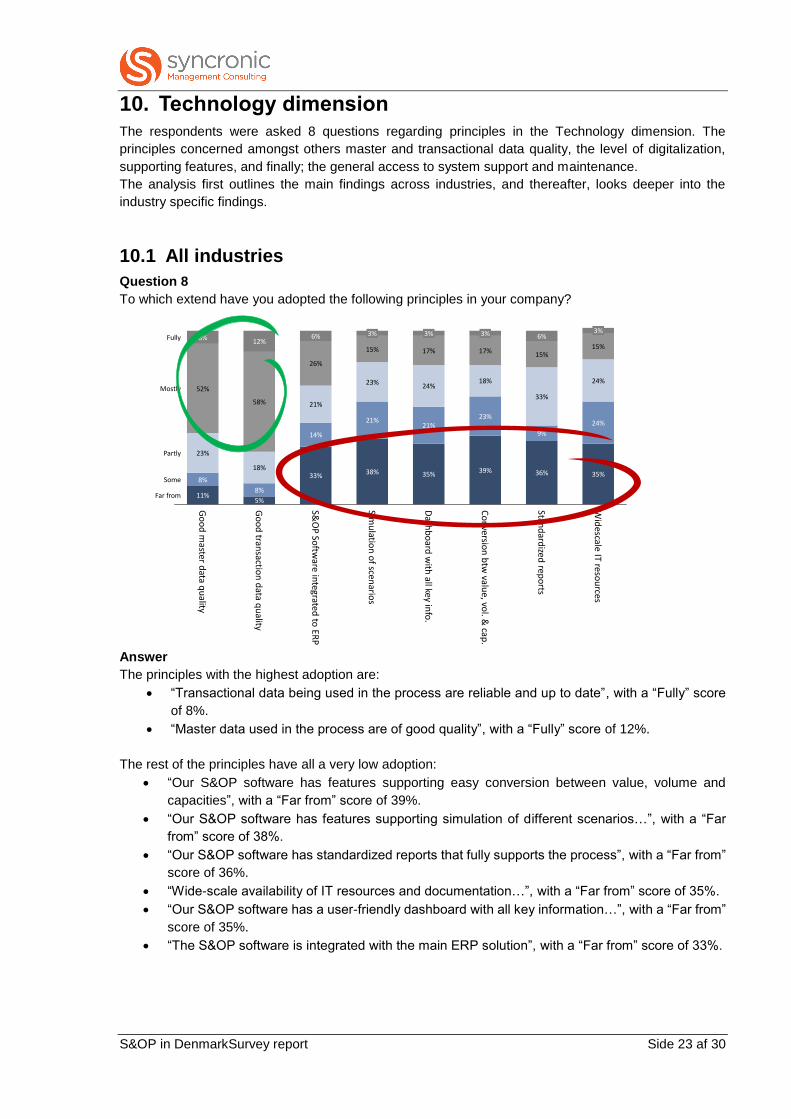
Question 8
To which extend have you adopted the following principles in your company?
11%5%
33% 38% 35%39% 36% 35%
8%
8%
14%
21%21%
23%
9%
24%
23%
18%
21%
23%24%
18%
33%
24%52%
58%
26%
15% 17% 17%15%
15%8%
12%6% 6%
Go
od
transactio
n d
ata qu
ality
Go
od
master d
ata qu
ality
Far from
Some
Partly
Mostly
Fully
Wid
escale IT resou
rces
3%
Stand
ardized
repo
rts
Co
nversio
n b
tw valu
e, vol. &
cap.
3%
Dash
bo
ard w
ith all key in
fo.
3%
Simu
lation
of scen
arios
3%
S&O
P So
ftware in
tegrated to
ERP
Answer
The principles with the highest adoption are:
• “Transactional data being used in the process are reliable and up to date”, with a “Fully” score
of 8%.
• “Master data used in the process are of good quality”, with a “Fully” score of 12%.
The rest of the principles have all a very low adoption:
• “Our S&OP software has features supporting easy conversion between value, volume and
capacities”, with a “Far from” score of 39%.
• “Our S&OP software has features supporting simulation of different scenarios…”, with a “Far
from” score of 38%.
• “Our S&OP software has standardized reports that fully supports the process”, with a “Far from”
score of 36%.
• “Wide-scale availability of IT resources and documentation…”, with a “Far from” score of 35%.
• “Our S&OP software has a user-friendly dashboard with all key information…”, with a “Far from”
score of 35%.
• “The S&OP software is integrated with the main ERP solution”, with a “Far from” score of 33%.
S&OP in DenmarkSurvey report Side 24 af 30
Conclusion
It is positive to see, more than 50% of the companies have reasonable good quality of master and
transaction data, since this is an obvious foundation for reliable planning and decision making.
The rest of the principles score very low indicating that most companies do not have software in place,
that supports the activities in the S&OP process. Whilst S&OP software for some time has been on the
market in the US, many of them have only recently gained ground in Europe.
Some of the software currently available are; JDA, SAP IBP, Kinaxis and OM Partners. Many large
company are running SAP as their ERP platform, and it is only a few years ago that SAP launched their
S&OP specific software (IBP).
Since most companies perceive S&OP, an important competitive factor, we expect that many of the
companies will invest in S&OP specific software in the future.
10.2 Industry specific
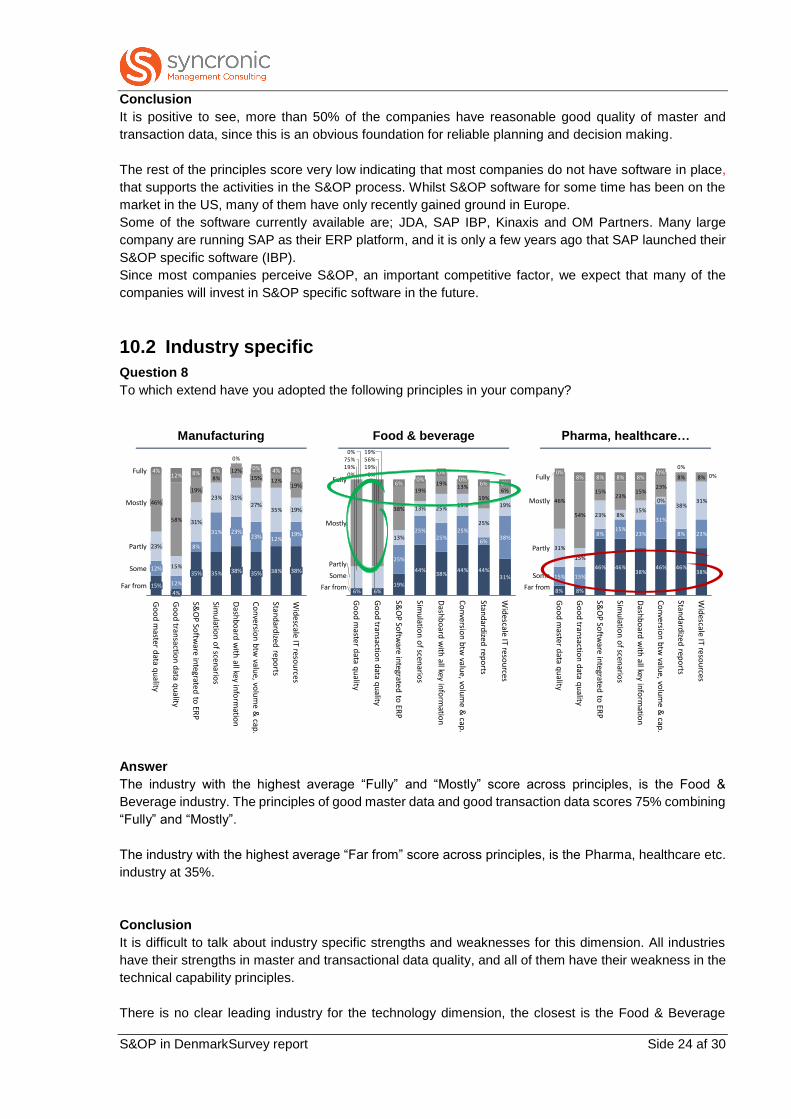
Question 8
To which extend have you adopted the following principles in your company?
Manufacturing Food & beverage Pharma, healthcare…
35% 38%
12%
8%
31%12%
15%
23%
35%
58%
8% 12%
0%
8%12%
Far from
Some
Partly
Mostly
Fully
Wid
escale IT resou
rces
38%
19%
19%
19%
4%
Stand
ardized
repo
rts
4%
Co
nversion
btw
value, vo
lum
e & cap
.
35%
23%
27%
15%
0%
Dash
bo
ard w
ith all key in
form
ation
38%
23%
31%
12%
Simu
lation
of scen
arios
4%
S&O
P So
ftware integrate
d to
ERP
35%
31%
19%
Go
od
transactio
n d
ata qu
ality
4%
Go
od
master d
ata qu
ality
15%
12%
23%
46%
4%
19%
44%38%
44% 44%31%
25%
25%25%
25%
6%38%13%
13% 25%19%
25%
19%38%
19%19%
13%
19%6%
6% 6% 6%
6%6%
0%0%19%19%56%75%19%0%
Far from
Some
Partly
Mostly
Fully
Wid
escale IT resou
rces
Stand
ardized
repo
rts
Co
nversion
btw
value, vo
lum
e & cap
.
0%
Dash
bo
ard w
ith all key in
form
ation
0%
Simu
lation
of scen
arios
0%
S&O
P So
ftware integrate
d to
ERP
Go
od
transactio
n d
ata qu
ality
Go
od
master d
ata qu
ality
46% 46%38%
46% 46%38%
15% 15%
8%15%
23%
31%
8% 23%
31%
15%
23% 8%15%
38%31%46%
54%
15%23%
15%23%
8% 8%8% 8% 8% 8%
8%8%
0%
0%
Some
Fully
Mostly
Partly
S&O
P So
ftware integrate
d to
ERP
Go
od
transactio
n d
ata qu
ality
Go
od
master d
ata qu
ality
0%
Wid
escale IT resou
rces
Far from
Stand
ardized
repo
rts
Co
nversion
btw
value, vo
lum
e & cap
.
0%
0%
Dash
bo
ard w
ith all key in
form
ation
Simu
lation
of scen
arios
Answer
The industry with the highest average “Fully” and “Mostly” score across principles, is the Food &
Beverage industry. The principles of good master data and good transaction data scores 75% combining
“Fully” and “Mostly”.
The industry with the highest average “Far from” score across principles, is the Pharma, healthcare etc.
industry at 35%.
Conclusion
It is difficult to talk about industry specific strengths and weaknesses for this dimension. All industries
have their strengths in master and transactional data quality, and all of them have their weakness in the
technical capability principles.
There is no clear leading industry for the technology dimension, the closest is the Food & Beverage
S&OP in DenmarkSurvey report Side 25 af 30
industry, that scores higher than the others on master and transactional data quality. An explanation
could be, as mentioned earlier, that this industry generally is further ahead in maturity due to being close
to demanding consumers.
In the other end, the Pharma industry seems to be a bit behind. We often see that the Pharma industry
are slower in adopting new concepts and technologies, simply because they usually pull higher margins,
and has less cost and efficiency focus.
It is worth noting that all industries score low on the principle “Wide-scale availability of IT resources and
documentation exist to manage and support your S&OP application”. Without access to support, that
can help finetune any given technical S&OP solution, the solution itself will not bring the intended value.

S&OP in DenmarkSurvey report Side 26 af 30
11. Reflection questions
The last part of the survey was focusing on the realized advantages of S&OP, barriers to develop maturity
and future investment plans. These questions were used to compare the result of the survey from 20131.
11.1 Purpose and achieved advantages
Question 4
What has been the purpose of implementing S&OP (mark all relevant options)?
Question 9
What advantages has your company achieved by implementing S&OP (mark all relevant options)?
Answer
The primary purposes of implementing S&OP are:
• “Improved capacity planning” at 88%.
• ” Improved integration between business functions” at 85%.
• “Improved transparency of plans” at 68%.
• “Reduction of inventories” at 68%.
Areas where the purpose has been achieved:
• “Improved transparency of plan”, where 68% had this as a purpose, but 77% has achieved
advantages.
Greatest gap between purpose and realized advantages:
• “Reduction of inventories” with a gap of 21%.
Comparing 20131 to 2017:
• The rank for purpose and achieved advantages has not changed significantly.
• For 8 out of 12 drivers, the achieved advantages score higher in 20131.
S&OP in DenmarkSurvey report Side 27 af 30
Conclusion
The main purposes of S&OP relate to; improved planning, integration and transparency, whereas only
reduction of inventories points in the direction of tangible benefits.
Only for transparency the purpose has been achieved, and hence it can be concluded, that benefits of
S&OP can be difficult to realize, and/or that it takes longer to realize them than, estimated in the original
business cases. Namely, the reduction of inventories has not materialized because of S&OP. Either the
business case has been too ambitious, or the benefits realization plan has not been solid enough.
It seems to be the same drivers that were in focus in 2013 as today. However, the achieved advantages
were higher in 20131 than 2017. This indicates that all low hanging fruits were harvested in 20131. By
now, companies are a bit higher on the maturity ladder, and therefore the advantages are harder to
realize.
11.2 Barriers to develop maturity
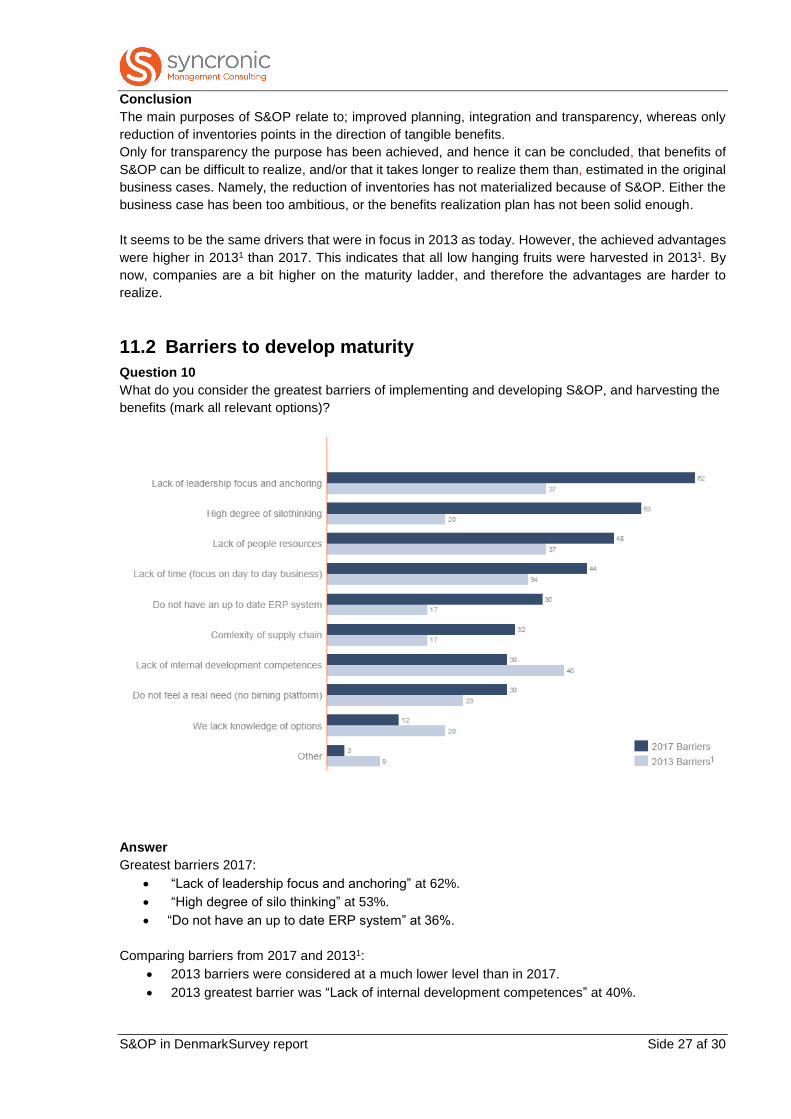
Question 10
What do you consider the greatest barriers of implementing and developing S&OP, and harvesting the
benefits (mark all relevant options)?
Answer
Greatest barriers 2017:
• “Lack of leadership focus and anchoring” at 62%.
• “High degree of silo thinking” at 53%.
• “Do not have an up to date ERP system” at 36%.
Comparing barriers from 2017 and 20131:
• 2013 barriers were considered at a much lower level than in 2017.
• 2013 greatest barrier was “Lack of internal development competences” at 40%.

S&OP in DenmarkSurvey report Side 28 af 30
Conclusion
“Lack of leadership focus and anchoring” is identified as the primary barrier to develop maturity in 2017.
“Lack of people resources”, “Lack of time (focus on day to day business)” and “Do not feel a real need
(no burning platform)” are considered in the same category. If leadership focus existed in organizations,
some of the underlying barriers, for example, “Lack of time” or “Lack of resources” would not have
occurred.
Even though S&OP has been one of the hottest topics in the last 10 years it indicates that S&OP still
has not been fully adopted into the CEO agenda. Potentially, senior managers struggle to promote a
shared S&OP vision, and demonstrate an appealing business case to executive management.
The lack of leadership focus are in line with findings from the Structure dimension, where many
companies still lacks CEO sponsorship.
Another barrier is the high degree of silo thinking. This is also quite in line with earlier findings that in
many companies; KPI’s are not cascaded from strategy, NPD is not included in S&OP, finance is not
included and budgets are not updated with S&OP information. These principles, are prerequisites for
breaking down silos, and an efficient cross-functional process.
Up to date ERP system as a barrier, corresponds very well with the findings in the Technology dimension.
Many companies lack software features, that supports the critical activities in the S&OP process. As
mentioned earlier, the chain is not stronger than the weakest link, and hence technology is a clear
stopping block for companies to pursue S&OP maturity further.
In general, the barriers have increased remarkably since 2013. This could be because companies have
increased their maturity since 2013, and that the more mature stages are harder to achieve. Only one
barrier has been reduced, namely the lack of internal development competences. This indicates, that
now that many more companies are working with S&OP, and that maturity generally has increased, then
internal competences also has been developed.
S&OP in DenmarkSurvey report Side 29 af 30
11.3 Expected S&OP investments 2017-2019
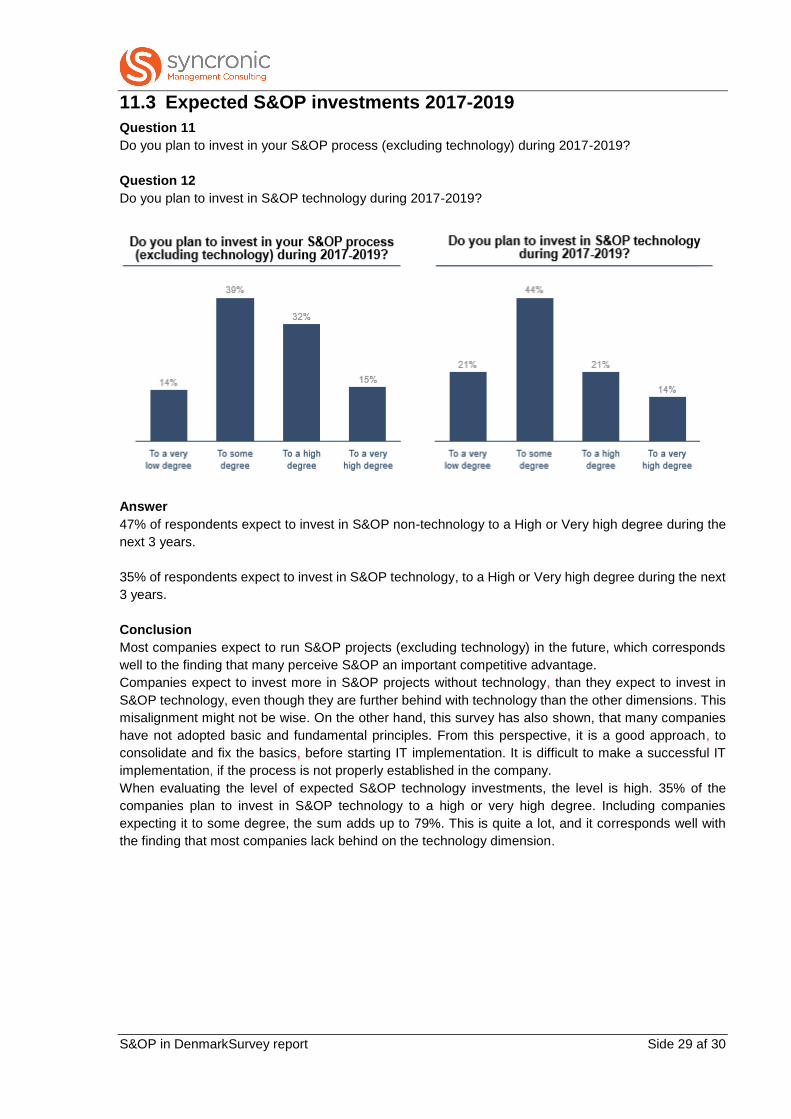
Question 11
Do you plan to invest in your S&OP process (excluding technology) during 2017-2019?
Question 12
Do you plan to invest in S&OP technology during 2017-2019?
Answer
47% of respondents expect to invest in S&OP non-technology to a High or Very high degree during the
next 3 years.
35% of respondents expect to invest in S&OP technology, to a High or Very high degree during the next
3 years.
Conclusion
Most companies expect to run S&OP projects (excluding technology) in the future, which corresponds
well to the finding that many perceive S&OP an important competitive advantage.
Companies expect to invest more in S&OP projects without technology, than they expect to invest in
S&OP technology, even though they are further behind with technology than the other dimensions. This
misalignment might not be wise. On the other hand, this survey has also shown, that many companies
have not adopted basic and fundamental principles. From this perspective, it is a good approach, to
consolidate and fix the basics, before starting IT implementation. It is difficult to make a successful IT
implementation, if the process is not properly established in the company.
When evaluating the level of expected S&OP technology investments, the level is high. 35% of the
companies plan to invest in S&OP technology to a high or very high degree. Including companies
expecting it to some degree, the sum adds up to 79%. This is quite a lot, and it corresponds well with
the finding that most companies lack behind on the technology dimension.

S&OP in DenmarkSurvey report Side 30 af 30
12. Disclaimer
The services and materials provided by SYNCRONIC or any of its affiliated companies are subject to
SYNCRONIC's Standard Terms and Conditions (a copy of which is available upon request) or such other
agreement as may have been previously executed by SYNCRONIC.
SYNCRONIC does not provide legal, accounting, or tax advice. SYNCRONIC has made no undertaking
to update these materials after the date hereof notwithstanding that such information may become
outdated or inaccurate.
SYNCRONIC shall not be liable for any indirect losses or damages including but not limited to, loss of
profit, loss of revenue, loss of data, use of internal time in cured by the other party or any Third-Party,
that rely on these materials.
To the full extent permitted by law (and except to the extent otherwise agreed in a signed writing by
SYNCRONIC), SYNCRONIC shall have no liability whatsoever to any Third-Party, and any Third-Party
hereby waives any rights and claims it may, have at any time against SYNCRONIC with regard to the
services, this presentation or other materials, including the accuracy or completeness thereof. Receipt
and review of this document shall be deemed agreement with and consideration for the foregoing.