cameroon factsheets of health statistics...
TRANSCRIPT

CAMEROON
Factsheets of Health Statistics2016

Population
2010 2011 2012 2013
Population proportion (%)
Aged over 60 %
Aged 15-59 %
Aged under 15% 42.9
52.2
4.9
44.2
50.9
4.9
40.0
55.0
5.0
40.6
54.0
5.4
Population( Source: WHO 2015)
Introduction
Population
Population (in thousands) total
2005
2006
2007
2008
2009
2010
2011
2012
2013
2014
2015 23,344
22,773
22,211
21,660
21,119
20,591
20,075
19,570
19,078
18,597
18,127
Population( Source: WHO 2016)
Health status and trends
2000Both sexes Female Male
2015Both sexes Female Male
Healthy Life expectancy at birth (years)
Life expectancy at age 60 (years)
Life expectancy at birth (years) 50
15
44
53
16
46
51
16
45
56
16
50
59
17
51
57
17
50
Life expectancy( Source: WHO 2016)
1990
Both sexes Female Male
2013
Both sexes Female Male
Adult mortality rate (probability of dying between15 and 60 years per 1000 population) 340287313 370341356
Adult mortality( Source: WHO 2015)
1990 1995 2000 2005 2013 2015
Maternal mortality ratio (per 100 000 live births) 596590690740760720
Maternal mortality( Source: WHO 2015)
2000 2012
Age-standardized mortality rate by cause (per100 000 population)
All Causes
Communicable
Noncommunicable diseases
Injuries
Malignant neoplasms (CANCER)
Cardiovascular diseases
Chronic Respiratory diseases
Diabetes mellitus 52.3
37.5
285.7
73.4
106.0
675.2
768.8
1,550.0
113.7
660.9
1,025.2
1,799.8
Age standardized deaths( Source: WHO 2015)
1990 2000 2015
Under-five mortality rate (deaths per 1,000 live births)
Infant mortality rate (probability of dying between birth andage 1 per 1000 live births) 57
88
93
151
85
136
Child mortality( Source: WHO 2015)
2000 2012
Distribution of years of life lost by major causegroup (%)
Communicable
Noncommunicable diseases
Injuries 9
22
69
7
15
78
Burden of disease( Source: WHO 2015)
CameroonHealth status and trends

Health MDGs
MDG - 4: Reduce child mortalityTarget 4.A: Reduce by two thirds, between 1990 and 2015, the under-five mortality rate
(Source: WHO, 2015)
1990 2015 MDG Target 2015 Reduction (%)
Under-five mortality rate (deaths per 1,000 live births)
Measles (MCV) immunization coverage among 1-year-olds (%) 43
36
100
67
80
88
56
136
Progress on the MDGs
Not achieved
Achieved
MDG - 5: Improve maternal healthTarget 5.A: Reduce by three quarters, between 1990 and 2015, the maternal mortality ratio
(Source: WHO, 2015)
1990 2015 MDG Target 2015 Reduction (%)
Maternal mortality ratio (per 100 000 live births) 1875596728
Progress on the MDGs
Not achieved
2007-2014 MDG Target 2015Antenatal care coverage at least one visitBirths attended par skilled health personnel (%)Unmet need for family planning (%) 0.00
90.00100.00
24.0064.0085.00
Progress on the MDGs
Not achieved
Not achievedAchieved
Target 5.B: Achieve, by 2015, universal access to reproductive health (Source: WHO, 2015)
MDG - 6: Combat HIV/AIDS, malaria and other diseasesTarget 6.A: Have halted by 2015 and begun to reverse the spread of HIV/AIDS
Target 6.B: Achieve, by 2010, universal access to treatment for HIV/AIDS for all those who need itTarget 6.C: Have halted by 2015 and begun to incidence of malaria and other major diseases
(Source: WHO, 2015)
1990 2000 2007 2014 MDG Target 2015 Reduction (%)
Incidence of HIV (%)Antiretroviral therapy coverage (%)Malaria incidence (%)Tuberculosis mortality rate (per 100 000 population per year) -105.88
41.54
50.0075.0080.000.00
35.00
22.000.38
25.000.65
19.00
Health-Related MDGs
MDG - 7: Ensure environment sustainabilityTarget 7.C: Halve,by the proportion of people without sustainable access to safe drinking water and basic sanitation
(Source: WHO, 2015)
1990 2015 MDG Target 2015 Reduction (%)
Population using improved drinking-water sources (%)Population using improved Sanitation (%) 9.82
62.8350.0050.00
45.8081.90
39.9051.30
Progress on the MDGs
Achieved Not achieved
MDG - 1: Eradicate extreme poverty and hungerTarget 1.C: Halve,between 1990 and 2015, the proportion of people who suffer from hunger
(Source: WHO, 2015)
1990-1995 2006-2012 MDG Target 2015 Reduction (%)
Children aged <5 years underweight (%) 0.87.015.118.0
Progress on the MDGs
Not achieved
Other MDGs
MDG - 2: Achieve Universal Primary EducationTarget 2.A: Ensure that, by 2015, children everywhere, boys and girls alike, will be able to complete a full course of primary schooling
(Source: UNICEF, 2015)
2007-2014 MDG Target 2015
Percentage of net enrolment ratio in primary education 100.095.0
Progress on the MDGs
On track
MDG - 3: Promote Gender Equality and Empower WomenTarget 3.A: Eliminate gender disparity in primary and secondary education, preferably by, 2005, and in all levels of education no later than 2015
(Source: UNICEF, 2015)
2007-2014 MDG Target 2015
The gender parity index in percentage of net enrolment ratio inprimary education 1.000.87
Progress on the MDGs
Not on track
MDG - 8: Develop a global partnership for developmentTarget 8.A: Develop further an open, rule-based, non discrimanatory trading and financial system
Target 8.D: In cooperation with pharmaceutical companies, provide access to affordable essential drugs(Source: World Bank, 2015)
1990 2005 2011 2013
Official development assistance (ODA) received as percentage of GDP 2.502.442.504.00
Private Public
Median availability of selected generic medicines, 2007-2013
Median consumer price ratio of selected generic medicines, 2007-2013
Progress on the MDGs
Not achievedNot achievedAchieved
Not achieved
CAMEROONProgress on the MDGs

1995 1996 1997 1998 1999 2000 2001 2002 2003 2004 2005 2006 2007 2008 2009 2010 2011 2012 2013
External resources for health as a percentage of total expenditureon health
General government expenditure on health as % of GDP
General government expenditure on health as a percentage oftotal expenditure on health
General government expenditure on health as a percentage oftotal government expenditure
Out-of-pocket expenditure as a percentage of total expenditureon health
Per capita government expenditure on health (PPP int. $)
Per capita government expenditure on health at averageexchange rate (US$)
Per capita total expenditure on health (PPP int. $)
Per capita total expenditure on health at average exchange rate(US$)
Private prepaid plans as a percentage of private expenditure onhealth
Social security expenditure on health as a percentage of generalgovernment expenditure on health
Total expenditure on health as a percentage of gross domesticproduct 5.1
2.6
67.0
138.0
23.0
48.0
61.5
8.5
34.7
1.8
6.3
5.0
2.6
61.0
130.0
20.0
42.0
63.7
8.5
32.4
1.6
9.1
5.3
2.6
64.0
133.0
22.0
46.0
61.6
8.5
34.7
1.8
4.5
5.3
2.6
57.0
127.0
17.0
38.0
66.1
8.5
30.1
1.6
7.1
5.1
5.2
56.0
121.0
15.0
32.0
69.6
7.3
26.5
1.4
5.3
5.0
4.2
60.0
118.0
12.0
24.0
75.3
5.6
20.7
1.0
5.7
4.7
3.5
50.0
108.0
11.0
25.0
73.1
6.8
22.6
1.1
6.6
4.8
3.2
46.0
107.0
10.0
24.0
73.3
7.4
22.5
1.1
5.7
4.9
3.1
45.0
105.0
10.0
24.0
72.9
7.7
23.0
1.1
5.5
4.6
3.3
41.0
97.0
10.0
24.0
71.3
7.1
24.4
1.1
6.7
4.9
2.9
39.0
99.0
11.0
27.0
68.9
8.2
27.0
1.3
6.8
4.8
3.0
31.0
94.0
8.0
25.0
69.2
7.9
26.7
1.3
6.0
4.7
3.5
27.0
89.0
7.0
21.0
71.5
6.8
24.2
1.1
5.0
4.4
3.9
26.0
81.0
5.0
17.0
74.6
6.1
21.0
0.9
4.2
4.4
4.7
29.0
78.0
5.0
15.0
76.7
5.0
18.8
0.8
2.3
4.4
4.8
29.0
75.0
5.0
13.0
77.7
4.9
17.7
0.8
3.2
4.6
3.6
29.0
77.0
6.0
16.0
74.6
6.6
21.1
1.0
2.9
5.2
4.0
34.0
82.0
6.0
14.0
78.9
5.9
17.3
0.9
2.7
3.9
3.8
25.0
59.0
6.0
14.0
71.9
6.1
23.3
0.9
4.6
Health financingSource: WHO 2015
2007-2013 2013 1985-2015 2005-2015
Availability of national list of approved medical devices forprocurement or reimbursement
Availability of national standards or recommended lists ofmedical devices
Availability of technical specifications of medical devices tosupport procurement or donations
Distribution of censuses carried out in the last three censusround(1985-1994, 1995-2004, 2005-2015)
Percentage of civil registration coverage for births
Plan of census data
Unit in the Ministry of Health responsible for the management ofmedical devices
1
3
1
2
1
0
61
Health information, evidence and knowledgeSource: WHO 2015
2010 2013
Total density per 100 000 population: District/rural hospitals
Total density per 100 000 population: Health centres
Total density per 100 000 population: Health posts
Total density per 100 000 population: Hospitals
Total density per 100 000 population: Provincial hospitals
Total density per 100 000 population: Specialized hospitals
Total density per million females aged from 50 to 69 years old:Mammography units
Total density per million population: Computed tomography units
Total density per million population: Gamma camera or Nuclear medicine
Total density per million population: Linear Accelerator
Total density per million population: Magnetic Resonance Imaging
Total density per million population: Positron Emission tomography
Total density per million population: Radiotherapy units
Total density per million population: Telecobalt Unit 0.13
0.13
0.00
0.04
0.00
0.04
0.63
17.40
0.04
0.08
0.79
7.43
0.63
0.67
0.15
0.15
0.00
0.05
0.00
0.05
0.71
17.08
0.05
0.09
8.43
0.72
0.77
Medical products, vaccines, intrastructures and equipementSource: WHO 2015
1994 1995 1996 1997 1998 1999 2000 2001 2002 2004 2005 2006 2007 2008 2009 2010 2011
Smear-positive tuberculosis treatment-success rate (%)
Treatment success rate for new pulmonary smear-negative and extrapulmonary tuberculosis cases
Treatment success rate for retreatment tuberculosis cases 70
78
80
71
77
78
69
76
78
66
72
77
64
72
76
44
74
55
74
49
71
69
71
57
62
59
77
67
75
67
75
68
60595344
Service deliverySource: WHO 2015
2004 2005 2007 2009 2007-2013
Dentistry personnel density (per 10 000 population)
Dentistry personnel density (per 1000 population)
Health management & support workers density (per 1000population)Nursing and midwifery personnel density (per 10 000population)Nursing and midwifery personnel density (per 1000population)
Other health workers density (per 1000 population)
Pharmaceutical personnel density (per 10 000 population)
Pharmaceutical personnel density (per 1000 population)
Physicians density (per 10 000 population)
Physicians density (per 1000 population)
0.800
0.045
4.400
0.045
0.077
0.002
0.462
0.438
0.001
0.002
0.078
0.002
0.365
0.487
0.001
0.002
0.064
0.002
0.153
0.411
0.001
0.002
0.192
0.043
1.598
0.362
0.009
Health workforceSource: WHO 2015
1995 1996 1997 1998 1999 2000 2001 2002 2003 2004 2005 2006 2007 2008 2009 2010 2011 2012 2013
Expenditures for health as a proportion of total per person expenditure
Out-of-pocket expenditure as a percentage of private expenditure on health
Persons protected from out-of-pocket expenditures through a prepaymentscheme
Private expenditure on health as a percentage of total expenditure on health
Proportion of births attended by skilled personnel
Satisfied need for family planning
65.30
94.10
67.60
94.20
14.40
63.60
65.30
94.30
69.90
2.60
94.60
73.50
94.60
1.16
79.30
95.00
77.40
94.50
77.50
94.60
77.00
94.60
75.60
94.30
73.00
94.50
73.30
94.40
75.80
94.40
79.00
94.40
81.20
94.50
82.30
94.50
78.90
94.50
82.70
95.30
76.70
93.80
Universal coverageSource: WHO 2015
National health policies
National Health Strategic Plans
20152011
20152011
Availability of national standards orrecommended lists of medicaldevices
2010
2013
Health technology (medical device)national policy
2010
2013
Types of lists recommending healthtechnology for high burden diseases
2010
2013
Unit in the Ministry of Healthresponsible for the management ofmedical devices
2010
2013
For different healthcare facilities
For different healthcare facilities
Yes, and it is part of the National Health Program/Plan orPolicy
Yes, and it is part of the National Health Program/Plan orPolicy
No list available
No list available
Yes
Yes
Comprehensive monitoring and evaluation plan 2012
Health financing strategy 2013
No
Not started
Distribution of censuses carried out in the last three census round (1985-1994, 1995-2004, 2005-2015)
Plan of census data, 2005-2015 Census conducted
3 Censuses
Source: UNSD, 2015
Leadership and governanceSource: WHO 2015
CAMEROONThe health system
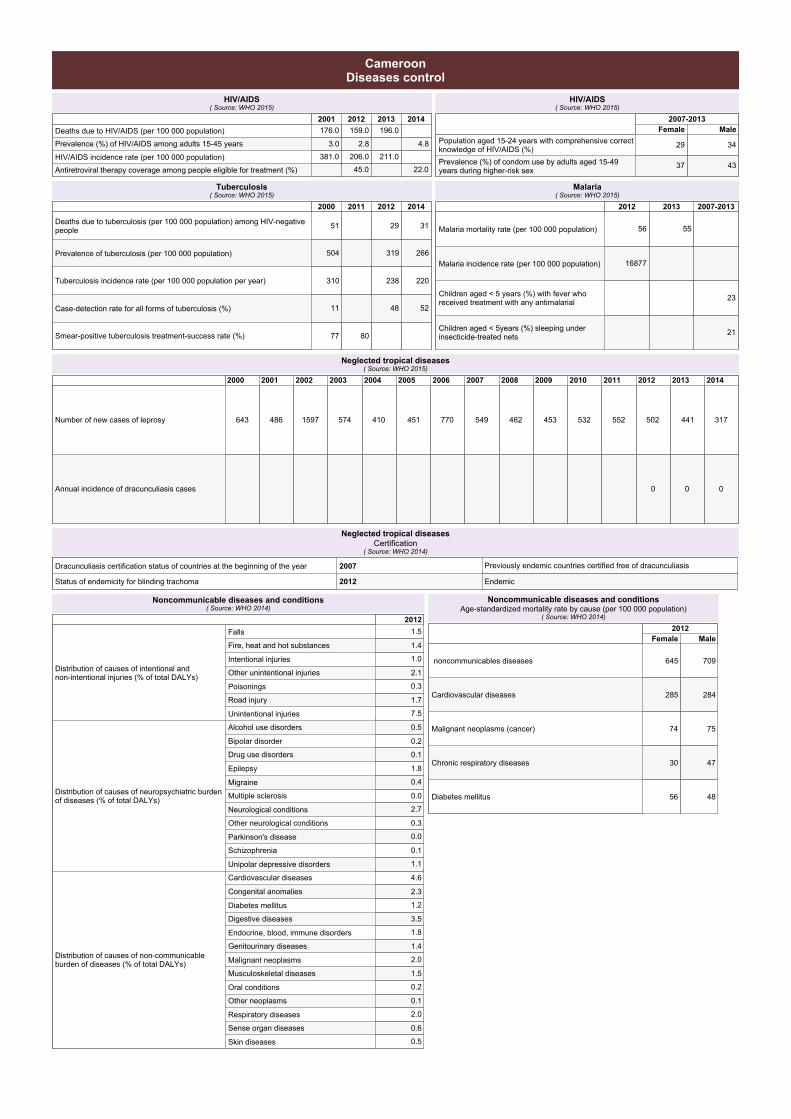
2001 2012 2013 2014Deaths due to HIV/AIDS (per 100 000 population)
Prevalence (%) of HIV/AIDS among adults 15-45 years
HIV/AIDS incidence rate (per 100 000 population)
Antiretroviral therapy coverage among people eligible for treatment (%)
381.0
176.0
3.0
206.0
159.0
45.0
2.8
211.0
196.0
22.0
4.8
HIV/AIDS( Source: WHO 2015)
2007-2013Female Male
Population aged 15-24 years with comprehensive correctknowledge of HIV/AIDS (%)
Prevalence (%) of condom use by adults aged 15-49years during higher-risk sex
4337
3429
HIV/AIDS( Source: WHO 2015)
2000 2011 2012 2014
Deaths due to tuberculosis (per 100 000 population) among HIV-negativepeople
Prevalence of tuberculosis (per 100 000 population)
Tuberculosis incidence rate (per 100 000 population per year)
Case-detection rate for all forms of tuberculosis (%)
Smear-positive tuberculosis treatment-success rate (%)
504
310
77
51
11
80
319
238
48
29
266
220
52
31
Tuberculosis( Source: WHO 2015)
2012 2013 2007-2013
Malaria mortality rate (per 100 000 population)
Malaria incidence rate (per 100 000 population)
Children aged < 5 years (%) with fever whoreceived treatment with any antimalarial
Children aged < 5years (%) sleeping underinsecticide-treated nets
16877
56 55
23
21
Malaria( Source: WHO 2015)
CameroonDiseases control
2000 2001 2002 2003 2004 2005 2006 2007 2008 2009 2010 2011 2012 2013 2014
Number of new cases of leprosy
Annual incidence of dracunculiasis cases
1597 770643 574 552549 532 502486 462 453451 441410 317
000
Neglected tropical diseases( Source: WHO 2015)
Dracunculiasis certification status of countries at the beginning of the year 2007
Status of endemicity for blinding trachoma 2012
Previously endemic countries certified free of dracunculiasis
Endemic
Neglected tropical diseasesCertification
( Source: WHO 2014)
2012
Distribution of causes of intentional andnon-intentional injuries (% of total DALYs)
Falls
Fire, heat and hot substances
Intentional injuries
Other unintentional injuries
Poisonings
Road injury
Unintentional injuries
Distribution of causes of neuropsychiatric burdenof diseases (% of total DALYs)
Alcohol use disorders
Bipolar disorder
Drug use disorders
Epilepsy
Migraine
Multiple sclerosis
Neurological conditions
Other neurological conditions
Parkinson's disease
Schizophrenia
Unipolar depressive disorders
Distribution of causes of non-communicableburden of diseases (% of total DALYs)
Cardiovascular diseases
Congenital anomalies
Diabetes mellitus
Digestive diseases
Endocrine, blood, immune disorders
Genitourinary diseases
Malignant neoplasms
Musculoskeletal diseases
Oral conditions
Other neoplasms
Respiratory diseases
Sense organ diseases
Skin diseases
7.5
2.1
1.7
1.5
1.4
1.0
0.3
2.7
1.8
1.1
0.5
0.4
0.3
0.2
0.1
0.1
0.0
0.0
4.6
3.5
2.3
2.0
2.0
1.8
1.5
1.4
1.2
0.6
0.5
0.2
0.1
Noncommunicable diseases and conditions( Source: WHO 2014)
2012Female Male
noncommunicables diseases
Cardiovascular diseases
Malignant neoplasms (cancer)
Chronic respiratory diseases
Diabetes mellitus 48
47
75
284
709
56
30
74
285
645
Noncommunicable diseases and conditionsAge-standardized mortality rate by cause (per 100 000 population)
( Source: WHO 2014)
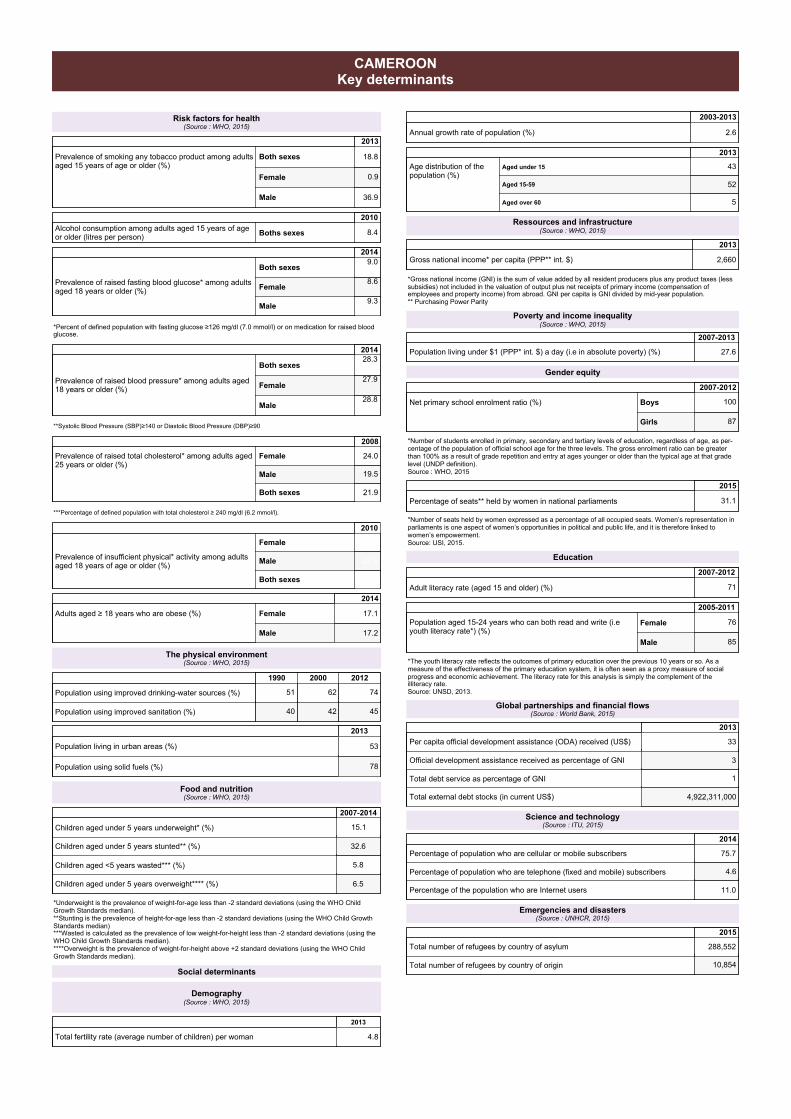
Risk factors for health(Source : WHO, 2015)
2013
Prevalence of smoking any tobacco product among adultsaged 15 years of age or older (%)
Both sexes
Female
Male 36.9
0.9
18.8
2010Alcohol consumption among adults aged 15 years of ageor older (litres per person) Boths sexes 8.4
2014
Prevalence of raised fasting blood glucose* among adultsaged 18 years or older (%)
Both sexes
Female
Male9.3
8.6
9.0
2014
Prevalence of raised blood pressure* among adults aged18 years or older (%)
Both sexes
Female
Male28.8
27.9
28.3
2008
Prevalence of raised total cholesterol* among adults aged25 years or older (%)
Female
Male
Both sexes 21.9
19.5
24.0
2010
Prevalence of insufficient physical* activity among adultsaged 18 years of age or older (%)
Female
Male
Both sexes 30.7
22.8
38.7
The physical environment(Source : WHO, 2015)
1990 2000 2012
Population using improved drinking-water sources (%)
Population using improved sanitation (%)
746251
454240
Food and nutrition(Source : WHO, 2015)
2007-2014
Children aged under 5 years underweight* (%)
Children aged under 5 years stunted** (%)
Children aged <5 years wasted*** (%)
Children aged under 5 years overweight**** (%)
15.1
32.6
5.8
6.5
Social determinants
Demography(Source : WHO, 2015)
2013
Age distribution of thepopulation (%)
Aged under 15
Aged 15-59
Aged over 60 5
52
43
Ressources and infrastructure(Source : WHO, 2015)
2013
Gross national income* per capita (PPP** int. $) 2,660
Poverty and income inequality(Source : WHO, 2015)
2007-2013
Population living under $1 (PPP* int. $) a day (i.e in absolute poverty) (%) 27.6
Gender equity
2007-2012
Net primary school enrolment ratio (%) Boys
Girls 87
100
Global partnerships and financial flows(Source : World Bank, 2015)
2013
Per capita official development assistance (ODA) received (US$)
Official development assistance received as percentage of GNI
Total debt service as percentage of GNI
Total external debt stocks (in current US$)
33
3
1
4,922,311,000
Science and technology(Source : ITU, 2015)
2014
Percentage of population who are cellular or mobile subscribers
Percentage of population who are telephone (fixed and mobile) subscribers
Percentage of the population who are Internet users
75.7
4.6
11.0
Emergencies and disasters(Source : UNHCR, 2015)
2015
Total number of refugees by country of asylum
Total number of refugees by country of origin
288,552
10,854
Education
2007-2012
Adult literacy rate (aged 15 and older) (%) 71
CAMEROONKey determinants
2013
Total fertility rate (average number of children) per woman 4.8
2003-2013
Annual growth rate of population (%) 2.6
*Percent of defined population with fasting glucose ≥126 mg/dl (7.0 mmol/l) or on medication for raised bloodglucose.
**Systolic Blood Pressure (SBP)≥140 or Diastolic Blood Pressure (DBP)≥90
***Percentage of defined population with total cholesterol ≥ 240 mg/dl (6.2 mmol/l).
*Underweight is the prevalence of weight-for-age less than -2 standard deviations (using the WHO ChildGrowth Standards median).**Stunting is the prevalence of height-for-age less than -2 standard deviations (using the WHO Child GrowthStandards median)***Wasted is calculated as the prevalence of low weight-for-height less than -2 standard deviations (using theWHO Child Growth Standards median).****Overweight is the prevalence of weight-for-height above +2 standard deviations (using the WHO ChildGrowth Standards median).
*Gross national income (GNI) is the sum of value added by all resident producers plus any product taxes (lesssubsidies) not included in the valuation of output plus net receipts of primary income (compensation ofemployees and property income) from abroad. GNI per capita is GNI divided by mid-year population.** Purchasing Power Parity
*Number of students enrolled in primary, secondary and tertiary levels of education, regardless of age, as per-centage of the population of official school age for the three levels. The gross enrolment ratio can be greaterthan 100% as a result of grade repetition and entry at ages younger or older than the typical age at that gradelevel (UNDP definition).Source : WHO, 2015
2015
Percentage of seats** held by women in national parliaments 31.1
*Number of seats held by women expressed as a percentage of all occupied seats. Women’s representation inparliaments is one aspect of women’s opportunities in political and public life, and it is therefore linked towomen’s empowerment.Source: USI, 2015.
2005-2011
Population aged 15-24 years who can both read and write (i.eyouth literacy rate*) (%)
Female
Male 85
76
*The youth literacy rate reflects the outcomes of primary education over the previous 10 years or so. As ameasure of the effectiveness of the primary education system, it is often seen as a proxy measure of socialprogress and economic achievement. The literacy rate for this analysis is simply the complement of theilliteracy rate.Source: UNSD, 2013.
2014
Adults aged ≥ 18 years who are obese (%) Female
Male 17.2
17.1
2013
Population living in urban areas (%)
Population using solid fuels (%)
53
78