cameroon: debt sustainability analysis; imf country report ... · paloma anos casero (ida) prepared...
TRANSCRIPT
CAMEROON STAFF REPORT FOR THE 2018 ARTICLE IV CONSULTATION, SECOND REVIEW UNDER THE EXTENDED CREDIT FACILITY ARRANGEMENT, REQUESTS FOR WAIVERS OF NONOBSERVANCE OF PERFORMANCE CRITERIA AND MODIFICATION OF PERFORMANCE CRITERIA—DEBT SUSTAINABILITY ANALYSIS
Cameroon’s risk of external debt distress remains high. Fiscal consolidation and the Fund-supported envisaged reforms, coupled with the increasing share of concessional new borrowing, would improve the debt profile over time. However, at present, Cameroon’s external debt remains highly vulnerable to exogenous shocks: the policy-dependent threshold for the present value of debt to exports and debt service to exports are breached in the baseline program scenario as well as under standard stress tests. Mitigating risks to public debt thus requires a number of policy actions including: (i) a resolute and effective fiscal consolidation; (ii) a shift in the composition of new borrowing towards concessional loans; (iii) enhanced controls on externally-financed investment projects at all levels of government; (iv) implementation of policies to boost growth and non-oil exports; and (iv) a strengthening of public debt management
Approved By David Owen (IMF) and Paloma Anos Casero (IDA)
Prepared by the staffs of the International Monetary Fund and the International Development Association
June 22, 2018

CAMEROON
2 INTERNATIONAL MONETARY FUND
BACKGROUND 1. Public debt increased to 38.2 percent of GDP in 2017, a full 5 percent higher than what was reported at the time of the 1st ECF Review (Text Table 1, Text Figure 1). The increase can be explained by two factors: (i) a broadening of the definition of public debt to include all SONARA debt due to third parties (1.8 percent); and (ii) a larger-than-expected fiscal deficit at end-2017, financed by higher external disbursement and higher expenditure float. As a result, total public and publicly guaranteed debt (external plus domestic) increased from a revised 33.3 percent of GDP in 2016 to 38.2 percent in 2017.1
2. The stock of contracted-but-undisbursed debt also increased. A 2017 study by the National Debt Committee (CNDP) found that the large stock of undisbursed loans reflects a number of factors, including (i) normal project execution lags; (ii) delays in large infrastructure projects; (iii) non-performing projects with very low or nil disbursements, owing to lack of maturation or lack of available counterpart funds. This stock reached CFAF 4.5 trillion or 23 percent of GDP, up from 20 percent of GDP at end-2016. China’s share in undisbursed loans is still the largest, but dropped from 36 percent at end-2016 to 28 percent at end-2017, as new borrowing agreements were signed mostly with multilateral creditors, which now account for over 40 percent of undisbursed debt. Commercial loans account for 15.6 percent of the undisbursed amount.
3. The share of external concessional and semi-concessional debt has increased, in line with the objectives of the ECF-supported program. Multilateral and Paris Club (PC) debt represented almost half of total debt. Bilateral non-PC debt is dominated by China, while commercial debt mostly reflects a $750 million Eurobond issued in 2015 (Text Table 2).
1 In line with the previous DSA, the figures reported in the current DSA are higher than those reported by the authorities (and reported in the accompanying Policy Note), because of SONARA debt (see paragraph 6).
Text Table 1. Cameroon: Public and Publicly Guaranteed Debt, 2016–17
(percent of GDP)
Sources: Cameroonian authorities; and IMF staff calculations.
Text Table 2. Cameroon: Composition of External Debt by Creditor, 2016–17
(percent of GDP)
Sources: Cameroonian authorities; and IMF staff calculations.
2016 2016 2017First
ReviewRevised
perimeterEst.
27.9 27.4 31.6External debt 20.7 20.7 23.4Domestic Debt 5.6 5.1 8.0BEAC statutory advances 1.2 1.2 …Publicly guaranteed debt 0.4 0.4 0.3
SONARA debt 0.4 2.8 3.0 o/w external … 1.5 1.9
Expenditure float 3.2 3.1 3.6
Total PPG debt 31.5 33.3 38.2Domestic 10.4 10.7 12.6External 21.1 22.7 25.6
Memo:20.1 20.1 21.9
Domestic 1.3 1.3 0.9External 18.8 18.8 21.0
Stock of contracted but undisbursed deb
Public debt contracted and
2016 2017Multilateral 6.0 7.3Bilateral PC 3.2 3.7Bilateral non-PC 7.2 7.9Commercial 5.9 6.4
o/w SONARA 1.5 1.9n/a (guaranteed) 0.4 0.3Total 22.7 25.6
CAMEROON
INTERNATIONAL MONETARY FUND 3
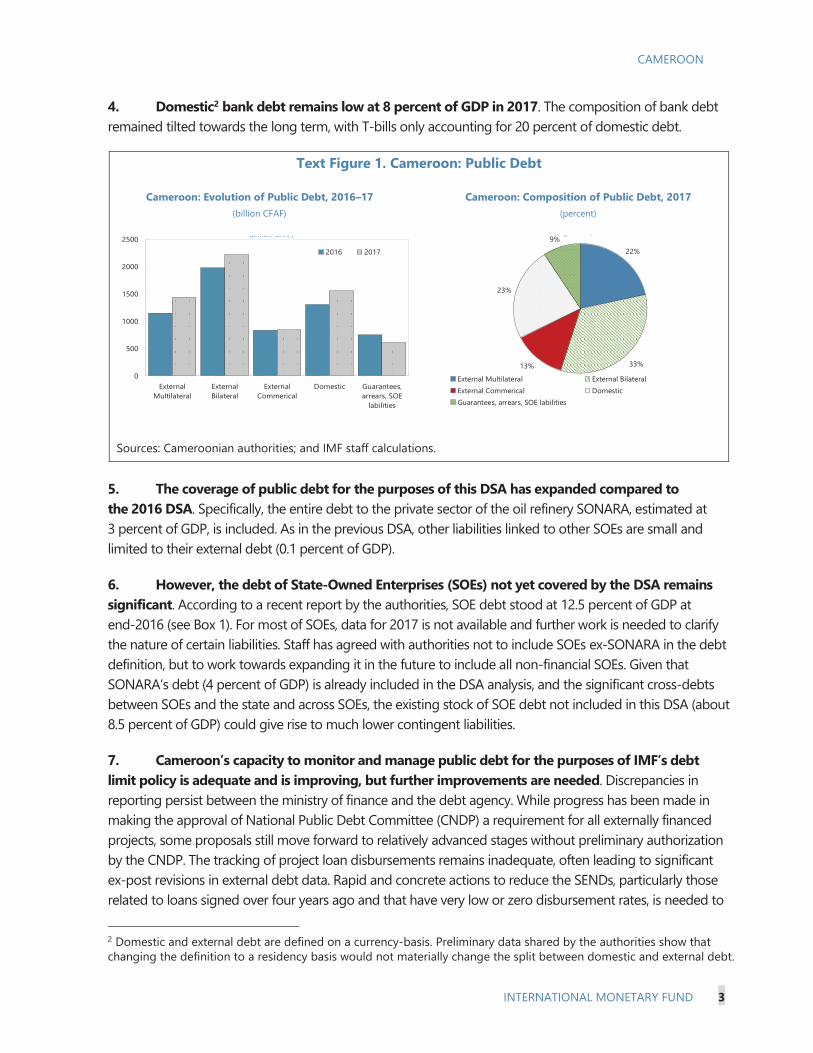
4. Domestic2 bank debt remains low at 8 percent of GDP in 2017. The composition of bank debt remained tilted towards the long term, with T-bills only accounting for 20 percent of domestic debt.
Text Figure 1. Cameroon: Public Debt
Cameroon: Evolution of Public Debt, 2016–17 (billion CFAF)
Cameroon: Composition of Public Debt, 2017 (percent)
Sources: Cameroonian authorities; and IMF staff calculations.
5. The coverage of public debt for the purposes of this DSA has expanded compared to the 2016 DSA. Specifically, the entire debt to the private sector of the oil refinery SONARA, estimated at 3 percent of GDP, is included. As in the previous DSA, other liabilities linked to other SOEs are small and limited to their external debt (0.1 percent of GDP).
6. However, the debt of State-Owned Enterprises (SOEs) not yet covered by the DSA remains significant. According to a recent report by the authorities, SOE debt stood at 12.5 percent of GDP at end-2016 (see Box 1). For most of SOEs, data for 2017 is not available and further work is needed to clarify the nature of certain liabilities. Staff has agreed with authorities not to include SOEs ex-SONARA in the debt definition, but to work towards expanding it in the future to include all non-financial SOEs. Given that SONARA’s debt (4 percent of GDP) is already included in the DSA analysis, and the significant cross-debts between SOEs and the state and across SOEs, the existing stock of SOE debt not included in this DSA (about 8.5 percent of GDP) could give rise to much lower contingent liabilities.
7. Cameroon’s capacity to monitor and manage public debt for the purposes of IMF’s debt limit policy is adequate and is improving, but further improvements are needed. Discrepancies in reporting persist between the ministry of finance and the debt agency. While progress has been made in making the approval of National Public Debt Committee (CNDP) a requirement for all externally financed projects, some proposals still move forward to relatively advanced stages without preliminary authorization by the CNDP. The tracking of project loan disbursements remains inadequate, often leading to significant ex-post revisions in external debt data. Rapid and concrete actions to reduce the SENDs, particularly those related to loans signed over four years ago and that have very low or zero disbursement rates, is needed to
2 Domestic and external debt are defined on a currency-basis. Preliminary data shared by the authorities show that changing the definition to a residency basis would not materially change the split between domestic and external debt.
0
500
1000
1500
2000
2500
ExternalMultilateral
ExternalBilateral
ExternalCommerical
Domestic Guarantees,arrears, SOE
labilities
2016 2017
(billion CFAF)
22%
33%13%
23%
9%
External Multilateral External BilateralExternal Commerical DomesticGuarantees, arrears, SOE labilities
(p )

CAMEROON
4 INTERNATIONAL MONETARY FUND
provide a clearer picture of the existing commitments’ overhang and space for new borrowing. On the other hand, progress has been made in the monitoring of SOE debt and other contingent liabilities (see Box 1).
Box 1. Public Debt and State-Owned Enterprises
Improved monitoring. The authorities took a decisive step in improving monitoring of SOEs by publishing, at the end of 2017, a “livre vert” listing all companies where the state or public entity is a shareholder, and all Public Establishments with an Industrial or Commercial Character (EPIC), which are legally distinct from SOEs but imply the same modalities of operation and state control. It is expected that the livre vert will be updated and published yearly.
Coverage. This analysis employs data from SOEs with a state participation above 50 percent and the EPICs for which reliable financial data are available. Financial companies (such as public banks) are excluded.
SOE gross debt is sizeable. Total SOE debt reached 12.5 percent of GDP in 2016, up from 11.7 percent in 2014. Over two thirds of outstanding SOE debt is financial (banks, securitized debt and other loans) and suppliers’ debt.
Cross-debts with the central government are significant. Anecdotal evidence suggests liabilities across SOEs are significant. A substantial portion of gross SOE debt, exceeding 2 percent of GDP, is owed to the state. At the same time SOE claims on the state declined to 0.3 percent of GDP at end-2016, (1.5 percent in 2014).
The public oil refinery SONARA is a concern. Total SONARA debt reached 5 percent of GDP in 2014, before gradually declining to 4 percent of GDP at end-2017, as lower oil prices triggered higher-than-expected profits. However, the increase in international oil prices has already started to strain SONARA’s finances again in 2018. At end-2017, reported state debt vis-à-vis the refinery stood at 0.5 percent of GDP; the refinery’s debt to the state, mainly in the form of tax and customs arrears, stood at 1.2 percent of GDP.
2014 2015 2016Dividends 0.0 0.0 0.0Subsidies 0.7 1.0 1.2Claims on the state 1.5 1.3 0.3Financial Debt 4.5 5.1 6.4Suppliers 4.0 3.2 2.6Tax debt 1.8 2.6 2.3Social debt 0.2 0.2 0.3Other 1.3 1.2 0.9Total debt 11.7 12.4 12.5
Text Table: SOEs and EPIC debt, 2014-16(percent of GDP)
Livre VertFinancial data available
SOEs 38 26Development companies 2 1EPIC 17 10Total 57 37
Text Table. A census of public enterprises
SONARA DEBT2014 2015 2016 2017
Financial 0.6 0.6 0.6 0.8Suppliers 3.1 2.1 1.6 1.7Tax 1.1 1.7 1.6 1.2Social security 0.0 0.0 0.0 …Other 0.2 0.2 0.4 0.3Total debt 5.0 4.5 4.2 4.0
In percent of GDP
CAMEROON
INTERNATIONAL MONETARY FUND 5
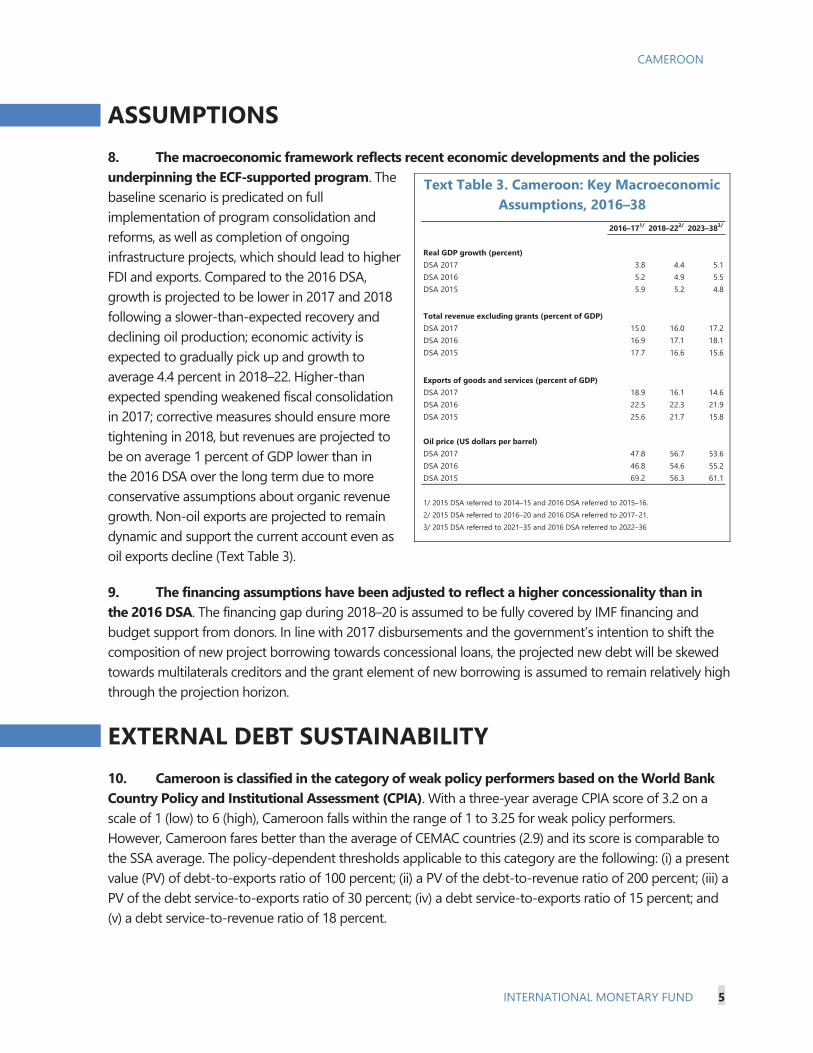
ASSUMPTIONS 8. The macroeconomic framework reflects recent economic developments and the policies underpinning the ECF-supported program. The baseline scenario is predicated on full implementation of program consolidation and reforms, as well as completion of ongoing infrastructure projects, which should lead to higher FDI and exports. Compared to the 2016 DSA, growth is projected to be lower in 2017 and 2018 following a slower-than-expected recovery and declining oil production; economic activity is expected to gradually pick up and growth to average 4.4 percent in 2018–22. Higher-than expected spending weakened fiscal consolidation in 2017; corrective measures should ensure more tightening in 2018, but revenues are projected to be on average 1 percent of GDP lower than in the 2016 DSA over the long term due to more conservative assumptions about organic revenue growth. Non-oil exports are projected to remain dynamic and support the current account even as oil exports decline (Text Table 3).
9. The financing assumptions have been adjusted to reflect a higher concessionality than in the 2016 DSA. The financing gap during 2018–20 is assumed to be fully covered by IMF financing and budget support from donors. In line with 2017 disbursements and the government’s intention to shift the composition of new project borrowing towards concessional loans, the projected new debt will be skewed towards multilaterals creditors and the grant element of new borrowing is assumed to remain relatively high through the projection horizon.
EXTERNAL DEBT SUSTAINABILITY 10. Cameroon is classified in the category of weak policy performers based on the World Bank Country Policy and Institutional Assessment (CPIA). With a three-year average CPIA score of 3.2 on a scale of 1 (low) to 6 (high), Cameroon falls within the range of 1 to 3.25 for weak policy performers. However, Cameroon fares better than the average of CEMAC countries (2.9) and its score is comparable to the SSA average. The policy-dependent thresholds applicable to this category are the following: (i) a present value (PV) of debt-to-exports ratio of 100 percent; (ii) a PV of the debt-to-revenue ratio of 200 percent; (iii) a PV of the debt service-to-exports ratio of 30 percent; (iv) a debt service-to-exports ratio of 15 percent; and (v) a debt service-to-revenue ratio of 18 percent.
Text Table 3. Cameroon: Key Macroeconomic Assumptions, 2016–38
2016–171/ 2018–222/ 2023–383/
Real GDP growth (percent)DSA 2017 3.8 4.4 5.1DSA 2016 5.2 4.9 5.5DSA 2015 5.9 5.2 4.8
Total revenue excluding grants (percent of GDP)DSA 2017 15.0 16.0 17.2DSA 2016 16.9 17.1 18.1DSA 2015 17.7 16.6 15.6
Exports of goods and services (percent of GDP)DSA 2017 18.9 16.1 14.6DSA 2016 22.5 22.3 21.9DSA 2015 25.6 21.7 15.8
Oil price (US dollars per barrel)DSA 2017 47.8 56.7 53.6DSA 2016 46.8 54.6 55.2DSA 2015 69.2 56.3 61.1
1/ 2015 DSA referred to 2014–15 and 2016 DSA referred to 2015–16.2/ 2015 DSA referred to 2016–20 and 2016 DSA referred to 2017–21.3/ 2015 DSA referred to 2021–35 and 2016 DSA referred to 2022–36
CAMEROON
6 INTERNATIONAL MONETARY FUND
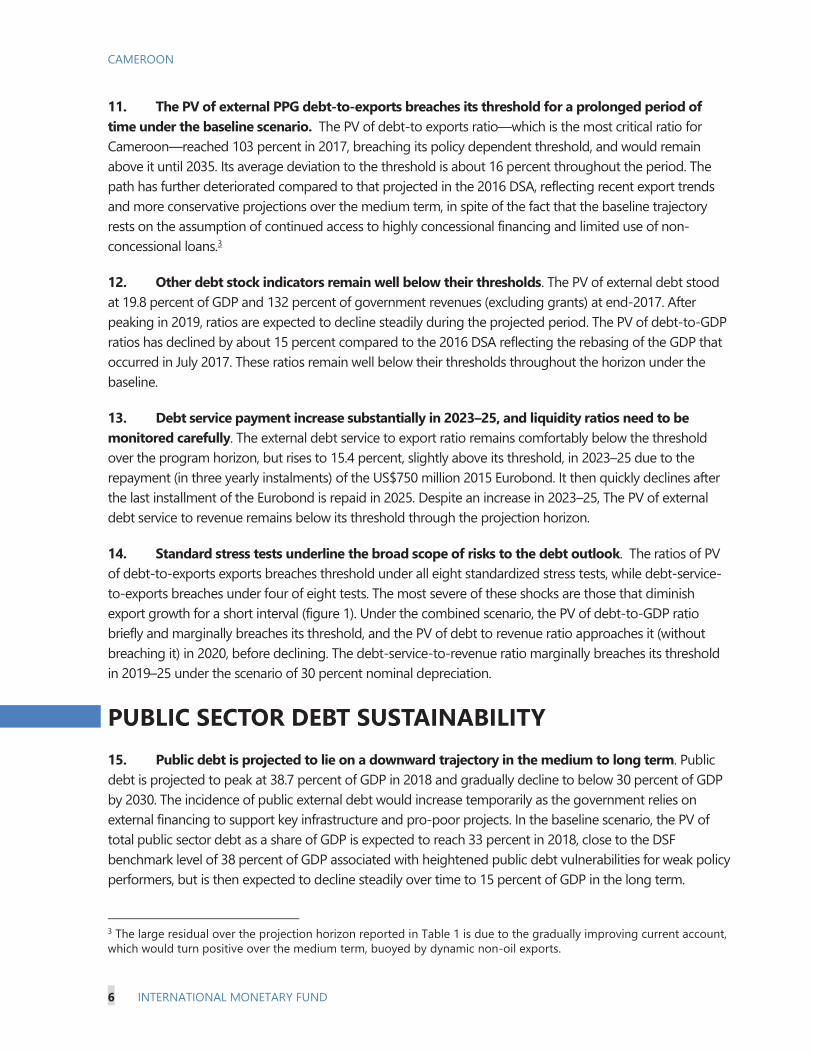
11. The PV of external PPG debt-to-exports breaches its threshold for a prolonged period of time under the baseline scenario. The PV of debt-to exports ratio—which is the most critical ratio for Cameroon—reached 103 percent in 2017, breaching its policy dependent threshold, and would remain above it until 2035. Its average deviation to the threshold is about 16 percent throughout the period. The path has further deteriorated compared to that projected in the 2016 DSA, reflecting recent export trends and more conservative projections over the medium term, in spite of the fact that the baseline trajectory rests on the assumption of continued access to highly concessional financing and limited use of non-concessional loans.3
12. Other debt stock indicators remain well below their thresholds. The PV of external debt stood at 19.8 percent of GDP and 132 percent of government revenues (excluding grants) at end-2017. After peaking in 2019, ratios are expected to decline steadily during the projected period. The PV of debt-to-GDP ratios has declined by about 15 percent compared to the 2016 DSA reflecting the rebasing of the GDP that occurred in July 2017. These ratios remain well below their thresholds throughout the horizon under the baseline.
13. Debt service payment increase substantially in 2023–25, and liquidity ratios need to be monitored carefully. The external debt service to export ratio remains comfortably below the threshold over the program horizon, but rises to 15.4 percent, slightly above its threshold, in 2023–25 due to the repayment (in three yearly instalments) of the US$750 million 2015 Eurobond. It then quickly declines after the last installment of the Eurobond is repaid in 2025. Despite an increase in 2023–25, The PV of external debt service to revenue remains below its threshold through the projection horizon.
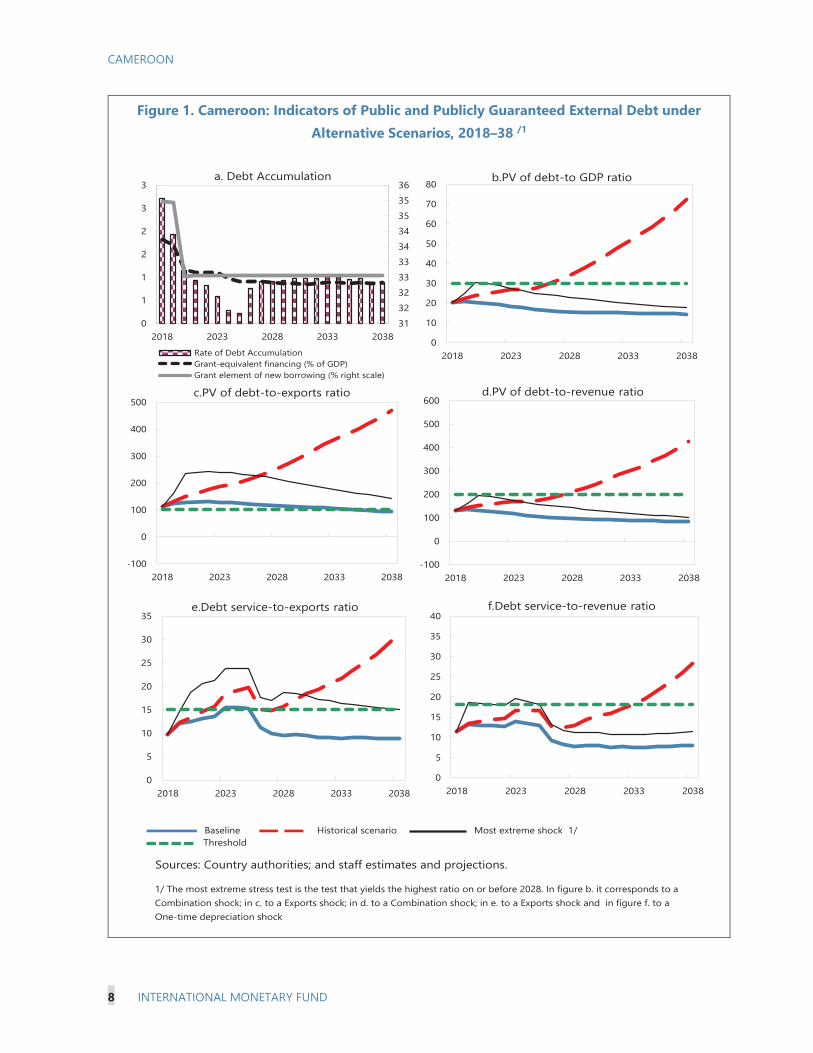
14. Standard stress tests underline the broad scope of risks to the debt outlook. The ratios of PV of debt-to-exports exports breaches threshold under all eight standardized stress tests, while debt-service-to-exports breaches under four of eight tests. The most severe of these shocks are those that diminish export growth for a short interval (figure 1). Under the combined scenario, the PV of debt-to-GDP ratio briefly and marginally breaches its threshold, and the PV of debt to revenue ratio approaches it (without breaching it) in 2020, before declining. The debt-service-to-revenue ratio marginally breaches its threshold in 2019–25 under the scenario of 30 percent nominal depreciation.
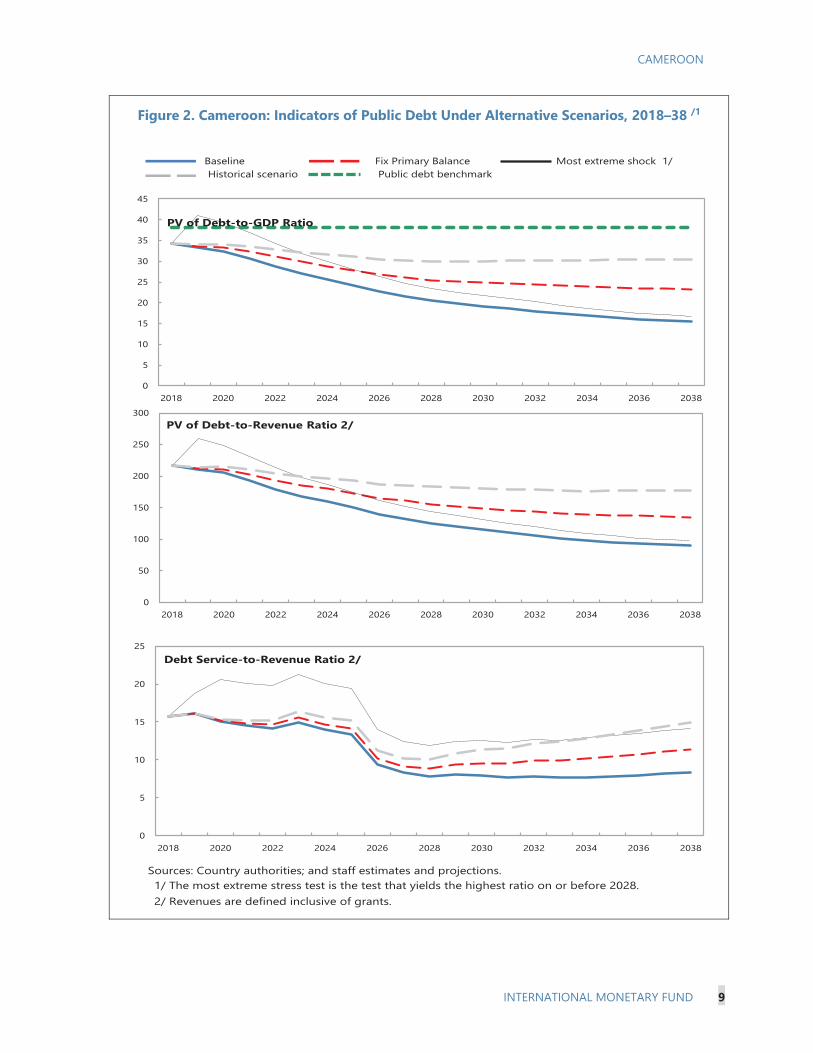
PUBLIC SECTOR DEBT SUSTAINABILITY 15. Public debt is projected to lie on a downward trajectory in the medium to long term. Public debt is projected to peak at 38.7 percent of GDP in 2018 and gradually decline to below 30 percent of GDP by 2030. The incidence of public external debt would increase temporarily as the government relies on external financing to support key infrastructure and pro-poor projects. In the baseline scenario, the PV of total public sector debt as a share of GDP is expected to reach 33 percent in 2018, close to the DSF benchmark level of 38 percent of GDP associated with heightened public debt vulnerabilities for weak policy performers, but is then expected to decline steadily over time to 15 percent of GDP in the long term.
3 The large residual over the projection horizon reported in Table 1 is due to the gradually improving current account, which would turn positive over the medium term, buoyed by dynamic non-oil exports.
CAMEROON
INTERNATIONAL MONETARY FUND 7
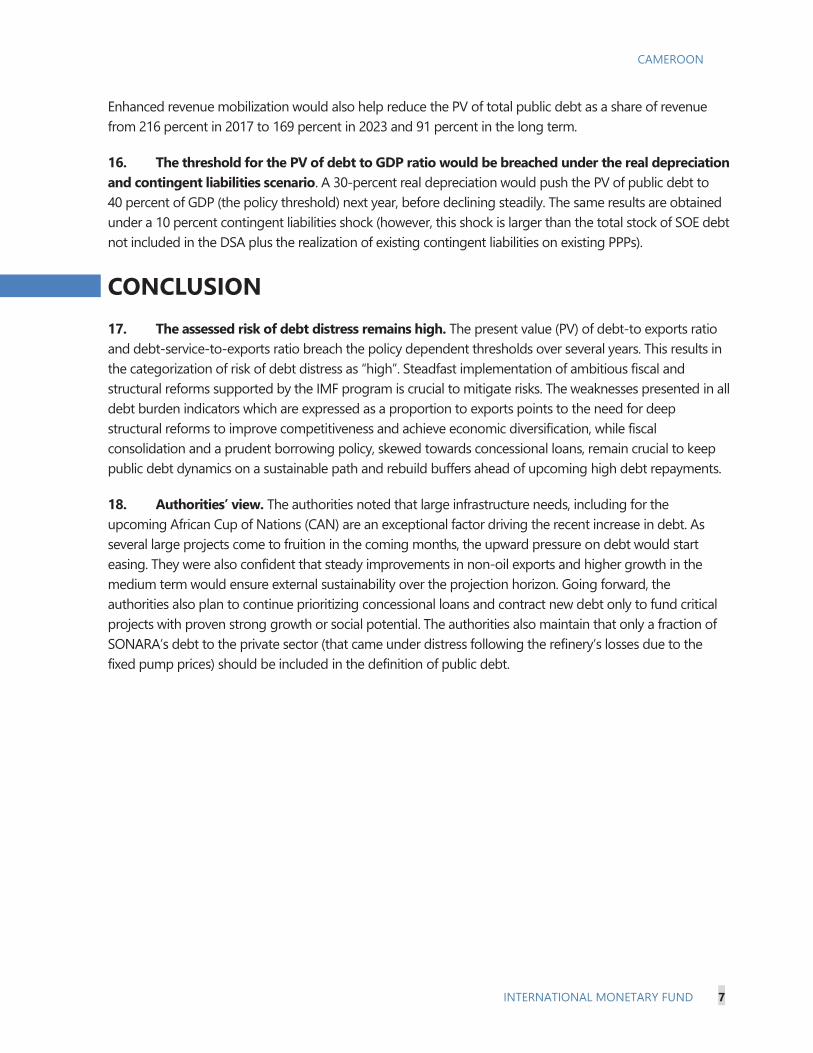
Enhanced revenue mobilization would also help reduce the PV of total public debt as a share of revenue from 216 percent in 2017 to 169 percent in 2023 and 91 percent in the long term.
16. The threshold for the PV of debt to GDP ratio would be breached under the real depreciation and contingent liabilities scenario. A 30-percent real depreciation would push the PV of public debt to 40 percent of GDP (the policy threshold) next year, before declining steadily. The same results are obtained under a 10 percent contingent liabilities shock (however, this shock is larger than the total stock of SOE debt not included in the DSA plus the realization of existing contingent liabilities on existing PPPs).
CONCLUSION 17. The assessed risk of debt distress remains high. The present value (PV) of debt-to exports ratio and debt-service-to-exports ratio breach the policy dependent thresholds over several years. This results in the categorization of risk of debt distress as “high”. Steadfast implementation of ambitious fiscal and structural reforms supported by the IMF program is crucial to mitigate risks. The weaknesses presented in all debt burden indicators which are expressed as a proportion to exports points to the need for deep structural reforms to improve competitiveness and achieve economic diversification, while fiscal consolidation and a prudent borrowing policy, skewed towards concessional loans, remain crucial to keep public debt dynamics on a sustainable path and rebuild buffers ahead of upcoming high debt repayments.
18. Authorities’ view. The authorities noted that large infrastructure needs, including for the upcoming African Cup of Nations (CAN) are an exceptional factor driving the recent increase in debt. As several large projects come to fruition in the coming months, the upward pressure on debt would start easing. They were also confident that steady improvements in non-oil exports and higher growth in the medium term would ensure external sustainability over the projection horizon. Going forward, the authorities also plan to continue prioritizing concessional loans and contract new debt only to fund critical projects with proven strong growth or social potential. The authorities also maintain that only a fraction of SONARA’s debt to the private sector (that came under distress following the refinery’s losses due to the fixed pump prices) should be included in the definition of public debt.
CAMEROON
8 INTERNATIONAL MONETARY FUND
Figure 1. Cameroon: Indicators of Public and Publicly Guaranteed External Debt under Alternative Scenarios, 2018–38 /1
Sources: Country authorities; and staff estimates and projections.
1/ The most extreme stress test is the test that yields the highest ratio on or before 2028. In figure b. it corresponds to a Combination shock; in c. to a Exports shock; in d. to a Combination shock; in e. to a Exports shock and in figure f. to a One-time depreciation shock
Baseline Historical scenario Most extreme shock 1/ Threshold
0
5
10
15
20
25
30
35
40
2018 2023 2028 2033 2038
f.Debt service-to-revenue ratio
31323233333434353536
0
1
1
2
2
3
3
2018 2023 2028 2033 2038Rate of Debt AccumulationGrant-equivalent financing (% of GDP)Grant element of new borrowing (% right scale)
a. Debt Accumulation
-100
0
100
200
300
400
500
2018 2023 2028 2033 2038
c.PV of debt-to-exports ratio
0
10
20
30
40
50
60
70
80
2018 2023 2028 2033 2038
b.PV of debt-to GDP ratio
-100
0
100
200
300
400
500
600
2018 2023 2028 2033 2038
d.PV of debt-to-revenue ratio
0
5
10
15
20
25
30
35
2018 2023 2028 2033 2038
e.Debt service-to-exports ratio
CAMEROON
INTERNATIONAL MONETARY FUND 9
Figure 2. Cameroon: Indicators of Public Debt Under Alternative Scenarios, 2018–38 /1
Sources: Country authorities; and staff estimates and projections.1/ The most extreme stress test is the test that yields the highest ratio on or before 2028. 2/ Revenues are defined inclusive of grants.
BaselinePublic debt benchmark
Most extreme shock 1/Historical scenario
Fix Primary Balance
0
50
100
150
200
250
300
2018 2020 2022 2024 2026 2028 2030 2032 2034 2036 2038
PV of Debt-to-Revenue Ratio 2/
0
5
10
15
20
25
30
35
40
45
2018 2020 2022 2024 2026 2028 2030 2032 2034 2036 2038
PV of Debt-to-GDP Ratio
0
5
10
15
20
25
2018 2020 2022 2024 2026 2028 2030 2032 2034 2036 2038
Debt Service-to-Revenue Ratio 2/

CAMEROON
10 INTERNATIONAL MONETARY FUND
Table 1. Cameroon: External Debt Sustainability Framework, Baseline Scenario, 2015–38 (percent of GDP, unless otherwise indicated)
Historical 6/ Standard 6/
Average Deviation 2018-2023 2024-20382015 2016 2017 2018 2019 2020 2021 2022 2023 Average 2028 2038 Average
External debt (nominal) 1/ 21.6 25.4 28.2 28.9 29.9 29.5 29.0 28.5 27.8 25.0 23.0of which: public and publicly guaranteed (PPG) 19.9 22.6 25.6 26.3 27.3 27.0 26.4 25.9 25.2 22.4 20.4
Change in external debt 7.0 3.7 2.9 0.6 1.0 -0.4 -0.5 -0.5 -0.7 -0.2 -0.2Identified net debt-creating flows 3.8 -0.6 -4.9 -1.9 -1.8 -2.0 -2.1 -2.1 -1.9 -4.3 -9.4
Non-interest current account deficit 3.5 2.5 2.0 2.6 0.8 2.0 2.0 1.9 1.9 1.9 2.0 -0.3 -7.1 -2.3Deficit in balance of goods and services 3.4 2.6 2.0 2.7 2.9 3.0 3.2 3.3 3.2 0.7 -6.3
Exports 21.8 19.4 19.2 18.0 17.0 16.1 15.4 14.8 14.3 13.4 15.4Imports 25.2 22.0 21.2 20.8 19.8 19.1 18.6 18.1 17.5 14.1 9.1
Net current transfers (negative = inflow) -1.0 -1.1 -1.2 -1.2 0.5 -1.3 -1.3 -1.3 -1.2 -1.2 -1.2 -1.1 -0.9 -1.0of which: official -0.2 -0.2 -0.3 -0.3 -0.3 -0.3 -0.3 -0.3 -0.3 -0.2 -0.2
Other current account flows (negative = net inflow) 1.1 1.0 1.2 0.5 0.4 0.1 -0.1 -0.1 0.1 0.0 0.1Net FDI (negative = inflow) -1.9 -3.0 -6.3 -2.6 1.4 -3.9 -3.5 -3.5 -3.5 -3.6 -3.3 -3.4 -1.8 -2.7Endogenous debt dynamics 2/ 2.2 -0.2 -0.6 0.0 -0.3 -0.3 -0.5 -0.5 -0.6 -0.6 -0.5
Contribution from nominal interest rate 0.3 0.7 0.8 1.0 0.9 1.0 0.9 0.9 0.8 0.7 0.7Contribution from real GDP growth -0.9 -0.9 -0.8 -1.0 -1.2 -1.3 -1.4 -1.4 -1.4 -1.3 -1.2Contribution from price and exchange rate changes 2.9 0.1 -0.6 … … … … … … … …
Residual (3-4) 3/ 3.2 4.3 7.8 2.6 2.8 1.6 1.5 1.7 1.2 4.0 9.2of which: exceptional financing 0.0 0.0 0.0 0.0 0.0 0.0 0.0 0.0 0.0 0.0 0.0
PV of external debt 4/ ... ... 22.5 22.9 23.4 23.0 22.5 21.8 21.0 18.2 16.9In percent of exports ... ... 117.5 127.3 137.7 143.1 145.6 147.5 147.1 136.0 109.6
PV of PPG external debt ... ... 19.8 20.4 20.8 20.5 19.9 19.3 18.5 15.7 14.3In percent of exports ... ... 103.5 113.0 122.6 127.2 129.0 130.2 129.2 116.9 93.0In percent of government revenues ... ... 132.0 131.4 133.3 131.5 126.6 121.5 116.3 96.9 84.2
Debt service-to-exports ratio (in percent) 3.4 9.4 11.0 16.2 16.4 16.5 16.7 17.4 19.3 13.7 12.6PPG debt service-to-exports ratio (in percent) 3.4 6.6 7.1 9.8 12.1 12.5 13.1 13.6 15.4 9.5 8.9PPG debt service-to-revenue ratio (in percent) 4.5 8.7 9.1 11.3 13.2 12.9 12.9 12.6 13.8 7.8 8.1Total gross financing need (Billions of U.S. dollars) 0.7 0.4 -0.8 0.4 0.6 0.5 0.5 0.5 0.8 -1.5 -11.1Non-interest current account deficit that stabilizes debt ratio -3.5 -1.2 -0.9 1.3 1.0 2.2 2.4 2.4 2.8 -0.1 -6.9
Key macroeconomic assumptions
Real GDP growth (in percent) 5.7 4.5 3.2 4.2 1.2 4.0 4.5 4.8 5.0 5.2 5.4 4.8 5.4 5.5 5.4GDP deflator in US dollar terms (change in percent) -16.3 -0.2 2.4 0.4 8.3 10.3 2.4 2.7 2.2 2.3 2.1 3.7 1.7 1.8 1.8Effective interest rate (percent) 5/ 1.8 3.4 3.4 2.9 0.5 4.0 3.3 3.5 3.4 3.5 3.1 3.5 2.9 3.1 3.0Growth of exports of G&S (US dollar terms, in percent) -21.7 -7.1 4.3 1.8 17.8 7.9 0.9 1.9 3.0 3.3 3.9 3.5 7.6 8.9 7.8Growth of imports of G&S (US dollar terms, in percent) -19.5 -9.1 2.0 3.1 17.0 12.4 2.2 3.8 4.6 4.6 3.8 5.2 3.1 2.3 2.7Grant element of new public sector borrowing (in percent) ... ... ... ... ... 35.0 34.9 32.5 32.6 32.6 32.6 33.3 32.6 32.6 32.6Government revenues (excluding grants, in percent of GDP) 16.4 14.7 15.0 15.5 15.6 15.6 15.7 15.9 15.9 16.2 17.0 16.6Aid flows (in Billions of US dollars) 7/ 1614.8 3.1 4.0 1.1 1.1 0.6 0.7 0.7 0.8 0.9 1.9
of which: Grants 0.0 0.1 0.1 0.1 0.1 0.1 0.1 0.1 0.1 0.1 0.2of which: Concessional loans 1614.7 3.0 3.9 0.9 1.0 0.5 0.6 0.6 0.7 0.8 1.6
Grant-equivalent financing (in percent of GDP) 8/ ... ... ... 1.8 1.7 1.2 1.1 1.1 1.1 0.9 0.9 0.9Grant-equivalent financing (in percent of external financing) 8/ ... ... ... 39.4 38.4 37.4 37.4 37.1 36.9 37.1 36.5 36.9
Memorandum items:Nominal GDP (Billions of US dollars) 30.9 32.2 34.1 39.1 41.9 45.0 48.4 52.1 56.0 79.2 160.8Nominal dollar GDP growth -11.6 4.2 5.7 14.8 7.1 7.6 7.4 7.7 7.6 8.7 7.2 7.4 7.3PV of PPG external debt (in Billions of US dollars) 7.1 8.0 8.8 9.2 9.7 10.1 10.4 12.4 23.1(PVt-PVt-1)/GDPt-1 (in percent) 2.7 1.9 1.1 0.9 0.8 0.6 1.4 0.9 0.9 0.8Gross workers' remittances (Billions of US dollars) 0.5 0.5 0.6 0.7 0.7 0.8 0.8 0.8 0.9 1.1 1.8PV of PPG external debt (in percent of GDP + remittances) ... ... 19.5 20.0 20.5 20.1 19.6 19.0 18.2 15.5 14.2PV of PPG external debt (in percent of exports + remittances) ... ... 95.1 102.8 111.2 115.1 116.6 117.4 116.3 105.7 86.5Debt service of PPG external debt (in percent of exports + remittances) ... ... 6.6 8.9 11.0 11.3 11.9 12.2 13.8 8.5 8.3
Sources: Country authorities; and staff estimates and projections.
1/ Includes both public and private sector external debt.2/ Derived as [r - g - ρ(1+g)]/(1+g+ρ+gρ) times previous period debt ratio, with r = nominal interest rate; g = real GDP growth rate, and ρ = growth rate of GDP deflator in U.S. dollar terms. 3/ Includes exceptional financing (i.e., changes in arrears and debt relief); changes in gross foreign assets; and valuation adjustments. For projections also includes contribution from price and exchange rate changes.4/ Assumes that PV of private sector debt is equivalent to its face value.5/ Current-year interest payments divided by previous period debt stock. 6/ Historical averages and standard deviations are generally derived over the past 10 years, subject to data availability. 7/ Defined as grants, concessional loans, and debt relief.8/ Grant-equivalent financing includes grants provided directly to the government and through new borrowing (difference between the face value and the PV of new debt).
Actual Projections
CAMEROON
INTERNATIONAL MONETARY FUND 11
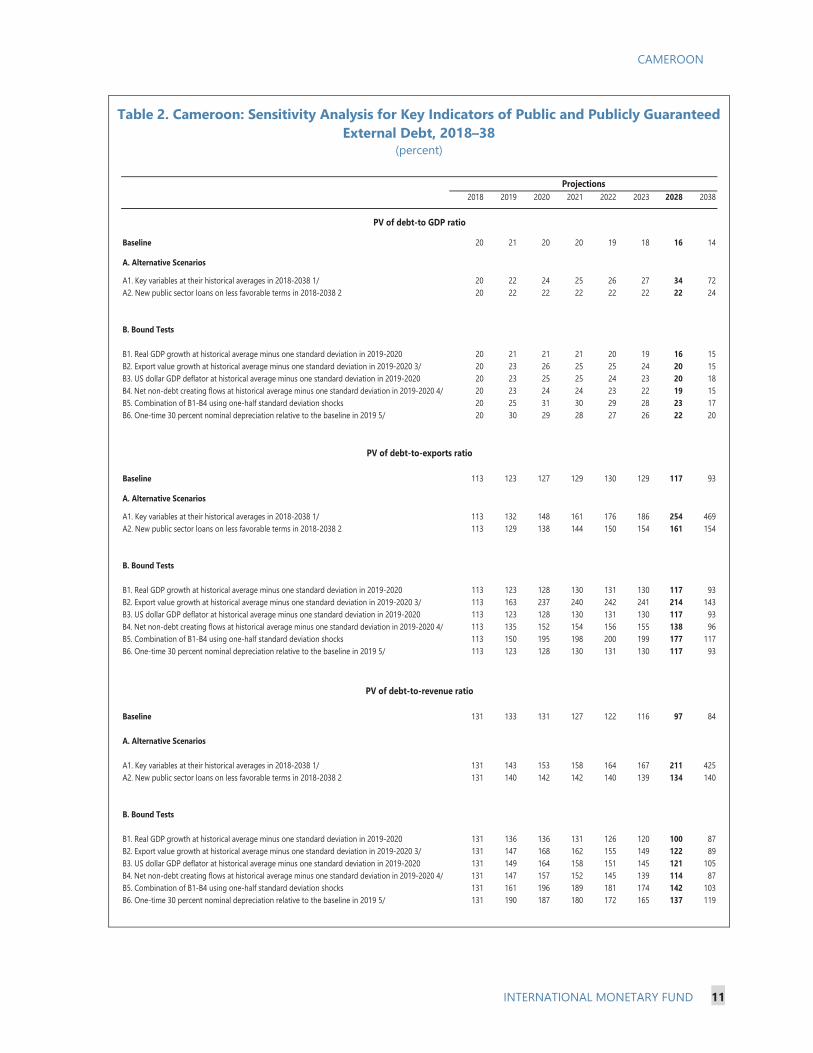
Table 2. Cameroon: Sensitivity Analysis for Key Indicators of Public and Publicly Guaranteed External Debt, 2018–38
(percent)
2018 2019 2020 2021 2022 2023 2028 2038
Baseline 20 21 20 20 19 18 16 14
A. Alternative Scenarios
A1. Key variables at their historical averages in 2018-2038 1/ 20 22 24 25 26 27 34 72A2. New public sector loans on less favorable terms in 2018-2038 2 20 22 22 22 22 22 22 24
B. Bound Tests
B1. Real GDP growth at historical average minus one standard deviation in 2019-2020 20 21 21 21 20 19 16 15B2. Export value growth at historical average minus one standard deviation in 2019-2020 3/ 20 23 26 25 25 24 20 15B3. US dollar GDP deflator at historical average minus one standard deviation in 2019-2020 20 23 25 25 24 23 20 18B4. Net non-debt creating flows at historical average minus one standard deviation in 2019-2020 4/ 20 23 24 24 23 22 19 15B5. Combination of B1-B4 using one-half standard deviation shocks 20 25 31 30 29 28 23 17B6. One-time 30 percent nominal depreciation relative to the baseline in 2019 5/ 20 30 29 28 27 26 22 20
Baseline 113 123 127 129 130 129 117 93
A. Alternative Scenarios
A1. Key variables at their historical averages in 2018-2038 1/ 113 132 148 161 176 186 254 469A2. New public sector loans on less favorable terms in 2018-2038 2 113 129 138 144 150 154 161 154
B. Bound Tests
B1. Real GDP growth at historical average minus one standard deviation in 2019-2020 113 123 128 130 131 130 117 93B2. Export value growth at historical average minus one standard deviation in 2019-2020 3/ 113 163 237 240 242 241 214 143B3. US dollar GDP deflator at historical average minus one standard deviation in 2019-2020 113 123 128 130 131 130 117 93B4. Net non-debt creating flows at historical average minus one standard deviation in 2019-2020 4/ 113 135 152 154 156 155 138 96B5. Combination of B1-B4 using one-half standard deviation shocks 113 150 195 198 200 199 177 117B6. One-time 30 percent nominal depreciation relative to the baseline in 2019 5/ 113 123 128 130 131 130 117 93
Baseline 131 133 131 127 122 116 97 84
A. Alternative Scenarios
A1. Key variables at their historical averages in 2018-2038 1/ 131 143 153 158 164 167 211 425A2. New public sector loans on less favorable terms in 2018-2038 2 131 140 142 142 140 139 134 140
B. Bound Tests
B1. Real GDP growth at historical average minus one standard deviation in 2019-2020 131 136 136 131 126 120 100 87B2. Export value growth at historical average minus one standard deviation in 2019-2020 3/ 131 147 168 162 155 149 122 89B3. US dollar GDP deflator at historical average minus one standard deviation in 2019-2020 131 149 164 158 151 145 121 105B4. Net non-debt creating flows at historical average minus one standard deviation in 2019-2020 4/ 131 147 157 152 145 139 114 87B5. Combination of B1-B4 using one-half standard deviation shocks 131 161 196 189 181 174 142 103B6. One-time 30 percent nominal depreciation relative to the baseline in 2019 5/ 131 190 187 180 172 165 137 119
PV of debt-to-exports ratio
PV of debt-to-revenue ratio
PV of debt-to GDP ratio
Projections
CAMEROON
12 INTERNATIONAL MONETARY FUND
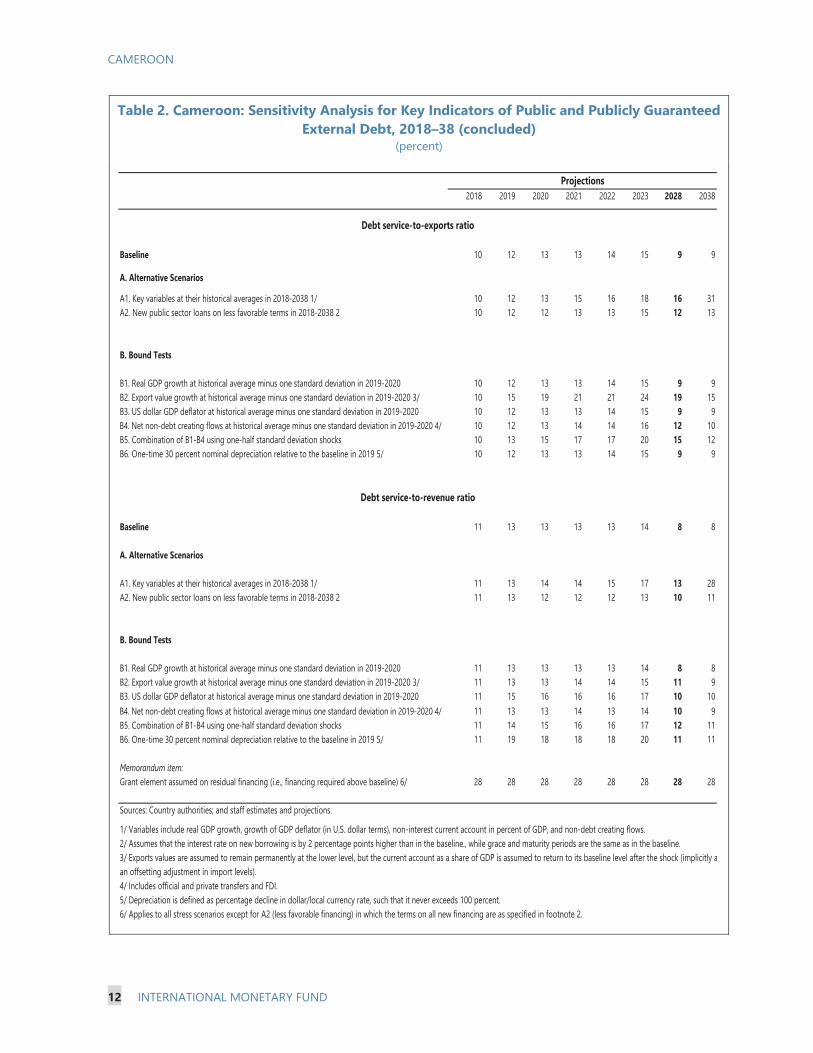
Table 2. Cameroon: Sensitivity Analysis for Key Indicators of Public and Publicly Guaranteed External Debt, 2018–38 (concluded)
(percent)
2018 2019 2020 2021 2022 2023 2028 2038
Baseline 10 12 13 13 14 15 9 9
A. Alternative Scenarios
A1. Key variables at their historical averages in 2018-2038 1/ 10 12 13 15 16 18 16 31A2. New public sector loans on less favorable terms in 2018-2038 2 10 12 12 13 13 15 12 13
B. Bound Tests
B1. Real GDP growth at historical average minus one standard deviation in 2019-2020 10 12 13 13 14 15 9 9B2. Export value growth at historical average minus one standard deviation in 2019-2020 3/ 10 15 19 21 21 24 19 15B3. US dollar GDP deflator at historical average minus one standard deviation in 2019-2020 10 12 13 13 14 15 9 9B4. Net non-debt creating flows at historical average minus one standard deviation in 2019-2020 4/ 10 12 13 14 14 16 12 10B5. Combination of B1-B4 using one-half standard deviation shocks 10 13 15 17 17 20 15 12B6. One-time 30 percent nominal depreciation relative to the baseline in 2019 5/ 10 12 13 13 14 15 9 9
Baseline 11 13 13 13 13 14 8 8
A. Alternative Scenarios
A1. Key variables at their historical averages in 2018-2038 1/ 11 13 14 14 15 17 13 28A2. New public sector loans on less favorable terms in 2018-2038 2 11 13 12 12 12 13 10 11
B. Bound Tests
B1. Real GDP growth at historical average minus one standard deviation in 2019-2020 11 13 13 13 13 14 8 8B2. Export value growth at historical average minus one standard deviation in 2019-2020 3/ 11 13 13 14 14 15 11 9B3. US dollar GDP deflator at historical average minus one standard deviation in 2019-2020 11 15 16 16 16 17 10 10B4. Net non-debt creating flows at historical average minus one standard deviation in 2019-2020 4/ 11 13 13 14 13 14 10 9B5. Combination of B1-B4 using one-half standard deviation shocks 11 14 15 16 16 17 12 11B6. One-time 30 percent nominal depreciation relative to the baseline in 2019 5/ 11 19 18 18 18 20 11 11
Memorandum item:Grant element assumed on residual financing (i.e., financing required above baseline) 6/ 28 28 28 28 28 28 28 28
Sources: Country authorities; and staff estimates and projections.
1/ Variables include real GDP growth, growth of GDP deflator (in U.S. dollar terms), non-interest current account in percent of GDP, and non-debt creating flows. 2/ Assumes that the interest rate on new borrowing is by 2 percentage points higher than in the baseline., while grace and maturity periods are the same as in the baseline.3/ Exports values are assumed to remain permanently at the lower level, but the current account as a share of GDP is assumed to return to its baseline level after the shock (implicitly aan offsetting adjustment in import levels). 4/ Includes official and private transfers and FDI.5/ Depreciation is defined as percentage decline in dollar/local currency rate, such that it never exceeds 100 percent.6/ Applies to all stress scenarios except for A2 (less favorable financing) in which the terms on all new financing are as specified in footnote 2.
Debt service-to-revenue ratio
Debt service-to-exports ratio
Projections
CAMEROON
INTERNATIONAL MONETARY FUND 13
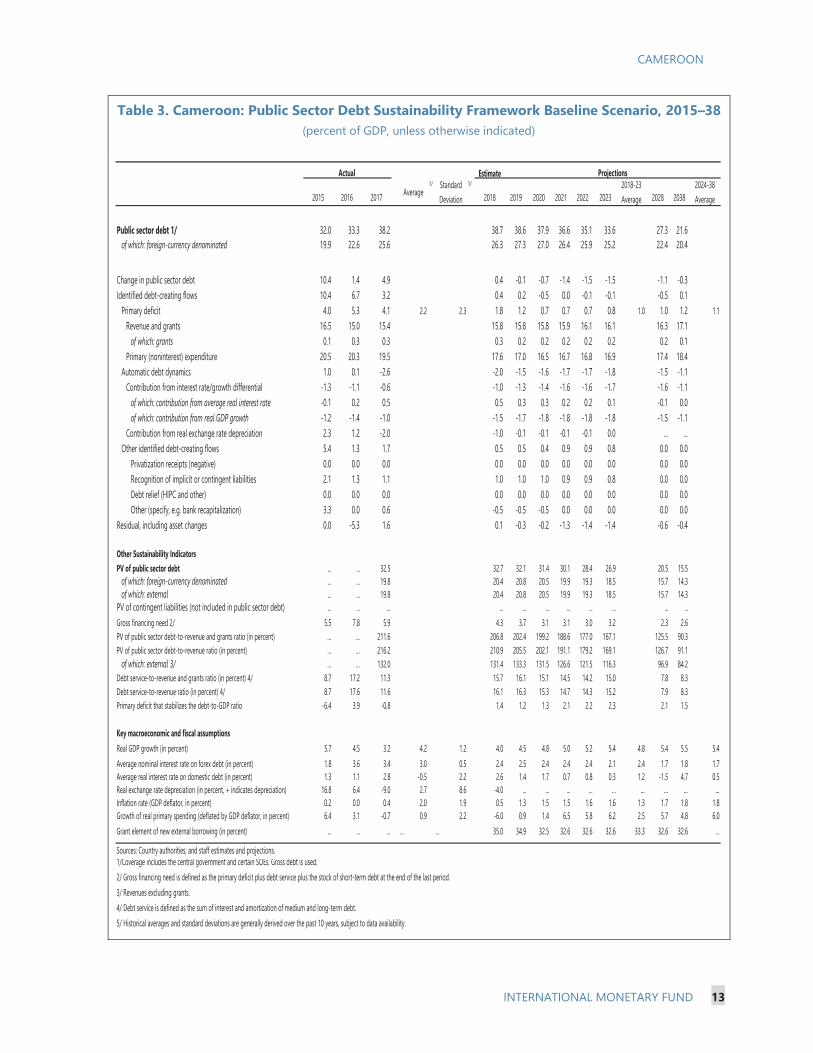
Table 3. Cameroon: Public Sector Debt Sustainability Framework Baseline Scenario, 2015–38 (percent of GDP, unless otherwise indicated)
Estimate
2015 2016 2017 Average5/ Standard
Deviation
5/
2018 2019 2020 2021 2022 20232018-23 Average 2028 2038
2024-38 Average
Public sector debt 1/ 32.0 33.3 38.2 38.7 38.6 37.9 36.6 35.1 33.6 27.3 21.6of which: foreign-currency denominated 19.9 22.6 25.6 26.3 27.3 27.0 26.4 25.9 25.2 22.4 20.4
Change in public sector debt 10.4 1.4 4.9 0.4 -0.1 -0.7 -1.4 -1.5 -1.5 -1.1 -0.3Identified debt-creating flows 10.4 6.7 3.2 0.4 0.2 -0.5 0.0 -0.1 -0.1 -0.5 0.1
Primary deficit 4.0 5.3 4.1 2.2 2.3 1.8 1.2 0.7 0.7 0.7 0.8 1.0 1.0 1.2 1.1Revenue and grants 16.5 15.0 15.4 15.8 15.8 15.8 15.9 16.1 16.1 16.3 17.1
of which: grants 0.1 0.3 0.3 0.3 0.2 0.2 0.2 0.2 0.2 0.2 0.1Primary (noninterest) expenditure 20.5 20.3 19.5 17.6 17.0 16.5 16.7 16.8 16.9 17.4 18.4
Automatic debt dynamics 1.0 0.1 -2.6 -2.0 -1.5 -1.6 -1.7 -1.7 -1.8 -1.5 -1.1Contribution from interest rate/growth differential -1.3 -1.1 -0.6 -1.0 -1.3 -1.4 -1.6 -1.6 -1.7 -1.6 -1.1
of which: contribution from average real interest rate -0.1 0.2 0.5 0.5 0.3 0.3 0.2 0.2 0.1 -0.1 0.0of which: contribution from real GDP growth -1.2 -1.4 -1.0 -1.5 -1.7 -1.8 -1.8 -1.8 -1.8 -1.5 -1.1
Contribution from real exchange rate depreciation 2.3 1.2 -2.0 -1.0 -0.1 -0.1 -0.1 -0.1 0.0 ... ...Other identified debt-creating flows 5.4 1.3 1.7 0.5 0.5 0.4 0.9 0.9 0.8 0.0 0.0
Privatization receipts (negative) 0.0 0.0 0.0 0.0 0.0 0.0 0.0 0.0 0.0 0.0 0.0Recognition of implicit or contingent liabilities 2.1 1.3 1.1 1.0 1.0 1.0 0.9 0.9 0.8 0.0 0.0Debt relief (HIPC and other) 0.0 0.0 0.0 0.0 0.0 0.0 0.0 0.0 0.0 0.0 0.0Other (specify, e.g. bank recapitalization) 3.3 0.0 0.6 -0.5 -0.5 -0.5 0.0 0.0 0.0 0.0 0.0
Residual, including asset changes 0.0 -5.3 1.6 0.1 -0.3 -0.2 -1.3 -1.4 -1.4 -0.6 -0.4
Other Sustainability IndicatorsPV of public sector debt ... ... 32.5 32.7 32.1 31.4 30.1 28.4 26.9 20.5 15.5
of which: foreign-currency denominated ... ... 19.8 20.4 20.8 20.5 19.9 19.3 18.5 15.7 14.3of which: external ... ... 19.8 20.4 20.8 20.5 19.9 19.3 18.5 15.7 14.3
PV of contingent liabilities (not included in public sector debt) ... ... ... ... ... ... ... ... ... ... ...Gross financing need 2/ 5.5 7.8 5.9 4.3 3.7 3.1 3.1 3.0 3.2 2.3 2.6PV of public sector debt-to-revenue and grants ratio (in percent) … … 211.6 206.8 202.4 199.2 188.6 177.0 167.1 125.5 90.3PV of public sector debt-to-revenue ratio (in percent) … … 216.2 210.9 205.5 202.1 191.1 179.2 169.1 126.7 91.1
of which: external 3/ … … 132.0 131.4 133.3 131.5 126.6 121.5 116.3 96.9 84.2Debt service-to-revenue and grants ratio (in percent) 4/ 8.7 17.2 11.3 15.7 16.1 15.1 14.5 14.2 15.0 7.8 8.3Debt service-to-revenue ratio (in percent) 4/ 8.7 17.6 11.6 16.1 16.3 15.3 14.7 14.3 15.2 7.9 8.3Primary deficit that stabilizes the debt-to-GDP ratio -6.4 3.9 -0.8 1.4 1.2 1.3 2.1 2.2 2.3 2.1 1.5
Key macroeconomic and fiscal assumptionsReal GDP growth (in percent) 5.7 4.5 3.2 4.2 1.2 4.0 4.5 4.8 5.0 5.2 5.4 4.8 5.4 5.5 5.4Average nominal interest rate on forex debt (in percent) 1.8 3.6 3.4 3.0 0.5 2.4 2.5 2.4 2.4 2.4 2.1 2.4 1.7 1.8 1.7Average real interest rate on domestic debt (in percent) 1.3 1.1 2.8 -0.5 2.2 2.6 1.4 1.7 0.7 0.8 0.3 1.2 -1.5 4.7 0.5Real exchange rate depreciation (in percent, + indicates depreciation) 16.8 6.4 -9.0 2.7 8.6 -4.0 ... ... ... ... ... ... ... ... ...Inflation rate (GDP deflator, in percent) 0.2 0.0 0.4 2.0 1.9 0.5 1.3 1.5 1.5 1.6 1.6 1.3 1.7 1.8 1.8Growth of real primary spending (deflated by GDP deflator, in percent) 6.4 3.1 -0.7 0.9 2.2 -6.0 0.9 1.4 6.5 5.8 6.2 2.5 5.7 4.8 6.0Grant element of new external borrowing (in percent) ... ... ... … … 35.0 34.9 32.5 32.6 32.6 32.6 33.3 32.6 32.6 ...
Sources: Country authorities; and staff estimates and projections.1/Coverage includes the central government and certain SOEs. Gross debt is used.2/ Gross financing need is defined as the primary deficit plus debt service plus the stock of short-term debt at the end of the last period. 3/ Revenues excluding grants.4/ Debt service is defined as the sum of interest and amortization of medium and long-term debt.5/ Historical averages and standard deviations are generally derived over the past 10 years, subject to data availability.
Actual Projections
CAMEROON
14 INTERNATIONAL MONETARY FUND
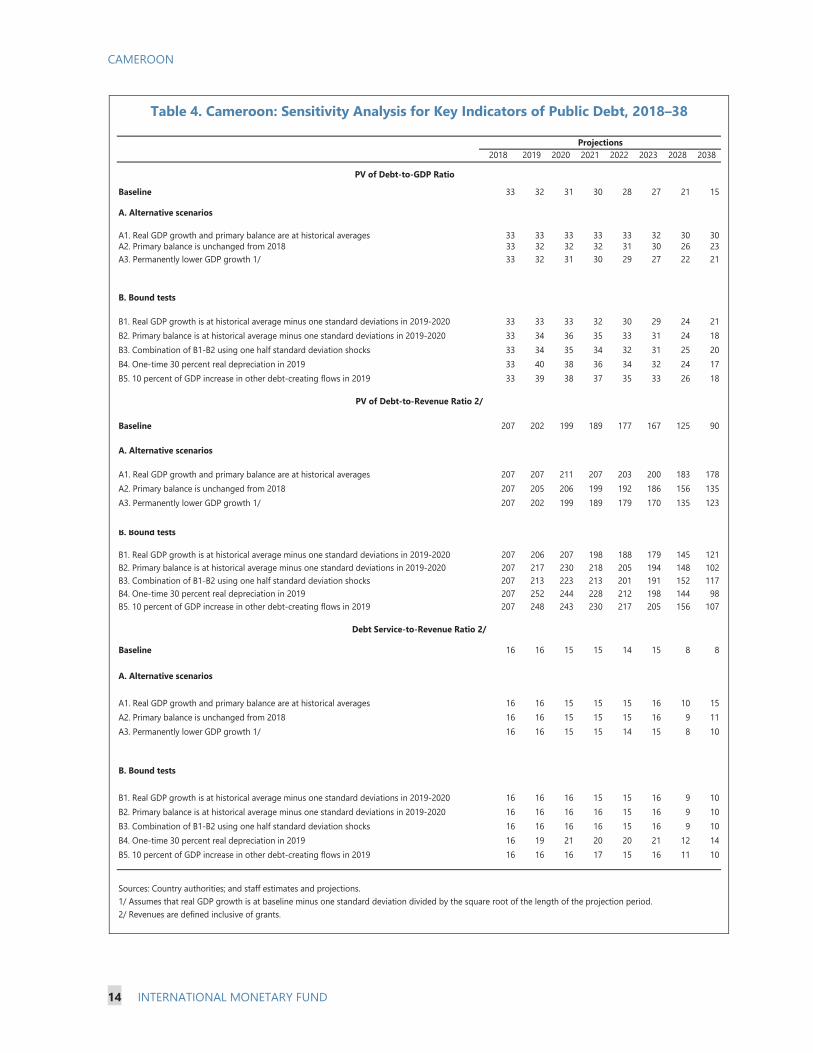
Table 4. Cameroon: Sensitivity Analysis for Key Indicators of Public Debt, 2018–38
2018 2019 2020 2021 2022 2023 2028 2038
Baseline 33 32 31 30 28 27 21 15
A. Alternative scenarios
A1. Real GDP growth and primary balance are at historical averages 33 33 33 33 33 32 30 30A2. Primary balance is unchanged from 2018 33 32 32 32 31 30 26 23A3. Permanently lower GDP growth 1/ 33 32 31 30 29 27 22 21
B. Bound tests
B1. Real GDP growth is at historical average minus one standard deviations in 2019-2020 33 33 33 32 30 29 24 21B2. Primary balance is at historical average minus one standard deviations in 2019-2020 33 34 36 35 33 31 24 18B3. Combination of B1-B2 using one half standard deviation shocks 33 34 35 34 32 31 25 20B4. One-time 30 percent real depreciation in 2019 33 40 38 36 34 32 24 17B5. 10 percent of GDP increase in other debt-creating flows in 2019 33 39 38 37 35 33 26 18
Baseline 207 202 199 189 177 167 125 90
A. Alternative scenarios
A1. Real GDP growth and primary balance are at historical averages 207 207 211 207 203 200 183 178A2. Primary balance is unchanged from 2018 207 205 206 199 192 186 156 135A3. Permanently lower GDP growth 1/ 207 202 199 189 179 170 135 123
B. Bound tests
B1. Real GDP growth is at historical average minus one standard deviations in 2019-2020 207 206 207 198 188 179 145 121B2. Primary balance is at historical average minus one standard deviations in 2019-2020 207 217 230 218 205 194 148 102B3. Combination of B1-B2 using one half standard deviation shocks 207 213 223 213 201 191 152 117B4. One-time 30 percent real depreciation in 2019 207 252 244 228 212 198 144 98B5. 10 percent of GDP increase in other debt-creating flows in 2019 207 248 243 230 217 205 156 107
Baseline 16 16 15 15 14 15 8 8
A. Alternative scenarios
A1. Real GDP growth and primary balance are at historical averages 16 16 15 15 15 16 10 15A2. Primary balance is unchanged from 2018 16 16 15 15 15 16 9 11A3. Permanently lower GDP growth 1/ 16 16 15 15 14 15 8 10
B. Bound tests
B1. Real GDP growth is at historical average minus one standard deviations in 2019-2020 16 16 16 15 15 16 9 10B2. Primary balance is at historical average minus one standard deviations in 2019-2020 16 16 16 16 15 16 9 10B3. Combination of B1-B2 using one half standard deviation shocks 16 16 16 16 15 16 9 10B4. One-time 30 percent real depreciation in 2019 16 19 21 20 20 21 12 14B5. 10 percent of GDP increase in other debt-creating flows in 2019 16 16 16 17 15 16 11 10
Sources: Country authorities; and staff estimates and projections.1/ Assumes that real GDP growth is at baseline minus one standard deviation divided by the square root of the length of the projection period.2/ Revenues are defined inclusive of grants.
PV of Debt-to-GDP Ratio
Projections
PV of Debt-to-Revenue Ratio 2/
Debt Service-to-Revenue Ratio 2/