cambridge working p aper s in economics cambridge working
TRANSCRIPT

Cambridge Working Papers in Economics: 1942
NETWORK UTILITIES PERFORMANCE AND INSTITUTIONAL QUALITY: EVIDENCE FROM THE
ITALIAN ELECTRICITY SECTOR
Golnoush Soroush
Carlo Cambini
Tooraj Jamasb
Manuel Llorca
14 May 2019
It is generally accepted that institutions are important for economic development. However, whether the performance of regulated utilities within a country is affected by the quality of institutions is yet to be investigated thoroughly. We analyse how the quality of regional institutions impact performance of Italian electricity distribution utilities. We use a stochastic frontier analysis approach to estimate cost functions and examine the performance of 108 electricity distribution utilities from 2011 to 2015. This unique dataset was constructed with the help of the Italian Regulator for Energy, Networks, and Environment. In addition, we use a recent dataset on regional institutional quality in Italy. We present evidence that utilities in regions with better government effectiveness, responsiveness towards citizens, control of corruption, and rule of law, also tend to be more cost efficient. The results suggest that national regulators should take regional institutional diversity into account in incentive regulation and efficiency benchmarking of utilities.
Cambridge Working P apers in Economics
Faculty of Economics

www.eprg.group.cam.ac.uk
Network Utilities Performance and Institutional Quality: Evidence from the Italian Electricity Sector
EPRG Working Paper 1914
Cambridge Working Paper in Economics 1942
Golnoush Soroush, Carlo Cambini, Tooraj Jamasb, Manuel Llorca
Abstract It is generally accepted that institutions are important for economic development. However, whether the performance of regulated utilities within a country is affected by the quality of institutions is yet to be investigated thoroughly. We analyse how the quality of regional institutions impact performance of Italian electricity distribution utilities. We use a stochastic frontier analysis approach to estimate cost functions and examine the performance of 108 electricity distribution utilities from 2011 to 2015. This unique dataset was constructed with the help of the Italian Regulator for Energy, Networks, and Environment. In addition, we use a recent dataset on regional institutional quality in Italy. We present evidence that utilities in regions with better government effectiveness, responsiveness towards citizens, control of corruption, and rule of law, also tend to be more cost efficient. The results suggest that national regulators should take regional institutional diversity into account in incentive regulation and efficiency benchmarking of utilities. Keywords Institutional quality; stochastic frontier analysis; electricity distribution
in Italy; cost efficiency; inefficiency determinants. JEL Classification D22, L51, L94, O43
Contact [email protected] Publication April 2019 Financial Support Carlo Cambini and Golnoush Soroush gratefully acknowledge EU’s
H2020 research and innovation project: PLANET (Planning and operational tools for optimizing energy flows and synergies between energy networks), Grant Agreement No. 773839.

1
Network Utilities Performance and Institutional Quality:
Evidence from the Italian Electricity Sector
Golnoush Soroush a*, Carlo Cambini a, Tooraj Jamasb b, Manuel Llorca b
a Department of Management, Politecnico di Torino, Italy
b Durham University Business School, Durham University, UK
Abstract
It is generally accepted that institutions are important for economic development.
However, whether the performance of regulated utilities within a country is affected
by the quality of institutions is yet to be investigated thoroughly. We analyse how the
quality of regional institutions impact performance of Italian electricity distribution
utilities. We use a stochastic frontier analysis approach to estimate cost functions and
examine the performance of 108 electricity distribution utilities from 2011 to 2015.
This unique dataset was constructed with the help of the Italian Regulator for
Energy, Networks, and Environment. In addition, we use a recent dataset on regional
institutional quality in Italy. We present evidence that utilities in regions with better
government effectiveness, responsiveness towards citizens, control of corruption,
and rule of law, also tend to be more cost efficient. The results suggest that national
regulators should take regional institutional diversity into account in incentive
regulation and efficiency benchmarking of utilities.
Keywords: institutional quality; stochastic frontier analysis; electricity distribution
in Italy; cost efficiency; inefficiency determinants.
JEL classification: D22, L51, L94, O43.
* Corresponding author: Department of Management, Politecnico di Torino, Turin, 10129, Italy. E-mail: [email protected]

2
1. Introduction
Over the past three decades and in particular since the seminal work by North (1990), impact
of institutions on economic development has been investigated and confirmed by empirical
studies. More recently, the same trend is observed for the impact of macro-level factors on
firms’ total factor productivity (Lasagni et al., 2015). However, whether the performance of
regulated network utilities can also be affected by the quality of institutions has been explored
to a lesser degree. Recently, a few studies have examined this issue (Jamasb et al., 2018;
Borghi et al., 2016; Nyathikala et al., 2018). These studies highlight how economic and
technical efficiency by utilities can be hindered due to poor quality of institutions.
However, there is a need for more research on this subject as some questions remain. For
instance, whether the variations of utilities’ efficiency in developed economies, despite their
relative technical advantage, is influenced by the quality of institutions. Is it possible to trace
the performance of utilities within a country to regional institutional characteristics alongside
the geographical and economic differences? Do national energy regulators need to consider
the diversity in quality of regional institutions in incentive regulation and efficiency
benchmarking of network utilities? In this paper we aim to provide a better insight to
regulators on these issues by analysing the performance of the Italian electricity distribution
utilities.
In the 1990s, electricity sector reform processes began around the world aiming at promoting
privatisation and liberalisation in network industries (Armstrong et al., 1994). Due to
technical characteristics as well as high sunk investment costs, the distribution networks of
the electricity industry have traditionally been regarded as natural monopolies. Since the
distribution network can be largely exposed to market failures, it is more efficient to regulate
this segment of the electricity network rather than relying on a competitive setting (Giannakis
et al., 2005). Therefore, as the reform processes started, independent sector regulators were
established to ensure fair treatment of consumers as well as efficiency improvements (Jamasb
and Pollitt, 2007). In this context, incentive-based mechanisms and efficiency benchmarking
methods have been widely used by many sector regulators to evaluate the performance of
distribution network utilities.
3
Despite almost three decades of electricity sector reforms, the performance of utilities across
different regions of countries around the world seems to be diverse and non-homogenous.1
This lack of homogeneity can be linked to geographical differences (Cambini et al., 2016),
diverse weather conditions (Llorca et al., 2016) as well as economic development (Jamasb et
al., 2018). However, not only technical, economic, and geographical measures may affect
firms’ efficiency. Regional and local institutional settings, in which regulated firms operate,
might also influence firms’ overall performance. Hence, it is worthy to explore whether
regional institutional measures might also impact performance of network utilities across a
country.
Italy was among the first countries to reform the electricity sector in 1990s. The Italian
Regulatory Authority for Energy, Networks and the Environment (Autorità di Regolazione
per Energia, Reti e Ambiente, ARERA) was established in 1995 to promote competition in
the electricity generation sector as well as ensuring efficiency and quality of services provided
by the utilities active in the transmission and distribution sectors. To this aim, ARERA has
applied incentive-based mechanisms since 2002 to encourage utilities to improve their
productive efficiency and improve service quality measures such as continuity of supply.
After nearly two decades of reforms, although the Italian power system is considered to be
one of the most developed in the world, the electricity distribution sector in Italy exhibits
persistent inefficiency and service quality issues across the regions of the country.
Meanwhile, regional differences between northern and southern regions raise the question
whether the dissimilar levels of economic development and differences in quality of
institutions, also affect the performance of electricity distribution utilities.
In this paper we aim to answer this question by examining the impact of regional-level
institutional quality on the efficiency of the Italian electricity distribution utilities from 2011
to 2015. We use a novel and high-quality dataset that has been constructed with the help of
ARERA, allowing us to use regulatory accounting data on network distribution segment, i.e.,
the regulated segments, excluding the potentially competitive activities. We complement this
data with information on quality of institutions at regional-level from Nifo and Vecchione
(2014). Due to the historical socioeconomic gap between northern and southern areas, Italy is
an ideal case study to explore the potential link between economic and institutional
1 For instance, this is the case for the Indian electricity distribution utilities (Jamasb et al., 2018). In Italy, there is
a wide gap between performance of utilities located in northern and southern regions (Cambini et al., 2014).

4
endowments, and performance of network utilities. We use a set of Stochastic Frontier
Analysis (SFA) models to estimate cost functions that allow us to examine the impact of
regional-level economic and institutional factors on cost efficiency of the electricity
distribution utilities in the country.
The paper is organised as follows. Section 2 provides an overview of the literature on the
impact of quality of institutions on performance of firms, in particular electric utilities. In
Section 3 we present a brief institutional background of the Italian electricity industry.
Section 4 discusses the estimation methodology and the models we use in this paper. In
Section 5 we present the dataset and how the variables are structured. We present and discuss
the estimation results in Section 6. Finally, in Section 7 conclusions and policy implications
are provided.
2. Literature Review
The role of institutions in economic development was first acknowledged by North (1990). In
the past three decades, a large number of studies on the impact of institutional quality on
economic development have been published. Using regional and cross-country data, several
studies provide empirical evidence that a higher quality of institutions translates into higher
rates of economic growth (Easterley and Levine, 2003; Acemoglu and Robinson, 2008;
Chanda and Dalgaard, 2008; Grigorian and Martinez, 2002). Hall and Jones (1999) define
institutions and government policies as the social infrastructure driving differences between
countries in terms of capital accumulation and productivity. Acemoglu et al. (2001; 2002),
focuses on countries which experienced European colonialism and finds a strong relationship
between good institutions and higher income per capita.
Kim and Law (2012) examine the relationship between institutions and local-urban
development in the Americas and conclude that spatial economic development is affected by
institutional factors such as political centralisation. Gyimah-Brempong and de Camacho
(2006) use a sample of 61 countries with diverse economic development levels to take a
closer look at the regional differences in terms of impact of corruption, as an institutional
measure, on economic development. They find strong evidence suggesting that regional
differences in growth and income distribution can be traced back to the level of corruption in
different regions and countries.

5
Impact of institutions on firm-level economic activity on the other hand, has been of interest
for researchers in recent years. How institutions impact investment patterns in human and
physical capitals and consequently on firms’ productivity has been investigated by several
studies (Mankiw et al., 1992; Ketterer and Rodriguez-Pose, 2012 and Rodrik et al., 2004).
Eicher et al. (2006) suggest that institutions affect factor productivity and better institutions
improve output through physical capital. Dollar et al. (2005) consider investment environment
as a proxy for institutions and highlight the differences between the investment climate across
countries and their regions. They confirm that a better investment climate induces a higher
firm productivity. Lensink and Meesters (2014) use cross-country data to confirm how well-
developed institutions result in a more efficient operation of commercial institutions.
While the relationship between quality of institutions and overall economic growth or firms’
productivity has been investigated by some studies, whether the same relationship exists in
specific sectors and specific regions of a country is a less explored topic in the literature. In
particular, the impact of countries’ institutional settings on performance of regulated firms,
active in different segments of network industries, has not been investigated yet. In this
regard, electricity transmission and distribution networks, due to their technological
characteristics, are appropriate choices to examine if such a relationship exists. Electricity
distribution networks are natural monopolies and therefore subjected to economic regulation.
The infrastructure design is relatively similar throughout the whole network. Thus, the
sources of inefficiency and unobserved heterogeneity in this sector might be traced back to
structural and environmental factors that are out of firms’ control, as well as how utilities
manage their resources rather than pure technological differences.
Although the literature on determinants of firms’ performance in electricity distribution is
quite rich, empirical evidence on whether institutional quality can be considered as one of the
sector’s sources of inefficiency is scant. The main drawback is due to the fact that the
electricity sector is facing reform processes around the world and as a consequence, reforms
have been widely considered as a proxy for the institutional environment in the literature.
Consequently, a large body of research has focused on how regulatory reforms impact
performance of utilities (see, e.g., Pombo and Taborda, 2006; Andres et al., 2008; Stern and
Cubbin, 2005). Impact of reforms has been denoted as the general impact of institutions in

6
such studies. However, institutions can be defined by various proxies and therefore, taking
reforms as the only measure of the country’s institutional settings can result in misleading
conclusions.
Another gap in the literature is the lack of empirical evidence on the impact of ‘local/regional
institutions’ on performance of electricity utilities located in different regions of a country.
This is mainly due to the fact that data on quality of institutions at regional level is not as
accessible as country-level data. Consequently, the majority of analysis looks at inter-country
differences rather than inter-regional diversity (Bortolotti et al., 2013). Within this
framework, it is worth summing up a brief review of the literature on the impact of
institutions (and/or their corresponding proxies) on performance of the electricity sector.
Bergara et al. (1998) is one of the first to shed light on this subject. They investigate the
impact of political institutions on investments in the electricity industry. Using a cross-nation
analysis, they show that a well-defined political institution can enhance electricity generation
capacity. More recently Dramani and Tewari (2014) find similar result for electricity sector
performance in Ghana. Balza et al. (2013), examines how reforms affect performance of the
electricity sector in 18 Latin American countries. Their results show that credible sectoral
institutions, in particular regulatory quality, play a central role in the industry’s performance
improvements. On the contrary, Durakoglu (2011), studying the Turkish electricity
distribution sector, suggests that regulatory governance itself can be affected by political
endowments and therefore having a good regulatory content does not necessarily translate
into a successful reform. This result is in line with what has been discussed earlier by Rodrik
(2003) arguing that a sound reform process, which has the potential to encourage productive
firms, requires a sound institutional framework as well.
Nepal and Jamasb (2012; 2013) discuss the existence of the same rationale for the electricity
sector reforms and suggest that the success of reforms depends not only on micro and macro
factors but also on the country’s institutional factors as well as reforms in other sectors of the
economy. Erdogdu (2013) uses a cross-country analysis and shows that electricity reforms are
more effective in countries with higher institutional quality. Focused on the relationship

7
between the quality measures of institutions2 and efficiency of the electricity sector, Dal Bo
and Rossi (2007) investigate whether corruption can be considered as an inefficiency
determinant for electricity utilities. Using cross-country data from Latin America they find
evidence that higher levels of corruption translate into a higher number of inefficient firms.
Estache et al. (2009), consider corruption as a proxy of the whole institutional quality and
suggest that reforms can only reduce impact of corruption on performance of regulated firms
to some extent. They confirm the impact of institutional quality on reforms by showing that
with high levels of corruption reforms are not effective.
Borghi et al. (2016) analyse electricity distribution firms in 16 EU countries to explore how
the interaction between ownership and quality of government affects firm-level efficiency.
They find that where measures of government quality are higher, public firms show higher
efficiency scores, while with poor quality of institutions private firms seem to be more
productive. Their analysis, however, examines country-level data rather than regional-level
data within a single country as we do in our analysis.
Jamasb et al. (2018) study the Indian electricity distribution sector and examine a set of
proxies representing quality of institutions to examine whether state-level economic factors
and institutional quality affect firms’ performance. They find that state-level economic and
institutional characteristics have an impact on efficiency of firms. However, in their work the
authors use a set of metrics that can be considered only as relatively distant proxies for quality
of institutions. They use an index of Human Development and political rules (e.g., the number
of Times the Chief Minister Headed the Coalition Government or the President imposes ad
hoc rules3) which are not exactly a measure of the overall institutions in a region or state. In
our paper, instead, we use regional institutional quality measures that are constructed based
on World Governance Indicators and are directly link to the law system, the degree of
corruption, and political stability, and that therefore directly measure the quality of regional
institutions within a country.
2 By quality measures of institutions, we refer to the World Governance Indicators proposed by Kaufmann et al.
(1999), widely recognised and used as a measurement and comparison tool. The six dimensions of governance
are: Voice and Accountability, Political Stability and Lack of Violence, Government Effectiveness, Regulatory
Quality, Rule of Law, and Control of Corruption. 3 In the Republic of India, “Article 356 provides for the imposition of President’s Rule in States to combat a
situation ‘in which the Government of the State cannot be carried on in accordance with the provisions of the
constitution’” (Arora, 1990, p.1).

8
3. The Italian electricity sector and institutional context
Italy was among the first countries to start the reform process of the electricity sector in the
1990s. The Italian national regulator, currently named Regulatory Authority for Energy,
Networks and the Environment (ARERA) was established in 1995 with the aim to promote
competition in the electricity generation sector and ensure efficiency and higher quality of
services provided by transmission and distribution utilities. The primary objective of the
reforms in Italy was to liberalise the electricity market and to move from a monopolistic
structure towards an open economic sector where competition was possible. Prior to the
reforms, Enel, the largest electricity utility in Italy, was owned by the Ministry of Economy
and had monopoly of the entire electricity sector. In 1999, following the legislative decree n.
79/1999, known as the ”Bersani Decree”, Enel was forced to unbundle its generation,
transmission, and distribution activities and to share its transmission and distribution
infrastructures with a few competitors including Endesa Italia, Edipower and Tirreno Power.
Until 2002, under the unbundling rule, monopolistic (i.e., distribution and transmission) and
competitive (i.e., electricity generation and trading) corporate activities were totally separated.
The primary objective of the reforms was achieved in 2007 when following the ongoing
electricity sector privatisation and liberalisation actions, the sector was announced to be
completely open to private customers.
ARERA has applied incentive-based mechanisms since 2002 to encourage utilities to improve
their productive efficiency and quality of service. However, despite nearly two decades of
reforms and regulatory efforts to enhance efficiency as well as quality of service standards in
Italy, there exist persistent inefficiency and service quality issues across the regions of the
country. Utilities in northern parts of Italy seem to use their resources more efficiently relative
to those in southern and central areas and consequently, performance metrics of utilities
located in different regions are widely dispersed (Cambini et al., 2014; Capece et al., 2013).
The sector also suffers from high number of interruptions, in particular in the southern part of
the country (ARERA, 2017).
These persistent issues suggest the existence of exogenous factors which can stall continuous
efficiency and quality improvements. In Italy differences in environmental characteristics
including weather situations, area covered by forests, or coastal locations are among the
factors leading to diverse efficiency scores across the country (Cambini et al., 2016).

9
However, the differences between northern and southern regions raise the question whether
dissimilar economic development levels and differences in quality of institutions, can affect
performance of electricity distribution utilities. Identifying roots of development difference
between northern and southern regions has been a macro-level research topic for a long time.
Meanwhile, the difference in performance of firms in north and south has attracted some
attention from researchers. Lasagni et al. (2015) use the regional Institutional Quality Index
(IQI), constructed by Nifo and Vecchione (2014), to examine how regional quality of
institutions impact total factor productivity of the Italian manufacturing firms. They find that
better business environment and institutional context improve firm-level productivity.
Nonetheless, impact of institutions on the Italian electricity sector has not been investigated.
Few studies have investigated efficiency of the energy sector in Italy. Capece et al. (2013)
analyse the Italian energy sector using energy utilities’ financial information and conclude
that performances of utilities in northern and southern areas of the country are widely
unequal. More specifically, previous research on the Italian electricity distribution sector (see
Fumagalli and Lo Schiavo, 2009; Cambini et al., 2014; 2016) mostly focuses on the
evaluation of output-based incentive mechanisms with respect to quality of service and not
necessarily on efficiency analysis of the sector. Moreover, two of these studies, Cambini et al.
(2014; 2016), only use the data available on Enel activities, and not the remaining Italian
utilities, which is the data utilised in this work.
This paper aims to fill the gap in the literature on how quality of local institutions impact
performance of utilities across a country while it gives an insight into performance of Italian
electricity distribution utilities. The novelty of this work is twofold. First, we use take a novel
and unique regulatory accounting dataset on the Italian electricity distribution utilities made
available to the authors by ARERA. Second, we use regional institutional quality measures,
constructed based on World Governance Indicators, to examine impact of quality of local
institutions on performance of regulated network utilities.
4. Methodology
When analysing performance of utilities, it is common to estimate either variable or total cost
functions (Filippini and Wetzel, 2014). In addition, in the electricity sector, frontier
approaches are widely used for benchmarking objectives as well as estimating technical,

10
allocative, and cost efficiency.4 Among the parametric and nonparametric frontier approaches
that are frequently utilised, Stochastic Frontier Analysis (SFA) and Data Envelopment
Analysis (DEA) are respectively the two most used to analyse the efficiency of the electricity
transmission and distribution utilities. In practice, the choice between parametric and
nonparametric approaches depends on the research or the regulatory objectives (see Coelli et
al., 2005).
Our goal in this paper is to identify macro-level inefficiency determinants of the electricity
distribution sector. With that aim, we estimate a total cost function using an SFA approach.
Considering that firms are cost-minimising entities, a total cost function can be written as:
𝑇𝐶 = 𝑓(𝑦, 𝑝, 𝑥, 𝛽) (1)
where 𝑇𝐶 is firms’ total costs, 𝑦 represents outputs including energy delivered, number of
customers, and average duration of interruptions per customer, 𝑝 is the vector of input prices
including capital and labour prices, 𝑥 stands for the control variables, and 𝛽 represents the
parameters to be estimated. The total cost function must be non-decreasing in outputs and
input prices, and linearly homogeneous with respect to input prices.
We use a heteroscedastic SFA model to estimate a total cost function using an unbalanced
panel dataset.5 This approach allows us to estimate the cost efficiency of the utilities, while
taking into account the impact of quality of institutions as inefficiency determinants. The
original form of stochastic frontier models was first introduced simultaneously by Aigner et
al. (1977) (ALS henceforth) and Meeusen and van den Broeck (1977). The random term in
these models includes two components incorporating statistical noise and inefficiency. Pitt
and Lee (1981) and Schmidt and Sickles (1984) applied SFA models to panel data to interpret
random and fixed effects as inefficiency rather than unobserved heterogeneity (Farsi et al.,
2005). These models, however, consider the inefficiency term to be time-invariant meaning
that the inefficiency level of each firm remains unchanged over time, which is considered to
be an unrealistic assumption (Kumbhakar et al., 2015). Later, Kumbhakar (1990) and Battese
and Coelli (1992) proposed models which allow including time-varying inefficiency terms.
4 See Farsi and Filippini (2009) for a review of studies on cost function estimation and frontier approaches. 5 SFA is considered to be easily applied to panel datasets (Farsi and Filippini, 2009).

11
The general form of a stochastic cost frontier can be presented as follows:
ln 𝑇𝐶𝑖𝑡 = ln 𝑓(𝑦𝑖𝑡, 𝑝𝑖𝑡, 𝑥𝑖𝑡 , 𝛽) + 𝑣𝑖𝑡 + 𝑢𝑖𝑡 (2)
where 𝑖 denotes the firm and 𝑡 stands for time, 𝑣 is the statistical noise term, which follows a
normal distribution and 𝑢 is an inefficiency term that captures firms’ cost inefficiency and can
follow a range of distributions, such as the half-normal, the truncated normal or the
exponential.
It should be noted that the original models by Aigner et al. (1977) and Meeusen and van den
Broeck (1977) do not allow to analyse the presence of factors that may influence firms’
efficiency. Diverse models have been developed in the SFA literature to address this relevant
issue (for a summary see Alvarez et al., 2006; Lai and Huang, 2010; or Llorca et al., 2016).
Some of these models fulfil the so-called scaling property, which implies that the inefficiency
term can be decomposed in the following way:
𝑢𝑖𝑡(𝑧𝑖𝑡, 𝛿) = ℎ(𝑧𝑖𝑡, 𝛿) ∙ 𝑢𝑖𝑡∗ (3)
where 𝑢𝑖𝑡∗ is a random variable that captures firm’s base efficiency level and ℎ(𝑧𝑖𝑡, 𝛿), which
represents the scaling function. In these models, the efficiency level of firms depends on 𝑢𝑖𝑡∗
and its scale changes by a function of 𝑧𝑖𝑡, i.e., the environmental variables. This is in fact the
specific feature of the scaling property: the scaling function only changes the scale of the
inefficiency term and not its shape which is determined by the basic random variable (Alvarez
et al., 2006). Therefore, as emphasised by Llorca et al. (2016), the scaling function is
responsible for adjusting the level of inefficiency upwards or downwards under the influence
of inefficiency determinants.
Among the models which fulfil the scaling property, in this paper we follow the model of
Reifschneider and Stevenson (1991), Caudill and Ford (1993), and Caudill et al. (1995).5 In
5 It should be noted that the inefficiency determinants can be introduced in the SFA models through the pre-
truncation mean (see, e.g., Battese and Coelli, 1995) and/or the pre-truncation variance (see, e.g., Reifschneider
and Stevenson, 1991; or Caudill and Ford, 1993) of the inefficiency term. Where to include these inefficiency
determinants and the final choice of the model depends strongly on the characteristics of the dataset itself. In
particular, we also estimated the panel data model of Battese and Coelli (1995), as well as the model of Battese
and Coelli (1992). However, we experienced lack of convergence with these models.

12
this model (RSCFG henceforth) the inefficiency term, 𝑢𝑖𝑡, follows a half-normal function
while the scaling function, ℎ(𝑧𝑖𝑡, 𝛿), takes an exponential functional form. Therefore, the
inefficiency term can be rewritten as:
𝑢𝑖𝑡(𝑧𝑖𝑡, 𝛿) = exp(𝑧𝑖𝑡′ 𝛿) ∙ 𝑢𝑖𝑡
∗ (4)
Consequently, the final total cost function to be estimated will be as follows:
ln 𝑇𝐶𝑖𝑡 = ln 𝑓(𝑦𝑖𝑡, 𝑝𝑖𝑡, 𝑥𝑖𝑡 , 𝛽) + 𝑣𝑖𝑡 + exp(𝑧𝑖𝑡′ 𝛿) ∙ 𝑢𝑖𝑡
∗ (5)
As for the functional form, both Cobb-Douglas and translogarithmic (translog) flexible
functional forms are estimated in this work. The flexibility feature of these functional forms
corresponds to the fact that the signs of the first and second-order approximations are not set
ex-ante (Ramos-Real, 2005). After comparing the two functional forms taking into account
the goodness of fit, the translog model is selected to include the inefficiency determinants.
Further details on the final estimated functional form is provided in the next section.
5. Data and Model Specification
For our analysis we use a unique dataset of 108 utilities active in the Italian electricity
distribution sector, from 2011 to 2015, in 15 Italian regions,6 based in 3 geographic areas.7
The firm-level data8 comprises regulatory accounting data on network distribution segment
only (i.e., they do not include potentially competitive activities such as commercialisation9),
as well as data on physical aspects of the electricity distribution networks owned by the
utilities (e.g., energy delivered, length of lines, number of customers, number of
transformers). These data were collected and exclusively made available to the authors by
6 The regions are: Piemonte, Lombardia, Liguria, Veneto, Trentino Alto Adige, Valle d’Aosta, Abruzzo, Marche,
Emilia Romagna, Friuli Venezia Giulia, Sicilia, Sardegna, Puglia, Lazio and Umbria. 7 Since 2000, for regulatory purposes, ARERA divides the Italian territory into three areas or circoscrizioni:
north, centre, and south (Cambini et al., 2014). We use the same geographical classification to recognise the
locational and geographical diversity. 8 A detailed description of variables extracted from the dataset collected by ARERA as well as variables
extracted from other resources is presented in Appendix A. 9 Following Directive 96/92/CE of 1996 and under the unbundling rule, competitive and monopolistic corporate
activities are separated in the electricity sector across the European Union.

13
ARERA.10 The data on quality of service (average frequency and average duration of
interruptions per customer) is available from the ARERA online database.
After data cleaning, removing missing values, and dropping outliers, we obtained an
unbalanced panel with a total number of 237 observations. One outlier in the final analysis is
Enel (E-Distribuzione) and its corresponding regulatory and physical data. Enel owns about
86% of the Italian electricity distribution network and operates in almost all Italian regions,
with 115 operating districts in total (Cambini et al., 2014). However, the dataset in hand
contained only information on Enel activities as one unit, which converts it in an outlier due
to its large operation domain compared to other utilities in the sample. Therefore, we first
perform our analysis by excluding the country-wide Enel but, for testing the robustness of our
analysis, we then re-run our estimates including Enel again. The data on economic
development measures are at regional-level and extracted from ISTAT11 and Eurostat12 online
databases. In particular, we selected regional Gross Value Added and regional employment
rate as regional-level economic development characteristics which can potentially affect firm-
level efficiency.
In order to assess the impact of institutional quality on performance of the electricity
distribution utilities in Italy, we use a database on institutional quality measures constructed
by Nifo and Vecchione (2014).13 Following the same framework proposed by Kaufmann et al.
(2011) to construct the World Governance Indicators, they developed the Institutional Quality
Index (IQI) for each of the Italian regions. In particular, they used 24 elementary indexes14 to
construct 5 key dimensions of quality of governance: voice and accountability, government
effectiveness, rule of law, regulatory quality, and corruption. They then use a weighted
average of these 5 categories to construct IQI which captures the overall quality of institutions
in each of the Italian regions. The regional scale of these indexes gives us the possibility to
examine whether the differences in performance of utilities located in various regions of a
country can be explained by the differences in quality of regional institutions.
10 Under the accounting separation obligations (CAS, Conti Annuali Separati), ARERA requires distribution
utilities to collect and submit their annual regulatory accounting statements to the online repository of the
authority. 11 Istituto Nazionale di Statistica, ISTAT, is the Italian national institute of statistics which collects and produces
social, economic, and environmental statistical information in Italy. It is accessible at: www.istat.it. 12 Eurostat database is accessible at: https://ec.europa.eu/eurostat/data/database. 13 The database is available at: https://siepi.org/en/institutional-quality-index-dataset-disponibile/. 14 See Nifo and Vecchione (2014) for a detailed description of the indexes.

14
Table 1 reports descriptive statistics of the variables utilised in this study (excluding Enel
figures).15 As expected, due to the unbalanced nature of our sample, the range (the difference
between minimum and maximum values) of output and input variables is quite large. This,
once again, indicates the diverse operational characteristics of the utilities ranging from small
(with 10 consumers) to large (over 1.5 million consumers) utilities. The same is observed for
price of labour. Due to technical characteristics of distribution networks, utilities can
outsource most of their operational activities. Therefore, the wide gap between minimum and
maximum labour prices can be linked to either the operational extent of the firms or their
outsourcing strategies.
Table 1. Descriptive Statistics
Variable Unit Min. Max. Mean Std. Dev.
Totex Euros (2010) 5,656 315,185,156 11,209,170 39,082,340
ENED MWh 673 11,334,422 393,498 1,573,321
CUST No of Customers 10 1,626,019 51,661 206,264
SAIDI Minutes 0.01 8,067 125.84 429.86
LPR Euros (2010) 200 265,430 52,935 28,226
KPR Euros (2010) 0.01 21,466 1,871 1,811
North Dummy 0 1 0.87 0.33
Centre Dummy 0 1 0.08 0.27
South Dummy 0 1 0.05 0.21
Mount Dummy 0 1 0.78 0.41
Corp Dummy 0 1 0.78 0.41
Emp_Rate % 39 68.72 65.58 5.28
GVA Euros (2010) 14,295 33,822 30,273 4,854
Voice Index 23 65 48.62 7.44
RoL Index 30 81.70 69.84 12.17
Gov_Eff Index 17.40 61.40 46.50 7.46
Corru_Ctrl Index 61.40 97.30 90.43 5.86
15 Table B.1. in Appendix B presents descriptive statistics of variables with respect to the three areas in which
utilities are located: north, centre, and south.

15
We use four dimensions of the governance quality as institutional inefficiency determinants of
the electricity distribution sector: control of corruption, voice and accountability, rule of law,
and government effectiveness. We do not include regulatory quality in our analysis. This
index captures the ability of government in implementing its policies. However, since
ARERA, the Italian energy and networks authority, is an independent entity from the
government, we decided that the regulatory quality index is not relevant to our analysis.
Following the discussion in Section 4, the econometric specification of our model that takes
the translog functional form can be presented as follows:
ln (𝑇𝑜𝑡𝑒𝑥𝑖𝑡
𝐿𝑃𝑅𝑖𝑡) = 𝛼 + ∑ 𝛽𝑛 ln 𝑦𝑛𝑖𝑡 + 𝛽𝐾 ln (
𝐾𝑃𝑅𝑖𝑡
𝐿𝑃𝑅𝑖𝑡)3
𝑛=1 + ∑ ∑ 𝛽𝑛𝑚 ln 𝑦𝑛𝑖𝑡3𝑚=1
3𝑛=1 ln 𝑦𝑚𝑖𝑡 +
1
2𝛽𝐾𝐾 [ln (
𝐾𝑃𝑅𝑖𝑡
𝐿𝑃𝑅𝑖𝑡)]
2
+ ∑ 𝛽𝑛𝐾 ln 𝑦𝑛𝑖𝑡 ln (𝐾𝑃𝑅𝑖𝑡
𝐿𝑃𝑅𝑖𝑡)3
𝑛=1 + 𝛽𝐶𝑒𝑛𝑡𝑟𝑒𝐶𝑒𝑛𝑡𝑟𝑒𝑖 + 𝛽𝑆𝑜𝑢𝑡ℎ𝑆𝑜𝑢𝑡ℎ𝑖 +
𝛽𝐶𝑜𝑟𝑝𝐶𝑜𝑟𝑝𝑖 + 𝛽𝑀𝑜𝑢𝑛𝑡𝑀𝑜𝑢𝑛𝑡𝑖 + 𝜈𝑖𝑡 + exp(∑ 𝛿𝑟𝑧𝑟𝑖𝑡8𝑟=1 )𝑢𝑖𝑡
∗ (6)
where 𝛼 is the intercept, 𝑦 represents the outputs and 𝑧 corresponds to the efficiency
determinants included in our analysis.
As mentioned before, the dependent variable is total network cost of distribution utilities
(Totex).16 For each distributor, Totex is constructed by summing up operational expenditure
(Opex) and capital expenditure (Capex). Opex consists of employee cost, operations and
maintenance cost, materials cost, administrative and general expenditure and other costs.
Capex is made up of total depreciation and interest. As explanatory variables, we consider
three outputs, two input prices, and a set of variables controlling for the area and geographic
characteristics as well as the legal status of the utilities. Since the main operation of the
distribution utilities is to deliver energy to the final consumers, we select these two variables
as outputs. Moreover, amount of energy delivered and number of customers are among the
most used output variables when estimating efficiency of electricity distribution utilities
(Jamasb and Pollitt, 2001).
As for the third output, we use the average outage duration for each customer served, in
minutes (SAIDI). This variable should be interpreted as a bad output in the electricity
16 All the monetary values are deflated to the 2010 values using the Consumer Price Index (CPI).

16
distribution activity defined in our model. Selection of this variable is compatible with the
output-based regulation of the Italian regulatory authority which has been established since
2004. According to this regulatory scheme, a quality of service measure is set, ex-ante, by the
regulator and utilities are either rewarded or punished depending on whether they have
reached the required threshold or not. In this sense, SAIDI is linked with the level of effort
taken by the utility to mitigate interruptions and improve its service quality.
Labour price (LPR) and capital price (KPR)17 are the two input prices and both are firm-
specific. In order to impose homogeneity of degree one in prices, both Totex and capital price
values are normalised using the labour price. In order to control for the division made by the
regulator based on the geographical area which the utilities are located in, two variables,
Centre and South are included as dummies. Another dummy variable corresponding to the
northern area (North), is included as one of the inefficiency determinants. The dummy
variable, Mountain Side (Mount), is used to account for geographic characteristics of the
firms. Finally, we also control for the legal status of the utilities (i.e., whether the utility is
legally registered as municipality/cooperative or corporation) by including Corporate (Corp)
as a dummy variable in the cost function.
A total of 8 variables are included as inefficiency determinants. Except the time trend18 and
the dummy variable North, all the other variables are measured at regional-level. Regional
Gross Value Added per capita (GVA) and employment rate (Emp_Rate) are the variables
capturing the impact of regional economic development on firms’ performance.
In order to examine our main hypothesis on whether institutional factors affect performance
of network industries, we use regional-level institutional quality indexes. These indexes are
assigned to each utility based on the region in which the headquarter of the utility is located
in. As discussed by Kaufmann et al. (2011), country-level institutional quality measures can
17 Capital Price calculation for the electricity distribution utilities needs detailed data which is not publicly
disclosed by firms and therefore, usually proxies, such as Whole Price Index, are used in efficiency analysis
studies (see for instance, Jamasb et al., 2018; Llorca et al., 2016). Weighted Average Capital Cost (WACC) is
another measure which can be considered to define capital price and as in the case of Italy, the Italian energy
regulator sets periodic WACC to be used by utilities when reporting their Capex. Although we have data on the
WACC values and the Whole Price Index for the period 2011-2015, when this variable is utilised as capital price,
the model does not converge, forcing us to elaborate the capital price using the available firm-level data. 18 Time trend was initially included in the cost frontier to examine technical change. However, this variable did
not show significant impact. This can be due to the developed nature of electricity distribution in Italy or that the
analysed time period is not sufficiently long for any major technical improvements to take place.

17
be used to define the concept of governance itself as well as the overall quality of governance
in a country. According to Nifo and Vecchione (2014), the same methodology can be applied
to measure local-level quality of governance. Lasagni et al. (2015) use the weighted average
of regional-level indexes introduced by Nifo and Vecchione (2014) (defined as Institutional
Quality Index, IQI) to analyse performance of manufacturing firms in Italy. Borghi et al.
(2016) use government effectiveness as well as regulatory quality indexes at country-level to
study performance of electricity distribution utilities across 16 European countries.
We use four of these local-level institutional quality indexes: control of corruption
(Corru_Ctrl), voice and accountability (Voice), rule of law (RoL), and government
effectiveness (Gov_Eff). Each of these indexes is considered to have an impact on firms’
performance through either direct (a reliable justice system can assure a more secure business
environment or a better control over corruption can reduce chances of free riding) or indirect
(how reforms are implemented) impacts. In general, with higher governance quality measures,
firms tend to use their sources better. Therefore, the effect of these variables as inefficiency
determinants is expected to be negative.
6. Results
We estimate a set of cost functions in our analysis. The first two are cost frontiers that are
estimated following the approach proposed by Aigner et al. (1977), earlier defined as ALS
model. We alternatively utilise Cobb-Douglas and translog functional forms for their
specifications. These two cost functions do not incorporate inefficiency determinants. For the
third one, we use the model labelled as RSCFG in Section 4, which incorporates inefficiency
determinants. Table 2 presents the parameter estimates of the three cost functions.
The ALS model with Cobb-Douglas specification is presented in the first column. In this
model, the coefficients of two of the outputs, Energy Delivered and Number of Customers,
are both positive and significant as expected, indicating the rise of total cost with increasing
number of consumers and demand for energy. Although not statistically significant, the
coefficient for SAIDI is negative and the sign remains consistent within the other two models.
This indicates that as utilities extend their efforts to reduce duration of interruptions, their
costs increase (conversely, the higher is the duration of interruptions, the lower are the effort

18
and total cost).19 Furthermore, the sum of the two significant output coefficients (ENED and
CUST) is 0.79, pointing out the existence of economies of scale in the Italian electricity
distribution sector. Coefficient of capital price is positive and significant. As for area
dummies, Centre and South, they are both positive, indicating that firms in central and
southern areas of Italy have higher total costs comparing to those located in northern regions.
However, only the coefficient for Centre is statistically significant. As expected, the dummy
variable for mountain side (Mount) shows a positive and significant coefficient. Also, the
dummy variable for legal status (Corp) is not statistically significant in the Cobb-Douglas
specification.
The second column of Table 2 presents the ALS model with translog specification. This
model, which does not include inefficiency determinants, shows similar results to the ALS
model with the Cobb-Douglas specification for all explanatory variables except for SAIDI.
Although the coefficient sign for SAIDI remains negative, it now becomes statistically
significant.
The third column reports the estimation results for the RSCFG model which incorporates
inefficiency determinants. In order to identify the best specification to be used when
estimating the RSCFG model, a Likelihood Ratio (LR) test is applied. This test can be applied
to compare the models presented in this paper because they are nested. The results, reported at
the bottom of Table 2, support the rejection of the Cobb-Douglas against the translog
specification when the ALS model is estimated; hence we use the latter to estimate the
RSCFG model. When comparing the ALS against the RSCFG model, the former is rejected
according to the LR test and therefore the RSCFG with translog specification is our preferred
model to be analysed.
19 Due to the twofolded nature of such efforts, the sign of this variable cannot be expected prior to the estimation.
Filippini and Wetzel (2014) argue that when using SAIDI as an output in the cost frontier, the short-term and
long-term impacts on variable and total costs might defer. In the short run, SAIDI increases Totex but in the long
run, the impact might be positive or negative depending on the level of effort that the utility uses to reduce
outages and whether, in turn, these efforts reduce the overall operation and maintenance costs.

19
Table 2. Parameter Estimates (models with Totex as dependent variable)
ALS (Cobb-Douglas) ALS (translog) RSCFG (translog)
Variable Est. Std.
Err. Est.
Std.
Err. Est.
Std.
Err.
Frontier
Intercept -1.737 *** 0.157 -1.898 *** 0.160 -1.971 *** 0.078
ln ENED 0.439 *** 0.067 0.528 *** 0.078 0.405 *** 0.040
ln CUST 0.352 *** 0.073 0.224 *** 0.078 0.426 *** 0.046
ln SAIDI -0.040 0.025 -0.049 * 0.027 -0.080 *** 0.011
ln (KPR/LPR) 0.293 *** 0.032 0.412 *** 0.031 0.442 *** 0.025
12⁄ (ln ENED)2 -0.026 0.170 -0.117 0.118
12⁄ (ln CUST)2 0.108 0.228 -0.101 0.149
12⁄ (ln SAIDI)2 0.012 0.012 0.009 0.015
12⁄ [ln (KPR/LPR)2] 0.130 *** 0.024 0.151 *** 0.012
ln ENED · ln CUST -0.025 0.195 0.118 0.132
ln ENED · ln SAIDI -0.013 0.048 0.050 0.037
ln ENED · ln (KPR/LPR) -0.041 0.079 -0.043 ** 0.039
ln CUST · ln SAIDI 0.054 0.051 -0.023 0.044
ln CUST · ln (KPR/LPR) 0.034 0.092 0.046 * 0.047
ln SAIDI · ln (KPR/LPR) 0.025 0.025 0.061 *** 0.015
Centre 0.462 *** 0.105 0.521 *** 0.103 0.594 *** 0.032
South 0.203 0.205 0.196 0.206 0.550 *** 0.035
Mount 0.193 ** 0.092 0.293 *** 0.091 0.229 *** 0.061
Corp -0.064 0.078 0.024 0.071 -0.067 *** 0.026
Noise term (σv
2) -2.864 *** 0.404 -3.171 *** 0.500 -8.929 *** 0.505
Inefficiency term (variance)
Intercept -0.614 *** 0.194 -0.874 *** 0.224 24.868 *** 5.612
ln GVA -4.972 * 2.697
Emp_Rate 55.97 *** 8.211
Voice -6.656 *** 2.646
RoL -4.545 ** 2.233
Gov_Eff -5.992 * 3.168
Corru_Ctrl -17.15 *** 4.044
North -1.321 ** 0.572
T 0.030 0.079
Observations 237 237 237
Log-likelihood -163.314 -131.116 -94.630
Chi-squared LR test 64.40 *** 72.97 *** -
Degrees of freedom (10) (8) -
Significance code: *p<0.1, **p<0.05, ***p<0.01

20
After incorporating the inefficiency determinants in the RSCFG model, coefficients of both
outputs and input prices keep the same sign and remain significant as in the ALS model with
the translog specification. The dummy variables Centre and Mount show the same results as
before. However, the estimated coefficients for two of the control variables in the frontier
change after including inefficiency determinants. The dummy for South, while keeping the
same positive sign as before, now becomes significant. This indicates the more intensive
impact of institutional and economic characteristics on utilities located in central and southern
Italy. The coefficient for the legal status dummy, Corp, which in the translog model was
positive but not significant, becomes now negative and significant. This suggests that utilities
which are legally listed as corporates are on average more efficient (i.e., they face lower
costs) than their counterparts (municipalities and cooperatives).
Regarding the inefficiency determinants, the coefficients of all the variables except the time
trend show significant results with the expected signs. The coefficient for the regional gross
value added per capita (GVA) is significant and negative, which means that inefficiency
decreases with higher GVA values. This result is compatible with findings of Jamasb et al.
(2018) who also show that GDP has a negative effect on the inefficiency of the utilities.
Employment rate (Emp_Rate) is another macroeconomic factor that is expected to have an
impact on the cost efficiency of electricity distribution utilities. The estimated coefficient for
this variable in the inefficiency term is positive and significant. This suggests that when, as a
result of increased economic activity, the employment rate increases, inefficiency increases as
well. This finding may seem counterintuitive since better macroeconomic performance is in
general tied with increasing output measures. However, as the employment rate increases,
labour price increases as well and firms will need to either pay a higher price for labour or, in
order to avoid these higher prices, to increase their capital. Either way, with the same level of
outputs, firms’ total cost will increase resulting in lower efficiency scores.20
Looking at the institutional quality measures included in the efficiency term, the coefficients
are all significant and with the expected negative signs. Voice and accountability (Voice),
which represents the degree of government’s responsiveness towards citizens, has a negative
and significant impact on inefficiency. This indicates that as the politicians become more
20 This result is compatible with those of Issah and Antwi (2017) showing a positive link between unemployment
rate and firm’s performance through Return On Assets (ROA). According to their findings, as unemployment
rate increases the future earnings of the firm also increases, which implies better performance measures for
firms. The reverse is true for the employment rate. Also Gjerde and Sættem (1999) report a similar result.

21
accountable for their actions and consequently do not use their power to fulfil interests of
certain groups, a more reliable service can be provided and resources will be allocated more
efficiently in the electricity distribution sector (Scott and Seth, 2013).
Similar result is found for the Government Effectiveness (Gov_Eff) variable. Stronger policy
implementation mechanisms limit rent seeking behaviour and encourage utilities to improve
their performance. The coefficient for Rule of Law (RoL) is significant and negative,
suggesting that lower crime rates and higher quality of the court system can decrease firm-
level inefficiency. This result is compatible with previous works on the impact of rule of law
on business performance (Roxas et al., 2012). A more effective government and stronger
judiciary system, will assure firms that their investment is not at risk and are encouraged to
invest in less flexible but more efficient technologies (Bergara et al., 1998). The coefficient
for Control of Corruption (Corru_Ctrl) is highly significant and negative. Italy has one of the
lowest corruption perception index scores (equal to 50 in 2017) among the OECD countries
(Transparency International, 2017), that is, the level of corruption is considered high,
affecting firms’ performance (Fiorino et al., 2012). Our result suggests that corruption has a
negative impact also on performance of regulated utilities. Consequently, as efforts to control
corruption increases at macro-level, cost inefficiency in the electricity distribution sector
decreases. Overall, the estimation outcomes suggest a strong impact of macroeconomic
factors on the performance of distribution utilities. The coefficient of the control variable,
North, is negative and significant, indicating that utilities located in northern regions are more
efficient than those in central and southern regions. The time trend, T, is positive, however it
does not seem to have a significant impact on the efficiency of the utilities in our sample.
Figure 1 shows how the average efficiency scores in the three estimated models change from
2011 to 2015. The figure shows more severe fluctuations in the efficiency scores during the
period of analysis for the ALS model with Cobb-Douglas (CD) specification. However, since
both models (ALS and RSCFG) with translog (TL) specification are the preferred ones, we
focus on their changes. While the efficiency scores of these models follow a similar pattern,
there is a wide gap in the efficiency scores. Throughout the period of analysis, the preferred
RSCFG model, which includes inefficiency determinants, shows lower efficiencies than the
ALS model. The trend shows a steady decline in performance of utilities until 2013 and then
an increasing drift from 2013 until the end of the analysed period in 2015.

22
Figure 1. Evolution of Annual Average Efficiency over Time
The average efficiency in the RSCFG model was 58.5% in 2011, when it started to decline,
and reached the lowest of 55.5% in 2013. It then started to increase from 2013 and peaked up
in 2015 with the highest average efficiency score in the analysed period equal to 61%. The
average efficiency score for the whole period is equal to 58% which is lower than the 78%
efficiency score of distribution utilities owned by Enel from 2004 to 2009, reported by
Cambini et al. (2014).21 This may be revealing the impact of economies of scale in the Italian
electricity distribution sector.
Enel, which owns 85% of the Italian electricity distribution sector, enjoys from its wide
operation domain in the country. For this reason, in a separate analysis, we perform the same
estimates previously shown by including also Enel. The result of this analysis is presented in
Appendix C. After introducing Enel, the results remain consistent. Coefficients of the main
outputs and input prices variables in the frontier hold relatively similar values with the same
signs. As for the inefficiency determinants, both economic development measures, Gross
Value Added and Employment Rate, show the same coefficient values and signs. However,
this does not hold for the institutional quality measures and only Control of Corruption shows
the same coefficient value and sign.22
21 These efficiency scores are relative measures and hence they should be compared with caution. 22 While inclusion of Enel in the analysis results in some inefficiency determinants becoming insignificant, the
overall efficiency scores do not change considerably and follow the same pattern during the period of analysis.
50
52
54
56
58
60
62
64
66
68
2011 2012 2013 2014 2015
Co
st e
ffic
ien
cy (
%)
Year
ALS model (TL) RSCFG model (TL) ALS model (CD)

23
7. Conclusion
While the literature on how institutions impact performance of non-regulated firms is quite
rich, there is not sufficient empirical evidence on whether institutions affect the functioning of
regulated network utilities. Our findings add to the literature by providing empirical evidence
on the importance of good institutions in improving cost efficiency of electricity distribution
utilities.
In Italy, electricity sector reforms started with two primary objectives: liberalisation and
privatisation of the sector. After achieving these objectives in mid 2000s, the regulatory
authority set eyes on improving efficiency as well as service quality of the electricity
transmission and distribution sectors. However, after nearly two decades of reforms and
regulatory efforts, the Italian electricity distribution sector still suffers from two main issues.
First, there is a wide discrepancy between the performance of utilities across the country, and
second, there is a persistent problem of electricity interruptions which is more common
among the utilities located in southern parts of the country.
Northern and southern areas of Italy are historically diverse in terms of socioeconomic
development measures. In addition, the geographical characteristics are quite disparate with
northern parts mostly covered by mountains while southern areas are mostly coastal.
According to the existing empirical evidence these factors affect the efficiency of electricity
utilities and lead to efficiency differentials across a country. However, one strand of literature
suggests that performance differentials can be linked to differences in regional-level quality of
institutions as well as macroeconomic factors such as GDP or GVA, and employment rate.
Using a unique dataset on the Italian electricity distribution utilities and estimating a set of
stochastic frontier models, we analyse the cost efficiency of the electricity distribution utilities
in different regions of Italy. We study the impact of regional-level economic development
measures as well as the impact of quality of local institutions on the efficiency of the
electricity distribution utilities. According to our estimations, the average cost efficiency of
the Italian electricity distribution sector is about 58%. This score is lower than what has been
reported by previous studies which did not incorporate the institutional or economic factors.
Our results also suggest that regional-level macroeconomic factors as well as quality of
regional institutions have significant impact on the cost efficiency of distribution utilities. In

24
particular, utilities located in regions with better institutional endowments show better
performance scores in comparison to the ones located in regions with lower institutional
quality measurements.
The findings of this paper can be of interest to regulators as it is an attempt towards
identifying unobservable roots of differences in performance of regulated firms such as
electricity utilities. When applying benchmarking methods, regulators usually consider
physical, organisational, and environmental (mainly meteorological) differences which can
impact either capital or operational expenditures of the utilities. However, following the
results of this study, also institutional diversity can impact functioning of the utilities.
Therefore, it appears that to compare performance of utilities on a fair basis when applying
benchmarking methods, regional diversity in terms of institutional quality should be
considered as well.
On the one hand, institutions directly and/or indirectly impact firms’ operations through
quality of the business environment. On the other hand, governments’ accountability towards
the citizens prevents distorted political actions as well as unfair resource allocation to
preferred parties. If any of the institutional quality measures is weakened in a country or
region, the abovementioned mechanisms might be negatively affected. Consequently, how
resources are allocated and how utilities decide to use their available resources (i.e., whether
they perform efficiently or inefficiently), are impacted as well.
In particular, in regions or countries that face issues such as low access rates due to unfair
allocation of resources to the utilities or low service quality due to poor maintenance of
operations by utilities, the problem might be linked to the quality of institutions. Thus, in
order to overcome these issues and to improve the overall efficiency of the distribution sector,
regulators need to consider the institutional domain that the utilities are encountering with.
Current regulatory approaches do not take this into account and mainly focus on firm-level
economic incentives and activities to improve the efficiency of the utilities. However, it
appears that considering impacts of institutions is inevitable for devising effective incentives
to regulated firms to improve their efficiency and quality of service.

25
References
Acemoglu, D., Johnson, S. and Robinson, J.A. (2001). “The colonial origins of comparative
development: an empirical investigation”. American Economic Review, 91: 1369-1401.
Acemoglu, D., Johnson, S. and Robinson, J.A. (2002). “Reversal of fortune: Geography and
institutions in the making of the modern world income distribution”. Quarterly Journal
of Economics, 117: 1231-1294.
Acemoglu, D. and Robinson, J.A. (2008). “The Role of Institution in Growth and
Development”. Working Paper No. 10, Commission on Growth and Development.
Aigner, D., Lovell, K. and Schmidt, P. (1977). “Formulation and estimation of stochastic
frontier production function models”. Journal of Econometrics, 6: 21-37.
Alvarez, A., Amsler, C., Orea, L. and Schmidt, P. (2006). “Interpreting and testing the scaling
property in models where inefficiency depends on firm characteristics”. Journal of
Productivity Analysis, 25: 201-212.
Andres, L., Guasch, J. L. and Azumendi, S. L. (2008). “Regulatory Governance and Sector
Performance: Methodology and Evaluation for Electricity Distribution in Latin
America”. World Bank Policy Research Working Paper Series, No. 4494.
ARERA (2017). “Annual Report to the International Agency for the Cooperation of National
Energy Regulators and to the European Commission on the Regulatory Activities and
the Fulfilment of Duties of the Italian Regulatory Authority for Electricity, Gas and
Water”. 31 July 2017.
Armstrong, M., Cowan, S. and Vickers, J. (1994). “Regulatory Reform: Economic Analysis
and British Experience”. Vol. 1, 1st ed., The MIT Press.
Arora, S.C. (1990). “President’s rule in Indian states: A study of Punjab”. South Asia Books,
1st ed. (1 December 1990).
Balza, L., Jimenez, R. and Mercado, J. (2013). “Privatization, institutional reform, and
performance in the Latin American electricity sector”. Inter-American Development
Bank, Infrastructure and Environment Department, Energy Division, Technical Note
No. IDB-TN-599.
Battese, G.E. and Coelli, T.J. (1992). “Frontier production functions, technical efficiency and
panel data: with application to paddy farmers in India”. Journal of Productivity
Analysis, 3: 153-169.
Battese, G.E. and Coelli, T.J. (1995). “A model for technical efficiency for panel data”.
Empirical Economics, 20: 325-332.

26
Bergara, M., Henisz, W., J. and Spiller, P. T. (1998). “Political institutional and electric utility
investment: A cross-nation analysis”. Program on Workable Energy Regulation
(POWER), California Management Review, 40: 18-35.
Borghi, E., Del Bo, C. and Florio, M. (2016). “Institutions and Firms productivity: Evidence
from electricity distribution in the EU”. Oxford Bulletin of Economics and Statistics,
78: 170- 196.
Bortolotti, B., Cambini, C., and Rondi, L. (2013). “Reluctant Regulation”. Journal of
Comparative Economics, 41, 804-828.
Cambini, C., Croce, A. and Fumagalli, E. (2014). “Output-based incentive regulation in
electricity distribution: Evidence from Italy”. Energy Economics, 45: 205-216.
Cambini, C., Fumagalli, E. and Rondi, L. (2016). “Incentives to Quality and Investment:
Evidence from Electricity Distribution in Italy”. Journal of Regulatory Economics, 49:
1-32.
Capece, G., Di Pillo, F., Levialdi, N. (2013). “The Performance Assessment of Energy
Companies”. Proceedings of the 2nd International Conference on Clean and Green
Energy (ICCGE 2013), Dubai, UAE, 248-252.
Caudill, S.B. and Ford, J.M. (1993). “Biases in frontier estimation due to heteroscedasticity”.
Economic Letters, 41: 17-20.
Caudill, S.B., Ford, J.M. and Gropper, D.M. (1995). “Frontier estimation and firm-specific
inefficiency measures in the presence of heteroscedasticity”. Journal of Business and
Economic Statistics, 13: 105-11.
Chanda, A. and Dalgaard, C.J. (2008). “Dual Economies and International Total Factor
Productivity Differences: Channeling the Impact from Institutions, Trade and
Geography”. Economica, 75: 629-661.
Coelli, T.J., Rao, D.S.P., O’Donnell, C.J. and Battese, G.E. (2005). “An introduction to
efficiency and productivity analysis”. 2nd ed., Springer.
Dal Bo, E. and Di Tella, R. (2003). “Capture by threat”. Journal of Political Economy, 111:
1123-54.
Dal Bo, E. and Rossi, M.A. (2007). “Corruption and inefficiency: Theory and evidence from
electric utilities”. Journal of Public Economics, 19: 939-962.
Dollar, D., Hallward-Driemeier, M. and Mengistae, T. (2005). “Investment climate and firm
performance in developing economies”. Economic Development and Cultural Change,
54: 1-31.

27
Dramani, J.B. and Tewari, D.D. (2014), “Institutions’ and electricity sectors’ performance in
Ghana”. Journal of Economics, 5: 259-273.
Durakoglu, M. S. (2011). “Political institutions of electricity regulation: the case of Turkey”.
Energy Policy, 39: 5578-5587.
Easterly, William and Ross Levine. (2003). “Tropics, Germs and Crops: The Role of
Endowments in Economic Development”. Journal of Monetary Economics, 50: 3-39.
Eicher, T., Garcia-Penalosa, C. and Teksoz, U. (2006). “How Do Institutions Lead Some
Countries to Produce so much more Output per Worker than Others?”. Institutions,
Development and Growth. Cambridge, MA: MIT Press.
Erdogdu, E. (2013). “A cross-country analysis of electricity market reforms: Potential
contribution of New Institutional Economics”. Energy Economics, 39: 239-251.
Estache, A., Goicoechea, A. and Trujillo, L. (2009). “Utilities reforms and corruption in
developing countries”. Utilities Policy, 17: 191-202.
Farsi, M., Filippini, M. and Kuenzle, M. (2005). “Unobserved heterogeneity in stochastic cost
frontier models: an application to Swiss nursing homes”. Applied Economics, 37: 2127-
2141.
Farsi, M. and Filippini, M. (2009). “An analysis of cost efficiency in Swiss multi-utilities”.
Energy Economics, 31: 306-315.
Fiorino, N., Galli, E. and Petrarca, I. (2012). “Corruption and growth: evidence from the
Italian regions”. European Journal of Government and Economics, 1: 126-144.
Fumagalli, E. and Lo Schiavo L. (2009). “Regulating and improving the quality of electricity
supply: the case of Italy”. European Review of Energy Markets, 3: 1-27.
Filippini, M. and Welzel, H. (2014). “The impact of ownership unbundling on cost efficiency:
empirical evidence from the New Zealand electricity distribution sector”. Energy
Economics, 45: 412-418.
Giannakis, D., Jamasb, T. and Pollitt, M. (2005). “Benchmarking and incentive regulation of
quality of service: An application to the UK electricity distribution networks”. Energy
Policy, 33: 2256-2271.
Gjerde, Ø. and Sættem, F. (1999). “Causal relations among stock returns and macroeconomic
variables in a small, open economy”. Journal of International Financial Markets,
Institutions and Money, 9: 61-74.

28
Grigorian, D. and Martinez, A. (2002). “Industrial Growth and the Quality of Institutions:
What Do (Transition) Economies Have to Gain from the Rule of Law?”. Working Paper
No. 2475, World Bank.
Gyimah-Brempong, K. and de Camacho, S.M. (2006). “Corruption, growth, and income
distribution; are there regional differences?”. Economics of Governance, 7: 245-269.
Hall, R. E. and Jones, C.I. (1999). “Why do Some Countries Produce so Much More Output
per Worker?”. Quarterly Journal of Economics, 114: 83-116.
Issah, M. and Antwi, S. (2017). “Role of macroeconomic variables on firms’ performance:
Evidence from the UK”. Cogent Economics & Finance, 5(1). DOI:
10.1080/23322039.2017.1405581.
Jamasb, T., Llorca, M., Khetrapal, P. and Thakur, T. (2018). “Institutions and performance of
regulated firms: Evidence from electric utilities in the Indian states”. EPRG working
paper, No. 1809 and Cambridge working paper, No. 1823.
Jamasb, T. and Pollitt, M.G. (2007). “Incentive regulation of electricity distribution networks:
Lessons of experience from Britain”. Energy Policy, 35: 6163-6187.
Kaufmann, D., Kraay, A. and Zoido-Lobaton, P. (1999). “Governance matters”. Policy
Research working paper, No. WPS-2196, World Bank.
Kaufmann, D.; Kraay, A.; Mastruzzi, M. (2011). “The Worldwide Governance Indicators:
Methodology and Analytical Issues”. The Hague Journal on the Rule of Law, 3: 220-
246.
Ketterer, T. D. and Rodriguez-Pose, A. (2011). “Do Local Amenities Affect the Appeal of
Regions in Europe for Migrants?”. Journal of Regional Science, 52: 535-561.
Kim, S. and Law, M.T. (2012). “History, Institutions, and Cities: A View from the
Americas”. Journal of Regional Science, 52: 10-39.
Kumbhakar, S.C. (1990). “Production frontiers and panel data, and time varying technical
inefficiency”. Journal of Econometrics, 46: 201-211.
Kumbhakar, S.C., Wang, H.J. and Horncastle, A.P. (2015). “A practitioner’s guide to
stochastic frontier analysis using STATA”. Cambridge University Press, New York,
2015.
Lai, H. and Huang, C.J. (2010). “Likelihood ratio tests for model selection of stochastic
frontier models”. Journal of Productivity Analysis, 34, 3-13.

29
Lasagni, A., Nifo, A.M. and Vecchione, G. (2015). “Firm productivity and institutional
quality: evidence from Italian industry”. Journal of Regional Science, 55: 774-800.
Lensink, R. and Meesters, A. (2012). “Institutions and bank performance: a stochastic frontier
analysis”. Oxford Bulletin of Economics and Statistics, 76: 67-92.
Llorca, M., Orea, L. and Pollitt, M.G. (2016). “Efficiency and environmental factors in the
US electricity transmission industry”. Energy Economics, 55: 234-246.
Mankiw, N. G., Romer, D. and Weil, D. (1992). “A Contribution to the Empirics of Growth”.
The Quarterly Journal of Economics, 107: 407-437.
Meeusen, W. and van den Broeck, J. (1977). “Efficiency estimation from Cobb-Douglas
production functions with composed error”. International Economic Review, 18: 435-
444.
Nepal, R. and Jamasb, T. (2012). “Reforming the power sector in transition: Do institutions
matter?”. Energy Economics, 34: 1675-1682.
Nifo, A. and Vecchione, G. (2014). “Do Institutions Play a Role in Skilled Migration? The
Case of Italy”. Regional Studies, 48: 1628-1649.
North, D.C. (1990). “Institutions, institutional change and economic performance”.
Cambridge University Press, New York.
Nyathikala, S. A., Jamasb, T., Llorca, M. and Kulshrestha, M. (2018). "Utilities Governance,
Incentives, and Performance: Evidence from the Water Sector in India". EPRG working
paper, No. 1832 and Cambridge working paper, No. 1861.
Pitt, M. and Lee, L. (1981). “The measurement and sources of technical inefficiency in
Indonesian weaving industry”. Journal of Development Economics, 9: 43-64.
Pombo, C. and Taborda, R. (2006). “Performance and efficiency in Colombia’s power
distribution system: Effects of the 1994 reform”. Energy Economics, 28: 339-369.
Ramos-Real, F.J. (2005). “Cost functions and the electric utility industry. A contribution to
the debate on deregulation”. Energy Policy, 33: 69-87.
Reifschneider, D. and Stevenson, R. (1991). “Systematic departures from the frontier: A
framework for the analysis of firm inefficiency”. International Economic Review, 32:
715-723.
Rodrik, D. (2003). “Growth Strategies”. John F. Kennedy School of Government Working
Paper, Harvard University.

30
Rodrik, D., Subramanian, A. and Trebbi, F. (2004). “Institutions rule: the primacy of
institutions over geography and integration in economic development”. Journal of
Economic Growth, 9: 131-165.
Roxas, B., Chadee, D. and Erwee, R. (2012). ”Effects of rule of law on firm performance in
South Africa”. European Business Review, 24: 478-492.
Schmidt, P., Sickles, R.E. (1984). “Production frontiers and panel data”. Journal of Business
and Economic Statistics, 2: 367-374.
Scott, A. and Seth, P. (2013). “The political economy of electricity distribution in developing
countries: A Literature Review”. Overseas Development Institute. Politics and
Governance, London, UK, March 2013. Available at:
https://www.odi.org/publications/7378-political-economy-electricity-distribution-
developing-countries-review-literature.
Stern, J. and Cubbin, J. (2005). “Regulatory effectiveness: the impact of regulation and
regulatory governance arrangements on electricity industry outcomes”. World Bank
Policy Research Working Paper 3536.
Transparency International, (2017). The 2017 Corruption Perceptions Index. Available at:
www.transparency.org/cpi.

31
Appendix A
Table A.1. Variables, Descriptions, and Sources
Variable
Name Label Description Data Source
Dependant Variable
Totex
Total
Distribution
Cost
Total cost of distribution
activities=OPEX+CAPEX
OPEX= Employees Cost+ Operations and
Maintenance Cost+ Cost
of Materials +Administrative and
General Expenditure+ Other Costs
CAPEX= Depreciation+ Interest
Elaborated using data collected by
ARERA.
Outputs
ENED Energy
Delivered
Total energy delivered to
customers.
Elaborated using data collected by
ARERA.
CUST Number of
Customers
Total number of
consumers served by the
utility.
Elaborated using data collected by
ARERA.
SAIDI
System
Average
Interruption
Duration
Index
Average duration of long
(more than 3 minutes),
unplanned interruptions
per customer (measured
in minutes).
ARERA Online Database:
https://www.arera.it/it/dati/elenco_dati.htm.
Input Prices
LPR Labour Price Employees Cost/ Number of Personnel
Elaborated using data collected by
ARERA.
KPR Capital Price Interest/Network Length Elaborated using data collected by
ARERA.
Control Variables
Corp Corporation
Dummy variable that
takes value 1 if the utility
is not legally categorised
as municipality or
cooperative.
Elaborated using data collected by
ARERA.
South Southern area
of Italy
Dummy variable that
takes value 1 when a
utility is located in the
Southern area of the
country.
Elaborated using data collected by
ARERA.
Centre Central area of
Italy
Dummy variable that
takes value 1 when a
utility is located in the
Central area of the
country.
Elaborated using data collected by
ARERA.
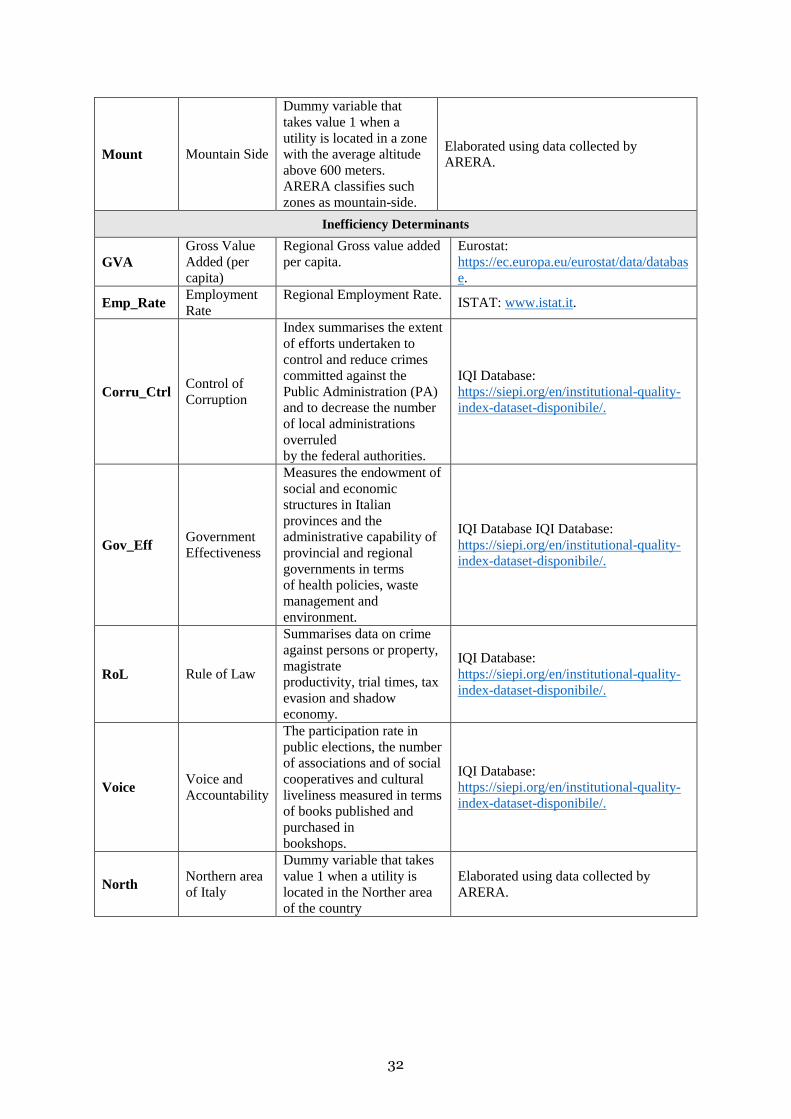
32
Mount Mountain Side
Dummy variable that
takes value 1 when a
utility is located in a zone
with the average altitude
above 600 meters.
ARERA classifies such
zones as mountain-side.
Elaborated using data collected by
ARERA.
Inefficiency Determinants
GVA
Gross Value
Added (per
capita)
Regional Gross value added
per capita.
Eurostat:
https://ec.europa.eu/eurostat/data/databas
e.
Emp_Rate Employment
Rate
Regional Employment Rate. ISTAT: www.istat.it.
Corru_Ctrl Control of
Corruption
Index summarises the extent
of efforts undertaken to
control and reduce crimes
committed against the
Public Administration (PA)
and to decrease the number
of local administrations
overruled
by the federal authorities.
IQI Database:
https://siepi.org/en/institutional-quality-
index-dataset-disponibile/.
Gov_Eff Government
Effectiveness
Measures the endowment of
social and economic
structures in Italian
provinces and the
administrative capability of
provincial and regional
governments in terms
of health policies, waste
management and
environment.
IQI Database IQI Database:
https://siepi.org/en/institutional-quality-
index-dataset-disponibile/.
RoL Rule of Law
Summarises data on crime
against persons or property,
magistrate
productivity, trial times, tax
evasion and shadow
economy.
IQI Database:
https://siepi.org/en/institutional-quality-
index-dataset-disponibile/.
Voice Voice and
Accountability
The participation rate in
public elections, the number
of associations and of social
cooperatives and cultural
liveliness measured in terms
of books published and
purchased in
bookshops.
IQI Database:
https://siepi.org/en/institutional-quality-
index-dataset-disponibile/.
North Northern area
of Italy
Dummy variable that takes
value 1 when a utility is
located in the Norther area
of the country
Elaborated using data collected by
ARERA.
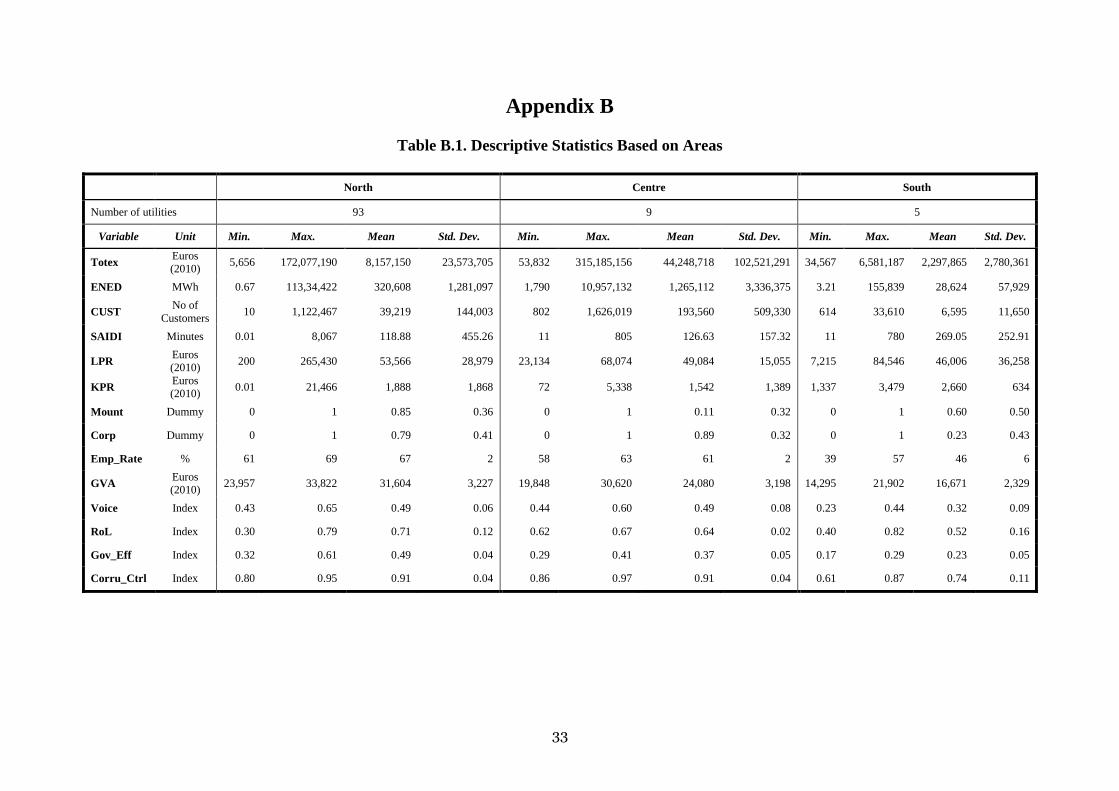
33
Appendix B
Table B.1. Descriptive Statistics Based on Areas
North Centre South
Number of utilities 93 9 5
Variable Unit Min. Max. Mean Std. Dev. Min. Max. Mean Std. Dev. Min. Max. Mean Std. Dev.
Totex Euros
(2010) 5,656 172,077,190 8,157,150 23,573,705 53,832 315,185,156 44,248,718 102,521,291 34,567 6,581,187 2,297,865 2,780,361
ENED MWh 0.67 113,34,422 320,608 1,281,097 1,790 10,957,132 1,265,112 3,336,375 3.21 155,839 28,624 57,929
CUST No of
Customers 10 1,122,467 39,219 144,003 802 1,626,019 193,560 509,330 614 33,610 6,595 11,650
SAIDI Minutes 0.01 8,067 118.88 455.26 11 805 126.63 157.32 11 780 269.05 252.91
LPR Euros
(2010) 200 265,430 53,566 28,979 23,134 68,074 49,084 15,055 7,215 84,546 46,006 36,258
KPR Euros
(2010) 0.01 21,466 1,888 1,868 72 5,338 1,542 1,389 1,337 3,479 2,660 634
Mount Dummy 0 1 0.85 0.36 0 1 0.11 0.32 0 1 0.60 0.50
Corp Dummy 0 1 0.79 0.41 0 1 0.89 0.32 0 1 0.23 0.43
Emp_Rate % 61 69 67 2 58 63 61 2 39 57 46 6
GVA Euros
(2010) 23,957 33,822 31,604 3,227 19,848 30,620 24,080 3,198 14,295 21,902 16,671 2,329
Voice Index 0.43 0.65 0.49 0.06 0.44 0.60 0.49 0.08 0.23 0.44 0.32 0.09
RoL Index 0.30 0.79 0.71 0.12 0.62 0.67 0.64 0.02 0.40 0.82 0.52 0.16
Gov_Eff Index 0.32 0.61 0.49 0.04 0.29 0.41 0.37 0.05 0.17 0.29 0.23 0.05
Corru_Ctrl Index 0.80 0.95 0.91 0.04 0.86 0.97 0.91 0.04 0.61 0.87 0.74 0.11
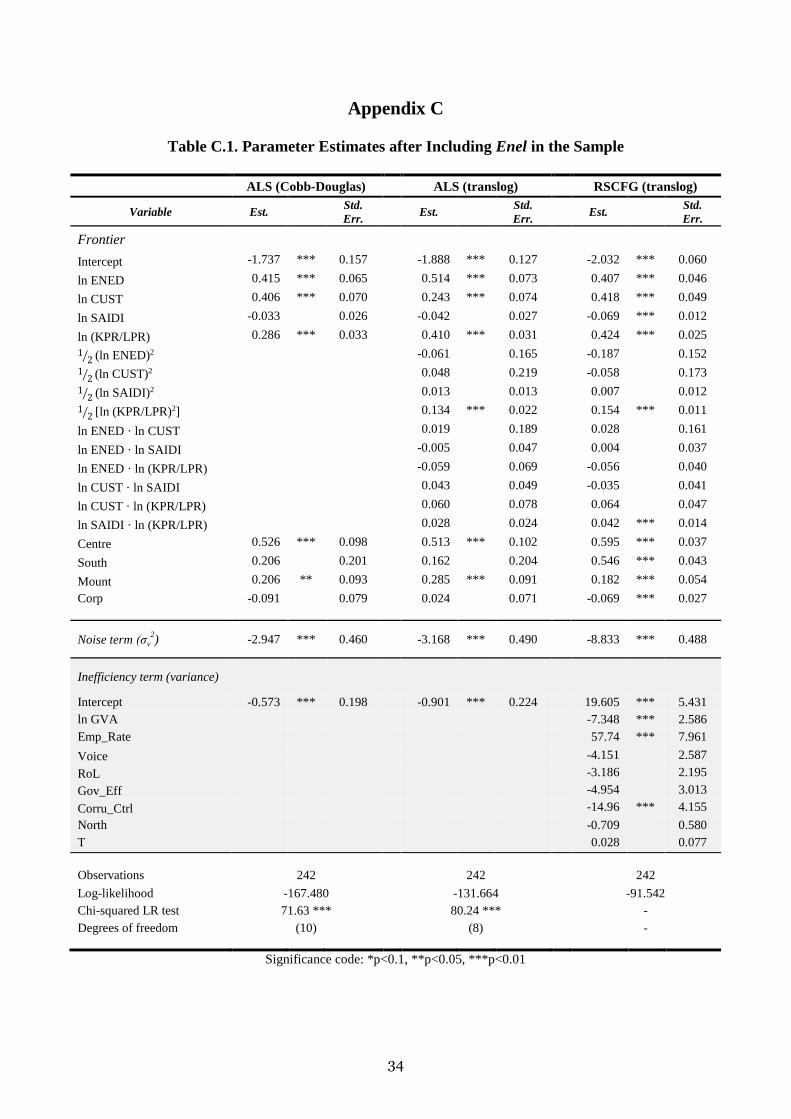
34
Appendix C
Table C.1. Parameter Estimates after Including Enel in the Sample
ALS (Cobb-Douglas) ALS (translog) RSCFG (translog)
Variable Est. Std.
Err. Est.
Std.
Err. Est.
Std.
Err.
Frontier
Intercept -1.737 *** 0.157 -1.888 *** 0.127 -2.032 *** 0.060
ln ENED 0.415 *** 0.065 0.514 *** 0.073 0.407 *** 0.046
ln CUST 0.406 *** 0.070 0.243 *** 0.074 0.418 *** 0.049
ln SAIDI -0.033 0.026 -0.042 0.027 -0.069 *** 0.012
ln (KPR/LPR) 0.286 *** 0.033 0.410 *** 0.031 0.424 *** 0.025
12⁄ (ln ENED)2 -0.061 0.165 -0.187 0.152
12⁄ (ln CUST)2 0.048 0.219 -0.058 0.173
12⁄ (ln SAIDI)2 0.013 0.013 0.007 0.012
12⁄ [ln (KPR/LPR)2] 0.134 *** 0.022 0.154 *** 0.011
ln ENED · ln CUST 0.019 0.189 0.028 0.161
ln ENED · ln SAIDI -0.005 0.047 0.004 0.037
ln ENED · ln (KPR/LPR) -0.059 0.069 -0.056 0.040
ln CUST · ln SAIDI 0.043 0.049 -0.035 0.041
ln CUST · ln (KPR/LPR) 0.060 0.078 0.064 0.047
ln SAIDI · ln (KPR/LPR) 0.028 0.024 0.042 *** 0.014
Centre 0.526 *** 0.098 0.513 *** 0.102 0.595 *** 0.037
South 0.206 0.201 0.162 0.204 0.546 *** 0.043
Mount 0.206 ** 0.093 0.285 *** 0.091 0.182 *** 0.054
Corp -0.091 0.079 0.024 0.071 -0.069 *** 0.027
Noise term (σv
2) -2.947 *** 0.460 -3.168 *** 0.490 -8.833 *** 0.488
Inefficiency term (variance)
Intercept -0.573 *** 0.198 -0.901 *** 0.224 19.605 *** 5.431
ln GVA -7.348 *** 2.586
Emp_Rate 57.74 *** 7.961
Voice -4.151 2.587
RoL -3.186 2.195
Gov_Eff -4.954 3.013
Corru_Ctrl -14.96 *** 4.155
North -0.709 0.580
T 0.028 0.077
Observations 242 242 242
Log-likelihood -167.480 -131.664 -91.542
Chi-squared LR test 71.63 *** 80.24 *** -
Degrees of freedom (10) (8) -
Significance code: *p<0.1, **p<0.05, ***p<0.01