cambridge to huntingdon improvement scheme - gov.uk · safe roads, reliable journeys, informed...
TRANSCRIPT
Safe roads, reliable journeys, informed travellers
Cambridge to Huntingdon improvement scheme
Preliminary traffic reportApril 2014
A14
An executive agency of the Department for Transport
3
Table of Contents 1.0 Introduction 4 2.0 Forecasting and Modelling 5 2.1 Demand for Transport Schemes 5 2.2 Transport Modelling 5 2.3 Traffic Growth 6 2.4 Transport and Development Schemes 6 2.5 Traffic Forecasts 8 3.0 Traffic Forecasts on Strategic Routes 10 3.1 Without Scheme Demand 10 3.2 With Scheme Demand 11 4.0 Traffic Forecasts on Local Roads 14 4.1 Without Scheme Demand 14 4.2 With Scheme Demand 16 5.0 Network Performance 21 5.1 Network Capacity 21 5.2 Journey Times 21 6.0 Northstowe and Alconbury Weald 26 6.1 Impact on Strategic Routes 27 6.2 Impact on Local Roads 28 7.0 Next Steps 31

4
1.0 Introduction The Highways Agency is proposing a £1.5billion scheme to improve a 21 mile length of the of the A14 trunk road between Cambridge and Huntingdon. The primary aims of the proposed scheme are to relieve congestion on one of the busiest parts of the strategic road network between the Midlands and East Anglia and to support both national and regional economic growth. The Cambridge sub-region is one of the fastest growing areas of the United Kingdom in terms of population and economy. Between now and 2023 the area’s population is expected to grow by 23 per cent, driving a 22 per cent increase in jobs. However, traffic congestion is regularly cited by businesses as a constraint on growth. The A14 trunk road, which forms part of the trans-European transport network designated by the European Union, provides a vital east-west corridor between the Midlands and East Anglia and joins north-south routes via the A1 (M) and M11 motorways. It also serves as an important local commuter route in the region. The section of the A14 trunk road between Cambridge and Huntingdon is well known for congestion and delays. Built more than three decades ago, the road was not designed to accommodate the daily volume of traffic that now uses it and is in need of improvement. Up to 85,000 vehicles currently use the road every day and an exceptionally large number of heavy goods vehicles rely on this important strategic route. Road users regularly experience long delays and unpredictable journey times on this section of the road and there are safety concerns due to the volume and density of traffic. Without improvement, congestion on the A14 trunk road is predicted to worsen and it has already become a constraint to housing and employment growth in the Cambridge and Huntingdon area. Local and regional businesses also need access to a large and diverse labour market, requiring many people to commute into and out of the area each day. The quality of life for those who live in and between Cambridge and Huntingdon is diminished by congestion, which can cause driver stress and can contribute to other factors affecting wellbeing, safety and health.
5
2.0 Forecasting and Modelling 2.1 Demand for Transport Schemes The demand for transport schemes arises from a need to move from one place to another. The demand for travel between places will therefore depend on the nature and scale of the activity that takes place in each location and the ease of travel between them. For some journeys there may be a choice of transport modes available – for example bus, train or car – and in some cases there may also be a choice of route. The travel demand is therefore divided between these competing modes and routes based on factors such as cost, convenience and time. In order to assess the impacts of any proposed transport scheme, it is necessary to understand the current patterns of travel demand and how these might change in the future. Some changes in travel demand are expected to happen whether or not the proposed transport scheme progresses. These could include changes in jobs, population, income, and/or vehicle ownership arising from economic growth. Other changes in travel demand are directly related to the proposed transport scheme and will only occur if the scheme progresses. These could include changes in journey origin or destination, changes in mode choice and/or changes to the selected route. The increase in capacity on the highway network resulting from new transport schemes may also enable new housing or employment developments to proceed, where such developments would not be possible without the proposed scheme going ahead. In traffic modelling carried out to assess the impacts of a proposed transport scheme, developments which would be enabled by the proposed scheme, are commonly referred to as ‘dependent developments’. The assessment of the overall impact of a proposed transport scheme takes account of all of these effects in combination. The impact of the proposed scheme can be measured by assessing the change in the number of trips by mode and route between each origin and destination, both with and without the proposed transport scheme.
2.2 Transport Modelling In order to assess the potential benefits of the proposed A14 Cambridge to Huntingdon improvement scheme, a suite of transport models has been used to forecast the expected travel demand both with and without the scheme in place. The Cambridge Sub-Regional Model (CSRM), which incorporates land use planning and mode choice elements, has been used to forecast the demand for travel between origin and destination ‘zones’ by different modes of transport. The CSRM outputs are fed into a road traffic model, which is used to forecast the routes that traffic will take between each pair of origin and destination zones. Earlier versions of the road traffic model were developed to represent conditions in 2006. To update that earlier work, the performance of the model has been reviewed against conditions in 2011 with a number of enhancements made to the model to improve the representation of traffic movements on the strategic road network (which includes the A14).

6
This refreshed model, known as the Cambridge to Huntingdon A14 Roads Model (CHARM), has been used as the basis for forecasting the future performance of the road network around Huntingdon and Cambridge both with and without the proposed scheme. Traffic figures produced by the CHARM model are interim forecasts which are based on the best information that is currently available. Further traffic forecasts will be produced as the proposed scheme is progressed and these forecasts will take account of the evolving scheme design and any changes or updates to underlying assumptions about growth. 2.3 Traffic Growth In order to assess the benefits of a road scheme which has not yet been built, there is a requirement to forecast what might reasonably be expected to happen in the future. In the case of the proposed A14 Cambridge to Huntingdon improvement scheme, previous versions of the scheme have been assessed against forecast years of 2016 and 2031. However, the road traffic model has since been updated to reflect:
Changes to the proposed scheme design;
New guidance (from the Department for Transport); and
Greater clarity on the planned timescales for construction of the proposed scheme.
For the current proposed A14 Cambridge to Huntingdon improvement scheme, we have produced forecasts for 2020, which is the year that the scheme is expected to open; and for 2035, which is a future year used to assess whether the design of the scheme will be able to accommodate the predicted traffic in that future year. We have used industry standard methods of assessing traffic growth in the UK, which ensure consistency between the assessment of the proposed A14 Cambridge to Huntingdon improvement scheme and other transport schemes in different parts of the country. Predicted growth in the number of cars and other light vehicles is based on factors from the Trip End Model Presentation Program (TEMPro version 6.2, January 2013) in conjunction with the National Trip End Model (NTEM version 6.2, January 2013), which take account of forecast changes in population and employment. Predicted growth in goods vehicles has been based on the latest Road Transport Forecasts, released in July 2013. This data provides the most up-to-date growth assumptions available and is endorsed by the Department for Transport. 2.4 Transport and Development Schemes In developing the traffic forecasts, we have considered the impact of proposed housing and employment developments in the Cambridge-Huntingdon area. The core traffic forecasts, which form the basis of the consultation material, only include developments, the delivery of which are considered to be ‘near certain’ or ‘more than likely’ (as per Department for Transport guidelines) such as the first phase of the proposed development at Northstowe, which comprises 1,500 houses.

7
The traffic forecasts also take account of proposed improvements to the transport networks. As with proposed developments, only transport schemes that are considered to be ‘near certain’ or ‘more than likely’ have been included in our core forecasts. The transport schemes and developments that are included in the current forecasts are summarised over the following pages. 2.4.1 Transport Schemes The following road improvement schemes have been included in our core forecasts. The assumed opening year for each scheme is indicated in brackets.
A1/A14 Brampton Hut Signals (2006)
Western entrance to Cambridge Science Park (2006)
Roundabout at northern part of A14 Bar Hill junction (2006)
A1198 Papworth Everard Bypass (2007)
A428 Cambourne to Hardwick (2007)
Milton Interchange Signals (2007)
Huntingdon Bus Lane on Ring Road between George Street and Bus Station (2007)
Dedicated left-turn to Milton Interchange westbound on-slip and alterations to Science Park eastern entrance (2007)
Histon Interchange westbound off-slip and Kings Hedges Rd improvements due to Orchard Park development (2008)
Relocation of Milton Park and Ride Site (2009)
Access to St Ives Park and Ride Site (2009)
Access to Longstanton Park and Ride Site (2009)
Signal control at the A141/Kings Ripton Road (2009)
Longstanton Bypass (2009)
Addenbrookes Access Road (2010)
Completion of A421 Dualling from M1 to Black Cat Roundabout (2010)
Cambridgeshire Guided Busway level crossings (2011)
Addition of signalised access to NIAB site on Huntingdon Road and new roads in preparation for Cambridge University site between Huntingdon Road and Madingley Road (2012)
Speed limit reduction on Airport Way and Newmarket Road (2012)
A14 Spittals Upgrade (2014)
A14 Histon – Girton Auxiliary Lane (2014)

8
A14 Girton – Histon Auxiliary Lane (2014)
Huntingdon West of Town Centre Link (2014)
Cambridge NW Access road (2021)
Darwin Green Access Road (2021) 2.4.2 Housing Developments The following housing developments have been included in our core forecasts (and the assumed size of each development, in terms of the number of dwellings it is expected to deliver, is indicated in brackets):
Bell School, Cambridge Southern Fringe (650 units)
Clay Farm, Cambridge Southern Fringe (2,300 units)
Glebe Farm, Cambridge Southern Fringe (300 units)
Trumpington Meadows, Cambridge Southern Fringe (600 units)
Trumpington Meadows (Monsanto), Cambridge Southern Fringe (570 units)
North of Newmarket Road, Cambridge East (1,500 units)
North of Cherry Hinton Road, Cambridge East (735 units)
Arbury Camp, North-West Cambridge (435 units)
NIAB1 (Darwin Green) Site, North-West Cambridge (1,593 units)
University Site, North-West Cambridge (3,000 units)
Loves Farm, Huntingdonshire (1,050 units)
Northbridge, Huntingdonshire (1,250 units)
Cambourne, South Cambridgeshire (800 units)
Northstowe Phase 1, South Cambridgeshire (1,500 units)
2.4.3 Employment Developments The employment forecasts are based on planning data from the National Trip End Model (version 6.2) which takes account of the most recent estimates of employment growth by industry. This information is provided at ward level and therefore we cannot predict definitively the level of future employment growth expected for specific development sites. 2.5 Traffic Forecasts We have produced interim traffic forecasts for 2020 (scheme opening year) and 2035 (future design year), which reflect the best information currently available. These forecasts are intended to give a broad indication of the likely travel conditions on the A14 and surrounding road network, both in 2020 and 2035, and both with and without the proposed A14 improvement scheme.

9
The following sections of this report summarise the forecast changes in traffic flows and highway network performance resulting from the proposed A14 Cambridge to Huntingdon improvement scheme.

10
3.0 Traffic Forecasts on Strategic Routes We have prepared forecasts of Annual Average Daily Traffic (AADT) flows, which represent the average traffic flow in a 24-hour period measured over the whole year, for the scheme opening year (2020) and the future design year (2035). Forecasts with and without the proposed A14 improvement scheme are presented below for each of the key sections of the A14 and for a range of other roads that are likely to experience a change in traffic levels as a result of the implementation of the proposed A14 improvement scheme. 3.1 Without Scheme Demand
Traffic growth of the order of 10% to 15% is expected between the present year and the first forecast year of 2020. The rate of growth differs from road to road depending on the characteristics of each road, such as the amount of congestion on it and the availability of alternative routes. Without the proposed A14 improvement nearly all sections of the road network in the vicinity of the proposed scheme are forecast to experience further increases in traffic flows between 2020 and 2035. The AADT forecasts at a number of representative sections of road are shown in Table 1 below. Table 1: Comparison of 2-way AADT Forecasts on Major Routes in 2011, 2020 and 2035 Without Scheme
Units: vehicles per day Away from areas affected by congestion, the increase in traffic between 2020 and 2035 is forecasts to be between 10% and 20%. Congestion on the A14 between Cambridge and Huntingdon is forecast to restrict the traffic growth to 3%, with some traffic expected to divert via the A428 and A1198 as a consequence. As a result, the traffic on the A428 is forecast to grow by 36%, while growth in traffic flows on the A1198 is forecast to be 59%.
Road Section 2011 2020 2035
A14 West of A1 41500 47000 54000
A14 Spur east of A1(M) 43000 50000 57500
A14 Through Huntingdon 72000 83000 90000
A14 Swavesey to Bar Hill 77000 86500 89500
A14 Bar Hill to Girton 91000 105500 113500
A14 Cambridge Northern Bypass 63000 76000 85000
A428 Near Bourne Airfield 27000 34500 47000
A1198 West of Hilton 10500 14500 23000
A1 North of A14 34000 46000 60000
A1 South of A14 47000 58500 69000
A141 North of Huntingdon 17500 19000 21000
11
The forecasts of 2-way traffic flows for the ‘without scheme’ scenario are shown in Figure 1. The key in the bottom left hand corner of Figure 1 explains how AADT information is presented in the boxes. 3.2 With Scheme Demand
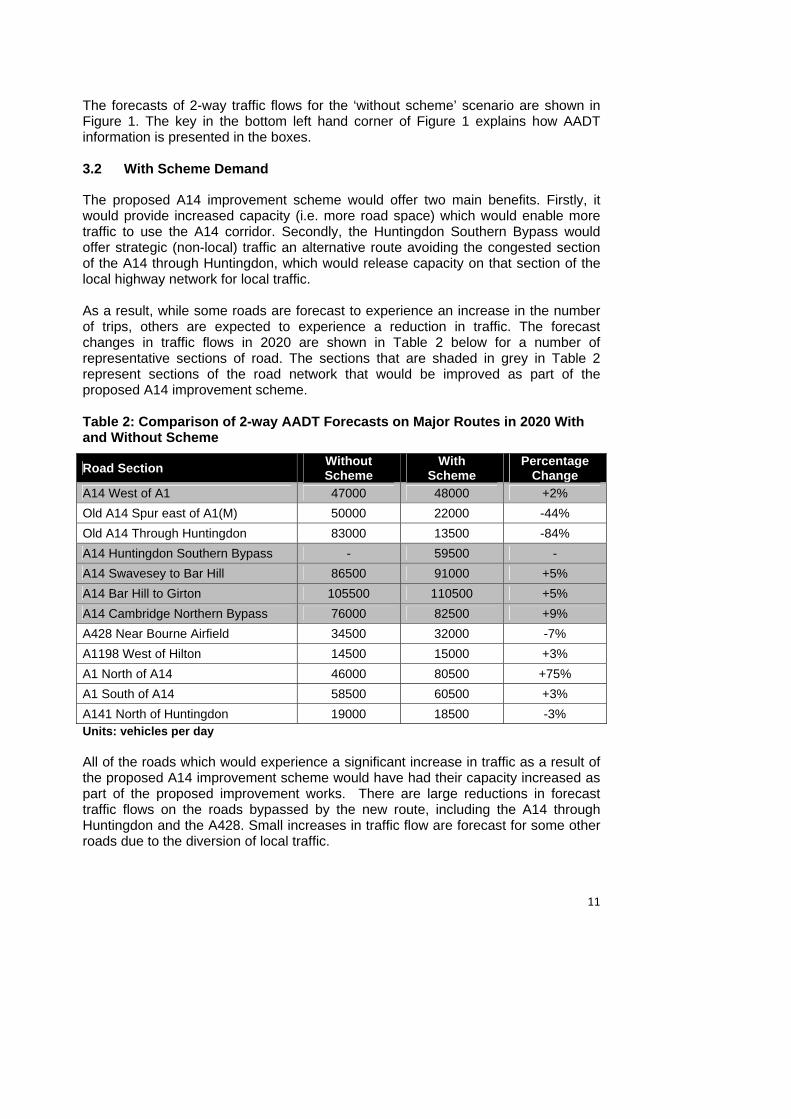
The proposed A14 improvement scheme would offer two main benefits. Firstly, it would provide increased capacity (i.e. more road space) which would enable more traffic to use the A14 corridor. Secondly, the Huntingdon Southern Bypass would offer strategic (non-local) traffic an alternative route avoiding the congested section of the A14 through Huntingdon, which would release capacity on that section of the local highway network for local traffic. As a result, while some roads are forecast to experience an increase in the number of trips, others are expected to experience a reduction in traffic. The forecast changes in traffic flows in 2020 are shown in Table 2 below for a number of representative sections of road. The sections that are shaded in grey in Table 2 represent sections of the road network that would be improved as part of the proposed A14 improvement scheme. Table 2: Comparison of 2-way AADT Forecasts on Major Routes in 2020 With and Without Scheme
Units: vehicles per day All of the roads which would experience a significant increase in traffic as a result of the proposed A14 improvement scheme would have had their capacity increased as part of the proposed improvement works. There are large reductions in forecast traffic flows on the roads bypassed by the new route, including the A14 through Huntingdon and the A428. Small increases in traffic flow are forecast for some other roads due to the diversion of local traffic.
Road Section Without Scheme
With Scheme
Percentage Change
A14 West of A1 47000 48000 +2%
Old A14 Spur east of A1(M) 50000 22000 -44%
Old A14 Through Huntingdon 83000 13500 -84%
A14 Huntingdon Southern Bypass - 59500 -
A14 Swavesey to Bar Hill 86500 91000 +5%
A14 Bar Hill to Girton 105500 110500 +5%
A14 Cambridge Northern Bypass 76000 82500 +9%
A428 Near Bourne Airfield 34500 32000 -7%
A1198 West of Hilton 14500 15000 +3%
A1 North of A14 46000 80500 +75%
A1 South of A14 58500 60500 +3%
A141 North of Huntingdon 19000 18500 -3%

12
The forecast changes in AADT in 2035 as a result of the proposed A14 improvement scheme are shown in Table 3 below. Table 3: Comparison of 2-way AADT Forecasts on Major Routes in 2035 With and Without Scheme
Units: vehicles per day In proportional terms, the forecast impact of the proposed new Huntingdon Southern Bypass on traffic flows in 2035 is similar to that forecast to occur in 2020. The most significant difference between the two assessment years (2020 and 2035) is forecast to occur on the A14 between Cambridge and Huntingdon. Here the extra capacity introduced by the proposed A14 improvement scheme allows this route to carry more traffic, offering more significant relief to the A428 and A1198. The forecast 2-way traffic flows for the ‘with scheme’ scenario are shown in Figure 1. The key in the bottom left hand corner of Figure 1 explains how AADT information is presented in the boxes.
Road Section Without Scheme
With Scheme
Percentage Change
A14 West of A1 54000 56500 +5%
Old A14 Spur east of A1(M) 57500 26500 -54%
Old A14 Through Huntingdon 90000 16000 -84%
A14 Huntingdon Southern Bypass - 74500 -
A14 Swavesey to Bar Hill 89500 106500 +19%
A14 Bar Hill to Girton 113500 132000 +16%
A14 Cambridge Northern Bypass 85000 96000 +13%
A428 Near Bourne Airfield 47000 39000 -17%
A1198 West of Hilton 23000 19000 -18%
A1 North of A14 60000 102500 +71%
A1 South of A14 69000 72000 +4%
A141 North of Huntingdon 21000 20500 -3%

13
Figure 1: Opening Year (2020) and Design Year (2035) Annual Average Daily Traffic Forecasts

14
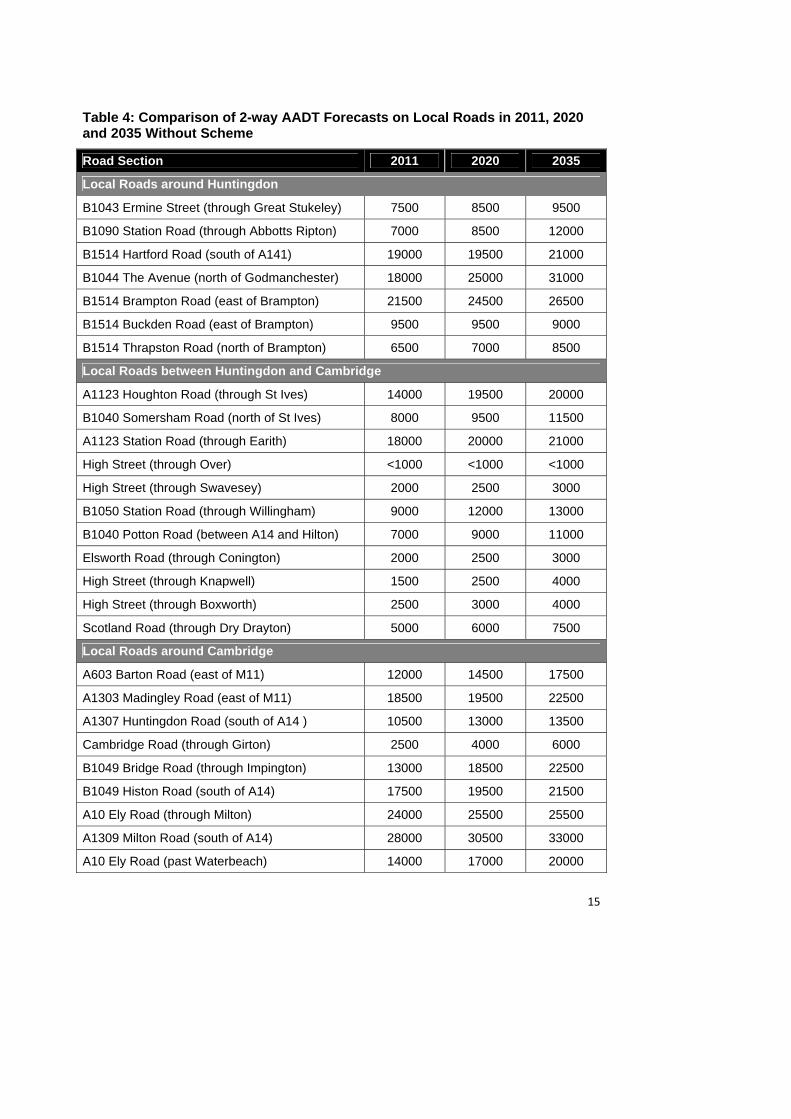
4.0 Traffic Forecasts on Local Roads Traffic patterns on local roads are expected to change significantly as a result of the proposed A14 improvements scheme. Some local roads will experience a reduction in traffic flow as the additional new road capacity will allow some trips to divert back on to the improved A14. However, vehicle movements are predicted to increase on other roads as a result of the release of traffic that is currently being suppressed or is diverting from other routes. In some cases these two effects are forecast to counterbalance each other, resulting in little or no change. The relationship between the A14 and these local roads is complex and it is therefore much harder to predict with certainty what the impact on individual routes will be. The interim traffic forecasts presented below represent our current view of the impact that the proposed A14 improvement scheme would have on some key local roads; however, the forecasts may change as the proposed scheme and our understanding of current traffic patterns continues to evolve. 4.1 Without Scheme Demand Table 4 overleaf compares forecast AADT flows in 2020 and 2035 on a selection of local roads around Huntingdon and Cambridge without the proposed A14 improvement scheme in place. This data shows that traffic flows are forecast to grow by 10-30% between 2011 and 2020, although the level of growth on individual routes varies significantly. A large proportion of this forecast increase is attributable to an increase in background traffic associated with expected economic growth in the region; however, some of the forecast growth is the result of traffic diverting on to local roads to avoid congestion on the A14 around Cambridge and Huntingdon. By 2035 many sections of the road network are forecast to experience a further increase in traffic levels of 10-20%, bringing overall traffic growth on some sections of the road network between 2011 and 2035 to over 50%. Again, while some of this growth can be ascribed to economic development, the impact of congestion on the A14 is one of the main influencing factors with an increasing proportion of traffic predicted to divert on to local roads as a result.
15
Table 4: Comparison of 2-way AADT Forecasts on Local Roads in 2011, 2020 and 2035 Without Scheme
Road Section 2011 2020 2035
Local Roads around Huntingdon
B1043 Ermine Street (through Great Stukeley) 7500 8500 9500
B1090 Station Road (through Abbotts Ripton) 7000 8500 12000
B1514 Hartford Road (south of A141) 19000 19500 21000
B1044 The Avenue (north of Godmanchester) 18000 25000 31000
B1514 Brampton Road (east of Brampton) 21500 24500 26500
B1514 Buckden Road (east of Brampton) 9500 9500 9000
B1514 Thrapston Road (north of Brampton) 6500 7000 8500
Local Roads between Huntingdon and Cambridge
A1123 Houghton Road (through St Ives) 14000 19500 20000
B1040 Somersham Road (north of St Ives) 8000 9500 11500
A1123 Station Road (through Earith) 18000 20000 21000
High Street (through Over) <1000 <1000 <1000
High Street (through Swavesey) 2000 2500 3000
B1050 Station Road (through Willingham) 9000 12000 13000
B1040 Potton Road (between A14 and Hilton) 7000 9000 11000
Elsworth Road (through Conington) 2000 2500 3000
High Street (through Knapwell) 1500 2500 4000
High Street (through Boxworth) 2500 3000 4000
Scotland Road (through Dry Drayton) 5000 6000 7500
Local Roads around Cambridge
A603 Barton Road (east of M11) 12000 14500 17500
A1303 Madingley Road (east of M11) 18500 19500 22500
A1307 Huntingdon Road (south of A14 ) 10500 13000 13500
Cambridge Road (through Girton) 2500 4000 6000
B1049 Bridge Road (through Impington) 13000 18500 22500
B1049 Histon Road (south of A14) 17500 19500 21500
A10 Ely Road (through Milton) 24000 25500 25500
A1309 Milton Road (south of A14) 28000 30500 33000
A10 Ely Road (past Waterbeach) 14000 17000 20000

16
Units: vehicles per day 4.2 With Scheme Demand Tables 5 and 6 compare forecast AADT flows on these local roads with and without the proposed A14 improvement scheme in 2020 and 2035 respectively. The forecasts show that many of the key radial routes around Huntingdon would experience a reduction in traffic flows as a result of the proposed A14 improvement scheme, while many of the key radial routes around Cambridge would experience some traffic growth due to the release of suppressed demand in this area. The picture for the towns and villages to the north and south of the A14 between Cambridge and Huntingdon is mixed. Some settlements are forecast to experience an increase as local traffic would divert through them to obtain access to the A14 rather than using other routes such as the A1198/A428, while others would benefit from this diversion of local traffic and see a reduction in traffic. While the percentage changes in traffic flow may appear large in some places, in overall terms the absolute change in traffic is expected to be relatively small, with flows on most sections of the road network predicted to change by no more than 500-1,000 vehicles per day.

17
Table 5: Comparison of 2-way AADT Forecasts on Local Roads in 2020 With and Without Scheme
Road Section Without Scheme
With Scheme
Percentage Change
Local Roads around Huntingdon
B1043 Ermine Street (through Great Stukeley) 8500 6500 -24%
B1090 Station Road (through Abbotts Ripton) 8500 7500 -12%
B1514 Hartford Road (south of A141) 19500 16500 -15%
B1044 The Avenue (north of Godmanchester) 25000 9500 -62%
B1514 Brampton Road (east of Brampton) 24500 27000 +10%
B1514 Buckden Road (east of Brampton) 9500 8500 -11%
B1514 Thrapston Road (north of Brampton) 7000 3500 -50%
Local Roads between Huntingdon and Cambridge
A1123 Houghton Road (through St Ives) 19500 19500 0%
B1040 Somersham Road (north of St Ives) 9500 9500 0%
A1123 Station Road (through Earith) 20000 19500 -3%
High Street (through Over) <1000 <1000 0%
High Street (through Swavesey) 2500 2000 -20%
B1050 Station Road (through Willingham) 12000 12500 +4%
B1040 Potton Road (between A14 and Hilton) 9000 9500 +6%
Elsworth Road (through Conington) 2500 2500 0%
High Street (through Knapwell) 2500 2000 -20%
High Street (through Boxworth) 3000 3000 0%
Scotland Road (through Dry Drayton) 6000 7000 +17%
Local Roads around Cambridge
A603 Barton Road (east of M11) 14500 14500 0%
A1303 Madingley Road (east of M11) 19500 19000 -3%
A1307 Huntingdon Road (south of A14 ) 13000 13500 +4%
Cambridge Road (through Girton) 4000 4500 +13%
B1049 Bridge Road (through Impington) 18500 21000 +14%
B1049 Histon Road (south of A14) 19500 19500 0%
A10 Ely Road (through Milton) 25500 25500 0%
A1309 Milton Road (south of A14) 30500 31000 +2%
A10 Ely Road (past Waterbeach) 17000 16500 -3%

18
Units: vehicles per day

19
Table 6: Comparison of 2-way AADT Forecasts on Local Roads in 2035 With and Without Scheme
Road Section Without Scheme
With Scheme
Percentage Change
Local Roads around Huntingdon
B1043 Ermine Street (through Great Stukeley) 9500 7000 -26%
B1090 Station Road (through Abbotts Ripton) 12000 9000 -25%
B1514 Hartford Road (south of A141) 21000 19500 -7%
B1044 The Avenue (north of Godmanchester) 31000 13000 -58%
B1514 Brampton Road (east of Brampton) 26500 28500 +8%
B1514 Buckden Road (east of Brampton) 9000 8500 -6%
B1514 Thrapston Road (north of Brampton) 8500 4000 -53%
Local Roads between Huntingdon and Cambridge
A1123 Houghton Road (through St Ives) 20000 19500 -3%
B1040 Somersham Road (north of St Ives) 11500 11500 0%
A1123 Station Road (through Earith) 21000 20500 -2%
High Street (through Over) <1000 <1000 0%
High Street (through Swavesey) 3000 3000 0%
B1050 Station Road (through Willingham) 13000 14000 +8%
B1040 Potton Road (between A14 and Hilton) 11000 11500 +5%
Elsworth Road (through Conington) 3000 3000 0%
High Street (through Knapwell) 4000 3000 -25%
High Street (through Boxworth) 4000 4000 0%
Scotland Road (through Dry Drayton) 7500 7500 0%
Local Roads around Cambridge
A603 Barton Road (east of M11) 17500 17500 0%
A1303 Madingley Road (east of M11) 22500 21000 -7%
A1307 Huntingdon Road (south of A14 ) 13500 15500 +15%
Cambridge Road (through Girton) 6000 6000 0%
B1049 Bridge Road (through Impington) 22500 23500 +4%
B1049 Histon Road (south of A14) 21500 22500 +5%
A10 Ely Road (through Milton) 25500 25500 0%
A1309 Milton Road (south of A14) 33000 34500 +5%
A10 Ely Road (past Waterbeach) 20000 20000 0%

20
Units: vehicles per day
21
5.0 Network Performance In addition to examining the forecast change in traffic flows, we have also assessed the potential network performance benefits of the proposed A14 improvement scheme in terms of network capacity and journey times.
5.1 Network Capacity Network capacity indicates how much of the available route capacity is being used at any point in time. It is measured by calculating the volume to capacity ratio, which compares the forecast travel demand to the theoretical available capacity over a given time period. The resultant statistic represents the percentage of capacity being used, with a figure of 90% or above being indicative of road congestion and increasing unreliability. In the case of the proposed A14 improvement scheme, the new Huntingdon Southern Bypass is forecast to be operating at 50%-60% capacity by 2020. This represents a significant improvement compared with the existing A14 route through Huntingdon, which is forecast to be operating at between 85%-100% capacity by this time if the proposed scheme does not go ahead. By 2035, the new Huntingdon Southern Bypass is forecast to be operating at 65-75% capacity while the existing A14 route through Huntingdon is forecast to be operating at 95%-110% capacity by this time if the proposed scheme does not go ahead. Again this shows that the proposed scheme would offer significant benefits and would avoid any potential suppression of demand or diversion of traffic on to other local roads, which forecasts indicate would be likely to occur if the proposed scheme did not go ahead. The proposed scheme is also expected to provide capacity benefits on the section of the A14 between Swavesey (Junction 28) and Girton (Junction 31). In 2035 this section of road is forecast to be operating at between 70%-80% capacity as a result of the proposed scheme widening works compared with 85%-100% if the proposed scheme did not go ahead. 5.2 Journey Times In addition to network capacity, we have extracted forecasts of average peak period journey times from the road traffic model for the following routes in 2020 and 2035:
Route 1: A14 J20 Ellington – A14 J31 Girton (via Huntingdon)
Route 2: A14 J20 Ellington – A14 J31 Girton (via Huntingdon Southern Bypass)
Route 3: A1 J14 Alconbury – A14 J31 Girton (via Huntingdon)
Route 4: A1 J14 Alconbury – A14 J31 Girton (via Huntingdon Southern Bypass)
These routes are shown in Figure 2 overleaf.

22
Figure 2: Journey Times Routes
23
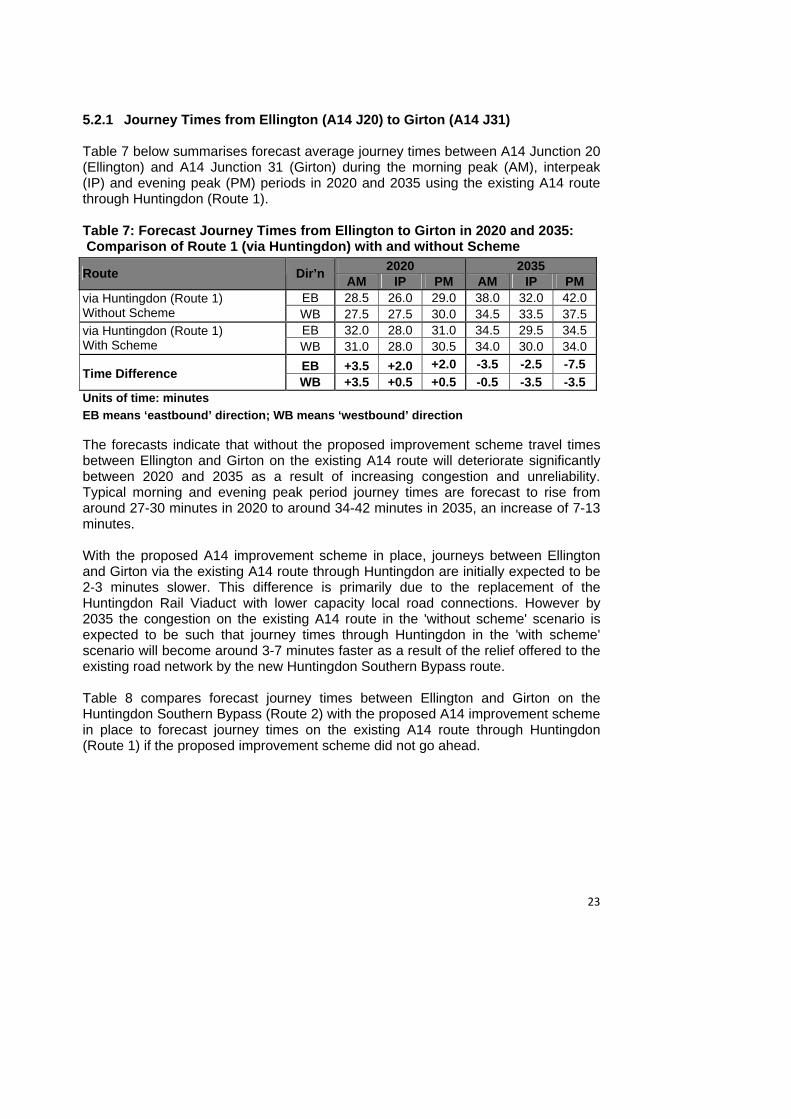
5.2.1 Journey Times from Ellington (A14 J20) to Girton (A14 J31) Table 7 below summarises forecast average journey times between A14 Junction 20 (Ellington) and A14 Junction 31 (Girton) during the morning peak (AM), interpeak (IP) and evening peak (PM) periods in 2020 and 2035 using the existing A14 route through Huntingdon (Route 1). Table 7: Forecast Journey Times from Ellington to Girton in 2020 and 2035: Comparison of Route 1 (via Huntingdon) with and without Scheme
2020 2035 Route Dir’n
AM IP PM AM IP PM EB 28.5 26.0 29.0 38.0 32.0 42.0 via Huntingdon (Route 1)
Without Scheme WB 27.5 27.5 30.0 34.5 33.5 37.5 EB 32.0 28.0 31.0 34.5 29.5 34.5 via Huntingdon (Route 1)
With Scheme WB 31.0 28.0 30.5 34.0 30.0 34.0
EB +3.5 +2.0 +2.0 -3.5 -2.5 -7.5 Time Difference
WB +3.5 +0.5 +0.5 -0.5 -3.5 -3.5 Units of time: minutes
EB means ‘eastbound’ direction; WB means ‘westbound’ direction The forecasts indicate that without the proposed improvement scheme travel times between Ellington and Girton on the existing A14 route will deteriorate significantly between 2020 and 2035 as a result of increasing congestion and unreliability. Typical morning and evening peak period journey times are forecast to rise from around 27-30 minutes in 2020 to around 34-42 minutes in 2035, an increase of 7-13 minutes. With the proposed A14 improvement scheme in place, journeys between Ellington and Girton via the existing A14 route through Huntingdon are initially expected to be 2-3 minutes slower. This difference is primarily due to the replacement of the Huntingdon Rail Viaduct with lower capacity local road connections. However by 2035 the congestion on the existing A14 route in the 'without scheme' scenario is expected to be such that journey times through Huntingdon in the 'with scheme' scenario will become around 3-7 minutes faster as a result of the relief offered to the existing road network by the new Huntingdon Southern Bypass route. Table 8 compares forecast journey times between Ellington and Girton on the Huntingdon Southern Bypass (Route 2) with the proposed A14 improvement scheme in place to forecast journey times on the existing A14 route through Huntingdon (Route 1) if the proposed improvement scheme did not go ahead.

24
Table 8: Forecast Journey Times from Ellington to Girton in 2020 and 2035: Comparison of Route 1 (via Huntingdon) and Route 2 (via Bypass)
2020 2035 Route Dir’n
AM IP PM AM IP PM EB 28.5 26.0 29.0 38.0 32.0 42.0 via Huntingdon (Route 1)
Without Scheme WB 27.5 27.5 30.0 34.5 33.5 37.5 EB 19.5 19.5 19.5 21.0 21.0 22.0 via Huntingdon Bypass (Route 2)
With Scheme WB 19.5 20.0 20.0 20.5 21.5 21.0 EB -9.0 -6.5 -9.5 -17.0 -11.0 -20.0
Time Difference WB -8.0 -7.5 -10.0 -14.0 -12.0 -16.5
Units of time: minutes
EB means ‘eastbound’ direction; WB means ‘westbound’ direction Table 8 shows that in 2020 journeys between Ellington and Girton via the Huntingdon Southern Bypass would be quicker than journeys on the existing A14 route via Huntingdon by around 8-10 minutes in the morning and evening peak periods and by around 6½ -7½ minutes in the interpeak period. By 2035 the journey time benefits associated with using the Bypass are expected to increase significantly with journey time savings of around 14-20 minutes in the morning and evening peak periods and around 11-12 minutes in the interpeak period. 5.2.2 Journey Times from Alconbury (A1 J14) to Girton (A14 J31) Table 9 summarises forecast average journey times between Alconbury (A1 Junction 14) and Girton (A14 Junction 31) during the morning peak, interpeak and evening peak periods in 2020 and 2035 with and without the proposed A14 improvement scheme. In Table 9, forecast, journey times are presented for the existing A14 route through Huntingdon (Route 3). Table 9: Forecast Journey Times from Alconbury to Girton in 2020 and 2035: Comparison of Route 3 (via Huntingdon) with and without scheme
2020 2035 Route Dir’n
AM IP PM AM IP PM EB 25.5 23.5 26.5 33.0 29.0 37.0 via Huntingdon (Route 3)
Without Scheme WB 25.5 26.0 28.0 32.5 31.5 35.5 EB 28.0 24.5 27.5 29.5 26.0 30.0 via Huntingdon (Route 3)
With Scheme WB 27.5 25.0 27.5 31.0 26.5 31.0 EB +2.5 +1.0 +1.0 -3.5 -3.0 -7.0
Time Difference WB +2.0 -1.0 -0.5 -1.5 -5.0 -4.5
Units of time: minutes
EB means ‘eastbound’ direction; WB means ‘westbound’ direction Again, if the proposed A14 improvement scheme is not implemented, a significant increase in journey times is forecast between 2020 and 2035 as a result of congestion on the existing A14 route. Morning and evening peak period journey

25
times are forecast to rise by around 7-10 minutes, while interpeak period journey times are expected to rise by around 5-6 minutes. The replacement of the Huntingdon Rail Viaduct with local road connections is forecast to increase journey times in 2020 due to the new route having lower capacity. However, as a result of the reduction in traffic generated by the A14 improvement scheme, journey times on the existing A14 via Huntingdon are not expected to change significantly between 2020 and 2035, resulting in journey time benefits of up to 7 minutes compared to the situation if the improvement scheme does not go ahead. Table 10 compares forecast journey times between Alconbury and Girton on the Huntingdon Southern Bypass (Route 4) with the proposed A14 improvement scheme in place, to forecast journey times on the existing A14 route through Huntingdon (Route 3) if the proposed improvement scheme did not go ahead. Table 10: Forecast Journey Times from Alconbury to Girton in 2020 and 2035: Comparison of Route 3 (via Huntingdon) and Route 4 (via Bypass)
2020 2035 Route Dir’n
AM IP PM AM IP PM EB 25.5 23.5 26.5 33.0 29.0 37.0 via Huntingdon (Route 3)
Without Scheme WB 25.5 26.0 28.0 32.5 31.5 35.5 EB 21.0 20.0 21.0 25.0 23.0 25.5 via Huntingdon Bypass (Route 4)
With Scheme WB 22.0 22.0 23.0 23.5 24.5 25.0 EB -4.5 -3.5 -5.5 -8.0 -6.0 -11.5
Time Difference WB -3.5 -4.0 -5.0 -9.0 -7.0 -10.5
Units of time: minutes
EB means ‘eastbound’ direction; WB means ‘westbound’ direction Table 10 shows that journeys between Alconbury and Girton via the new Huntingdon Southern Bypass are forecast to be around 3½ -5½ minutes quicker in 2020 and up to 11½ minutes quicker by 2035 compared with use of the existing A14 route if the proposed A14 improvement scheme did not go ahead.
26
6.0 Northstowe and Alconbury Weald In addition to the core traffic forecasts, we have undertaken an initial high level sensitivity test to confirm that the proposed A14 improvement scheme can accommodate the potential higher levels of growth predicted from the proposed large-scale developments which although not currently committed are expected to come forward in the period up to 2035. This is referred to below as the ‘high growth sensitivity test’. The high growth sensitivity test assumes full build out of the proposed developments at Alconbury Weald (5,000 homes, 8,000 jobs) and Northstowe (10,000 homes), although these developments may not actually be fully occupied by 2035. Other emerging development sites, such as those at Bourn Airfield, Cambourne West and Waterbeach are at a much earlier planning stage and have therefore not been included in this high growth sensitivity test. However, should their planning status change, these developments will be considered in the next set of traffic forecasts for the proposed scheme, which are expected to be available in Summer 2014. The high growth sensitivity test allows for road improvements that will be brought forward with the Alconbury Weald and Northstowe developments. At Alconbury this includes new accesses on to the Megatron Roundabout, Ermine Street and the A141 around Huntingdon as well as improvements to the B1043 Rusts Lane. The Northstowe development includes new connections to the B1050 south of Longstanton and to Dry Drayton Road south of Oakington, with the B1050 becoming dual carriageway between the new access road and the Bar Hill junction.
27
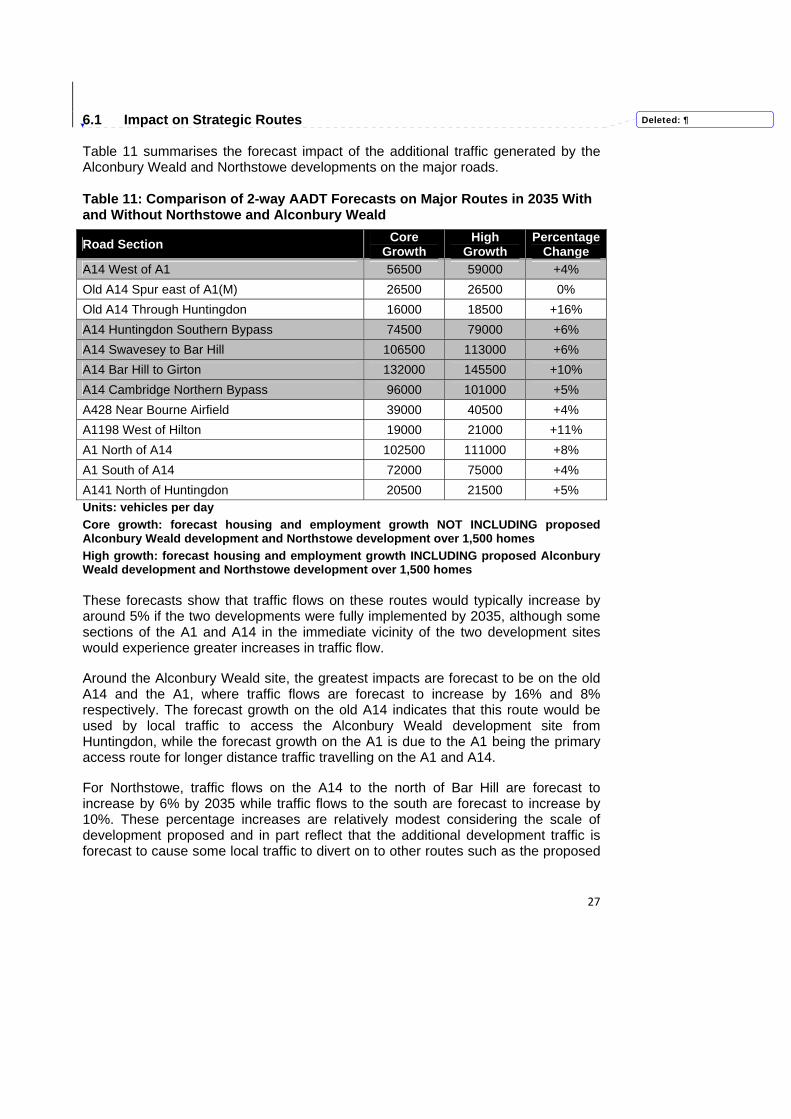
6.1 Impact on Strategic Routes Table 11 summarises the forecast impact of the additional traffic generated by the Alconbury Weald and Northstowe developments on the major roads. Table 11: Comparison of 2-way AADT Forecasts on Major Routes in 2035 With and Without Northstowe and Alconbury Weald
Units: vehicles per day
Core growth: forecast housing and employment growth NOT INCLUDING proposed Alconbury Weald development and Northstowe development over 1,500 homes
High growth: forecast housing and employment growth INCLUDING proposed Alconbury Weald development and Northstowe development over 1,500 homes These forecasts show that traffic flows on these routes would typically increase by around 5% if the two developments were fully implemented by 2035, although some sections of the A1 and A14 in the immediate vicinity of the two development sites would experience greater increases in traffic flow. Around the Alconbury Weald site, the greatest impacts are forecast to be on the old A14 and the A1, where traffic flows are forecast to increase by 16% and 8% respectively. The forecast growth on the old A14 indicates that this route would be used by local traffic to access the Alconbury Weald development site from Huntingdon, while the forecast growth on the A1 is due to the A1 being the primary access route for longer distance traffic travelling on the A1 and A14. For Northstowe, traffic flows on the A14 to the north of Bar Hill are forecast to increase by 6% by 2035 while traffic flows to the south are forecast to increase by 10%. These percentage increases are relatively modest considering the scale of development proposed and in part reflect that the additional development traffic is forecast to cause some local traffic to divert on to other routes such as the proposed
Road Section Core
Growth High
Growth Percentage
Change
A14 West of A1 56500 59000 +4%
Old A14 Spur east of A1(M) 26500 26500 0%
Old A14 Through Huntingdon 16000 18500 +16%
A14 Huntingdon Southern Bypass 74500 79000 +6%
A14 Swavesey to Bar Hill 106500 113000 +6%
A14 Bar Hill to Girton 132000 145500 +10%
A14 Cambridge Northern Bypass 96000 101000 +5%
A428 Near Bourne Airfield 39000 40500 +4%
A1198 West of Hilton 19000 21000 +11%
A1 North of A14 102500 111000 +8%
A1 South of A14 72000 75000 +4%
A141 North of Huntingdon 20500 21500 +5%
Deleted: 

28
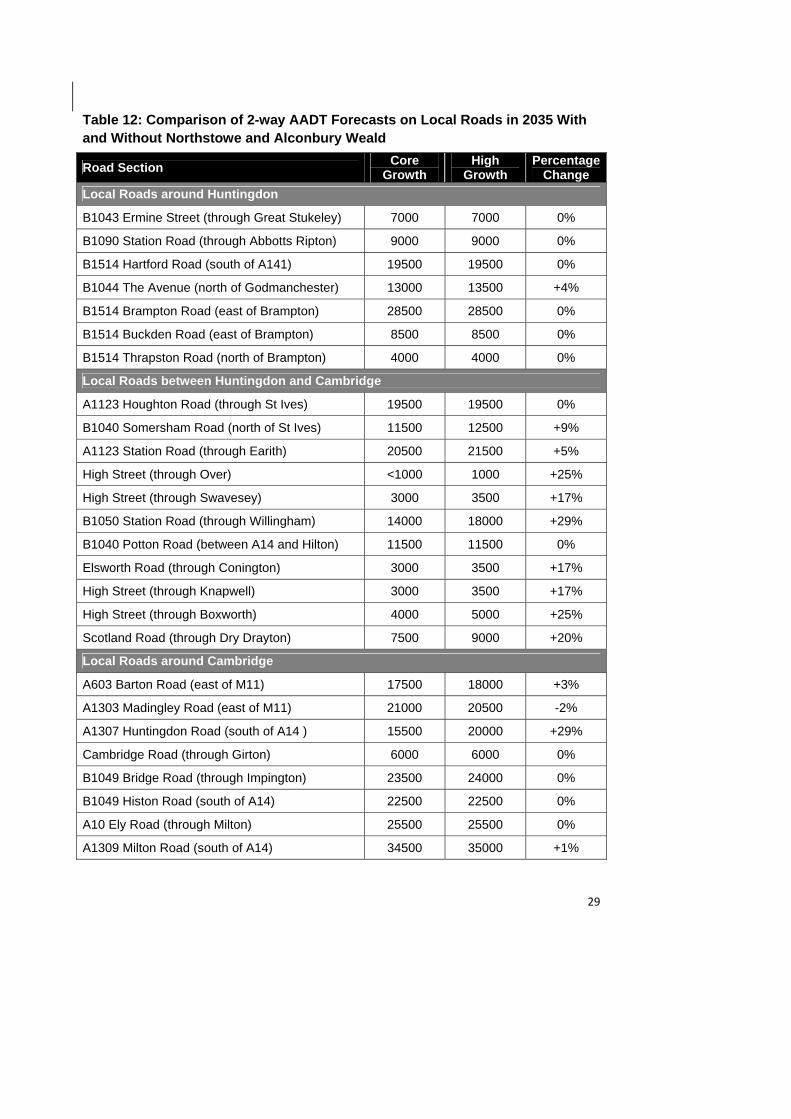
Local Access Road that will run parallel with the A14 along this section of the network. 6.2 Impact on Local Roads As well as examining the impact of these proposed developments on the major routes, we have also considered the potential impacts on other local roads. Table 12 shows the forecast impact of the Alconbury Weald and Northstowe developments on a selection of local roads. In general, the local roads around Huntingdon and Cambridge are not forecast to experience a significant change in traffic flows as a result of the two proposed developments, indicating that the impacts of the developments are expected to be relatively localised. The impacts on local roads between Huntingdon and Cambridge are more apparent with some routes forecast to experience increases in traffic of up to 30%, particularly those roads to the north of the A14 in the immediate vicinity of Northstowe. Significant changes are also forecast on local roads to the south of the A14; these changes are primarily due to the forecast re-routing of some local traffic to avoid the sections of the A14 on which the development traffic is forecast to have the greatest impact. The A1307 into Cambridge is forecast to experience a significant increase in traffic flows as Northstowe development traffic would use this route to access the city rather than the A14. Similarly around Huntingdon, traffic flows are forecast to increase significantly on St Peter’s Road as some Alconbury development traffic would use this route to access Huntingdon as an alternative to using either the old A14 or Ermine Street.
29
Table 12: Comparison of 2-way AADT Forecasts on Local Roads in 2035 With and Without Northstowe and Alconbury Weald
Road Section Core
Growth High
Growth Percentage
Change
Local Roads around Huntingdon
B1043 Ermine Street (through Great Stukeley) 7000 7000 0%
B1090 Station Road (through Abbotts Ripton) 9000 9000 0%
B1514 Hartford Road (south of A141) 19500 19500 0%
B1044 The Avenue (north of Godmanchester) 13000 13500 +4%
B1514 Brampton Road (east of Brampton) 28500 28500 0%
B1514 Buckden Road (east of Brampton) 8500 8500 0%
B1514 Thrapston Road (north of Brampton) 4000 4000 0%
Local Roads between Huntingdon and Cambridge
A1123 Houghton Road (through St Ives) 19500 19500 0%
B1040 Somersham Road (north of St Ives) 11500 12500 +9%
A1123 Station Road (through Earith) 20500 21500 +5%
High Street (through Over) <1000 1000 +25%
High Street (through Swavesey) 3000 3500 +17%
B1050 Station Road (through Willingham) 14000 18000 +29%
B1040 Potton Road (between A14 and Hilton) 11500 11500 0%
Elsworth Road (through Conington) 3000 3500 +17%
High Street (through Knapwell) 3000 3500 +17%
High Street (through Boxworth) 4000 5000 +25%
Scotland Road (through Dry Drayton) 7500 9000 +20%
Local Roads around Cambridge
A603 Barton Road (east of M11) 17500 18000 +3%
A1303 Madingley Road (east of M11) 21000 20500 -2%
A1307 Huntingdon Road (south of A14 ) 15500 20000 +29%
Cambridge Road (through Girton) 6000 6000 0%
B1049 Bridge Road (through Impington) 23500 24000 0%
B1049 Histon Road (south of A14) 22500 22500 0%
A10 Ely Road (through Milton) 25500 25500 0%
A1309 Milton Road (south of A14) 34500 35000 +1%

30
Units: vehicles per day
Core growth: forecast housing and employment growth NOT INCLUDING proposed Alconbury Weald development and Northstowe development over 1,500 homes
High growth: forecast housing and employment growth INCLUDING proposed Alconbury Weald development and Northstowe development over 1,500 homes
A10 Ely Road (past Waterbeach) 20000 20000 0%

31
7.0 Next Steps
As noted above, the traffic figures presented in this document are interim forecasts based on the best information that is currently available. Further traffic forecasts will be produced as the proposed scheme progresses and these forecasts will take account of the evolving scheme design and any changes to underlying growth assumptions. As part of this process, further enhancements will also be made to the road traffic model, CHARM, to ensure that it is representative of current travel patterns. To inform these enhancements an extensive data collection exercise has been undertaken to obtain up to date traffic information (traffic flows and journey times). Number plate recognition technology and aggregated mobile phone signal data has also been used to give a better understanding of the routes that traffic currently uses. New runs of the Cambridge Sub-Regional Model will also be carried out, taking account of the Local Planning Authorities’ latest views on future planning growth in the region including dependent developments, and the Local Highway Authorities’ expectations for other road improvement schemes. This information will be used to generate estimates of the travel demand in 2014, and new forecasts of travel patterns in 2020 and 2035 with and without the A14 improvement scheme. Updated traffic forecasts relating to the proposed scheme are expected to be available in Summer 2014.

If you need help using this or any other Highways Agency information, please call 0300 123 5000* and we will assist you.
© Crown copyright 2014. You may re-use this information (not including logos) free of charge in any format or medium, under the terms of the Open Government Licence. To view this licence, visit http://www.nationalarchives.gov.uk/doc/open-government-licence/ or write to the Information Policy Team, The National Archives, Kew, London TW9 4DU, or email: [email protected].
This document is also available on our website at www.highways.gov.uk
If you have any enquiries about this publication email [email protected] or call 0300 123 5000*Please quote Highways Agency publications code PR214/13
* Calls to 03 num bers cost no more than a national rate call to an 01 or 02 num ber and must count towards any inclu sive min utes in the same way as 01 and 02 calls. These rules apply to calls from any type of line includ ing mobile, BT, other fixed line or payphone. Calls may be recorded or monitored.
Highways Agency media services. Job number S130732
Printed on paper from well-managed forests and other controlled sources