cambridge international … (9790)/9790_y16_sp_4.pdfthe enzyme lipase catalyses the hydrolysis of...
TRANSCRIPT
The syllabus is approved for use in England, Wales and Northern Ireland as a Cambridge International Level 3 Pre-U Certificate.
This document consists of 14 printed pages and 2 blank pages.
© UCLES 2013 [Turn over
*0123456789*
Cambridge International Examinations Cambridge Pre-U Certificate
BIOLOGY (PRINCIPAL) 9790/04
Paper 4 Practical For Examination from 2016
SPECIMEN PAPER
2 hours 30 minutes
Candidates answer on the Question Paper.
Additional Materials: As listed in the Confidential Instructions.
READ THESE INSTRUCTIONS FIRST
Write your Centre number, candidate number and name on all the work you hand in.
Write in dark blue or black pen.
You may use an HB pencil for any diagrams and graphs.
Do not use staples, paper clips, glue or correction fluid.
DO NOT WRITE IN ANY BARCODES.
Section A
Answer all questions.
Write your answers in the spaces provided on the Question Paper.
Section B
Answer all questions.
Write your answers in the spaces provided on the Question Paper.
Electronic calculators may be used.
You may lose marks if you do not show your working or if you do not use appropriate units.
At the end of the examination, fasten all your work securely together.
The number of marks is given in brackets [ ] at the end of each question or part question.
www.XtremePapers.com

2
© UCLES 2013 9790/04/SP/16
Section A
Answer all the questions.
You are recommended to spend no longer than 90 minutes on question 1. 1 You should read through the whole of this question carefully and then plan your use of the time to
make sure that you finish all the work that you would like to do. The enzyme lipase catalyses the hydrolysis of ester bonds in triglycerides. Its activity is affected
by the presence of bile salts. Full fat milk will be used as the source of triglycerides. You are to investigate the effect of different concentrations of bile salts on the rate of
hydrolysis of triglycerides in milk. You are provided with a 1% solution of lipase and a 5% solution of bile salts. Proceed as follows. 1 Use the syringes and the small beakers to prepare a number of different concentrations of
bile salts using the 5% bile salts solution and water provided. You will need a maximum of 10 cm3 of each bile salts solution.
(a) Complete the table below to show how you have prepared the different solutions.
final concentration of bile salts / %
volume of 5% bile salts solution / cm3
volume of water / cm3
[3] (b) Suggest suitable controls for this experiment.
[2]
3
© UCLES 2013 9790/04/SP/16 [Turn over
2 Label test-tubes with the concentrations of bile salts that you have prepared. 3 Prepare the labelled test-tubes with milk, sodium carbonate solution, bile salts solutions and
thymolphthalein solution, using the following quantities:
• 5.0 cm3 of milk
• 5.0 cm3 of sodium carbonate solution
• 1.0 cm3 of the appropriate bile salts solution
• three drops of thymolphthalein. 4 Label a test-tube or test-tubes with the control or controls that you have decided to use, and
prepare these appropriately 5 Put a bung into each test-tube in turn and invert twice so that the contents are a uniform blue
colour. 6 Put some warm water in a beaker to act as a water-bath. The beaker should be about
half-full. Adjust the temperature of the water to 50 oC (± 2 oC). 7 Place the test-tubes prepared in steps 3 and 4 into the water-bath. 8 Stir the lipase solution with the glass rod provided. Put 2.0 cm3 of the lipase solution into as
many labeled, clean test-tubes as you need for the concentrations of bile salts that you are testing and your controls. Place them in the water-bath.
9 Prepare the space on page 4 to record your results. (c) (i) As pH falls, the blue colour of the thymolphtahalein will fade until it is colourless. Describe how this is used to gain information about the rate of hydrolysis of the lipid in
the milk by lipase.
[3]
(ii) Measure and record the temperature in the water-bath at appropriate points during the
experiment. Record your measurements in the space below.
[1]
4
© UCLES 2013 9790/04/SP/16
10 After all the test-tubes have been in the water-bath for at least five minutes, add the lipase solution, from each test-tube, to the test-tubes containing the milk and bile salts solutions, and, where appropriate, to the control test-tubes as well.
Immediately after adding the lipase solution insert a bung into each test-tube and invert
twice to mix the contents. (d) You should record your results in a logical way, to show the effect of bile salts on the rate of
triglyceride hydrolysis by lipase in the space below. Record and justify any further decisions that you make about your investigation in the space
below the table.
[11]
5
© UCLES 2013 9790/04/SP/16 [Turn over
(e) Plot a graph of your results on the grid below to show the effect of the concentration of bile salts on the rate of hydrolysis of triglycerides.
[5]
6
© UCLES 2013 9790/04/SP/16
(f) Describe and explain the pattern of results shown by your graph.
[10]

7
© UCLES 2013 9790/04/SP/16 [Turn over
(g) Identify the limitations and sources of error in this investigation.
Explain how you would improve the method you used in this investigation to give more
accurate and valid results.
[10]
[Total: 45]

8
© UCLES 2013 9790/04/SP/16
BLANK PAGE
9
© UCLES 2013 9790/04/SP/16 [Turn over
Section B
Answer all the questions.
You are recommended to spend no longer than 60 minutes on question 2.
2 You should read through the whole of this question carefully and then plan your use of the time to
make sure that you finish all the work that you would like to do. R1 is a transverse section of the spinal cord of a small mammal. (a) (i) Make a low-power plan drawing of R1. Label your plan drawing. [6] (ii) Use a ruler to measure the actual size of the specimen on slide R1 and the size of your
drawing between the same points. Put a line on your drawing to show the size that you have measured. Calculate the magnification of your drawing.
Show your working. magnification …………….………………… [2]

10
© UCLES 2013 9790/04/SP/16
(b) Use the high-power lens of your microscope to locate a cell body of a motor neurone in R1. Make a labelled drawing to show the cell body. Annotate your drawing to indicate the functions of the structures you have drawn. Use the eyepiece graticule and stage micrometer to measure the diameter of the cell body.
Indicate the actual diameter on your drawing and show how you have derived your answer. [8]
11
© UCLES 2013 9790/04/SP/16 [Turn over
(c) Slide R2 is a transverse section of part of the brain of a small mammal. Compare, using a hand lens and your microscope, the structure and appearance of R1 and
R2. Present your comparison as a table in the space below. [5]
12
© UCLES 2013 9790/04/SP/16
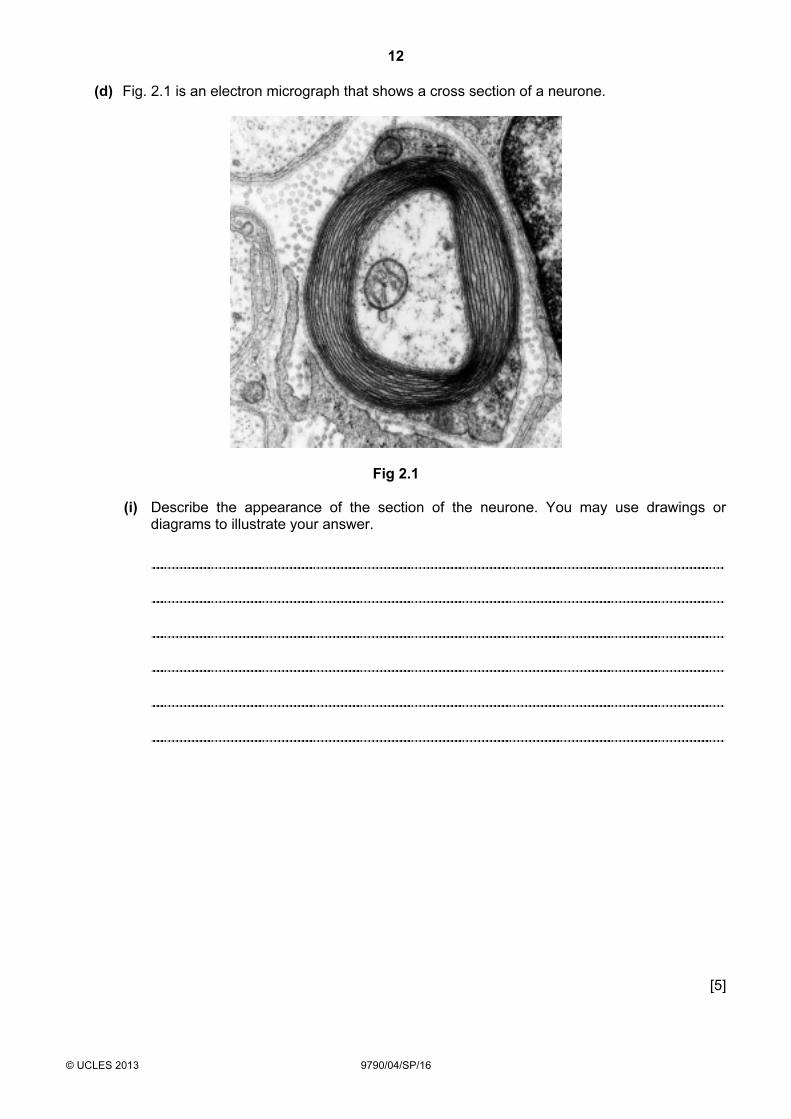
(d) Fig. 2.1 is an electron micrograph that shows a cross section of a neurone.
Fig 2.1 (i) Describe the appearance of the section of the neurone. You may use drawings or
diagrams to illustrate your answer.
[5]
13
© UCLES 2013 9790/04/SP/16 [Turn over
(ii) Explain how the structural features you describe in (i) are related to the function of the neurone.
[4]
14
© UCLES 2013 9790/04/SP/16
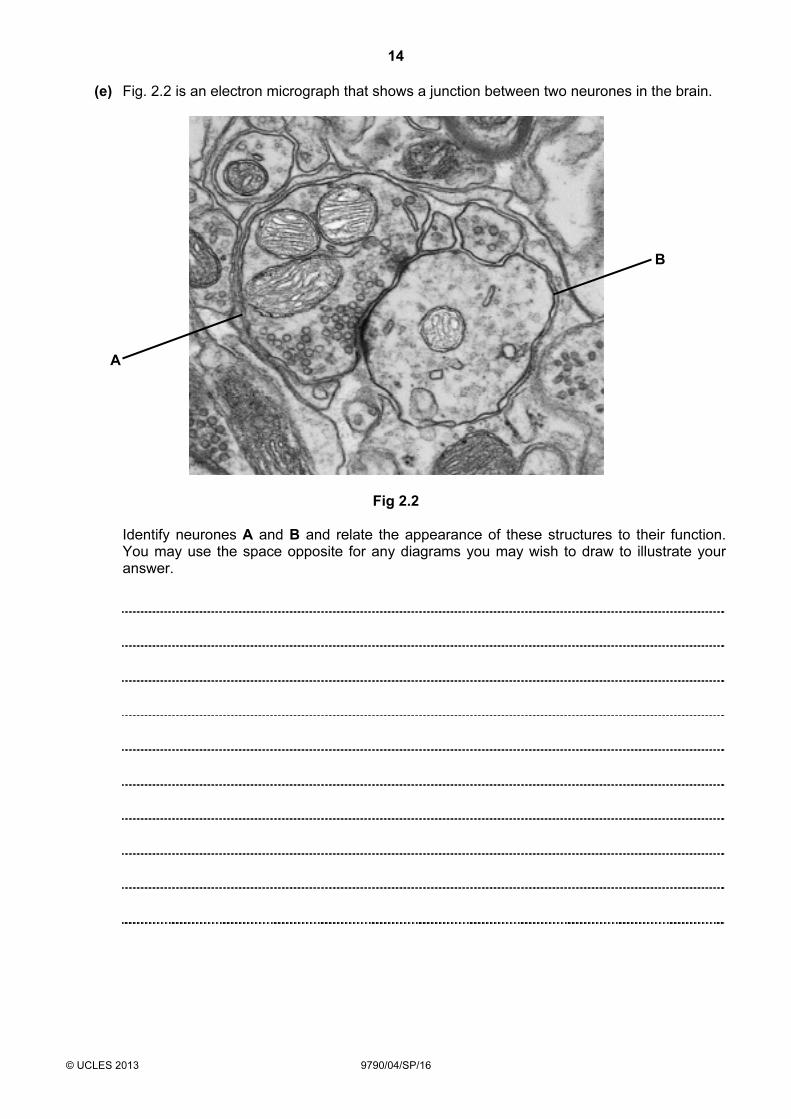
(e) Fig. 2.2 is an electron micrograph that shows a junction between two neurones in the brain.
Fig 2.2 Identify neurones A and B and relate the appearance of these structures to their function.
You may use the space opposite for any diagrams you may wish to draw to illustrate your answer.
A
B
15
© UCLES 2013 9790/04/SP/16
[5] [Total: 35]
16
Copyright Acknowledgements: Question 2 Figure 2.1 Myelinated neuron, Road not taken © Wikimedia Commons. Question 2 Figure 2.2 Synapse nerve junction, © Thomas Deerinck, NCMIR/Science Photo Library Permission to reproduce items where third-party owned material protected by copyright is included has been sought and cleared where possible. Every reasonable effort has been made by the publisher (UCLES) to trace copyright holders, but if any items requiring clearance have unwittingly been included, the publisher will be pleased to make amends at the earliest possible opportunity. Cambridge International Examinations is part of the Cambridge Assessment Group. Cambridge Assessment is the brand name of University of Cambridge Local Examinations Syndicate (UCLES), which is itself a department of the University of Cambridge.
© UCLES 2013 9790/04/SP/16
BLANK PAGE