caltrain / hsr blended service plan operations ...modernization+program/blended... · analyze a...
TRANSCRIPT
Caltrain / HSR Blended Service Plan Operations Considerations Analysis
(Requested by Stakeholders)
FINAL
Prepared for: Peninsula Corridor Joint Powers Board (JPB) Prepared by: CalMod Program Team
June 2013

This Page Intentionally Left Blank

Dear Stakeholders, During the last year, Caltrain staff with consultant support and stakeholder input, has been conducting planning efforts to advance the Caltrain Modernization program and the Caltrain/HSR blended system. This report, the Caltrain/HSR Blended Service Plan Operations Consideration Analysis, is one of the efforts related to planning the Caltrain/HSR blended system. To fully understand the key model inputs and parameters that were used in this study, it is critical to review the Caltrain/HSR Blended Operations Analysis prepared in March 2012 (http://www.caltrain.com/Assets/Caltrain+Modernization+Program/Documents/Final-Caltrain-California+HSR+Blended+Operations+Analysis.pdf). The 2012 analysis determined that a blended system in the peninsula is operationally viable using a computer simulation model that was specially customized for the Caltrain corridor. The Caltrain/HSR Blended Service Plan Operations Consideration Analysis was prepared in response to stakeholders’ interests in analyzing additional blended system operating scenarios not evaluated in the Caltrain/HSR Blended Operations Analysis. This analysis concluded that all of the tested options are viable as simulated in the model. However, the simulations also revealed that there are performance differences between the options examined. This analysis does not include any policy or planning recommendations, but serves an educational purpose. As planning for the blended system continues, additional analysis will be needed to confirm the simulated performance of the options considered relative to real world system operations. Thank you for participating in the blended system planning process. We appreciate your time and your efforts in shaping this report and partaking in the necessary discussions to shape the future of the peninsula corridor.
Marian Lee, AICP Executive Officer, Caltrain Modernization Program

ACKNOWLEDGEMENTS
BOARD OF DIRECTORS 2013
Ken Yeager, Chair Tom Nolan, Vice Chair Jose Cisneros Malia Cohen Jerry Deal Ash Kalra Arthur L. Lloyd Adrienne Tissier Perry Woodward EXECUTIVE DIRECTOR
Michael J. Scanlon EXECUTIVE TEAM
Virginia Harrington Deputy CEO Chuck Harvey Deputy CEO April Chan Executive Officer, Planning and Development Rita Haskin Executive Officer, Customer Service & Marketing Marian Lee Executive Officer, Caltrain Modernization Program Martha Martinez Board Secretary Mark Simon Executive Officer, Public Affairs David Miller Joan Cassman General Counsel - Hanson Bridgett
PROJECT TEAM
Caltrain Staff
Michelle Bouchard Director, Rail Transportation Melanie Choy Planning Manager Stacy Cocke Senior Planner Steve Hill Chief Engineer, Track & Structures Liria Larano Director, Engineering & Construction
Consultant Support
Bill Lipfert Practice Manager for Rail Operations Planning & Simulation, LTK Engineering Services Dave Elliott Senior Consultant, LTK Engineering Services Steve Crosley Project Manager, Fehr & Peers

TABLE OF CONTENTS
1. Executive Summary ...................................................................................................................................................... 1
2. Introduction ................................................................................................................................................................. 3
3. Context ........................................................................................................................................................................ 4
4. Overtake (Passing Track) Options Simulation ................................................................................................................ 9
Simulation Description .......................................................................................................................................................... 12
Long - Middle 4 Track Overtake ........................................................................................................................................ 12
Short - Middle 4 Track Overtake ....................................................................................................................................... 12
Middle 3 Track Overtake ................................................................................................................................................... 13
North 4 Track Overtake ..................................................................................................................................................... 14
South 4 Track Overtake ..................................................................................................................................................... 15
Simulation Results ................................................................................................................................................................. 16
5. Additional Infrastructure and Service Pattern Considerations ..................................................................................... 19
HSR Redwood City Station .................................................................................................................................................... 19
Simulation Description ...................................................................................................................................................... 19
Simluation Results ............................................................................................................................................................. 21
Downtown Extension Project (DTX) and Transbay Transit Center (TTC) ............................................................................... 21
Simluation description ...................................................................................................................................................... 21
Simluation Results ............................................................................................................................................................. 23
Dumbarton Rail ..................................................................................................................................................................... 23
Simluation Description ...................................................................................................................................................... 23
Simluation Results ............................................................................................................................................................. 26
Baby Bullet/Skip Stop Service ................................................................................................................................................ 26
Simluation Description ...................................................................................................................................................... 26
Simluation Results ............................................................................................................................................................. 29
6. Other Considerations ................................................................................................................................................. 30
Longer Train Consists and Less Train Frequency ................................................................................................................... 30
Ridership ........................................................................................................................................................................... 30
Passenger Boarding and Platform Length ......................................................................................................................... 31
Gate Down Time ............................................................................................................................................................... 31
High-Speed Rail Storage / Maintenance Facility ................................................................................................................... 32
Future ACE, Capitol Corridor, and Amtrak Services .............................................................................................................. 32
Freight Service ....................................................................................................................................................................... 33
7. Conclusion ................................................................................................................................................................. 35

This Page Intentionally Left Blank
Caltrain/HSR Blended Service Plan / Operations Considerations Analysis (Requested by Stakeholders) | 1
1. Executive Summary
Caltrain and the California High Speed Rail Authority are in a partnership to build a blended system in
the peninsula corridor. Both agencies have been working with stakeholders on various planning efforts
to define what the blended system will look like and what the future blended service will provide.
The Caltrain/California HSR Blended Operations Analysis was completed by Caltrain in March 2012. This
study showed that a blended system and blended service plan was viable.
When that study was distributed for stakeholder review, local partners and stakeholders requested
analyses of other factors and variations of the blended system. These requests were collected by
Caltrain staff and form the basis of the analysis for this study, as reflected in Table 1.
Table 1: Stakeholder Requested Service Plan and Operations Considerations
Category Considerations
Overtake (Passing) Tracks
Analyze other overtake options in addition to the “Long-Middle 4 Track” and “Short-Middle 4 Track” overtake options analyzed in 2012 study.
Infrastructure and Service Patterns
Analyze a second mid-peninsula HSR station at Redwood City
Analyze DTX and TTC projects
Analyze the Dumbarton Rail Corridor project
Modify prototypical schedule to include Caltrain baby bullet service
Other
Reduce train frequency by operating longer trains
Incorporate the HSR storage/maintenance facility
Support existing passenger rail tenants
Support freight service
The considerations in the “Overtake Tracks” and “Infrastructure and Service Pattern” categories noted
above were analyzed using a computer simulation model. Specific to the overtake track options,
Caltrain staff identified 3 additional options along the corridor that merited analysis. The performance of
each consideration is outlined in the latter sections of this study.
This analysis concluded that all of the tested blended system options are viable as simulated in the
model. However, the simulation also revealed that there are notable performance differences
between the options examined. As planning for the blended system continues, additional due
diligence will be needed to confirm the performance of the options considered relative to real world
system operations.
The considerations in the “Other” category were assessed qualitatively and are also described in this
study. Due to timing, there is limited discussion regarding the HSR storage/maintenance facility and
freight service. Those considerations will need to be further advanced beyond the conclusion of this

Caltrain/HSR Blended Service Plan / Operations Considerations Analysis (Requested by Stakeholders) | 2
study. The analysis and results of this study will be used to inform design of the blended system and
develop the blended system service plan.

Caltrain/HSR Blended Service Plan / Operations Considerations Analysis (Requested by Stakeholders) | 3
2. Introduction
The purpose of this study is to evaluate various service plan and operations considerations related to the
blended system. These considerations are of interest to our stakeholders and are important to
designing the blended system as well as preparing the future blended service plan.
This report builds on the March 2012 Caltrain/California HSR Blended Operations Analysis. It is essential
for the reader to be familiar with the March 2012 report so that the analysis and findings included in this
study are contextualized and understandable.
The analysis included in the following report is divided into 4 major parts:
Section 3 provides an overview of the simulation model and model inputs that set the baseline
for comparing the simulations performed in this study.
Section 4 describes the simulations and results associated with each of the analyzed overtake
options.
Section 5 outlines simulations and results associated with the infrastructure and service pattern
considerations. String charts from the simulations are included in Appendix A.
Section 6 provides a qualitative discussion about other considerations that did not warrant
simulations.
Finally, Section 7 summarizes the report’s conclusions. Appendix B includes information about the
process and outreach efforts associated with this study. Appendix B will be expanded in the final report
to include public comments and responses to this draft report.

Caltrain/HSR Blended Service Plan / Operations Considerations Analysis (Requested by Stakeholders) | 4
3. Context
This study builds on the analysis completed in the March 2012 Caltrain/California HSR Blended
Operations Analysis and uses the same methodology and computer simulation model used for the
March 2012 analysis.
It is important for the reader to be familiar with the March 2012 analysis in order to understand and
appreciate the findings included in this study.
The computer simulation model software used to conduct the analysis, TrainOps®, is a proprietary
software application developed by LTK Engineering Services. The model was customized for application
to the Caltrain and HSR operations analysis. The future Caltrain system modeled in the simulation
software is different from the one that exists today. Future changes assumed in the model include
electrification of the Caltrain system, an advanced signal system (CBOSS) and new Caltrain rail cars
(“rolling stock”) that have electric propulsion. The baseline assumptions used in the model are
summarized in Table 2. A detailed description of the modeling methodology used in these simulations
can be found in the March 2012 Caltrain/California HSR Blended Operations Analysis.

Caltrain/HSR Blended Service Plan / Operations Considerations Analysis (Requested by Stakeholders) | 5
Table 2: Baseline Simulation Model Inputs
Model
Input
Category
Model Input Assumption
Infr
astr
uct
ure
Train Propulsion System Caltrain Corridor electrified, San Francisco to Tamien
High Speed Rail Stations Separate HSR Station at San Jose Diridon, new 4-track configuration
at Millbrae, new dedicated HSR platforms at 4th and King
High Speed Rail Interlockings
Conceptual connections assumed north and south of Millbrae to
support four tracks at station with two platform edges for Caltrain
and two for HSR. Connections assumed near CP De La Cruz (to
support transition to dedicated HSR trackage to points south).
Ro
llin
g
Sto
ck Caltrain
EMU, 8-Car Consist, Coradia trainset (typical regional EMU), 700
feet long
HSR EMU, Siemens Velaro E High Speed Train, 656 feet long (200m) *
Trai
n C
on
tro
l
Base Existing wayside signaling
Positive Train Control CBOSS implementation with dynamic profiling to signals at stop,
civil speed restrictions, station stops.
PTC Response Time –
Automatic Signal Territory 6 seconds
PTC Response Time –
Interlocking Territory –
Following Train on Same Route
14 seconds
PTC Response Time –
Interlocking Territory –
Following Train on Different Route
30 seconds
Op
era
tio
ns
Caltrain operating philosophy –
peak periods Prototypical skip stop schedule without Caltrain-Caltrain overtakes
Caltrain operating philosophy –
off-peak periods All stops “memory” type schedule with 2 trains per hour.
Caltrain period of operation 4 am to 1 am
Dwell times
Caltrain dwell times based on observations of existing dwell,
adjusted for additional doors on EMUs and increased passenger
loads.
HSR
All trains stop at San Francisco, Millbrae and San Jose. Service level
varies by scenario. 2 minute HSR dwell time at Millbrae assumed to
account for fewer train doors and passengers with luggage.
Dis
pat
chin
g
Millbrae 4 Track Segment No scheduled overtakes allowed.
Hold Out Rule
At South San Francisco, Broadway and Atherton Stations, where
passengers must cross one active track at grade in order to board
and alight from trains, only one train in station at a time (unless
both are expressing through the station).
*HSR will operate a mix of shorter and longer train consists. Only the shorter equipment was simulated. All blended system infrastructure will be compatible with both train lengths.

Caltrain/HSR Blended Service Plan / Operations Considerations Analysis (Requested by Stakeholders) | 6
Figure 1 shows the baseline infrastructure simulated. It includes existing Caltrain tracks and HSR-related
improvements at North Terminal, Millbrae and between CP De La Cruz and South Terminal. The HSR
improvements shown are conceptual.
Figure 1: Caltrain/HSR Baseline Infrastructure
The baseline AM peak Caltrain schedule used in the simulations is reflected in Table 3 and Table 4. This
is a prototypical skip-stop schedule developed for use in this analysis. No decision has been made on
the final blended system schedule.
Schematics shown in figure are for modeling
purposes only. Schematics do not reflect
conceptual engineering or design work.

Caltrain/HSR Blended Service Plan / Operations Considerations Analysis (Requested by Stakeholders) | 7
Table 3: Peak 60 Minutes Northbound Service – AM Simulated Schedule
Train: 416 418 420 422 424 426
Tamien Station 7:02a 7:32a
San Jose Diridon Station 7:00a 7:10a 7:20a 7:30a 7:40a 7:50a
College Park Station*
Santa Clara Station 7:05a 7:35a
Lawrence Station 7:18a 7:48a
Sunnyvale Station 7:11a 7:21a 7:30a 7:41a 7:51a 8:00a
Mountain View Station 7:16a 7:26a 7:35a 7:46a 7:56a 8:05a
San Antonio Station 7:38a 8:08a
California Ave. Station 7:21a 7:51a
Palo Alto Station 7:25a 7:34a 7:44a 7:55a 8:04a 8:14a
Menlo Park Station 7:36a 7:46a 8:06a 8:16a
Atherton Station 7:28a
Redwood City Station 7:32a 7:43a 7:51a 8:01a 8:13a 8:21a
San Carlos Station 7:54a 8:24a
Belmont Station 7:47a 8:17a
Hillsdale Station 7:39a 7:50a 7:58a 8:08a 8:20a 8:28a
Hayward Park Station 8:00a
San Mateo Station 7:42a 7:53a 8:11a 8:23a
Burlingame Station 7:56a 8:26a
Broadway Station 8:15a
Millbrae Station 7:50a 8:01a 8:08a 8:19a 8:31a 8:37a
San Bruno Station 8:12a 8:41a
South San Francisco Station 7:57a 8:26a
Bayshore Station 8:45a
22nd Street Station 8:19a
4th & King Station 8:04a 8:14a 8:23a 8:33a 8:44a 8:52a
*Schedule to be determined
This is a prototypical schedule and was developed as a modeling input only. Additional service plans and schedule options will be developed and considered in subsequent stages of the planning process

Caltrain/HSR Blended Service Plan / Operations Considerations Analysis (Requested by Stakeholders) | 8
Table 4: Peak 60 Minutes Southbound Service – AM Simulated Schedule
Train: 417 419 421 423 425 427
4th & King Station 7:00a 7:10a 7:20a 7:30a 7:40a 7:50a
22nd Street Station 7:05a 7:15a 7:25a 7:35a 7:45a 7:55a
Bayshore Station 7:19a
South San Francisco Station 7:43a
San Bruno Station 7:27a 7:56a
Millbrae Station 7:18a 7:30a 7:38a 7:49a 7:59a 8:08a
Broadway Station 8:11a
Burlingame Station 7:34a 8:03a
San Mateo Station 7:37a 7:44a 8:06a 8:15a
Hayward Park Station 7:39a
Hillsdale Station 7:27a 7:42a 7:58a 8:10a
Belmont Station 7:49a 8:20a
San Carlos Station 7:30a 7:45a 8:01a 8:13a
Redwood City Station 7:51a 7:56a 8:19a 8:27a
Atherton Station 8:22a
Menlo Park Station 7:39a 8:00a 8:10a 8:31a
Palo Alto Station 7:42a 7:57a 8:03a 8:13a 8:26a 8:34a
California Ave. Station 8:06a 8:37a
San Antonio Station 7:47a 8:18a
Mountain View Station 7:51a 8:05a 8:12a 8:22a 8:34a 8:43a
Sunnyvale Station 8:16a 8:47a
Lawrence Station 7:57a 8:28a
Santa Clara Station 8:02a 8:33a
College Park Station*
San Jose Diridon Station 8:07a 8:18a 8:29a 8:38a 8:47a 9:00a
Tamien Station 8:14a 8:36a 8:54p
*Schedule to be determined
This is a prototypical schedule and was developed as a modeling input only. Additional service plans and
schedule options will be developed and considered in subsequent stages of the planning process
The assumptions listed in Table 2, the infrastructure shown in Figure 1 and the schedules reflected in
Table 3 and Table 4 will be referred throughout the report as the “baseline” scenario.

Caltrain/HSR Blended Service Plan / Operations Considerations Analysis (Requested by Stakeholders) | 9
4. Overtake (Passing Track) Options Simulation
As demonstrated in the March 2012 analysis, the blended system utilizing existing tracks can reliably
support a blended service of up to 6 Caltrain trains and 2 high-speed rail trains per peak hour per
direction (6/2 scenario).
In order to support more than 8 total trains per peak direction per hour, overtake tracks are needed.
Overtake tracks in this context are those that would be used by high-speed rail trains to pass (overtake)
Caltrain trains that travel more slowly and need to stop more frequently at stations. With limited
overtake tracks, blended service of up to 6 Caltrain trains and 4 HSR trains (6/4 scenario) per peak hour
per direction can be accommodated.
In the Caltrain/California HSR Blended Operations Analysis, the Long - Middle 4 Track overtake and Short
- Middle 4 Track overtake options were analyzed and proven viable. The analysis also identified the
North 4 Track and South 4 Track overtake options but did not analyze their performance. Given
stakeholder interest, these two options along with an additional Middle 3 Track overtake option were
defined for further analysis in this study. Together, the five overtake options are:
Long - Middle 4 Track
Short - Middle 4 Track
Middle 3 Track
North 4 Track
South 4 Track
For comparative purposes, the descriptions and results of all five options are noted in this report.
The overall guiding criterion for defining overtake segment options was that they should improve the
operational integration of Caltrain and high speed rail services to support the operation of a blended
system with more than 8 total trains per direction per peak hour. In order to achieve a delay-free
overtake, each option had to be long enough and include sufficient scheduled Caltrain stops to support
the 7+ minute travel time difference required for an HSR train to safely overtake a Caltrain train.
Within this overall criterion, overtake options were also sited in locations where they could connect to
existing multi-track segments to minimize capital costs. As possible, overtake options were located
where their construction and operation would limit impacts to adjoining communities.
The approximate locations of all five overtake options are shown in Figure 2.

Caltrain/HSR Blended Service Plan / Operations Considerations Analysis (Requested by Stakeholders) | 10
Figure 2: Approximate Overtake Option Locations
Caltrain/HSR Blended Service Plan / Operations Considerations Analysis (Requested by Stakeholders) | 11
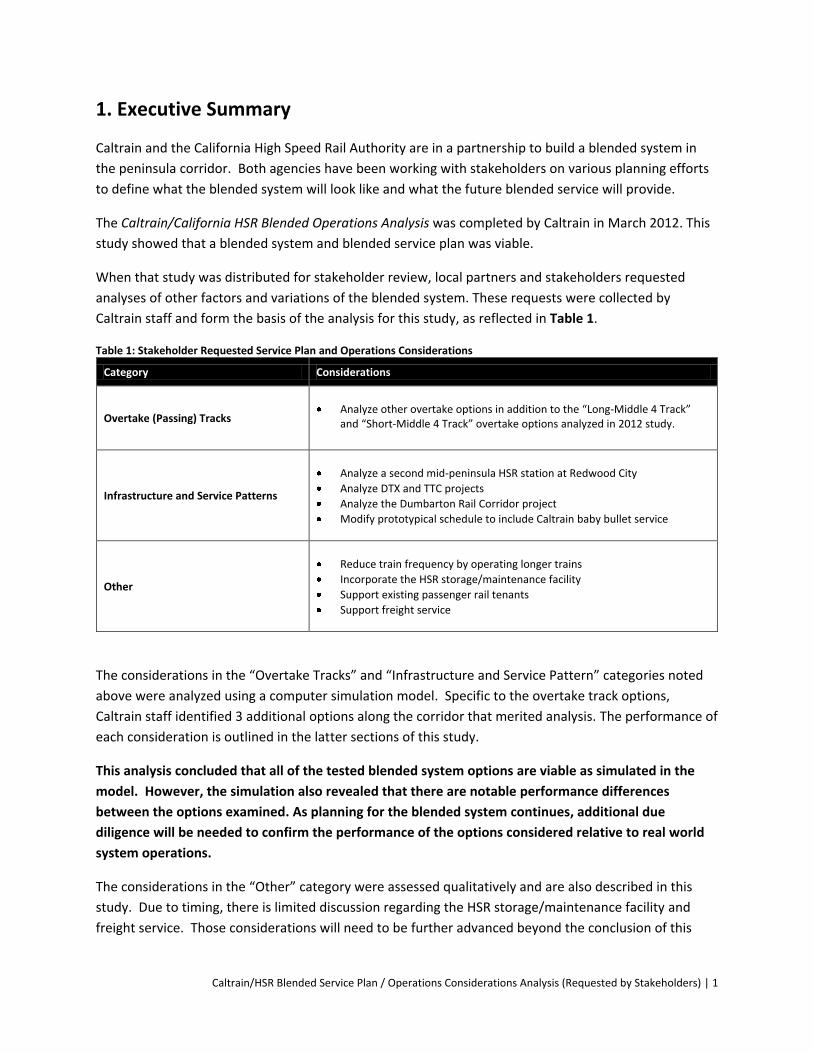
Within the overtake options, two types of configuration were simulated. One is based on a 4 track
configuration while the other is based on a 3 track configuration. Figure 3 provides a conceptual
illustration of the differences between a 3 and 4 track overtake configuration.
Figure 3: Overtake Track Configurations
The 4 track configuration is shorter in length and thus reduces the number of stations that would need
to be reconfigured. A 4 track overtake, however, requires additional width which could result in impacts
outside of the Caltrain-owned right of way in constrained areas. The 3 track configuration is narrower
and has less need for right of way width but must be correspondingly longer and would require more
stations to be reconfigured.
It is important to understand that given the train frequencies proposed, the 3 track overtake, like the 4
track overtake, supports one directional train travel. One-half of the 3 track overtake supports
northbound trains and the other half supports southbound trains. In the 4 track overtake, it is clearer
that each of the parallel tracks supports one directional trains.

Caltrain/HSR Blended Service Plan / Operations Considerations Analysis (Requested by Stakeholders) | 12
Simulation Description
Long - Middle 4 Track Overtake
The “Long-Middle 4 Track Overtake” option assumes a 9.1-mile long 4-track segment of tracks from MP
18.1 to MP 27.2, as shown in Figure 4. It includes five Caltrain stations (Hayward Park, Hillsdale,
Belmont, San Carlos and Redwood City). The existing 4-track configuration south of Redwood City is
utilized within this overtake.
Figure 4: Baseline Infrastructure with Long-Middle 4 Track Overtake Infrastructure
Short - Middle 4 Track Overtake
The “Short - Middle 4 Track Overtake” option assumes a 6.1-mile long 4-track segment of tracks from
MP 18.1 to MP 24.2, as shown in Figure 5. It includes four Caltrain stations (Hayward Park, Hillsdale,
Schematics shown in figure are for modeling
purposes only. Schematics do not reflect
conceptual engineering or design work.

Caltrain/HSR Blended Service Plan / Operations Considerations Analysis (Requested by Stakeholders) | 13
Belmont and San Carlos). This option was explored to understand the operational impacts of
terminating the passing tracks north of Redwood City, avoiding the constrained downtown area.
Figure 5: Baseline Infrastructure with Short-Middle 4 Track Overtake Infrastructure
Middle 3 Track Overtake
The “Middle 3 Track Overtake” option assumes a 16 mile track from CP Palm (MP 18.1) to CP Mayfield
(MP 33.7), as shown in Figure 6. It includes ten stations (Hayward Park, Hillsdale, Belmont, San Carlos,
Redwood City, Atherton, Menlo Park, Palo Alto, Stanford and California Ave).
Schematics shown in figure are for modeling
purposes only. Schematics do not reflect
conceptual engineering or design work.

Caltrain/HSR Blended Service Plan / Operations Considerations Analysis (Requested by Stakeholders) | 14
Figure 6: Baseline Infrastructure with Middle 3 Track Overtake Infrastructure
North 4 Track Overtake
The “North 4 Track Overtake” option assumes a 10.2-mile long 4-track segment of tracks from MP 5 to
MP 15.2, as shown in Figure 7. It includes four Caltrain stations (Bayshore, South San Francisco, San
Bruno and Millbrae) and one HSR station (Millbrae). The existing 4-track configuration at Bayshore is
utilized as part of the North 4 Track Overtake.
Schematics shown in figure are for modeling
purposes only. Schematics do not reflect
conceptual engineering or design work.

Caltrain/HSR Blended Service Plan / Operations Considerations Analysis (Requested by Stakeholders) | 15
Figure 7: Baseline Infrastructure with North 4 Track Overtake Infrastructure
South 4 Track Overtake
The “South 4 Track Overtake” option assumes a 7.8-mile long 4-track segment of tracks from MP 33.8 to
MP 41.6, as shown in Figure 8. It includes four Caltrain stations (San Antonio, Mountain View,
Sunnyvale and Lawrence). The existing 4-track configuration at Lawrence is utilized as a portion of the
South 4 Track Overtake.
Schematics shown in figure are for modeling
purposes only. Schematics do not reflect
conceptual engineering or design work.

Caltrain/HSR Blended Service Plan / Operations Considerations Analysis (Requested by Stakeholders) | 16
Figure 8: Baseline Infrastructure with South 4 Track Overtake Infrastructure
Simulation Results
The following tables reflect Caltrain and HSR simulation results for the AM Peak (trains departing San
Francisco or San Jose between 7:00am and 9:00am). For each simulation, relative performance during
the AM peak is described in terms of:
Caltrain and HSR average end-to-end trip time
Maximum and minimum trip time and standard deviation
Train congestion, assessed in terms of signal delay
Added Caltrain stops required to support overtakes (compared to assumed baseline schedule)
Schematics shown in figure are for modeling
purposes only. Schematics do not reflect
conceptual engineering or design work.
Caltrain/HSR Blended Service Plan / Operations Considerations Analysis (Requested by Stakeholders) | 17
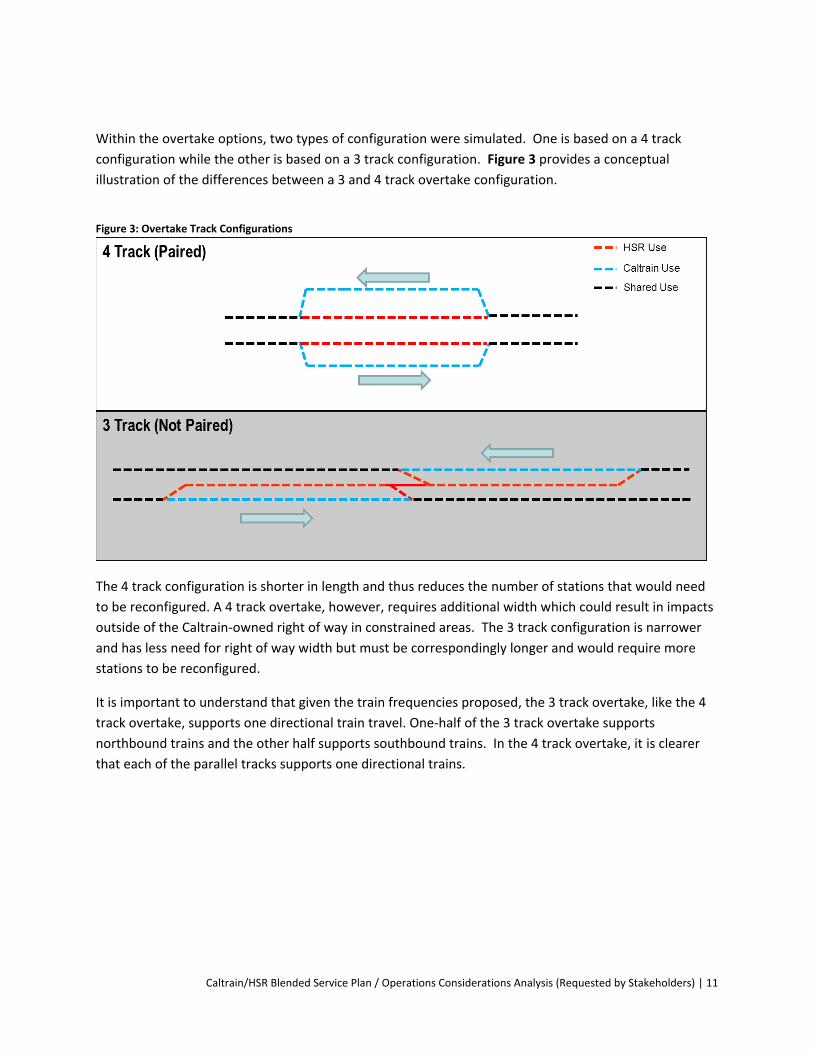
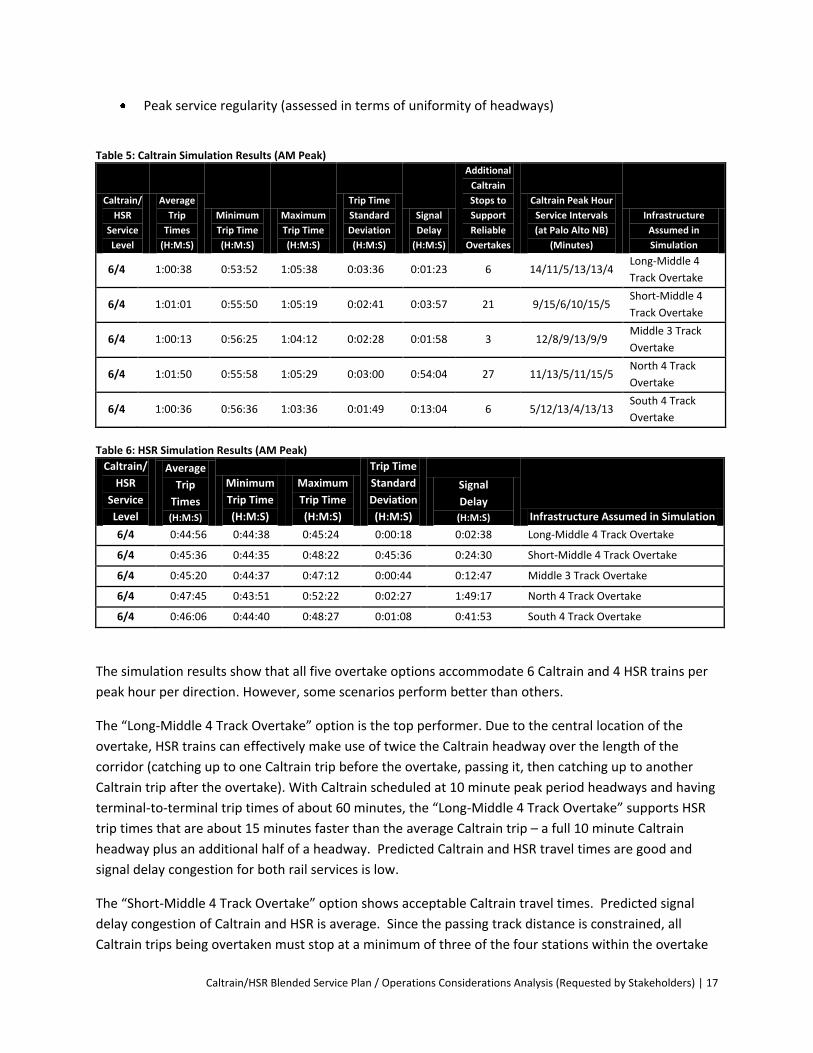
Peak service regularity (assessed in terms of uniformity of headways)
Table 5: Caltrain Simulation Results (AM Peak)
Caltrain/
HSR
Service
Level
Average
Trip
Times
(H:M:S)
Minimum
Trip Time
(H:M:S)
Maximum
Trip Time
(H:M:S)
Trip Time
Standard
Deviation
(H:M:S)
Signal
Delay
(H:M:S)
Additional
Caltrain
Stops to
Support
Reliable
Overtakes
Caltrain Peak Hour
Service Intervals
(at Palo Alto NB)
(Minutes)
Infrastructure
Assumed in
Simulation
6/4 1:00:38 0:53:52 1:05:38 0:03:36 0:01:23 6 14/11/5/13/13/4 Long-Middle 4
Track Overtake
6/4 1:01:01 0:55:50 1:05:19 0:02:41 0:03:57 21 9/15/6/10/15/5 Short-Middle 4
Track Overtake
6/4 1:00:13 0:56:25 1:04:12 0:02:28 0:01:58 3 12/8/9/13/9/9 Middle 3 Track
Overtake
6/4 1:01:50 0:55:58 1:05:29 0:03:00 0:54:04 27 11/13/5/11/15/5 North 4 Track
Overtake
6/4 1:00:36 0:56:36 1:03:36 0:01:49 0:13:04 6 5/12/13/4/13/13 South 4 Track
Overtake
Table 6: HSR Simulation Results (AM Peak)
Caltrain/
HSR
Service
Level
Average
Trip
Times
(H:M:S)
Minimum
Trip Time
(H:M:S)
Maximum
Trip Time
(H:M:S)
Trip Time
Standard
Deviation
(H:M:S)
Signal
Delay
(H:M:S) Infrastructure Assumed in Simulation
6/4 0:44:56 0:44:38 0:45:24 0:00:18 0:02:38 Long-Middle 4 Track Overtake
6/4 0:45:36 0:44:35 0:48:22 0:45:36 0:24:30 Short-Middle 4 Track Overtake
6/4 0:45:20 0:44:37 0:47:12 0:00:44 0:12:47 Middle 3 Track Overtake
6/4 0:47:45 0:43:51 0:52:22 0:02:27 1:49:17 North 4 Track Overtake
6/4 0:46:06 0:44:40 0:48:27 0:01:08 0:41:53 South 4 Track Overtake
The simulation results show that all five overtake options accommodate 6 Caltrain and 4 HSR trains per
peak hour per direction. However, some scenarios perform better than others.
The “Long-Middle 4 Track Overtake” option is the top performer. Due to the central location of the
overtake, HSR trains can effectively make use of twice the Caltrain headway over the length of the
corridor (catching up to one Caltrain trip before the overtake, passing it, then catching up to another
Caltrain trip after the overtake). With Caltrain scheduled at 10 minute peak period headways and having
terminal-to-terminal trip times of about 60 minutes, the “Long-Middle 4 Track Overtake” supports HSR
trip times that are about 15 minutes faster than the average Caltrain trip – a full 10 minute Caltrain
headway plus an additional half of a headway. Predicted Caltrain and HSR travel times are good and
signal delay congestion for both rail services is low.
The “Short-Middle 4 Track Overtake” option shows acceptable Caltrain travel times. Predicted signal
delay congestion of Caltrain and HSR is average. Since the passing track distance is constrained, all
Caltrain trips being overtaken must stop at a minimum of three of the four stations within the overtake

Caltrain/HSR Blended Service Plan / Operations Considerations Analysis (Requested by Stakeholders) | 18
trackage for delay-free operation. The absence of Redwood City Station (where all Caltrain trips are
scheduled to stop) makes this overtake option operationally challenging. The addition of new scheduled
stops increases the average Caltrain travel time.
The “Middle 3 Track Overtake” option supports good Caltrain trip times with low signal delay. HSR trip
times are predicted to be good, while signal delay congestion is predicted to be fair to low. While this
option performs well in the simulation, it is important to note that this type of operation requires
precision dispatching of HSR trains as they are approaching each other in opposing directions on one
track. It is also important to know that recovery from delays or incidents is likely to be more
compromised in a 3 track versus a 4 track overtake configuration.
The “North 4 Track Overtake” option has difficulty supporting the 7+ minute travel time difference
required for an HSR trip to overtake a Caltrain trip. The weakness of this overtake option is exacerbated
by the HSR stop at Millbrae Station. Because both HSR trains and Caltrain trains stop at Millbrae, the
time differential between the two is reduced. Even with the addition of a significant number of Caltrain
stops at Bayshore, South San Francisco and San Bruno stations to support overtakes, Caltrain trains must
still wait at the end of the passing tracks and experience delays. This scenario features long Caltrain trip
times and high levels of signal congestion.
The “South 4 Track Overtake” option requires adding more scheduled stops to the Caltrain trips to make
the overtake option operationally feasible. Overall, this option features good Caltrain travel times and
low signal delay congestion. However, the passing of Caltrain by high-speed rail trains being skewed to
the southern end of the Caltrain corridor limits the ability of HSR to catch up to two Caltrain trips ahead
(one before the overtake location and one after). HSR travel times and predicted signal delay suffer as a
result.
Caltrain/HSR Blended Service Plan / Operations Considerations Analysis (Requested by Stakeholders) | 19
5. Additional Infrastructure and Service Pattern Considerations
Four additional infrastructure and service pattern simulations were conducted as part of this study.
They include:
Additional HSR station at the Caltrain Redwood City station;
Downtown Extension Project (DTX) connecting the Caltrain system from 4th and King to the
Transbay Transit Center (TTC) in downtown San Francisco;
Dumbarton Rail Corridor project providing commuter rail service over the Dumbarton rail bridge
from the BART Union City station in the east bay to the Caltrain system in the peninsula; and
Mix of “baby-bullet” and “skip-stop” Caltrain service.
All of the simulations were tested using the “Long-Middle 4 Track Overtake” scenario infrastructure.
HSR Redwood City Station
Simulation Description
CHSRA is considering the Caltrain Redwood City station as an optional mid-peninsula HSR station. This
simulated scenario includes an HSR station in Redwood City in addition to those at Diridon, Millbrae and
4th and King Stations. At Redwood City, HSR is assumed to have a dedicated platform. The four-track
layout enables HSR and Caltrain trips to serve the station simultaneously, while minimizing delays. This
scenario assumes that all four HSR trains per hour serve the additional mid-Peninsula station. HSR dwell
times at Redwood City are assumed to be 2 minutes, consistent with HSR dwell times at Millbrae and
accounting for passengers with luggage.
See Figure 9.

Caltrain/HSR Blended Service Plan / Operations Considerations Analysis (Requested by Stakeholders) | 20
Figure 9: Baseline infrastructure with “Long-Middle 4 Track Overtake” and additional HSR station at Redwood City
Schematics shown in figure are for modeling
purposes only. Schematics do not reflect
conceptual engineering or design work.
Caltrain/HSR Blended Service Plan / Operations Considerations Analysis (Requested by Stakeholders) | 21
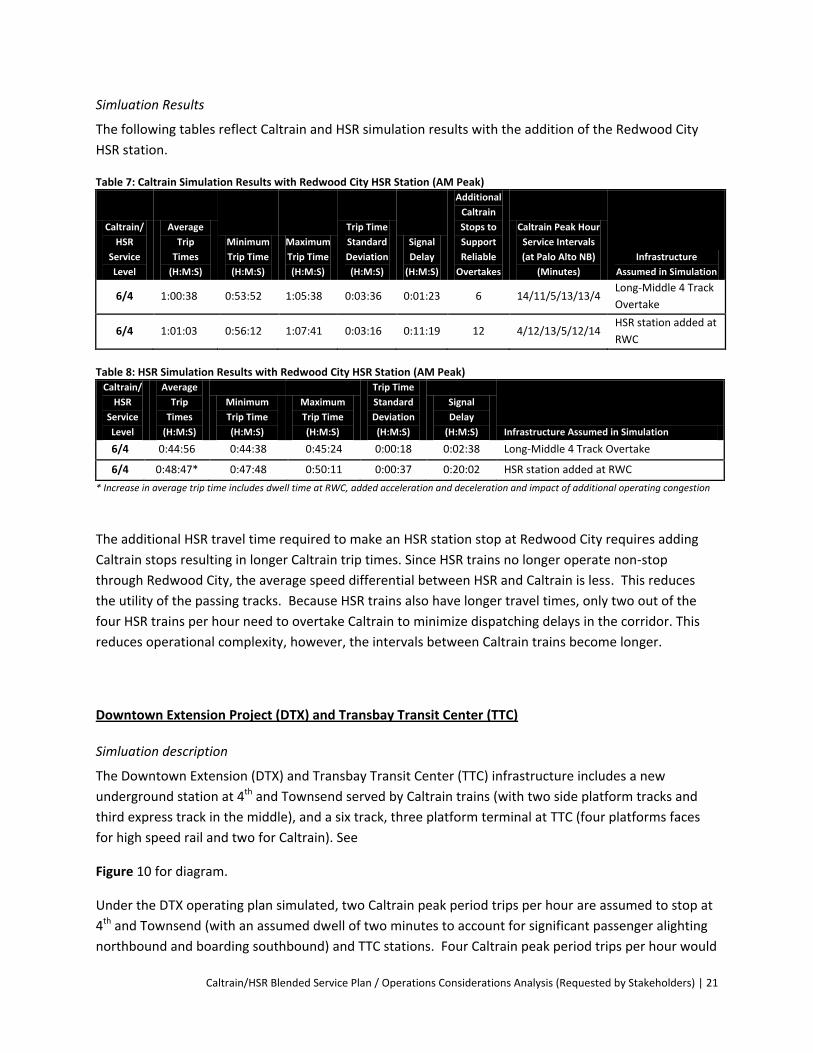
Simluation Results
The following tables reflect Caltrain and HSR simulation results with the addition of the Redwood City
HSR station.
Table 7: Caltrain Simulation Results with Redwood City HSR Station (AM Peak)
Caltrain/
HSR
Service
Level
Average
Trip
Times
(H:M:S)
Minimum
Trip Time
(H:M:S)
Maximum
Trip Time
(H:M:S)
Trip Time
Standard
Deviation
(H:M:S)
Signal
Delay
(H:M:S)
Additional
Caltrain
Stops to
Support
Reliable
Overtakes
Caltrain Peak Hour
Service Intervals
(at Palo Alto NB)
(Minutes)
Infrastructure
Assumed in Simulation
6/4 1:00:38 0:53:52 1:05:38 0:03:36 0:01:23 6 14/11/5/13/13/4 Long-Middle 4 Track
Overtake
6/4 1:01:03 0:56:12 1:07:41 0:03:16 0:11:19 12 4/12/13/5/12/14 HSR station added at
RWC
Table 8: HSR Simulation Results with Redwood City HSR Station (AM Peak)
Caltrain/
HSR
Service
Level
Average
Trip
Times
(H:M:S)
Minimum
Trip Time
(H:M:S)
Maximum
Trip Time
(H:M:S)
Trip Time
Standard
Deviation
(H:M:S)
Signal
Delay
(H:M:S) Infrastructure Assumed in Simulation
6/4 0:44:56 0:44:38 0:45:24 0:00:18 0:02:38 Long-Middle 4 Track Overtake
6/4 0:48:47* 0:47:48 0:50:11 0:00:37 0:20:02 HSR station added at RWC
* Increase in average trip time includes dwell time at RWC, added acceleration and deceleration and impact of additional operating congestion
The additional HSR travel time required to make an HSR station stop at Redwood City requires adding
Caltrain stops resulting in longer Caltrain trip times. Since HSR trains no longer operate non-stop
through Redwood City, the average speed differential between HSR and Caltrain is less. This reduces
the utility of the passing tracks. Because HSR trains also have longer travel times, only two out of the
four HSR trains per hour need to overtake Caltrain to minimize dispatching delays in the corridor. This
reduces operational complexity, however, the intervals between Caltrain trains become longer.
Downtown Extension Project (DTX) and Transbay Transit Center (TTC)
Simluation description
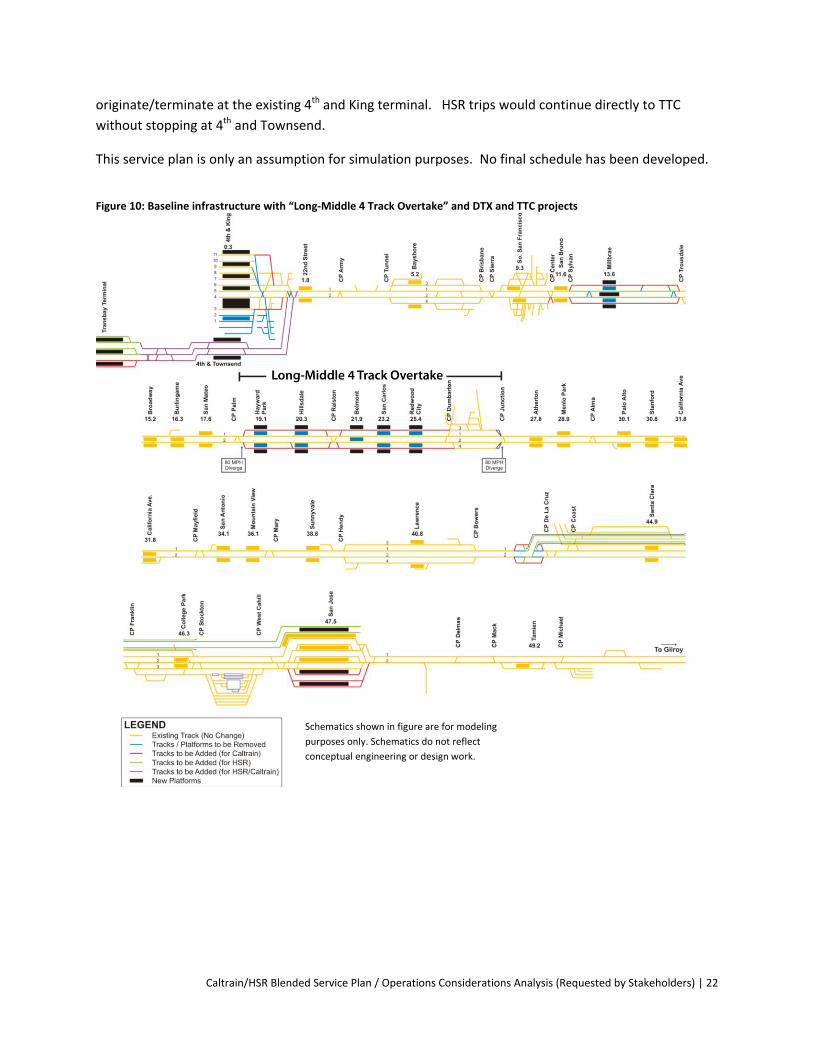
The Downtown Extension (DTX) and Transbay Transit Center (TTC) infrastructure includes a new
underground station at 4th and Townsend served by Caltrain trains (with two side platform tracks and
third express track in the middle), and a six track, three platform terminal at TTC (four platforms faces
for high speed rail and two for Caltrain). See
Figure 10 for diagram.
Under the DTX operating plan simulated, two Caltrain peak period trips per hour are assumed to stop at
4th and Townsend (with an assumed dwell of two minutes to account for significant passenger alighting
northbound and boarding southbound) and TTC stations. Four Caltrain peak period trips per hour would
Caltrain/HSR Blended Service Plan / Operations Considerations Analysis (Requested by Stakeholders) | 22
originate/terminate at the existing 4th and King terminal. HSR trips would continue directly to TTC
without stopping at 4th and Townsend.
This service plan is only an assumption for simulation purposes. No final schedule has been developed.
Figure 10: Baseline infrastructure with “Long-Middle 4 Track Overtake” and DTX and TTC projects
Schematics shown in figure are for modeling
purposes only. Schematics do not reflect
conceptual engineering or design work.

Caltrain/HSR Blended Service Plan / Operations Considerations Analysis (Requested by Stakeholders) | 23
Simluation Results
The following tables reflect Caltrain and HSR simulation results with assumed DTX and TTC
infrastructure.
Table 9 Caltrain Simulation Results with DTX and TTC Infrastructure (AM Peak)
Caltrain/
HSR
Service
Level
Average
Trip
Times
(H:M:S)
Minimum
Trip Time
(H:M:S)
Maximu
m Trip
Time
(H:M:S)
Trip Time
Standard
Deviation
(H:M:S)
Signal
Delay
(H:M:S)
Additional
Caltrain Stops
to Support
Reliable
Overtakes
Caltrain Peak
Hour Service
Intervals
(at Palo Alto
NB)
(Minutes)
Infrastructure
Assumed in
Simulation
6/4 1:00:38 0:53:52 1:05:38 0:03:36 0:01:23 6 14/11/5/13/13/
4
Long-Middle 4
Track
Overtake
[2/4]/4
2 trips to
TTC 1:05:59 1:04:02 1:08:06 0:01:37
0:07:42 12 14/9/5/13/13/6
DTX to TTC
applied to
Long Middle 4
Track
Overtake
4 trips to
4th
& King 1:00:38 0:56:50 1:05:51 0:02:43
* First data row is for travel to TTC (2 trains per hour) second data row is for travel terminating at 4th
and King (4 trains per hour)
Table 10 HSR Simulation Results with DTX and TTC Infrastructure (AM Peak) Caltrain/
HSR
Service
Level
Average
Trip
Times
(H:M:S)
Minimum
Trip Time
(H:M:S)
Maximum
Trip Time
(H:M:S)
Trip Time
Standard
Deviation
(H:M:S)
Signal
Delay
(H:M:S) Infrastructure Assumed in Simulation
6/4 0:44:56 0:44:38 0:45:24 0:00:18 0:02:38 Long-Middle 4 Track Overtake
[2/4]/4 0:46:44 0:46:20 0:48:00 0:00:22 0:13:30 With DTX and TTC
The DTX and the TTC support the blended system. However, they result in higher levels of signal delay
and more added Caltrain station stops to support the service extension to downtown San Francisco.
For Caltrain DTX operation, the average morning peak travel time to 4th and Townsend (1:00:47) is
virtually the same as Caltrain DTX operation to 4th and King (1:00:38).
Dumbarton Rail
Simluation Description
The Dumbarton Rail Corridor (DRC) service would join the Caltrain Corridor just south of Redwood City
Station at the location of the existing connecting tracks on the East Controlled Siding between CP
Dumbarton and CP Junction, as shown in Figure 11. An existing crossover at CP Dumbarton would
provide access for DRC trains heading to/from the north and a connection at CP Junction would provide
access for DRC trains heading to/from the south.
The DRC operation is assumed to use diesel trains (400 foot long, MP 36-PH3C, bi-level Bombardier
coaches with 4 cars push-pulled by a diesel locomotive), with peak direction and peak period service

Caltrain/HSR Blended Service Plan / Operations Considerations Analysis (Requested by Stakeholders) | 24
only (6-9 AM and 4-7 PM). The simulation assumes 3 trains would operate from DRC to 4th & King, with
another 3 operating from DRC to San Jose Diridon in the morning. In the evening, service would operate
in the reverse direction. The assumed AM DRC service simulated is shown in Table 11.
Figure 11: Baseline infrastructure with “Long-Middle 4 Track Overtake” and Dumbarton Rail Corridor project
Schematics shown in figure are for modeling
purposes only. Schematics do not reflect
conceptual engineering or design work.

Caltrain/HSR Blended Service Plan / Operations Considerations Analysis (Requested by Stakeholders) | 25
Table 11: Assumed DRC Service – Simulated AM Schedule
Train DRC
AM 01 DRC
AM 03 DRC
AM 05 DRC
AM 00 DRC
AM 02 DRC
AM 04
4th & King Station
6:56 7:56 8:56
22nd Street Station
— — —
Bayshore Station
— — —
South SF Station
— — —
San Bruno Station
— — —
Millbrae Station
6:40 7:40 8:40
Broadway Station
— — —
Burlingame Station
— — —
San Mateo Station
— — —
Hayward Park Station
— — —
Hillsdale Station
6:32 7:32 8:32
Belmont Station
— — —
San Carlos Station
— — —
Redwood City Station 6:25 7:25 8:25
From East Bay To San Jose To San Francisco
Redwood City Station 6:50 7:50 8:50
Atherton Station — — — Menlo Park Station — — — Palo Alto Station 6:55 7:55 8:55 California Ave. Station — — — San Antonio Station — — — Mountain View Station 7:02 8:02 9:02 Sunnyvale Station — — — Lawrence Station — — — Santa Clara Station — — — San Jose Diridon Station 7:15 8:15 9:15
Caltrain/HSR Blended Service Plan / Operations Considerations Analysis (Requested by Stakeholders) | 26
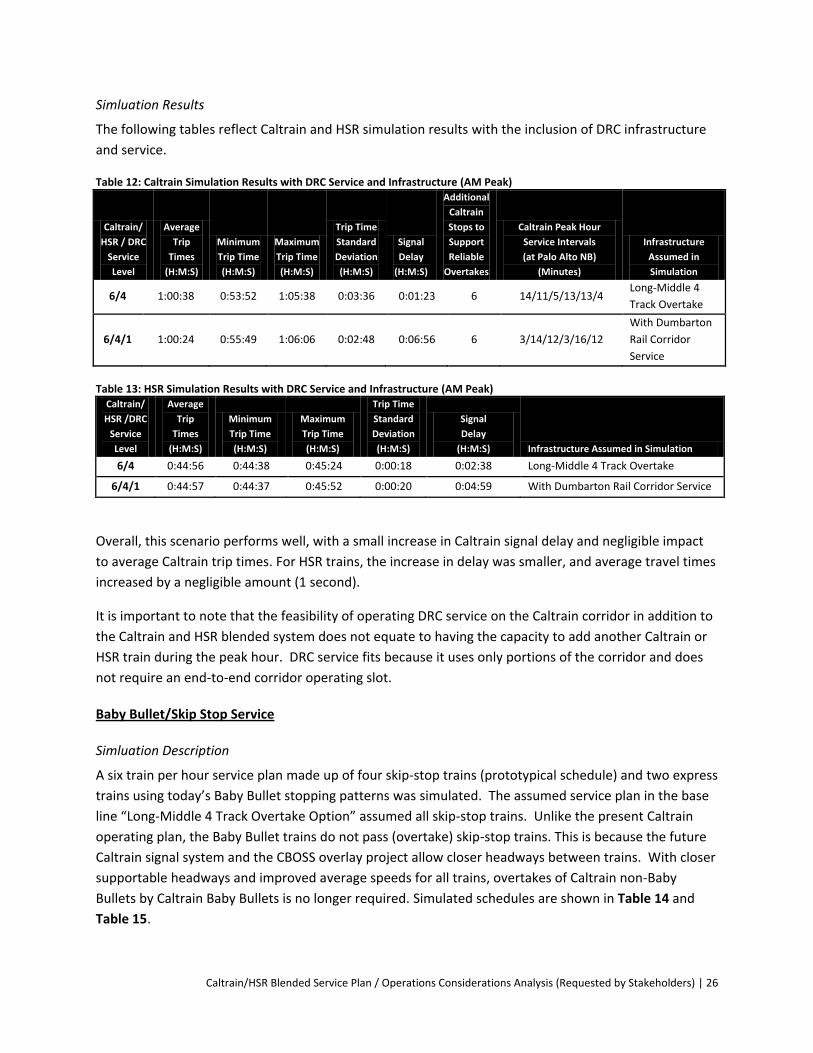
Simluation Results
The following tables reflect Caltrain and HSR simulation results with the inclusion of DRC infrastructure
and service.
Table 12: Caltrain Simulation Results with DRC Service and Infrastructure (AM Peak)
Caltrain/
HSR / DRC
Service
Level
Average
Trip
Times
(H:M:S)
Minimum
Trip Time
(H:M:S)
Maximum
Trip Time
(H:M:S)
Trip Time
Standard
Deviation
(H:M:S)
Signal
Delay
(H:M:S)
Additional
Caltrain
Stops to
Support
Reliable
Overtakes
Caltrain Peak Hour
Service Intervals
(at Palo Alto NB)
(Minutes)
Infrastructure
Assumed in
Simulation
6/4 1:00:38 0:53:52 1:05:38 0:03:36 0:01:23 6 14/11/5/13/13/4 Long-Middle 4
Track Overtake
6/4/1 1:00:24 0:55:49 1:06:06 0:02:48 0:06:56 6 3/14/12/3/16/12
With Dumbarton
Rail Corridor
Service
Table 13: HSR Simulation Results with DRC Service and Infrastructure (AM Peak)
Caltrain/
HSR /DRC
Service
Level
Average
Trip
Times
(H:M:S)
Minimum
Trip Time
(H:M:S)
Maximum
Trip Time
(H:M:S)
Trip Time
Standard
Deviation
(H:M:S)
Signal
Delay
(H:M:S) Infrastructure Assumed in Simulation
6/4 0:44:56 0:44:38 0:45:24 0:00:18 0:02:38 Long-Middle 4 Track Overtake
6/4/1 0:44:57 0:44:37 0:45:52 0:00:20 0:04:59 With Dumbarton Rail Corridor Service
Overall, this scenario performs well, with a small increase in Caltrain signal delay and negligible impact
to average Caltrain trip times. For HSR trains, the increase in delay was smaller, and average travel times
increased by a negligible amount (1 second).
It is important to note that the feasibility of operating DRC service on the Caltrain corridor in addition to
the Caltrain and HSR blended system does not equate to having the capacity to add another Caltrain or
HSR train during the peak hour. DRC service fits because it uses only portions of the corridor and does
not require an end-to-end corridor operating slot.
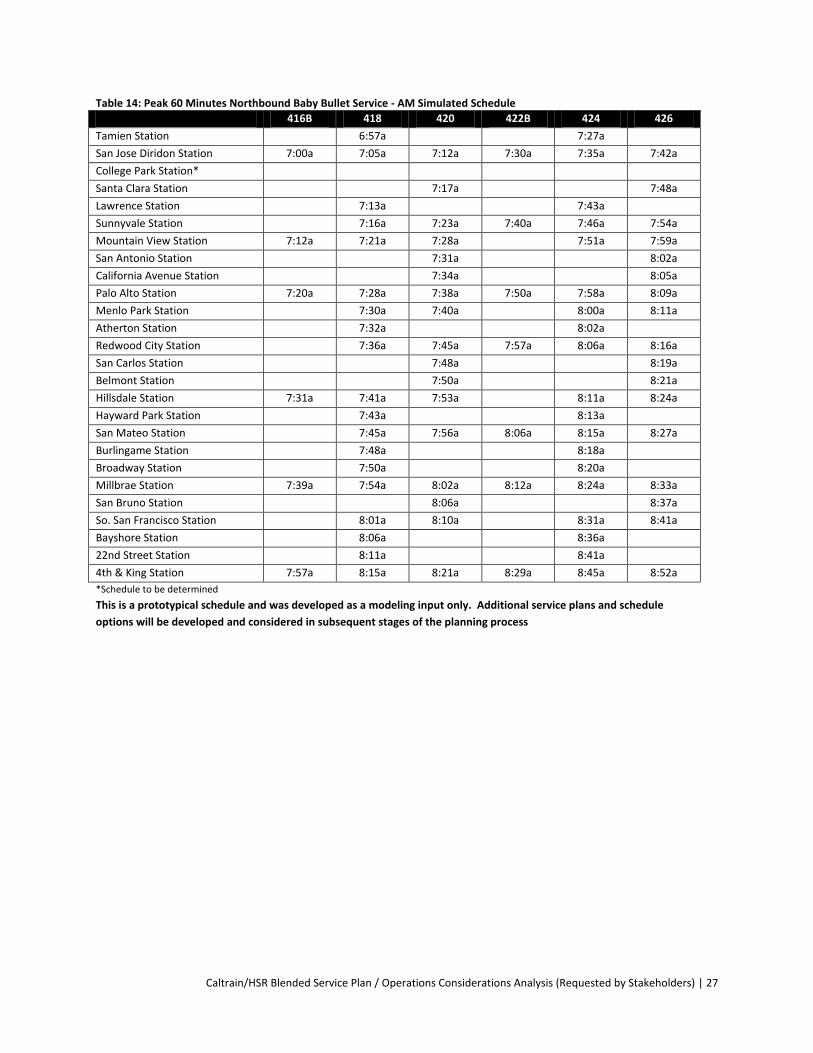
Baby Bullet/Skip Stop Service
Simluation Description
A six train per hour service plan made up of four skip-stop trains (prototypical schedule) and two express
trains using today’s Baby Bullet stopping patterns was simulated. The assumed service plan in the base
line “Long-Middle 4 Track Overtake Option” assumed all skip-stop trains. Unlike the present Caltrain
operating plan, the Baby Bullet trains do not pass (overtake) skip-stop trains. This is because the future
Caltrain signal system and the CBOSS overlay project allow closer headways between trains. With closer
supportable headways and improved average speeds for all trains, overtakes of Caltrain non-Baby
Bullets by Caltrain Baby Bullets is no longer required. Simulated schedules are shown in Table 14 and
Table 15.
Caltrain/HSR Blended Service Plan / Operations Considerations Analysis (Requested by Stakeholders) | 27
Table 14: Peak 60 Minutes Northbound Baby Bullet Service - AM Simulated Schedule
416B 418 420 422B 424 426
Tamien Station 6:57a 7:27a
San Jose Diridon Station 7:00a 7:05a 7:12a 7:30a 7:35a 7:42a
College Park Station*
Santa Clara Station 7:17a 7:48a
Lawrence Station 7:13a 7:43a
Sunnyvale Station 7:16a 7:23a 7:40a 7:46a 7:54a
Mountain View Station 7:12a 7:21a 7:28a 7:51a 7:59a
San Antonio Station 7:31a 8:02a
California Avenue Station 7:34a 8:05a
Palo Alto Station 7:20a 7:28a 7:38a 7:50a 7:58a 8:09a
Menlo Park Station 7:30a 7:40a 8:00a 8:11a
Atherton Station 7:32a 8:02a
Redwood City Station 7:36a 7:45a 7:57a 8:06a 8:16a
San Carlos Station 7:48a 8:19a
Belmont Station 7:50a 8:21a
Hillsdale Station 7:31a 7:41a 7:53a 8:11a 8:24a
Hayward Park Station 7:43a 8:13a
San Mateo Station 7:45a 7:56a 8:06a 8:15a 8:27a
Burlingame Station 7:48a 8:18a
Broadway Station 7:50a 8:20a
Millbrae Station 7:39a 7:54a 8:02a 8:12a 8:24a 8:33a
San Bruno Station 8:06a 8:37a
So. San Francisco Station 8:01a 8:10a 8:31a 8:41a
Bayshore Station 8:06a 8:36a
22nd Street Station 8:11a 8:41a
4th & King Station 7:57a 8:15a 8:21a 8:29a 8:45a 8:52a
*Schedule to be determined
This is a prototypical schedule and was developed as a modeling input only. Additional service plans and schedule
options will be developed and considered in subsequent stages of the planning process

Caltrain/HSR Blended Service Plan / Operations Considerations Analysis (Requested by Stakeholders) | 28
Table 15: Peak 60 Minutes Southbound Baby Bullet Service – AM Simulated Schedule
417B 419 421 423B 425 427
4th & King Station 7:00a 7:07a 7:15a 7:30a 7:37a 7:45a
22nd Street Station 7:06a 7:12a 7:20a 7:36a 7:42a 7:50a
Bayshore Station 7:24a 7:54a
South SF Station 7:29a 7:59a
San Bruno Station 7:22a 7:52a
Millbrae Station 7:19a 7:25a 7:35a 7:49a 7:55a 8:05a
Broadway Station 7:28a 7:58a
Burlingame Station 7:30a 8:00a
San Mateo Station 7:33a 7:40a 8:03a 8:10a
Hayward Park Station 7:42a 8:12a
Hillsdale Station 7:37a 7:45a 7:57a 8:07a 8:15a
Belmont Station 7:39a 8:09a
San Carlos Station 7:41a 7:48a 8:11a 8:18a
Redwood City Station 7:32a 7:47a 7:54a 8:17a 8:24a
Atherton Station 7:57a 8:27a
Menlo Park Station 7:37a 7:51a 7:59a 8:21a 8:29a
Palo Alto Station 7:54a 8:02a 8:08a 8:24a 8:32a
California Ave. Station 7:57a 8:27a
San Antonio Station 8:00a 8:30a
Mountain View Station 7:48a 8:04a 8:09a 8:15a 8:34a 8:39a
Sunnyvale Station 8:13a 8:43a
Lawrence Station 8:16a 8:46a
Santa Clara Station 8:21a 8:51a
College Park Station *
San Jose Diridon Station 8:02a 8:16a 8:25a 8:30a 8:46a 8:55a
Tamien Station 8:33a 9:03a
*Schedule to be determined
This is a prototypical schedule and was developed as a modeling input only. Additional service plans and schedule
options will be developed and considered in subsequent stages of the planning process
Caltrain/HSR Blended Service Plan / Operations Considerations Analysis (Requested by Stakeholders) | 29
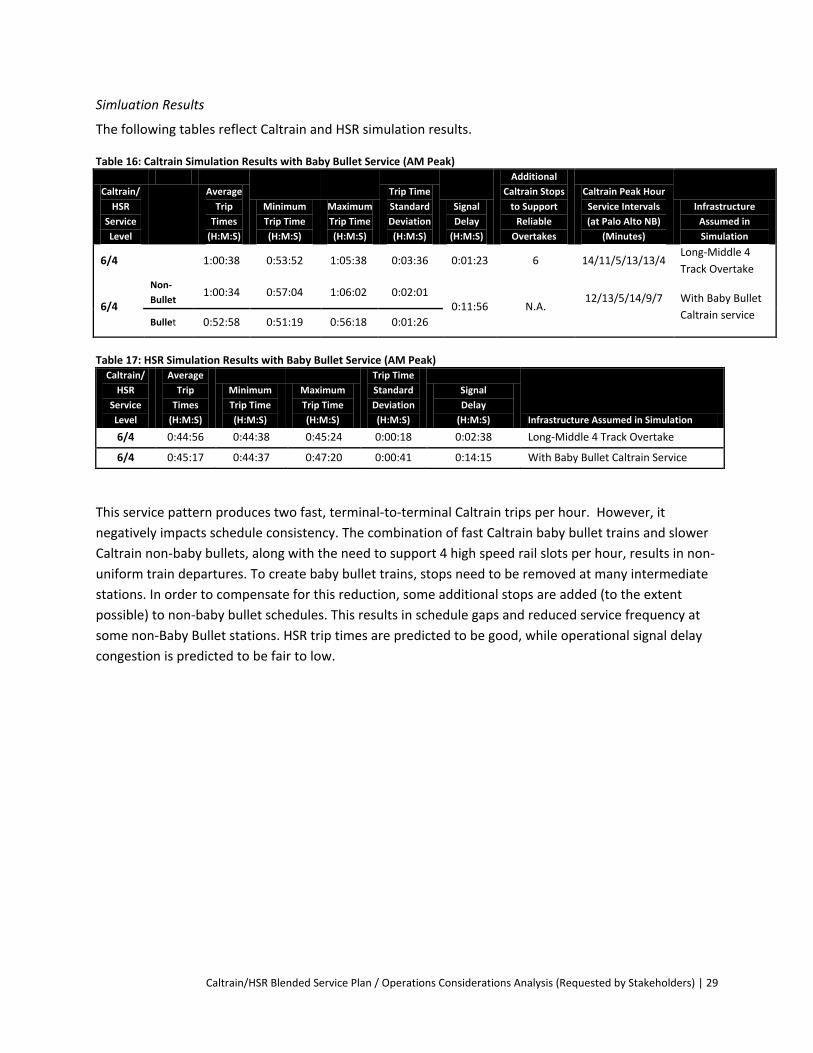
Simluation Results
The following tables reflect Caltrain and HSR simulation results.
Table 16: Caltrain Simulation Results with Baby Bullet Service (AM Peak)
Caltrain/
HSR
Service
Level
Average
Trip
Times
(H:M:S)
Minimum
Trip Time
(H:M:S)
Maximum
Trip Time
(H:M:S)
Trip Time
Standard
Deviation
(H:M:S)
Signal
Delay
(H:M:S)
Additional
Caltrain Stops
to Support
Reliable
Overtakes
Caltrain Peak Hour
Service Intervals
(at Palo Alto NB)
(Minutes)
Infrastructure
Assumed in
Simulation
6/4 1:00:38 0:53:52 1:05:38 0:03:36 0:01:23 6 14/11/5/13/13/4 Long-Middle 4
Track Overtake
6/4
Non-
Bullet 1:00:34 0:57:04 1:06:02 0:02:01
0:11:56 N.A. 12/13/5/14/9/7
With Baby Bullet
Caltrain service Bullet 0:52:58 0:51:19 0:56:18 0:01:26
Table 17: HSR Simulation Results with Baby Bullet Service (AM Peak)
Caltrain/
HSR
Service
Level
Average
Trip
Times
(H:M:S)
Minimum
Trip Time
(H:M:S)
Maximum
Trip Time
(H:M:S)
Trip Time
Standard
Deviation
(H:M:S)
Signal
Delay
(H:M:S) Infrastructure Assumed in Simulation
6/4 0:44:56 0:44:38 0:45:24 0:00:18 0:02:38 Long-Middle 4 Track Overtake
6/4 0:45:17 0:44:37 0:47:20 0:00:41 0:14:15 With Baby Bullet Caltrain Service
This service pattern produces two fast, terminal-to-terminal Caltrain trips per hour. However, it
negatively impacts schedule consistency. The combination of fast Caltrain baby bullet trains and slower
Caltrain non-baby bullets, along with the need to support 4 high speed rail slots per hour, results in non-
uniform train departures. To create baby bullet trains, stops need to be removed at many intermediate
stations. In order to compensate for this reduction, some additional stops are added (to the extent
possible) to non-baby bullet schedules. This results in schedule gaps and reduced service frequency at
some non-Baby Bullet stations. HSR trip times are predicted to be good, while operational signal delay
congestion is predicted to be fair to low.

Caltrain/HSR Blended Service Plan / Operations Considerations Analysis (Requested by Stakeholders) | 30
6. Other Considerations
This section provides a qualitative analysis of the remaining service plan / operations considerations.
Longer Train Consists and Less Train Frequency
Cities are concerned about increasing the number of trains during the peak periods. They are concerned
that more frequent trains will increase gate downtime resulting in a significant impact on local traffic
and safety at the at the existing at-grade crossings.1
Cities asked Caltrain to evaluate the operational feasibility and implications of keeping the same number
of trains as today during the peak hours and to consider increasing the train consists (rather than
increasing the number of trains) to accommodate increases in ridership.
The evaluation below compares operating five trains per peak hour per direction (today’s service level)
to the planned six in an electrified system with electric multiple unit (EMU) trains. Based on typical EMU
design, five 8-car trains have a roughly equivalent passenger capacity to six 6-car trains. EMU length is
assumed to be 85 feet per car with an average seating capacity of 118.5 seats per car.
Table 18 details the peak hour (per direction) capacity of six 6-car trains compared to five 8-car trains
and resulting train consist lengths.
Table 18: Peak Hour EMU Capacity Comparison
Service Frequency
(tphpd)
Average EMU Seating Capacity
EMU Train Consist Total Train Consist
Capacity
Peak Hour Capacity
(per direction)
Train Consist Length
(85 ft/car)
6 118.5 seats
6 car 711 4,266 510 ft
5 8 car 948 4,740 680 ft
The following comparative evaluation is focused on ridership, station platform length and gate down
time.
Ridership
The overall passenger capacity per peak hours between a six train (6-car train) and five train (8-car train)
is roughly equivalent (+/- 10%). However, ridership forecast models and realized ridership show that
demand positively correlates with increases in service frequency.
TCRP Report 95, Chapter 9: Transit Scheduling and Frequency – Traveler Response to Transportation
System Changes (Transportation Research Board, Washington DC, 2004) reports on the positive
correlation between service frequency and ridership for commuter rail service. When service frequency
is doubled, ridership increases by 50%. The same concept holds true for service frequency reductions
and ridership decreases. Growing the seat capacity with longer train consists but capping service
1 With the advanced signal system (CBOSS), gate down time will decrease at select at-grade crossings. CBOSS includes a performance attribute
that will eliminate the double gate down action at crossings located near stations. See Caltrain/ HSR Grade Crossing and Traffic Analysis (June
2013) for more information.

Caltrain/HSR Blended Service Plan / Operations Considerations Analysis (Requested by Stakeholders) | 31
frequency at today’s level will limit the potential for demand and ridership increase for Caltrain services
in the future. The 2009 Caltrain Electrification Final EA/EIR shows that increasing service frequency to 6
trains per peak hour peak direction increases ridership demand by approximately 10% compared to a 5
train per peak hour peak direction service. This comparison hints at sensitivity of ridership to service
frequency but should not be referenced as the basis for an absolute comparison, as the 6 train service
assumes a prototypical schedule based on an electrified system and the 5 train service essentially
reflects today’s service based on a diesel system.
Passenger Boarding and Platform Length
Currently, only 4th/King, Bayshore, San Bruno, Milbrae, Palo Alto, Stanford, Lawrence, and Diridon
stations have existing or under construction platforms that are longer than the 680 ft. required to
support 8-car consists. To address this problem, a capital or operational solution would be needed.
The capital solution would involve increasing platform lengths beyond 680 ft. at all Caltrain stations in
order to accommodate 8-car train consists. This would allow for boarding and alighting via all train cars
and thus would not adversely affect station dwell times and end-to-end runs times. A series of capital
improvements to lengthen station platforms throughout the system would present significant
challenges and costs. At stations like Hayward Park that are relatively free from ROW constraints and do
not have adjacent roadways crossing the tracks, extending the platforms would likely be a
straightforward capital improvement. At other stations like Burlingame, however, at-grade crossings to
the north and south of the existing platform pose significant physical constraints to platform extension.
Undertaking platform extension projects throughout the system would also create construction impacts
that would have the potential to effect Caltrain operations.
The operational solution involves limiting where passengers can board and alight. For example,
passengers could be restricted to boarding and alighting in only the front 6 cars versus all 8 cars. This
type of operation is practiced at other properties in cases where few stations have constrained platform
lengths. However, in the case where more than a small percentage of stations constrain operations in
this manner, this solution is neither safe nor practical. This operational scenario would likely result in
increased dwell times and would have corresponding schedule implications such as a longer overall end-
to-end trip times. It also presents challenges to addressing the needs of passengers with disabilities.
Under this operational scenario, passengers in wheelchairs would need to make sure they were seated
in the right car to access the mini highs at station platforms and would also face difficulties navigating
through crowds of standing passengers congregated in the 6 cars where boarding and alighting activities
would be permitted.
Gate Down Time
A scenario with 5 trains per peak hour per direction will result in fewer instances of gate downtime than
the 6 train per hour scenario. However, the duration of each gate closing in the 5 train scenario would
last slightly longer due to the trains being longer. Beyond this basic assessment, further judgment
cannot be made regarding comparable impacts to gate downtime and the motorist at the at-grade
crossings. A computer simulation would be needed for such an analysis given the high level of
Caltrain/HSR Blended Service Plan / Operations Considerations Analysis (Requested by Stakeholders) | 32
sensitivity between the train schedule and gate down time. Such a level of analysis is not included in the
scope of this study.
High-Speed Rail Storage / Maintenance Facility
Local stakeholders asked if the high-speed rail system will still require a storage/maintenance facility in
the peninsula. When the 4-track fully grade separated system was contemplated in the peninsula, a
storage/maintenance facility of approximately 100 acres was contemplated at several locations
including San Francisco, Brisbane, SFO and Santa Clara. Given that Caltrain is now committed to a
blended system on the peninsula, previous assumptions for HSR operations and maintenance facilities
have changed.
High-speed train service will still be required to begin in San Francisco. However, the fleet size stored in
the San Francisco area can be reduced based on the lower service levels assumed in the CHSRA Revised
2012 Business Plan. The size of the facility needed will be contingent on the number of trains operated
on the peninsula but will be a significant reduction from previous estimates (based on an assumed 27
train sets). A reduced number of train sets will lead to an associated reduction in the required storage
yard size and footprint.
The CHSRA is currently re-evaluating the peninsula for site specific and operationally feasible locations
that will meet the needs for maintenance and storage of high speed train sets. Suitable potential sites
will be identified and evaluated through the Blended System NEPA/CEQA environmental process, a later
process that is separate and distinct from the Peninsula Corridor Electrification EIR.
Future ACE, Capitol Corridor, and Amtrak Services
Local stakeholders asked if the blended system will impact Caltrain’s passenger rail tenants. Based on
concepts developed for the San Jose to Merced segment of the high-speed rail system, the blended
system does not impact Caltrain’s passenger rail tenants ACE, Capital Corridor and Amtrak.
From San Francisco to just north of the Caltrain Santa Clara Station (CP De La Cruz), high-speed rail will
use Caltrain mainline tracks. However, approximately at CP De La Cruz, it is assumed that high-speed rail
trains will transition from sharing Caltrain main line tracks to a dedicated two-track aerial alignment and
remain grade-separated on dedicated tracks to Diridon Station and southward from there towards Los
Angeles. This separate facility will keep high-speed trains separate from Caltrain, ACE, Capital Corridor
and Amtrak trains in the south terminal area which includes the Caltrain Santa Clara and Diridon
stations.

Caltrain/HSR Blended Service Plan / Operations Considerations Analysis (Requested by Stakeholders) | 33
Figure 12 shows the blended system without passing tracks and highlights the south terminal area from
CP Coast to CP Lick.
Figure 12: Schematic of CP Coast to CP Lick (highlighted in red box)
While high-speed rail trains in the Caltrain corridor (the blended service) will not impact ACE, Capitol
Corridor and Amtrak existing and future service, Caltrain will need to expand capacity and deploy
operational strategies in the south terminal area to support their future service plans with increased
electrified Caltrain service. A technical study (South Terminal Area Capacity Study) is currently being
prepared to determine how to support future ACE, Capitol Corridor and Amtrak and Caltrain service.
Freight Service
Local stakeholders asked how the blended system would impact freight service in the peninsula
corridor. The blended system requires an electrified corridor and the use of electric multiple unit trains
(EMUs) to meet the needs of Caltrain and to create the capacity to support high-speed rail trains in the
peninsula corridor. EMUs can be used if they are temporally separated from freight trains. This may
result in changing the freight operating hours.
Based on the existing trackage rights agreement between the JPB and UP, freight is allowed to operate
between midnight and 5 AM and during at least one 30 minute slot between 10 AM and 3 PM between
San Francisco (MP 0.2) and CP Coast (MP 44.75). In the south terminal area from CP Coast to CP Lick (MP
51.9), MT1 (owned by the UP) is always available for freight use.

Caltrain/HSR Blended Service Plan / Operations Considerations Analysis (Requested by Stakeholders) | 34
In 2010, the Federal Railroad Administration (FRA) granted a conditional waiver to Caltrain to operate
EMUs (identified at the time as “non-compliant” equipment, now referenced as “alternative compliant”
equipment) with Caltrain’s diesel fleet (“compliant” equipment) in the future. One of the conditions in
the waiver states that Caltrain must submit a temporal separation plan to the FRA before Caltrain can
operate EMUs. The proposal presented to the FRA to obtain the conditional waiver assumed that in the
area north of the Santa Clara station to San Francisco, freight trains would only operate between
midnight and 5am and in the south terminal area, MT1 would always be available for freight.
Moving forward, Caltrain will be meeting with the FRA and developing the required temporal separation
plan. If the original proposal is what is required by the FRA, in the area north of the Santa Clara Station,
freight movements will need to be contained to the midnight to 5 am period. This would affect
approximately 6 freight trips per day. If other strategies can be developed, changes in operating hours
may be minimized. Based on various discussions occurring in the rail industry, technicians are
contemplating whether positive train control (included as a component of the Caltrain advanced signal
system project to be operational by late 2015) might satisfy the requirement to temporally separate
freight and alternative compliant equipment. If there is merit to this evolving thought, changes to freight
operating windows may not be necessary. This dialogue will be monitored closely as it could greatly
influence the temporal separation plan to be prepared and submitted to the FRA. JPB will continue to
meet with Union Pacific Railroad, the existing freight service provider, to assure continued sharing of
information regarding Caltrain’s plans for railroad-related improvements in the corridor and to maximize
the opportunity for joint planning.
In addition to the potential impacts of changes in the windows of freight operations, stakeholders
expressed other concerns related to how the height of the overhead contact system (OCS) might impact
the corridor freight load and how construction impacts to freight traffic will be analyzed as part of the
Peninsula Corridor Electrification EIR.

Caltrain/HSR Blended Service Plan / Operations Considerations Analysis (Requested by Stakeholders) | 35
7. Conclusion
The analysis performed in this study serves an educational purpose and should inform the development
of the blended system program as we continue our dialogue with our stakeholders.
Specifically:
The passing track analysis will inform future discussions and decisions related to passing track
location and design;
The other infrastructure and service pattern analysis will inform the development of Caltrain
EMU service plans and blended system service plans with high speed rail; and
The qualitative section of this analysis provides definition regarding how and in what venue
various additional considerations related to the blended system will be addressed.
This analysis concluded that all of the tested blended system options are viable as simulated in the
model. However, the simulation also revealed that there are notable performance differences between
the options examined. As planning for the blended system continues, additional due diligence will be
needed to confirm the performance of the options considered relative to real world system operations.
It is anticipated that the blended system planning process will continue to advance after certification of
the Peninsula Corridor Electrification EIR, which is currently underway. This study should be used to
inform the development of the blended system alternatives that will ultimately by environmentally
evaluated in a future EIS/EIR by the CHSRA.