calm after the storm - ucl · calm after the storm: the configurational approach to manage flood...
TRANSCRIPT
SSS10 Proceedings of the 10th International Space Syntax Symposium
070
Calm after the storm: The configurational approach to manage flood risk in river-cities
Angela, Esposito University of Naples "Federico II" [email protected] Valerio, Di Pinto University of Naples "Federico II" [email protected]
Abstract
Watercourses can play a crucial role in settlement development, both in term of land use and space perception. River presence influences the whole urban pattern and whatever element that modifies spatial configuration -such as areas that can't be reached after a flood event- will globally affect the distribution of configurational indexes within the grid. Even if one could appear just a local grid variation, the whole city's working way will be modified and, in turn, the city recovery rate after a flood event could change too.
Configurational analysis in river cities contexts can be assumed as a decision making support tool: it allows to evaluate how flood recovery can change on varying of spatial configuration, helping in quantitatively assess a sort of spatial urban resilience property. Then, it needs to choose which configurational measures could suitably describe this property.
In technical literature some previous works have analysed urban resilience, attempting to describe it through a configurational approach at urban and architectural scale (Cutini, 2013; Koch and Miranda Carranza, 2013).
Focusing on flood resilience evaluation, space syntax measures have been carried out for the Turin metropolitan area (IT). The chosen case study region is an urban context with more than 500.000 inhabitants, crossed by two of the major Italian rivers. Assuming a flood scenario in the region, the feasibility of applying literature resilience indicators for flood event has been assessed, even if they have not been defined in relation to a flood event. The results have shown that, although useful in describing some grid properties, these indicators can't coherently be assumed to define if a certain urban system is resilient to flood events.
Therefore, as a starting point to achieve appropriate measures of flood resilience (in syntactic terms), it has been considered to pursue the priority objective to correctly estimate flood related changes in configuration layout, from spatial and functional perspectives. A statistical-based approach has been pointed out, obtaining a post-processing methodology. The latter has been applied to Turin case study, providing coherent and meaningful outcomes and allowing to overcome some operational issues in comparing different grids.
Evaluation of flood syntactic effects leads to a first flood resilience characterisation.
Keywords
City-river system, flood risk, configurational analysis, resilience.
A Esposito & V Di Pnto Calm after the storm: The configurational approach to manage flood risk in river-cities
70:1
SSS10 Proceedings of the 10th International Space Syntax Symposium
1. Introduction
Reflecting the several classifications of flood related damages and effects, many different definitions of resilience have been pointed out in technical and scientific literature. United Nations defined resilience as "the capacity of a system, community or society potentially exposed to hazards to adapt, by resisting or changing in order to reach and maintain an acceptable level of functioning and structure" (UN, 2005). Actually, the definition of the concept of resilience is a broad debate, begun many years ago and still open in the literature. Starting from an initial discussion about ecosystems (Holling, 1973), physics and psychology (Manyena, 2006), it results often studied on the basis of desirable characteristics of a “resilient system” (Tyler and Moench, 2012). In general, resilience is assumed as the ability to cope with a certain unsuccessful event.
If threatening urban areas, hazardous events - whichever type they are - inevitably affect aspects of city's organisation, in functional or structural terms. This circumstance is strongly considerable in case of natural disasters: given the complexity of many overlapping networks that combine to create what we call 'city' (such as social, economic or infrastructural nets), calamitous events can determine a wide range of direct and indirect effects. As a consequence, various considerations should be done to completely investigate impacts on urban systems, how the event affects city's functioning and how the city works during the post-event phase, attempting to assess city's reaction to such unexpected disturbance.
This premise allows to realize the need of some basic assumptions: we should define what we assume as a system to be analysed, jointly with the specific calamity it has to cope with, as well as the study perspective. In particular, this work focuses on evaluating spatial effects of urban floods. Having this aim, riverine cities are studied as river-cities, considering built environment and river courses as a whole. .
The strong mutual influence between rivers and the structure of the urban settlements they cross, in fact, suggests not to study them separately. Grid's layout reflects river presence, so configurational approach provides appropriate measures. The latter are representative of spatial properties that, in turn, implicitly account for proximity to water courses.
Assuming spatial configuration as a set of relations among urban spaces, and the said relations as an 'intrinsic aspect' of human activities (Hillier and Vaughan, 2007), changes in grid's pattern result not only into geometric variations of grid extension (which can be due to no more accessible zones,). Connecting grid structure to syntactic properties that it allows to investigate, changes in urban space boundary - representative of a new post-flood pattern of accessible spaces- mean a different set of spatial relations among parts of the grid, . It results into a globally transformed space perception, reflected by a completely new distribution of configurational indexes, which can change even for those spaces that still remain accessible after the event. As a result, even if a flood event affects well defined zones, it determines not equally space-limited variations, as regard urban centralities' location. In other terms, flood prone areas can be promptly defined, starting from analysing hydraulic and morphologic issues. However, flood related spatial consequences are not so readily inferred from a syntactic point of view.
2. Background
In the field of configurational analysis, some literature works have attempted to evaluate spatial resilience through syntactic measures. Although not specially focused on flood events, these studies have assumed that a certain grid pattern is modified by a perturbation obtaining a different configuration. Independently of the type of perturbation (although we can imagine that various perturbations can determine different corresponding spatial changes), in each case resilience has been investigated starting from comparing two scenarios (meaning the two configurations before and after the perturbation).
At architectural scale of analysis, syntactic resilience has been analysed with regard to way finding processes, assuming integration as a significant property. Entity of spatial changes has been evaluated considering how the modified configuration works differently compared with the one
A Esposito & V Di Pnto Calm after the storm: The configurational approach to manage flood risk in river-cities
70:2

SSS10 Proceedings of the 10th International Space Syntax Symposium
prior to the change. Consequently, 'sameness' and 'similarity' have been defined. The former is the statistical correlation between integration values of the two configurations; the latter, it is a qualitative evaluation reached by comparing integration summary statistical attributes before and after the change (Koch and Miranda Carranza, 2013).
At a wider scale, some spatial properties have been pointed out as distinguishing features in defining a resilient system. Based on connectivity, global choice and integration (global and local), a sort of resilience indicators have been applied for earthquake induced variations (Cutini, 2013).
3. Urban flood resilience assessment
In order to describe how flood related changes influence syntactic properties, analysis of the present city's configuration of a certain settlement represents the starting step to appreciate entity of variations. Furthermore, the evaluation of grid features, once it has been modified (since some areas have been flooded), allows to investigate the new city functioning and to estimate variations in respect to pre-event case. In this way, two different scenarios have to be studied.
In order to operatively assess flood related changes in urban layout, in this work Turin (IT) metropolitan area has been chosen as a suitable case study. The extent of study area (166 sqkm) has been delimited, on the basis of structural elements which act as barriers, not simply assuming Turin administrative boundaries. Three rivers (Dora Riparia, Stura di Lanzo, Po) cross the selected area in different parts, providing a region with distinctive river landscapes and large water availability. These factors fit for settlements' locations, which however necessarily have to cope with flood hazard. Selection of open spaces has provided a first grid structure representative of pre-event functioning (Scenario 0).
Aiming at defining a post-event scenario, flood prone areas have been pointed out adopting Po River Basin Authority data for a 500-years flood return period. Given the morphologic features and the particular river courses locations, flooded areas are placed as a sort of rivers' buffer, splitting the study area in four parts. In fact, after the event four subsystems can be identified: SUB1, located between Po and Dora Riparia rivers, SUB2 between Stura di Lanzo and Dora Riparia rivers, SUB3 in the North of Stura di Lanzo and SUB4 beyond Po River. As regard further analysis, just SUB1 and SUB2 will be considered, being the others more peripheral.
SUB3 appears small regarding the adopted scale of analysis, while SUB4 is mostly a natural environment Therefore, the post event configuration (Scenario1) has been assumed as the union of all open spaces of SUB1 and SUB2. It needs to specify that being not connected each other, these two subsystems (hereafter respectively named Scenario1_SUB1 and Scenario1_SUB2) have been individually analysed, as isolated parts.
A Esposito & V Di Pnto Calm after the storm: The configurational approach to manage flood risk in river-cities
70:3

SSS10 Proceedings of the 10th International Space Syntax Symposium
Figure 1: Public space map of the city of Turin (IT). In red, the boundary of the case-study area. In yellow transparency, 500-year flood plains.
Aiming at investigating how the system reacts, pre and post event configurations have to be studied individually to evaluate occurred changes from their comparison.
Angular Segment Analysis (ASA) has been performed through depthmapX software (Varoudis, 2012), achieving topologic measures at global (R=n) and local (R=3) radii. More in detail, post event configuration has been obtained, creating a new segment map in each subsystem of Scenario1, and not simply by removing some areas from pre-event segment map.
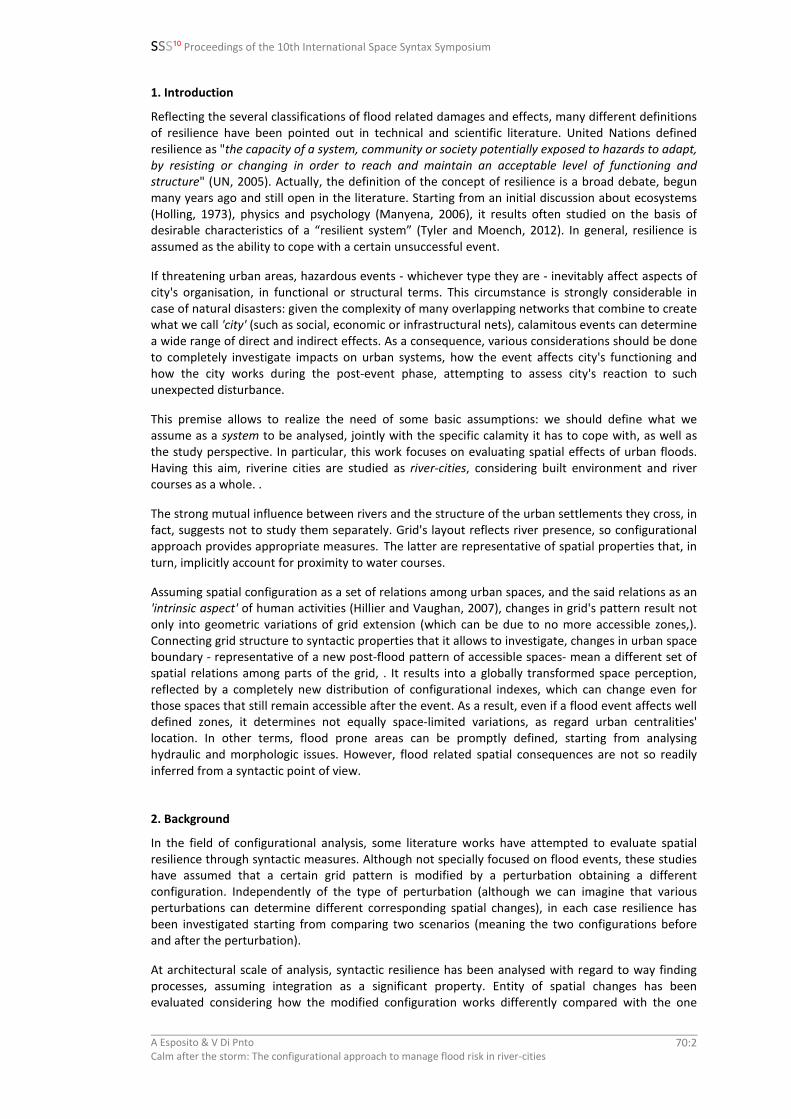
Integration core varies on varying of map layout. Some lines belong to integration core both in Scenario0 and in Scenario1. Despite this coincidence, after the event other lines also contribute to create the correspondent sets of most integrated lines. It supports the assumption that, even if flood prone areas can be limited and spatially defined, flood effects occur in substantially wider zones (even not directly flooded). Similarly, changes in integration core suggest that a flood event most likely influences overall urban centralities' distribution.
A Esposito & V Di Pnto Calm after the storm: The configurational approach to manage flood risk in river-cities
70:4
SSS10 Proceedings of the 10th International Space Syntax Symposium
Figure 2: Integration core Scenario0 (10% most integrated lines)
A Esposito & V Di Pnto Calm after the storm: The configurational approach to manage flood risk in river-cities
70:5
SSS10 Proceedings of the 10th International Space Syntax Symposium
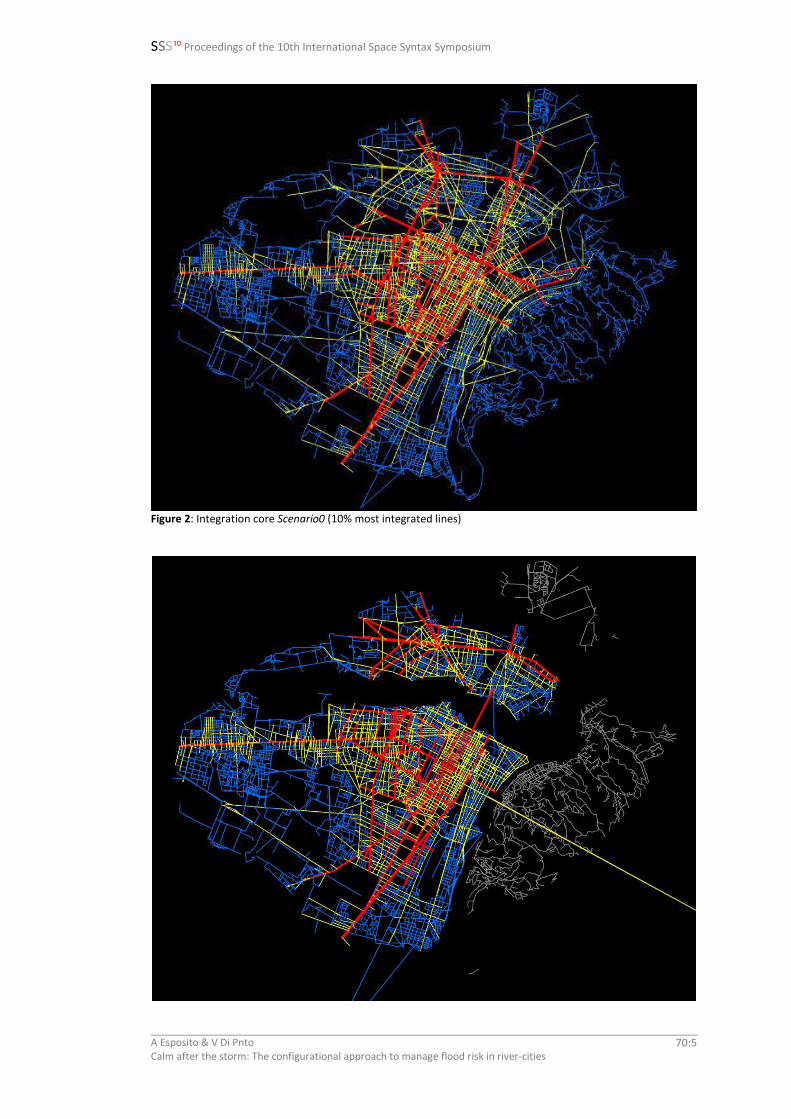
Figure 3: Integration core Scenario1_SUB1 and Scenario1_SUB2 (10% most integrated lines) As a starting step, resilience indicators discussed in the literature have been calculated both for Scenario0 andScenario1 configurations.
Although not proposed referring to urban level, resilience indicators described by Koch and Miranda Carranza (2013) have resulted not directly applicable to Turin case study. By definition, these indicators are strictly related to the number of elements which are compared in reproducing pre-event and post-event configurations. InTurin analysis , segment maps in Scenario0 and Scenario1 are made up of a different number of segments. Therefore, comparison should be done avoiding any procedure or calculation that could be affected by how many elements are being compared.
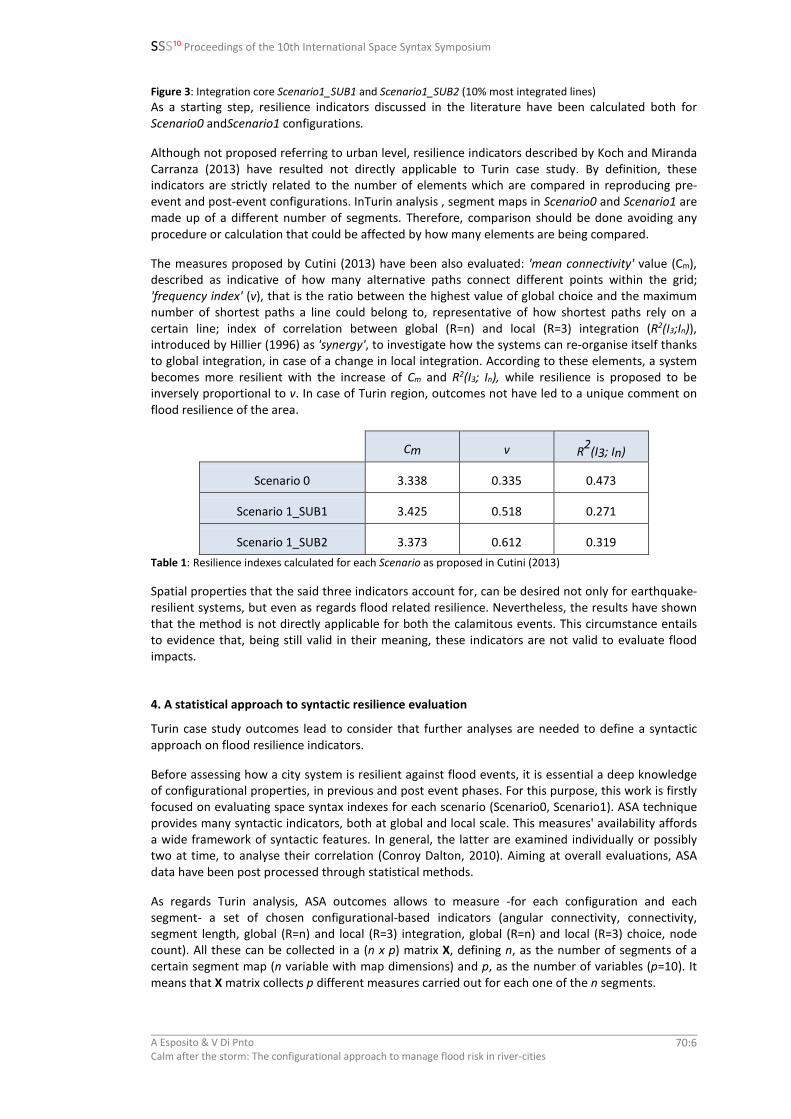
The measures proposed by Cutini (2013) have been also evaluated: 'mean connectivity' value (Cm), described as indicative of how many alternative paths connect different points within the grid; 'frequency index' (v), that is the ratio between the highest value of global choice and the maximum number of shortest paths a line could belong to, representative of how shortest paths rely on a certain line; index of correlation between global (R=n) and local (R=3) integration (R2(I3;In)), introduced by Hillier (1996) as 'synergy', to investigate how the systems can re-organise itself thanks to global integration, in case of a change in local integration. According to these elements, a system becomes more resilient with the increase of Cm and R2(I3; In), while resilience is proposed to be inversely proportional to v. In case of Turin region, outcomes not have led to a unique comment on flood resilience of the area.
Cm v R2(I3; In)
Scenario 0 3.338 0.335 0.473
Scenario 1_SUB1 3.425 0.518 0.271
Scenario 1_SUB2 3.373 0.612 0.319 Table 1: Resilience indexes calculated for each Scenario as proposed in Cutini (2013)
Spatial properties that the said three indicators account for, can be desired not only for earthquake-resilient systems, but even as regards flood related resilience. Nevertheless, the results have shown that the method is not directly applicable for both the calamitous events. This circumstance entails to evidence that, being still valid in their meaning, these indicators are not valid to evaluate flood impacts.
4. A statistical approach to syntactic resilience evaluation
Turin case study outcomes lead to consider that further analyses are needed to define a syntactic approach on flood resilience indicators.
Before assessing how a city system is resilient against flood events, it is essential a deep knowledge of configurational properties, in previous and post event phases. For this purpose, this work is firstly focused on evaluating space syntax indexes for each scenario (Scenario0, Scenario1). ASA technique provides many syntactic indicators, both at global and local scale. This measures' availability affords a wide framework of syntactic features. In general, the latter are examined individually or possibly two at time, to analyse their correlation (Conroy Dalton, 2010). Aiming at overall evaluations, ASA data have been post processed through statistical methods.
As regards Turin analysis, ASA outcomes allows to measure -for each configuration and each segment- a set of chosen configurational-based indicators (angular connectivity, connectivity, segment length, global (R=n) and local (R=3) integration, global (R=n) and local (R=3) choice, node count). All these can be collected in a (n x p) matrix X, defining n, as the number of segments of a certain segment map (n variable with map dimensions) and p, as the number of variables (p=10). It means that X matrix collects p different measures carried out for each one of the n segments.
A Esposito & V Di Pnto Calm after the storm: The configurational approach to manage flood risk in river-cities
70:6

SSS10 Proceedings of the 10th International Space Syntax Symposium
All p variables are related and quantitative measures. Then a (p x p) covariance matrix S can be evaluated. Statistical correlation among p variables could suggest that just few of them (or suitable variables consolidations) can mostly account for a large part of the whole X dataset-variance. This kind of observation represents the basic issue of the multivariate technique of Principal Component Analysis (PCA), which aims to reproduce the total variance of p related variables by a lower number of new k variables (k<p) called 'principal components' (PC). Therefore, PCA summarizes the p variables, accenting the configurational meaning of the whole 10-dimensional set.
PC are obtained as linear transformations of the initial p variables, uncorrelated and listed in descending order of their variance. Once known S matrix, algebraic considerations lead to PCA theoretical basis. The evaluation of S-eigenvectors and S-eigenvalues allows PC to be pointed out. In detail, each S-eigenvector contains the coefficients through which obtain linear transformations of the initial p variables. Given a certain S-eigenvector (namely, av), a relative PCv can be evaluated. The relative S-eigenvalue (namely, ) corresponds to PCv variance. Being S a (p x p) matrix, p different S-eigenvalues can be obtained (related to p S-eigenvector).
Figure 4: Correlation among analyzed variables. Blue colour ramp reveals increasing direct correlation - Red colour ramp reveals increasing inverse correlation.
Generally, PCA is carried out expressing X values as deviations from their average. However, variables cannot be directly compared if they differ one from each other, in measuring units or order of magnitude of their values. In this case, X values should be considered as standardised. Expressing the original X dataset in normalised terms, values can be collected in Z (n x p) matrix (instead of considering X). Analytically, this is the same of assuming R (p x p) correlation matrix, instead of S.
Given a certain PCv , the ratio between and the total variance of the original dataset (computable from S or R, as the case may be) represents which percentage of the original total variance is explained by that principal component PCv. If all PC are considered, the total original variance is accounted for. However, in this way no benefits are obtained with regard to the A Esposito & V Di Pnto Calm after the storm: The configurational approach to manage flood risk in river-cities
70:7

SSS10 Proceedings of the 10th International Space Syntax Symposium
reduction of the data multi-dimensionality. The literature proposes different selection criteria for choosing how many k components of all PC factors are enough to describe a sufficiently high proportion of the original p-variables variance.
Once certain number k (k<p) of components has been pointed out, respective av=1...k vectors serve to determine values of each PCv=1...k for all n elements ('scores'): PCi1 = xi1 a11 + ....+ xip a1p (i =1...n). Scores can be collected in a (n x k) Y matrix, which represents the original X dataset in a new space, having a reduced number of k dimensions. In case k results equal or lower than three, 1, 2 or 3-dimensional plots can be obtained. Then, PCA contributes to an easier and more immediate graphical representation than using all p dimensions of the processed dataset.
Given a certain principal component PCv, the following measures can be calculated:
- the statistical correlations between PCv and each one of original p variables. This measures help in explaining which one of the p variables mainly contributes to define PCv;
- the amount of variance of each p variable explained by PCv. This value regards the lack of information determined by assuming PCv as a combination of the original p variables (instead of assuming all p variables).
- the total variance explained by PCv=1...k, summing the variance explained by each of PCv=1...k.
Turin ASA outcomes have been processed applying PCA using R software (R Core Team, 2014). The same procedure has been followed for all the available datasets (namely, for Scenario0, Scenario1_SUB1 and Scenario1_SUB2). In each analysis, R matrix has been assumed as more appropriated, given the significantly different values we need to compare. It has been assumed that the set of PCv=1...k factors should ensure on average the 95% of the variance of each of original variable (Zani and Cerioli, 2007). Examining ten variables in all cases (p=10), k corresponds to the number of k components able to reproduce a percentage of 59.87% of explained variance.
Adopting this criterion, just the first two components (PC1; PC2) have resulted to be significant, summarizing most of the initial variance.
Scenario 0
% of variance explained
Cumulative value
PC1 55.0% 55.0%
PC2 12.2% 67.2%
Table 2: Explained variance (in percentage) by the components PC1 and PC2 for analyzed scenarios
Correlation coefficients (numerically variable from -1.0 to +1.0) between each p variable and each PCv=1...k factor can be displayed in the 'component plot'.
Scenario1 SUB1 % of variance explained
Cumulative value
PC1 49.2% 49.2% PC2 16.5% 65.7%
Scenario1 SUB2
% of variance explained
Cumulative value
PC1 50.7% 50.7% PC2 14.4% 65.1%
A Esposito & V Di Pnto Calm after the storm: The configurational approach to manage flood risk in river-cities
8

SSS10 Proceedings of the 10th International Space Syntax Symposium
Figure 5: Component plots for analyzed scenarios
Axes of component plot correspond to the selected PCv=1...k components; each point stands for one of the p variables. By construction, the more a point in the graph results placed nearby a circle of radius one ('correlation circle'), the more the corresponding variable is well modelled by the chosen k components. Actually, except for segment length, variations of all the ten variables seem to be adequately represented by the selected PCk=1,2. It can be drawn a vector for each variable, joining each point in the component plot with axes' origin. The more the angle between such vectorand a given axis is small, the grater is the correlation between the variables (that the said vector accounts for) and the PC v=1...k. (that the axis represents). Even slightly varying in numerical terms, mostly the same pattern has been obtained in all maps: PC1 substantially results strongly correlated to local indexes and connectivity' measures, while PC2 to global choice. Angles between vectors stand for correlation between related variables. The plots show that all local measures and connectivity are strongly interrelated. A significantly less marked correlation exists between all these and global integration, becoming almost a null correlation in regard to global choice. The plane angle between global integration and dept shows they are not correlated, as expected. This observation can be assumed to attest the validity of the analysis, confirming that PCA outcomes are able to reproduce processed indexes. Choosing k=2 principal components, it has been possible to examine the wide initial dataset as a new data sample, composed by a (n x 2) Y matrix containing score values of PCk=1 and PCk=2. The relative score values of these two components for each segment of maps have been represented in two-dimensional scatter plots ('score plots').
A Esposito & V Di Pnto Calm after the storm: The configurational approach to manage flood risk in river-cities
9
SSS10 Proceedings of the 10th International Space Syntax Symposium
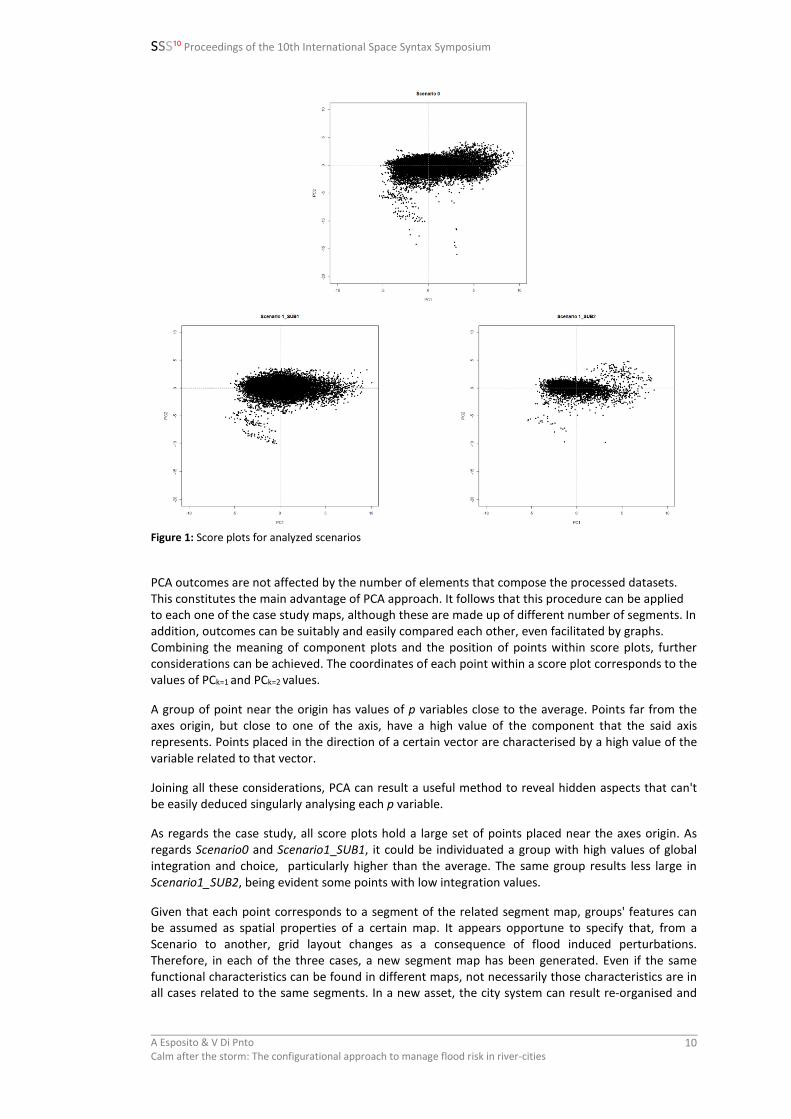
Figure 1: Score plots for analyzed scenarios
PCA outcomes are not affected by the number of elements that compose the processed datasets. This constitutes the main advantage of PCA approach. It follows that this procedure can be applied to each one of the case study maps, although these are made up of different number of segments. In addition, outcomes can be suitably and easily compared each other, even facilitated by graphs. Combining the meaning of component plots and the position of points within score plots, further considerations can be achieved. The coordinates of each point within a score plot corresponds to the values of PCk=1 and PCk=2 values.
A group of point near the origin has values of p variables close to the average. Points far from the axes origin, but close to one of the axis, have a high value of the component that the said axis represents. Points placed in the direction of a certain vector are characterised by a high value of the variable related to that vector.
Joining all these considerations, PCA can result a useful method to reveal hidden aspects that can't be easily deduced singularly analysing each p variable.
As regards the case study, all score plots hold a large set of points placed near the axes origin. As regards Scenario0 and Scenario1_SUB1, it could be individuated a group with high values of global integration and choice, particularly higher than the average. The same group results less large in Scenario1_SUB2, being evident some points with low integration values.
Given that each point corresponds to a segment of the related segment map, groups' features can be assumed as spatial properties of a certain map. It appears opportune to specify that, from a Scenario to another, grid layout changes as a consequence of flood induced perturbations. Therefore, in each of the three cases, a new segment map has been generated. Even if the same functional characteristics can be found in different maps, not necessarily those characteristics are in all cases related to the same segments. In a new asset, the city system can result re-organised and
A Esposito & V Di Pnto Calm after the storm: The configurational approach to manage flood risk in river-cities
10
SSS10 Proceedings of the 10th International Space Syntax Symposium
some areas (or rather, some segments) can play a different role in comparison with a pre-event configuration.
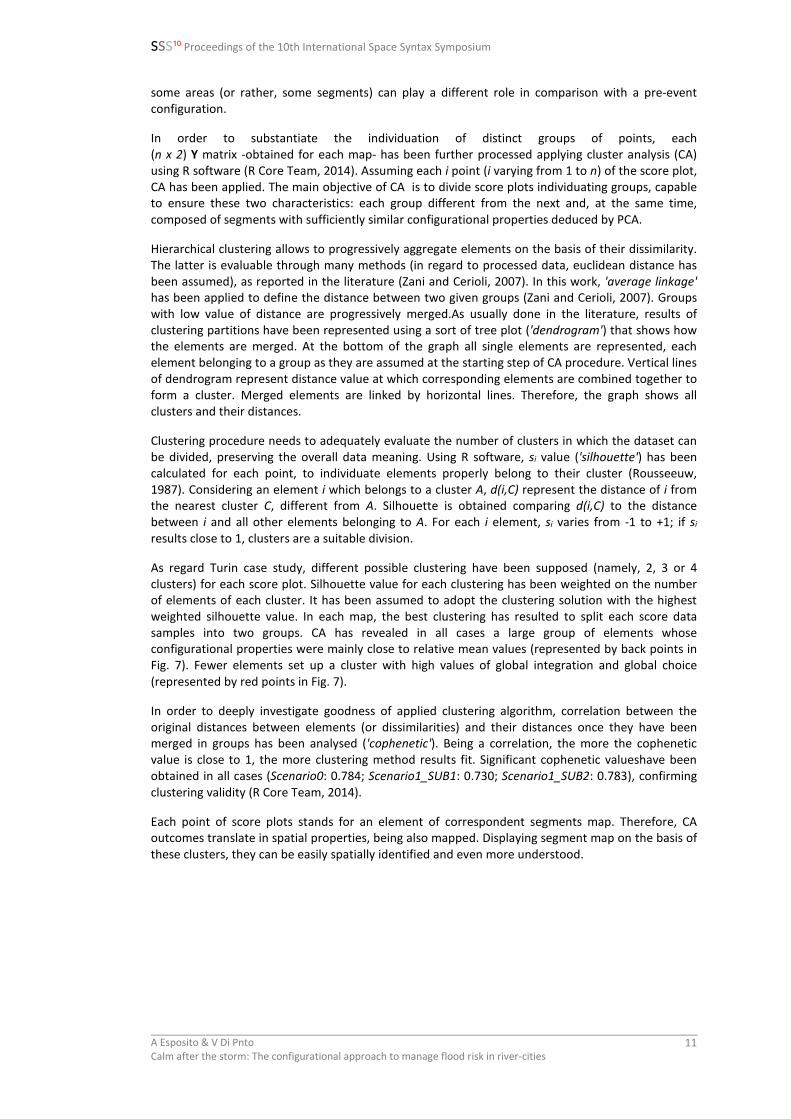
In order to substantiate the individuation of distinct groups of points, each (n x 2) Y matrix -obtained for each map- has been further processed applying cluster analysis (CA) using R software (R Core Team, 2014). Assuming each i point (i varying from 1 to n) of the score plot, CA has been applied. The main objective of CA is to divide score plots individuating groups, capable to ensure these two characteristics: each group different from the next and, at the same time, composed of segments with sufficiently similar configurational properties deduced by PCA.
Hierarchical clustering allows to progressively aggregate elements on the basis of their dissimilarity. The latter is evaluable through many methods (in regard to processed data, euclidean distance has been assumed), as reported in the literature (Zani and Cerioli, 2007). In this work, 'average linkage' has been applied to define the distance between two given groups (Zani and Cerioli, 2007). Groups with low value of distance are progressively merged.As usually done in the literature, results of clustering partitions have been represented using a sort of tree plot ('dendrogram') that shows how the elements are merged. At the bottom of the graph all single elements are represented, each element belonging to a group as they are assumed at the starting step of CA procedure. Vertical lines of dendrogram represent distance value at which corresponding elements are combined together to form a cluster. Merged elements are linked by horizontal lines. Therefore, the graph shows all clusters and their distances.
Clustering procedure needs to adequately evaluate the number of clusters in which the dataset can be divided, preserving the overall data meaning. Using R software, si value ('silhouette') has been calculated for each point, to individuate elements properly belong to their cluster (Rousseeuw, 1987). Considering an element i which belongs to a cluster A, d(i,C) represent the distance of i from the nearest cluster C, different from A. Silhouette is obtained comparing d(i,C) to the distance between i and all other elements belonging to A. For each i element, si varies from -1 to +1; if si results close to 1, clusters are a suitable division.
As regard Turin case study, different possible clustering have been supposed (namely, 2, 3 or 4 clusters) for each score plot. Silhouette value for each clustering has been weighted on the number of elements of each cluster. It has been assumed to adopt the clustering solution with the highest weighted silhouette value. In each map, the best clustering has resulted to split each score data samples into two groups. CA has revealed in all cases a large group of elements whose configurational properties were mainly close to relative mean values (represented by back points in Fig. 7). Fewer elements set up a cluster with high values of global integration and global choice (represented by red points in Fig. 7).
In order to deeply investigate goodness of applied clustering algorithm, correlation between the original distances between elements (or dissimilarities) and their distances once they have been merged in groups has been analysed ('cophenetic'). Being a correlation, the more the cophenetic value is close to 1, the more clustering method results fit. Significant cophenetic valueshave been obtained in all cases (Scenario0: 0.784; Scenario1_SUB1: 0.730; Scenario1_SUB2: 0.783), confirming clustering validity (R Core Team, 2014).
Each point of score plots stands for an element of correspondent segments map. Therefore, CA outcomes translate in spatial properties, being also mapped. Displaying segment map on the basis of these clusters, they can be easily spatially identified and even more understood.
A Esposito & V Di Pnto Calm after the storm: The configurational approach to manage flood risk in river-cities
11

SSS10 Proceedings of the 10th International Space Syntax Symposium
Figure 7: Score plots and dendrograms for analyzed Scenarios
A Esposito & V Di Pnto Calm after the storm: The configurational approach to manage flood risk in river-cities
12

SSS10 Proceedings of the 10th International Space Syntax Symposium
Figure 8: Scenario0, thematic map of clusters (red [black] segments represent red [black] points of corresponding score plot)
Figure 9: Scenario 1_SUB1 and Scenario1_SUB2, thematic map of clusters (red [black] segments represent red [black] points of corresponding score plot). Grey lines are part of not analyzed sub-systems.
A Esposito & V Di Pnto Calm after the storm: The configurational approach to manage flood risk in river-cities
70:13

SSS10 Proceedings of the 10th International Space Syntax Symposium
Some key issues can be pointed out. Firstly, even if three different maps have been compared (or rather, three distinct grids, segments maps and, consequently, spatial configurations), all these urban systems show a similar functional structure in syntactic terms. A limited number of spaces holds a crucial role, acting as global centralities: for each grid, they are at the same time the nearest spaces to all others as well as the most passed through ones in moving from the boundary to the centre. This observation reflects the main advantage of the proposed methodological procedure: Principal Component Analysis enables to suitably combine several configurational aspects, collecting broader information than analysing singularly each measure. Subsequent Cluster Analysis allows similarities among spaces to be investigated, exploiting their overall syntactic features. Significant is also the possibility of comparing dataset composed by different number of elements, guaranteeing the validity of deduced information. Since PCA and CA results shall in no way depend by dimensionality of dataset they are applied to (namely, the number of elements of each processed dataset), they represent an appropriate methodology for the major matter of comparing three urban systems, distinguished from each other in extension and likely in functional aspects.
Once system's variations have been understood, in spatial and functional terms, its re- organisation capacity can be analysed. If resilience property is assumed as the ability of a certain spatial system to ensure the same functional features, once having been subject to a strong change, according to PCA/CA results Turin river-city system appears to be reasonably resilient concerning to flood risk. Certainly, this is just a starting step in defining resilience property, given all the many possible meanings of this concept. Further information can be deduced from studying correlation between connectivity and global integration, the so-called 'intelligibility' (Hillier, 1996). Although the evaluation of intelligibility for ASA data is a debated issue (Zhang et al., 2013), this measure is still useful for the matter. In fact, urban resilience concerns variations of state variables and not their magnitude. For the case study, system's breakdown leads to a decrease of intelligibility (Scenario0=0.13; Scenario1_SUB1=0.03; Scenario1_SUB2=0.07). It means that limited information can be deduced exploring the overall system at a local level, despite some spaces play a relevant r o l e in global functioning.
5. Conclusions
Natural disasters (e.g.: floods, earthquakes...) induce variations in urban grid, modifying the layout of public spaces within which movement can happen. Configurational analysis is a very powerful tool in pointing out how a city system spatially reacts if subject to a certain change. It could be used to define resilience through spatial indicators, as a quantitative property of the urban grid. In this field, previous studies dealt with this argument, pointing out some syntactic resilience indicators.
Focusing on flood related spatial changes, in this work a river-city case study has been analysed. Angular Segment Analysis has been carried out, in pre and post event configurations. At a later stage, resilience indicators described in the literature have been calculated. These indicators have not resulted to be able to properly describe flood spatial resilience.
This circumstance has induced the authors to consider that, before obtaining a valid method to evaluate flood resilience, the magnitude of the spatial changes in consequence of the event has to be assessed. In relation to this issue, pre and post event configurations have to be compared. Principal Component Analysis and Cluster Analysis have resulted good at defining a suitable methodology to combine spatial features in order to reduce dataset's numerosity. The main notable vantages are: a more direct interpretation of syntactic meaning and properties of all urban spaces; the wide ASA dataset can be displayed in plots with a reduced number of dimensions; PCA/CA provide considerations not affected by the number of elements to which PCA/CA is carried out. Statistic meaning of each PCA/CA elements and plots' characteristics allow groups of segments with specific spatial properties to be individuated.
As regard Turin case study, thanks to PCA/CA methodologies, ASA outcomes have been transformed from a 10-dimensional dataset to a 2-dimensional one, representing all values into two dimensional plots. Different scenarios (pre and post event) have been compared, using PCA/CA to overcome the problem of comparing against distinct maps (composed by different numbers of elements). Starting A Esposito & V Di Pnto Calm after the storm: The configurational approach to manage flood risk in river-cities
70:14
SSS10 Proceedings of the 10th International Space Syntax Symposium
from spatial properties of obtained clusters, limited changes have been found. Turin grid holds substantially the same functional structure, both in its present layout and after the flooding of a wide inner area. If resilience is assumed as the ability of the system to ensure the same spatial features, even once it has been hit by a flood, Turin can be considered resilient to this calamitous event. However, given the breadth of resilience concept, this is just a starting result, not leading to absolute considerations.
PCA/CA procedure offers some significant operative applications, due to the opportunity of easily compare different maps -independently of their magnitude- highlighting their main functional features. Proposed approach can be applied in comparing different cities or various configurations of a given city (e.g.: diachronic analysis).
It means that PCA/CA can be applied whenever a strong change affects an urban grid, thereby setting different scenarios. Structural changes of urban layout can be related to a flood event, as reported in this work. Otherwise, more in general, they can be due to any kind of natural disaster which modifies accessibility of areas (e.g.: earthquakes).
From an operational perspective, PCA/CA outcomes could become a supporting tool in risk management and planning. In fact, the whole configuration changes once a critic event has occurred; some areas could be requested to assume a different role than during pre-event phase. Applying PCA/CA procedure to a post-event scenario, the configurational properties of areas called to assume new functions can be pointed out.
In the field of risk management plan, the prevention phase considers to point out suitable locations to host rescues or collecting affected people. This step is often performed just starting from identifying adequately wide areas or potential shelters. A good choice of post event measures could descend also considering the functional meaning of these areas (within the whole urban system), and can surely improve system's reorganisation (or rather, its resilience).
Strong changes in urban layout can occur even in case of structural actions (e.g.: actions related to road infrastructures), not just related to a risk event. Therefore, further developments could lead to assume PCA/CA as a general supporting tool for urban master-planning.
A Esposito & V Di Pnto Calm after the storm: The configurational approach to manage flood risk in river-cities
70:15

SSS10 Proceedings of the 10th International Space Syntax Symposium
References Conroy Dalton, N. S. (2010), Synergy, Intelligibility and Revelation in neighbourhood places, En. Ph. D.
dissertation, London: University of London. Cutini, V. (2013), ‘The city when it trembles. Earthquake destructions, post-earthquake reconstruction and grid
configuration’. In: Kim, Y. O., Park, H. T., Seo, K. W. (eds), Proceedings of the Ninth International Space Syntax, Seoul: Sejong University, p.102:1- 102:17.
Esposito, A. and Di Pinto, V. (2014), ‘Urban resilience and risk assessment. How urban layout affects flood risk in the city’. In: Proceedings of ICCSA 2014. The 14th International Conference on Computational Science and its Applications, Guimarães, June 30-July 3 2014, p.204 – 207, doi:10.1109/ICCSA.2014.46
Hillier, B. (1996). Space is the machine: a configurational theory of architecture. Cambridge: Cambridge University Press.
Hillier, B. and Vaughan, L. (2007), ‘The city as one thing’. In Progress in Planning, Vol.67(3), p.205-230. Holling, C.S. (1973), ‘Resilience and stability of ecological systems’. In: Annual review of ecology and systematics,
Vol. 4, p.1-23, doi:10.1146/annurev.es.04.110173.000245. Koch, D. and Miranda Carranza, P. (2013), ‘Syntactic Resilience’. In: Kim, Y. O., Park, H. T., Seo, K. W. (eds.),
Proceedings of the Ninth International Space Syntax, Seoul: Sejong University, p.54:1-54:16. Manyena, S. B. (2006), 'The concept of resilience revisited' In Disasters, Vol. 30(4), p.434-450. R Core Team (2014), ‘R: A language and environment for statistical computing’, Version 3.1.2, Free Software –
GNU License, http://www.R-project.org/. Rousseeuw, P. J. (1987), ‘Silhouettes: a graphical aid to the interpretation and validation of cluster analysis’. In
Journal of computational and applied mathematics, Vol. 20, p.53-65, doi:10.1016/0377-0427(87)90125-7.
Tyler, S. and Moench, M. (2012), 'A framework for urban climate resilience' In Climate and Development, Vol. 4(4), p.311-326, doi: 10.1080/17565529.2012.745389.
United Nations (2005), 'Hyogo framework for action 2005-2015: building the resilience of nations and communities to disasters'. In: Extract from the final report of the World Conference on Disaster Reduction (A/CONF. 206/6).
Varoudis, T. (2012), 'depthmapX Multi-Platform Spatial Network Analysis Software’, Version 0.30 OpenSource, http://varoudis.github.io/depthmapX/
Zani, S. and Cerioli, A. (2007), Analisi dei dati e data mining per le decisioni aziendali, Milano: Giuffré Editore. Zhang, L., Chiradia A. and Zhuang Y. (2013), ‘In the intelligibility maze of space syntax: a space syntax analysis of
toy models, mazes and labyrinths’. In: Kim, Y. O., Park, H. T. and Seo, K. W. (eds.), Proceedings of the Ninth International Space Syntax Symposium, Seoul: Sejong University, p.82-1:82-18.
A Esposito & V Di Pnto Calm after the storm: The configurational approach to manage flood risk in river-cities
70:16