california static risk assessment (csra) susan turner, uci october 16, 2008
TRANSCRIPT

California Static Risk California Static Risk Assessment (CSRA)Assessment (CSRA)
Susan Turner, UCI
October 16, 2008

CDCR Has Embraced Risk Based Decision-Making
• Recommended by reviewers of CDCR practices– Expert panel recommendations
• Risk assessment part of the California Logic Model
– Strike Team• Realigning parole resources with offender risk
• Actuarial risk tools are used in criminal justice for a variety of purposes– Pretrial release, sentencing guidelines, parole release and
revocation decisions, probation caseload assignment, priority for programming

How Actuarial Risk Prediction Works—Auto Insurance Example
• Insurers want to know the likelihood that a driver will be in an accident
• They use their extensive records data to determine what factors are related to drivers experiencing an accident
• The model:
Risk (accident)=age + gender + zip code Risk (accident)=age + gender + zip code + driving experience +…etc.+ driving experience +…etc.

States are Currently Using Risk Assessment Tools in Parole
• Pennsylvania uses LSI and Static 99 along Pennsylvania uses LSI and Static 99 along with violence indicator, institutional with violence indicator, institutional programming and behaviorprogramming and behavior
• Maryland uses crime and 6-item risk Maryland uses crime and 6-item risk assessment for parole eligibilityassessment for parole eligibility

Actuarial Risk Prediction Has Benefits and Drawbacks
• Strengths– Promotes efficiency, consistency and objectivity in
decision-making– Has an empirical basis– Is more accurate than clinical judgment
• Limitations– Decisions are based on aggregate, or group,
performance• “Good” people with “bad” characteristics penalized• “Bad” people with “good” characteristics get a break

A Number of Outcomes Can Be Predicted in Corrections
• Most common is recidivism over a certain time period (e.g. three years)
• Other outcomes may be important for program evaluation– Drug use, employment, mental health status, etc.
• Availability/ease can drive this choice– Return to Custody (CDCR data)– Arrest (DoJ data)– Conviction (DoJ data)
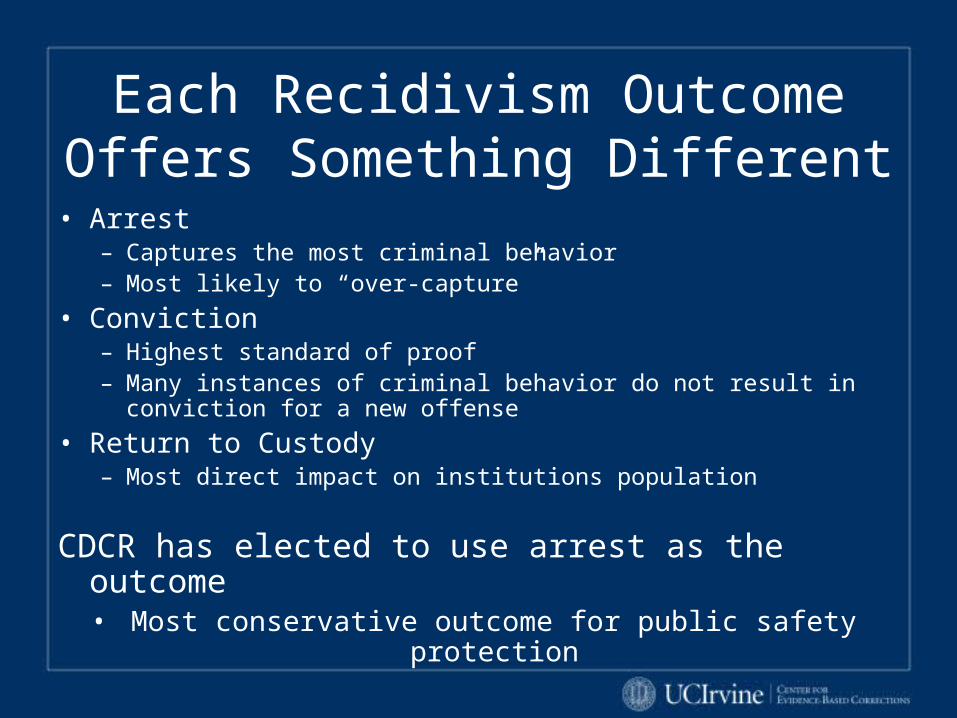
Each Recidivism Outcome Offers Something Different
• Arrest– Captures the most criminal behavior– Most likely to “over-capture”
• Conviction– Highest standard of proof– Many instances of criminal behavior do not result in conviction
for a new offense
• Return to Custody– Most direct impact on institutions population
CDCR has elected to use arrest as the outcome• Most conservative outcome for public safety protection
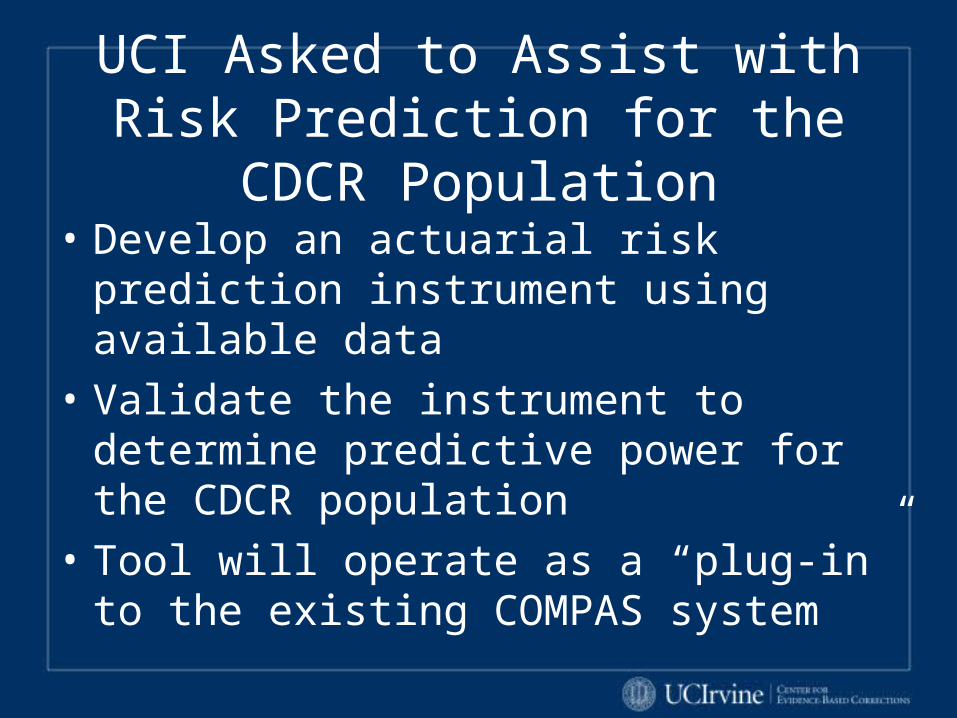
UCI Asked to Assist with Risk Prediction for the CDCR Population
• Develop an actuarial risk prediction instrument using available data
• Validate the instrument to determine predictive power for the CDCR population
• Tool will operate as a “plug-in” to the existing COMPAS system

UCI Drew on Washington State Work to Develop CSRA
• Washington State Institute for Public Policy (WSIPP) started by testing the items on the LSI-R– One of most widely used risk/needs assessments– Includes static and dynamic factors
• WSIPP removed items that did not have predictive usefulness
• WSIPP added items that improved predictive accuracy – Detailed juvenile and adult criminal history items
• The resulting tool uses static factors only• WSIPP tool predicts reconviction (arrest data not
available)
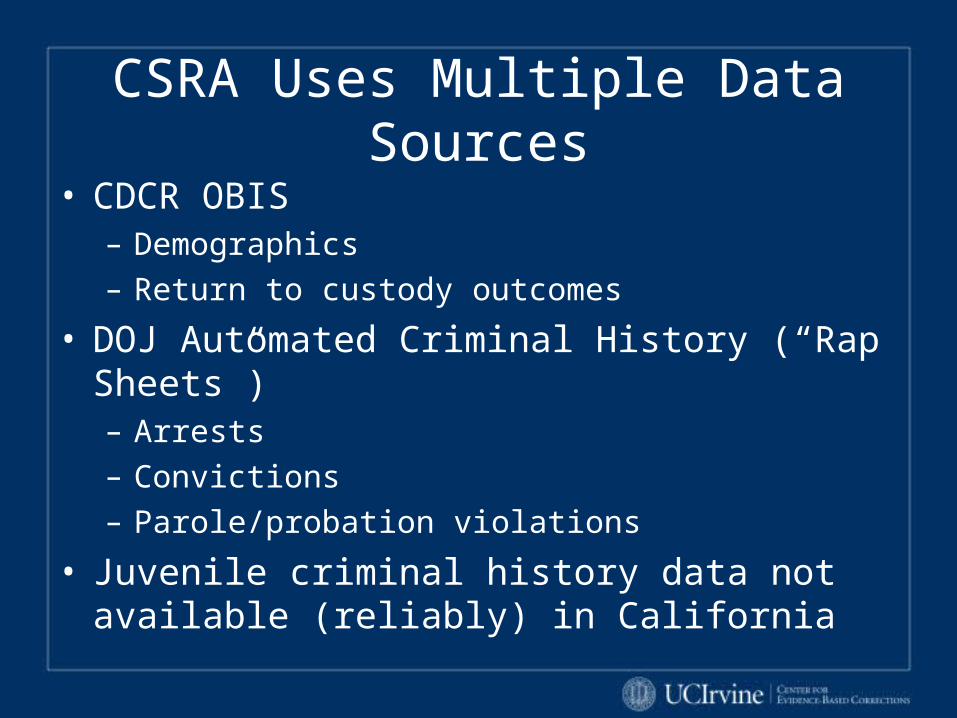
CSRA Uses Multiple Data Sources
• CDCR OBIS– Demographics– Return to custody outcomes
• DOJ Automated Criminal History (“Rap Sheets”)– Arrests– Convictions– Parole/probation violations
• Juvenile criminal history data not available (reliably) in California
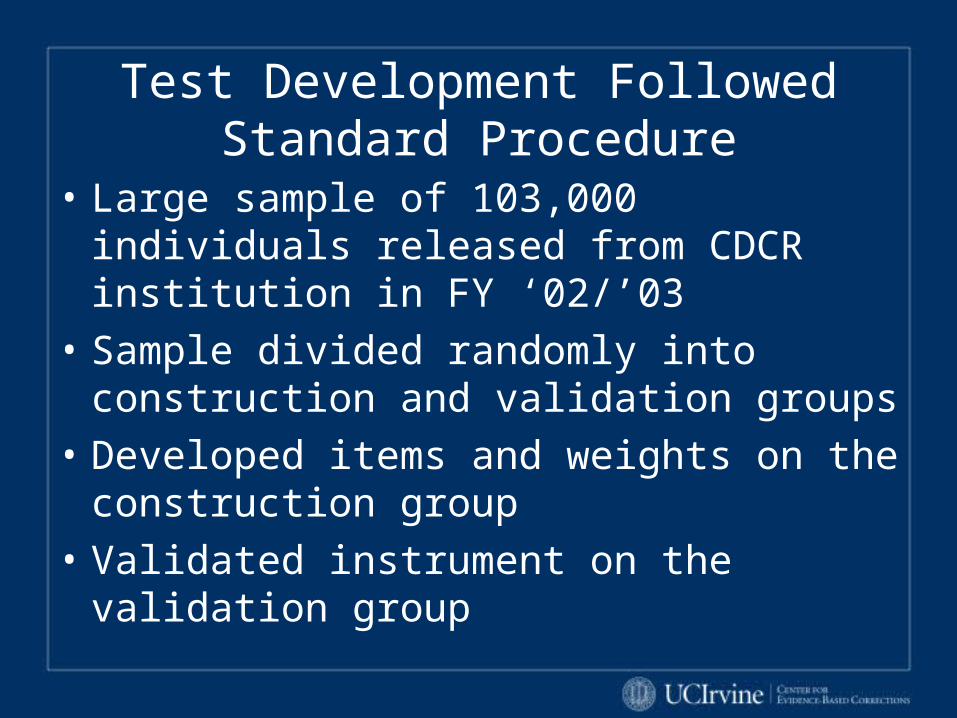
Test Development Followed Standard Procedure
• Large sample of 103,000 individuals released from CDCR institution in FY ‘02/’03
• Sample divided randomly into construction and validation groups
• Developed items and weights on the construction group
• Validated instrument on the validation group
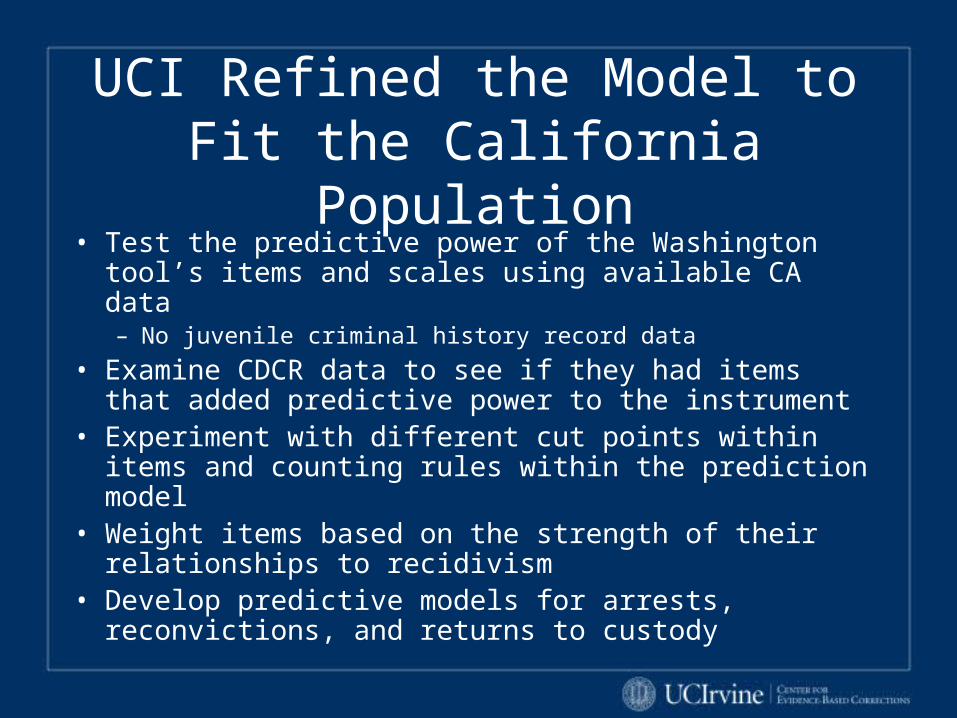
UCI Refined the Model to Fit the California Population
• Test the predictive power of the Washington tool’s items and scales using available CA data– No juvenile criminal history record data
• Examine CDCR data to see if they had items that added predictive power to the instrument
• Experiment with different cut points within items and counting rules within the prediction model
• Weight items based on the strength of their relationships to recidivism
• Develop predictive models for arrests, reconvictions, and returns to custody
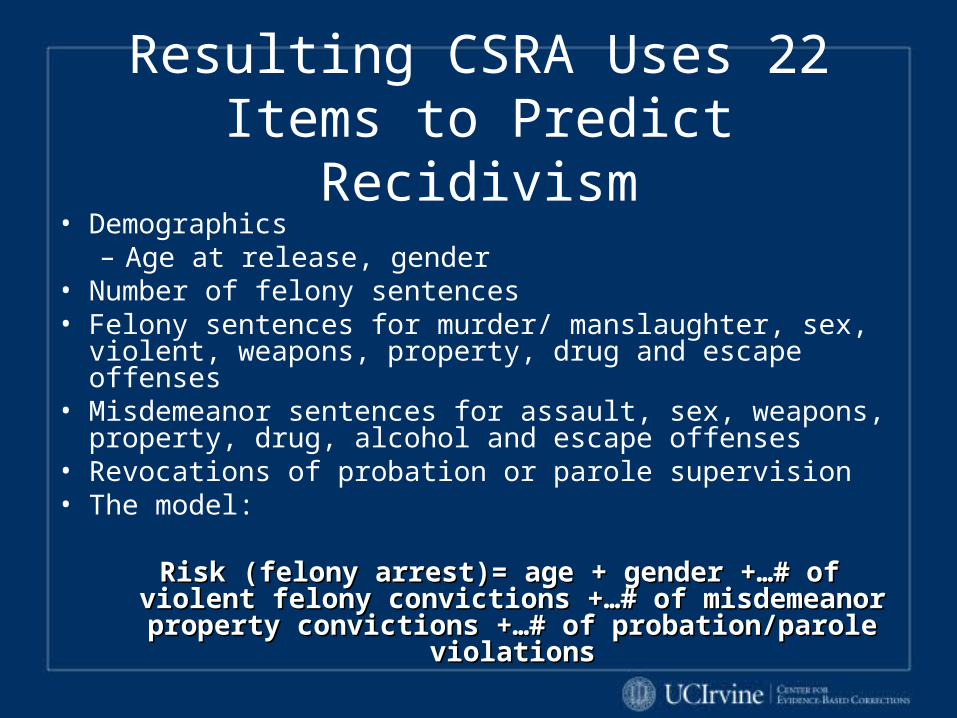
Resulting CSRA Uses 22 Items to Predict Recidivism
• Demographics– Age at release, gender
• Number of felony sentences• Felony sentences for murder/ manslaughter, sex, violent,
weapons, property, drug and escape offenses• Misdemeanor sentences for assault, sex, weapons,
property, drug, alcohol and escape offenses• Revocations of probation or parole supervision• The model:
Risk (felony arrest)= age + gender +…# of violent Risk (felony arrest)= age + gender +…# of violent felony convictions +…# of misdemeanor property felony convictions +…# of misdemeanor property
convictions +…# of probation/parole violationsconvictions +…# of probation/parole violations

CSRA Scores Offenders on Three “Nested” Sub-Scales
1. Violent Sub-Scale
2. Property & Violent Sub-Scale
3. Any Felony Sub-Scale
This allows CDCR to differentiate risk by type of recidivism
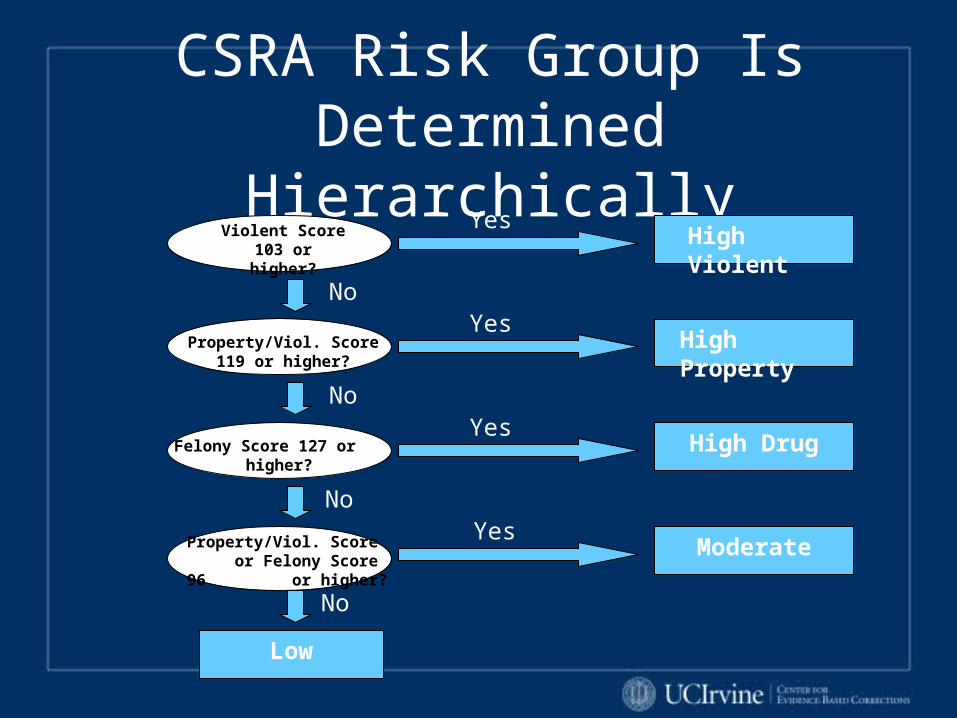
CSRA Risk Group Is Determined Hierarchically
Violent Score 103 or higher?
YesHigh Violent
No
Property/Viol. Score 119 or higher?
YesHigh Property
No
Felony Score 127 or higher?
YesHigh Drug
No
Property/Viol. Score or Felony Score 96
or higher?
YesModerate
No
Low
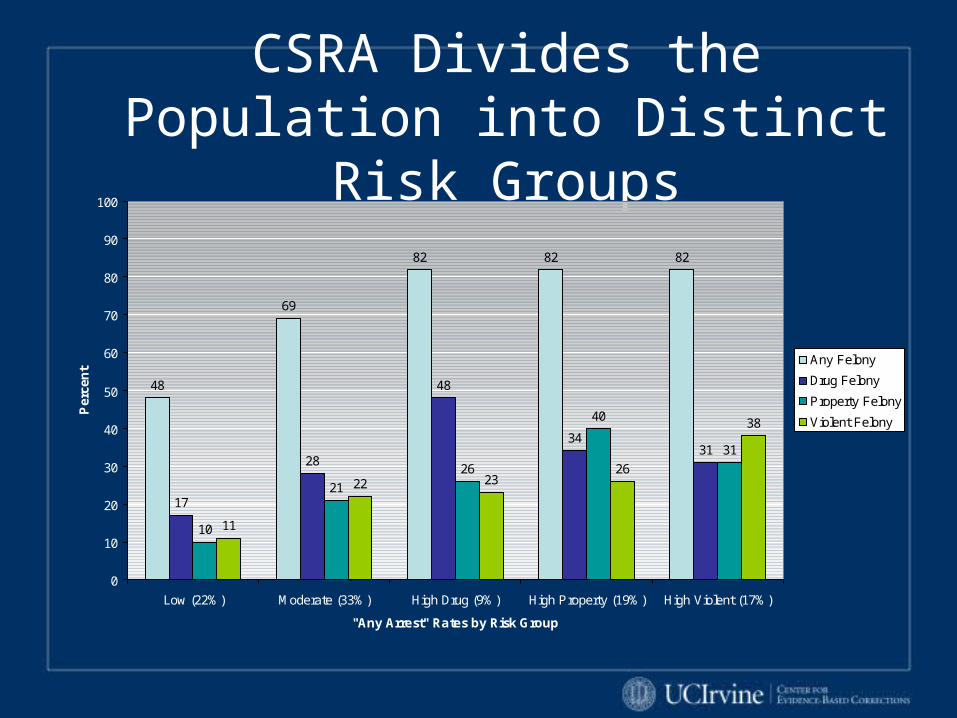
CSRA Divides the Population into Distinct Risk Groups
48
69
82 82 82
17
28
48
3431
10
21
26
40
31
11
22 2326
38
0
10
20
30
40
50
60
70
80
90
100
Low (22%) Moderate (33%) High Drug (9%) High Property (19%) High Violent (17%)
"Any Arrest" Rates by Risk Group
Per
cen
t
Any Felony
Drug Felony
Property Felony
Violent Felony
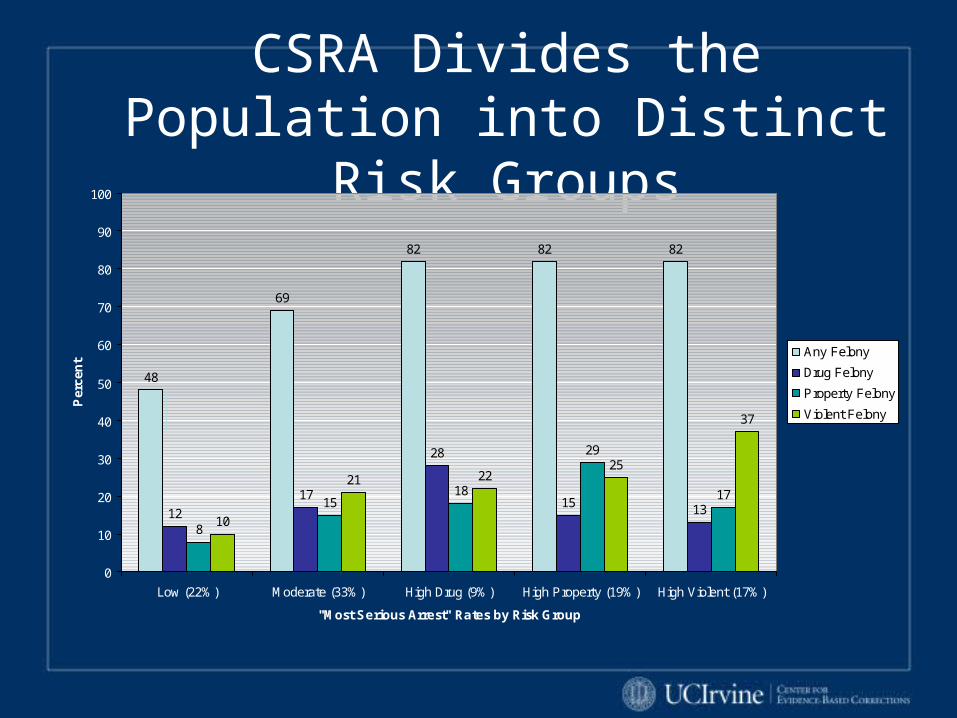
CSRA Divides the Population into Distinct Risk Groups
48
69
82 82 82
12
17
28
15 13
8
1518
29
17
10
21 2225
37
0
10
20
30
40
50
60
70
80
90
100
Low (22%) Moderate (33%) High Drug (9%) High Property (19%) High Violent (17%)
"Most Serious Arrest" Rates by Risk Group
Per
cen
t
Any Felony
Drug Felony
Property Felony
Violent Felony

Appendices

CSRA Reconviction Prediction
18
31
46 4441
9
16
30
18 16
510
13
24
15
47 8 8
15
0
10
20
30
40
50
60
70
80
90
100
Low (22%) Moderate (33%) High Drug (9%) High Property(19%)
High Violent (17%)
"Any Reconviction" Rates by Risk Group
Per
cen
t
Any Felony
Drug Felony
Property Felony
Violent Felony
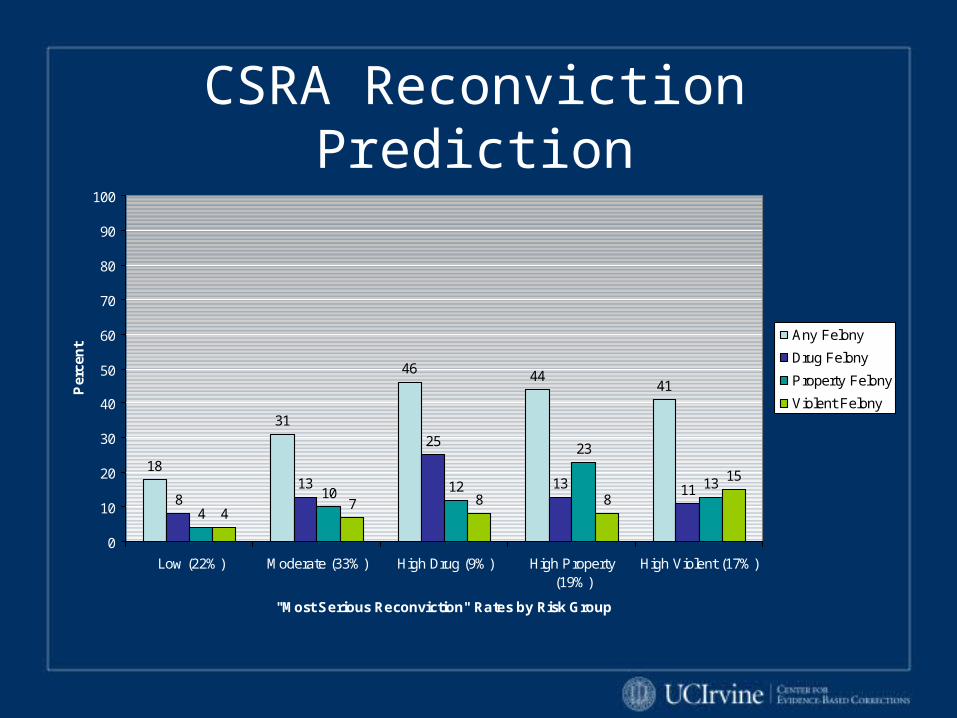
CSRA Reconviction Prediction
18
31
46 4441
813
25
13 11
4
10 12
23
13
47 8 8
15
0
10
20
30
40
50
60
70
80
90
100
Low (22%) Moderate (33%) High Drug (9%) High Property(19%)
High Violent (17%)
"Most Serious Reconviction" Rates by Risk Group
Per
cen
t
Any Felony
Drug Felony
Property Felony
Violent Felony

CSRA Performs within Usual Range for Risk Assessments
Instrument AUC Sample Recidivism Measure
Source
CSRA 0.70 103,000 releasees
Felony arrest Current
COMPAS 0.67 515 California parolees
Return to prison Farabee and Zhang (2007)
Criminal History Computation
0.68 28,519 Federal offenders
Re-conviction, re-arrest w/out dispo. available, supervision revocation
US Sentencing Commission (2004)
LSI-R 0.67 22,533 Wash. offenders
Any conviction WSIPP (2003)
Washington Static Risk Assessment
0.74 51,648 Wash. offenders
Felony conviction WSIPP (2007

Sample Item Weights—Felony Scale
Age 20-29 (vs. 60+)
Male (vs. Female)
Felony Homicide Conviction (vs. None)
3 Prior Felony Drug Convictions (vs. None)
5 Probation/Parole Violations (vs. None)
5 Prior Felony Property Convictions (vs. None)
-40
-20
0
20
40
60
80
100

Sample Item Weights—Violent Scale
Age 20-29 (vs. 60+)
Male (vs. Female)
3 Prior Felony Drug Convictions (vs. None)
5 Probation/Parole Violations (vs. None)
Felony Homicide Conviction (vs. None)
5 Prior Felony Property Convictions (vs. None)
-40
-20
0
20
40
60
80
100