california state controller's office list includes only ... · alameda abag publicly owned...
TRANSCRIPT

California State Controller's Office List includes only independent special districts
Data For LAFCO Fee Calculations Total Intergovernmental Revenues includes Federal,
Source: Special Districts Financial Transactions Report, Fiscal Year 2013-14 State, and Other Intergovernmental Agencies
Principal County Independent Special District Name Activity
Enterprise
Operating
Revenues
Enterprise
Non-Operating
Revenues
Non-Enterprise
General Purpose
Revenues
Total Inter
Governmental
Revenues
Alameda ABAG Comp Pool Self Insurance - - 844,159 -
Alameda ABAG Publicly Owned Energy Resources (ABAG Power) Electric Enterprise 6,651,280 5,042 - -
Alameda Alameda - Contra Costa Transit Financing Corporation Financing or Constructing Facilities - - 1,234,901 -
Alameda Alameda County Abandoned Vehicle Abatement Authority Governmental Services - - 1,314,436 1,314,091
Alameda Alameda County Mosquito Abatement District Pest Control - - 3,699,316 96,802
Alameda Alameda County Resource Conservation District Resource Conservation - - 1,028,100 1,000
Alameda Alameda County Schools Insurance Group Self Insurance - - 135,261,442 -
Alameda Alameda County Waste Management Authority and Source Reduction Recycling BoardWaste Disposal Enterprise 22,172,467 64,706 - -
Alameda Alameda County Water District Water Enterprise 86,417,967 9,269,033 - 3,569,872
Alameda Alameda-Contra Costa Transit District Transit Enterprise 399,205,749 - - 223,001,445
Alameda Aquatic Science Center Governmental Services - - 1,841,686 1,841,685
Alameda Associated Community Action Program Local and Regional Planning or Development - - (496) -
Alameda Bay Area Clean Water Agencies Water Enterprise 14,240,811 12,760 - -
Alameda Bay Area Headquarters Authority Financing or Constructing Facilities - - 1,585,896 -
Alameda Bay Area Home Buyer Agency (BAHBA) Governmental Services - - 76,244 -
Alameda Bay Area Housing Authority Risk Management Agency Self Insurance - - 4,157,139 -
Alameda Bay Area Schools Insurance Cooperative Self Insurance - - 4,946,268 -
Alameda Bay Cities Joint Powers Insurance Authority Self Insurance - - 12,269,245 -
Alameda California Joint Powers Risk Management Authority Self Insurance - - 14,587,292 -
Alameda Capitol Corridor Joint Powers Authority Transit Enterprise 33,419,760 - - 33,310,869
Alameda Castro Valley Sanitary District (Alameda) Waste Disposal Enterprise 6,674,102 2,123,774 - 265,342
Alameda City of Oakland-Clay Street Garage Corporation Parking - - 1,254,611 -
Alameda Dublin San Ramon Service District Waste Disposal Enterprise 30,783,416 2,294,413 - -
Alameda Dublin San Ramon Service District Water Enterprise 33,798,439 5,809,240 - 2,262
Alameda Dublin San Ramon Services District/East Bay Municipal Utility District Recycled Water AuthorityWater Enterprise 3,579,699 - - -
Alameda East Bay Dischargers Authority Waste Disposal Enterprise 3,254,689 892,625 - 449,525
Alameda East Bay Municipal Utility District Electric Enterprise 1,380,000 - - -
Alameda East Bay Municipal Utility District Fire Protection - - 25,492,000 245,000
Alameda East Bay Municipal Utility District Flood Control and Water Conservation - - 29,270,000 83,000
Alameda East Bay Municipal Utility District Recreation and Park - - 1,748,000 -
Alameda East Bay Municipal Utility District Waste Disposal Enterprise 73,444,000 5,484,000 - -
Alameda East Bay Municipal Utility District Water Enterprise 367,547,000 14,035,000 - -
Alameda East Bay Regional Communications System Authority Police Protection and Personal Safety - - 4,021,002 104,000
Alameda East Bay Regional Park District Fire Protection - - 3,599,308 665,957
Alameda East Bay Regional Park District Police Protection and Personal Safety - - 17,455,279 1,658,319
Alameda East Bay Regional Park District Recreation and Park - - 107,270,975 8,597,062
Alameda East Bay Schools Insurance Group Self Insurance - - 4,397,917 -
Alameda Eden Township Hospital District Health - - 5,420,598 -
Alameda Fairview Fire Protection District Fire Protection - - 2,895,619 22,751
Alameda Fremont Family Resources Center Corporation Governmental Services - - 358,997 356,508
Alameda Hayward Area Recreation and Park District Recreation and Park - - 28,140,318 136,865
Alameda Housing Authority Risk Retention Pool Self Insurance - - 8,564,412 -
SCO_LAFCO FY 2014 Page 1 of 77 07/29/15

California State Controller's Office List includes only independent special districts
Data For LAFCO Fee Calculations Total Intergovernmental Revenues includes Federal,
Source: Special Districts Financial Transactions Report, Fiscal Year 2013-14 State, and Other Intergovernmental Agencies
Principal County Independent Special District Name Activity
Enterprise
Operating
Revenues
Enterprise
Non-Operating
Revenues
Non-Enterprise
General Purpose
Revenues
Total Inter
Governmental
Revenues
Alameda Livermore Area Recreation and Park District Recreation and Park - - 17,895,807 1,181,087
Alameda Livermore-Amador Valley Transit Authority Transit Enterprise 13,062,559 - - 10,748,626
Alameda Livermore-Amador Valley Transit Authority - Specialized ServiceTransit Enterprise 1,365,572 - - 1,168,598
Alameda Livermore-Amador Valley Water Management Agency Waste Disposal Enterprise 11,322,513 46,789 - -
Alameda Livermore-Pleasanton Fire Department Joint Powers AuthorityFire Protection - - 28,528,832 27,629,372
Alameda Oakland-Alameda County Coliseum Authority Financing or Constructing Facilities - - 46,237,773 19,850,000
Alameda Oro Loma Sanitary District (Alameda) Waste Disposal Enterprise 18,442,264 638,918 - -
Alameda San Francisco Bay Area Rapid Transit District Transit Enterprise 850,244,609 - - 94,996,585
Alameda San Francisco Bay Area Rapid Transit District - Specialized ServiceTransit Enterprise 2,664,733 - - 1,833,416
Alameda Southern Alameda County Geographic Information System AuthorityGovernmental Services - - 47,713 -
Alameda Union Sanitary District (Alameda) Waste Disposal Enterprise 49,824,444 180,041 - -
Alameda Zone 7 Water Agency Flood Control and Water Conservation - - 11,466,285 64,318
Alameda Zone 7 Water Agency Water Enterprise 63,288,103 11,853,257 - 385,730
Alpine Alpine Resource Conservation District Resource Conservation - - 42 -
Alpine Bear Valley Water District Waste Disposal Enterprise 767,158 20,263 - -
Alpine County Service Area No. 1 (Alpine) Streets and Roads - Construction and Maintenance- - 260,822 11,343
Alpine Kirkwood Meadows Public Utilities District Electric Enterprise 5,034,865 927,727 - 2,225
Alpine Kirkwood Meadows Public Utilities District Fire Protection - - 103,650 -
Alpine Kirkwood Meadows Public Utilities District Governmental Services - - 4,630 -
Alpine Kirkwood Meadows Public Utilities District Snow Removal - - 326,225 -
Alpine Kirkwood Meadows Public Utilities District Television Translator Station Facilities - - 15,257 -
Alpine Kirkwood Meadows Public Utilities District Waste Disposal Enterprise 874,166 9 - -
Alpine Kirkwood Meadows Public Utilities District Water Enterprise 421,933 6 - -
Alpine Markleeville Public Utility District Waste Disposal Enterprise 79,552 - - -
Amador Amador County Recreation Agency (ACRA) Recreation and Park - - 309,334 142,779
Amador Amador Regional Sanitation District Waste Disposal Enterprise 142,091 684 - -
Amador Amador Regional Transit System Transit Enterprise 1,873,534 - - 1,625,062
Amador Amador Resource Conservation District Resource Conservation - - 326,719 53,555
Amador Amador Water Agency Water Enterprise 11,337,077 3,135,044 - 2,721
Amador Amador-Tuolumne Community Action Agency Governmental Services - - 10,212,834 7,590,695
Amador Central Sierra Child Support Agency Governmental Services - - 4,683,737 4,682,317
Amador Central Sierra Economic Development District Local and Regional Planning or Development - - 80,995 80,774
Amador Central Sierra Planning Council Local and Regional Planning or Development - - 2 -
Amador Drytown County Water District Water Enterprise 50,916 14,660 - 203
Amador Fiddletown Community Services District Waste Disposal Enterprise 13,105 - - -
Amador Fiddletown Community Services District Water Enterprise 39,121 - - -
Amador Ione Memorial District Memorial - - 80,354 961
Amador Jackson Valley Fire Protection District Fire Protection - - 396,420 244,199
Amador Jackson Valley Irrigation District Water Enterprise 241,497 427,020 - 309,341
Amador Lockwood Fire Protection District Fire Protection - - 225,178 142,458
Amador Pine Acres Community Services District Streets and Roads - Construction and Maintenance- - 40,329 -
Amador Pine Grove Community Services District Water Enterprise 321,970 70,735 - -
SCO_LAFCO FY 2014 Page 2 of 77 07/29/15

California State Controller's Office List includes only independent special districts
Data For LAFCO Fee Calculations Total Intergovernmental Revenues includes Federal,
Source: Special Districts Financial Transactions Report, Fiscal Year 2013-14 State, and Other Intergovernmental Agencies
Principal County Independent Special District Name Activity
Enterprise
Operating
Revenues
Enterprise
Non-Operating
Revenues
Non-Enterprise
General Purpose
Revenues
Total Inter
Governmental
Revenues
Amador Rabb Park Community Services District Water Enterprise 68,599 186 - -
Amador Ranch House Estates Community Services District Streets and Roads - Construction and Maintenance- - 273 -
Amador Ridgewood Acres Community Services District Streets and Roads - Construction and Maintenance- - 3,117 -
Amador River Pines Public Utility District Waste Disposal Enterprise 151,641 5,953 - 50
Amador River Pines Public Utility District Water Enterprise 162,622 6,482 - 100
Amador Sunset Heights Community Services District Streets and Roads - Construction and Maintenance- - 21,338 -
Amador Sutter Creek Fire Protection District Fire Protection - - 468,510 276,084
Amador Township No. 2 Cemetery District Cemetery - - 98,113 1,161
Amador Volcano Community Services District Water Enterprise 48,758 16,135 - 28
Amador Willow Springs Water District Water Enterprise - 5 - -
Butte Bangor Cemetery District Cemetery - - 6,705 89
Butte Berry Creek Community Services District Water Enterprise 55,917 3 - -
Butte Biggs-Gridley Hospital Agency Governmental Services - - 326,680 -
Butte Biggs-West Gridley Water District Water Enterprise 1,018,118 746,811 - 746,811
Butte Butte County Air Quality Management District Air Pollution Control - - 2,394,324 860,517
Butte Butte County Mosquito and Vector Control District Pest Control - - 2,696,097 399,010
Butte Butte County Resource Conservation District Resource Conservation - - 127,436 35,313
Butte Butte Creek Drainage District (Butte) Drainage and Drainage Maintenance - - 10,606 114
Butte Butte Regional Transit Transit Enterprise 5,842,986 - - 4,507,059
Butte Butte Regional Transit - Specialized Service Transit Enterprise 3,185,790 - - 2,829,278
Butte Butte School Districts Self-Funded Medical Benefits Self Insurance - - 51,884,908 -
Butte Butte Water District Water Enterprise 622,577 35,886 - -
Butte Buzztail Community Services District Water Enterprise 40,054 30,247 - -
Butte California Affordable Housing Agency Financing or Constructing Facilities - - 531,201 -
Butte Chico Area Recreation and Park District Recreation and Park - - 6,721,668 981,924
Butte Drainage District No. 1 (Butte) Drainage and Drainage Maintenance - - 87,188 318
Butte Drainage District No. 100 (Butte) Drainage and Drainage Maintenance - - 248,879 1,906
Butte Drainage District No. 2 (Butte) Drainage and Drainage Maintenance - - 4,489 23
Butte Drainage District No. 200 (Butte) Drainage and Drainage Maintenance - - 16,432 236
Butte Durham Irrigation District Water Enterprise 241,604 3 - -
Butte Durham Mosquito Abatement District Pest Control - - 139,681 1,260
Butte Durham Recreation and Park District Recreation and Park - - 608,537 5,806
Butte El Medio Fire Protection District Fire Protection - - 676,014 97,751
Butte Feather River Recreation and Park District Recreation and Park - - 2,631,414 138,156
Butte Gridley-Biggs Cemetery District Cemetery - - 436,805 3,106
Butte Kimshew Cemetery District Cemetery - - 88,335 913
Butte Lake Madrone Water District Water Enterprise 97,800 144,995 - 292
Butte Lake Oroville Area Public Utility District Waste Disposal Enterprise 1,133,282 671,172 - 3,735
Butte North Valley Schools Insurance Group Self Insurance - - 10,329,745 -
Butte Northern California School Insurance Group Self Insurance - - 6,359,143 -
Butte Oroville Cemetery District Cemetery - - 625,349 3,223
Butte Oroville Mosquito Abatement District Pest Control - - 185,739 1,465
SCO_LAFCO FY 2014 Page 3 of 77 07/29/15

California State Controller's Office List includes only independent special districts
Data For LAFCO Fee Calculations Total Intergovernmental Revenues includes Federal,
Source: Special Districts Financial Transactions Report, Fiscal Year 2013-14 State, and Other Intergovernmental Agencies
Principal County Independent Special District Name Activity
Enterprise
Operating
Revenues
Enterprise
Non-Operating
Revenues
Non-Enterprise
General Purpose
Revenues
Total Inter
Governmental
Revenues
Butte Paradise Cemetery District Cemetery - - 431,830 14,063
Butte Paradise Irrigation District Water Enterprise 6,879,438 539,575 - 3,421
Butte Paradise Recreation and Park District Recreation and Park - - 1,945,264 19,482
Butte Pine Creek Cemetery District Cemetery - - 9,168 119
Butte Reclamation District No. 833 Land Reclamation and Levee Maintenance - - 395,140 1,217
Butte Richardson Springs Community Services District Waste Disposal Enterprise 37,200 - - -
Butte Richvale Irrigation District Water Enterprise 1,505,926 137,940 - 93,075
Butte Richvale Recreation and Park District Recreation and Park - - 6,583 -
Butte Richvale Sanitary District (Butte) Waste Disposal Enterprise 49,293 25,834 - 300
Butte Rock Creek Reclamation District (Butte) Land Reclamation and Levee Maintenance - - 70,374 -
Butte Sacramento River Reclamation District (Butte) Land Reclamation and Levee Maintenance - - 285 -
Butte Sewerage Commission - Oroville Region Waste Disposal Enterprise 2,424,525 98,239 - -
Butte Small Cities Organized Risk Effort Self Insurance - - 2,921,647 -
Butte South Feather Water and Power Agency Electric Enterprise 16,551,945 88,863 - -
Butte South Feather Water and Power Agency Water Enterprise 2,903,503 734,421 - 8,074
Butte Thermalito Irrigation District Waste Disposal Enterprise 1,048,094 16,488 - -
Butte Thermalito Irrigation District Water Enterprise 2,339,882 209,501 - -
Butte Upham Cemetery District Cemetery - - 10,577 106
Butte Western Canal Water District Water Enterprise 1,803,574 71,630 - -
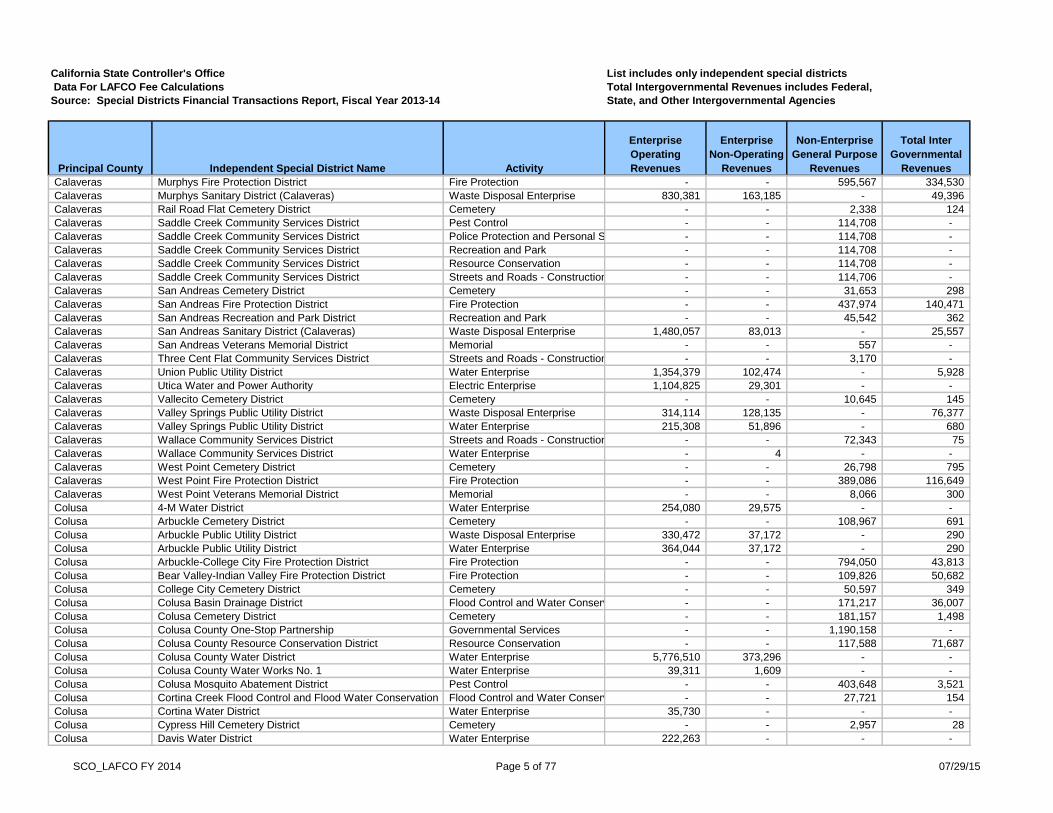
Calaveras Altaville Cemetery District Cemetery - - 80,877 1,040
Calaveras Altaville-Melones Fire Protection District Fire Protection - - 151,247 81,859
Calaveras Angels Camp Veterans Memorial District Memorial - - 134,807 53,745
Calaveras Calaveras Consolidated Fire Protection District Fire Protection - - 1,030,510 311,333
Calaveras Calaveras County Water District Waste Disposal Enterprise 5,187,670 928,884 - 128,386
Calaveras Calaveras County Water District Water Enterprise 10,394,774 2,790,172 - 724,619
Calaveras Calaveras Public Power Agency Electric Enterprise 2,343,665 16,580 - -
Calaveras Calaveras Public Utility District Water Enterprise 1,595,128 206,079 - 20,487
Calaveras Central Calaveras Fire and Rescue Protection District Fire Protection - - 504,992 157,170
Calaveras Circle XX Community Services District Streets and Roads - Construction and Maintenance- - 56,342 -
Calaveras Copper Cove Rocky Road Community Services District Streets and Roads - Construction and Maintenance- - 197,458 -
Calaveras Copperopolis Cemetery District Cemetery - - 8,861 110
Calaveras Copperopolis Fire Protection District Fire Protection - - 1,268,310 168,385
Calaveras Ebbetts Pass Fire Protection District Fire Protection - - 3,703,973 82,677
Calaveras Ebbetts Pass Veterans Memorial District Memorial - - 126,690 3,103
Calaveras Jenny Lind Veterans Memorial District Memorial - - 135,586 1,721
Calaveras Lynn Park Acres Community Services District Streets and Roads - Construction and Maintenance- - 7,729 -
Calaveras Middle River Community Service District Streets and Roads - Construction and Maintenance- - 13,105 -
Calaveras Mokelumne Hill Cemetery District Cemetery - - 14,806 146
Calaveras Mokelumne Hill Fire Protection District Fire Protection - - 161,883 47,956
Calaveras Mokelumne Hill Sanitary District (Calaveras) Waste Disposal Enterprise 238,075 853,769 - 835,574
Calaveras Mokelumne Hill Veterans Memorial District Memorial - - 34,598 126
Calaveras Murphys Cemetery District Cemetery - - 47,403 1,004
SCO_LAFCO FY 2014 Page 4 of 77 07/29/15
California State Controller's Office List includes only independent special districts
Data For LAFCO Fee Calculations Total Intergovernmental Revenues includes Federal,
Source: Special Districts Financial Transactions Report, Fiscal Year 2013-14 State, and Other Intergovernmental Agencies
Principal County Independent Special District Name Activity
Enterprise
Operating
Revenues
Enterprise
Non-Operating
Revenues
Non-Enterprise
General Purpose
Revenues
Total Inter
Governmental
Revenues
Calaveras Murphys Fire Protection District Fire Protection - - 595,567 334,530
Calaveras Murphys Sanitary District (Calaveras) Waste Disposal Enterprise 830,381 163,185 - 49,396
Calaveras Rail Road Flat Cemetery District Cemetery - - 2,338 124
Calaveras Saddle Creek Community Services District Pest Control - - 114,708 -
Calaveras Saddle Creek Community Services District Police Protection and Personal Safety - - 114,708 -
Calaveras Saddle Creek Community Services District Recreation and Park - - 114,708 -
Calaveras Saddle Creek Community Services District Resource Conservation - - 114,708 -
Calaveras Saddle Creek Community Services District Streets and Roads - Construction and Maintenance- - 114,706 -
Calaveras San Andreas Cemetery District Cemetery - - 31,653 298
Calaveras San Andreas Fire Protection District Fire Protection - - 437,974 140,471
Calaveras San Andreas Recreation and Park District Recreation and Park - - 45,542 362
Calaveras San Andreas Sanitary District (Calaveras) Waste Disposal Enterprise 1,480,057 83,013 - 25,557
Calaveras San Andreas Veterans Memorial District Memorial - - 557 -
Calaveras Three Cent Flat Community Services District Streets and Roads - Construction and Maintenance- - 3,170 -
Calaveras Union Public Utility District Water Enterprise 1,354,379 102,474 - 5,928
Calaveras Utica Water and Power Authority Electric Enterprise 1,104,825 29,301 - -
Calaveras Vallecito Cemetery District Cemetery - - 10,645 145
Calaveras Valley Springs Public Utility District Waste Disposal Enterprise 314,114 128,135 - 76,377
Calaveras Valley Springs Public Utility District Water Enterprise 215,308 51,896 - 680
Calaveras Wallace Community Services District Streets and Roads - Construction and Maintenance- - 72,343 75
Calaveras Wallace Community Services District Water Enterprise - 4 - -
Calaveras West Point Cemetery District Cemetery - - 26,798 795
Calaveras West Point Fire Protection District Fire Protection - - 389,086 116,649
Calaveras West Point Veterans Memorial District Memorial - - 8,066 300
Colusa 4-M Water District Water Enterprise 254,080 29,575 - -
Colusa Arbuckle Cemetery District Cemetery - - 108,967 691
Colusa Arbuckle Public Utility District Waste Disposal Enterprise 330,472 37,172 - 290
Colusa Arbuckle Public Utility District Water Enterprise 364,044 37,172 - 290
Colusa Arbuckle-College City Fire Protection District Fire Protection - - 794,050 43,813
Colusa Bear Valley-Indian Valley Fire Protection District Fire Protection - - 109,826 50,682
Colusa College City Cemetery District Cemetery - - 50,597 349
Colusa Colusa Basin Drainage District Flood Control and Water Conservation - - 171,217 36,007
Colusa Colusa Cemetery District Cemetery - - 181,157 1,498
Colusa Colusa County One-Stop Partnership Governmental Services - - 1,190,158 -
Colusa Colusa County Resource Conservation District Resource Conservation - - 117,588 71,687
Colusa Colusa County Water District Water Enterprise 5,776,510 373,296 - -
Colusa Colusa County Water Works No. 1 Water Enterprise 39,311 1,609 - -
Colusa Colusa Mosquito Abatement District Pest Control - - 403,648 3,521
Colusa Cortina Creek Flood Control and Flood Water Conservation DistrictFlood Control and Water Conservation - - 27,721 154
Colusa Cortina Water District Water Enterprise 35,730 - - -
Colusa Cypress Hill Cemetery District Cemetery - - 2,957 28
Colusa Davis Water District Water Enterprise 222,263 - - -
SCO_LAFCO FY 2014 Page 5 of 77 07/29/15

California State Controller's Office List includes only independent special districts
Data For LAFCO Fee Calculations Total Intergovernmental Revenues includes Federal,
Source: Special Districts Financial Transactions Report, Fiscal Year 2013-14 State, and Other Intergovernmental Agencies
Principal County Independent Special District Name Activity
Enterprise
Operating
Revenues
Enterprise
Non-Operating
Revenues
Non-Enterprise
General Purpose
Revenues
Total Inter
Governmental
Revenues
Colusa Glenn Valley Water District Water Enterprise 118,451 - - -
Colusa Grand Island Cemetery District Cemetery - - 25,180 149
Colusa Holthouse Water District Water Enterprise 37,863 27 - -
Colusa LaGrande Water District Water Enterprise 225,343 - - -
Colusa Maxwell Cemetery District Cemetery - - 47,646 987
Colusa Maxwell Fire Protection District Fire Protection - - 422,168 2,598
Colusa Maxwell Irrigation District Water Enterprise 1,091,757 11,974 - -
Colusa Maxwell Public Utility District Waste Disposal Enterprise 234,298 325,539 - 498
Colusa Maxwell Public Utility District Water Enterprise 164,610 78,680 - 498
Colusa Maxwell Recreation and Park District Recreation and Park - - 14,377 -
Colusa Princeton - Codora - Glenn Irrigation District Water Enterprise 1,249,199 238,889 - 1,000
Colusa Princeton Cemetery District Cemetery - - 12,930 102
Colusa Princeton Fire Protection District Fire Protection - - 104,495 40,638
Colusa Princeton Water Works District (Colusa) Waste Disposal Enterprise 20,871 3,342 - 24
Colusa Princeton Water Works District (Colusa) Water Enterprise 36,842 3,768 - 28
Colusa Reclamation District No. 1004 Water Enterprise 1,723,428 227,012 - -
Colusa Reclamation District No. 108 Land Reclamation and Levee Maintenance - - 6,960,455 1,417,927
Colusa Reclamation District No. 108 Water Enterprise 2,807,766 29,327 - -
Colusa Reclamation District No. 2047 Land Reclamation and Levee Maintenance - - 18,033 1,497
Colusa Reclamation District No. 479 Drainage and Drainage Maintenance - - 115,577 -
Colusa Sacramento River Fire District Fire Protection - - 594,697 44,808
Colusa Sacramento River Westside Levee District (Colusa) Land Reclamation and Levee Maintenance - - 325,094 -
Colusa Sacramento Valley Basinwide Air Pollution Control Council Governmental Services - - 80,279 4,022
Colusa Stonyford-Indian Valley Cemetery District Cemetery - - 15,719 88
Colusa Westside Water District Water Enterprise 2,960,169 2,344 - -
Colusa Williams Cemetery District Cemetery - - 115,809 832
Colusa Williams Fire Protection Authority Fire Protection - - 891,428 654,635
Colusa Williams Fire Protection District Fire Protection - - 177,546 41,535
Contra Costa Alamo-Lafayette Cemetery District Cemetery - - 444,893 2,346
Contra Costa Ambrose Recreation and Park District Recreation and Park - - 1,035,579 28,468
Contra Costa Bethel Island Municipal Improvement District Land Reclamation and Levee Maintenance - - 441,072 6,026
Contra Costa Byron - Brentwood - Knightsen Cemetery District Cemetery - - 624,861 9,683
Contra Costa Byron Sanitary District (Contra Costa) Waste Disposal Enterprise 420,551 30,401 - 1,000
Contra Costa Byron-Bethany Irrigation District Water Enterprise 2,741,335 2,301,555 - 50,000
Contra Costa Castle Rock County Water District Water Enterprise 71,591 11,548 - -
Contra Costa Central Contra Costa Sanitary District (Contra Costa) Waste Disposal Enterprise 90,466,985 14,385,593 - 124,547
Contra Costa Central Contra Costa Solid Waste Authority Governmental Services - - 3,773,673 -
Contra Costa Central Contra Costa Transit Authority Transit Enterprise 27,558,029 - - 22,388,320
Contra Costa Central Contra Costa Transit Authority - Specialized Service Transit Enterprise 5,230,925 - - 4,609,878
Contra Costa Contra Costa and Solano Counties School District Self Insurance AuthoritySelf Insurance - - 3,213,705 -
Contra Costa Contra Costa County Schools Insurance Group Self Insurance - - 45,672,896 -
Contra Costa Contra Costa Mosquito Abatement District Pest Control - - 6,278,642 37,364
SCO_LAFCO FY 2014 Page 6 of 77 07/29/15

California State Controller's Office List includes only independent special districts
Data For LAFCO Fee Calculations Total Intergovernmental Revenues includes Federal,
Source: Special Districts Financial Transactions Report, Fiscal Year 2013-14 State, and Other Intergovernmental Agencies
Principal County Independent Special District Name Activity
Enterprise
Operating
Revenues
Enterprise
Non-Operating
Revenues
Non-Enterprise
General Purpose
Revenues
Total Inter
Governmental
Revenues
Contra Costa Contra Costa Resource Conservation District Resource Conservation - - 380,934 167,926
Contra Costa Contra Costa Water District Water Enterprise 115,374,957 23,299,746 - 3,715,594
Contra Costa Crockett Community Services District Recreation and Park - - 705,549 2,146
Contra Costa Crockett Community Services District Waste Disposal Enterprise 1,418,148 217,825 - 2,500
Contra Costa Delta Diablo Sanitation District (Contra Costa) Waste Disposal Enterprise 31,563,752 3,335,361 - 1,592,064
Contra Costa Delta Ferry Authority Transit Enterprise 286,497 - - 246,870
Contra Costa Diablo Community Services District Police Protection and Personal Safety - - 661,140 3,105
Contra Costa Diablo Vista Water Maintenance District (Contra Costa) Water Enterprise 134,520 150,564 - 1,387
Contra Costa Diablo Water District Water Enterprise 8,285,454 1,794,303 - -
Contra Costa Discovery Bay Reclamation and Drainage Maintenance District (Contra Costa)Land Reclamation and Levee Maintenance - - 37,745 349
Contra Costa East Contra Costa Fire Protection District Fire Protection - - 13,295,884 572,753
Contra Costa East Contra Costa Irrigation District Water Enterprise 1,476,099 2,338,139 - 1
Contra Costa East Contra Costa Regional Fee and Financing Authority Streets and Roads - Construction and Maintenance- - 10,101,128 10,098,757
Contra Costa Eastern Contra Costa County Transit Authority Transit Enterprise 15,804,465 - - 12,552,046
Contra Costa Eastern Contra Costa County Transit Authority - Specialized ServiceTransit Enterprise 4,634,314 - - 3,987,584
Contra Costa Green Valley Recreation and Park District Recreation and Park - - 91,078 1,401
Contra Costa Ironhouse Sanitary District (Contra Costa) Waste Disposal Enterprise 11,088,882 1,506,159 - 44,534
Contra Costa Kensington Fire Protection District Fire Protection - - 3,656,826 28,107
Contra Costa Kensington Police Protection and Community Services DistrictPolice Protection and Personal Safety - - 2,724,437 103,760
Contra Costa Knightsen Town Community Services District Land Reclamation and Levee Maintenance - - 27,409 -
Contra Costa Los Medanos Community Hospital District Health - - 869,171 12,220
Contra Costa Moraga/Orinda Fire Protection District Fire Protection - - 17,807,642 1,160,673
Contra Costa Mountain View Sanitary District (Contra Costa) Waste Disposal Enterprise 5,731,878 571,822 - 7,861
Contra Costa Municipal Pooling Authority Self Insurance - - 17,154,749 -
Contra Costa Pleasant Hill BART Station Leasing Authority Local and Regional Planning or Development - - 747,861 -
Contra Costa Pleasant Hill Recreation and Park District Recreation and Park - - 6,670,760 29,129
Contra Costa Reclamation District No. 2024 Land Reclamation and Levee Maintenance - - 524,506 208,819
Contra Costa Reclamation District No. 2025 Land Reclamation and Levee Maintenance - - 2,103,997 1,935,288
Contra Costa Reclamation District No. 2026 Land Reclamation and Levee Maintenance - - 2,403,498 2,203,440
Contra Costa Reclamation District No. 2059 Land Reclamation and Levee Maintenance - - 575,727 192,673
Contra Costa Reclamation District No. 2065 Drainage and Drainage Maintenance - - 531,720 433,220
Contra Costa Reclamation District No. 2090 Land Reclamation and Levee Maintenance - - 2,547 -
Contra Costa Reclamation District No. 2122 Land Reclamation and Levee Maintenance - - 106,380 -
Contra Costa Reclamation District No. 2137 Land Reclamation and Levee Maintenance - - 1,193,839 992,209
Contra Costa Reclamation District No. 799 Land Reclamation and Levee Maintenance - - 684,069 241,344
Contra Costa Reclamation District No. 800 - Byron Tract (Contra Costa) Land Reclamation and Levee Maintenance - - 1,498,750 37,609
Contra Costa Reclamation District No. 830 Land Reclamation and Levee Maintenance - - 4,266,796 3,701,125
Contra Costa Rodeo Sanitary District (Contra Costa) Waste Disposal Enterprise 2,702,001 274,852 - 2,811
Contra Costa Rodeo-Hercules Fire Protection District Fire Protection - - 4,955,219 497,067
Contra Costa Rollingwood-Wilart Recreation and Park District Recreation and Park - - 19,516 180
Contra Costa San Ramon Valley Fire Protection Fire Protection - - 57,605,566 1,489,307
Contra Costa School Project for Utility Rate Reduction (SPURR) Electric Enterprise 33,778,951 18,533 - -
SCO_LAFCO FY 2014 Page 7 of 77 07/29/15

California State Controller's Office List includes only independent special districts
Data For LAFCO Fee Calculations Total Intergovernmental Revenues includes Federal,
Source: Special Districts Financial Transactions Report, Fiscal Year 2013-14 State, and Other Intergovernmental Agencies
Principal County Independent Special District Name Activity
Enterprise
Operating
Revenues
Enterprise
Non-Operating
Revenues
Non-Enterprise
General Purpose
Revenues
Total Inter
Governmental
Revenues
Contra Costa Schools Self Insurance of Contra Costa County Self Insurance - - 14,990,514 -
Contra Costa State Route 4 Bypass Authority Streets and Roads - Construction and Maintenance- - 3,824,171 3,824,142
Contra Costa Stege Sanitary District (Contra Costa) Waste Disposal Enterprise 3,881,033 367,967 - 46,697
Contra Costa Town of Discovery Bay Lighting and Lighting Maintenance - - 1,282,731 37,596
Contra Costa Town of Discovery Bay Recreation and Park - - 26,289 -
Contra Costa Town of Discovery Bay Waste Disposal Enterprise 4,263,200 - - -
Contra Costa Town of Discovery Bay Water Enterprise 3,458,708 - - -
Contra Costa West Contra Costa Integrated Waste Management Authority Governmental Services - - 2,723,700 -
Contra Costa West Contra Costa Transportation Advisory Committee (WCCTAC)Governmental Services - - 937,802 485,354
Contra Costa West County Agency Waste Disposal Enterprise - 289,567 - 289,567
Contra Costa West County Wastewater District (Contra Costa) Waste Disposal Enterprise 14,707,324 1,261,875 - 10,184
Contra Costa Western Contra Costa County Transit Authority Transit Enterprise 8,938,785 - - 6,798,911
Del Norte Bertsch-Ocean View Community Services District Water Enterprise 91,782 5,418 - 105
Del Norte Big Rock Community Services District Water Enterprise 141,619 18,760 - 297
Del Norte Border Coast Regional Airport Airport Enterprise 242,423 24,276 - 24,788
Del Norte Church Tree Community Services District Water Enterprise 5,079 1,381 - 22
Del Norte Crescent City Harbor District Harbor and Port Enterprise 1,041,265 17,403,773 - 17,039,278
Del Norte Crescent Fire Protection District Fire Protection - - 599,972 5,472
Del Norte Del Norte County Library Library Services - - 268,352 80,384
Del Norte Del Norte Healthcare District Health - - 876,812 244,786
Del Norte Del Norte Solid Waste Management Authority Waste Disposal Enterprise 2,713,437 304,018 - 60,000
Del Norte Fort Dick Fire Protection District Fire Protection - - 146,810 5,201
Del Norte Gasquet Community Services District Water Enterprise 173,269 3,354 - -
Del Norte Gasquet Fire Protection District Fire Protection - - 61,715 954
Del Norte HRC Community Services District Water Enterprise 14,508 111 - -
Del Norte Hunter Valley Community Services District Water Enterprise 9,860 2 - -
Del Norte Klamath Community Services District Waste Disposal Enterprise 15,689 568 - 10
Del Norte Klamath Community Services District Water Enterprise 65,088 688 - 81
Del Norte Klamath Fire Protection District No. 5 Fire Protection - - 47,792 577
Del Norte Redwood Coast Transit Authority Transit Enterprise 1,142,256 - - 941,895
Del Norte Redwood Park Community Services District Water Enterprise 39,883 19 - -
Del Norte Smith River Cemetery District Cemetery - - 1,955 40
Del Norte Smith River Community Services District Water Enterprise 369,430 92,014 - 27,765
Del Norte Smith River Fire Protection District Fire Protection - - 311,986 9,669
Del Norte Tri-Agency Economic Development Authority Local and Regional Planning or Development - - 2,437 -
Del Norte Trindel Insurance Fund Self Insurance - - 13,128,146 -
El Dorado Arroyo Vista Community Service District Streets and Roads - Construction and Maintenance- - 19,556 121
El Dorado Audubon Hills Community Services District Streets and Roads - Construction and Maintenance- - 38,911 306
El Dorado California Tahoe Emergency Services Operation Authority Ambulance Service - - 2,048,507 -
El Dorado Cameron Estates Community Services District Streets and Roads - Construction and Maintenance- - 163,597 893
El Dorado Cameron Park Airport District Airport Enterprise 352,546 74,251 - 138
El Dorado Cameron Park Community Services District Fire Protection - - 4,501,541 22,502
SCO_LAFCO FY 2014 Page 8 of 77 07/29/15

California State Controller's Office List includes only independent special districts
Data For LAFCO Fee Calculations Total Intergovernmental Revenues includes Federal,
Source: Special Districts Financial Transactions Report, Fiscal Year 2013-14 State, and Other Intergovernmental Agencies
Principal County Independent Special District Name Activity
Enterprise
Operating
Revenues
Enterprise
Non-Operating
Revenues
Non-Enterprise
General Purpose
Revenues
Total Inter
Governmental
Revenues
El Dorado Cameron Park Community Services District Lighting and Lighting Maintenance - - 2,037 -
El Dorado Cameron Park Community Services District Recreation and Park - - 1,362,332 7,476
El Dorado Connie Lane Community Services District Streets and Roads - Construction and Maintenance- - 9,378 79
El Dorado Cosumnes River Community Services District Streets and Roads - Construction and Maintenance- - 37,201 1
El Dorado Diamond Springs/El Dorado Fire Protection District Fire Protection - - 3,207,149 116,286
El Dorado East China Hill Community Services District Streets and Roads - Construction and Maintenance- - 13,230 89
El Dorado El Dorado County Emergency Services Authority Ambulance Service - - 10,049,405 9,803,550
El Dorado El Dorado County Fire Protection District Fire Protection - - 9,872,788 980,375
El Dorado El Dorado County Resource Conservation District Resource Conservation - - 129,324 121,789
El Dorado El Dorado County Risk Management Authority Self Insurance - - 33,261,767 -
El Dorado El Dorado County Transit Authority Transit Enterprise 5,788,019 - - 4,152,688
El Dorado El Dorado County-City of Placerville-City of South Lake TahoeGovernmental Services - - 193,734 193,534
El Dorado El Dorado Hills Community Services District Recreation and Park - - 11,377,157 62,076
El Dorado El Dorado Hills County Water District Fire Protection - - 14,839,988 1,091,883
El Dorado El Dorado Irrigation District Electric Enterprise 7,878,903 51,595 - 22,413
El Dorado El Dorado Irrigation District Waste Disposal Enterprise 21,309,337 4,906,908 - 33,529
El Dorado El Dorado Irrigation District Water Enterprise 32,535,032 7,648,729 - 33,530
El Dorado El Dorado Schools Financing Authority Financing or Constructing Facilities - - 4,720,277 -
El Dorado El Dorado Water and Power Authority Local and Regional Planning or Development - - 781,449 781,250
El Dorado Fallen Leaf Lake Community Services District Fire Protection - - 429,181 125,300
El Dorado Fallen Leaf Lake Community Services District Recreation and Park - - 121,337 -
El Dorado Garden Valley Fire Protection District Fire Protection - - 2,130,447 1,516,107
El Dorado Garden Valley Ranch Estates Community Services District Streets and Roads - Construction and Maintenance- - 40,131 156
El Dorado Georgetown Divide Public Utility District Waste Disposal Enterprise 340,530 865 - -
El Dorado Georgetown Divide Public Utility District Water Enterprise 2,030,041 1,454,910 - 12,957
El Dorado Georgetown Divide Recreation District Recreation and Park - - 710,082 365,293
El Dorado Georgetown Divide Resource Conservation District Resource Conservation - - 268,213 267,271
El Dorado Georgetown Fire Protection District Fire Protection - - 1,197,864 304,243
El Dorado Golden West Community Services District Streets and Roads - Construction and Maintenance- - 118,170 677
El Dorado Greenstone Country Community Services District Streets and Roads - Construction and Maintenance- - 189,914 1,670
El Dorado Grizzly Flats Community Services District Water Enterprise 511,568 1,583 - -
El Dorado Happy Homestead Cemetery District Cemetery - - 340,082 2,497
El Dorado Hickok Road Community Service District Streets and Roads - Construction and Maintenance- - 18,301 60
El Dorado Hillwood Community Service District Streets and Roads - Construction and Maintenance- - 46,595 186
El Dorado Holiday Lakes Community Services District Recreation and Park - - 13,504 46
El Dorado Kelsey Cemetery District Cemetery - - 3,205 16
El Dorado Knolls Property Owners Community Services District Streets and Roads - Construction and Maintenance- - 13,725 53
El Dorado Lake Valley Fire Protection District Fire Protection - - 6,425,914 86,139
El Dorado Lakeview Community Services District Streets and Roads - Construction and Maintenance- - 17,681 98
El Dorado Latrobe Fire Protection District Fire Protection - - 194,799 4,413
El Dorado Marble Mountain Homeowners Community Services District Streets and Roads - Construction and Maintenance- - 36,246 170
El Dorado Meeks Bay Fire Protection District Fire Protection - - 1,516,059 126,672
SCO_LAFCO FY 2014 Page 9 of 77 07/29/15
California State Controller's Office List includes only independent special districts
Data For LAFCO Fee Calculations Total Intergovernmental Revenues includes Federal,
Source: Special Districts Financial Transactions Report, Fiscal Year 2013-14 State, and Other Intergovernmental Agencies
Principal County Independent Special District Name Activity
Enterprise
Operating
Revenues
Enterprise
Non-Operating
Revenues
Non-Enterprise
General Purpose
Revenues
Total Inter
Governmental
Revenues
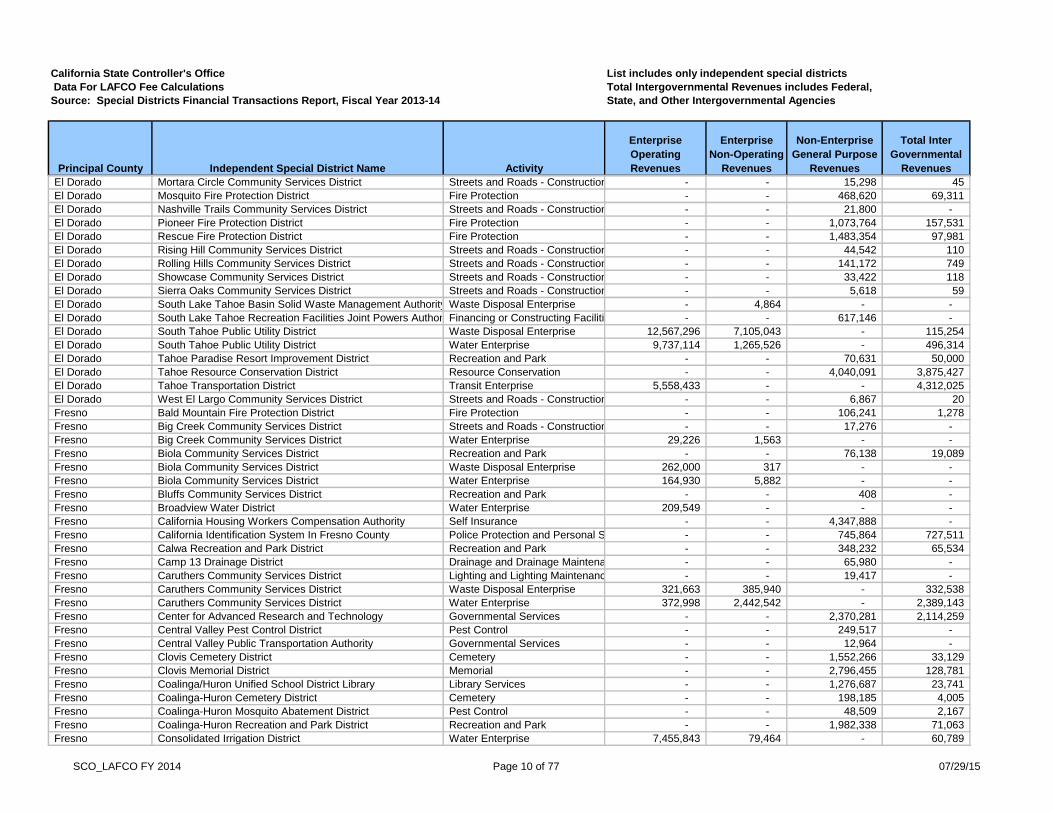
El Dorado Mortara Circle Community Services District Streets and Roads - Construction and Maintenance- - 15,298 45
El Dorado Mosquito Fire Protection District Fire Protection - - 468,620 69,311
El Dorado Nashville Trails Community Services District Streets and Roads - Construction and Maintenance- - 21,800 -
El Dorado Pioneer Fire Protection District Fire Protection - - 1,073,764 157,531
El Dorado Rescue Fire Protection District Fire Protection - - 1,483,354 97,981
El Dorado Rising Hill Community Services District Streets and Roads - Construction and Maintenance- - 44,542 110
El Dorado Rolling Hills Community Services District Streets and Roads - Construction and Maintenance- - 141,172 749
El Dorado Showcase Community Services District Streets and Roads - Construction and Maintenance- - 33,422 118
El Dorado Sierra Oaks Community Services District Streets and Roads - Construction and Maintenance- - 5,618 59
El Dorado South Lake Tahoe Basin Solid Waste Management Authority Waste Disposal Enterprise - 4,864 - -
El Dorado South Lake Tahoe Recreation Facilities Joint Powers AuthorityFinancing or Constructing Facilities - - 617,146 -
El Dorado South Tahoe Public Utility District Waste Disposal Enterprise 12,567,296 7,105,043 - 115,254
El Dorado South Tahoe Public Utility District Water Enterprise 9,737,114 1,265,526 - 496,314
El Dorado Tahoe Paradise Resort Improvement District Recreation and Park - - 70,631 50,000
El Dorado Tahoe Resource Conservation District Resource Conservation - - 4,040,091 3,875,427
El Dorado Tahoe Transportation District Transit Enterprise 5,558,433 - - 4,312,025
El Dorado West El Largo Community Services District Streets and Roads - Construction and Maintenance- - 6,867 20
Fresno Bald Mountain Fire Protection District Fire Protection - - 106,241 1,278
Fresno Big Creek Community Services District Streets and Roads - Construction and Maintenance- - 17,276 -
Fresno Big Creek Community Services District Water Enterprise 29,226 1,563 - -
Fresno Biola Community Services District Recreation and Park - - 76,138 19,089
Fresno Biola Community Services District Waste Disposal Enterprise 262,000 317 - -
Fresno Biola Community Services District Water Enterprise 164,930 5,882 - -
Fresno Bluffs Community Services District Recreation and Park - - 408 -
Fresno Broadview Water District Water Enterprise 209,549 - - -
Fresno California Housing Workers Compensation Authority Self Insurance - - 4,347,888 -
Fresno California Identification System In Fresno County Police Protection and Personal Safety - - 745,864 727,511
Fresno Calwa Recreation and Park District Recreation and Park - - 348,232 65,534
Fresno Camp 13 Drainage District Drainage and Drainage Maintenance - - 65,980 -
Fresno Caruthers Community Services District Lighting and Lighting Maintenance - - 19,417 -
Fresno Caruthers Community Services District Waste Disposal Enterprise 321,663 385,940 - 332,538
Fresno Caruthers Community Services District Water Enterprise 372,998 2,442,542 - 2,389,143
Fresno Center for Advanced Research and Technology Governmental Services - - 2,370,281 2,114,259
Fresno Central Valley Pest Control District Pest Control - - 249,517 -
Fresno Central Valley Public Transportation Authority Governmental Services - - 12,964 -
Fresno Clovis Cemetery District Cemetery - - 1,552,266 33,129
Fresno Clovis Memorial District Memorial - - 2,796,455 128,781
Fresno Coalinga/Huron Unified School District Library Library Services - - 1,276,687 23,741
Fresno Coalinga-Huron Cemetery District Cemetery - - 198,185 4,005
Fresno Coalinga-Huron Mosquito Abatement District Pest Control - - 48,509 2,167
Fresno Coalinga-Huron Recreation and Park District Recreation and Park - - 1,982,338 71,063
Fresno Consolidated Irrigation District Water Enterprise 7,455,843 79,464 - 60,789
SCO_LAFCO FY 2014 Page 10 of 77 07/29/15

California State Controller's Office List includes only independent special districts
Data For LAFCO Fee Calculations Total Intergovernmental Revenues includes Federal,
Source: Special Districts Financial Transactions Report, Fiscal Year 2013-14 State, and Other Intergovernmental Agencies
Principal County Independent Special District Name Activity
Enterprise
Operating
Revenues
Enterprise
Non-Operating
Revenues
Non-Enterprise
General Purpose
Revenues
Total Inter
Governmental
Revenues
Fresno Consolidated Mosquito Abatement District Pest Control - - 2,884,147 137,304
Fresno Del Rey Community Services District Recreation and Park - - 92,625 652
Fresno Del Rey Community Services District Waste Disposal Enterprise 524,555 - - -
Fresno Del Rey Community Services District Water Enterprise 225,416 590,047 - 588,506
Fresno Dunlap Cemetery District Cemetery - - 3,842 15
Fresno Easton Community Services District Lighting and Lighting Maintenance - - 46,325 249
Fresno Farmers Water District Water Enterprise 519,300 - - -
Fresno Fig Garden Fire Protection District Fire Protection - - 1,080,080 6,610
Fresno Fig Garden Police Protection District Police Protection and Personal Safety - - 414,379 1,884
Fresno Firebaugh Canal Water District Water Enterprise 8,536,971 224,135 - -
Fresno Five Cities Economic Development Authority Local and Regional Planning or Development - - 35,585 35,585
Fresno Fowler Cemetery District Cemetery - - 421,173 44,695
Fresno Free Water County Water District Water Enterprise 48,379 - - -
Fresno Fresno Area Self-Insurance Benefits Organization Self Insurance - - 20,352,212 -
Fresno Fresno County Fire Protection District Fire Protection - - 18,048,936 656,043
Fresno Fresno County Neighborhood Stabilization Joint Powers AuthorityLocal and Regional Planning or Development - - 851,282 -
Fresno Fresno County Regional Transportation Mitigation Fee Joint Powers AgencyGovernmental Services - - 36,409 -
Fresno Fresno County Rural Transit Agency Transit Enterprise 4,420,103 - - 3,714,689
Fresno Fresno County Self Insurance Group Self Insurance - - 9,043,320 -
Fresno Fresno County Water Works No. 18 Water Enterprise 254,823 222,092 - 210,768
Fresno Fresno Irrigation District Water Enterprise 15,829,561 508,427 - 278,177
Fresno Fresno Metropolitan Flood Control District Flood Control and Water Conservation - - 19,700,728 1,934,224
Fresno Fresno Mosquito and Vector Control District Pest Control - - 1,386,102 13,755
Fresno Fresno Regional Workforce Investment Board Governmental Services - - 14,695,288 13,796,886
Fresno Fresno Slough Water District Water Enterprise 192,536 3,249 - -
Fresno Fresno-Kings-Madera Regional Health Authority Health - - 573,160,285 573,157,131
Fresno Fresno-Madera Agency On Aging Local and Regional Planning or Development - - 5,763,906 5,506,453
Fresno Fresno-Westside Mosquito Abatement District Pest Control - - 1,258,362 72,242
Fresno Friant Water Authority Water Enterprise 8,226,948 2,224,547 - 1,819,112
Fresno Garfield Water District Water Enterprise 366,381 54,916 - -
Fresno Hills Valley Irrigation District Water Enterprise 1,328,229 195 - -
Fresno International Water District Water Enterprise 179,444 35 - -
Fresno James Irrigation District Water Enterprise 6,442,654 815,350 - -
Fresno James Resource Conservation District Resource Conservation - - 4 -
Fresno Kings River Conservation District Electric Enterprise 15,501,309 172,486 - -
Fresno Kings River Conservation District Flood Control and Water Conservation - - 4,764,608 614,436
Fresno Kings River Water District Water Enterprise 309,121 680 - -
Fresno Kings River Watershed Coalition Authority Governmental Services - - 1,659,895 -
Fresno Kingsburg Cemetery District Cemetery - - 477,969 14,418
Fresno Laguna Irrigation District Water Enterprise 1,127,763 18,044 - -
Fresno Lanare Community Services District Recreation and Park - - 8,382 24
Fresno Lanare Community Services District Water Enterprise - 216 - -
SCO_LAFCO FY 2014 Page 11 of 77 07/29/15

California State Controller's Office List includes only independent special districts
Data For LAFCO Fee Calculations Total Intergovernmental Revenues includes Federal,
Source: Special Districts Financial Transactions Report, Fiscal Year 2013-14 State, and Other Intergovernmental Agencies
Principal County Independent Special District Name Activity
Enterprise
Operating
Revenues
Enterprise
Non-Operating
Revenues
Non-Enterprise
General Purpose
Revenues
Total Inter
Governmental
Revenues
Fresno Laton Community Services District Electric Enterprise 14,070 - - -
Fresno Laton Community Services District Fire Protection - - 138,867 26,535
Fresno Laton Community Services District Waste Disposal Enterprise 363,302 2,739 - 10
Fresno Laton Community Services District Water Enterprise 225,776 2,739 - 10
Fresno Liberty Water District Water Enterprise - 43,140 - 2,459
Fresno Malaga County Water District Recreation and Park - - 324,731 3,394
Fresno Malaga County Water District Waste Disposal Enterprise 1,277,991 7,380 - -
Fresno Malaga County Water District Water Enterprise 1,131,818 35 - -
Fresno Mercy Springs Water District Water Enterprise 495,419 29 - -
Fresno Mid Valley Water Authority Water Enterprise - 9,937 - -
Fresno Mid Valley Water District Water Enterprise - 429 - -
Fresno North Central Fire Protection District Ambulance Service - - 766,117 10,030
Fresno North Central Fire Protection District Fire Protection - - 6,492,731 79,728
Fresno Oak Grove Cemetery District (Fresno) Cemetery - - 173,340 957
Fresno Orange Cove Fire Protection District Fire Protection - - 612,303 136,352
Fresno Orange Cove Irrigation District Water Enterprise 5,594,186 408,866 - -
Fresno Orange Cove Police Protection District Police Protection and Personal Safety - - 81,039 36,353
Fresno Organization of Self-Insured Schools Self Insurance - - 5,498,168 -
Fresno Oro Loma Water District Water Enterprise 3,600 - - -
Fresno Panoche Drainage District (Fresno) Drainage and Drainage Maintenance - - 6,398,475 882,764
Fresno Panoche Resource Conservation District Resource Conservation - - 13 -
Fresno Panoche Water District Water Enterprise 16,881,408 4,216,315 - 3,583,842
Fresno Parlier Cemetery District Cemetery - - 208,489 20,369
Fresno Pinedale County Water District Waste Disposal Enterprise 1,459,667 716 - -
Fresno Pinedale County Water District Water Enterprise 1,037,891 716 - -
Fresno Pinedale Public Utility District Waste Disposal Enterprise 192,860 163,722 - 1,666
Fresno Pleasant Valley Water District Water Enterprise - 7,186 - -
Fresno Raisin City Water District Water Enterprise 38,624 2,969 - -
Fresno Reclamation District No. 1606 Land Reclamation and Levee Maintenance - - 171,909 -
Fresno Reclamation District No. 801 Land Reclamation and Levee Maintenance - - 4,908 -
Fresno Reedley Cemetery District Cemetery - - 706,210 25,685
Fresno Riverdale Irrigation District Water Enterprise 289,001 10,573 - -
Fresno Riverdale Memorial District Memorial - - 99,584 859
Fresno Riverdale Public Utility District Fire Protection - - 80,497 965
Fresno Riverdale Public Utility District Lighting and Lighting Maintenance - - 32,096 219
Fresno Riverdale Public Utility District Waste Disposal Enterprise 612,223 10,678 - 128
Fresno Riverdale Public Utility District Water Enterprise 425,962 13,668 - 128
Fresno San Joaquin Valley Unified Air Pollution Control District Air Pollution Control - - 131,441,184 94,990,055
Fresno Sanger-Del Rey Cemetery District Cemetery - - 915,741 12,338
Fresno Selma - Kingsburg - Fowler County Sanitation District (Fresno)Waste Disposal Enterprise 7,779,953 164,014 - -
Fresno Selma Cemetery District Cemetery - - 695,470 4,399
Fresno Selma Health Care District Health - - 147,801 874
SCO_LAFCO FY 2014 Page 12 of 77 07/29/15
California State Controller's Office List includes only independent special districts
Data For LAFCO Fee Calculations Total Intergovernmental Revenues includes Federal,
Source: Special Districts Financial Transactions Report, Fiscal Year 2013-14 State, and Other Intergovernmental Agencies
Principal County Independent Special District Name Activity
Enterprise
Operating
Revenues
Enterprise
Non-Operating
Revenues
Non-Enterprise
General Purpose
Revenues
Total Inter
Governmental
Revenues
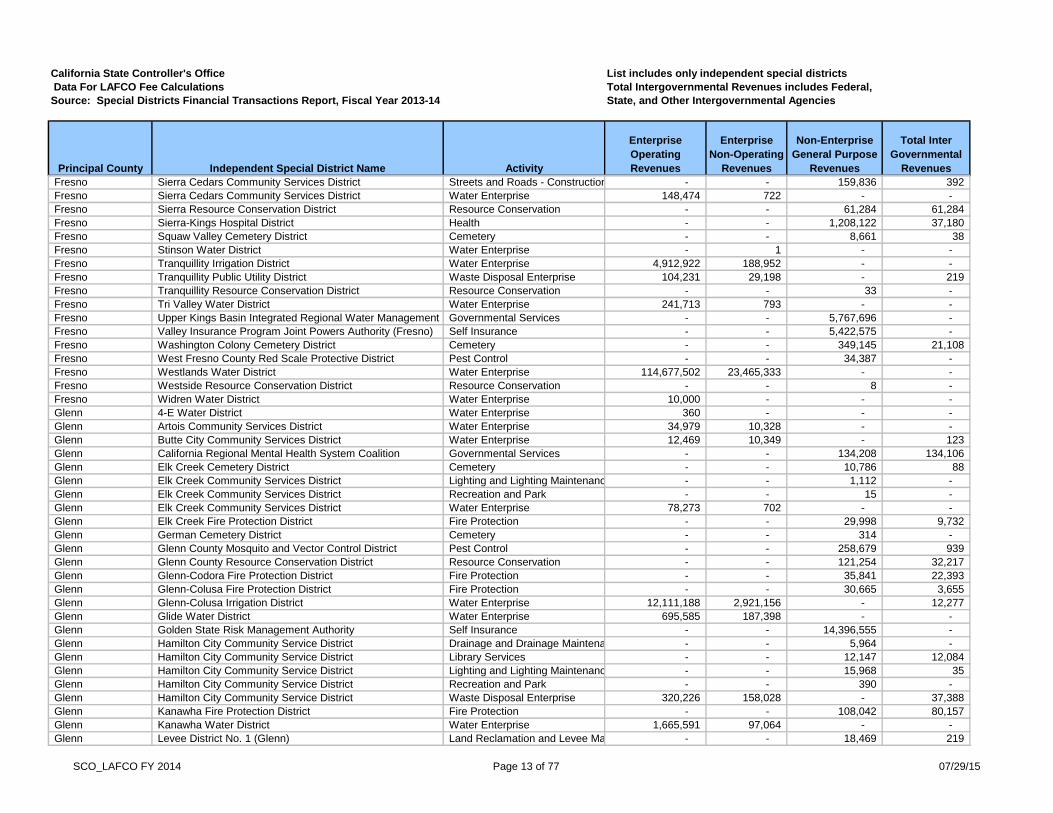
Fresno Sierra Cedars Community Services District Streets and Roads - Construction and Maintenance- - 159,836 392
Fresno Sierra Cedars Community Services District Water Enterprise 148,474 722 - -
Fresno Sierra Resource Conservation District Resource Conservation - - 61,284 61,284
Fresno Sierra-Kings Hospital District Health - - 1,208,122 37,180
Fresno Squaw Valley Cemetery District Cemetery - - 8,661 38
Fresno Stinson Water District Water Enterprise - 1 - -
Fresno Tranquillity Irrigation District Water Enterprise 4,912,922 188,952 - -
Fresno Tranquillity Public Utility District Waste Disposal Enterprise 104,231 29,198 - 219
Fresno Tranquillity Resource Conservation District Resource Conservation - - 33 -
Fresno Tri Valley Water District Water Enterprise 241,713 793 - -
Fresno Upper Kings Basin Integrated Regional Water Management AuthorityGovernmental Services - - 5,767,696 -
Fresno Valley Insurance Program Joint Powers Authority (Fresno) Self Insurance - - 5,422,575 -
Fresno Washington Colony Cemetery District Cemetery - - 349,145 21,108
Fresno West Fresno County Red Scale Protective District Pest Control - - 34,387 -
Fresno Westlands Water District Water Enterprise 114,677,502 23,465,333 - -
Fresno Westside Resource Conservation District Resource Conservation - - 8 -
Fresno Widren Water District Water Enterprise 10,000 - - -
Glenn 4-E Water District Water Enterprise 360 - - -
Glenn Artois Community Services District Water Enterprise 34,979 10,328 - -
Glenn Butte City Community Services District Water Enterprise 12,469 10,349 - 123
Glenn California Regional Mental Health System Coalition Governmental Services - - 134,208 134,106
Glenn Elk Creek Cemetery District Cemetery - - 10,786 88
Glenn Elk Creek Community Services District Lighting and Lighting Maintenance - - 1,112 -
Glenn Elk Creek Community Services District Recreation and Park - - 15 -
Glenn Elk Creek Community Services District Water Enterprise 78,273 702 - -
Glenn Elk Creek Fire Protection District Fire Protection - - 29,998 9,732
Glenn German Cemetery District Cemetery - - 314 -
Glenn Glenn County Mosquito and Vector Control District Pest Control - - 258,679 939
Glenn Glenn County Resource Conservation District Resource Conservation - - 121,254 32,217
Glenn Glenn-Codora Fire Protection District Fire Protection - - 35,841 22,393
Glenn Glenn-Colusa Fire Protection District Fire Protection - - 30,665 3,655
Glenn Glenn-Colusa Irrigation District Water Enterprise 12,111,188 2,921,156 - 12,277
Glenn Glide Water District Water Enterprise 695,585 187,398 - -
Glenn Golden State Risk Management Authority Self Insurance - - 14,396,555 -
Glenn Hamilton City Community Service District Drainage and Drainage Maintenance - - 5,964 -
Glenn Hamilton City Community Service District Library Services - - 12,147 12,084
Glenn Hamilton City Community Service District Lighting and Lighting Maintenance - - 15,968 35
Glenn Hamilton City Community Service District Recreation and Park - - 390 -
Glenn Hamilton City Community Service District Waste Disposal Enterprise 320,226 158,028 - 37,388
Glenn Kanawha Fire Protection District Fire Protection - - 108,042 80,157
Glenn Kanawha Water District Water Enterprise 1,665,591 97,064 - -
Glenn Levee District No. 1 (Glenn) Land Reclamation and Levee Maintenance - - 18,469 219
SCO_LAFCO FY 2014 Page 13 of 77 07/29/15
California State Controller's Office List includes only independent special districts
Data For LAFCO Fee Calculations Total Intergovernmental Revenues includes Federal,
Source: Special Districts Financial Transactions Report, Fiscal Year 2013-14 State, and Other Intergovernmental Agencies
Principal County Independent Special District Name Activity
Enterprise
Operating
Revenues
Enterprise
Non-Operating
Revenues
Non-Enterprise
General Purpose
Revenues
Total Inter
Governmental
Revenues
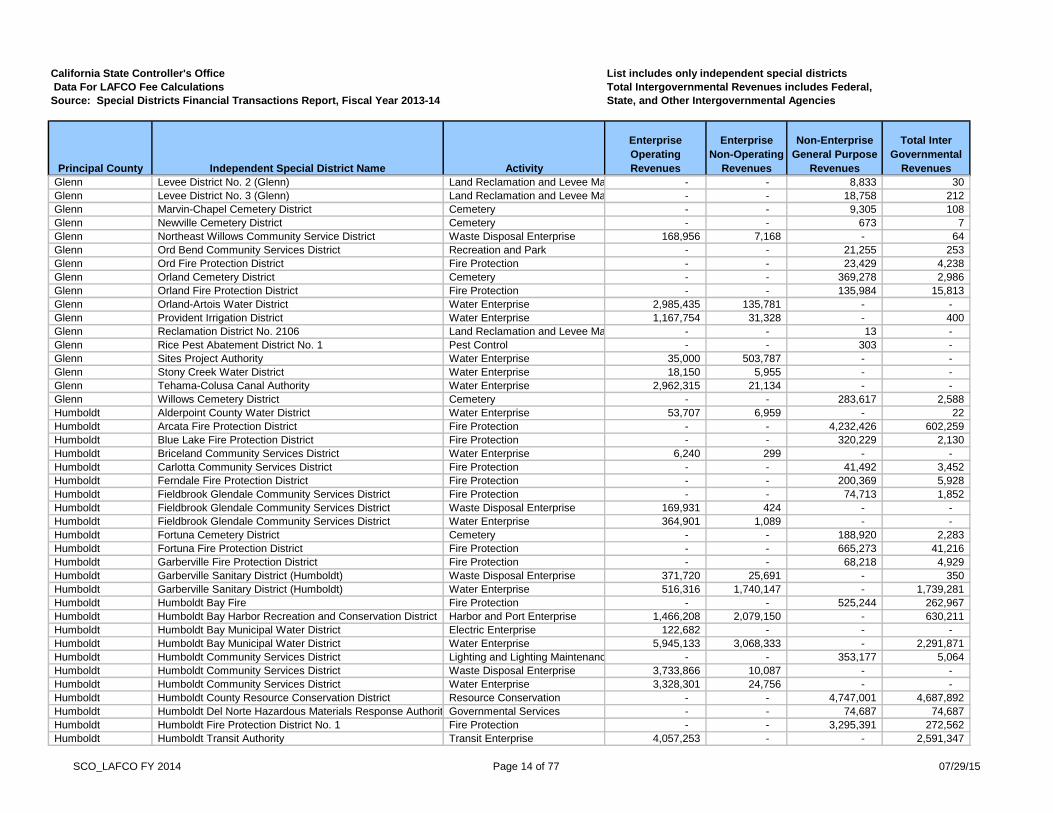
Glenn Levee District No. 2 (Glenn) Land Reclamation and Levee Maintenance - - 8,833 30
Glenn Levee District No. 3 (Glenn) Land Reclamation and Levee Maintenance - - 18,758 212
Glenn Marvin-Chapel Cemetery District Cemetery - - 9,305 108
Glenn Newville Cemetery District Cemetery - - 673 7
Glenn Northeast Willows Community Service District Waste Disposal Enterprise 168,956 7,168 - 64
Glenn Ord Bend Community Services District Recreation and Park - - 21,255 253
Glenn Ord Fire Protection District Fire Protection - - 23,429 4,238
Glenn Orland Cemetery District Cemetery - - 369,278 2,986
Glenn Orland Fire Protection District Fire Protection - - 135,984 15,813
Glenn Orland-Artois Water District Water Enterprise 2,985,435 135,781 - -
Glenn Provident Irrigation District Water Enterprise 1,167,754 31,328 - 400
Glenn Reclamation District No. 2106 Land Reclamation and Levee Maintenance - - 13 -
Glenn Rice Pest Abatement District No. 1 Pest Control - - 303 -
Glenn Sites Project Authority Water Enterprise 35,000 503,787 - -
Glenn Stony Creek Water District Water Enterprise 18,150 5,955 - -
Glenn Tehama-Colusa Canal Authority Water Enterprise 2,962,315 21,134 - -
Glenn Willows Cemetery District Cemetery - - 283,617 2,588
Humboldt Alderpoint County Water District Water Enterprise 53,707 6,959 - 22
Humboldt Arcata Fire Protection District Fire Protection - - 4,232,426 602,259
Humboldt Blue Lake Fire Protection District Fire Protection - - 320,229 2,130
Humboldt Briceland Community Services District Water Enterprise 6,240 299 - -
Humboldt Carlotta Community Services District Fire Protection - - 41,492 3,452
Humboldt Ferndale Fire Protection District Fire Protection - - 200,369 5,928
Humboldt Fieldbrook Glendale Community Services District Fire Protection - - 74,713 1,852
Humboldt Fieldbrook Glendale Community Services District Waste Disposal Enterprise 169,931 424 - -
Humboldt Fieldbrook Glendale Community Services District Water Enterprise 364,901 1,089 - -
Humboldt Fortuna Cemetery District Cemetery - - 188,920 2,283
Humboldt Fortuna Fire Protection District Fire Protection - - 665,273 41,216
Humboldt Garberville Fire Protection District Fire Protection - - 68,218 4,929
Humboldt Garberville Sanitary District (Humboldt) Waste Disposal Enterprise 371,720 25,691 - 350
Humboldt Garberville Sanitary District (Humboldt) Water Enterprise 516,316 1,740,147 - 1,739,281
Humboldt Humboldt Bay Fire Fire Protection - - 525,244 262,967
Humboldt Humboldt Bay Harbor Recreation and Conservation District Harbor and Port Enterprise 1,466,208 2,079,150 - 630,211
Humboldt Humboldt Bay Municipal Water District Electric Enterprise 122,682 - - -
Humboldt Humboldt Bay Municipal Water District Water Enterprise 5,945,133 3,068,333 - 2,291,871
Humboldt Humboldt Community Services District Lighting and Lighting Maintenance - - 353,177 5,064
Humboldt Humboldt Community Services District Waste Disposal Enterprise 3,733,866 10,087 - -
Humboldt Humboldt Community Services District Water Enterprise 3,328,301 24,756 - -
Humboldt Humboldt County Resource Conservation District Resource Conservation - - 4,747,001 4,687,892
Humboldt Humboldt Del Norte Hazardous Materials Response AuthorityGovernmental Services - - 74,687 74,687
Humboldt Humboldt Fire Protection District No. 1 Fire Protection - - 3,295,391 272,562
Humboldt Humboldt Transit Authority Transit Enterprise 4,057,253 - - 2,591,347
SCO_LAFCO FY 2014 Page 14 of 77 07/29/15

California State Controller's Office List includes only independent special districts
Data For LAFCO Fee Calculations Total Intergovernmental Revenues includes Federal,
Source: Special Districts Financial Transactions Report, Fiscal Year 2013-14 State, and Other Intergovernmental Agencies
Principal County Independent Special District Name Activity
Enterprise
Operating
Revenues
Enterprise
Non-Operating
Revenues
Non-Enterprise
General Purpose
Revenues
Total Inter
Governmental
Revenues
Humboldt Humboldt Transit Authority - Specialized Service Transit Enterprise 175,975 - - 128,894
Humboldt Humboldt Waste Management Authority Waste Disposal Enterprise 9,642,366 232,871 - -
Humboldt Hydesville County Water District Water Enterprise 243,172 - - -
Humboldt Jacoby Creek County Water District Water Enterprise 178,700 1,478 - -
Humboldt Kneeland Fire Protection District Fire Protection - - 24,600 77
Humboldt Loleta Community Services District Waste Disposal Enterprise 220,124 23,852 - 288
Humboldt Loleta Community Services District Water Enterprise 166,902 3,003 - -
Humboldt Loleta Fire Protection District Fire Protection - - 131,987 19,144
Humboldt Manila Community Services District Recreation and Park - - 183,589 80,792
Humboldt Manila Community Services District Waste Disposal Enterprise 185,826 1,043 - -
Humboldt Manila Community Services District Water Enterprise 175,735 11,226 - 282
Humboldt McKinleyville Community Services District Recreation and Park - - 1,355,313 21,367
Humboldt McKinleyville Community Services District Waste Disposal Enterprise 2,054,108 61,199 - -
Humboldt McKinleyville Community Services District Water Enterprise 2,516,005 110,389 - 79,575
Humboldt Miranda Community Services District Fire Protection - - 62,880 -
Humboldt Miranda Community Services District Waste Disposal Enterprise 56,856 1,572 - 214
Humboldt Miranda Community Services District Water Enterprise 46,126 50,908 - 761
Humboldt Myers Fire Protection District Fire Protection - - 15,609 236
Humboldt North Coast Emergency Medical Services District Health - - 615,233 581,550
Humboldt North Coast Schools Insurance Group Self Insurance - - 6,275,733 -
Humboldt North Coast Schools Medical Insurance Group Self Insurance - - 37,469,087 -
Humboldt North Coast Unified Air Quality Management District Air Pollution Control - - 2,956,790 2,171,299
Humboldt North Humboldt Recreation and Park District Recreation and Park - - 696,682 2,526
Humboldt Orick Community Services District Fire Protection - - 44,310 624
Humboldt Orick Community Services District Water Enterprise 54,275 89 - -
Humboldt Orleans Community Services District Water Enterprise 129,983 10,040 - 139
Humboldt Palmer Creek Community Services District Waste Disposal Enterprise 104,019 569 - -
Humboldt Palmer Creek Community Services District Water Enterprise 71,185 14,375 - -
Humboldt Patrick Creek Community Services District Streets and Roads - Construction and Maintenance- - 6,906 34
Humboldt Petrolia Cemetery District Cemetery - - 8,422 352
Humboldt Petrolia Fire Protection District Fire Protection - - 39,922 618
Humboldt Phillipsville Community Services District Water Enterprise 60,871 - - -
Humboldt Reclamation District No. 768 Land Reclamation and Levee Maintenance - - 16,620 -
Humboldt Redway Community Services District Waste Disposal Enterprise 342,751 48,964 - 705
Humboldt Redway Community Services District Water Enterprise 404,239 48,279 - 717
Humboldt Redway Fire Protection District Fire Protection - - 112,875 1,402
Humboldt Redwood Coast Energy Authority Local and Regional Planning or Development - - 1,721,819 537,623
Humboldt Redwood Region Economic Development Commission Local and Regional Planning or Development - - 478,099 -
Humboldt Resort Improvement District No. 1 Electric Enterprise 1,402,659 54,203 - -
Humboldt Resort Improvement District No. 1 Fire Protection - - 529,367 21,810
Humboldt Resort Improvement District No. 1 Waste Disposal Enterprise 245,867 195,384 - -
Humboldt Resort Improvement District No. 1 Water Enterprise 277,811 299,629 - -
SCO_LAFCO FY 2014 Page 15 of 77 07/29/15

California State Controller's Office List includes only independent special districts
Data For LAFCO Fee Calculations Total Intergovernmental Revenues includes Federal,
Source: Special Districts Financial Transactions Report, Fiscal Year 2013-14 State, and Other Intergovernmental Agencies
Principal County Independent Special District Name Activity
Enterprise
Operating
Revenues
Enterprise
Non-Operating
Revenues
Non-Enterprise
General Purpose
Revenues
Total Inter
Governmental
Revenues
Humboldt Rio Dell Fire Protection District Fire Protection - - 180,904 1,294
Humboldt Riverside Community Services District Water Enterprise 73,470 196 - -
Humboldt Rohner Community Recreation and Park Recreation and Park - - 17,729 1,066
Humboldt Samoa Fire Protection District Fire Protection - - 103,940 1
Humboldt Telegraph Ridge Fire Protection District Fire Protection - - 13,781 3,829
Humboldt Weott Community Services District Fire Protection - - 11,118 77
Humboldt Weott Community Services District Recreation and Park - - 310 -
Humboldt Weott Community Services District Waste Disposal Enterprise 79,091 801 - -
Humboldt Weott Community Services District Water Enterprise 80,984 250,095 - 249,965
Humboldt Westhaven Community Services District Water Enterprise 219,542 1,663 - -
Humboldt Willow Creek Community Services District Recreation and Park - - 70,766 -
Humboldt Willow Creek Community Services District Waste Disposal Enterprise 94,717 - - -
Humboldt Willow Creek Community Services District Water Enterprise 768,247 102,854 - 961
Humboldt Willow Creek Fire Protection District Fire Protection - - 166,161 1,940
Imperial Bard Resource Conservation District Resource Conservation - - 4,303 -
Imperial Bard Water District Electric Enterprise 71,000 - - -
Imperial Bard Water District Water Enterprise 1,379,822 49,827 - 20,860
Imperial Bombay Beach Community Service District Recreation and Park - - 53,223 39
Imperial Brawley County Water District Water Enterprise - 22,684 - -
Imperial Central Valley Cemetery District Cemetery - - 1,340,513 123,548
Imperial Heber Public Utility District Recreation and Park - - 380,287 1,788
Imperial Heber Public Utility District Waste Disposal Enterprise 1,724,513 70,415 - 346
Imperial Heber Public Utility District Water Enterprise 1,457,272 141,074 - -
Imperial Imperial County School Districts Liability/Property Self-Insurance AuthoritySelf Insurance - - 1,138,710 -
Imperial Imperial County Transportation Commission (ICTC) Transit Enterprise 5,379,326 - - 3,546,331
Imperial Imperial County Transportation Commission (ICTC)-Specialized ServiceTransit Enterprise 1,770,414 - - 1,675,468
Imperial Imperial Irrigation District Electric Enterprise 451,396,159 1,950,738 - -
Imperial Imperial Irrigation District Water Enterprise 157,625,978 6,134,645 - 5,944,039
Imperial Imperial Valley Emergency Communications Authority Governmental Services - - 964,993 -
Imperial Imperial Valley Resource Management Agency (IVRMA) Governmental Services - - 590,907 585,800
Imperial Imperial Valley Telecommunication Authority Underground Electric and Communication Facilities- - 663,524 46,138
Imperial Niland Fire Protection District Fire Protection - - 305,074 748
Imperial Niland Sanitary District (Imperial) Waste Disposal Enterprise 171,606 16,566 - 122
Imperial Palo Verde County Water District Water Enterprise 119,232 4,415 - 23
Imperial Pioneers Memorial Hospital Public Facilities Corporation Financing or Constructing Facilities - - 45,168 -
Imperial Riverview Cemetery District Cemetery - - 527,218 21,075
Imperial Salton Community Services District Fire Protection - - 28,208 -
Imperial Salton Community Services District Waste Disposal Enterprise 1,420,624 399,798 - 1,860
Imperial Seeley County Water District Waste Disposal Enterprise 557,184 271 - -
Imperial Seeley County Water District Water Enterprise 385,130 2,346 - 45
Imperial Self-Insurance Program for Imperial County Self Insurance - - 15,436 -
Imperial Winterhaven Fire Protection District Fire Protection - - 519,018 47,349
SCO_LAFCO FY 2014 Page 16 of 77 07/29/15

California State Controller's Office List includes only independent special districts
Data For LAFCO Fee Calculations Total Intergovernmental Revenues includes Federal,
Source: Special Districts Financial Transactions Report, Fiscal Year 2013-14 State, and Other Intergovernmental Agencies
Principal County Independent Special District Name Activity
Enterprise
Operating
Revenues
Enterprise
Non-Operating
Revenues
Non-Enterprise
General Purpose
Revenues
Total Inter
Governmental
Revenues
Imperial Winterhaven Water District Waste Disposal Enterprise 201,075 4,854 - 300
Imperial Winterhaven Water District Water Enterprise 120,165 19,727 - 7,295
Inyo Big Pine Cemetery District Cemetery - - 36,912 172
Inyo Big Pine Community Services District Waste Disposal Enterprise 141,254 518 - -
Inyo Big Pine Community Services District Water Enterprise 132,099 495 - -
Inyo Big Pine Fire Protection District Ambulance Service - - 18,407 -
Inyo Big Pine Fire Protection District Fire Protection - - 287,830 25,682
Inyo Bishop Fire Protection District Fire Protection - - 420,221 3,520
Inyo Darwin Community Services District Water Enterprise 18,287 2,424 - 1,290
Inyo East Independence Sanitary District (Inyo) Waste Disposal Enterprise 13,721 136 - -
Inyo Eastern Sierra Community Services District Waste Disposal Enterprise 834,740 12,845 - -
Inyo Great Basin Unified Air Pollution Control District Air Pollution Control - - 16,541,571 10,165,930
Inyo Independence Cemetery District Cemetery - - 70,498 639
Inyo Independence Fire Protection District Ambulance Service - - 28,242 1,372
Inyo Independence Fire Protection District Fire Protection - - 193,020 13,195
Inyo Indian Creek-Westridge Community Services District Water Enterprise 199,906 13,814 - 135
Inyo Inyo-Mono Resource Conservation District Resource Conservation - - 53 -
Inyo Keeler Community Services District Water Enterprise 22,692 127 - -
Inyo Lone Pine Community Services District Waste Disposal Enterprise 239,136 2,117 - -
Inyo Lone Pine Fire Protection District Ambulance Service - - 61,462 9,092
Inyo Lone Pine Fire Protection District Fire Protection - - 338,894 131,837
Inyo Mesa Community Services District Waste Disposal Enterprise - 102 - -
Inyo Mt. Whitney Cemetery District Cemetery - - 63,515 409
Inyo Olancha Community Services District Fire Protection - - 194,245 21,158
Inyo Pioneer Cemetery District Cemetery - - 340,493 2,378
Inyo Sierra Highlands Community Services District Water Enterprise 100,347 973 - -
Inyo Sierra North Community Service District Water Enterprise 11,850 16 - -
Inyo Southern Inyo Fire Protection District Fire Protection - - 125,744 11,388
Inyo Starlite Community Services District Water Enterprise 34,969 445 - -
Inyo Tecopa Cemetery District Cemetery - - 971 9
Kern Antelope Valley-East Kern Water Agency Water Enterprise 17,717,751 34,886,730 - 1,720,543
Kern Arvin Community Services District Water Enterprise 2,148,243 302,191 - 297,936
Kern Arvin-Edison Water Storage District Water Enterprise 20,927,372 9,915,801 - 1,672,392
Kern Bear Mountain Recreation and Park District Recreation and Park - - 643,079 4,157
Kern Bear Valley Community Services District Police Protection and Personal Safety - - 2,782,085 156,306
Kern Bear Valley Community Services District Streets and Roads - Construction and Maintenance- - 1,246,155 -
Kern Bear Valley Community Services District Waste Disposal Enterprise 1,020,759 11,096 - -
Kern Bear Valley Community Services District Water Enterprise 2,610,192 433,795 - 5,534
Kern Belridge Water Storage District Water Enterprise 18,408,679 267,522 - -
Kern Berrenda Mesa Water District Water Enterprise 17,304,901 299,592 - 553
Kern Boron Community Services District Waste Disposal Enterprise 149,777 - - -
Kern Boron Community Services District Water Enterprise 433,320 61,841 - 420
SCO_LAFCO FY 2014 Page 17 of 77 07/29/15

California State Controller's Office List includes only independent special districts
Data For LAFCO Fee Calculations Total Intergovernmental Revenues includes Federal,
Source: Special Districts Financial Transactions Report, Fiscal Year 2013-14 State, and Other Intergovernmental Agencies
Principal County Independent Special District Name Activity
Enterprise
Operating
Revenues
Enterprise
Non-Operating
Revenues
Non-Enterprise
General Purpose
Revenues
Total Inter
Governmental
Revenues
Kern Buena Vista Water Storage District Water Enterprise 11,834,776 410,868 - 258,366
Kern Buttonwillow County Water District Waste Disposal Enterprise 56,903 39,595 - 179
Kern Buttonwillow County Water District Water Enterprise 160,495 2,160 - -
Kern Buttonwillow Recreation and Park District Recreation and Park - - 477,191 3,119
Kern Cawelo Water District Water Enterprise 14,113,951 32,093 - -
Kern Cemetery District No. 1 Cemetery - - 1,120,387 11,404
Kern Delano Mosquito Abatement District Pest Control - - 988,567 36,483
Kern Desert Lake Community Services District Waste Disposal Enterprise 68,971 2,767 - 18
Kern Desert Lake Community Services District Water Enterprise 148,553 12,453 - 37
Kern East Kern Airport District Airport Enterprise 6,494,101 785,232 - 5,397
Kern East Kern Cemetery District Cemetery - - 494,094 3,539
Kern East Kern Health Care District Health - - 230,037 1,380
Kern East Niles Community Services District Waste Disposal Enterprise 1,895,907 4,317 - -
Kern East Niles Community Services District Water Enterprise 8,388,927 440,289 - 72,824
Kern Eastern Kern Air Pollution Control District Air Pollution Control - - 1,206,908 131,738
Kern Eastern Kern Resource Conservation District Resource Conservation - - 110,917 74,108
Kern Eastside Power Authority Electric Enterprise 4,082,422 232,475 - -
Kern Enos Lane Public Utility District Water Enterprise 101,026 329 - -
Kern Frazier Park Public Utility District Water Enterprise 660,379 61,774 - 394
Kern Golden Empire Schools Financing Authority Financing or Constructing Facilities - - 12,849,000 -
Kern Golden Empire Transit District Transit Enterprise 22,761,256 - - 17,709,370
Kern Golden Empire Transit District - Specialized Service Transit Enterprise 1,510,762 - - 1,382,428
Kern Golden Hills Community Service District Water Enterprise 2,469,973 580,829 - 1,748
Kern Greater Bakersfield Separation of Grade District Streets and Roads - Construction and Maintenance- - 138,941 6,896
Kern Greenfield County Water District Water Enterprise 2,106,239 36,460 - 210
Kern Henry Miller Water District Water Enterprise 4,909,075 209,421 - 1,000
Kern Indian Wells Valley Airport District Airport Enterprise 1,570,562 99,155 - 39,977
Kern Indian Wells Valley Water District Water Enterprise 10,520,586 310,963 - -
Kern Inyokern Community Services District Electric Enterprise 5,840 106 - -
Kern Inyokern Community Services District Waste Disposal Enterprise 80,037 - - -
Kern Inyokern Community Services District Water Enterprise 126,433 50,644 - -
Kern Inyo-Kern Schools Financing Authority Financing or Constructing Facilities - - 695,456 -
Kern Kern County Citrus Pest Control District Pest Control - - 975,937 -
Kern Kern County Water Agency Flood Control and Water Conservation - - 92,614 640
Kern Kern County Water Agency Water Enterprise 159,881,161 32,999,194 - 3,264,786
Kern Kern Delta Water District Water Enterprise 4,923,506 4,222,655 - 25,000
Kern Kern Fan Authority Resource Conservation - - 69,107 69,000
Kern Kern Mosquito and Vector Control Pest Control - - 4,722,011 41,165
Kern Kern River Valley Cemetery District Cemetery - - 193,153 715
Kern Kern River Watershed Coalition Authority Water Enterprise 801,399 543 - -
Kern Kern Valley Resource Conservation District Resource Conservation - - 10 -
Kern Kern Water Bank Authority Water Enterprise 14,191,004 1,196,495 - -
SCO_LAFCO FY 2014 Page 18 of 77 07/29/15

California State Controller's Office List includes only independent special districts
Data For LAFCO Fee Calculations Total Intergovernmental Revenues includes Federal,
Source: Special Districts Financial Transactions Report, Fiscal Year 2013-14 State, and Other Intergovernmental Agencies
Principal County Independent Special District Name Activity
Enterprise
Operating
Revenues
Enterprise
Non-Operating
Revenues
Non-Enterprise
General Purpose
Revenues
Total Inter
Governmental
Revenues
Kern Kern-Tulare Water District Water Enterprise 8,826,771 876,910 - -
Kern Lake Isabella Community Service District Water Enterprise 137,780 8 - -
Kern Lamont Public Utility District Waste Disposal Enterprise 999,623 327,594 - 675
Kern Lamont Public Utility District Water Enterprise 2,009,485 103,985 - 225
Kern Lamont Storm Water District (Kern) Flood Control and Water Conservation - - 3,164 -
Kern Lebec County Water District Water Enterprise 503,762 48,655 - 267
Kern Lost Hills Utility District (Kern) Waste Disposal Enterprise 222,756 14,094 - -
Kern Lost Hills Utility District (Kern) Water Enterprise 683,256 34,270 - 23,648
Kern Lost Hills Water District Water Enterprise 15,347,161 1,160,786 - 8,022
Kern McFarland Recreation and Park District Recreation and Park - - 1,060,409 6,320
Kern Metropolitan Bakersfield Habitat Conservation Plan ImplementationResource Conservation - - 1,657,121 -
Kern Mettler County Water District Water Enterprise 28,000 119,879 - 108
Kern Minter Field Airport District Airport Enterprise 1,829,160 394,747 - 381,310
Kern Minter Field Airport District Waste Disposal Enterprise 68,689 - - -
Kern Mojave Public Utility District Waste Disposal Enterprise - 234,029 - 230,381
Kern Mojave Public Utility District Water Enterprise 1,293,138 413,081 - 2,522
Kern Mountain Meadows Community Services District Streets and Roads - Construction and Maintenance- - 217,358 45,169
Kern North Edwards Water District Water Enterprise 163,911 1,927,169 - 1,921,577
Kern North Kern Cemetery District Cemetery - - 1,052,594 5,742
Kern North Kern Water Storage District Water Enterprise 16,570,340 4,453,289 - 4,438,594
Kern North Kern/Cawelo Financing Authority Financing or Constructing Facilities - - 674,250 -
Kern North of the River Municipal Water District Water Enterprise 5,798,700 517,248 - 4,128
Kern North of the River Recreation and Park District Recreation and Park - - 10,489,740 637,092
Kern North of the River Sanitary District No.1 (Kern) Waste Disposal Enterprise 5,884,286 1,213,924 - 876,271
Kern North West Kern Resource Conservation District Resource Conservation - - 170,269 164,525
Kern Olcese Water District Electric Enterprise 356,998 - - -
Kern Olcese Water District Water Enterprise 568,386 105 - -
Kern Quail Valley Water District Water Enterprise 86,018 266,026 - 178,185
Kern Rand Communities Water District Water Enterprise 250,921 66,061 - 18,880
Kern Rosamond Community Services District Lighting and Lighting Maintenance - - 99,987 -
Kern Rosamond Community Services District Recreation and Park - - 503,049 8,120
Kern Rosamond Community Services District Waste Disposal Enterprise 3,363,413 20,391 - -
Kern Rosamond Community Services District Water Enterprise 3,742,960 112,096 - 109,968
Kern Rosedale-Rio Bravo Water Storage District Water Enterprise 16,275,800 293,834 - -
Kern San Joaquin Valleywide Air Pollution Study Agency Air Pollution Control - - 8,490 -
Kern Self-Insured Schools of California SISC I - Workers CompensationSelf Insurance - - 14,212,792 -
Kern Self-Insured Schools of California SISC II - Liability and PropertySelf Insurance - - 17,662,744 -
Kern Self-Insured Schools of California SISC III - Health and Welfare BenefitsSelf Insurance - - 1,387,690,232 -
Kern Semitropic - Rosamond Water Bank Authority Water Enterprise 654,700 28,998 - -
Kern Semitropic Water Storage District Water Enterprise 39,883,359 12,840,686 - -
Kern Shafter Recreation and Park District Recreation and Park - - 752,942 10,951
Kern Shafter-Wasco Irrigation District Water Enterprise 4,680,292 1,567,191 - 226,104
SCO_LAFCO FY 2014 Page 19 of 77 07/29/15

California State Controller's Office List includes only independent special districts
Data For LAFCO Fee Calculations Total Intergovernmental Revenues includes Federal,
Source: Special Districts Financial Transactions Report, Fiscal Year 2013-14 State, and Other Intergovernmental Agencies
Principal County Independent Special District Name Activity
Enterprise
Operating
Revenues
Enterprise
Non-Operating
Revenues
Non-Enterprise
General Purpose
Revenues
Total Inter
Governmental
Revenues
Kern South Fork Mosquito Abatement District Pest Control - - 23,478 -
Kern South Kern Cemetery District Cemetery - - 455,214 1,840
Kern Southern San Joaquin Municipal Utility District Water Enterprise 8,053,904 1,484,860 - 5,439
Kern Southwest Healthcare District Health - - 92,695 765
Kern Stallion Springs Community Services District Police Protection and Personal Safety - - 989,836 147,880
Kern Stallion Springs Community Services District Recreation and Park - - 66,032 -
Kern Stallion Springs Community Services District Streets and Roads - Construction and Maintenance- - 343,468 -
Kern Stallion Springs Community Services District Waste Disposal Enterprise 370,597 16,132 - -
Kern Stallion Springs Community Services District Water Enterprise 687,265 108,623 - -
Kern Tehachapi - Cummings County Water District Water Enterprise 4,392,210 6,311,463 - 94,970
Kern Tehachapi Cemetery District Cemetery - - 419,828 9,860
Kern Tehachapi Resource Conservation District Resource Conservation - - 12,253 86
Kern Tehachapi Valley Recreation and Park District Recreation and Park - - 1,046,601 29,000
Kern Tejon-Castac Water District Waste Disposal Enterprise 670,225 - - -
Kern Tejon-Castac Water District Water Enterprise 5,292,386 - - -
Kern Wasco Recreation and Park District Recreation and Park - - 760,315 6,802
Kern West Kern Water District Water Enterprise 25,044,475 3,890,343 - -
Kern West Side Cemetery District Cemetery - - 904,467 5,692
Kern West Side Health Care District Health - - 3,423,835 1,227,182
Kern West Side Mosquito and Vector Control District Pest Control - - 1,991,048 18,960
Kern West Side Recreation and Park District Recreation and Park - - 3,320,967 18,726
Kern Wheeler Ridge-Maricopa Water Storage District Water Enterprise 69,310,383 1,705,709 - -
Kings Armona Community Services District Waste Disposal Enterprise 876,237 10,749 - 118
Kings Armona Community Services District Water Enterprise 992,433 41,809 - 353
Kings Avenal Healthcare District Ambulance Service - - 137,635 189
Kings California Vanpool Authority (CalVans) Transit Enterprise 8,916,974 - - 2,158,932
Kings Corcoran Cemetery District Cemetery - - 232,872 882
Kings Corcoran Irrigation District Water Enterprise 11,348,160 210,102 - -
Kings Cross Creek Flood Control District Flood Control and Water Conservation - - 1,775 -
Kings Devils Den Water District Water Enterprise - 5,819 - 10
Kings Dudley Ridge Water District Water Enterprise 9,039,580 14,036 - -
Kings Empire West Side Irrigation District Water Enterprise 435,097 20,014 - 130
Kings Excelsior-Kings River Resource Conservation District Resource Conservation - - 32,525 -
Kings Green Valley Water District Water Enterprise - 23,735 - 418
Kings Hanford Cemetery District Cemetery - - 891,233 4,308
Kings Home Garden Community Service District Lighting and Lighting Maintenance - - 9,133 54
Kings Home Garden Community Service District Waste Disposal Enterprise 261,746 7,652 - -
Kings Home Garden Community Service District Water Enterprise 194,103 18,312 - 422
Kings Kettleman City Community Services District Waste Disposal Enterprise 449,322 23,493 - 129
Kings Kettleman City Community Services District Water Enterprise 345,121 517,127 - 492,368
Kings Kings County Area Public Transit Agency Transit Enterprise 6,871,154 - - 6,067,890
Kings Kings County Self-Insured Schools District Self Insurance - - 2,774,998 -
SCO_LAFCO FY 2014 Page 20 of 77 07/29/15

California State Controller's Office List includes only independent special districts
Data For LAFCO Fee Calculations Total Intergovernmental Revenues includes Federal,
Source: Special Districts Financial Transactions Report, Fiscal Year 2013-14 State, and Other Intergovernmental Agencies
Principal County Independent Special District Name Activity
Enterprise
Operating
Revenues
Enterprise
Non-Operating
Revenues
Non-Enterprise
General Purpose
Revenues
Total Inter
Governmental
Revenues
Kings Kings County Water District Water Enterprise 15,865 1,312,974 - 14,908
Kings Kings Mosquito Abatement District Pest Control - - 2,177,683 242,367
Kings Kings Waste and Recycling Authority Waste Disposal Enterprise 7,362,420 26,773 - -
Kings Lakeside Irrigation Water District Water Enterprise 643,083 286,326 - 2,213
Kings Lemoore Cemetery District Cemetery - - 781,069 2,245
Kings Reclamation District No. 1618 Land Reclamation and Levee Maintenance - - 180,000 -
Kings Reclamation District No. 2069 Water Enterprise 16,450 195 - -
Kings Reclamation District No. 2071 Land Reclamation and Levee Maintenance - - 37,500 -
Kings Reclamation District No. 2125 Land Reclamation and Levee Maintenance - - 45,000 -
Kings Reclamation District No. 739 Land Reclamation and Levee Maintenance - - 40,000 -
Kings Reclamation District No. 749 Land Reclamation and Levee Maintenance - - 70,000 -
Kings Reclamation District No. 761 Water Enterprise 189,473 - - -
Kings Reclamation District No. 770 Land Reclamation and Levee Maintenance - - 567,881 92,881
Kings Reclamation District No. 771 Land Reclamation and Levee Maintenance - - 15 -
Kings Reclamation District No. 776 Land Reclamation and Levee Maintenance - - 35 -
Kings Reclamation District No. 780 Land Reclamation and Levee Maintenance - - 1,613 -
Kings Reclamation District No. 825 Land Reclamation and Levee Maintenance - - 8,722 -
Kings Stratford Irrigation District Water Enterprise 153,073 2,907 - -
Kings Stratford Public Utility District Waste Disposal Enterprise 240,573 171,881 - 161,109
Kings Stratford Public Utility District Water Enterprise 166,412 10,693 - 142
Kings Tulare Lake Basin Water Storage District Water Enterprise 11,919,265 16,922 - 800
Kings Tulare Lake Drainage District (Kings) Drainage and Drainage Maintenance - - 1,913,793 103,899
Lake Adams Springs Water District Water Enterprise 47,405 659 - -
Lake Anderson Springs Community Services District Water Enterprise 78,704 38,980 - -
Lake Buckingham Park Water District Water Enterprise 427,532 88,089 - -
Lake Butler-Keys Community Service District Streets and Roads - Construction and Maintenance- - 869 -
Lake Callayomi County Water District Water Enterprise 446,011 12,208 - 128
Lake Clearlake Oaks Water District Waste Disposal Enterprise 959,462 153,639 - 1,254
Lake Clearlake Oaks Water District Water Enterprise 1,126,443 99,712 - 1,254
Lake Cobb Area County Water District Water Enterprise 495,882 140,443 - -
Lake County Water Works District No. 1 (Lake) Water Enterprise 844,346 74,323 - 898
Lake East Lake Resource Conservation District Resource Conservation - - 66,204 27,070
Lake Glenbrook Cemetery District Cemetery - - 20,792 204
Lake Hartley Cemetery District Cemetery - - 167,810 1,389
Lake Hidden Valley Lake Community Services District Waste Disposal Enterprise 1,826,125 2,892 - -
Lake Hidden Valley Lake Community Services District Water Enterprise 1,342,126 1,565 - -
Lake Kelseyville Cemetery District Cemetery - - 134,596 1,198
Lake Kelseyville Fire Protection District Ambulance Service - - 1,743,646 420,420
Lake Kelseyville Fire Protection District Fire Protection - - 1,626,448 88,940
Lake Konocti County Water District Water Enterprise 1,188,531 72,175 - 1,200
Lake Lake County Fire Protection District Ambulance Service - - 1,293,002 250,500
Lake Lake County Fire Protection District Fire Protection - - 1,903,816 43,634
SCO_LAFCO FY 2014 Page 21 of 77 07/29/15

California State Controller's Office List includes only independent special districts
Data For LAFCO Fee Calculations Total Intergovernmental Revenues includes Federal,
Source: Special Districts Financial Transactions Report, Fiscal Year 2013-14 State, and Other Intergovernmental Agencies
Principal County Independent Special District Name Activity
Enterprise
Operating
Revenues
Enterprise
Non-Operating
Revenues
Non-Enterprise
General Purpose
Revenues
Total Inter
Governmental
Revenues
Lake Lake County Vector Control District Pest Control - - 1,677,478 49,927
Lake Lake Pillsbury Fire Protection District Fire Protection - - 31,550 -
Lake Lake Transit Authority Transit Enterprise 2,677,919 - - 2,130,625
Lake Lakeport Fire Protection District Ambulance Service - - 1,384,275 -
Lake Lakeport Fire Protection District Fire Protection - - 1,073,208 42,130
Lake Lower Lake Cemetery District Cemetery - - 149,003 1,937
Lake Middletown Cemetery District Cemetery - - 118,514 1,300
Lake Northshore Fire Protection District Fire Protection - - 2,407,695 135,025
Lake Reclamation District No. 2070 Land Reclamation and Levee Maintenance - - 127 -
Lake Reclamation District No. 695 Land Reclamation and Levee Maintenance - - 12,147 -
Lake Redbud Healthcare District Health - - 829,053 10,429
Lake Scotts Valley Water Conservation District Water Enterprise - 118 - -
Lake South Lake County Fire Protection District Fire Protection - - 2,888,422 367,621
Lake Upper Lake Cemetery District Cemetery - - 88,431 689
Lake Upper Lake County Water District Water Enterprise 194,098 4,042 - 51
Lake Villa Blue Estates Water District Water Enterprise 8,143 - - -
Lake West Lake Resource Conservation District Resource Conservation - - 647,775 639,072
Lassen Big Valley Fire Protection District Fire Protection - - 50,705 572
Lassen Big Valley Pest Abatement District Pest Control - - 37,547 1,156
Lassen Clear Creek Community Service District (Lassen) Fire Protection - - 40,317 535
Lassen Clear Creek Community Service District (Lassen) Water Enterprise 56,759 20 - 10
Lassen Doyle Fire Protection District Fire Protection - - 27,386 1,223
Lassen Firenet Lassen Fire Protection - - 8,043 -
Lassen Herlong Public Utility District Waste Disposal Enterprise 660,000 541 - -
Lassen Herlong Public Utility District Water Enterprise 362,870 5,314,280 - 5,310,719
Lassen Honey Lake Valley Resource Conservation District Resource Conservation - - 1,006,404 1,006,178
Lassen Janesville Fire Protection District Fire Protection - - 238,169 4,000
Lassen Lake Forest Fire Protection District Fire Protection - - 36,584 10,062
Lassen Lassen County Water Works District No. 1 Waste Disposal Enterprise 54,516 - - -
Lassen Lassen County Water Works District No. 1 Water Enterprise 72,976 441 - -
Lassen Lassen Library District Library Services - - 146,853 7,137
Lassen Lassen Municipal Utility District Electric Enterprise 18,360,567 424,912 - -
Lassen Leavitt Lake Community Service District Recreation and Park - - 8,764 -
Lassen Leavitt Lake Community Service District Waste Disposal Enterprise 116,780 8,599 - 300
Lassen Leavitt Lake Community Service District Water Enterprise 131,786 8,600 - 300
Lassen Little Valley Community Services District Fire Protection - - 2,092 59
Lassen Madeline Fire Protection District Fire Protection - - 8,868 477
Lassen Northwest Lassen Fire Protection District Fire Protection - - 11,057 -
Lassen Pit Resource Conservation District Resource Conservation - - 786,806 710,835
Lassen Spalding Community Service District Fire Protection - - 68,696 15,698
Lassen Spalding Community Service District Governmental Services - - 4 -
Lassen Spalding Community Service District Recreation and Park - - 1,352 -
SCO_LAFCO FY 2014 Page 22 of 77 07/29/15
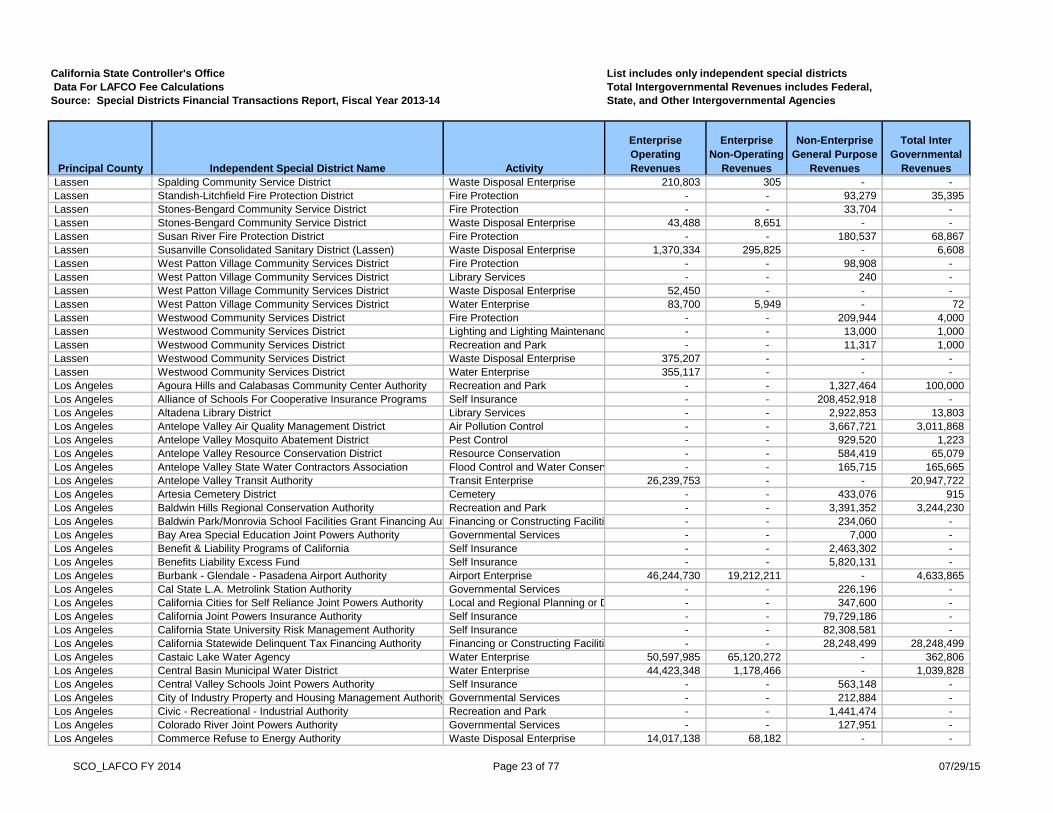
California State Controller's Office List includes only independent special districts
Data For LAFCO Fee Calculations Total Intergovernmental Revenues includes Federal,
Source: Special Districts Financial Transactions Report, Fiscal Year 2013-14 State, and Other Intergovernmental Agencies
Principal County Independent Special District Name Activity
Enterprise
Operating
Revenues
Enterprise
Non-Operating
Revenues
Non-Enterprise
General Purpose
Revenues
Total Inter
Governmental
Revenues
Lassen Spalding Community Service District Waste Disposal Enterprise 210,803 305 - -
Lassen Standish-Litchfield Fire Protection District Fire Protection - - 93,279 35,395
Lassen Stones-Bengard Community Service District Fire Protection - - 33,704 -
Lassen Stones-Bengard Community Service District Waste Disposal Enterprise 43,488 8,651 - -
Lassen Susan River Fire Protection District Fire Protection - - 180,537 68,867
Lassen Susanville Consolidated Sanitary District (Lassen) Waste Disposal Enterprise 1,370,334 295,825 - 6,608
Lassen West Patton Village Community Services District Fire Protection - - 98,908 -
Lassen West Patton Village Community Services District Library Services - - 240 -
Lassen West Patton Village Community Services District Waste Disposal Enterprise 52,450 - - -
Lassen West Patton Village Community Services District Water Enterprise 83,700 5,949 - 72
Lassen Westwood Community Services District Fire Protection - - 209,944 4,000
Lassen Westwood Community Services District Lighting and Lighting Maintenance - - 13,000 1,000
Lassen Westwood Community Services District Recreation and Park - - 11,317 1,000
Lassen Westwood Community Services District Waste Disposal Enterprise 375,207 - - -
Lassen Westwood Community Services District Water Enterprise 355,117 - - -
Los Angeles Agoura Hills and Calabasas Community Center Authority Recreation and Park - - 1,327,464 100,000
Los Angeles Alliance of Schools For Cooperative Insurance Programs Self Insurance - - 208,452,918 -
Los Angeles Altadena Library District Library Services - - 2,922,853 13,803
Los Angeles Antelope Valley Air Quality Management District Air Pollution Control - - 3,667,721 3,011,868
Los Angeles Antelope Valley Mosquito Abatement District Pest Control - - 929,520 1,223
Los Angeles Antelope Valley Resource Conservation District Resource Conservation - - 584,419 65,079
Los Angeles Antelope Valley State Water Contractors Association Flood Control and Water Conservation - - 165,715 165,665
Los Angeles Antelope Valley Transit Authority Transit Enterprise 26,239,753 - - 20,947,722
Los Angeles Artesia Cemetery District Cemetery - - 433,076 915
Los Angeles Baldwin Hills Regional Conservation Authority Recreation and Park - - 3,391,352 3,244,230
Los Angeles Baldwin Park/Monrovia School Facilities Grant Financing AuthorityFinancing or Constructing Facilities - - 234,060 -
Los Angeles Bay Area Special Education Joint Powers Authority Governmental Services - - 7,000 -
Los Angeles Benefit & Liability Programs of California Self Insurance - - 2,463,302 -
Los Angeles Benefits Liability Excess Fund Self Insurance - - 5,820,131 -
Los Angeles Burbank - Glendale - Pasadena Airport Authority Airport Enterprise 46,244,730 19,212,211 - 4,633,865
Los Angeles Cal State L.A. Metrolink Station Authority Governmental Services - - 226,196 -
Los Angeles California Cities for Self Reliance Joint Powers Authority Local and Regional Planning or Development - - 347,600 -
Los Angeles California Joint Powers Insurance Authority Self Insurance - - 79,729,186 -
Los Angeles California State University Risk Management Authority Self Insurance - - 82,308,581 -
Los Angeles California Statewide Delinquent Tax Financing Authority Financing or Constructing Facilities - - 28,248,499 28,248,499
Los Angeles Castaic Lake Water Agency Water Enterprise 50,597,985 65,120,272 - 362,806
Los Angeles Central Basin Municipal Water District Water Enterprise 44,423,348 1,178,466 - 1,039,828
Los Angeles Central Valley Schools Joint Powers Authority Self Insurance - - 563,148 -
Los Angeles City of Industry Property and Housing Management Authority Governmental Services - - 212,884 -
Los Angeles Civic - Recreational - Industrial Authority Recreation and Park - - 1,441,474 -
Los Angeles Colorado River Joint Powers Authority Governmental Services - - 127,951 -
Los Angeles Commerce Refuse to Energy Authority Waste Disposal Enterprise 14,017,138 68,182 - -
SCO_LAFCO FY 2014 Page 23 of 77 07/29/15

California State Controller's Office List includes only independent special districts
Data For LAFCO Fee Calculations Total Intergovernmental Revenues includes Federal,
Source: Special Districts Financial Transactions Report, Fiscal Year 2013-14 State, and Other Intergovernmental Agencies
Principal County Independent Special District Name Activity
Enterprise
Operating
Revenues
Enterprise
Non-Operating
Revenues
Non-Enterprise
General Purpose
Revenues
Total Inter
Governmental
Revenues
Los Angeles Community College Insurance Group Self Insurance - - 1,980,452 -
Los Angeles Compton Creek Mosquito Abatement District Pest Control - - 318,710 663
Los Angeles County Sanitation District No. 1 (Los Angeles) Waste Disposal Enterprise 40,326,912 5,408,390 - 18,189
Los Angeles County Sanitation District No. 14 (Los Angeles) Waste Disposal Enterprise 34,931,685 2,577,010 - 4,976
Los Angeles County Sanitation District No. 15 (Los Angeles) Waste Disposal Enterprise 54,691,397 10,176,128 - 41,764
Los Angeles County Sanitation District No. 16 (Los Angeles) Waste Disposal Enterprise 34,419,221 6,794,681 - 28,439
Los Angeles County Sanitation District No. 17 (Los Angeles) Waste Disposal Enterprise 3,705,682 770,765 - 3,309
Los Angeles County Sanitation District No. 18 (Los Angeles) Waste Disposal Enterprise 37,450,490 6,303,953 - 20,799
Los Angeles County Sanitation District No. 19 (Los Angeles) Waste Disposal Enterprise 6,882,095 1,592,715 - 7,199
Los Angeles County Sanitation District No. 2 - Refuse Disposal - Working Capital Fund (Los Angeles)Waste Disposal Enterprise 28,544,457 5,093,997 - -
Los Angeles County Sanitation District No. 2 (Los Angeles) Waste Disposal Enterprise 58,706,799 9,700,856 - 36,539
Los Angeles County Sanitation District No. 20 (Los Angeles) Waste Disposal Enterprise 21,754,405 1,532,780 - 4,285
Los Angeles County Sanitation District No. 21 (Los Angeles) Waste Disposal Enterprise 32,823,590 5,666,991 - 22,556
Los Angeles County Sanitation District No. 22 (Los Angeles) Waste Disposal Enterprise 29,955,026 5,539,074 - 20,378
Los Angeles County Sanitation District No. 28 (Los Angeles) Waste Disposal Enterprise 1,083,670 583,453 - 3,906
Los Angeles County Sanitation District No. 29 (Los Angeles) Waste Disposal Enterprise 2,820,513 240,748 - 571
Los Angeles County Sanitation District No. 3 (Los Angeles) Waste Disposal Enterprise 45,292,306 7,567,097 - 27,798
Los Angeles County Sanitation District No. 4 (Los Angeles) Waste Disposal Enterprise 4,034,800 739,077 - 3,146
Los Angeles County Sanitation District No. 5 (Los Angeles) Waste Disposal Enterprise 57,784,524 13,332,822 - 67,894
Los Angeles County Sanitation District No. 8 (Los Angeles) Waste Disposal Enterprise 23,932,335 3,211,057 - 11,645
Los Angeles County Sanitation District No. 9 (Los Angeles) Waste Disposal Enterprise 71,950 119,840 - 588
Los Angeles Crescenta Valley County Water District Waste Disposal Enterprise 3,242,490 5,786 - -
Los Angeles Crescenta Valley County Water District Water Enterprise 9,386,582 7,313,665 - 6,872,846
Los Angeles Culver City School Facilities Financing Authority Financing or Constructing Facilities - - 1,844,369 -
Los Angeles Desert and Mountain Conservation Authority Resource Conservation - - 15,000 -
Los Angeles Downey Cemetery District Cemetery - - 72,878 1,490
Los Angeles Exclusive Risk Management Authority of California Self Insurance - - 1,078,371 -
Los Angeles Foothill Air Support Team Authority Police Protection and Personal Safety - - 285,631 -
Los Angeles Foothill Municipal Water District Water Enterprise 13,032,607 285,727 - 270
Los Angeles Foothill Transit Transit Enterprise 65,701,432 - - 45,794,292
Los Angeles Gateway Cities Council of Governments Local and Regional Planning or Development - - 2,612,244 2,611,894
Los Angeles Glendale Parking Facilities Joint Powers Authority Financing or Constructing Facilities - - 1,582,914 -
Los Angeles Golden Valley Municipal Water District Waste Disposal Enterprise 166,955 1,666 - 28
Los Angeles Golden Valley Municipal Water District Water Enterprise 105,168 6,665 - 67
Los Angeles Greater Los Angeles County Vector Control District Pest Control - - 10,421,136 28,666
Los Angeles Green Valley County Water District Water Enterprise 209,684 74,424 - 73,462
Los Angeles Hub Cities Consortium Governmental Services - - 4,451,958 4,410,209
Los Angeles Human Services Consortium of the East San Gabriel Valley Governmental Services - - 9,761,042 9,625,198
Los Angeles Independent Cities Risk Management Authority Self Insurance - - 22,667,200 -
Los Angeles Interagency Communication Interoperability System Joint Powers Agency (ICIS JPA)Governmental Services - - 638,317 333,057
Los Angeles Interstate 5 Consortium of Cities Local and Regional Planning or Development - - 7,524,640 7,524,640
Los Angeles Kinneloa Irrigation District Water Enterprise 1,433,013 4,599 - -
SCO_LAFCO FY 2014 Page 24 of 77 07/29/15

California State Controller's Office List includes only independent special districts
Data For LAFCO Fee Calculations Total Intergovernmental Revenues includes Federal,
Source: Special Districts Financial Transactions Report, Fiscal Year 2013-14 State, and Other Intergovernmental Agencies
Principal County Independent Special District Name Activity
Enterprise
Operating
Revenues
Enterprise
Non-Operating
Revenues
Non-Enterprise
General Purpose
Revenues
Total Inter
Governmental
Revenues
Los Angeles La Canada Irrigation District Water Enterprise 5,274,873 428,672 - 3,254
Los Angeles La Habra Heights County Water District Water Enterprise 3,370,878 1,370,330 - 4,763
Los Angeles LA IMPACT Police Protection and Personal Safety - - 12,800,788 12,799,258
Los Angeles La Puente Valley County Water Water Enterprise 3,224,959 477,919 - 1,342
Los Angeles Lancaster Cemetery District Cemetery - - 256,361 657
Los Angeles Las Virgenes Municipal Water District Waste Disposal Enterprise 17,670,783 279,105 - 3,156
Los Angeles Las Virgenes Municipal Water District Water Enterprise 42,002,411 1,670,067 - 62,491
Los Angeles Little Lake Cemetery District Cemetery - - 341,561 621
Los Angeles Littlerock Creek Irrigation District Water Enterprise 1,602,202 147,972 - 2,874
Los Angeles Local Classrooms Funding Authority Governmental Services - - 27,250 -
Los Angeles Long Beach Public Transportation Company Transit Enterprise 78,821,993 - - 60,027,164
Los Angeles Long Beach Public Transportation Company - Specialized ServiceTransit Enterprise 1,071,043 - - 981,810
Los Angeles Los Angeles Convention and Exhibition Center Authority Financing or Constructing Facilities - - 25,858,612 -
Los Angeles Los Angeles County Capital Asset Leasing Corporation Financing or Constructing Facilities - - 24,782,431 -
Los Angeles Los Angeles County Metropolitan Transportation Authority Transit Enterprise 1,362,604,310 - - 982,612,631
Los Angeles Los Angeles County Sanitation Districts Financing Authority Financing or Constructing Facilities - - 24,520,698 -
Los Angeles Los Angeles County West Vector Control District Pest Control - - 4,221,065 6,860
Los Angeles Los Angeles Gateway Region Integrated Regional Water Management AuthorityFlood Control and Water Conservation - - 3,071,389 3,063,162
Los Angeles Los Angeles Grand Avenue Authority Local and Regional Planning or Development - - 703,918 -
Los Angeles Los Angeles Homeless Services Authority Governmental Services - - 67,585,203 67,514,150
Los Angeles Los Angeles Memorial Coliseum Commission Recreation and Park - - 4,000,965 19,583
Los Angeles Los Angeles Regional Crime Laboratory Facility Authority Police Protection and Personal Safety - - 2,508,908 2,494,705
Los Angeles Los Angeles Regional Interoperable Communications System AuthorityPolice Protection and Personal Safety - - 43,438,687 42,356,768
Los Angeles Los Cerritos Wetlands Authority Resource Conservation - - 406,144 357,136
Los Angeles Merge Risk Management Joint Powers Authority Self Insurance - - 6,822,423 -
Los Angeles Metropolitan Water District of Southern California Electric Enterprise 14,625,219 - - -
Los Angeles Metropolitan Water District of Southern California Water Enterprise 1,667,059,642 105,985,073 - 718,864
Los Angeles Miraleste Recreation and Park District Recreation and Park - - 174,667 829
Los Angeles Mountains Conservation and Education Authority Resource Conservation - - 6 -
Los Angeles Mountains Recreation and Conservation Authority Recreation and Park - - 32,649,246 23,251,150
Los Angeles Municipal Improvement Corporation of Los Angeles Financing or Constructing Facilities - - 673,935 -
Los Angeles Newhall County Water District Water Enterprise 13,016,630 766,130 - 3,545
Los Angeles Orchard Dale Water District Water Enterprise 4,442,235 11,767 - -
Los Angeles Palm Ranch Irrigation District Water Enterprise 1,219,287 96,474 - 402
Los Angeles Palmdale Recycled Water Authority Water Enterprise - 200,035 - 200,000
Los Angeles Palmdale Water District Water Enterprise 24,152,064 7,876,064 - -
Los Angeles Palos Verdes Library District Library Services - - 7,360,691 47,407
Los Angeles Palos Verdes Peninsula Transportation Authority Transit Enterprise 2,522,394 - - 2,215,038
Los Angeles Palos Verdes Peninsula Transportation Authority - Specialized ServiceTransit Enterprise 52,413 - - -
Los Angeles Pasadena Glen Community Services District Streets and Roads - Construction and Maintenance- - 32,384 -
Los Angeles Pico Water District Water Enterprise 3,477,452 29,224 - -
Los Angeles Point Dume Community Services District Recreation and Park - - 2 -
SCO_LAFCO FY 2014 Page 25 of 77 07/29/15

California State Controller's Office List includes only independent special districts
Data For LAFCO Fee Calculations Total Intergovernmental Revenues includes Federal,
Source: Special Districts Financial Transactions Report, Fiscal Year 2013-14 State, and Other Intergovernmental Agencies
Principal County Independent Special District Name Activity
Enterprise
Operating
Revenues
Enterprise
Non-Operating
Revenues
Non-Enterprise
General Purpose
Revenues
Total Inter
Governmental
Revenues
Los Angeles Pomona Valley Transportation Authority Transit Enterprise 1,522,510 - - 817,086
Los Angeles Pomona Valley Transportation Authority - Specialized ServiceTransit Enterprise 2,680,926 - - 2,562,879
Los Angeles Protected Insurance Program for Schools Self Insurance - - 208,185,821 -
Los Angeles PTSC-MTA Risk Management Authority Self Insurance - - 90,729,217 -
Los Angeles Puente Basin Water Agency Water Enterprise 20,260,573 1,581,405 - -
Los Angeles Puente Hills Habitat Preservation Authority Recreation and Park - - 2,849,341 5,600
Los Angeles Quartz Hill Water District Water Enterprise 4,646,096 492,812 - 2,240
Los Angeles Resources Conservation District of the Santa Monica MountainsResource Conservation - - 1,228,903 2,079
Los Angeles Ridgecrest Ranchos Recreation and Park District Recreation and Park - - 25,762 762
Los Angeles Rowland Area County Water District Water Enterprise 21,000,529 858,311 - 3,399
Los Angeles San Fernando Valley Council of Governments Governmental Services - - 70,025 -
Los Angeles San Gabriel Basin Water Quality Authority Water Enterprise 21,234,337 14,938 - -
Los Angeles San Gabriel County Water District Water Enterprise 6,643,589 66,022 - -
Los Angeles San Gabriel River Discovery Center Authority Governmental Services - - 182,708 182,679
Los Angeles San Gabriel Valley Mosquito and Vector Control District Pest Control - - 3,623,951 -
Los Angeles San Gabriel Valley Municipal Water District Electric Enterprise 103,255 - - -
Los Angeles San Gabriel Valley Municipal Water District Water Enterprise 1,861,200 6,964,964 - 345,086
Los Angeles San Gabriel Valley School Districts Self Insurance Authority for LiabilitySelf Insurance - - 2,465,574 -
Los Angeles San Gabriel Valley School Districts Self-Insurance Authority for Workers CompensationSelf Insurance - - 9,264,784 -
Los Angeles Santa Clarita Valley Sanitation District of Los Angeles CountyWaste Disposal Enterprise 28,294,643 6,894,766 - 41,424
Los Angeles Santa Clarita Watershed Recreation and Conservation AuthorityRecreation and Park - - 102 -
Los Angeles Sativa-Los Angeles County Water District Water Enterprise 1,083,838 14,428 - -
Los Angeles School Insurance Group Northern Alliance Second (Signal II) Self Insurance - - 537,483 -
Los Angeles Schools Association For Excess Risk Self Insurance - - 46,497,464 -
Los Angeles Schools Linked For Insurance Management Self Insurance - - 8,412,508 -
Los Angeles Self-Insurance Risk Management Authority Self Insurance - - 12,487,796 -
Los Angeles Self-Insurance Risk Management Authority II for Liability and Property ProtectionSelf Insurance - - 2,668,203 -
Los Angeles Self-Insurance Risk Management Authority III - Employee BenefitsSelf Insurance - - 7,156,158 -
Los Angeles South Bay Cities Council of Governments Local and Regional Planning or Development - - 2,512,219 935,011
Los Angeles South Bay Cities Sanitation District (Los Angeles) Waste Disposal Enterprise 9,850,292 4,882,226 - 30,153
Los Angeles South Bay Regional Public Communications Authority Governmental Services - - 9,987,633 452,452
Los Angeles South Coast Air Quality Management District Air Pollution Control - - 299,485,256 104,475,542
Los Angeles South Montebello Irrigation District Water Enterprise 3,817,977 63,327 - -
Los Angeles Southeast Area Animal Control Authority Animal Control - - 4,954,723 -
Los Angeles Southeast Area Social Services Funding Authority (SASSFA) Governmental Services - - 4,515,116 4,001,909
Los Angeles Southeast Water Coalition District Governmental Services - - 33,000 -
Los Angeles Southern California Community College Districts Self-Funded Insurance AuthoritySelf Insurance - - 6,320,892 -
Los Angeles Southern California Home Financing Authority Financing or Constructing Facilities - - 1,775,181 -
Los Angeles Southern California Library Cooperative Library Services - - 1,111,216 674,591
Los Angeles Southern California Public Power Authority Electric Enterprise 702,327,000 30,461,000 - -
Los Angeles Southern California Regional Airport Authority Airport Enterprise - 80 - -
Los Angeles Southern California Regional Rail Authority Transit Enterprise 204,705,909 - - 100,016,412
SCO_LAFCO FY 2014 Page 26 of 77 07/29/15
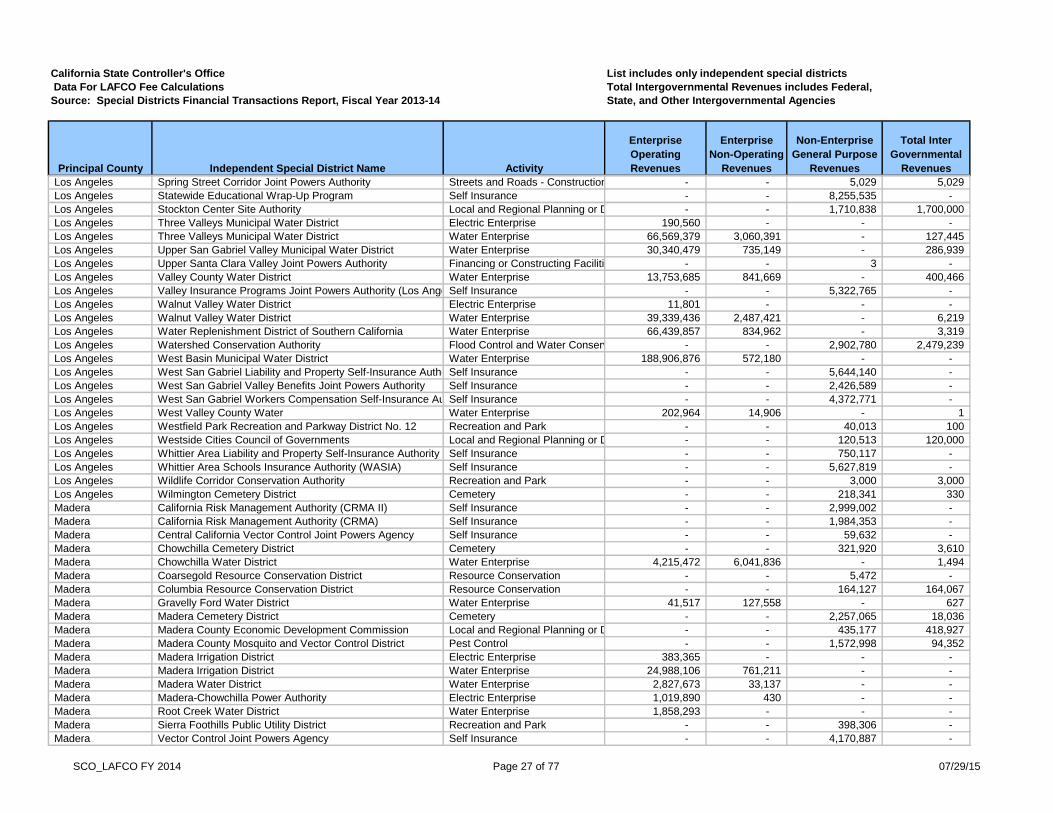
California State Controller's Office List includes only independent special districts
Data For LAFCO Fee Calculations Total Intergovernmental Revenues includes Federal,
Source: Special Districts Financial Transactions Report, Fiscal Year 2013-14 State, and Other Intergovernmental Agencies
Principal County Independent Special District Name Activity
Enterprise
Operating
Revenues
Enterprise
Non-Operating
Revenues
Non-Enterprise
General Purpose
Revenues
Total Inter
Governmental
Revenues
Los Angeles Spring Street Corridor Joint Powers Authority Streets and Roads - Construction and Maintenance- - 5,029 5,029
Los Angeles Statewide Educational Wrap-Up Program Self Insurance - - 8,255,535 -
Los Angeles Stockton Center Site Authority Local and Regional Planning or Development - - 1,710,838 1,700,000
Los Angeles Three Valleys Municipal Water District Electric Enterprise 190,560 - - -
Los Angeles Three Valleys Municipal Water District Water Enterprise 66,569,379 3,060,391 - 127,445
Los Angeles Upper San Gabriel Valley Municipal Water District Water Enterprise 30,340,479 735,149 - 286,939
Los Angeles Upper Santa Clara Valley Joint Powers Authority Financing or Constructing Facilities - - 3 -
Los Angeles Valley County Water District Water Enterprise 13,753,685 841,669 - 400,466
Los Angeles Valley Insurance Programs Joint Powers Authority (Los Angeles)Self Insurance - - 5,322,765 -
Los Angeles Walnut Valley Water District Electric Enterprise 11,801 - - -
Los Angeles Walnut Valley Water District Water Enterprise 39,339,436 2,487,421 - 6,219
Los Angeles Water Replenishment District of Southern California Water Enterprise 66,439,857 834,962 - 3,319
Los Angeles Watershed Conservation Authority Flood Control and Water Conservation - - 2,902,780 2,479,239
Los Angeles West Basin Municipal Water District Water Enterprise 188,906,876 572,180 - -
Los Angeles West San Gabriel Liability and Property Self-Insurance AuthoritySelf Insurance - - 5,644,140 -
Los Angeles West San Gabriel Valley Benefits Joint Powers Authority Self Insurance - - 2,426,589 -
Los Angeles West San Gabriel Workers Compensation Self-Insurance AuthoritySelf Insurance - - 4,372,771 -
Los Angeles West Valley County Water Water Enterprise 202,964 14,906 - 1
Los Angeles Westfield Park Recreation and Parkway District No. 12 Recreation and Park - - 40,013 100
Los Angeles Westside Cities Council of Governments Local and Regional Planning or Development - - 120,513 120,000
Los Angeles Whittier Area Liability and Property Self-Insurance Authority Self Insurance - - 750,117 -
Los Angeles Whittier Area Schools Insurance Authority (WASIA) Self Insurance - - 5,627,819 -
Los Angeles Wildlife Corridor Conservation Authority Recreation and Park - - 3,000 3,000
Los Angeles Wilmington Cemetery District Cemetery - - 218,341 330
Madera California Risk Management Authority (CRMA II) Self Insurance - - 2,999,002 -
Madera California Risk Management Authority (CRMA) Self Insurance - - 1,984,353 -
Madera Central California Vector Control Joint Powers Agency Self Insurance - - 59,632 -
Madera Chowchilla Cemetery District Cemetery - - 321,920 3,610
Madera Chowchilla Water District Water Enterprise 4,215,472 6,041,836 - 1,494
Madera Coarsegold Resource Conservation District Resource Conservation - - 5,472 -
Madera Columbia Resource Conservation District Resource Conservation - - 164,127 164,067
Madera Gravelly Ford Water District Water Enterprise 41,517 127,558 - 627
Madera Madera Cemetery District Cemetery - - 2,257,065 18,036
Madera Madera County Economic Development Commission Local and Regional Planning or Development - - 435,177 418,927
Madera Madera County Mosquito and Vector Control District Pest Control - - 1,572,998 94,352
Madera Madera Irrigation District Electric Enterprise 383,365 - - -
Madera Madera Irrigation District Water Enterprise 24,988,106 761,211 - -
Madera Madera Water District Water Enterprise 2,827,673 33,137 - -
Madera Madera-Chowchilla Power Authority Electric Enterprise 1,019,890 430 - -
Madera Root Creek Water District Water Enterprise 1,858,293 - - -
Madera Sierra Foothills Public Utility District Recreation and Park - - 398,306 -
Madera Vector Control Joint Powers Agency Self Insurance - - 4,170,887 -
SCO_LAFCO FY 2014 Page 27 of 77 07/29/15

California State Controller's Office List includes only independent special districts
Data For LAFCO Fee Calculations Total Intergovernmental Revenues includes Federal,
Source: Special Districts Financial Transactions Report, Fiscal Year 2013-14 State, and Other Intergovernmental Agencies
Principal County Independent Special District Name Activity
Enterprise
Operating
Revenues
Enterprise
Non-Operating
Revenues
Non-Enterprise
General Purpose
Revenues
Total Inter
Governmental
Revenues
Marin Almonte Sanitary District (Marin) Waste Disposal Enterprise 331,563 122,561 - 476
Marin Alto Sanitary District (Marin) Waste Disposal Enterprise 255,676 72,749 - 249
Marin Bel Marin Keys Community Services District Local and Regional Planning or Development - - 962,505 30,678
Marin Belvedere-Tiburon Joint Recreation Committee District Recreation and Park - - 1,376,563 -
Marin Belvedere-Tiburon Library Agency Library Services - - 2,135,498 7,300
Marin Bolinas Community Public Utility Waste Disposal Enterprise 307,616 30,745 - 123
Marin Bolinas Community Public Utility Water Enterprise 723,683 347,920 - 40,729
Marin Bolinas Fire Protection District Fire Protection - - 588,924 18,315
Marin Central Marin Police Authority Police Protection and Personal Safety - - 10,722,816 10,650,932
Marin Central Marin Sanitation Agency Waste Disposal Enterprise 16,921,697 88,244 - -
Marin Fire Agencies Insurance Risk Authority Self Insurance - - 2,957,237 -
Marin Fire House Community Park Agency Recreation and Park - - 30,012 25,023
Marin Homestead Valley Sanitary District (Marin) Waste Disposal Enterprise 604,512 225,144 - 846
Marin Inverness Public Utility District Fire Protection - - 539,225 17,047
Marin Inverness Public Utility District Water Enterprise 416,419 21,006 - -
Marin Kentfield Fire Protection District Fire Protection - - 4,757,096 563,840
Marin Larkspur Marina Financing Authority Financing or Constructing Facilities - - 139,618 -
Marin Las Gallinas Valley Sanitary District (Marin) Waste Disposal Enterprise 10,321,468 1,213,101 - 23,651
Marin Marin City Community Services District Recreation and Park - - 1,826,882 1,001,376
Marin Marin Clean Energy Electric Enterprise 84,833,236 926,912 - 917,947
Marin Marin County Hazardous and Solid Waste Joint Powers AuthorityGovernmental Services - - 3,023,058 81,038
Marin Marin County Resource Conservation District Resource Conservation - - 809,444 809,238
Marin Marin County Transit District Transit Enterprise 20,986,419 - - 14,655,906
Marin Marin County Transit District - Specialized Service Transit Enterprise 5,511,940 - - 4,377,569
Marin Marin Emergency Radio Authority Governmental Services - - 1,654,421 1,651,432
Marin Marin General Services Authority Governmental Services - - 695,127 547,298
Marin Marin Municipal Water District Water Enterprise 67,734,729 7,461,936 - 1,136,667
Marin Marin Schools Insurance Authority Self Insurance - - 12,659,307 -
Marin Marin Telecommunications Agency Governmental Services - - 4,242,328 -
Marin Marin/Sonoma Mosquito and Vector Control District Pest Control - - 7,857,888 20,010
Marin Marinet Consortium Joint Powers Authority Library Services - - 1,077,853 -
Marin Marinwood Community Services District Fire Protection - - 2,191,943 101,198
Marin Marinwood Community Services District Lighting and Lighting Maintenance - - 24,142 -
Marin Marinwood Community Services District Recreation and Park - - 2,718,616 4,742
Marin Muir Beach Community Services District Fire Protection - - 48,856 -
Marin Muir Beach Community Services District Governmental Services - - 164,894 16,401
Marin Muir Beach Community Services District Recreation and Park - - 9,629 -
Marin Muir Beach Community Services District Water Enterprise 163,141 - - -
Marin North Marin Water District Waste Disposal Enterprise 178,110 46,438 - 908
Marin North Marin Water District Water Enterprise 20,199,511 503,298 - 868
Marin Novato Fire Protection District Fire Protection - - 24,861,891 858,019
Marin Novato Sanitary District (Marin) Waste Disposal Enterprise 16,098,666 2,215,719 - 10,698
SCO_LAFCO FY 2014 Page 28 of 77 07/29/15
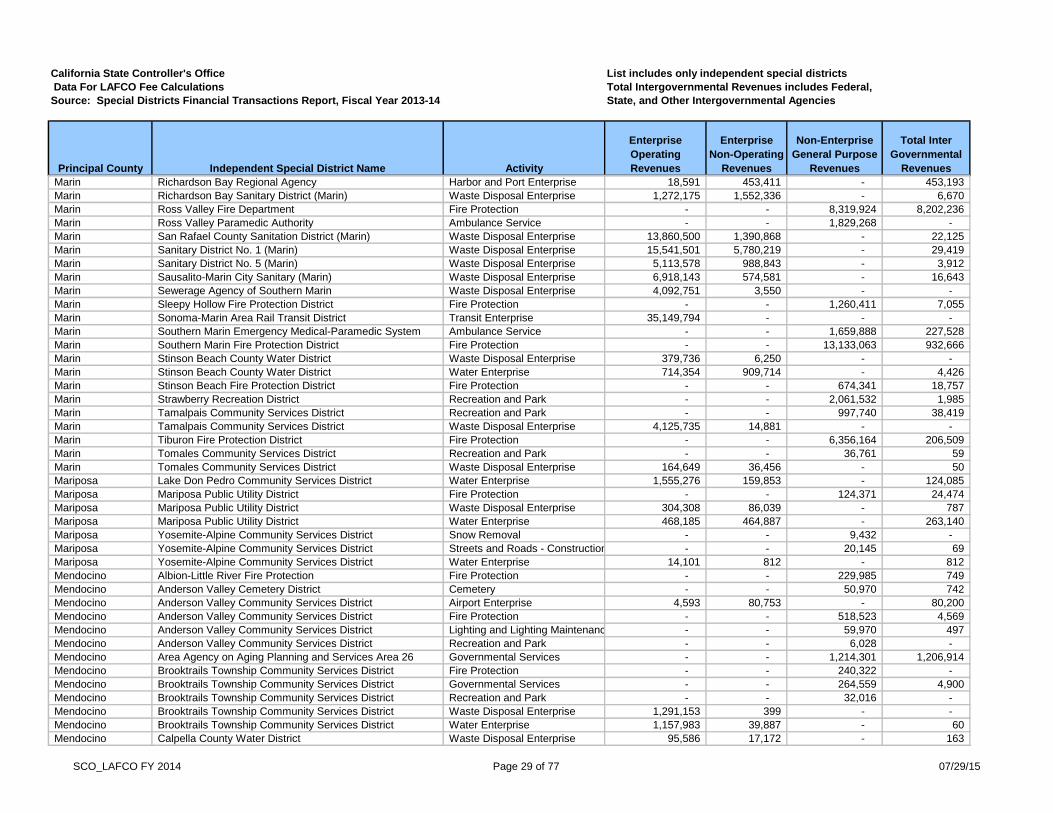
California State Controller's Office List includes only independent special districts
Data For LAFCO Fee Calculations Total Intergovernmental Revenues includes Federal,
Source: Special Districts Financial Transactions Report, Fiscal Year 2013-14 State, and Other Intergovernmental Agencies
Principal County Independent Special District Name Activity
Enterprise
Operating
Revenues
Enterprise
Non-Operating
Revenues
Non-Enterprise
General Purpose
Revenues
Total Inter
Governmental
Revenues
Marin Richardson Bay Regional Agency Harbor and Port Enterprise 18,591 453,411 - 453,193
Marin Richardson Bay Sanitary District (Marin) Waste Disposal Enterprise 1,272,175 1,552,336 - 6,670
Marin Ross Valley Fire Department Fire Protection - - 8,319,924 8,202,236
Marin Ross Valley Paramedic Authority Ambulance Service - - 1,829,268 -
Marin San Rafael County Sanitation District (Marin) Waste Disposal Enterprise 13,860,500 1,390,868 - 22,125
Marin Sanitary District No. 1 (Marin) Waste Disposal Enterprise 15,541,501 5,780,219 - 29,419
Marin Sanitary District No. 5 (Marin) Waste Disposal Enterprise 5,113,578 988,843 - 3,912
Marin Sausalito-Marin City Sanitary (Marin) Waste Disposal Enterprise 6,918,143 574,581 - 16,643
Marin Sewerage Agency of Southern Marin Waste Disposal Enterprise 4,092,751 3,550 - -
Marin Sleepy Hollow Fire Protection District Fire Protection - - 1,260,411 7,055
Marin Sonoma-Marin Area Rail Transit District Transit Enterprise 35,149,794 - - -
Marin Southern Marin Emergency Medical-Paramedic System Ambulance Service - - 1,659,888 227,528
Marin Southern Marin Fire Protection District Fire Protection - - 13,133,063 932,666
Marin Stinson Beach County Water District Waste Disposal Enterprise 379,736 6,250 - -
Marin Stinson Beach County Water District Water Enterprise 714,354 909,714 - 4,426
Marin Stinson Beach Fire Protection District Fire Protection - - 674,341 18,757
Marin Strawberry Recreation District Recreation and Park - - 2,061,532 1,985
Marin Tamalpais Community Services District Recreation and Park - - 997,740 38,419
Marin Tamalpais Community Services District Waste Disposal Enterprise 4,125,735 14,881 - -
Marin Tiburon Fire Protection District Fire Protection - - 6,356,164 206,509
Marin Tomales Community Services District Recreation and Park - - 36,761 59
Marin Tomales Community Services District Waste Disposal Enterprise 164,649 36,456 - 50
Mariposa Lake Don Pedro Community Services District Water Enterprise 1,555,276 159,853 - 124,085
Mariposa Mariposa Public Utility District Fire Protection - - 124,371 24,474
Mariposa Mariposa Public Utility District Waste Disposal Enterprise 304,308 86,039 - 787
Mariposa Mariposa Public Utility District Water Enterprise 468,185 464,887 - 263,140
Mariposa Yosemite-Alpine Community Services District Snow Removal - - 9,432 -
Mariposa Yosemite-Alpine Community Services District Streets and Roads - Construction and Maintenance- - 20,145 69
Mariposa Yosemite-Alpine Community Services District Water Enterprise 14,101 812 - 812
Mendocino Albion-Little River Fire Protection Fire Protection - - 229,985 749
Mendocino Anderson Valley Cemetery District Cemetery - - 50,970 742
Mendocino Anderson Valley Community Services District Airport Enterprise 4,593 80,753 - 80,200
Mendocino Anderson Valley Community Services District Fire Protection - - 518,523 4,569
Mendocino Anderson Valley Community Services District Lighting and Lighting Maintenance - - 59,970 497
Mendocino Anderson Valley Community Services District Recreation and Park - - 6,028 -
Mendocino Area Agency on Aging Planning and Services Area 26 Governmental Services - - 1,214,301 1,206,914
Mendocino Brooktrails Township Community Services District Fire Protection - - 240,322 -
Mendocino Brooktrails Township Community Services District Governmental Services - - 264,559 4,900
Mendocino Brooktrails Township Community Services District Recreation and Park - - 32,016 -
Mendocino Brooktrails Township Community Services District Waste Disposal Enterprise 1,291,153 399 - -
Mendocino Brooktrails Township Community Services District Water Enterprise 1,157,983 39,887 - 60
Mendocino Calpella County Water District Waste Disposal Enterprise 95,586 17,172 - 163
SCO_LAFCO FY 2014 Page 29 of 77 07/29/15

California State Controller's Office List includes only independent special districts
Data For LAFCO Fee Calculations Total Intergovernmental Revenues includes Federal,
Source: Special Districts Financial Transactions Report, Fiscal Year 2013-14 State, and Other Intergovernmental Agencies
Principal County Independent Special District Name Activity
Enterprise
Operating
Revenues
Enterprise
Non-Operating
Revenues
Non-Enterprise
General Purpose
Revenues
Total Inter
Governmental
Revenues
Mendocino Calpella County Water District Water Enterprise 126,143 65 - -
Mendocino Caspar South Water District Waste Disposal Enterprise 69,232 444 - -
Mendocino Cemetery District of the Redwoods Cemetery - - 91,157 1,003
Mendocino Coast Life Support District Ambulance Service - - 1,832,674 1,222
Mendocino Comptche Community Services District Fire Protection - - 35,254 7,839
Mendocino Covelo Cemetery District Cemetery - - 17,899 205
Mendocino Covelo Community Services District Waste Disposal Enterprise 207,295 45 - -
Mendocino Covelo Fire Protection District Fire Protection - - 199,749 544
Mendocino Eel-Russian River Commission Flood Control and Water Conservation - - 3,900 3,900
Mendocino Elk Community Services District Fire Protection - - 185,606 416
Mendocino Elk County Water District Water Enterprise 122,265 253 - -
Mendocino Fort Bragg Fire Protection Authority Fire Protection - - 1,126,927 649,992
Mendocino Fort Bragg Rural Fire Protection District Fire Protection - - 369,894 2,068
Mendocino Gualala Community Services District Waste Disposal Enterprise 514,824 9,528 - -
Mendocino Hopland Cemetery District Cemetery - - 9,838 42
Mendocino Hopland Fire Protection District Fire Protection - - 393,150 93,818
Mendocino Hopland Public Utility District Waste Disposal Enterprise 305,557 91 - -
Mendocino Hopland Public Utility District Water Enterprise 231,145 97 - -
Mendocino Irish Beach Water District Water Enterprise 195,092 97,413 - -
Mendocino Laytonville County Water District Water Enterprise 444,199 19,054 - 192
Mendocino Leggett Valley Fire Protection District Fire Protection - - 48,605 306
Mendocino Little Lake Fire Protection District Fire Protection - - 949,366 140,780
Mendocino Long Valley Fire Protection District (Mendocino) Ambulance Service - - 176,745 -
Mendocino Long Valley Fire Protection District (Mendocino) Fire Protection - - 299,537 18,877
Mendocino Mendocino City Community Services District Waste Disposal Enterprise 692,731 104,699 - 811
Mendocino Mendocino Coast Recreation and Park District Recreation and Park - - 738,282 2,679
Mendocino Mendocino County Flood Control and Water Conservation Improvement DistrictFlood Control and Water Conservation - - 403,520 419
Mendocino Mendocino County Inland Water and Power Commission Water Enterprise - 10,000 - 10,000
Mendocino Mendocino County Resource Conservation District Resource Conservation - - 1,696,037 1,678,749
Mendocino Mendocino County Waterworks District No. 2 Waste Disposal Enterprise 131,000 14,820 - -
Mendocino Mendocino County Youth Project Governmental Services - - 1,440,748 955,501
Mendocino Mendocino Fire Protection District Fire Protection - - 326,717 1,675
Mendocino Mendocino Solid Waste Management Authority Waste Disposal Enterprise 838,639 369 - -
Mendocino Mendocino Transit Authority Transit Enterprise 4,154,312 - - 3,427,137
Mendocino Mendocino Transit Authority - Specialized Service Transit Enterprise 575,726 - - 428,519
Mendocino Mendocino-Little River Cemetery District Cemetery - - 49,619 547
Mendocino Millview County Water District Water Enterprise 1,669,813 634,689 - -
Mendocino North Coast Railroad Authority Transit Enterprise 584,843 - - -
Mendocino Noyo Harbor District Harbor and Port Enterprise 490,610 1,024,198 - 938,619
Mendocino Pacific Reefs Water District Water Enterprise 7,904 23,523 - -
Mendocino Piercy Fire Protection District Fire Protection - - 30,212 220
Mendocino Potter Valley Cemetery District Cemetery - - 18,371 120
SCO_LAFCO FY 2014 Page 30 of 77 07/29/15

California State Controller's Office List includes only independent special districts
Data For LAFCO Fee Calculations Total Intergovernmental Revenues includes Federal,
Source: Special Districts Financial Transactions Report, Fiscal Year 2013-14 State, and Other Intergovernmental Agencies
Principal County Independent Special District Name Activity
Enterprise
Operating
Revenues
Enterprise
Non-Operating
Revenues
Non-Enterprise
General Purpose
Revenues
Total Inter
Governmental
Revenues
Mendocino Potter Valley Community Services District Fire Protection - - 73,812 765
Mendocino Potter Valley Irrigation District Water Enterprise 117,648 315,132 - 3,202
Mendocino Redwood Coast Fire Protection District Fire Protection - - 248,256 42,152
Mendocino Redwood Valley - Calpella Fire Protection District Fire Protection - - 559,427 39,220
Mendocino Redwood Valley County Water District Water Enterprise 1,209,434 27,334 - 400
Mendocino Round Valley County Water District Flood Control and Water Conservation - - 16,115 172
Mendocino Russian River Cemetery District Cemetery - - 561,830 2,880
Mendocino Schools Insurance Group, Northern Alliance Self Insurance - - 5,937,452 -
Mendocino South Coast Fire Protection District Fire Protection - - 388,537 1,562
Mendocino Ukiah Valley Fire Protection District Fire Protection - - 1,393,175 98,868
Mendocino Ukiah Valley Sanitation District (Mendocino) Waste Disposal Enterprise 5,167,550 197,453 - 1,964
Mendocino Westport County Water District Waste Disposal Enterprise 87,653 1 - -
Mendocino Westport County Water District Water Enterprise 93,656 4,497 - 12
Mendocino Westport-Ten Mile Cemetery District Cemetery - - 18,135 154
Mendocino Willow County Water District Water Enterprise 789,427 19,646 - -
Merced Ballico Community Services District Water Enterprise 22,751 58 - -
Merced Ballico-Cortez Water District Water Enterprise - 6,249 - 50
Merced Bloss Memorial Healthcare District Health - - 2,247,882 3,271
Merced Celeste County Water District Water Enterprise - 694 - 6
Merced Centinella Water District Water Enterprise - 92 - -
Merced Central California Irrigation District Water Enterprise 20,175,319 542,159 - 3,334
Merced Charleston Drainage District (Merced) Drainage and Drainage Maintenance - - 149,393 -
Merced City of Merced Public Financing and Economic Development AuthorityFinancing or Constructing Facilities - - 44,399 -
Merced Country Club County Water District Water Enterprise 13,650 18 - -
Merced Delhi County Water District Waste Disposal Enterprise 785,334 83,998 - 1,000
Merced Delhi County Water District Water Enterprise 743,877 84,006 - 1,000
Merced Dos Palos Area Wastewater Treatment and Disposal System Waste Disposal Enterprise 825,375 472 - -
Merced Dos Palos Cemetery District Cemetery - - 211,840 1,059
Merced Dos Palos Drainage District (Merced) Drainage and Drainage Maintenance - - 128,061 -
Merced Dos Palos Water Quality Improvement Joint Powers Agency Water Enterprise 974,266 254,172 - 247,512
Merced Eagle Field Water District Water Enterprise 260,000 - - -
Merced East Merced Resource Conservation District Resource Conservation - - 25,277 13,511
Merced Franklin County Water District Waste Disposal Enterprise 677,611 48,200 - 400
Merced Grassland Resource Conservation District Resource Conservation - - 1,484 1,484
Merced Grassland Water District Water Enterprise 3,324,250 22,051 - 208
Merced Gustine Drainage District (Merced) Drainage and Drainage Maintenance - - 158,394 -
Merced Gustine-Romero Resource Conservation District Resource Conservation - - 131 -
Merced Henry Miller Reclamation District No. 2131 Water Enterprise 9,520,884 295,553 - 288,234
Merced Hilmar Cemetery District Cemetery - - 104,609 776
Merced Hilmar County Water District Waste Disposal Enterprise 729,431 55,033 - 700
Merced Hilmar County Water District Water Enterprise 599,807 49,642 - 500
Merced Le Grand Community Services District Waste Disposal Enterprise 324,700 8,356 - 72
SCO_LAFCO FY 2014 Page 31 of 77 07/29/15

California State Controller's Office List includes only independent special districts
Data For LAFCO Fee Calculations Total Intergovernmental Revenues includes Federal,
Source: Special Districts Financial Transactions Report, Fiscal Year 2013-14 State, and Other Intergovernmental Agencies
Principal County Independent Special District Name Activity
Enterprise
Operating
Revenues
Enterprise
Non-Operating
Revenues
Non-Enterprise
General Purpose
Revenues
Total Inter
Governmental
Revenues
Merced Le Grand Community Services District Water Enterprise 269,569 6,856 - 72
Merced Le Grand-Athlone Water District Water Enterprise - 10,337 - 77
Merced Los Banos Cemetery District Cemetery - - 310,548 1,032
Merced Los Banos Resource Conservation District Resource Conservation - - 298 -
Merced Lower San Joaquin Levee District (Merced) Flood Control and Water Conservation - - 1,068,402 -
Merced Merced Cemetery District Cemetery - - 658,575 3,770
Merced Merced County Mosquito Abatement Pest Control - - 2,741,493 157,929
Merced Merced County Regional Waste Management Authority Waste Disposal Enterprise 11,656,823 99,213 - -
Merced Merced County Schools Insurance Group I Self Insurance - - 3,225,273 -
Merced Merced Irrigation District Electric Enterprise 59,477,465 167,668 - -
Merced Merced Irrigation District Water Enterprise 17,322,127 3,466,864 - 32,269
Merced Merquin Cemetery District Cemetery - - 56,549 615
Merced Merquin County Water District Drainage and Drainage Maintenance - - 2,439,187 1,093
Merced Midway Community Services District Waste Disposal Enterprise 42,190 12,959 - 1
Merced Midway Community Services District Water Enterprise 42,190 14,838 - 1
Merced North Dos Palos Water District Water Enterprise 10,847 - - -
Merced Pacheco Water District Water Enterprise 1,885,921 266,957 - 140,250
Merced Plainsburg Cemetery District Cemetery - - 138,314 537
Merced Planada Community Services District Waste Disposal Enterprise 883,599 391,239 - 388,286
Merced Planada Community Services District Water Enterprise 569,079 2,953 - -
Merced San Joaquin River Exchange Contractors Water Authority Water Enterprise 23,026,200 4,210,047 - 4,117,483
Merced San Joaquin River Flood Control Project Agency Flood Control and Water Conservation - - 677,617 677,617
Merced San Joaquin Valley Drainage Authority Drainage and Drainage Maintenance - - 2,750,714 908,208
Merced San Luis and Delta-Mendota Water Authority Water Enterprise 29,680,623 51,738 - -
Merced San Luis Resource Conservation District Resource Conservation - - 10 -
Merced San Luis Water District Water Enterprise 28,922,450 715,486 - 6,194
Merced Santa Nella County Water District Waste Disposal Enterprise 422,720 164,842 - 711
Merced Santa Nella County Water District Water Enterprise 594,669 203,802 - 42,238
Merced Snelling Cemetery District Cemetery - - 24,819 203
Merced Snelling Community Services District Waste Disposal Enterprise 69,632 23,144 - 257
Merced South Dos Palos County Water District Waste Disposal Enterprise 14,779 3,732 - 35
Merced South Dos Palos County Water District Water Enterprise 25,980 6,428 - 62
Merced Stevinson Water District Water Enterprise 372,075 5,105 - 59
Merced Transit Joint Powers Authority of Merced County Transit Enterprise 9,297,996 - - 8,298,956
Merced Transit Joint Powers Authority of Merced County- Specialized ServiceTransit Enterprise 3,336,867 - - 2,978,331
Merced Turner Island Water District Water Enterprise 1,170,349 166 - -
Merced Volta Community Services District Water Enterprise 21,855 14 - -
Merced Winton Cemetery District Cemetery - - 690,012 3,023
Merced Winton Water and Sanitary District (Merced) Waste Disposal Enterprise 1,834,891 59,343 - 490
Merced Winton Water and Sanitary District (Merced) Water Enterprise 802,467 38,296 - 490
Merced Yosemite Area Regional Transportation System (YARTS) Transit Enterprise 1,816,965 - - 1,076,029
Modoc Adin Cemetery District Cemetery - - 28,229 879
SCO_LAFCO FY 2014 Page 32 of 77 07/29/15

California State Controller's Office List includes only independent special districts
Data For LAFCO Fee Calculations Total Intergovernmental Revenues includes Federal,
Source: Special Districts Financial Transactions Report, Fiscal Year 2013-14 State, and Other Intergovernmental Agencies
Principal County Independent Special District Name Activity
Enterprise
Operating
Revenues
Enterprise
Non-Operating
Revenues
Non-Enterprise
General Purpose
Revenues
Total Inter
Governmental
Revenues
Modoc Adin Community Services District Waste Disposal Enterprise 45,886 2,703 - 43
Modoc Adin Fire Protection District Fire Protection - - 53,466 28,272
Modoc Alturas Cemetery District Cemetery - - 106,080 5,696
Modoc Alturas Fire Protection District Fire Protection - - 86,874 16,393
Modoc California Pines Community Services District Airport Enterprise - 24,312 - 20,312
Modoc California Pines Community Services District Fire Protection - - 524,860 356
Modoc California Pines Community Services District Pest Control - - 7,117 -
Modoc California Pines Community Services District Recreation and Park - - 18,791 633
Modoc California Pines Community Services District Streets and Roads - Construction and Maintenance- - 67,140 -
Modoc California Pines Community Services District Waste Disposal Enterprise 120,687 62,592 - 229
Modoc California Pines Community Services District Water Enterprise 85,677 20,874 - 300
Modoc Canby Fire Protection District Fire Protection - - 15,959 277
Modoc Cedarville Cemetery District Cemetery - - 19,664 263
Modoc Cedarville County Water District Water Enterprise 119,482 4,260 - 53
Modoc Cedarville Fire Protection District Fire Protection - - 47,229 775
Modoc Central Modoc Resource Conservation District Resource Conservation - - 143,142 91,051
Modoc Daphnedale Community Services District Waste Disposal Enterprise 26,429 2,849 - 42
Modoc Davis Creek Cemetery District Cemetery - - 5,615 97
Modoc Davis Creek Fire Protection District Fire Protection - - 12,317 915
Modoc Eagleville Cemetery District Cemetery - - 8,099 132
Modoc Eagleville Fire Protection District Fire Protection - - 8,488 157
Modoc Ft. Bidwell Cemetery District Cemetery - - 5,685 266
Modoc Ft. Bidwell Fire Protection District Fire Protection - - 7,730 313
Modoc Hot Spring Valley Irrigation District Water Enterprise 58,394 - - -
Modoc Lake City Cemetery District Cemetery - - 8,526 201
Modoc Lake City Fire Protection District Fire Protection - - 8,545 159
Modoc Lava Beds - Butte Valley Resource Conservation District Resource Conservation - - 1,028,079 1,027,518
Modoc Likely Cemetery District Cemetery - - 8,717 234
Modoc Likely Fire Protection District Fire Protection - - 30,057 2,109
Modoc Lookout Cemetery District Cemetery - - 9,618 448
Modoc Lookout Fire Protection District Fire Protection - - 22,341 13,926
Modoc Modoc County Schools Joint Powers Authority Self Insurance - - 197,890 -
Modoc Modoc Transportation Agency - Specialized Service Transit Enterprise 526,150 - - 418,260
Modoc Newell County Water District Waste Disposal Enterprise 33,868 172 - -
Modoc Newell County Water District Water Enterprise 45,549 105 - -
Modoc South Fork Irrigation District Water Enterprise 87,766 7,595 - -
Modoc Willow Ranch Cemetery District Cemetery - - 5,243 84
Modoc Willow Ranch Fire Protection District Fire Protection - - 6,240 100
Mono Antelope Fire Protection District Fire Protection - - 217,039 71,990
Mono Antelope Valley Water District Water Enterprise - 461 - -
Mono Birchim Community Services District Water Enterprise - 82,289 - 214
Mono Bridgeport Fire Protection District Fire Protection - - 163,600 16,898
SCO_LAFCO FY 2014 Page 33 of 77 07/29/15

California State Controller's Office List includes only independent special districts
Data For LAFCO Fee Calculations Total Intergovernmental Revenues includes Federal,
Source: Special Districts Financial Transactions Report, Fiscal Year 2013-14 State, and Other Intergovernmental Agencies
Principal County Independent Special District Name Activity
Enterprise
Operating
Revenues
Enterprise
Non-Operating
Revenues
Non-Enterprise
General Purpose
Revenues
Total Inter
Governmental
Revenues
Mono Bridgeport Public Utility District Waste Disposal Enterprise 239,767 9,826 - 40
Mono Bridgeport Public Utility District Water Enterprise 337,413 6,523 - 40
Mono Chalfant Valley Fire Department Fire Protection - - 123,497 236
Mono County Service Area No. 1 (Mono) Television Translator Station Facilities - - 147,130 384
Mono County Service Area No. 2 (Mono) Television Translator Station Facilities - - 30,419 -
Mono County Service Area No. 5 (Mono) Television Translator Station Facilities - - 57,433 125
Mono Eastern Sierra Transit Authority Transit Enterprise 5,474,186 - - 2,848,622
Mono Hilton Creek Community Services District Waste Disposal Enterprise 357,275 98,752 - 242
Mono June Lake Fire Protection District Fire Protection - - 431,485 12,408
Mono June Lake Public Financing Authority Financing or Constructing Facilities - - 138,283 -
Mono June Lake Public Utility District Waste Disposal Enterprise 374,978 316,816 - 726
Mono June Lake Public Utility District Water Enterprise 376,795 320,343 - 726
Mono Lee Vining Fire Protection District Fire Protection - - 54,752 76
Mono Lee Vining Public Utility District Water Enterprise - 110,455 - 65,793
Mono Long Valley Fire Protection District (Mono) Fire Protection - - 333,836 799
Mono Mammoth County Water District Waste Disposal Enterprise 2,640,815 3,557,711 - 8,450
Mono Mammoth County Water District Water Enterprise 3,460,410 3,057,117 - 9,171
Mono Mammoth Lakes Community Services District Streets and Roads - Construction and Maintenance- - 33,189 -
Mono Mammoth Lakes Fire Protection District Fire Protection - - 3,019,193 382,280
Mono Mammoth Lakes Mosquito Abatement District Pest Control - - 84,854 202
Mono Mono City Fire Protection District Fire Protection - - 36,840 45
Mono Mono County Library Authority Library Services - - 944,808 2,459
Mono Mono County Resource Conservation District Resource Conservation - - 157,502 157,000
Mono Mono County Tri-Valley Groundwater Management District Resource Conservation - - 108 -
Mono Paradise Fire Protection District Fire Protection - - 29,625 -
Mono Wheeler Crest Community Services District Water Enterprise - 81,831 - 39,000
Mono Wheeler Crest Fire Protection District Fire Protection - - 152,586 7,074
Mono White Mountain Fire Protection Fire Protection - - 48,905 114
Monterey Aromas Tri-County Fire Protection District Fire Protection - - 1,244,718 9,559
Monterey Cachagua Fire Protection District Fire Protection - - 97,345 37,791
Monterey California Sanitation Districts Risk Management Authority Self Insurance - - 10,812,970 -
Monterey Carmel Area Wastewater Agency (Monterey) Waste Disposal Enterprise 7,284,283 1,645,015 - 9,326
Monterey Carmel Highlands Fire Protection District Fire Protection - - 2,458,831 309,786
Monterey Carmel Valley Recreation and Park District Recreation and Park - - 84,276 5,205
Monterey Castroville Cemetery District Cemetery - - 190,421 24,761
Monterey Castroville Community Services District Drainage and Drainage Maintenance - - 39,281 32,357
Monterey Castroville Community Services District Lighting and Lighting Maintenance - - 34,269 34,269
Monterey Castroville Community Services District Waste Disposal Enterprise 268,054 1,327,318 - 1,202,996
Monterey Castroville Community Services District Water Enterprise 913,025 7,187 - -
Monterey Community Human Services Project Health - - 4,182,262 3,710,190
Monterey Cypress Fire Protection District Fire Protection - - 4,326,438 23,302
Monterey Gonzales Cemetery District Cemetery - - 94,224 3,688
SCO_LAFCO FY 2014 Page 34 of 77 07/29/15

California State Controller's Office List includes only independent special districts
Data For LAFCO Fee Calculations Total Intergovernmental Revenues includes Federal,
Source: Special Districts Financial Transactions Report, Fiscal Year 2013-14 State, and Other Intergovernmental Agencies
Principal County Independent Special District Name Activity
Enterprise
Operating
Revenues
Enterprise
Non-Operating
Revenues
Non-Enterprise
General Purpose
Revenues
Total Inter
Governmental
Revenues
Monterey Gonzales Fire Protection District Fire Protection - - 195,819 24,693
Monterey Greenfield Cemetery District Cemetery - - 102,399 2,346
Monterey Greenfield Fire Protection District Fire Protection - - 724,238 161,053
Monterey Greenfield Memorial District Memorial - - 161,426 6,081
Monterey Greenfield Recreation and Park District Recreation and Park - - 171,232 7,584
Monterey King City Cemetery District Cemetery - - 242,655 810
Monterey Local Government Services Authority Governmental Services - - 4,978,110 4,978,110
Monterey Marina Coast Water District Waste Disposal Enterprise 3,526,656 99,062 - -
Monterey Marina Coast Water District Water Enterprise 12,359,689 325,310 - -
Monterey Mission-Soledad Fire Protection District Fire Protection - - 229,988 31,737
Monterey Monterey Bay Area Self-Insurance Authority Self Insurance - - 5,641,591 -
Monterey Monterey Bay Unified Air Pollution Control District Air Pollution Control - - 9,839,909 5,796,182
Monterey Monterey County Liability and Property Self-Insurance AuthoritySelf Insurance - - 3,691,383 -
Monterey Monterey County Local Agencies Insurance Authority Self Insurance - - 1,274,727 -
Monterey Monterey County Regional Fire Protection District Fire Protection - - 12,861,304 4,318,349
Monterey Monterey County Resource Conservation District Resource Conservation - - 503,157 502,652
Monterey Monterey County Schools Insurance Group Self Insurance - - 53,642,924 -
Monterey Monterey Educational Risk Management Authority Self Insurance - - 9,979,669 -
Monterey Monterey Peninsula Airport District Airport Enterprise 7,809,041 4,230,081 - 4,041,984
Monterey Monterey Peninsula Regional Park District Recreation and Park - - 6,117,422 1,520,468
Monterey Monterey Peninsula Regional Water Authority Water Enterprise 433,844 - - -
Monterey Monterey Peninsula Water Management District Flood Control and Water Conservation - - 4,936,028 244,777
Monterey Monterey Peninsula Water Management District Water Enterprise 5,359,496 25,950 - -
Monterey Monterey Regional Waste Management District Waste Disposal Enterprise 21,927,743 119,955 - -
Monterey Monterey Regional Water Pollution Control Agency District Waste Disposal Enterprise 24,814,767 1,050,035 - -
Monterey Monterey-Salinas Transit Transit Enterprise 32,611,970 - - 25,461,515
Monterey Monterey-Salinas Transit - Specialized Service Transit Enterprise 3,621,144 - - 3,293,304
Monterey Moss Landing Harbor District Harbor and Port Enterprise 2,250,789 1,003,980 - 188,813
Monterey Municipal Services Authority Self Insurance - - 834,992 -
Monterey North County Fire Protection District (Monterey) Fire Protection - - 7,169,290 221,071
Monterey North County Public Recreation District Recreation and Park - - 869,140 154,113
Monterey Northern Salinas Valley Mosquito Abatement District Pest Control - - 1,572,098 203,984
Monterey Pajaro/Sunny Mesa Community Services District Lighting and Lighting Maintenance - - 125,513 62
Monterey Pajaro/Sunny Mesa Community Services District Streets and Roads - Construction and Maintenance- - 63,452 -
Monterey Pajaro/Sunny Mesa Community Services District Waste Disposal Enterprise 170,392 - - -
Monterey Pajaro/Sunny Mesa Community Services District Water Enterprise 1,644,341 358,890 - -
Monterey Pebble Beach Community Services District Fire Protection - - 9,147,433 51,270
Monterey Pebble Beach Community Services District Waste Disposal Enterprise 1,628,465 2,486,266 - 14,461
Monterey Regional Government Services Authority Governmental Services - - 6,756,408 6,723,333
Monterey Salinas Valley Solid Waste Authority Waste Disposal Enterprise 18,244,943 46,108 - -
Monterey San Ardo Cemetery District Cemetery - - 20,380 204
Monterey San Ardo Water District Waste Disposal Enterprise 38,262 15,764 - -
SCO_LAFCO FY 2014 Page 35 of 77 07/29/15

California State Controller's Office List includes only independent special districts
Data For LAFCO Fee Calculations Total Intergovernmental Revenues includes Federal,
Source: Special Districts Financial Transactions Report, Fiscal Year 2013-14 State, and Other Intergovernmental Agencies
Principal County Independent Special District Name Activity
Enterprise
Operating
Revenues
Enterprise
Non-Operating
Revenues
Non-Enterprise
General Purpose
Revenues
Total Inter
Governmental
Revenues
Monterey San Ardo Water District Water Enterprise 61,525 15,816 - -
Monterey San Lucas Cemetery District Cemetery - - 15,299 86
Monterey San Lucas County Water District Waste Disposal Enterprise 76,095 112 - -
Monterey San Lucas County Water District Water Enterprise 68,549 - - -
Monterey Santa Lucia Community Services District Police Protection and Personal Safety - - 1,557,169 -
Monterey Santa Lucia Community Services District Streets and Roads - Construction and Maintenance- - 1,507,820 -
Monterey Santa Lucia Community Services District Waste Disposal Enterprise 256 291,130 - -
Monterey Santa Lucia Community Services District Water Enterprise 440,093 1,666,638 - -
Monterey Seaside County Sanitation District (Monterey) Waste Disposal Enterprise 1,307,360 424,876 - 1,121
Monterey Soledad Cemetery District Cemetery - - 124,950 325
Monterey Soledad-Mission Recreation and Park District Recreation and Park - - 446,061 1,370
Monterey South Monterey County Fire Protection District Fire Protection - - 576,754 1,695
Monterey Spreckels Community Services District Fire Protection - - 78,769 74
Monterey Spreckels Memorial District Memorial - - 198,385 125
Napa Circle Oaks County Water District Waste Disposal Enterprise 116,955 17,803 - 200
Napa Circle Oaks County Water District Water Enterprise 200,914 17,805 - 200
Napa Congress Valley Water District Water Enterprise 15,366 83,944 - 331
Napa Los Carneros Water District Water Enterprise - 382,141 - -
Napa Napa County Mosquito Abatement District Pest Control - - 2,116,837 5,664
Napa Napa County Regional Park and Open Space District Recreation and Park - - 1,336,463 793,808
Napa Napa County Resource Conservation District Resource Conservation - - 1,447,246 998,089
Napa Napa County Transportation Agency Transit Enterprise 7,410,168 - - 6,412,263
Napa Napa County Transportation Agency - Specialized Service Transit Enterprise 2,290,826 - - 2,007,229
Napa Napa Sanitation District Waste Disposal Enterprise 21,077,878 6,814,895 - 2,771,771
Napa Pope Valley Cemetery District Cemetery - - 2 -
Napa Reclamation District No. 2109 Waste Disposal Enterprise 5,000 207,116 - 1,852
Napa South Napa Waste Management Authority Waste Disposal Enterprise 11,837,107 9,537 - -
Napa Spanish Flat Water District Waste Disposal Enterprise 138,942 - - -
Napa Spanish Flat Water District Water Enterprise 144,808 - - -
Napa Upper Valley Waste Management Agency Waste Disposal Enterprise 150,142 25,424 - -
Nevada Bear River Recreation and Park District Recreation and Park - - 154,696 235
Nevada Beyers Lane Community Services District Streets and Roads - Construction and Maintenance- - 13,862 -
Nevada Donner Summit Public Utility District Waste Disposal Enterprise 2,054,399 6,134,883 - 5,734,955
Nevada Donner Summit Public Utility District Water Enterprise 370,709 59,078 - 27,336
Nevada Higgins Area Fire Protection District Fire Protection - - 1,569,826 327,367
Nevada Kingsbury Greens Community Services District Drainage and Drainage Maintenance - - 24,445 -
Nevada Lake of the Pines Ranchos Road Community Services DistrictStreets and Roads - Construction and Maintenance- - 51,809 185
Nevada Mystic Mine Road Community Services District Streets and Roads - Construction and Maintenance- - 11,844 -
Nevada Nevada Cemetery District Cemetery - - 410,863 4,415
Nevada Nevada County Consolidated Fire District Fire Protection - - 5,457,686 316,223
Nevada Nevada County Fire Agency Fire Protection - - 13,355 -
Nevada Nevada County Resource Conservation District Resource Conservation - - 213,626 2,726
SCO_LAFCO FY 2014 Page 36 of 77 07/29/15

California State Controller's Office List includes only independent special districts
Data For LAFCO Fee Calculations Total Intergovernmental Revenues includes Federal,
Source: Special Districts Financial Transactions Report, Fiscal Year 2013-14 State, and Other Intergovernmental Agencies
Principal County Independent Special District Name Activity
Enterprise
Operating
Revenues
Enterprise
Non-Operating
Revenues
Non-Enterprise
General Purpose
Revenues
Total Inter
Governmental
Revenues
Nevada Nevada Irrigation District Electric Enterprise 20,705,832 348 - -
Nevada Nevada Irrigation District Water Enterprise 21,002,326 11,097,883 - 934,383
Nevada Nevada-Sierra In-Home Supportive Services Public Authority Governmental Services - - 1,398,798 -
Nevada North San Juan Fire Protection District Fire Protection - - 260,137 35,543
Nevada Northern Sierra Air Quality Management District Air Pollution Control - - 1,531,566 1,352,346
Nevada Oak Tree Park and Recreation District Recreation and Park - - 43,597 6,203
Nevada Ophir Hill Fire Protection District Fire Protection - - 814,551 249,728
Nevada Peardale-Chicago Park Fire Protection District Fire Protection - - 433,687 25,590
Nevada Penn Valley Fire Protection District Ambulance Service - - 1,014,580 -
Nevada Penn Valley Fire Protection District Fire Protection - - 1,057,083 105,013
Nevada Rough and Ready Fire Protection District Fire Protection - - 292,404 1,973
Nevada San Juan Ridge County Water District Flood Control and Water Conservation - - 19,586 157
Nevada Sierra Economic Development Corporation Local and Regional Planning or Development - - 576,023 172,362
Nevada Truckee Cemetery District Cemetery - - 146,448 1,483
Nevada Truckee Fire Protection District Fire Protection - - 9,823,158 288,283
Nevada Truckee Sanitary District (Nevada) Waste Disposal Enterprise 2,667,331 4,459,070 - 44,187
Nevada Truckee-Donner Public Utility District Electric Enterprise 24,213,374 9,383 - -
Nevada Truckee-Donner Public Utility District Water Enterprise 11,060,506 122,882 - -
Nevada Truckee-Donner Recreation and Park District Recreation and Park - - 6,755,372 43,309
Nevada Washington County Water District Fire Protection - - 32,457 283
Nevada Washington County Water District Water Enterprise 74,149 871 - -
Nevada Western Gateway Regional Recreation and Park District Recreation and Park - - 144,153 -
Orange Bardeen Partners Incorporated Financing or Constructing Facilities - - 10,576,000 -
Orange Big Independent Cities Excess Pool Joint Powers Agreement Self Insurance - - 5,302,794 -
Orange Buena Park Library District Library Services - - 2,700,261 519,642
Orange California Insurance Pool Authority Self Insurance - - 7,993,430 -
Orange Capistrano Bay Community Services District Police Protection and Personal Safety - - 1,078,881 -
Orange Central Net Operations Authority Governmental Services - - 345,768 45,000
Orange Coastal Animal Services Authority Animal Control - - 1,438,263 1,043,734
Orange Cooperative Organization For The Development of Employee Selection ProceduresGovernmental Services - - 669,687 -
Orange Costa Mesa Sanitary District (Orange) Waste Disposal Enterprise 10,131,540 601,530 - 1,620
Orange East Orange County Water District Water Enterprise 8,792,000 1,170,908 - 7,124
Orange El Toro Water District Waste Disposal Enterprise 8,158,318 387,788 - 1,792
Orange El Toro Water District Water Enterprise 16,657,606 681,524 - 3,328
Orange Emerald Bay Service District Waste Disposal Enterprise - 1,484,619 - 39,814
Orange Emerald Bay Service District Water Enterprise - 369,707 - 2,706
Orange Fullerton Arboretum Authority Recreation and Park - - 1,351,833 599,615
Orange Integrated Law and Justice Agency for Orange County (ILJAOC)Governmental Services - - 899,408 898,088
Orange Irvine Ranch Water District Waste Disposal Enterprise 58,108,000 27,678,000 - -
Orange Irvine Ranch Water District Water Enterprise 66,322,000 29,178,000 - 211,000
Orange Mesa Consolidated Water District Water Enterprise 37,675,088 452,758 - -
Orange Metro Cities Fire Authority Governmental Services - - 5,250,031 -
SCO_LAFCO FY 2014 Page 37 of 77 07/29/15

California State Controller's Office List includes only independent special districts
Data For LAFCO Fee Calculations Total Intergovernmental Revenues includes Federal,
Source: Special Districts Financial Transactions Report, Fiscal Year 2013-14 State, and Other Intergovernmental Agencies
Principal County Independent Special District Name Activity
Enterprise
Operating
Revenues
Enterprise
Non-Operating
Revenues
Non-Enterprise
General Purpose
Revenues
Total Inter
Governmental
Revenues
Orange Midway City Sanitary District (Orange) Waste Disposal Enterprise 7,574,795 2,535,327 - 995,560
Orange Moulton-Niguel Water District Waste Disposal Enterprise 17,624,792 8,437,819 - -
Orange Moulton-Niguel Water District Water Enterprise 36,072,065 26,669,221 - 1,355,588
Orange Municipal Water District of Orange County Water Enterprise 204,730,600 321,609 - -
Orange National Water Research Institute Flood Control and Water Conservation - - 967,425 477,518
Orange North Net Joint Powers Training Agreement Governmental Services - - 293,508 -
Orange Northern Orange County Liability and Property Self-Insurance AuthoritySelf Insurance - - 3,443,192 -
Orange Northern Orange County Self-Funded Workers Compensation AgencySelf Insurance - - 7,114,782 -
Orange Orange County - City Hazardous Material Emergency Response AuthorityGovernmental Services - - 101,828 93,005
Orange Orange County Cemetery District Cemetery - - 5,415,048 84,439
Orange Orange County Council of Governments Local and Regional Planning or Development - - 338,105 258,188
Orange Orange County Fire Authority Ambulance Service - - 4,653,791 -
Orange Orange County Fire Authority Fire Protection - - 303,750,232 20,485,090
Orange Orange County Fringe Benefit Joint Powers Agreement Self Insurance - - 3,947,378 -
Orange Orange County Sanitation District Waste Disposal Enterprise 315,552,026 94,037,062 - 19,040,587
Orange Orange County Transportation Authority Transit Enterprise 276,346,418 - - 204,140,569
Orange Orange County Transportation Authority - Specialized ServiceTransit Enterprise 33,204,983 - - 27,605,916
Orange Orange County Vector Control District Pest Control - - 11,372,526 690,849
Orange Orange County Water District Water Enterprise 105,293,285 30,719,249 - 138,528
Orange Placentia Library District Library Services - - 2,488,751 14,214
Orange Public Cable Television Authority Television Translator Station Facilities - - 5,527,592 -
Orange Rossmoor Community Services District Recreation and Park - - 1,239,886 57,429
Orange Rossmoor/Los Alamitos Area Sewer District Waste Disposal Enterprise 11,227 401,679 - 2,795
Orange San Juan Basin Authority Water Enterprise - 1,236,323 - -
Orange Santa Ana River Flood Protection Agency Flood Control and Water Conservation - - 23,254 23,100
Orange Santa Margarita Water District Waste Disposal Enterprise 14,115,358 8,459,791 - 9,832
Orange Santa Margarita Water District Water Enterprise 51,352,628 30,130,220 - 35,016
Orange Santiago Aqueduct Commission Water Enterprise 2,194,268 307 - -
Orange School Employers Association of California Governmental Services - - 222,545 -
Orange Serrano Irrigation District Water Enterprise 6,308,276 238,484 - -
Orange Silverado - Modjeska Recreation and Park District Recreation and Park - - 256,491 199
Orange South Coast Water District Recreation and Park - - 261,269 -
Orange South Coast Water District Waste Disposal Enterprise 13,894,181 3,474,893 - 11,791
Orange South Coast Water District Water Enterprise 17,663,051 3,088,221 - 11,791
Orange South Coast Water District Financing Authority Financing or Constructing Facilities - - 2,194,900 -
Orange South Orange County Wastewater Authority Waste Disposal Enterprise 26,833,747 24,902 - -
Orange Southern California Coastal Water Research Project AuthorityGovernmental Services - - 9,328,724 7,966,682
Orange Southern Orange County Property Liability Self-Insurance AuthoritySelf Insurance - - 427,232 -
Orange Sunset Beach Sanitary District (Orange) Waste Disposal Enterprise 446,806 589,182 - 3,953
Orange Surfside Colony Community Services District Police Protection and Personal Safety - - 447,887 2,460
Orange Surfside Colony Storm Water Drainage District (Orange) Drainage and Drainage Maintenance - - 167,292 1,012
Orange Three Arch Bay Community Services District Drainage and Drainage Maintenance - - 401,571 -
SCO_LAFCO FY 2014 Page 38 of 77 07/29/15

California State Controller's Office List includes only independent special districts
Data For LAFCO Fee Calculations Total Intergovernmental Revenues includes Federal,
Source: Special Districts Financial Transactions Report, Fiscal Year 2013-14 State, and Other Intergovernmental Agencies
Principal County Independent Special District Name Activity
Enterprise
Operating
Revenues
Enterprise
Non-Operating
Revenues
Non-Enterprise
General Purpose
Revenues
Total Inter
Governmental
Revenues
Orange Three Arch Bay Community Services District Police Protection and Personal Safety - - 1,207,471 17,418
Orange Trabuco Canyon Water District Waste Disposal Enterprise 2,131,519 630,485 - 4,998
Orange Trabuco Canyon Water District Water Enterprise 4,097,812 3,174,387 - 131,991
Orange West Cities Communications Center Joint Powers Authority (WESTCOMM)Police Protection and Personal Safety - - 2,325,457 2,319,840
Orange Western Orange County Self-Funded Workers Compensation AgencySelf Insurance - - 5,255,835 -
Orange Yorba Linda Water District Waste Disposal Enterprise 1,877,250 83,724 - -
Orange Yorba Linda Water District Water Enterprise 29,309,273 2,781,731 - -
Placer Alpine Springs County Water District Fire Protection - - 514,516 4,788
Placer Alpine Springs County Water District Recreation and Park - - 110,017 845
Placer Alpine Springs County Water District Waste Disposal Enterprise 429,833 5,788 - -
Placer Alpine Springs County Water District Water Enterprise 634,497 2,894 - -
Placer Alta Fire Protection District Fire Protection - - 84,161 1,852
Placer American River Authority Local and Regional Planning or Development - - 1,029 -
Placer Auburn Cemetery District Cemetery - - 794,178 3,913
Placer Auburn Recreation and Park District Recreation and Park - - 4,083,268 56,069
Placer Auburn Valley Community Services District Waste Disposal Enterprise 179,529 292,177 - -
Placer Auburn Valley Community Services District Water Enterprise 227,172 7 - -
Placer Bizz Johnson Highway Interchange Joint Powers Authority Streets and Roads - Construction and Maintenance- - 1,154,839 1,136,891
Placer California Charter Schools Joint Powers Authority Self Insurance - - 17,226,192 -
Placer Cemetery District No. 1 (Placer) Cemetery - - 1,316,778 14,171
Placer Christian Valley Park Community Services District Streets and Roads - Construction and Maintenance- - 46,265 455
Placer Christian Valley Park Community Services District Water Enterprise 433,394 58,350 - -
Placer Colfax Cemetery District Cemetery - - 227,924 1,213
Placer Foresthill Fire Protection District Fire Protection - - 1,281,384 3,584
Placer Foresthill Public Utility District Water Enterprise 2,067,119 92,961 - 12,097
Placer Golden Sierra Job Training Agency Local and Regional Planning or Development - - 3,975,520 3,975,411
Placer Heather Glen Community Services District Streets and Roads - Construction and Maintenance- - 16,383 54
Placer Heather Glen Community Services District Waste Disposal Enterprise 5,280 - - -
Placer Heather Glen Community Services District Water Enterprise 83,845 3,003 - -
Placer Loomis Fire Protection District Fire Protection - - 1,681,706 53,653
Placer McKinney Water District Water Enterprise 75,875 157,972 - 1,210
Placer Meadow Vista County Water District Water Enterprise 910,961 968,322 - 800
Placer Midway Heights County Water District Water Enterprise 529,804 79,934 - 361
Placer Newcastle - Rocklin - Gold Hill Cemetery District Cemetery - - 1,492,723 10,778
Placer Newcastle Fire Protection District Fire Protection - - 815,271 1,861
Placer North Lake Tahoe Public Finance Authority Financing or Constructing Facilities - - 5,375,549 -
Placer North Tahoe Fire Protection District Ambulance Service - - 6,850,354 273,981
Placer North Tahoe Fire Protection District Fire Protection - - 3,473,805 234,865
Placer North Tahoe Public Utility District Recreation and Park - - 1,806,355 68,706
Placer North Tahoe Public Utility District Waste Disposal Enterprise 1,522,656 3,801,612 - 105,336
Placer North Tahoe Public Utility District Water Enterprise 4,017,395 153,525 - 8,640
Placer Northstar Community Services District Fire Protection - - 5,938,588 39,613
SCO_LAFCO FY 2014 Page 39 of 77 07/29/15

California State Controller's Office List includes only independent special districts
Data For LAFCO Fee Calculations Total Intergovernmental Revenues includes Federal,
Source: Special Districts Financial Transactions Report, Fiscal Year 2013-14 State, and Other Intergovernmental Agencies
Principal County Independent Special District Name Activity
Enterprise
Operating
Revenues
Enterprise
Non-Operating
Revenues
Non-Enterprise
General Purpose
Revenues
Total Inter
Governmental
Revenues
Placer Northstar Community Services District Waste Disposal Enterprise 2,595,646 40,406 - -
Placer Northstar Community Services District Water Enterprise 2,018,270 57,834 - -
Placer Penryn Fire Protection District Fire Protection - - 659,733 11,196
Placer Placer County Resource Conservation District Resource Conservation - - 1,142,620 3,000
Placer Placer County Water Agency Electric Enterprise 13,515,521 5,375 - -
Placer Placer County Water Agency Water Enterprise 53,784,840 3,469,880 - 1,632,220
Placer Placer Hills Fire Protection District Fire Protection - - 1,631,282 8,738
Placer Placer Mosquito and Vector Control District Pest Control - - 3,777,051 349
Placer Rocklin Fire Protection District Fire Protection - - 42,297 504
Placer Roseville Cemetery District Cemetery - - 2,344,992 18,471
Placer School Insurance Group-Placer and Nevada Counties Self Insurance - - 81,998,969 -
Placer Sierra Coordinated Resources Management Council Resource Conservation - - 819,615 819,581
Placer Sierra Lakes County Water District Waste Disposal Enterprise 1,256,696 174,520 - 9,000
Placer Sierra Lakes County Water District Water Enterprise 880,010 174,521 - 9,000
Placer South Placer Fire Protection District Fire Protection - - 8,097,578 55,528
Placer South Placer Municipal Utility District Waste Disposal Enterprise 15,596,576 1,377,606 - 6,705
Placer South Placer Wastewater Authority Waste Disposal Enterprise 10,123,631 1,786,090 - -
Placer Squaw Valley Public Service District Fire Protection - - 2,663,509 29,049
Placer Squaw Valley Public Service District Waste Disposal Enterprise 1,227,695 112,316 - 207
Placer Squaw Valley Public Service District Water Enterprise 1,419,410 428,114 - 31,217
Placer Suburban Pines Community Services District Fire Protection - - 2,318 16
Placer Tahoe City Cemetery District Cemetery - - 52,748 441
Placer Tahoe City Public Utility District Recreation and Park - - 5,855,957 667,313
Placer Tahoe City Public Utility District Waste Disposal Enterprise 3,906,102 64,189 - -
Placer Tahoe City Public Utility District Water Enterprise 4,518,625 1,659,221 - 1,571,769
Placer Tahoe-Truckee Sanitation Agency Waste Disposal Enterprise 12,426,837 2,937,826 - 444,609
Placer Talmont Resort Improvement District Streets and Roads - Construction and Maintenance- - 98,167 -
Placer Talmont Resort Improvement District Water Enterprise 355,855 5,267 - -
Placer Truckee-Tahoe Airport District Airport Enterprise 4,063,787 5,547,019 - 95,017
Placer Western Placer Waste Management Authority Waste Disposal Enterprise 20,423,095 877,254 - 70,680
Plumas Almanor Recreation and Park District Recreation and Park - - 37,739 -
Plumas Beckwourth Fire Protection District Fire Protection - - 212,473 50,565
Plumas C Road Community Services District Fire Protection - - 60,377 -
Plumas Central Plumas Recreation District Recreation and Park - - 324,087 2,927
Plumas Chester Cemetery District Cemetery - - 77,555 710
Plumas Chester Public Utility District Fire Protection - - 2,581,095 960
Plumas Chester Public Utility District Waste Disposal Enterprise 534,903 87,147 - 385
Plumas Chester Public Utility District Water Enterprise 377,765 23,690 - 1,000
Plumas Clio Public Utility District Water Enterprise 11,378 13,771 - 116
Plumas Crescent Mills Cemetery Cemetery - - 1 -
Plumas Crescent Mills Fire Protection District Fire Protection - - 27,087 242
Plumas Cromberg Cemetery District Cemetery - - 2,931 17
SCO_LAFCO FY 2014 Page 40 of 77 07/29/15

California State Controller's Office List includes only independent special districts
Data For LAFCO Fee Calculations Total Intergovernmental Revenues includes Federal,
Source: Special Districts Financial Transactions Report, Fiscal Year 2013-14 State, and Other Intergovernmental Agencies
Principal County Independent Special District Name Activity
Enterprise
Operating
Revenues
Enterprise
Non-Operating
Revenues
Non-Enterprise
General Purpose
Revenues
Total Inter
Governmental
Revenues
Plumas East Quincy Community Services District Waste Disposal Enterprise 717,697 137,692 - -
Plumas East Quincy Community Services District Water Enterprise 503,250 94,683 - 850
Plumas Eastern Plumas Rural Fire Protection District Fire Protection - - 67,452 485
Plumas Feather River Canyon Community Services District Water Enterprise 37,142 85 - -
Plumas Feather River Resource Conservation District Resource Conservation - - 1,057 -
Plumas Gold Mountain Community Services District Fire Protection - - 86,494 -
Plumas Gold Mountain Community Services District Waste Disposal Enterprise 198,548 108 - -
Plumas Gold Mountain Community Services District Water Enterprise 271,239 96 - -
Plumas Graeagle Community Services District Water Enterprise - 29,661 - 279
Plumas Graeagle Fire Protection District Fire Protection - - 307,335 1,325
Plumas Greenhorn Creek Community Services District Fire Protection - - 17,553 2,794
Plumas Greenhorn Creek Community Services District Water Enterprise 121,979 10,653 - 105
Plumas Greenville Cemetery District Cemetery - - 23,605 433
Plumas Grizzly Lake Community Services District Waste Disposal Enterprise 224,590 17,403 - 100
Plumas Grizzly Lake Community Services District Water Enterprise 205,684 17,442 - 100
Plumas Grizzly Ranch Community Services District Water Enterprise 5,445 449,000 - -
Plumas Hamilton Branch Community Services District Water Enterprise 206,612 457 - -
Plumas Hamilton Branch Fire Protection District Fire Protection - - 322,400 2,056
Plumas Indian Valley Ambulance Service Authority Ambulance Service - - 61,729 -
Plumas Indian Valley Community Services District Waste Disposal Enterprise 152,239 16,291 - 18
Plumas Indian Valley Community Services District Water Enterprise 455,419 133,061 - 1,399
Plumas Indian Valley Recreation and Park District Recreation and Park - - 56,790 2,000
Plumas Johnsville Public Utility District Water Enterprise 57,329 9,276 - 73
Plumas La Porte Fire Protection District Fire Protection - - 21,187 190
Plumas Last Chance Creek Water District Water Enterprise 68,100 321 - -
Plumas Long Valley Community Services District Fire Protection - - 29,791 1
Plumas Meadow Valley Cemetery District Cemetery - - 12,710 201
Plumas Meadow Valley Fire Protection District Fire Protection - - 54,691 526
Plumas Meadow Valley Fire Protection District Recreation and Park - - 4,952 2,242
Plumas Mohawk Valley Cemetery District Cemetery - - 20,758 117
Plumas Peninsula Fire Protection District Fire Protection - - 1,314,516 4,186
Plumas Plumas Eureka Community Services District Fire Protection - - 135,572 450
Plumas Plumas Eureka Community Services District Waste Disposal Enterprise 402,401 710 - -
Plumas Plumas Eureka Community Services District Water Enterprise 338,735 453 - -
Plumas Portola Cemetery District Cemetery - - 54,171 467
Plumas Prattville-Almanor Fire Protection District Fire Protection - - 80,671 558
Plumas Quincy Community Services District Waste Disposal Enterprise 1,164,988 746,074 - 684,279
Plumas Quincy Community Services District Water Enterprise 607,279 58,133 - 539
Plumas Quincy Fire Protection District Fire Protection - - 493,638 2,197
Plumas Quincy-La Porte Cemetery District Cemetery - - 150,893 1,553
Plumas Sierra Valley Fire Protection District Fire Protection - - 41,996 438
Plumas Sierra Valley Groundwater Management District Water Enterprise 32,807 84 - 53
SCO_LAFCO FY 2014 Page 41 of 77 07/29/15

California State Controller's Office List includes only independent special districts
Data For LAFCO Fee Calculations Total Intergovernmental Revenues includes Federal,
Source: Special Districts Financial Transactions Report, Fiscal Year 2013-14 State, and Other Intergovernmental Agencies
Principal County Independent Special District Name Activity
Enterprise
Operating
Revenues
Enterprise
Non-Operating
Revenues
Non-Enterprise
General Purpose
Revenues
Total Inter
Governmental
Revenues
Plumas Taylorsville Cemetery District Cemetery - - 10,948 234
Plumas Whitehawk Ranch Community Services District Recreation and Park - - 133,017 -
Riverside Banning Library District Library Services - - 677,186 50,643
Riverside Beaumont Cherry Valley Recreation and Park District Recreation and Park - - 1,680,748 492,131
Riverside Beaumont Library District Library Services - - 1,132,306 121,970
Riverside Beaumont-Cherry Valley Water District Water Enterprise 11,979,486 137,985 - -
Riverside Cabazon County Water District Water Enterprise 1,401,292 82,675 - 205
Riverside Chiriaco Summit Water District Water Enterprise 133,201 7,957 - -
Riverside Citrus Pest Control District No. 2 Pest Control - - 489,935 -
Riverside Coachella Valley Cemetery District Cemetery - - 1,884,552 305,575
Riverside Coachella Valley Conservation Commission Resource Conservation - - 7,058,145 25,000
Riverside Coachella Valley Mosquito and Vector Control District Pest Control - - 7,994,696 3,906,234
Riverside Coachella Valley Resource Conservation District Resource Conservation - - 325,811 1,469
Riverside Coachella Valley Water District Flood Control and Water Conservation - - 19,246,226 8,499,632
Riverside Coachella Valley Water District Waste Disposal Enterprise 44,241,442 6,307,747 - 1,870,333
Riverside Coachella Valley Water District Water Enterprise 113,927,744 69,517,558 - 6,869,647
Riverside Coachella/Indio Waste Transfer Station Authority Waste Disposal Enterprise 387,610 1,053 - -
Riverside Community College-County Superintendent Self-Insurance Program For EmployeesSelf Insurance - - 6,610 -
Riverside De Luz Community Service District Streets and Roads - Construction and Maintenance- - 2,327,235 -
Riverside Desert Recreation District Recreation and Park - - 10,783,845 2,551,530
Riverside Desert Sands Unified School District Building Corporation Financing or Constructing Facilities - - 6,987,030 -
Riverside Desert Water Agency Waste Disposal Enterprise 1,003,015 3,193 - -
Riverside Desert Water Agency Water Enterprise 26,795,134 20,761,641 - 110,289
Riverside Eastern Municipal Water District Waste Disposal Enterprise 103,258,698 14,085,442 - 2,701,246
Riverside Eastern Municipal Water District Water Enterprise 139,536,321 29,204,224 - 3,885,287
Riverside Edgemont Community Services District Lighting and Lighting Maintenance - - 30,077 128
Riverside Edgemont Community Services District Waste Disposal Enterprise 253,498 1,192,113 - 7,458
Riverside Elsinore - Murrieta - Anza Resource Conservation District Resource Conservation - - 32,460 -
Riverside Elsinore Valley Cemetery District Cemetery - - 783,552 7,696
Riverside Elsinore Valley Municipal Water District Waste Disposal Enterprise 26,735,602 831,503 - -
Riverside Elsinore Valley Municipal Water District Water Enterprise 51,485,581 11,712,828 - 1,928,456
Riverside ERICA Communications Authority Police Protection and Personal Safety - - 986,253 -
Riverside Fern Valley Water District Water Enterprise 562,105 532,635 - 7,210
Riverside High Valleys Water District Water Enterprise 178,102 374,612 - 1,254
Riverside Home Garden County Water District Water Enterprise 803,881 459 - -
Riverside Home Gardens Sanitary District (Riverside) Waste Disposal Enterprise 765,544 182,350 - 6,233
Riverside Idyllwild Fire Protection District Fire Protection - - 1,825,988 52,553
Riverside Idyllwild Water District Waste Disposal Enterprise 383,027 135,186 - 1,349
Riverside Idyllwild Water District Water Enterprise 1,054,866 352,278 - 3,652
Riverside Jacqueline Cochran Regional Airport Authority Local and Regional Planning or Development - - 87,632 87,500
Riverside Jurupa Area Recreation and Park District Recreation and Park - - 2,768,961 647,832
Riverside Jurupa Community Services District Lighting and Lighting Maintenance - - 1,880,626 108,300
SCO_LAFCO FY 2014 Page 42 of 77 07/29/15

California State Controller's Office List includes only independent special districts
Data For LAFCO Fee Calculations Total Intergovernmental Revenues includes Federal,
Source: Special Districts Financial Transactions Report, Fiscal Year 2013-14 State, and Other Intergovernmental Agencies
Principal County Independent Special District Name Activity
Enterprise
Operating
Revenues
Enterprise
Non-Operating
Revenues
Non-Enterprise
General Purpose
Revenues
Total Inter
Governmental
Revenues
Riverside Jurupa Community Services District Recreation and Park - - 8,388,980 -
Riverside Jurupa Community Services District Waste Disposal Enterprise 15,931,009 2,173,071 - 25,855
Riverside Jurupa Community Services District Water Enterprise 31,591,429 5,661,530 - -
Riverside Lake Elsinore and San Jacinto Watersheds Authority Flood Control and Water Conservation - - 570,767 569,698
Riverside Lake Hemet Municipal Water District Recreation and Park - - 274,373 -
Riverside Lake Hemet Municipal Water District Waste Disposal Enterprise 752,831 41,448 - 451
Riverside Lake Hemet Municipal Water District Water Enterprise 13,803,502 1,383,333 - 89,941
Riverside Lee Lake Water District Waste Disposal Enterprise 2,662,787 91,606 - 540
Riverside Lee Lake Water District Water Enterprise 5,913,300 86,626 - 266
Riverside Local Agency Workers Compensation Excess Joint Powers AuthoritySelf Insurance - - 10,580,567 -
Riverside March Inland Port Airport Authority Airport Enterprise 300,997 4,705,892 - 4,504,353
Riverside March Joint Powers Authority Local and Regional Planning or Development - - 6,163,841 94,227
Riverside March Joint Powers Utilities Authority Electric Enterprise 147,853 - - -
Riverside Mission Springs Water District Waste Disposal Enterprise 3,791,584 4,971,549 - 2,644,225
Riverside Mission Springs Water District Water Enterprise 7,139,048 1,057,489 - 83,408
Riverside Mt. San Jacinto Winter Park Authority Recreation and Park - - 12,736,571 196,919
Riverside Murrieta Valley Cemetery District Cemetery - - 421,372 6,119
Riverside Northwest Mosquito and Vector Control District Pest Control - - 2,945,085 419,182
Riverside Palm Springs Cemetery District Cemetery - - 1,177,110 137,413
Riverside Palm Springs Desert Resort Communities Convention and Visitors AuthorityGovernmental Services - - 13,156,734 12,551,798
Riverside Palo Verde Cemetery District Cemetery - - 249,508 21,451
Riverside Palo Verde Irrigation District Water Enterprise 6,027,708 1,044,364 - 188,812
Riverside Palo Verde Resource Conservation District Flood Control and Water Conservation - - 4 -
Riverside Palo Verde Valley Library District Library Services - - 272,220 2,713
Riverside Palo Verde Valley Transit Agency Transit Enterprise 894,557 - - 792,074
Riverside Pine Cove Water District Water Enterprise 463,545 323,501 - 1,615
Riverside Pinyon Pines County Water District Water Enterprise 49,874 - - -
Riverside Public Entity Risk Management Authority (PERMA) Self Insurance - - 6,411,566 274,559
Riverside Rancho California Water District Waste Disposal Enterprise 6,640,661 703,854 - 13,999
Riverside Rancho California Water District Water Enterprise 62,100,741 43,623,469 - 1,560,647
Riverside Riverside County Employer / Employee Partnership For BenefitsSelf Insurance - - 245,538,104 -
Riverside Riverside County Habitat Conservation Agency Resource Conservation - - 739,507 685,296
Riverside Riverside County Waste Resources Management District Waste Disposal Enterprise 3,716,943 285 - -
Riverside Riverside Schools Insurance Authority Self Insurance - - 8,402,494 -
Riverside Riverside Schools Risk Management Authority Self Insurance - - 22,440,809 -
Riverside Riverside Transit Agency Transit Enterprise 44,920,531 - - 34,289,174
Riverside Riverside Transit Agency - Specialized Service Transit Enterprise 11,108,673 - - 9,277,393
Riverside Riverside-Corona Resource Conservation District Resource Conservation - - 2,044,344 91,976
Riverside Rubidoux Community Services District Fire Protection - - 3,593,035 978,115
Riverside Rubidoux Community Services District Waste Disposal Enterprise 5,046,257 8,485 - -
Riverside Rubidoux Community Services District Water Enterprise 5,505,330 30,296 - 7,585
Riverside Salton Sea Authority Resource Conservation - - 931,305 320,544
SCO_LAFCO FY 2014 Page 43 of 77 07/29/15

California State Controller's Office List includes only independent special districts
Data For LAFCO Fee Calculations Total Intergovernmental Revenues includes Federal,
Source: Special Districts Financial Transactions Report, Fiscal Year 2013-14 State, and Other Intergovernmental Agencies
Principal County Independent Special District Name Activity
Enterprise
Operating
Revenues
Enterprise
Non-Operating
Revenues
Non-Enterprise
General Purpose
Revenues
Total Inter
Governmental
Revenues
Riverside San Gorgonio Pass Water Agency Water Enterprise 2,443,119 16,551,390 - 215,421
Riverside San Jacinto Basin Resource Conservation District Resource Conservation - - 414,312 2,122
Riverside San Jacinto Valley Cemetery District Cemetery - - 853,271 71,512
Riverside Santa Ana Watershed Project Authority Waste Disposal Enterprise 11,243,430 3,085,758 - 283,245
Riverside Southern California Schools Regional Liability Excess Fund Self Insurance - - 31,374,804 -
Riverside Southern Coachella Valley Community Services District Police Protection and Personal Safety - - 790,498 -
Riverside Summit Cemetery District Cemetery - - 1,302,884 155,237
Riverside Sunline Services Group Governmental Services - - 502,306 -
Riverside Sunline Transit Agency Transit Enterprise 25,253,260 - - 20,202,220
Riverside Temecula Cemetery District Cemetery - - 866,736 12,413
Riverside Tenaja Community Services District Streets and Roads - Construction and Maintenance- - 134,911 -
Riverside Valley Health System Health - - 2,073,585 -
Riverside Valley Sanitary District (Riverside) Waste Disposal Enterprise 11,272,450 693,233 - 6,604
Riverside Valley-Wide Recreation and Park District Recreation and Park - - 14,415,027 709,631
Riverside Van Horn Regional Treatment Facility Governmental Services - - 922 -
Riverside Water Employee Services Authority Governmental Services - - 21,171,969 21,171,969
Riverside Western Municipal Water District Waste Disposal Enterprise 10,407,161 322,648 - -
Riverside Western Municipal Water District Water Enterprise 99,447,026 32,487,934 - 12,103,259
Riverside Western Riverside County Regional Conservation Authority Resource Conservation - - 3,464,151 3,229,119
Riverside Western Riverside County Regional Wastewater Authority Waste Disposal Enterprise 4,933,153 13,216 - -
Sacramento Alpha Fund Joint Powers Agency Self Insurance - - 42,743,782 -
Sacramento American River Flood Control District Flood Control and Water Conservation - - 2,348,681 650,000
Sacramento Arcade Creek Recreation and Park District Recreation and Park - - 870,345 264,839
Sacramento Arden Manor Recreation and Park District Recreation and Park - - 664,954 4,294
Sacramento Arden Park Recreation and Park District Recreation and Park - - 818,516 4,350
Sacramento Area 4 Agency on Aging Local and Regional Planning or Development - - 8,837,972 8,837,972
Sacramento Association of California Water Agencies Joint Powers Insurance AuthoritySelf Insurance - - 140,452,408 -
Sacramento Brannan-Andrus Levee Maintenance (Sacramento) Flood Control and Water Conservation - - 742,398 199,851
Sacramento California Affiliated Risk Management Authorities (CARMA) Self Insurance - - 7,336,322 -
Sacramento California Association for Park and Recreation Insurance Self Insurance - - 6,743,715 -
Sacramento California Fair Service Authority Self Insurance - - 7,902,724 -
Sacramento California Fire and Rescue Training Authority Governmental Services - - 6,065,712 3,600,000
Sacramento California Mental Health Services Authority Health - - 1,463,865 1,463,865
Sacramento California Residential Mitigation Program (CRMP) Governmental Services - - 1,000,000 1,000,000
Sacramento California Transit Systems Joint Powers Insurance Authority Self Insurance - - 7,297,743 -
Sacramento CalTRUST Governmental Services - - 129,724 -
Sacramento Capital South East Connector Authority Streets and Roads - Construction and Maintenance- - 1,733,860 1,733,507
Sacramento Capitol Area Development Authority Financing or Constructing Facilities - - 10,422,709 34,928
Sacramento Carmichael Water District Water Enterprise 9,666,748 142,104 - 341
Sacramento Central Valley Financing Authority Electric Enterprise 40,268,906 52,643 - -
Sacramento Citrus Heights Water District Water Enterprise 11,358,086 42,975 - 3,178
Sacramento Clay Water District Water Enterprise - 884 - 10
SCO_LAFCO FY 2014 Page 44 of 77 07/29/15

California State Controller's Office List includes only independent special districts
Data For LAFCO Fee Calculations Total Intergovernmental Revenues includes Federal,
Source: Special Districts Financial Transactions Report, Fiscal Year 2013-14 State, and Other Intergovernmental Agencies
Principal County Independent Special District Name Activity
Enterprise
Operating
Revenues
Enterprise
Non-Operating
Revenues
Non-Enterprise
General Purpose
Revenues
Total Inter
Governmental
Revenues
Sacramento Cooperative Agricultural Support Services Authority Governmental Services - - 19,737,026 41,540
Sacramento Cooperative Personnel Services Governmental Services - - 24,761,670 -
Sacramento Cordova Recreation and Park District Recreation and Park - - 10,201,738 147,243
Sacramento Cosumnes Community Services District Ambulance Service - - 7,181,029 -
Sacramento Cosumnes Community Services District Fire Protection - - 36,522,384 1,407,346
Sacramento Cosumnes Community Services District Lighting and Lighting Maintenance - - 14,900,724 -
Sacramento Cosumnes Community Services District Recreation and Park - - 8,267,231 126,291
Sacramento Courtland Fire Protection District Fire Protection - - 140,501 10,720
Sacramento CSAC Excess Insurance Authority Self Insurance - - 580,207,501 -
Sacramento Del Paso Manor Water District Water Enterprise 1,450,860 1,788 - -
Sacramento Delta Fire Protection District (Sacramento) Fire Protection - - 161,569 944
Sacramento Elk Grove-Cosumnes Cemetery District Cemetery - - 966,662 8,558
Sacramento Employment Risk Management Authority (ERMA) Self Insurance - - 5,984,260 -
Sacramento Fair Oaks Cemetery District Cemetery - - 687,794 2,438
Sacramento Fair Oaks Recreation and Park District Recreation and Park - - 2,630,956 17,739
Sacramento Fair Oaks Water District Water Enterprise 8,407,892 346,243 - -
Sacramento Fire Agencies Self Insurance System (FASIS) Self Insurance - - 5,327,878 -
Sacramento Fire District Association of California Employment Benefits AuthoritySelf Insurance - - 6,626,148 -
Sacramento Florin County Water District Water Enterprise 1,472,955 1,562 - -
Sacramento Florin Resource Conservation District Resource Conservation - - 93,229 -
Sacramento Florin Resource Conservation District Water Enterprise 13,433,371 1,163,715 - -
Sacramento Freeport Regional Water Authority Water Enterprise 867,948 6,814 - -
Sacramento Fulton-El Camino Recreation and Park District Recreation and Park - - 2,801,988 489,742
Sacramento Galt Irrigation District Water Enterprise - 18,268 - 189
Sacramento Galt Schools Joint Powers Authority Financing or Constructing Facilities - - 214,227 -
Sacramento Galt-Arno Cemetery District Cemetery - - 267,350 1,600
Sacramento Herald Fire Protection District Fire Protection - - 624,077 7,605
Sacramento Human Rights / Fair Housing Commission of the City and County of SacramentoGovernmental Services - - 551,631 541,829
Sacramento Lower Cosumnes Resource Conservation District Resource Conservation - - 88,494 -
Sacramento Nor-Cal Schools Joint Powers Association Governmental Services - - 3,900 -
Sacramento North Delta Water Agency Water Enterprise 906,803 850 - -
Sacramento North Highlands Recreation and Park District Recreation and Park - - 1,452,192 71,736
Sacramento Northern California Gas Authority No. 1 Electric Enterprise 37,912,548 610,588 - -
Sacramento Northern California Municipal Power Corporation No. 2 Electric Enterprise 3,838,455 - - -
Sacramento Northern California Municipal Power Corporation No. 3 Electric Enterprise 8,362,285 - - -
Sacramento Northern California Power Agency Electric Enterprise 392,984,229 3,648,569 - -
Sacramento Northern California Regional Public Safety Training Authority Governmental Services - - 1,893,996 682,455
Sacramento Northern California Special Districts Insurance Authority Self Insurance - - 2,102,158 -
Sacramento Omochumne - Hartnell Water District Water Enterprise - 120,274 - 1,500
Sacramento Orangevale Recreation and Park District Recreation and Park - - 2,780,584 139,696
Sacramento Pacific Fruitridge Fire Protection District Fire Protection - - 2,845,746 34,897
Sacramento Public Agency Risk Sharing Authority of California (PARSAC)Self Insurance - - 11,093,150 2,227,573
SCO_LAFCO FY 2014 Page 45 of 77 07/29/15

California State Controller's Office List includes only independent special districts
Data For LAFCO Fee Calculations Total Intergovernmental Revenues includes Federal,
Source: Special Districts Financial Transactions Report, Fiscal Year 2013-14 State, and Other Intergovernmental Agencies
Principal County Independent Special District Name Activity
Enterprise
Operating
Revenues
Enterprise
Non-Operating
Revenues
Non-Enterprise
General Purpose
Revenues
Total Inter
Governmental
Revenues
Sacramento Rancho Murieta Community Services District Drainage and Drainage Maintenance - - 212,806 432
Sacramento Rancho Murieta Community Services District Police Protection and Personal Safety - - 1,343,425 1,437
Sacramento Rancho Murieta Community Services District Waste Disposal Enterprise 1,877,732 573,203 - 2,457
Sacramento Rancho Murieta Community Services District Water Enterprise 1,808,698 848,094 - 2,754
Sacramento Reclamation District No. 1000 Land Reclamation and Levee Maintenance - - 5,176,033 1,790,857
Sacramento Reclamation District No. 1002 Land Reclamation and Levee Maintenance - - 104,490 -
Sacramento Reclamation District No. 1601 Land Reclamation and Levee Maintenance - - 2,260,679 1,891,364
Sacramento Reclamation District No. 2067 Land Reclamation and Levee Maintenance - - 150,956 -
Sacramento Reclamation District No. 2110 Land Reclamation and Levee Maintenance - - 88,291 16,025
Sacramento Reclamation District No. 2111 Land Reclamation and Levee Maintenance - - 10,000 -
Sacramento Reclamation District No. 3 Land Reclamation and Levee Maintenance - - 1,005,061 410,191
Sacramento Reclamation District No. 317 Drainage and Drainage Maintenance - - 83,543 -
Sacramento Reclamation District No. 341 Land Reclamation and Levee Maintenance - - 8,313,861 7,666,550
Sacramento Reclamation District No. 349 Drainage and Drainage Maintenance - - 51,202 -
Sacramento Reclamation District No. 407 Drainage and Drainage Maintenance - - 81,004 -
Sacramento Reclamation District No. 551 Land Reclamation and Levee Maintenance - - 180,667 -
Sacramento Reclamation District No. 554 Land Reclamation and Levee Maintenance - - 39,715 -
Sacramento Reclamation District No. 556 Land Reclamation and Levee Maintenance - - 64,146 -
Sacramento Reclamation District No. 563 Land Reclamation and Levee Maintenance - - 689,269 98,323
Sacramento Reclamation District No. 744 Drainage and Drainage Maintenance - - 21,906 -
Sacramento Reclamation District No. 755 Drainage and Drainage Maintenance - - 19,399 -
Sacramento Reclamation District No. 800 (Sacramento) Land Reclamation and Levee Maintenance - - 194,503 -
Sacramento Regional Water Authority Water Enterprise 1,020,185 3,509,542 - 3,417,499
Sacramento Rio Linda-Elverta Community Water District Water Enterprise 2,435,088 677,134 - 10
Sacramento Rio Linda-Elverta Parks and Recreation Area (Sacramento) Recreation and Park - - 1,007,833 54,082
Sacramento River Delta Fire District Fire Protection - - 165,432 1,846
Sacramento Rural Counties Environmental Services Joint Powers AuthorityGovernmental Services - - 182,898 74,227
Sacramento Sacramento Area Flood Control Agency Flood Control and Water Conservation - - 6,338,143 -
Sacramento Sacramento Area Sewer District Waste Disposal Enterprise 100,139,399 5,200,438 - -
Sacramento Sacramento Central Groundwater Authority Resource Conservation - - 245,086 244,222
Sacramento Sacramento Cogeneration Authority Electric Enterprise 66,724,841 4,756 - -
Sacramento Sacramento Groundwater Authority Local and Regional Planning or Development - - 522,213 -
Sacramento Sacramento Metropolitan Air Quality Management District Air Pollution Control - - 23,961,837 17,064,626
Sacramento Sacramento Metropolitan Cable Television Commission Governmental Services - - 15,701,831 -
Sacramento Sacramento Metropolitan Fire District Fire Protection - - 171,096,985 16,615,891
Sacramento Sacramento Municipal Utility District Electric Enterprise 1,428,395,423 61,613,065 - 25,651,429
Sacramento Sacramento Municipal Utility District Financing Authority Electric Enterprise 242,511,392 143,271 - -
Sacramento Sacramento Power Authority Electric Enterprise 65,310,204 26,179 - -
Sacramento Sacramento Public Library Authority Library Services - - 34,369,421 8,774,422
Sacramento Sacramento Regional County Sanitary (Sacramento) Waste Disposal Enterprise 198,457,522 8,762,737 - 11,522
Sacramento Sacramento Regional Public Safety Communications Center Governmental Services - - 8,554,148 -
Sacramento Sacramento Regional Transit System Transit Enterprise 144,006,061 - - 104,515,228
SCO_LAFCO FY 2014 Page 46 of 77 07/29/15
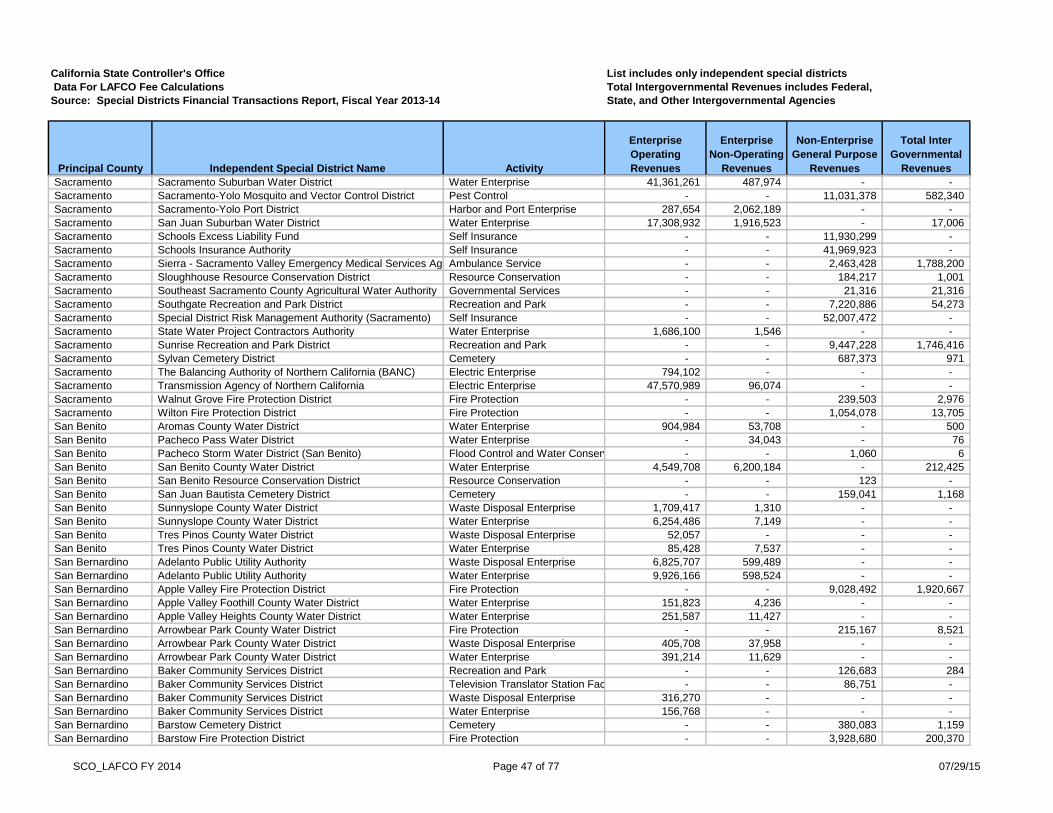
California State Controller's Office List includes only independent special districts
Data For LAFCO Fee Calculations Total Intergovernmental Revenues includes Federal,
Source: Special Districts Financial Transactions Report, Fiscal Year 2013-14 State, and Other Intergovernmental Agencies
Principal County Independent Special District Name Activity
Enterprise
Operating
Revenues
Enterprise
Non-Operating
Revenues
Non-Enterprise
General Purpose
Revenues
Total Inter
Governmental
Revenues
Sacramento Sacramento Suburban Water District Water Enterprise 41,361,261 487,974 - -
Sacramento Sacramento-Yolo Mosquito and Vector Control District Pest Control - - 11,031,378 582,340
Sacramento Sacramento-Yolo Port District Harbor and Port Enterprise 287,654 2,062,189 - -
Sacramento San Juan Suburban Water District Water Enterprise 17,308,932 1,916,523 - 17,006
Sacramento Schools Excess Liability Fund Self Insurance - - 11,930,299 -
Sacramento Schools Insurance Authority Self Insurance - - 41,969,923 -
Sacramento Sierra - Sacramento Valley Emergency Medical Services AgencyAmbulance Service - - 2,463,428 1,788,200
Sacramento Sloughhouse Resource Conservation District Resource Conservation - - 184,217 1,001
Sacramento Southeast Sacramento County Agricultural Water Authority Governmental Services - - 21,316 21,316
Sacramento Southgate Recreation and Park District Recreation and Park - - 7,220,886 54,273
Sacramento Special District Risk Management Authority (Sacramento) Self Insurance - - 52,007,472 -
Sacramento State Water Project Contractors Authority Water Enterprise 1,686,100 1,546 - -
Sacramento Sunrise Recreation and Park District Recreation and Park - - 9,447,228 1,746,416
Sacramento Sylvan Cemetery District Cemetery - - 687,373 971
Sacramento The Balancing Authority of Northern California (BANC) Electric Enterprise 794,102 - - -
Sacramento Transmission Agency of Northern California Electric Enterprise 47,570,989 96,074 - -
Sacramento Walnut Grove Fire Protection District Fire Protection - - 239,503 2,976
Sacramento Wilton Fire Protection District Fire Protection - - 1,054,078 13,705
San Benito Aromas County Water District Water Enterprise 904,984 53,708 - 500
San Benito Pacheco Pass Water District Water Enterprise - 34,043 - 76
San Benito Pacheco Storm Water District (San Benito) Flood Control and Water Conservation - - 1,060 6
San Benito San Benito County Water District Water Enterprise 4,549,708 6,200,184 - 212,425
San Benito San Benito Resource Conservation District Resource Conservation - - 123 -
San Benito San Juan Bautista Cemetery District Cemetery - - 159,041 1,168
San Benito Sunnyslope County Water District Waste Disposal Enterprise 1,709,417 1,310 - -
San Benito Sunnyslope County Water District Water Enterprise 6,254,486 7,149 - -
San Benito Tres Pinos County Water District Waste Disposal Enterprise 52,057 - - -
San Benito Tres Pinos County Water District Water Enterprise 85,428 7,537 - -
San Bernardino Adelanto Public Utility Authority Waste Disposal Enterprise 6,825,707 599,489 - -
San Bernardino Adelanto Public Utility Authority Water Enterprise 9,926,166 598,524 - -
San Bernardino Apple Valley Fire Protection District Fire Protection - - 9,028,492 1,920,667
San Bernardino Apple Valley Foothill County Water District Water Enterprise 151,823 4,236 - -
San Bernardino Apple Valley Heights County Water District Water Enterprise 251,587 11,427 - -
San Bernardino Arrowbear Park County Water District Fire Protection - - 215,167 8,521
San Bernardino Arrowbear Park County Water District Waste Disposal Enterprise 405,708 37,958 - -
San Bernardino Arrowbear Park County Water District Water Enterprise 391,214 11,629 - -
San Bernardino Baker Community Services District Recreation and Park - - 126,683 284
San Bernardino Baker Community Services District Television Translator Station Facilities - - 86,751 -
San Bernardino Baker Community Services District Waste Disposal Enterprise 316,270 - - -
San Bernardino Baker Community Services District Water Enterprise 156,768 - - -
San Bernardino Barstow Cemetery District Cemetery - - 380,083 1,159
San Bernardino Barstow Fire Protection District Fire Protection - - 3,928,680 200,370
SCO_LAFCO FY 2014 Page 47 of 77 07/29/15

California State Controller's Office List includes only independent special districts
Data For LAFCO Fee Calculations Total Intergovernmental Revenues includes Federal,
Source: Special Districts Financial Transactions Report, Fiscal Year 2013-14 State, and Other Intergovernmental Agencies
Principal County Independent Special District Name Activity
Enterprise
Operating
Revenues
Enterprise
Non-Operating
Revenues
Non-Enterprise
General Purpose
Revenues
Total Inter
Governmental
Revenues
San Bernardino Barstow Heights Community Services District Recreation and Park - - 105,241 701
San Bernardino Big Bear Airport District Airport Enterprise 633,370 1,238,687 - 90,595
San Bernardino Big Bear Area Regional Wastewater Agency Waste Disposal Enterprise 5,106,951 11,305 - -
San Bernardino Big Bear City Community Services District Ambulance Service - - 1,511,635 61,435
San Bernardino Big Bear City Community Services District Fire Protection - - 3,986,359 503,867
San Bernardino Big Bear City Community Services District Waste Disposal Enterprise 4,131,183 24,670 - -
San Bernardino Big Bear City Community Services District Water Enterprise 3,158,296 8,453 - -
San Bernardino Big Bear Fire Authority Fire Protection - - 896,724 -
San Bernardino Big Bear Municipal Water District Pest Control - - 168,181 -
San Bernardino Big Bear Municipal Water District Recreation and Park - - 938,986 -
San Bernardino Big Bear Municipal Water District Water Enterprise 382,512 3,165,630 - 38,596
San Bernardino Big River Community Services District Recreation and Park - - 119,240 36
San Bernardino Bighorn-Desert View Water Agency Water Enterprise 1,089,864 440,174 - 102,378
San Bernardino California Educational Computer Consortium Joint Powers AuthorityGovernmental Services - - 5,081,986 -
San Bernardino California Schools Employee Benefit Association Self Insurance - - 143,126,337 -
San Bernardino California Statewide Automated Welfare System Consortium IVGovernmental Services - - 132,967,334 132,967,334
San Bernardino Chino Basin Desalter Authority (CDA) Water Enterprise 36,181,313 7,561,442 - 7,038,028
San Bernardino Chino Basin Water Conservation District Flood Control and Water Conservation - - 2,232,295 746,256
San Bernardino Chino Valley Independent Fire District Fire Protection - - 29,821,726 766,635
San Bernardino Colton/San Bernardino Regional Tertiary Treatment and Water Reclamation AuthorityWaste Disposal Enterprise 4,236,137 - - -
San Bernardino Consolidated Fire Agencies Fire Protection - - 9,181,918 9,239
San Bernardino Crest Forest Fire Protection District Ambulance Service - - 753,330 -
San Bernardino Crest Forest Fire Protection District Fire Protection - - 3,686,615 49,422
San Bernardino Crestline County Sanitation District (San Bernardino) Waste Disposal Enterprise 2,564,903 1,140,024 - 23,090
San Bernardino Crestline Village Water District Water Enterprise 2,428,429 426,997 - 24,021
San Bernardino Crestline-Lake Arrowhead Water Agency Water Enterprise 3,153,862 1,956,197 - 23,752
San Bernardino Cucamonga Valley Water District Waste Disposal Enterprise 15,228,576 240,648 - -
San Bernardino Cucamonga Valley Water District Water Enterprise 68,197,649 3,102,727 - -
San Bernardino Daggett Community Services District Fire Protection - - 41,455 352
San Bernardino Daggett Community Services District Lighting and Lighting Maintenance - - 4,145 35
San Bernardino Daggett Community Services District Recreation and Park - - 58,036 493
San Bernardino Daggett Community Services District Water Enterprise 190,388 3 - -
San Bernardino East Valley Water District Waste Disposal Enterprise 11,900,106 77,489 - -
San Bernardino East Valley Water District Water Enterprise 20,754,416 115,444 - -
San Bernardino Frontier Project Foundation Governmental Services - - 57,951 -
San Bernardino Helendale Community Services District Recreation and Park - - 555,576 41,310
San Bernardino Helendale Community Services District Waste Disposal Enterprise 1,305,580 247,535 - -
San Bernardino Helendale Community Services District Water Enterprise 1,593,642 26,200 - -
San Bernardino Hesperia Recreation and Park District Recreation and Park - - 7,233,671 872,250
San Bernardino Hi-Desert Water District Water Enterprise 8,828,942 1,961,860 - 13,634
San Bernardino High Desert Corridor Joint Powers Authority Streets and Roads - Construction and Maintenance- - 1,183 -
San Bernardino High Desert Schools Joint Powers Authority Self Insurance - - 5,244,507 -
SCO_LAFCO FY 2014 Page 48 of 77 07/29/15
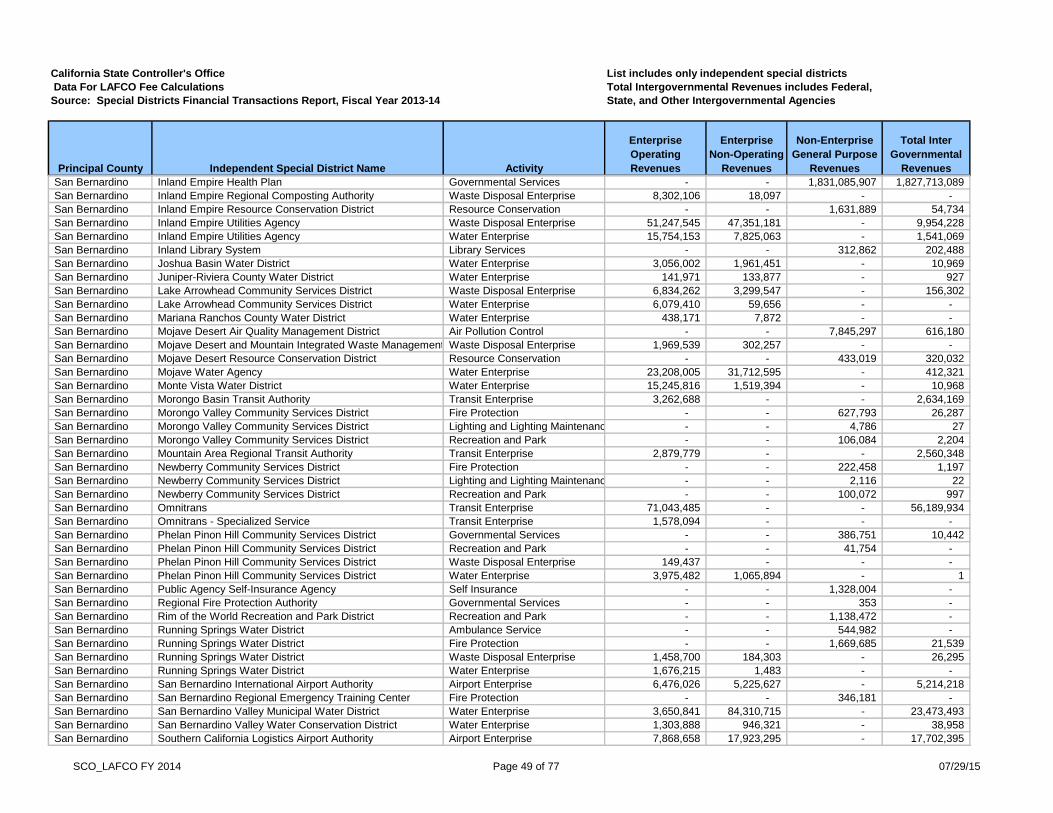
California State Controller's Office List includes only independent special districts
Data For LAFCO Fee Calculations Total Intergovernmental Revenues includes Federal,
Source: Special Districts Financial Transactions Report, Fiscal Year 2013-14 State, and Other Intergovernmental Agencies
Principal County Independent Special District Name Activity
Enterprise
Operating
Revenues
Enterprise
Non-Operating
Revenues
Non-Enterprise
General Purpose
Revenues
Total Inter
Governmental
Revenues
San Bernardino Inland Empire Health Plan Governmental Services - - 1,831,085,907 1,827,713,089
San Bernardino Inland Empire Regional Composting Authority Waste Disposal Enterprise 8,302,106 18,097 - -
San Bernardino Inland Empire Resource Conservation District Resource Conservation - - 1,631,889 54,734
San Bernardino Inland Empire Utilities Agency Waste Disposal Enterprise 51,247,545 47,351,181 - 9,954,228
San Bernardino Inland Empire Utilities Agency Water Enterprise 15,754,153 7,825,063 - 1,541,069
San Bernardino Inland Library System Library Services - - 312,862 202,488
San Bernardino Joshua Basin Water District Water Enterprise 3,056,002 1,961,451 - 10,969
San Bernardino Juniper-Riviera County Water District Water Enterprise 141,971 133,877 - 927
San Bernardino Lake Arrowhead Community Services District Waste Disposal Enterprise 6,834,262 3,299,547 - 156,302
San Bernardino Lake Arrowhead Community Services District Water Enterprise 6,079,410 59,656 - -
San Bernardino Mariana Ranchos County Water District Water Enterprise 438,171 7,872 - -
San Bernardino Mojave Desert Air Quality Management District Air Pollution Control - - 7,845,297 616,180
San Bernardino Mojave Desert and Mountain Integrated Waste Management AuthorityWaste Disposal Enterprise 1,969,539 302,257 - -
San Bernardino Mojave Desert Resource Conservation District Resource Conservation - - 433,019 320,032
San Bernardino Mojave Water Agency Water Enterprise 23,208,005 31,712,595 - 412,321
San Bernardino Monte Vista Water District Water Enterprise 15,245,816 1,519,394 - 10,968
San Bernardino Morongo Basin Transit Authority Transit Enterprise 3,262,688 - - 2,634,169
San Bernardino Morongo Valley Community Services District Fire Protection - - 627,793 26,287
San Bernardino Morongo Valley Community Services District Lighting and Lighting Maintenance - - 4,786 27
San Bernardino Morongo Valley Community Services District Recreation and Park - - 106,084 2,204
San Bernardino Mountain Area Regional Transit Authority Transit Enterprise 2,879,779 - - 2,560,348
San Bernardino Newberry Community Services District Fire Protection - - 222,458 1,197
San Bernardino Newberry Community Services District Lighting and Lighting Maintenance - - 2,116 22
San Bernardino Newberry Community Services District Recreation and Park - - 100,072 997
San Bernardino Omnitrans Transit Enterprise 71,043,485 - - 56,189,934
San Bernardino Omnitrans - Specialized Service Transit Enterprise 1,578,094 - - -
San Bernardino Phelan Pinon Hill Community Services District Governmental Services - - 386,751 10,442
San Bernardino Phelan Pinon Hill Community Services District Recreation and Park - - 41,754 -
San Bernardino Phelan Pinon Hill Community Services District Waste Disposal Enterprise 149,437 - - -
San Bernardino Phelan Pinon Hill Community Services District Water Enterprise 3,975,482 1,065,894 - 1
San Bernardino Public Agency Self-Insurance Agency Self Insurance - - 1,328,004 -
San Bernardino Regional Fire Protection Authority Governmental Services - - 353 -
San Bernardino Rim of the World Recreation and Park District Recreation and Park - - 1,138,472 -
San Bernardino Running Springs Water District Ambulance Service - - 544,982 -
San Bernardino Running Springs Water District Fire Protection - - 1,669,685 21,539
San Bernardino Running Springs Water District Waste Disposal Enterprise 1,458,700 184,303 - 26,295
San Bernardino Running Springs Water District Water Enterprise 1,676,215 1,483 - -
San Bernardino San Bernardino International Airport Authority Airport Enterprise 6,476,026 5,225,627 - 5,214,218
San Bernardino San Bernardino Regional Emergency Training Center Fire Protection - - 346,181 -
San Bernardino San Bernardino Valley Municipal Water District Water Enterprise 3,650,841 84,310,715 - 23,473,493
San Bernardino San Bernardino Valley Water Conservation District Water Enterprise 1,303,888 946,321 - 38,958
San Bernardino Southern California Logistics Airport Authority Airport Enterprise 7,868,658 17,923,295 - 17,702,395
SCO_LAFCO FY 2014 Page 49 of 77 07/29/15

California State Controller's Office List includes only independent special districts
Data For LAFCO Fee Calculations Total Intergovernmental Revenues includes Federal,
Source: Special Districts Financial Transactions Report, Fiscal Year 2013-14 State, and Other Intergovernmental Agencies
Principal County Independent Special District Name Activity
Enterprise
Operating
Revenues
Enterprise
Non-Operating
Revenues
Non-Enterprise
General Purpose
Revenues
Total Inter
Governmental
Revenues
San Bernardino Southern California Schools Risk Management Self Insurance - - 31,413,322 -
San Bernardino Statewide Association of Community Colleges Self Insurance - - 18,715,403 -
San Bernardino The Animal Care Joint Power Authority Animal Control - - 4,402 -
San Bernardino Thunderbird County Water District Water Enterprise 201,152 282 - -
San Bernardino Twentynine Palms Cemetery District Cemetery - - 227,307 1,626
San Bernardino Twentynine Palms County Water District Fire Protection - - 1,406,051 -
San Bernardino Twentynine Palms County Water District Water Enterprise 4,429,044 297,075 - -
San Bernardino Victor Valley Transit Authority Transit Enterprise 9,140,707 - - 6,868,570
San Bernardino Victor Valley Transit Authority - Specialized Service Transit Enterprise 3,371,520 - - 2,913,586
San Bernardino Victor Valley Wastewater Reclamation Authority Waste Disposal Enterprise 12,268,889 582,714 - 169,664
San Bernardino Victorville Water District Water Enterprise 26,416,439 621,334 - 5,999
San Bernardino Water Facilities Authority Water Enterprise 21,391,980 426,105 - 321,660
San Bernardino West End Communications Authority Governmental Services - - 10,251 -
San Bernardino West End Fire and Emergency Response Commission Governmental Services - - 53,549 -
San Bernardino West Valley Mosquito and Vector Control District Pest Control - - 2,448,089 -
San Bernardino West Valley Water District Water Enterprise 23,132,844 1,707,584 - 367,058
San Bernardino Yermo Community Services District Fire Protection - - 57,936 528
San Bernardino Yermo Community Services District Lighting and Lighting Maintenance - - 10,259 118
San Bernardino Yermo Community Services District Recreation and Park - - 47,005 528
San Bernardino Yucaipa Valley Water District Waste Disposal Enterprise 10,984,358 190,204 - -
San Bernardino Yucaipa Valley Water District Water Enterprise 10,852,653 2,641,101 - 30,423
San Bernardino Yucca Valley Airport District Airport Enterprise 67,402 12 - -
San Diego Alpine Fire Protection District Fire Protection - - 3,562,164 165,282
San Diego Automated Regional Justice Information System (ARJIS) Governmental Services - - 6,305,682 1,757,465
San Diego Bonita-Sunnyside Fire Protection District Fire Protection - - 2,616,368 25,399
San Diego Borrego Springs Fire Protection District Fire Protection - - 1,864,539 1
San Diego Borrego Water District Waste Disposal Enterprise 539,013 4 - -
San Diego Borrego Water District Water Enterprise 2,868,506 19,736 - (43,641)
San Diego Canebrake County Water District Water Enterprise 31,176 15,277 - 210
San Diego Cuyamaca Water District Water Enterprise 78,460 16 - -
San Diego Deer Springs Fire Protection District Fire Protection - - 4,482,322 3,464
San Diego Del Mar Race Track Authority Financing or Constructing Facilities - - 8,366,206 2,198,265
San Diego Descanso Community Water District Water Enterprise 396,653 - - -
San Diego Encina Wastewater Authority Waste Disposal Enterprise 13,446,624 8,227 - -
San Diego Encinitas Ranch Golf Authority Recreation and Park - - 4,172,023 -
San Diego Fairbanks Ranch Community Services District Waste Disposal Enterprise 615,916 5,763 - -
San Diego Fallbrook Public Utility District Waste Disposal Enterprise 6,112,664 768,551 - 6,791
San Diego Fallbrook Public Utility District Water Enterprise 24,167,511 3,229,597 - 7,491
San Diego Grossmont Healthcare District Health - - 6,680,300 437,348
San Diego Heartland Communications Facility Authority Governmental Services - - 2,316,403 87,838
San Diego Heartland Fire Training Authority Fire Protection - - 836,730 353,227
San Diego Helix Water District Water Enterprise 77,068,099 4,333,957 - -
SCO_LAFCO FY 2014 Page 50 of 77 07/29/15

California State Controller's Office List includes only independent special districts
Data For LAFCO Fee Calculations Total Intergovernmental Revenues includes Federal,
Source: Special Districts Financial Transactions Report, Fiscal Year 2013-14 State, and Other Intergovernmental Agencies
Principal County Independent Special District Name Activity
Enterprise
Operating
Revenues
Enterprise
Non-Operating
Revenues
Non-Enterprise
General Purpose
Revenues
Total Inter
Governmental
Revenues
San Diego Imperial Valley Schools Joint Powers Authority (IVSJPA) Self Insurance - - 506,894 -
San Diego Jacumba Community Services District Water Enterprise 260,420 12 - -
San Diego Julian Community Services District Water Enterprise 197,526 55,240 - 1
San Diego Julian-Cuyamaca Fire Protection District Fire Protection - - 547,568 58,818
San Diego Lake Cuyamaca Recreation and Park District Recreation and Park - - 1,552,718 -
San Diego Lakeside Fire Protection District Fire Protection - - 13,164,881 817,924
San Diego Lakeside Water District Water Enterprise 7,708,049 813,549 - 3,704
San Diego Leucadia Wastewater District Waste Disposal Enterprise 9,330,135 1,478,637 - 11,201
San Diego Lower Sweetwater Fire Protection District Fire Protection - - 279,636 2,998
San Diego Majestic Pines Community Services District Water Enterprise 458,668 15,966 - -
San Diego Metro Wastewater JPA Financing or Constructing Facilities - - 228,570 228,515
San Diego Mission Resource Conservation District Resource Conservation - - 1,115,456 661,799
San Diego Mootamai Municipal Water District Fire Protection - - 16,413 169
San Diego Morro Hills Community Services District Streets and Roads - Construction and Maintenance- - 66,024 624
San Diego North County Cemetery District Cemetery - - 1,458,741 175,523
San Diego North County Dispatch Joint Powers Agency Governmental Services - - 3,654,659 108,665
San Diego North County Fire Protection District (San Diego) Fire Protection - - 13,529,801 234,790
San Diego North San Diego County Transit District Transit Enterprise 88,063,767 - - 56,922,462
San Diego North San Diego County Transit District-Specialized Service Transit Enterprise 4,789,180 - - 4,415,711
San Diego Olivenhain Municipal Water District Electric Enterprise 111,159 - - -
San Diego Olivenhain Municipal Water District Waste Disposal Enterprise 4,278,537 78,213 - -
San Diego Olivenhain Municipal Water District Water Enterprise 49,863,124 8,562,331 - 373,010
San Diego Otay Water District Waste Disposal Enterprise 2,838,672 64,150 - 1
San Diego Otay Water District Water Enterprise 83,431,124 7,460,764 - 31,383
San Diego Padre Dam Municipal Water District Recreation and Park - - 4,896,914 -
San Diego Padre Dam Municipal Water District Waste Disposal Enterprise 15,964,703 56,491 - -
San Diego Padre Dam Municipal Water District Water Enterprise 43,629,534 2,784,173 - 22,950
San Diego Pauma Municipal Water District Water Enterprise - 16,329 - 12
San Diego Pauma Valley Community Services District Police Protection and Personal Safety - - 910,643 10,507
San Diego Pauma Valley Community Services District Waste Disposal Enterprise 421,765 48,901 - -
San Diego Pine Valley Fire Protection District Fire Protection - - 380,327 163,606
San Diego Pomerado Cemetery District Cemetery - - 1,035,107 11,732
San Diego Public Agencies Self Insurance System Self Insurance - - 12,590 -
San Diego Quantification Settlement Agreement Joint Powers Authority Governmental Services - - 8,405,365 -
San Diego Questhaven Municipal Water District Water Enterprise 4,200 - - -
San Diego R.E. Badger Water Facilities Financing Authority Financing or Constructing Facilities - - 1,991,976 -
San Diego Rainbow Municipal Water District Waste Disposal Enterprise 2,683,334 118,199 - 217
San Diego Rainbow Municipal Water District Water Enterprise 37,448,990 351,947 - 3,207
San Diego Ramona Cemetery District Cemetery - - 259,444 1,600
San Diego Ramona Municipal Water District Fire Protection - - 5,335,968 20,009
San Diego Ramona Municipal Water District Recreation and Park - - 116,703 -
San Diego Ramona Municipal Water District Waste Disposal Enterprise 5,415,485 1,594,876 - 15,983
SCO_LAFCO FY 2014 Page 51 of 77 07/29/15

California State Controller's Office List includes only independent special districts
Data For LAFCO Fee Calculations Total Intergovernmental Revenues includes Federal,
Source: Special Districts Financial Transactions Report, Fiscal Year 2013-14 State, and Other Intergovernmental Agencies
Principal County Independent Special District Name Activity
Enterprise
Operating
Revenues
Enterprise
Non-Operating
Revenues
Non-Enterprise
General Purpose
Revenues
Total Inter
Governmental
Revenues
San Diego Ramona Municipal Water District Water Enterprise 18,083,284 1,755,478 - 132,900
San Diego Rancho Santa Fe Community Services District Lighting and Lighting Maintenance - - 143,369 1,271
San Diego Rancho Santa Fe Community Services District Streets and Roads - Construction and Maintenance- - 573,479 5,085
San Diego Rancho Santa Fe Community Services District Waste Disposal Enterprise 2,538,015 187,882 - 442
San Diego Rancho Santa Fe Fire Protection District Fire Protection - - 12,898,270 761,018
San Diego Regional Solid Waste Association (RSWA) Waste Disposal Enterprise 275,120 3,394 - -
San Diego Resource Conservation District of Greater San Diego County Resource Conservation - - 1,073,558 811,605
San Diego Rincon Del Diablo Municipal Water District Fire Protection - - 1,889,031 25,130
San Diego Rincon Del Diablo Municipal Water District Water Enterprise 15,261,104 914,899 - 23,977
San Diego Rincon Ranch Community Services District Streets and Roads - Construction and Maintenance- - 42,824 733
San Diego Rural Fire Protection District Fire Protection - - 2,200,384 651,847
San Diego San Diego Area Housing and Finance Agency Governmental Services - - 45 -
San Diego San Diego City Schools Financing Authority Financing or Constructing Facilities - - 160,755 -
San Diego San Diego Convention Center Corporation, Inc. Governmental Services - - 35,996,407 3,405,000
San Diego San Diego County Regional Airport Authority Airport Enterprise 195,736,837 89,893,874 - 3,924,332
San Diego San Diego County Schools Fringe Benefits Consortium Self Insurance - - 57,439,008 -
San Diego San Diego County Schools Risk Management Joint Powers AuthoritySelf Insurance - - 38,264,577 -
San Diego San Diego County Water Authority Electric Enterprise 3,860,169 - - -
San Diego San Diego County Water Authority Water Enterprise 647,882,886 36,358,724 - 11,481,700
San Diego San Diego Data Processing Corporation, Inc. Governmental Services - - 402,333 -
San Diego San Diego Geographic Information Source District Governmental Services - - 1,183,282 988,954
San Diego San Diego Metropolitan Transit System Transit Enterprise 65,958,835 - - 39,933,367
San Diego San Diego Pooled Insurance Program Self Insurance - - 8,756,545 -
San Diego San Diego Regional Building Authority Financing or Constructing Facilities - - 1,867,631 -
San Diego San Diego Transit Corporation Transit Enterprise 84,537,215 - - 56,721,647
San Diego San Diego Trolley Inc. Transit Enterprise 70,857,452 - - 29,413,415
San Diego San Diego Unified Port District Harbor and Port Enterprise 143,536,420 14,296,128 - 4,165,518
San Diego San Dieguito River Valley Regional Open Space Park Joint Powers AuthorityRecreation and Park - - 1,896,544 1,142,334
San Diego San Elijo Joint Powers Authority Waste Disposal Enterprise 6,294,813 2,272,689 - 802,738
San Diego San Luis Rey Municipal Water District Water Enterprise 62,522 2,976 - 22
San Diego San Miguel Consolidated Fire Protection District Fire Protection - - 19,247,492 1,009,829
San Diego Santa Fe Irrigation District Water Enterprise 23,687,101 2,379,528 - 20,219
San Diego Serra Cooperative Library System Library Services - - 325,315 324,047
San Diego South Bay Irrigation District Water Enterprise - 2,146 - -
San Diego Southern California Intergovernmental Training and Develop CenterLocal and Regional Planning or Development - - 4,494,070 -
San Diego Sweetwater Authority Water Enterprise 54,605,475 1,398,161 - -
San Diego Unified San Diego County Emergency Services Organization Governmental Services - - 307,210 307,071
San Diego Upper San Luis Rey Resource Conservation District Resource Conservation - - 33,824 222
San Diego Vallecitos Water District Waste Disposal Enterprise 16,750,506 1,904,271 - 697,329
San Diego Vallecitos Water District Water Enterprise 38,532,143 1,884,008 - 699,086
San Diego Valley Center Cemetery District Cemetery - - 176,794 285
San Diego Valley Center Fire Protection District Fire Protection - - 2,286,051 137,342
SCO_LAFCO FY 2014 Page 52 of 77 07/29/15
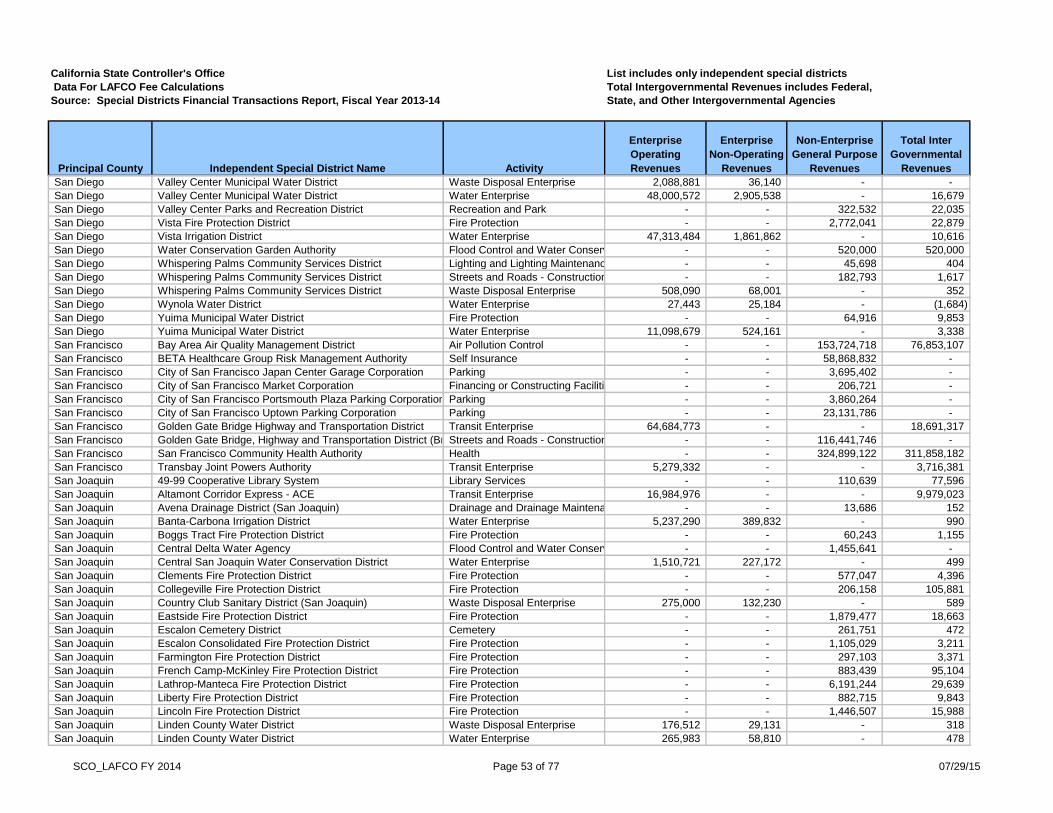
California State Controller's Office List includes only independent special districts
Data For LAFCO Fee Calculations Total Intergovernmental Revenues includes Federal,
Source: Special Districts Financial Transactions Report, Fiscal Year 2013-14 State, and Other Intergovernmental Agencies
Principal County Independent Special District Name Activity
Enterprise
Operating
Revenues
Enterprise
Non-Operating
Revenues
Non-Enterprise
General Purpose
Revenues
Total Inter
Governmental
Revenues
San Diego Valley Center Municipal Water District Waste Disposal Enterprise 2,088,881 36,140 - -
San Diego Valley Center Municipal Water District Water Enterprise 48,000,572 2,905,538 - 16,679
San Diego Valley Center Parks and Recreation District Recreation and Park - - 322,532 22,035
San Diego Vista Fire Protection District Fire Protection - - 2,772,041 22,879
San Diego Vista Irrigation District Water Enterprise 47,313,484 1,861,862 - 10,616
San Diego Water Conservation Garden Authority Flood Control and Water Conservation - - 520,000 520,000
San Diego Whispering Palms Community Services District Lighting and Lighting Maintenance - - 45,698 404
San Diego Whispering Palms Community Services District Streets and Roads - Construction and Maintenance- - 182,793 1,617
San Diego Whispering Palms Community Services District Waste Disposal Enterprise 508,090 68,001 - 352
San Diego Wynola Water District Water Enterprise 27,443 25,184 - (1,684)
San Diego Yuima Municipal Water District Fire Protection - - 64,916 9,853
San Diego Yuima Municipal Water District Water Enterprise 11,098,679 524,161 - 3,338
San Francisco Bay Area Air Quality Management District Air Pollution Control - - 153,724,718 76,853,107
San Francisco BETA Healthcare Group Risk Management Authority Self Insurance - - 58,868,832 -
San Francisco City of San Francisco Japan Center Garage Corporation Parking - - 3,695,402 -
San Francisco City of San Francisco Market Corporation Financing or Constructing Facilities - - 206,721 -
San Francisco City of San Francisco Portsmouth Plaza Parking Corporation Parking - - 3,860,264 -
San Francisco City of San Francisco Uptown Parking Corporation Parking - - 23,131,786 -
San Francisco Golden Gate Bridge Highway and Transportation District Transit Enterprise 64,684,773 - - 18,691,317
San Francisco Golden Gate Bridge, Highway and Transportation District (Bridge / Highway)Streets and Roads - Construction and Maintenance- - 116,441,746 -
San Francisco San Francisco Community Health Authority Health - - 324,899,122 311,858,182
San Francisco Transbay Joint Powers Authority Transit Enterprise 5,279,332 - - 3,716,381
San Joaquin 49-99 Cooperative Library System Library Services - - 110,639 77,596
San Joaquin Altamont Corridor Express - ACE Transit Enterprise 16,984,976 - - 9,979,023
San Joaquin Avena Drainage District (San Joaquin) Drainage and Drainage Maintenance - - 13,686 152
San Joaquin Banta-Carbona Irrigation District Water Enterprise 5,237,290 389,832 - 990
San Joaquin Boggs Tract Fire Protection District Fire Protection - - 60,243 1,155
San Joaquin Central Delta Water Agency Flood Control and Water Conservation - - 1,455,641 -
San Joaquin Central San Joaquin Water Conservation District Water Enterprise 1,510,721 227,172 - 499
San Joaquin Clements Fire Protection District Fire Protection - - 577,047 4,396
San Joaquin Collegeville Fire Protection District Fire Protection - - 206,158 105,881
San Joaquin Country Club Sanitary District (San Joaquin) Waste Disposal Enterprise 275,000 132,230 - 589
San Joaquin Eastside Fire Protection District Fire Protection - - 1,879,477 18,663
San Joaquin Escalon Cemetery District Cemetery - - 261,751 472
San Joaquin Escalon Consolidated Fire Protection District Fire Protection - - 1,105,029 3,211
San Joaquin Farmington Fire Protection District Fire Protection - - 297,103 3,371
San Joaquin French Camp-McKinley Fire Protection District Fire Protection - - 883,439 95,104
San Joaquin Lathrop-Manteca Fire Protection District Fire Protection - - 6,191,244 29,639
San Joaquin Liberty Fire Protection District Fire Protection - - 882,715 9,843
San Joaquin Lincoln Fire Protection District Fire Protection - - 1,446,507 15,988
San Joaquin Linden County Water District Waste Disposal Enterprise 176,512 29,131 - 318
San Joaquin Linden County Water District Water Enterprise 265,983 58,810 - 478
SCO_LAFCO FY 2014 Page 53 of 77 07/29/15

California State Controller's Office List includes only independent special districts
Data For LAFCO Fee Calculations Total Intergovernmental Revenues includes Federal,
Source: Special Districts Financial Transactions Report, Fiscal Year 2013-14 State, and Other Intergovernmental Agencies
Principal County Independent Special District Name Activity
Enterprise
Operating
Revenues
Enterprise
Non-Operating
Revenues
Non-Enterprise
General Purpose
Revenues
Total Inter
Governmental
Revenues
San Joaquin Linden-Peters Fire Protection District Fire Protection - - 1,895,460 23,500
San Joaquin Lockeford Community Services District Waste Disposal Enterprise 285,896 14,252 - -
San Joaquin Lockeford Community Services District Water Enterprise 309,372 115,509 - 1,309
San Joaquin Lockeford Protection District No. 1 (San Joaquin) Land Reclamation and Levee Maintenance - - 5,651 35
San Joaquin Mokelumne Rural Fire Protection District Fire Protection - - 945,891 5,853
San Joaquin Montezuma Fire Protection District (San Joaquin) Fire Protection - - 992,465 5,695
San Joaquin Mountain House Community Services District Lighting and Lighting Maintenance - - 47,227 -
San Joaquin Mountain House Community Services District Local and Regional Planning or Development - - 3,615,936 25,084
San Joaquin Mountain House Community Services District Police Protection and Personal Safety - - 2,045,048 -
San Joaquin Mountain House Community Services District Recreation and Park - - 360,958 -
San Joaquin Mountain House Community Services District Streets and Roads - Construction and Maintenance- - 4,405,118 -
San Joaquin Mountain House Community Services District Waste Disposal Enterprise 3,065,223 1,033 - -
San Joaquin Mountain House Community Services District Water Enterprise 3,213,364 405 - -
San Joaquin Naglee Burk Irrigation District Water Enterprise 222,080 422,306 - 19,719
San Joaquin New Jerusalem Drainage District (San Joaquin) Drainage and Drainage Maintenance - - 66,740 732
San Joaquin New Mariposa Drainage District (San Joaquin) Drainage and Drainage Maintenance - - 4,419 49
San Joaquin North San Joaquin Water Conservation District Water Enterprise - 226,866 - 2,771
San Joaquin Oakwood Lake Water District Water Enterprise 1,261,136 50 - -
San Joaquin Power and Water Resources Pooling Authority Electric Enterprise 45,499,576 547,840 - -
San Joaquin Reclamation District No. 1 Land Reclamation and Levee Maintenance - - 217,779 750
San Joaquin Reclamation District No. 1007 Land Reclamation and Levee Maintenance - - 2,472 -
San Joaquin Reclamation District No. 1608 Land Reclamation and Levee Maintenance - - 463,266 1,932
San Joaquin Reclamation District No. 1614 Land Reclamation and Levee Maintenance - - 526,789 1,889
San Joaquin Reclamation District No. 17 Land Reclamation and Levee Maintenance - - 4,768,807 1,619,737
San Joaquin Reclamation District No. 2 Land Reclamation and Levee Maintenance - - 115,921 60,471
San Joaquin Reclamation District No. 2021 Land Reclamation and Levee Maintenance - - 14 -
San Joaquin Reclamation District No. 2023 Land Reclamation and Levee Maintenance - - 226,313 29,904
San Joaquin Reclamation District No. 2027 Land Reclamation and Levee Maintenance - - 1,226,147 509,544
San Joaquin Reclamation District No. 2028 Land Reclamation and Levee Maintenance - - 563,638 252,867
San Joaquin Reclamation District No. 2029 Land Reclamation and Levee Maintenance - - 759,973 -
San Joaquin Reclamation District No. 2030 Land Reclamation and Levee Maintenance - - 3,886,604 1,532,109
San Joaquin Reclamation District No. 2033 Land Reclamation and Levee Maintenance - - 396,143 67,161
San Joaquin Reclamation District No. 2037 Land Reclamation and Levee Maintenance - - 3,713,388 3,144,707
San Joaquin Reclamation District No. 2038 Land Reclamation and Levee Maintenance - - 286,833 74,057
San Joaquin Reclamation District No. 2039 Land Reclamation and Levee Maintenance - - 713,688 416,912
San Joaquin Reclamation District No. 2040 Land Reclamation and Levee Maintenance - - 914,578 883,222
San Joaquin Reclamation District No. 2041 Land Reclamation and Levee Maintenance - - 2,857,615 2,857,532
San Joaquin Reclamation District No. 2042 Land Reclamation and Levee Maintenance - - 1,403,108 -
San Joaquin Reclamation District No. 2044 Land Reclamation and Levee Maintenance - - 540,012 234,329
San Joaquin Reclamation District No. 2058 Water Enterprise 846,899 293 - -
San Joaquin Reclamation District No. 2062 Land Reclamation and Levee Maintenance - - 220,697 -
San Joaquin Reclamation District No. 2064 Land Reclamation and Levee Maintenance - - 178,532 -
SCO_LAFCO FY 2014 Page 54 of 77 07/29/15

California State Controller's Office List includes only independent special districts
Data For LAFCO Fee Calculations Total Intergovernmental Revenues includes Federal,
Source: Special Districts Financial Transactions Report, Fiscal Year 2013-14 State, and Other Intergovernmental Agencies
Principal County Independent Special District Name Activity
Enterprise
Operating
Revenues
Enterprise
Non-Operating
Revenues
Non-Enterprise
General Purpose
Revenues
Total Inter
Governmental
Revenues
San Joaquin Reclamation District No. 2064 Water Enterprise 145,860 5 - -
San Joaquin Reclamation District No. 2072 Land Reclamation and Levee Maintenance - - 331,306 130,638
San Joaquin Reclamation District No. 2074 Land Reclamation and Levee Maintenance - - 954,627 304,797
San Joaquin Reclamation District No. 2075 Land Reclamation and Levee Maintenance - - 66,204 -
San Joaquin Reclamation District No. 2085 Drainage and Drainage Maintenance - - 120,844 -
San Joaquin Reclamation District No. 2086 Land Reclamation and Levee Maintenance - - 5,004 -
San Joaquin Reclamation District No. 2089 Land Reclamation and Levee Maintenance - - 34,939 13,464
San Joaquin Reclamation District No. 2095 Land Reclamation and Levee Maintenance - - 50,031 -
San Joaquin Reclamation District No. 2096 Land Reclamation and Levee Maintenance - - 22,699 260
San Joaquin Reclamation District No. 2107 Land Reclamation and Levee Maintenance - - 25,858 750
San Joaquin Reclamation District No. 2113 Land Reclamation and Levee Maintenance - - 596,301 534,786
San Joaquin Reclamation District No. 2115 Land Reclamation and Levee Maintenance - - 83,888 62,731
San Joaquin Reclamation District No. 2116 Land Reclamation and Levee Maintenance - - 1,376 -
San Joaquin Reclamation District No. 2119 Land Reclamation and Levee Maintenance - - 778,932 32,675
San Joaquin Reclamation District No. 2126 Land Reclamation and Levee Maintenance - - 31,335 6,264
San Joaquin Reclamation District No. 348 Land Reclamation and Levee Maintenance - - 1,573,644 1,007,436
San Joaquin Reclamation District No. 38 Land Reclamation and Levee Maintenance - - 1,279,520 279,516
San Joaquin Reclamation District No. 403 Land Reclamation and Levee Maintenance - - 42,511 -
San Joaquin Reclamation District No. 404 Land Reclamation and Levee Maintenance - - 1,667,403 1,201,742
San Joaquin Reclamation District No. 524 Land Reclamation and Levee Maintenance - - 97,403 49,776
San Joaquin Reclamation District No. 544 Land Reclamation and Levee Maintenance - - 149,599 63,642
San Joaquin Reclamation District No. 548 Land Reclamation and Levee Maintenance - - 826,118 233,344
San Joaquin Reclamation District No. 684 Land Reclamation and Levee Maintenance - - 910,633 232,106
San Joaquin Reclamation District No. 756 Land Reclamation and Levee Maintenance - - 4,437,290 3,894,511
San Joaquin Reclamation District No. 773 Land Reclamation and Levee Maintenance - - 323,818 169,256
San Joaquin Reclamation District No. 828 Land Reclamation and Levee Maintenance - - 50,061 -
San Joaquin Ripon Consolidated Fire Protection District Fire Protection - - 2,472,139 165,740
San Joaquin San Joaquin County Mosquito and Vector Control Pest Control - - 6,861,075 133,871
San Joaquin San Joaquin County Resource Conservation District Resource Conservation - - 2,864,659 66,645
San Joaquin San Joaquin County Schools Data Processing Center Governmental Services - - 2,068,937 2,066,551
San Joaquin San Joaquin County Schools Property and Liability Insurance GroupSelf Insurance - - 1,499,763 -
San Joaquin San Joaquin County Schools Workers Compensation Insurance GroupSelf Insurance - - 7,516,958 -
San Joaquin San Joaquin Regional Transit District Transit Enterprise 29,813,487 - - 24,160,183
San Joaquin San Joaquin Regional Transit District - Specialized Service Transit Enterprise 238,536 - - 66,869
San Joaquin South Delta Water Agency Flood Control and Water Conservation - - 1,226,759 -
San Joaquin South San Joaquin Irrigation District Electric Enterprise 840,994 - - -
San Joaquin South San Joaquin Irrigation District Water Enterprise 12,313,504 11,770,192 - 20,591
San Joaquin Southern Delta Levee Protection and Channel Maintenance AuthorityLand Reclamation and Levee Maintenance - - 4,002 -
San Joaquin Stockton Port District Harbor and Port Enterprise 45,239,085 60,797 - -
San Joaquin Stockton-East Water District Water Enterprise 19,328,482 2,323,796 - 14,149
San Joaquin Thornton Fire Protection District Fire Protection - - 297,510 2,115
San Joaquin Tracy Cemetery District Cemetery - - 974,409 21,148
SCO_LAFCO FY 2014 Page 55 of 77 07/29/15

California State Controller's Office List includes only independent special districts
Data For LAFCO Fee Calculations Total Intergovernmental Revenues includes Federal,
Source: Special Districts Financial Transactions Report, Fiscal Year 2013-14 State, and Other Intergovernmental Agencies
Principal County Independent Special District Name Activity
Enterprise
Operating
Revenues
Enterprise
Non-Operating
Revenues
Non-Enterprise
General Purpose
Revenues
Total Inter
Governmental
Revenues
San Joaquin Tracy Fire Protection District Fire Protection - - 4,996,756 45,480
San Joaquin Tracy School Facilities Financing Authority Financing or Constructing Facilities - - 1,402,122 -
San Joaquin Tuxedo-Country Club Fire Protection District Fire Protection - - 1,083,131 10,996
San Joaquin Upper Mokelumne River Watershed Authority Water Enterprise - 218 - -
San Joaquin Waterloo-Morada Fire Protection District Fire Protection - - 2,288,915 16,629
San Joaquin West Side Irrigation District Water Enterprise 1,169,222 360,276 - 633
San Joaquin Woodbridge Fire Protection District Fire Protection - - 2,802,440 28,111
San Joaquin Woodbridge Irrigation District Water Enterprise 3,784,962 499,307 - 12,602
San Joaquin Woodbridge Sanitary District (San Joaquin) Waste Disposal Enterprise 408,011 82,812 - 8,981
San Luis Obispo Arroyo Grande Cemetery District Cemetery - - 407,887 2,977
San Luis Obispo Atascadero Cemetery District Cemetery - - 397,655 2,567
San Luis Obispo Avila Beach Community Services District Fire Protection - - 326,547 1,713
San Luis Obispo Avila Beach Community Services District Waste Disposal Enterprise 349,115 202,559 - 1,673
San Luis Obispo Avila Beach Community Services District Water Enterprise 474,968 - - -
San Luis Obispo California Valley Community Services District Streets and Roads - Construction and Maintenance- - 332,920 646
San Luis Obispo Cambria Cemetery District Cemetery - - 213,745 709
San Luis Obispo Cambria Community Healthcare District Ambulance Service - - 1,408,888 500
San Luis Obispo Cambria Community Services District Fire Protection - - 1,685,146 9,787
San Luis Obispo Cambria Community Services District Recreation and Park - - 2,082,945 5,915
San Luis Obispo Cambria Community Services District Waste Disposal Enterprise 2,047,167 1,359 - -
San Luis Obispo Cambria Community Services District Water Enterprise 2,306,338 962 - -
San Luis Obispo Cayucos Fire Protection District Fire Protection - - 549,134 10,645
San Luis Obispo Cayucos Sanitary District (San Luis Obispo) Waste Disposal Enterprise 1,771,306 740,401 - 1,500
San Luis Obispo Cayucos-Morro Bay Cemetery District Cemetery - - 417,681 2,404
San Luis Obispo Central California Schools Financing Authority Governmental Services - - 263,098 -
San Luis Obispo Five Cities Fire Authority Fire Protection - - 4,499,090 4,375,255
San Luis Obispo Garden Farms Community Water District Water Enterprise 50,216 85,995 - 211
San Luis Obispo Ground Squirrel Hollow Community Services District Streets and Roads - Construction and Maintenance- - 158,792 -
San Luis Obispo Heritage Ranch Community Services District Waste Disposal Enterprise 838,819 76,379 - 618
San Luis Obispo Heritage Ranch Community Services District Water Enterprise 1,281,138 169,080 - 1,315
San Luis Obispo Independence Ranch Community Services District Streets and Roads - Construction and Maintenance- - 62,520 -
San Luis Obispo Integrated Waste Management Authority Waste Disposal Enterprise 1,796,372 281,114 - 277,398
San Luis Obispo Linne Community Services District Streets and Roads - Construction and Maintenance- - 60,036 155
San Luis Obispo Los Osos Community Services District Drainage and Drainage Maintenance - - 113,570 -
San Luis Obispo Los Osos Community Services District Fire Protection - - 2,202,073 16,249
San Luis Obispo Los Osos Community Services District Governmental Services - - (515) -
San Luis Obispo Los Osos Community Services District Recreation and Park - - 918 -
San Luis Obispo Los Osos Community Services District Waste Disposal Enterprise - 4,868,153 - 3,570,927
San Luis Obispo Los Osos Community Services District Water Enterprise 2,165,742 228,230 - 42,023
San Luis Obispo Nipomo Community Services District Drainage and Drainage Maintenance - - 14,002 115
San Luis Obispo Nipomo Community Services District Lighting and Lighting Maintenance - - 24,572 -
San Luis Obispo Nipomo Community Services District Waste Disposal Enterprise 2,267,191 168,574 - -
SCO_LAFCO FY 2014 Page 56 of 77 07/29/15

California State Controller's Office List includes only independent special districts
Data For LAFCO Fee Calculations Total Intergovernmental Revenues includes Federal,
Source: Special Districts Financial Transactions Report, Fiscal Year 2013-14 State, and Other Intergovernmental Agencies
Principal County Independent Special District Name Activity
Enterprise
Operating
Revenues
Enterprise
Non-Operating
Revenues
Non-Enterprise
General Purpose
Revenues
Total Inter
Governmental
Revenues
San Luis Obispo Nipomo Community Services District Water Enterprise 4,229,844 2,791,844 - 2,204,225
San Luis Obispo Oceano Community Services District Fire Protection - - 828,246 27,327
San Luis Obispo Oceano Community Services District Lighting and Lighting Maintenance - - 38,307 -
San Luis Obispo Oceano Community Services District Recreation and Park - - 232 -
San Luis Obispo Oceano Community Services District Waste Disposal Enterprise 892,779 165,901 - -
San Luis Obispo Oceano Community Services District Water Enterprise 1,956,591 360,422 - 152,355
San Luis Obispo Paso Robles Cemetery District Cemetery - - 704,740 3,285
San Luis Obispo Port San Luis Harbor District Harbor and Port Enterprise 1,329,994 488,433 - -
San Luis Obispo Port San Luis Harbor District Police Protection and Personal Safety - - 833,759 5,860
San Luis Obispo Port San Luis Harbor District Recreation and Park - - 2,042,012 81,122
San Luis Obispo San Luis Obispo County Air Pollution District Air Pollution Control - - 5,632,173 1,301,477
San Luis Obispo San Luis Obispo Regional Transit Authority Transit Enterprise 6,031,037 - - 4,655,059
San Luis Obispo San Luis Obispo Regional Transit Authority - Specialized ServiceTransit Enterprise 3,000,315 - - 2,886,260
San Luis Obispo San Miguel Cemetery District Cemetery - - 74,594 558
San Luis Obispo San Miguel Community Services District Fire Protection - - 319,399 2,829
San Luis Obispo San Miguel Community Services District Lighting and Lighting Maintenance - - 70,116 84
San Luis Obispo San Miguel Community Services District Waste Disposal Enterprise 539,572 86,657 - 1
San Luis Obispo San Miguel Community Services District Water Enterprise 505,855 50,092 - 1
San Luis Obispo San Simeon Acres Community Services District Waste Disposal Enterprise 438,503 56,422 - 796
San Luis Obispo San Simeon Acres Community Services District Water Enterprise 345,639 14,298 - 393
San Luis Obispo Santa Margarita Cemetery District Cemetery - - 42,048 249
San Luis Obispo Santa Margarita Fire Protection Fire Protection - - 126,846 16,278
San Luis Obispo Schools Insurance Program for Employees Self Insurance - - 4,621,385 87,125
San Luis Obispo Shandon Cemetery District Cemetery - - 14,452 108
San Luis Obispo South County Area Transit Transit Enterprise 1,065,584 - - 915,047
San Luis Obispo South San Luis Obispo County Sanitation District (San Luis Obispo)Waste Disposal Enterprise 3,289,133 32,584 - -
San Luis Obispo Squire Canyon Community Services District Streets and Roads - Construction and Maintenance- - 31,220 -
San Luis Obispo Templeton Cemetery District Cemetery - - 140,327 771
San Luis Obispo Templeton Community Services District Drainage and Drainage Maintenance - - 21,104 21,085
San Luis Obispo Templeton Community Services District Fire Protection - - 997,774 262,059
San Luis Obispo Templeton Community Services District Lighting and Lighting Maintenance - - 24,702 218
San Luis Obispo Templeton Community Services District Recreation and Park - - 447,215 2,326
San Luis Obispo Templeton Community Services District Waste Disposal Enterprise 1,064,125 10,015 - -
San Luis Obispo Templeton Community Services District Water Enterprise 1,954,480 255,801 - -
San Luis Obispo Upper Salinas/Las Tablas Resource Conservation District Resource Conservation - - 292,108 224,512
San Mateo Bay Area Water Supply and Conservation Agency Water Enterprise 23,626,353 1,368,916 - -
San Mateo Bayshore Sanitary District (San Mateo) Waste Disposal Enterprise 976,532 258,464 - 1,498
San Mateo Belmont-San Carlos Fire Department Fire Protection - - 3,549,991 -
San Mateo Broadmoor Police Protection District Police Protection and Personal Safety - - 1,533,697 271,769
San Mateo California Maritime Infrastructure Authority Financing or Constructing Facilities - - 112 -
San Mateo Central County Fire Department Fire Protection - - 17,012,812 -
San Mateo City/County Association of Governments of San Mateo CountyLocal and Regional Planning or Development - - 20,005,516 8,700,279
SCO_LAFCO FY 2014 Page 57 of 77 07/29/15

California State Controller's Office List includes only independent special districts
Data For LAFCO Fee Calculations Total Intergovernmental Revenues includes Federal,
Source: Special Districts Financial Transactions Report, Fiscal Year 2013-14 State, and Other Intergovernmental Agencies
Principal County Independent Special District Name Activity
Enterprise
Operating
Revenues
Enterprise
Non-Operating
Revenues
Non-Enterprise
General Purpose
Revenues
Total Inter
Governmental
Revenues
San Mateo Coastside County Water District Water Enterprise 8,377,303 1,228,200 - 3,932
San Mateo Coastside Fire Protection District Fire Protection - - 9,680,945 1,308,911
San Mateo Colma Fire Protection District Fire Protection - - 109,112 1,992
San Mateo East Palo Alto Sanitary District (San Mateo) Waste Disposal Enterprise 4,383,354 414,233 - 57,416
San Mateo Granada Sanitary District (San Mateo) Waste Disposal Enterprise 1,266,536 877,639 - 1
San Mateo Highlands Recreation Community Services District Recreation and Park - - 2,648,810 2,109
San Mateo Housing Endowment and Regional Trust of San Mateo CountyGovernmental Services - - 510,499 203,016
San Mateo Ladera Recreation District Recreation and Park - - 705,273 786
San Mateo Los Trancos County Water District Water Enterprise - 294,195 - 1
San Mateo Menlo Park Fire Protection District Fire Protection - - 39,158,904 6,341,361
San Mateo Mid Peninsula Water District Water Enterprise 9,762,786 642,081 - 1
San Mateo Montara Sanitary District (San Mateo) Waste Disposal Enterprise 2,112,310 347,945 - 2,013
San Mateo Montara Sanitary District (San Mateo) Water Enterprise 1,745,200 1,573,188 - 11,409
San Mateo Net Six Joint Powers Authority Fire Protection - - 166,005 -
San Mateo North Coast County Water District Water Enterprise 8,777,603 1,050,617 - 2,824
San Mateo Pacific Library Partnership Library Services - - 2,374,480 1,585,420
San Mateo Peninsula Corridor Joint Powers Board Transit Enterprise 112,635,308 - - 24,512,438
San Mateo Peninsula Health Care District Health - - 8,146,012 438,722
San Mateo Peninsula Library System District Library Services - - 8,417,142 4,548,592
San Mateo San Francisquito Creek Joint Powers Authority Flood Control and Water Conservation - - 590,398 -
San Mateo San Mateo County Harbor District Harbor and Port Enterprise 3,997,068 7,713,215 - 296,541
San Mateo San Mateo County Library Joint Powers Authority Library Services - - 24,713,697 2,729,628
San Mateo San Mateo County Mosquito Abatement District Pest Control - - 4,573,074 609,032
San Mateo San Mateo County Pre-Hospital Emergency Medical Services GroupAmbulance Service - - 4,111,761 -
San Mateo San Mateo County Resource Conservation District Resource Conservation - - 1,348,426 1,055,595
San Mateo San Mateo County Schools Insurance Group Self Insurance - - 35,889,261 -
San Mateo San Mateo County Transit District Transit Enterprise 145,264,244 - - 47,736,799
San Mateo San Mateo County Transit District - Specialized Service Transit Enterprise 13,756,643 - - 12,404,977
San Mateo Sequoia Healthcare District Health - - 9,742,677 257,995
San Mateo Sewer Authority Mid-Coastside Waste Disposal Enterprise 4,259,777 39,837 - -
San Mateo Silicon Valley Clean Water Waste Disposal Enterprise 33,530,273 2,845,129 - -
San Mateo South Bayside Waste Management Authority (SBWMA) Waste Disposal Enterprise 41,973,806 163,751 - -
San Mateo The Cities Group Self Insurance - - 2,855,317 -
San Mateo West Bay Sanitary District (San Mateo) Waste Disposal Enterprise 19,684,848 181,922 - -
San Mateo Westborough County Water District Waste Disposal Enterprise 1,928,136 - - -
San Mateo Westborough County Water District Water Enterprise 2,109,520 498,650 - 3,569
San Mateo Woodside Fire Protection District Fire Protection - - 15,769,389 78,335
Santa Barbara Cachuma Resource Conservation District Resource Conservation - - 516,249 369,079
Santa Barbara Carpinteria - Summerland Fire Protection District Fire Protection - - 8,204,366 582,814
Santa Barbara Carpinteria Cemetery District Cemetery - - 343,702 1,046
Santa Barbara Carpinteria Sanitary District (Santa Barbara) Waste Disposal Enterprise 4,606,242 735,283 - 2,934
Santa Barbara Carpinteria Valley Water District Water Enterprise 12,135,215 51,274 - 24,790
SCO_LAFCO FY 2014 Page 58 of 77 07/29/15

California State Controller's Office List includes only independent special districts
Data For LAFCO Fee Calculations Total Intergovernmental Revenues includes Federal,
Source: Special Districts Financial Transactions Report, Fiscal Year 2013-14 State, and Other Intergovernmental Agencies
Principal County Independent Special District Name Activity
Enterprise
Operating
Revenues
Enterprise
Non-Operating
Revenues
Non-Enterprise
General Purpose
Revenues
Total Inter
Governmental
Revenues
Santa Barbara Casmalia Community Services District Water Enterprise 99,375 - - -
Santa Barbara Central Coast Water Authority Water Enterprise 19,641,221 120,693 - -
Santa Barbara Cuyama Community Services District Waste Disposal Enterprise 156,190 4,271 - -
Santa Barbara Cuyama Community Services District Water Enterprise 220,165 682,987 - 677,682
Santa Barbara Cuyama Valley Recreation and Park District Recreation and Park - - 174,252 15,252
Santa Barbara Embarcadero Municipal Improvement District Waste Disposal Enterprise - 228,252 - 1,326
Santa Barbara Goleta Cemetery District Cemetery - - 733,471 16,361
Santa Barbara Goleta Sanitary District (Santa Barbara) Waste Disposal Enterprise 10,476,426 404,065 - 804
Santa Barbara Goleta Water District Water Enterprise 33,529,252 319,841 - -
Santa Barbara Goleta West Sanitary District (Santa Barbara) Waste Disposal Enterprise 3,957,668 2,304,351 - 13,331
Santa Barbara Guadalupe Cemetery District Cemetery - - 137,849 20,532
Santa Barbara Isla Vista Recreation and Park District Recreation and Park - - 1,477,764 300,521
Santa Barbara Lompoc Cemetery District Cemetery - - 630,738 2,460
Santa Barbara Los Alamos Cemetery District Cemetery - - 33,579 94
Santa Barbara Los Alamos Community Services District Waste Disposal Enterprise 485,754 30,772 - 1,500
Santa Barbara Los Alamos Community Services District Water Enterprise 579,356 31,983 - 1,500
Santa Barbara Mission Hills Community Services District Waste Disposal Enterprise 518,336 7,353 - -
Santa Barbara Mission Hills Community Services District Water Enterprise 969,157 10,155 - -
Santa Barbara Montecito Fire Protection District Fire Protection - - 15,015,001 594,283
Santa Barbara Montecito Sanitary District (Santa Barbara) Waste Disposal Enterprise 4,730,900 565,271 - 2,889
Santa Barbara Montecito Water District Water Enterprise 16,557,720 155,938 - -
Santa Barbara Mosquito and Vector Management District of Santa Barbara CountyPest Control - - 1,016,037 11,703
Santa Barbara Oak Hill Cemetery District Cemetery - - 416,276 1,608
Santa Barbara Santa Barbara County Air Pollution Control Air Pollution Control - - 8,302,750 2,973,829
Santa Barbara Santa Barbara County Schools Self-Insurance Program for EmployeesSelf Insurance - - 5,831,022 -
Santa Barbara Santa Barbara Metropolitan Transit District Transit Enterprise 22,756,977 - - 12,893,133
Santa Barbara Santa Barbara San Luis Obispo Regional Health Authority Health - - 382,003,827 -
Santa Barbara Santa Maria Cemetery District Cemetery - - 1,559,737 3,954
Santa Barbara Santa Maria Public Airport District Airport Enterprise 3,095,288 1,359,081 - 34,769
Santa Barbara Santa Maria Valley Water Conservation District Flood Control and Water Conservation - - 574,411 26,535
Santa Barbara Santa Rita Hills Community Services District Streets and Roads - Construction and Maintenance- - 196,340 -
Santa Barbara Santa Ynez Community Services District Waste Disposal Enterprise 824,266 235,004 - 1,077
Santa Barbara Santa Ynez River Water Conservation District Flood Control and Water Conservation - - 526,581 6,758
Santa Barbara Santa Ynez River Water Conservation District, Improvement District No. 1Water Enterprise 10,414,794 32,677 - 1
Santa Barbara Summerland Sanitary District (Santa Barbara) Waste Disposal Enterprise 769,512 202,677 - 1,198
Santa Barbara Vandenberg Village Community Services District Waste Disposal Enterprise 2,365,042 23,386 - -
Santa Barbara Vandenberg Village Community Services District Water Enterprise 1,788,207 13,837 - -
Santa Clara Aldercroft Heights County Water District Water Enterprise 209,317 83 - -
Santa Clara Bay Area Community College Districts Joint Power Agency Self Insurance - - 4,427,936 -
Santa Clara Burbank Sanitary District (Santa Clara) Waste Disposal Enterprise 564,539 5,958 - -
Santa Clara Cable Joint Powers Television Translator Station Facilities - - 1,738,703 -
Santa Clara Cupertino Sanitary District (Santa Clara) Waste Disposal Enterprise 11,375,473 74,624 - -
SCO_LAFCO FY 2014 Page 59 of 77 07/29/15

California State Controller's Office List includes only independent special districts
Data For LAFCO Fee Calculations Total Intergovernmental Revenues includes Federal,
Source: Special Districts Financial Transactions Report, Fiscal Year 2013-14 State, and Other Intergovernmental Agencies
Principal County Independent Special District Name Activity
Enterprise
Operating
Revenues
Enterprise
Non-Operating
Revenues
Non-Enterprise
General Purpose
Revenues
Total Inter
Governmental
Revenues
Santa Clara Guadalupe Coyote Resource Conservation District Resource Conservation - - 184,638 1,099
Santa Clara Lake Canyon Community Services District Waste Disposal Enterprise - 57,379 - -
Santa Clara Library Joint Powers Authority of Santa Clara County Library Services - - 36,818,321 3,990,004
Santa Clara Lions Gate Community Services District Streets and Roads - Construction and Maintenance- - 735,522 -
Santa Clara Loma Prieta Resource Conservation District Resource Conservation - - 69,222 416
Santa Clara Los Altos Hills County Fire District Fire Protection - - 8,432,015 47,968
Santa Clara Los Gatos-Saratoga Department of Community Education and RecreationRecreation and Park - - 8,294,472 -
Santa Clara Midpeninsula Regional Open Space District Recreation and Park - - 36,063,850 2,044,406
Santa Clara North County Library Authority Library Services - - 1,042,411 -
Santa Clara Northern California Community College Pool Self Insurance - - 3,358,736 -
Santa Clara Purissima Hills Water District Water Enterprise 5,676,799 864,246 - 3,798
Santa Clara Rancho Rinconada Recreation and Park District Recreation and Park - - 746,862 11,438
Santa Clara San Martin County Water District Water Enterprise 193,136 25,991 - -
Santa Clara Santa Clara Community Health Authority Health - - 4,568,191 -
Santa Clara Santa Clara County Abandoned Vehicle Abatement Service AuthorityGovernmental Services - - 1,592,730 -
Santa Clara Santa Clara County Open-Space Authority Recreation and Park - - 4,477,877 131,091
Santa Clara Santa Clara County Schools Insurance Group Self Insurance - - 30,190,944 699,432
Santa Clara Santa Clara Valley Habitat Agency Resource Conservation - - 931,685 930,730
Santa Clara Santa Clara Valley Transportation Authority Transit Enterprise 633,720,000 - - 157,424,000
Santa Clara Santa Clara Valley Transportation Authority - Specialized ServiceTransit Enterprise 20,890,009 - - 17,951,182
Santa Clara Santa Clara Valley Water District Flood Control and Water Conservation - - 131,150,134 13,861,595
Santa Clara Santa Clara Valley Water District Water Enterprise 172,373,466 36,661,657 - 4,478,620
Santa Clara Saratoga Cemetery District Cemetery - - 1,041,684 4,279
Santa Clara Saratoga Fire Protection District Fire Protection - - 6,061,059 33,470
Santa Clara Schools Alliance for Workers Compensation Excess Self-Funded Joint Powers AuthoritySelf Insurance - - 1,711,836 -
Santa Clara Silicon Valley Animal Control Authority Animal Control - - 2,086,319 -
Santa Clara Silicon Valley Regional Interoperability Authority Police Protection and Personal Safety - - 1,331,428 1,323,100
Santa Clara South Bay Area Schools Insurance Authority Self Insurance - - 3,152,204 -
Santa Clara South Bay Regional Public Safety Training Consortium Governmental Services - - 8,971,611 -
Santa Clara South County Regional Wastewater Authority Waste Disposal Enterprise 11,096,073 388,728 - 292,162
Santa Clara South Santa Clara County Fire District Fire Protection - - 4,316,662 109,183
Santa Clara South Santa Clara Valley Memorial District Memorial - - 130,815 613
Santa Clara West Valley Sanitation District of Santa Clara County (Santa Clara)Waste Disposal Enterprise 20,800,141 376,223 - -
Santa Clara West Valley Solid Waste Management Authority Governmental Services - - 305,084 261,468
Santa Cruz Alba Recreation and Park District Recreation and Park - - 1,977 -
Santa Cruz Aptos-La Selva Fire Protection Services Fire Protection - - 9,466,636 192,375
Santa Cruz Ben Lomond Fire Protection District Fire Protection - - 662,960 4,915
Santa Cruz Boulder Creek Fire Protection District Fire Protection - - 727,712 5,345
Santa Cruz Boulder Creek Recreation and Park District Recreation and Park - - 271,934 1,176
Santa Cruz Branciforte Fire Protection District Fire Protection - - 745,421 4,442
Santa Cruz Central Fire Protection District (Santa Cruz) Fire Protection - - 13,447,742 345,683
Santa Cruz Central Water District Water Enterprise 723,510 95,341 - 736
SCO_LAFCO FY 2014 Page 60 of 77 07/29/15

California State Controller's Office List includes only independent special districts
Data For LAFCO Fee Calculations Total Intergovernmental Revenues includes Federal,
Source: Special Districts Financial Transactions Report, Fiscal Year 2013-14 State, and Other Intergovernmental Agencies
Principal County Independent Special District Name Activity
Enterprise
Operating
Revenues
Enterprise
Non-Operating
Revenues
Non-Enterprise
General Purpose
Revenues
Total Inter
Governmental
Revenues
Santa Cruz Criminal Justice Council of Santa Cruz County Governmental Services - - 24,638 24,000
Santa Cruz Felton Fire Protection District Fire Protection - - 639,155 5,623
Santa Cruz Henry J Mello Center for the Performing Arts Administrative AgencyGovernmental Services - - 25,806 4,100
Santa Cruz La Selva Beach Parks and Recreation District Recreation and Park - - 158,495 816
Santa Cruz Library Joint Powers Authority Library Services - - 12,422,802 5,170,878
Santa Cruz Lompico County Water District Water Enterprise 499,395 127,482 - 1,771
Santa Cruz Opal Cliffs Recreation and Park District Recreation and Park - - 81,157 74
Santa Cruz Pajaro Valley Cemetery District Cemetery - - 1,013,245 40,409
Santa Cruz Pajaro Valley Fire Protection District Fire Protection - - 1,521,103 10,355
Santa Cruz Pajaro Valley Water Management Agency Flood Control and Water Conservation - - 12,663,031 114,102
Santa Cruz Reclamation District No. 2049 Drainage and Drainage Maintenance - - 45,315 -
Santa Cruz Salsipuedes Sanitary District (Santa Cruz) Waste Disposal Enterprise 337,421 18,256 - 124
Santa Cruz San Lorenzo Valley Water District Waste Disposal Enterprise 101,637 - - -
Santa Cruz San Lorenzo Valley Water District Water Enterprise 5,736,851 673,385 - 3,775
Santa Cruz Santa Cruz Consolidated Emergency Communication Center Governmental Services - - 6,311,078 3,680,681
Santa Cruz Santa Cruz County Animal Shelter Animal Control - - 4,652,499 -
Santa Cruz Santa Cruz County Emergency Medical Services Integration AuthorityGovernmental Services - - 294,286 4,500
Santa Cruz Santa Cruz County Fire Agencies Insurance Group Self Insurance - - 678,645 -
Santa Cruz Santa Cruz County Library Financing Authority Governmental Services - - 15,517,488 15,515,175
Santa Cruz Santa Cruz County Resource Conservation District Resource Conservation - - 2,811,920 2,563,630
Santa Cruz Santa Cruz County Sanitation District (Santa Cruz) Waste Disposal Enterprise 21,977,223 401,666 - 21,898
Santa Cruz Santa Cruz County Schools Health Insurance Group Self Insurance - - 1,508,725 -
Santa Cruz Santa Cruz County Vehicle Abatement Authority Governmental Services - - 305,097 305,010
Santa Cruz Santa Cruz Metropolitan Transit District Transit Enterprise 37,649,096 - - 17,977,145
Santa Cruz Santa Cruz Metropolitan Transit District - Specialized Service Transit Enterprise 6,055,939 - - -
Santa Cruz Santa Cruz Port District Harbor and Port Enterprise 7,966,299 6,451,985 - 6,378,230
Santa Cruz Santa Cruz-San Benito County Schools Insurance Group Self Insurance - - 3,147,560 -
Santa Cruz Scotts Valley Fire Protection District Fire Protection - - 5,675,286 354,422
Santa Cruz Scotts Valley Water District Water Enterprise 5,482,287 725,345 - 5,789
Santa Cruz Soquel Creek Water District Water Enterprise 14,810,069 115,107 - -
Santa Cruz Southern Peninsula Region Insurance Group Self Insurance - - 1,120,594 -
Santa Cruz Zayante Fire Protection District Fire Protection - - 401,616 49,048
Shasta Anderson Cemetery District Cemetery - - 194,828 1,183
Shasta Anderson Fire Protection District Fire Protection - - 1,099,297 47,187
Shasta Anderson-Cottonwood Irrigation District Water Enterprise 1,514,184 461,085 - 11,662
Shasta Bella Vista Water District Water Enterprise 4,431,342 2,531,867 - 25,286
Shasta Buckeye Fire Protection District Fire Protection - - 89,986 1,371
Shasta Burney Basin Mosquito Abatement District Pest Control - - 123,093 3,511
Shasta Burney Cemetery District Cemetery - - 123,425 4,399
Shasta Burney Fire Protection District Fire Protection - - 625,793 4,469
Shasta Burney Water District Waste Disposal Enterprise 464,543 2,070 - 62
Shasta Burney Water District Water Enterprise 790,387 5,630 - -
SCO_LAFCO FY 2014 Page 61 of 77 07/29/15
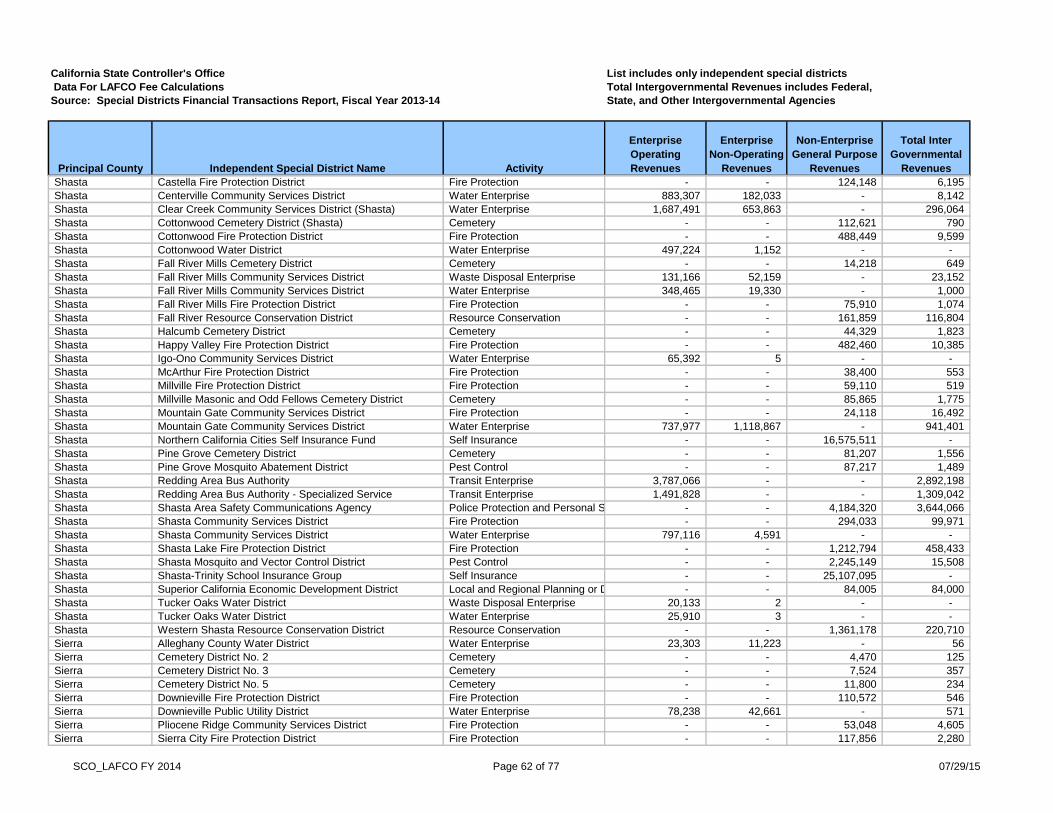
California State Controller's Office List includes only independent special districts
Data For LAFCO Fee Calculations Total Intergovernmental Revenues includes Federal,
Source: Special Districts Financial Transactions Report, Fiscal Year 2013-14 State, and Other Intergovernmental Agencies
Principal County Independent Special District Name Activity
Enterprise
Operating
Revenues
Enterprise
Non-Operating
Revenues
Non-Enterprise
General Purpose
Revenues
Total Inter
Governmental
Revenues
Shasta Castella Fire Protection District Fire Protection - - 124,148 6,195
Shasta Centerville Community Services District Water Enterprise 883,307 182,033 - 8,142
Shasta Clear Creek Community Services District (Shasta) Water Enterprise 1,687,491 653,863 - 296,064
Shasta Cottonwood Cemetery District (Shasta) Cemetery - - 112,621 790
Shasta Cottonwood Fire Protection District Fire Protection - - 488,449 9,599
Shasta Cottonwood Water District Water Enterprise 497,224 1,152 - -
Shasta Fall River Mills Cemetery District Cemetery - - 14,218 649
Shasta Fall River Mills Community Services District Waste Disposal Enterprise 131,166 52,159 - 23,152
Shasta Fall River Mills Community Services District Water Enterprise 348,465 19,330 - 1,000
Shasta Fall River Mills Fire Protection District Fire Protection - - 75,910 1,074
Shasta Fall River Resource Conservation District Resource Conservation - - 161,859 116,804
Shasta Halcumb Cemetery District Cemetery - - 44,329 1,823
Shasta Happy Valley Fire Protection District Fire Protection - - 482,460 10,385
Shasta Igo-Ono Community Services District Water Enterprise 65,392 5 - -
Shasta McArthur Fire Protection District Fire Protection - - 38,400 553
Shasta Millville Fire Protection District Fire Protection - - 59,110 519
Shasta Millville Masonic and Odd Fellows Cemetery District Cemetery - - 85,865 1,775
Shasta Mountain Gate Community Services District Fire Protection - - 24,118 16,492
Shasta Mountain Gate Community Services District Water Enterprise 737,977 1,118,867 - 941,401
Shasta Northern California Cities Self Insurance Fund Self Insurance - - 16,575,511 -
Shasta Pine Grove Cemetery District Cemetery - - 81,207 1,556
Shasta Pine Grove Mosquito Abatement District Pest Control - - 87,217 1,489
Shasta Redding Area Bus Authority Transit Enterprise 3,787,066 - - 2,892,198
Shasta Redding Area Bus Authority - Specialized Service Transit Enterprise 1,491,828 - - 1,309,042
Shasta Shasta Area Safety Communications Agency Police Protection and Personal Safety - - 4,184,320 3,644,066
Shasta Shasta Community Services District Fire Protection - - 294,033 99,971
Shasta Shasta Community Services District Water Enterprise 797,116 4,591 - -
Shasta Shasta Lake Fire Protection District Fire Protection - - 1,212,794 458,433
Shasta Shasta Mosquito and Vector Control District Pest Control - - 2,245,149 15,508
Shasta Shasta-Trinity School Insurance Group Self Insurance - - 25,107,095 -
Shasta Superior California Economic Development District Local and Regional Planning or Development - - 84,005 84,000
Shasta Tucker Oaks Water District Waste Disposal Enterprise 20,133 2 - -
Shasta Tucker Oaks Water District Water Enterprise 25,910 3 - -
Shasta Western Shasta Resource Conservation District Resource Conservation - - 1,361,178 220,710
Sierra Alleghany County Water District Water Enterprise 23,303 11,223 - 56
Sierra Cemetery District No. 2 Cemetery - - 4,470 125
Sierra Cemetery District No. 3 Cemetery - - 7,524 357
Sierra Cemetery District No. 5 Cemetery - - 11,800 234
Sierra Downieville Fire Protection District Fire Protection - - 110,572 546
Sierra Downieville Public Utility District Water Enterprise 78,238 42,661 - 571
Sierra Pliocene Ridge Community Services District Fire Protection - - 53,048 4,605
Sierra Sierra City Fire Protection District Fire Protection - - 117,856 2,280
SCO_LAFCO FY 2014 Page 62 of 77 07/29/15

California State Controller's Office List includes only independent special districts
Data For LAFCO Fee Calculations Total Intergovernmental Revenues includes Federal,
Source: Special Districts Financial Transactions Report, Fiscal Year 2013-14 State, and Other Intergovernmental Agencies
Principal County Independent Special District Name Activity
Enterprise
Operating
Revenues
Enterprise
Non-Operating
Revenues
Non-Enterprise
General Purpose
Revenues
Total Inter
Governmental
Revenues
Sierra Sierra County Fire Protection District No. 1 Fire Protection - - 141,120 1,500
Sierra Sierra County Waterworks No. 1 (Sierra) Water Enterprise 68,623 30,923 - 2,333
Sierra Sierra Valley Resource Conservation District Resource Conservation - - 373,209 370,196
Sierra Sierraville Public Utility District Water Enterprise 64,775 18,453 - 21
Siskiyou Big Springs Irrigation District Water Enterprise 126,861 3,779 - 27
Siskiyou Butte Valley Fire Protection Fire Protection - - 38,507 501
Siskiyou Butte Valley Irrigation District Water Enterprise 280,635 141,857 - 11
Siskiyou Callahan Water District Water Enterprise 13,157 1 - -
Siskiyou Collier Interpretive and Information Center Agency Recreation and Park - - 44,194 8,500
Siskiyou Copco Lake Fire Protection District Fire Protection - - 21,554 3,098
Siskiyou Dunsmuir Fire Protection District Fire Protection - - 69,766 17,450
Siskiyou Dunsmuir Recreation and Park District Recreation and Park - - 129,256 1,674
Siskiyou Etna Cemetery District Cemetery - - 34,451 592
Siskiyou Fort Jones Cemetery District Cemetery - - 71,399 2,269
Siskiyou Gazelle Fire Protection District Fire Protection - - 16,719 335
Siskiyou Grenada Fire Protection District Fire Protection - - 47,553 2,300
Siskiyou Grenada Irrigation District Water Enterprise 125,089 18 - -
Siskiyou Grenada Sanitary District (Siskiyou) Waste Disposal Enterprise 76,329 498 - -
Siskiyou Happy Camp Cemetery District Cemetery - - 14,164 3,815
Siskiyou Happy Camp Community Services District Lighting and Lighting Maintenance - - 5,534 -
Siskiyou Happy Camp Community Services District Recreation and Park - - 7,385 -
Siskiyou Happy Camp Community Services District Water Enterprise 247,200 13,617 - 19
Siskiyou Happy Camp Fire Protection District Fire Protection - - 52,152 332
Siskiyou Happy Camp Sanitary District (Siskiyou) Waste Disposal Enterprise 143,864 71,908 - 461
Siskiyou Hornbrook Cemetery District Cemetery - - 20,820 370
Siskiyou Hornbrook Fire Protection District Fire Protection - - 24,009 6,449
Siskiyou Klamath Water and Power Agency Water Enterprise - 4,543,233 - 4,543,233
Siskiyou Lake Shastina Community Services District Fire Protection - - 179,355 60
Siskiyou Lake Shastina Community Services District Governmental Services - - 103,993 3,190
Siskiyou Lake Shastina Community Services District Police Protection and Personal Safety - - 388,727 116,913
Siskiyou Lake Shastina Community Services District Waste Disposal Enterprise 593,826 669 - -
Siskiyou Lake Shastina Community Services District Water Enterprise 492,494 4,191 - -
Siskiyou Lakeview Cemetery District Cemetery - - 9,173 195
Siskiyou Mayten Fire Protection District Fire Protection - - 33,818 4,070
Siskiyou McCloud Community Services District Ambulance Service - - 23,740 -
Siskiyou McCloud Community Services District Fire Protection - - 132,181 11,307
Siskiyou McCloud Community Services District Library Services - - 7,479 6
Siskiyou McCloud Community Services District Lighting and Lighting Maintenance - - 21,943 -
Siskiyou McCloud Community Services District Recreation and Park - - 49,006 43
Siskiyou McCloud Community Services District Streets and Roads - Construction and Maintenance- - 41,336 -
Siskiyou McCloud Community Services District Waste Disposal Enterprise 653,946 1,897 - -
Siskiyou McCloud Community Services District Water Enterprise 461,723 1,504 - -
SCO_LAFCO FY 2014 Page 63 of 77 07/29/15

California State Controller's Office List includes only independent special districts
Data For LAFCO Fee Calculations Total Intergovernmental Revenues includes Federal,
Source: Special Districts Financial Transactions Report, Fiscal Year 2013-14 State, and Other Intergovernmental Agencies
Principal County Independent Special District Name Activity
Enterprise
Operating
Revenues
Enterprise
Non-Operating
Revenues
Non-Enterprise
General Purpose
Revenues
Total Inter
Governmental
Revenues
Siskiyou Montague Fire Protection District Fire Protection - - 54,037 677
Siskiyou Montague Water Conservation District Water Enterprise 584,232 398,762 - 29
Siskiyou Mt. Shasta Fire Protection District Fire Protection - - 456,142 157,943
Siskiyou Mt. Shasta Recreation and Park District Recreation and Park - - 581,217 6,781
Siskiyou Northeastern Joint Powers Authority Self Insurance - - 2,869,402 -
Siskiyou Picard Cemetery District Cemetery - - 20,269 581
Siskiyou Planning and Service Area II Area Agency On Aging Local and Regional Planning or Development - - 2,330,146 2,323,641
Siskiyou Sawyers Bar County Water District Water Enterprise 259 9,126 - -
Siskiyou Scott Valley Fire Protection District Fire Protection - - 166,072 70,672
Siskiyou Scott Valley Irrigation District Water Enterprise 55,159 3,415 - 55
Siskiyou Shasta Valley Cemetery District Cemetery - - 192,936 1,728
Siskiyou Shasta Valley Resource Conservation District Resource Conservation - - 1,062,581 905,409
Siskiyou Siskiyou Resource Conservation District Resource Conservation - - 373,742 351,499
Siskiyou South Yreka Fire Protection District Fire Protection - - 178,833 116,456
Siskiyou Tennant Community Services District Fire Protection - - 2,709 -
Siskiyou Tennant Community Services District Waste Disposal Enterprise 6,597 - - -
Siskiyou Tennant Community Services District Water Enterprise 27,637 - - -
Siskiyou Tulelake Irrigation District Water Enterprise 4,674,129 952,588 - 909,140
Siskiyou Tulelake Multi - County Fire Protection District Fire Protection - - 99,951 801
Siskiyou Weed Recreation and Park District Recreation and Park - - 1,289,906 1,006,601
Solano California Fairs Financing Authority Financing or Constructing Facilities - - 6,780,916 5,827,177
Solano Collinsville Levee District (Solano) Land Reclamation and Levee Maintenance - - 10,321 86
Solano Cordelia Fire Protection District Fire Protection - - 740,240 84,754
Solano Dixon Fire Protection District Fire Protection - - 541,822 5,314
Solano Dixon Public Library District Library Services - - 1,146,532 611,998
Solano Dixon Regional Watershed Joint Powers Authority Drainage and Drainage Maintenance - - 65,433 63,024
Solano Dixon Resource Conservation District Resource Conservation - - 1,020,873 35,873
Solano Dixon-Solano Water Authority Water Enterprise 1,767,861 5,552 - -
Solano Fairfield-Suisun Sewer District Waste Disposal Enterprise 25,515,012 161,265 - -
Solano Frost Lake Reclamation District No. 2129 (Solano) Land Reclamation and Levee Maintenance - - 6,358 -
Solano Greater Vallejo Recreation District Recreation and Park - - 7,497,205 405,763
Solano Maine Prairie Water District Water Enterprise 1,131,840 57,140 - 2,493
Solano Montezuma Fire Protection District (Solano) Fire Protection - - 1,048,108 82,199
Solano North Bay Schools Insurance Authority Self Insurance - - 22,193,769 -
Solano Reclamation District No. 1607 Land Reclamation and Levee Maintenance - - 155,817 12,743
Solano Reclamation District No. 2060 Land Reclamation and Levee Maintenance - - 79,347 -
Solano Reclamation District No. 2068 Water Enterprise 1,235,869 178,066 - -
Solano Reclamation District No. 2084 Land Reclamation and Levee Maintenance - - 25,000 -
Solano Reclamation District No. 2093 Land Reclamation and Levee Maintenance - - 7,500 -
Solano Reclamation District No. 2098 Land Reclamation and Levee Maintenance - - 95,205 -
Solano Reclamation District No. 2112 Land Reclamation and Levee Maintenance - - 16,000 -
Solano Reclamation District No. 2130 Land Reclamation and Levee Maintenance - - 8 -
SCO_LAFCO FY 2014 Page 64 of 77 07/29/15

California State Controller's Office List includes only independent special districts
Data For LAFCO Fee Calculations Total Intergovernmental Revenues includes Federal,
Source: Special Districts Financial Transactions Report, Fiscal Year 2013-14 State, and Other Intergovernmental Agencies
Principal County Independent Special District Name Activity
Enterprise
Operating
Revenues
Enterprise
Non-Operating
Revenues
Non-Enterprise
General Purpose
Revenues
Total Inter
Governmental
Revenues
Solano Reclamation District No. 2134 Land Reclamation and Levee Maintenance - - 3,389 -
Solano Reclamation District No. 2135 Land Reclamation and Levee Maintenance - - 4,010 -
Solano Reclamation District No. 2136 Land Reclamation and Levee Maintenance - - 10,033 4,491
Solano Reclamation District No. 501 Land Reclamation and Levee Maintenance - - 400,978 -
Solano Reclamation District No. 536 Land Reclamation and Levee Maintenance - - 105,952 -
Solano Rio Vista - Montezuma Cemetery District Cemetery - - 649,215 6,104
Solano Rural North Vacaville Water District Water Enterprise 607,107 861,014 - -
Solano Silveyville Cemetery District Cemetery - - 530,957 4,348
Solano Solano Animal Control Authority Animal Control - - 700,121 -
Solano Solano County Mosquito Abatement District Pest Control - - 2,025,698 334,053
Solano Solano County Transit (Soltrans) Transit Enterprise 9,561,480 - - 5,468,442
Solano Solano County Water Agency Flood Control and Water Conservation - - 1,603,461 475,905
Solano Solano County Water Agency Water Enterprise 2,012,541 17,268,422 - 1,115,837
Solano Solano Emergency Medical Services Cooperative Governmental Services - - 2,352,526 -
Solano Solano Irrigation District Electric Enterprise 2,773,575 431,212 - -
Solano Solano Irrigation District Water Enterprise 15,456,935 5,506,228 - 344,011
Solano Solano Resource Conservation District Resource Conservation - - 1,107,205 139,808
Solano Solano Water Authority Water Enterprise - 304 - -
Solano Soltrans - Specialized Service Transit Enterprise 1,824,687 - - 1,657,823
Solano Suisun Fire Protection District Fire Protection - - 505,323 130,793
Solano Suisun Resource Conservation District Resource Conservation - - 1,002,667 483,962
Solano Suisun/Solano Water Authority Water Enterprise 4,732,999 63,941 - -
Solano Suisun-Fairfield-Rockville Cemetery District Cemetery - - 1,411,423 11,419
Solano Tri-City and County Regional Park and Open Space Group Recreation and Park - - 20,496 -
Solano Vacaville Fire Protection District Fire Protection - - 1,289,238 10,243
Solano Vacaville Unified School Library District Library Services - - 5,363,547 2,235,276
Solano Vacaville-Elmira Cemetery District Cemetery - - 889,218 6,092
Solano Vallejo Sanitation and Flood Control District Waste Disposal Enterprise 28,073,886 2,658,726 - 8,133
Sonoma Bennett Valley Fire Protection Fire Protection - - 792,408 52,678
Sonoma Bodega Bay Fire Protection District Fire Protection - - 1,786,354 27,590
Sonoma Bodega Bay Public Utility District Waste Disposal Enterprise 1,292,394 - - -
Sonoma Bodega Bay Public Utility District Water Enterprise 819,193 352,503 - 2,900
Sonoma Camp Meeker Recreation and Park District Recreation and Park - - 66,040 438
Sonoma Camp Meeker Recreation and Park District Water Enterprise 117,876 129,375 - -
Sonoma Cazadero Community Services District Fire Protection - - 207,563 1,800
Sonoma Cazadero Community Services District Lighting and Lighting Maintenance - - 3,750 50
Sonoma Cazadero Community Services District Recreation and Park - - 11,593 77
Sonoma Cloverdale Fire Protection District Fire Protection - - 1,305,507 252,585
Sonoma Cloverdale Health Care District Ambulance Service - - 541,607 -
Sonoma Creekside Wastewater Authority Waste Disposal Enterprise - 5,000 - 5,000
Sonoma Del Rio Woods Recreation and Park District Recreation and Park - - 66,685 573
Sonoma Forestville Fire Protection District Fire Protection - - 1,743,639 324,162
SCO_LAFCO FY 2014 Page 65 of 77 07/29/15

California State Controller's Office List includes only independent special districts
Data For LAFCO Fee Calculations Total Intergovernmental Revenues includes Federal,
Source: Special Districts Financial Transactions Report, Fiscal Year 2013-14 State, and Other Intergovernmental Agencies
Principal County Independent Special District Name Activity
Enterprise
Operating
Revenues
Enterprise
Non-Operating
Revenues
Non-Enterprise
General Purpose
Revenues
Total Inter
Governmental
Revenues
Sonoma Forestville Water District Waste Disposal Enterprise 834,496 4,343 - -
Sonoma Forestville Water District Water Enterprise 754,164 139,802 - 1,073
Sonoma Geyserville Fire Protection District Fire Protection - - 891,679 6,886
Sonoma Glen Ellen Fire Protection District Fire Protection - - 884,888 80,605
Sonoma Gold Ridge Fire Protection District Fire Protection - - 1,803,295 200,185
Sonoma Gold Ridge Resource Conservation District Resource Conservation - - 1,545,198 1,519,877
Sonoma Graton Community Services District Waste Disposal Enterprise 1,040,778 718,435 - 695,053
Sonoma Graton Fire Protection District Fire Protection - - 686,593 27,114
Sonoma Green Valley Cemetery District Cemetery - - 11,954 83
Sonoma Kenwood Fire Protection District Fire Protection - - 741,458 9,739
Sonoma Monte Rio Fire Protection District Fire Protection - - 346,040 24,943
Sonoma Monte Rio Recreation and Park District Recreation and Park - - 250,352 11,087
Sonoma North Bay Cooperative Library District Library Services - - 6,044 -
Sonoma North Bay Water District Water Enterprise - 317 - -
Sonoma NorthNet Library System Library Services - - 898,706 466,850
Sonoma Occidental Community Services District Fire Protection - - 371,094 20,119
Sonoma Occidental Community Services District Water Enterprise 88,335 67,139 - -
Sonoma Petaluma Health Care District Health - - 2,340,328 -
Sonoma Rains Creek Water District Water Enterprise 103,754 430 - -
Sonoma Rancho Adobe Fire Protection District Fire Protection - - 3,826,551 725,860
Sonoma Redwood Empire Dispatch Communications Authority Fire Protection - - 3,461,848 -
Sonoma Redwood Empire Municipal Insurance Fund Self Insurance - - 9,014,215 -
Sonoma Redwood Empire School Insurance Group Self Insurance - - 17,044,646 -
Sonoma Rincon Valley Fire Protection District Fire Protection - - 4,869,324 65,702
Sonoma Roseland Fire Protection District Fire Protection - - 570,470 5,803
Sonoma Russian River County Water District Water Enterprise 516,643 4,216 - -
Sonoma Russian River Fire Protection District Fire Protection - - 2,018,657 6,951
Sonoma Russian River Recreation and Park District Recreation and Park - - 271,875 (30,034)
Sonoma Schell-Vista Fire Protection District Fire Protection - - 787,451 51,565
Sonoma Shiloh Cemetery District Cemetery - - 472,794 4,033
Sonoma Sonoma County Library Library Services - - 16,321,731 510,736
Sonoma Sonoma County Public Safety Consortium Police Protection and Personal Safety - - 1,801,389 1,798,392
Sonoma Sonoma County Waste Management Agency Waste Disposal Enterprise 6,026,386 56,047 - -
Sonoma Sonoma Mountain County Water District Water Enterprise 71,992 10,958 - 48
Sonoma Sonoma Resource Conservation District Resource Conservation - - 2,250,934 1,874,078
Sonoma Sweetwater Springs Water District Water Enterprise 2,222,308 875,702 - -
Sonoma The California Authority of Racing Fairs Governmental Services - - 1,444,653 -
Sonoma Timber Cove County Water District Water Enterprise 276,875 31,722 - -
Sonoma Timber Cove Fire Protection District Fire Protection - - 155,840 1,045
Sonoma Valley of the Moon Fire Protection District Fire Protection - - 8,561,637 5,036,036
Sonoma Valley of the Moon Water District Water Enterprise 4,691,915 49,453 - -
Sonoma Windsor County Water District Waste Disposal Enterprise 7,572,850 542,051 - 120
SCO_LAFCO FY 2014 Page 66 of 77 07/29/15
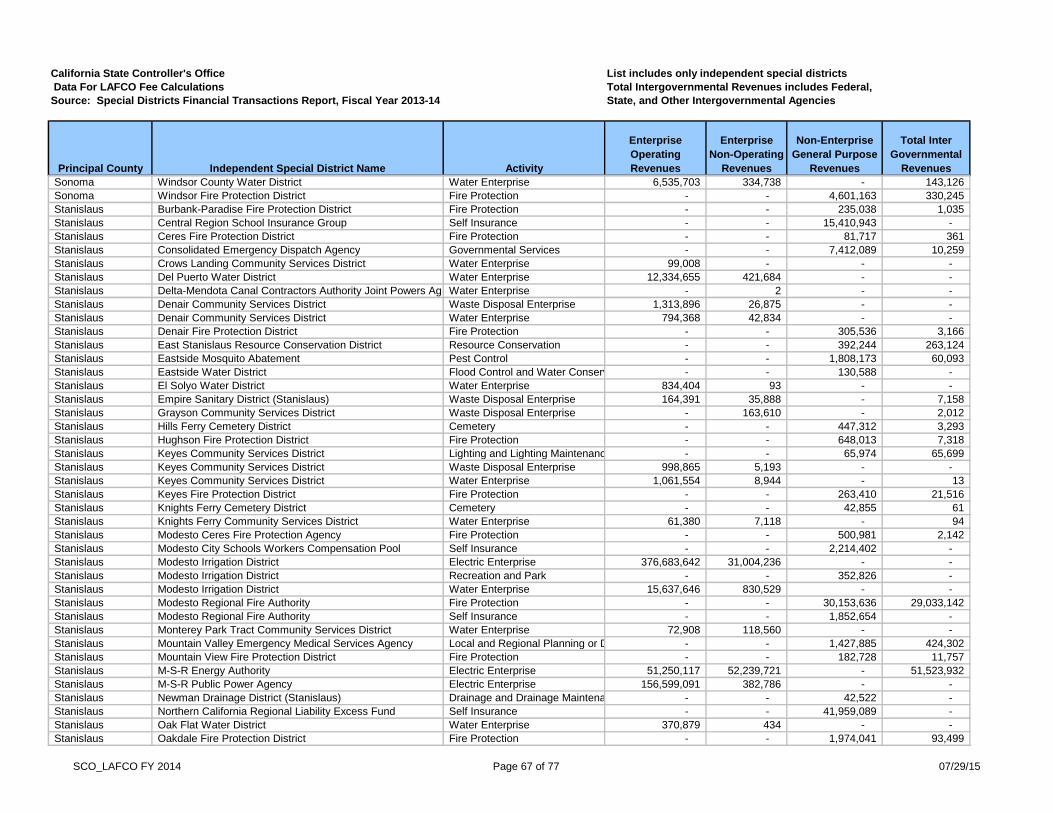
California State Controller's Office List includes only independent special districts
Data For LAFCO Fee Calculations Total Intergovernmental Revenues includes Federal,
Source: Special Districts Financial Transactions Report, Fiscal Year 2013-14 State, and Other Intergovernmental Agencies
Principal County Independent Special District Name Activity
Enterprise
Operating
Revenues
Enterprise
Non-Operating
Revenues
Non-Enterprise
General Purpose
Revenues
Total Inter
Governmental
Revenues
Sonoma Windsor County Water District Water Enterprise 6,535,703 334,738 - 143,126
Sonoma Windsor Fire Protection District Fire Protection - - 4,601,163 330,245
Stanislaus Burbank-Paradise Fire Protection District Fire Protection - - 235,038 1,035
Stanislaus Central Region School Insurance Group Self Insurance - - 15,410,943 -
Stanislaus Ceres Fire Protection District Fire Protection - - 81,717 361
Stanislaus Consolidated Emergency Dispatch Agency Governmental Services - - 7,412,089 10,259
Stanislaus Crows Landing Community Services District Water Enterprise 99,008 - - -
Stanislaus Del Puerto Water District Water Enterprise 12,334,655 421,684 - -
Stanislaus Delta-Mendota Canal Contractors Authority Joint Powers AgencyWater Enterprise - 2 - -
Stanislaus Denair Community Services District Waste Disposal Enterprise 1,313,896 26,875 - -
Stanislaus Denair Community Services District Water Enterprise 794,368 42,834 - -
Stanislaus Denair Fire Protection District Fire Protection - - 305,536 3,166
Stanislaus East Stanislaus Resource Conservation District Resource Conservation - - 392,244 263,124
Stanislaus Eastside Mosquito Abatement Pest Control - - 1,808,173 60,093
Stanislaus Eastside Water District Flood Control and Water Conservation - - 130,588 -
Stanislaus El Solyo Water District Water Enterprise 834,404 93 - -
Stanislaus Empire Sanitary District (Stanislaus) Waste Disposal Enterprise 164,391 35,888 - 7,158
Stanislaus Grayson Community Services District Waste Disposal Enterprise - 163,610 - 2,012
Stanislaus Hills Ferry Cemetery District Cemetery - - 447,312 3,293
Stanislaus Hughson Fire Protection District Fire Protection - - 648,013 7,318
Stanislaus Keyes Community Services District Lighting and Lighting Maintenance - - 65,974 65,699
Stanislaus Keyes Community Services District Waste Disposal Enterprise 998,865 5,193 - -
Stanislaus Keyes Community Services District Water Enterprise 1,061,554 8,944 - 13
Stanislaus Keyes Fire Protection District Fire Protection - - 263,410 21,516
Stanislaus Knights Ferry Cemetery District Cemetery - - 42,855 61
Stanislaus Knights Ferry Community Services District Water Enterprise 61,380 7,118 - 94
Stanislaus Modesto Ceres Fire Protection Agency Fire Protection - - 500,981 2,142
Stanislaus Modesto City Schools Workers Compensation Pool Self Insurance - - 2,214,402 -
Stanislaus Modesto Irrigation District Electric Enterprise 376,683,642 31,004,236 - -
Stanislaus Modesto Irrigation District Recreation and Park - - 352,826 -
Stanislaus Modesto Irrigation District Water Enterprise 15,637,646 830,529 - -
Stanislaus Modesto Regional Fire Authority Fire Protection - - 30,153,636 29,033,142
Stanislaus Modesto Regional Fire Authority Self Insurance - - 1,852,654 -
Stanislaus Monterey Park Tract Community Services District Water Enterprise 72,908 118,560 - -
Stanislaus Mountain Valley Emergency Medical Services Agency Local and Regional Planning or Development - - 1,427,885 424,302
Stanislaus Mountain View Fire Protection District Fire Protection - - 182,728 11,757
Stanislaus M-S-R Energy Authority Electric Enterprise 51,250,117 52,239,721 - 51,523,932
Stanislaus M-S-R Public Power Agency Electric Enterprise 156,599,091 382,786 - -
Stanislaus Newman Drainage District (Stanislaus) Drainage and Drainage Maintenance - - 42,522 -
Stanislaus Northern California Regional Liability Excess Fund Self Insurance - - 41,959,089 -
Stanislaus Oak Flat Water District Water Enterprise 370,879 434 - -
Stanislaus Oakdale Fire Protection District Fire Protection - - 1,974,041 93,499
SCO_LAFCO FY 2014 Page 67 of 77 07/29/15

California State Controller's Office List includes only independent special districts
Data For LAFCO Fee Calculations Total Intergovernmental Revenues includes Federal,
Source: Special Districts Financial Transactions Report, Fiscal Year 2013-14 State, and Other Intergovernmental Agencies
Principal County Independent Special District Name Activity
Enterprise
Operating
Revenues
Enterprise
Non-Operating
Revenues
Non-Enterprise
General Purpose
Revenues
Total Inter
Governmental
Revenues
Stanislaus Oakdale Irrigation District Electric Enterprise 11,314,546 848,422 - 736,218
Stanislaus Oakdale Irrigation District Water Enterprise 5,907,793 21,098,415 - 44,602
Stanislaus Orestimba Creek Flood Control District Flood Control and Water Conservation - - 15,642 -
Stanislaus Patterson Cemetery District Cemetery - - 331,128 2,206
Stanislaus Patterson Water District Water Enterprise 5,165,243 127,280 - -
Stanislaus Reclamation District No. 2063 Land Reclamation and Levee Maintenance - - 106,654 773
Stanislaus Reclamation District No. 2091 Land Reclamation and Levee Maintenance - - 121,152 115,724
Stanislaus Reclamation District No. 2143 (Wendt Ranch) Land Reclamation and Levee Maintenance - - 19 -
Stanislaus Riverdale Park Tract Community Services District Water Enterprise 40,119 7,436 - -
Stanislaus Rock Creek Water District Electric Enterprise 50,354 121 - -
Stanislaus Rock Creek Water District Water Enterprise 1,700 15,560 - -
Stanislaus Salida Fire Protection District Fire Protection - - 1,107,462 9,654
Stanislaus Salida Sanitary District (Stanislaus) Waste Disposal Enterprise 43,283 2,315,527 - 9,617
Stanislaus San Joaquin River Group Authority Water Enterprise 225,223 635 - -
Stanislaus San Joaquin Tributaries Authority Flood Control and Water Conservation - - 1,809,464 1,707,000
Stanislaus Sand Creek Flood Control District Flood Control and Water Conservation - - 12,619 -
Stanislaus Stanislaus Consolidated Fire Protection District Fire Protection - - 9,750,713 265,600
Stanislaus Stanislaus Drug Enforcement Agency Police Protection and Personal Safety - - 2,411,188 2,120,400
Stanislaus Stanislaus Regional Water Authority Water Enterprise 96,278 - - -
Stanislaus Tuolumne Wind Project Authority Electric Enterprise 32,956,000 3,449,000 - -
Stanislaus Turlock Fire Protection District Fire Protection - - 242,409 7,201
Stanislaus Turlock Irrigation District Electric Enterprise 351,587,630 561,041 - -
Stanislaus Turlock Irrigation District Water Enterprise 8,602,123 1,397,927 - -
Stanislaus Turlock Mosquito Abatement District Pest Control - - 1,765,250 271,046
Stanislaus Turlock Public Schools Financing Authority Financing or Constructing Facilities - - 308,866 -
Stanislaus Walnut Energy Center Authority Electric Enterprise - 76,611,000 - -
Stanislaus Waterford Public Financing Authority Financing or Constructing Facilities - - 582,404 -
Stanislaus West Side Community Healthcare District Ambulance Service - - 1,737,295 3,023
Stanislaus West Stanislaus Fire Protection District Fire Protection - - 939,618 6,263
Stanislaus West Stanislaus Irrigation District Water Enterprise 6,302,757 1,231,911 - 8,500
Stanislaus West Stanislaus Resource Conservation District Resource Conservation - - 30,813 399
Stanislaus Western Hills Water District Water Enterprise 1,851,345 4,750,564 - -
Stanislaus Westley Community Services District Waste Disposal Enterprise 19,415 1,655 - 5
Stanislaus Westley Community Services District Water Enterprise 26,591 1,656 - 5
Stanislaus Westport Fire Protection District Fire Protection - - 165,140 1,262
Stanislaus Woodland Ave Fire Protection District Fire Protection - - 258,589 76,271
Sutter Fairview Cemetery District Cemetery - - 59,426 560
Sutter Feather Water District Drainage and Drainage Maintenance - - 12,380 -
Sutter Feather Water District Water Enterprise 935,616 19,017 - -
Sutter Gilsizer Drainage District (Sutter) Drainage and Drainage Maintenance - - 478,587 44,206
Sutter Levee District No. 1 (Sutter) Flood Control and Water Conservation - - 432,484 3,448
Sutter Levee District No. 9 (Sutter) Flood Control and Water Conservation - - 77,816 1,080
SCO_LAFCO FY 2014 Page 68 of 77 07/29/15
California State Controller's Office List includes only independent special districts
Data For LAFCO Fee Calculations Total Intergovernmental Revenues includes Federal,
Source: Special Districts Financial Transactions Report, Fiscal Year 2013-14 State, and Other Intergovernmental Agencies
Principal County Independent Special District Name Activity
Enterprise
Operating
Revenues
Enterprise
Non-Operating
Revenues
Non-Enterprise
General Purpose
Revenues
Total Inter
Governmental
Revenues
Sutter Live Oak Cemetery District Cemetery - - 244,413 1,076
Sutter Meridian Fire Protection Fire Protection - - 329,513 2,791
Sutter Nicolaus Cemetery District Cemetery - - 23,799 273
Sutter Pleasant Grove Cemetery District Cemetery - - 28,462 321
Sutter Reclamation District No. 1001 Land Reclamation and Levee Maintenance - - 684,734 -
Sutter Reclamation District No. 1500 Flood Control and Water Conservation - - 1,935,986 -
Sutter Reclamation District No. 1660 Land Reclamation and Levee Maintenance - - 264,506 -
Sutter Reclamation District No. 2054 Land Reclamation and Levee Maintenance - - 54,166 568
Sutter Reclamation District No. 2056 Land Reclamation and Levee Maintenance - - 67,010 467
Sutter Reclamation District No. 70 Land Reclamation and Levee Maintenance - - 296,141 -
Sutter Reclamation District No. 777 Land Reclamation and Levee Maintenance - - 172,637 1,031
Sutter South Sutter Water District Electric Enterprise - 232,891 - -
Sutter South Sutter Water District Recreation and Park - - 27,500 -
Sutter South Sutter Water District Water Enterprise 902,386 7,624 - -
Sutter Sutter Animal Services Authority Animal Control - - 990,799 825,324
Sutter Sutter Basin Fire Protection District Fire Protection - - 82,060 1,174
Sutter Sutter Cemetery District Cemetery - - 1,200,041 7,298
Sutter Sutter Community Service District Water Enterprise 756,881 11,016 - -
Sutter Sutter County Resource Conservation District Resource Conservation - - 134,255 42,687
Sutter Sutter Extension Water District Water Enterprise 1,309,972 910 - -
Sutter Sutter-Butte Flood Control Agency Flood Control and Water Conservation - - 768,241 -
Sutter Sutter-Yuba Mosquito Abatement District Pest Control - - 2,756,796 39,709
Sutter Tri County Schools Insurance Group Self Insurance - - 61,147,200 -
Sutter Yuba Sutter Transit Authority Transit Enterprise 6,316,625 - - 4,835,337
Tehama Belle Mill Cemetery District Cemetery - - 512 -
Tehama Capay Fire Protection District Fire Protection - - 73,850 1,518
Tehama Corning Cemetery District Cemetery - - 288,524 2,767
Tehama Corning Water District Water Enterprise 595,807 208,301 - 44
Tehama Deer Creek Irrigation District Water Enterprise - 3,070 - -
Tehama El Camino Irrigation District Water Enterprise 444,282 1,498 - -
Tehama Gerber-Las Flores Community Services District Lighting and Lighting Maintenance - - 56,044 1
Tehama Gerber-Las Flores Community Services District Waste Disposal Enterprise 181,927 19,000 - -
Tehama Gerber-Las Flores Community Services District Water Enterprise 161,332 21,000 - -
Tehama Kirkwood Cemetery District Cemetery - - 4,135 69
Tehama Kirkwood Water District Water Enterprise 40,530 - - -
Tehama Los Molinos Cemetery District Cemetery - - 59,688 1,688
Tehama Los Molinos Community Services District Water Enterprise 137,008 105,385 - 40,055
Tehama Manton Cemetery District Cemetery - - 43,177 1,362
Tehama Paskenta Cemetery District Cemetery - - 16,394 3,069
Tehama Paskenta Community Services District Water Enterprise 39,316 256,978 - 253,783
Tehama Proberta Water District Water Enterprise 146,174 1,857 - -
Tehama Red Bluff Cemetery District Cemetery - - 431,311 5,593
SCO_LAFCO FY 2014 Page 69 of 77 07/29/15

California State Controller's Office List includes only independent special districts
Data For LAFCO Fee Calculations Total Intergovernmental Revenues includes Federal,
Source: Special Districts Financial Transactions Report, Fiscal Year 2013-14 State, and Other Intergovernmental Agencies
Principal County Independent Special District Name Activity
Enterprise
Operating
Revenues
Enterprise
Non-Operating
Revenues
Non-Enterprise
General Purpose
Revenues
Total Inter
Governmental
Revenues
Tehama Rio Alto Water District Waste Disposal Enterprise 483,286 459,846 - 870
Tehama Rio Alto Water District Water Enterprise 556,202 98,766 - 1,821
Tehama Tehama Cemetery District Cemetery - - 54,688 506
Tehama Tehama County Mosquito and Vector Control Pest Control - - 684,273 6,898
Tehama Tehama County Resource Conservation District Resource Conservation - - 964,481 602,232
Tehama Tehama County Sanitary Landfill Agency Waste Disposal Enterprise 58,653 78,307 - 45,095
Tehama Tehama County/Red Bluff Landfill Management Agency Waste Disposal Enterprise 340,846 128,929 - 68,186
Tehama Thomes Creek Water District Water Enterprise 22,545 1,527 - -
Tehama Vina Cemetery District Cemetery - - 5,676 228
Trinity Coffee Creek Fire Protection District Fire Protection - - 46,731 700
Trinity Douglas City Community Services District Fire Protection - - 75,650 14,074
Trinity Greater Hayfork Valley Park and Recreation District Recreation and Park - - 40,522 -
Trinity Hayfork Fire Protection District Fire Protection - - 458,994 298,846
Trinity Hyampom Community Service District Fire Protection - - 35,008 96
Trinity Junction City Fire Protection District Fire Protection - - 28,424 6,200
Trinity Lewiston Community Services District Fire Protection - - 128,438 2,851
Trinity Lewiston Community Services District Water Enterprise 56,103 288,759 - 286,943
Trinity Post Mountain Public Utility District Fire Protection - - 16,636 -
Trinity Ruth Lake Community Services District Recreation and Park - - 1,230,536 462,145
Trinity Salyer Community Service District Fire Protection - - 57,831 -
Trinity Trinity Center Community Services District Fire Protection - - 60,036 835
Trinity Trinity County Public Utilities District Electric Enterprise 11,279,569 31,477 - -
Trinity Trinity County Resource and Water Conservation District Resource Conservation - - 1,843,475 1,496,529
Trinity Trinity County Waterworks District No. 1 Waste Disposal Enterprise 152,624 39,381 - -
Trinity Trinity County Waterworks District No. 1 Water Enterprise 353,627 22,209 - 400
Trinity Weaverville / Douglas City Parks and Recreation District Recreation and Park - - 129,440 1,191
Trinity Weaverville Community Services District Water Enterprise 916,941 46,891 - -
Trinity Weaverville Fire Protection District Fire Protection - - 252,606 3,115
Trinity Weaverville Sanitary District (Trinity) Waste Disposal Enterprise 556,221 34,948 - 60
Tulare Allensworth Community Services District Water Enterprise 116,446 39,989 - 39,989
Tulare Alpaugh Irrigation District Water Enterprise 1,267,361 332,731 - 1,549
Tulare Alpaugh Joint Powers Authority Water Enterprise 292,026 68,888 - 50,129
Tulare Alpine Village-Sequoia Crest Community Services District Streets and Roads - Construction and Maintenance- - 29,634 215
Tulare Alta Cemetery District Cemetery - - 822,103 23,261
Tulare Alta Irrigation District Water Enterprise 2,414,641 942,163 - 733,514
Tulare Angiola Water District Water Enterprise 5,981,624 96,386 - -
Tulare Atwell Island Water District Water Enterprise 19,951 83,732 - -
Tulare Authority for California Cities Excess Liability (ACCEL) Self Insurance - - 13,173,612 -
Tulare Central California Tristeza Eradication Agency Pest Control - - 1,670,490 1,657,241
Tulare Central San Joaquin Valley Risk Management Authority Self Insurance - - 30,713,595 -
Tulare Central Tulare County School Districts Self-Insurance AuthoritySelf Insurance - - 1,752,452 -
Tulare Consolidated Central Valley Table Grape Pest and Disease Control DistrictPest Control - - 832,434 -
SCO_LAFCO FY 2014 Page 70 of 77 07/29/15

California State Controller's Office List includes only independent special districts
Data For LAFCO Fee Calculations Total Intergovernmental Revenues includes Federal,
Source: Special Districts Financial Transactions Report, Fiscal Year 2013-14 State, and Other Intergovernmental Agencies
Principal County Independent Special District Name Activity
Enterprise
Operating
Revenues
Enterprise
Non-Operating
Revenues
Non-Enterprise
General Purpose
Revenues
Total Inter
Governmental
Revenues
Tulare Consolidated Waste Management Authority Waste Disposal Enterprise - 457,365 - 457,033
Tulare Cutler Public Utility District Waste Disposal Enterprise 505,598 12,703 - 9,545
Tulare Cutler Public Utility District Water Enterprise 439,562 346,359 - 325,055
Tulare Deer Creek and Tule River Authority Water Enterprise 64,384 482 - -
Tulare Deer Creek Storm Water District (Tulare) Flood Control and Water Conservation - - 31,385 546
Tulare Delano-Earlimart Irrigation District Water Enterprise 11,194,924 70,927 - -
Tulare Delta Vector Control District Pest Control - - 2,939,662 323,924
Tulare Dinuba Memorial District Memorial - - 158,794 8,236
Tulare Ducor Community Services District Water Enterprise 137,024 17,547 - -
Tulare Ducor Irrigation District Water Enterprise - 1,615 - -
Tulare Earlimart Public Utility District Waste Disposal Enterprise 359,936 22,275 - 4,800
Tulare Earlimart Public Utility District Water Enterprise 499,470 2,100 - -
Tulare East Orosi Community Services District Waste Disposal Enterprise 51,310 408 - -
Tulare East Orosi Community Services District Water Enterprise 22,073 604 - 1
Tulare Eshom Valley Cemetery District Cemetery - - 12,199 119
Tulare Exeter District Ambulance Ambulance Service - - 1,311,958 9,744
Tulare Exeter Irrigation District Water Enterprise 1,346,666 401,508 - -
Tulare Exeter Memorial District Memorial - - 264,920 -
Tulare Exeter Public Cemetery District Cemetery - - 306,472 -
Tulare Friant Power Authority Electric Enterprise 2,920,370 1,339 - -
Tulare Goshen Community Services District Waste Disposal Enterprise 964,052 953,259 - 53,049
Tulare Goshen Public Financing Authority Financing or Constructing Facilities - - 53,024 53,000
Tulare Ivanhoe Irrigation District Water Enterprise 1,007,071 435,940 - 1,747
Tulare Ivanhoe Memorial District Memorial - - 31,434 330
Tulare Ivanhoe Public Utility District Electric Enterprise 19,771 - - -
Tulare Ivanhoe Public Utility District Waste Disposal Enterprise 295,253 104,241 - 32,106
Tulare Ivanhoe Public Utility District Water Enterprise 442,207 7,776 - -
Tulare Kaweah Delta Water Conservation District Flood Control and Water Conservation - - 5,431,035 1,119,940
Tulare Kaweah River Power Authority Electric Enterprise 1,127,884 22,269 - 12,922
Tulare King-Tulare Area Agency on Aging Local and Regional Planning or Development - - 3,440,299 3,435,509
Tulare Lemon Cove Sanitary District (Tulare) Waste Disposal Enterprise 10,296 3,064 - 25
Tulare Lemon Cove Sanitary District (Tulare) Water Enterprise 7,148 3,064 - 25
Tulare Levee District No. 1 (Tulare) Flood Control and Water Conservation - - 716 -
Tulare Levee District No. 2 (Tulare) Flood Control and Water Conservation - - 82 -
Tulare Lewis Creek Water District Water Enterprise 135,592 196 - -
Tulare Lindmore Irrigation District Water Enterprise 3,496,510 590,982 - 432,758
Tulare Lindsay - Strathmore Cemetery District Cemetery - - 512,962 12,807
Tulare Lindsay - Strathmore Memorial District Memorial - - 166,135 1,311
Tulare Lindsay-Strathmore Irrigation District Water Enterprise 5,236,375 1,558,098 - 556,318
Tulare London Community Services District Waste Disposal Enterprise 217,343 2,964 - -
Tulare London Community Services District Water Enterprise 218,258 16,604 - 150
Tulare Lower Tule River Irrigation District Water Enterprise 6,348,171 2,507,913 - 1,727
SCO_LAFCO FY 2014 Page 71 of 77 07/29/15

California State Controller's Office List includes only independent special districts
Data For LAFCO Fee Calculations Total Intergovernmental Revenues includes Federal,
Source: Special Districts Financial Transactions Report, Fiscal Year 2013-14 State, and Other Intergovernmental Agencies
Principal County Independent Special District Name Activity
Enterprise
Operating
Revenues
Enterprise
Non-Operating
Revenues
Non-Enterprise
General Purpose
Revenues
Total Inter
Governmental
Revenues
Tulare Orosi Memorial District Memorial - - 85,222 9,294
Tulare Orosi Public Utility District Lighting and Lighting Maintenance - - 41,203 -
Tulare Orosi Public Utility District Waste Disposal Enterprise 824,548 84,527 - 23,787
Tulare Orosi Public Utility District Water Enterprise 656,493 60,935 - 23,787
Tulare Patterson Tract Community Service District Water Enterprise 57,815 1,359 - -
Tulare Pixley Irrigation District Water Enterprise 1,763,932 2,058,663 - 721,145
Tulare Pixley Public Utility District Waste Disposal Enterprise 458,138 7,417 - -
Tulare Pixley Public Utility District Water Enterprise 409,327 649,428 - 642,011
Tulare Ponderosa Community Services District Streets and Roads - Construction and Maintenance- - 86,435 1
Tulare Ponderosa Community Services District Water Enterprise 107,960 316,844 - 310,000
Tulare Poplar Community Service District Recreation and Park - - 6,020 -
Tulare Poplar Community Service District Waste Disposal Enterprise 231,344 69,511 - 65,338
Tulare Poplar Community Service District Water Enterprise 206,962 15,159 - 5,036
Tulare Porter Vista Public Utility District Waste Disposal Enterprise 510,840 116,320 - 1,020
Tulare Porterville Cemetery District Cemetery - - 898,704 2,715
Tulare Porterville Irrigation District Water Enterprise 6,143,378 494,840 - -
Tulare Porterville Memorial District Memorial - - 377,740 6,858
Tulare Richgrove Community Services District Streets and Roads - Construction and Maintenance- - 209,572 -
Tulare Richgrove Community Services District Waste Disposal Enterprise 100,156 11,992 - 33
Tulare Richgrove Community Services District Water Enterprise 125,532 2,928 - 33
Tulare Saucelito Irrigation District Water Enterprise 1,629,066 99,685 - -
Tulare School Employees Trust-Tulare Self Insurance - - 154 -
Tulare Sequoia Memorial District Memorial - - 24,374 251
Tulare South Tulare Memorial District Memorial - - 414,471 3,560
Tulare Southern Tulare County Citrus Pest Control District Pest Control - - 472,727 -
Tulare Springville Memorial District Memorial - - 126,032 717
Tulare Springville Public Utility District Waste Disposal Enterprise 263,113 14,452 - 109
Tulare Springville Public Utility District Water Enterprise 283,682 354,818 - 340,474
Tulare St. Johns Water District Water Enterprise 191,785 977 - -
Tulare Stone Corral Irrigation District Water Enterprise 1,885,428 341,779 - -
Tulare Strathmore Fire Protection District Fire Protection - - 26,642 265
Tulare Strathmore Public Utility District Waste Disposal Enterprise 207,099 72,236 - 692
Tulare Strathmore Public Utility District Water Enterprise 517,555 20,779 - 231
Tulare Sultana Community Services District Waste Disposal Enterprise 86,969 5,118 - 46
Tulare Sultana Community Services District Water Enterprise 82,078 4,640 - 46
Tulare Tea Pot Dome Water District Water Enterprise 1,067,574 107,906 - (4,975)
Tulare Terra Bella Irrigation District Water Enterprise 4,796,302 356,464 - -
Tulare Terra Bella Memorial District Memorial - - 84,462 760
Tulare Teviston Community Services District Water Enterprise 100,129 279 - -
Tulare Three Rivers Cemetery District Cemetery - - 19,108 73
Tulare Three Rivers Community Services District Waste Disposal Enterprise 59,347 53,146 - 17,963
Tulare Three Rivers Community Services District Water Enterprise 48,015 333,147 - 225,200
SCO_LAFCO FY 2014 Page 72 of 77 07/29/15

California State Controller's Office List includes only independent special districts
Data For LAFCO Fee Calculations Total Intergovernmental Revenues includes Federal,
Source: Special Districts Financial Transactions Report, Fiscal Year 2013-14 State, and Other Intergovernmental Agencies
Principal County Independent Special District Name Activity
Enterprise
Operating
Revenues
Enterprise
Non-Operating
Revenues
Non-Enterprise
General Purpose
Revenues
Total Inter
Governmental
Revenues
Tulare Three Rivers Memorial District Memorial - - 115,490 581
Tulare Tipton Community Services District Waste Disposal Enterprise 198,075 22,504 - 129
Tulare Tipton Community Services District Water Enterprise 292,606 45,680 - 13,038
Tulare Tipton-Pixley Cemetery District Cemetery - - 130,078 5,652
Tulare Tract 92-Community Services District Water Enterprise 22,124 371 - -
Tulare Tulare Area Schools Employee Benefit Authority Self Insurance - - 19,909,312 -
Tulare Tulare Cemetery District Cemetery - - 753,968 1,364
Tulare Tulare County Pest Control District Pest Control - - 685,102 97,354
Tulare Tulare County Resource Conservation District Resource Conservation - - 596,993 -
Tulare Tulare County School Districts Self-Insurance Authority Self Insurance - - 2,971,245 -
Tulare Tulare County Schools Insurance Group Self Insurance - - 17,561,834 -
Tulare Tulare Irrigation District Water Enterprise 9,574,441 460,340 - 194,378
Tulare Tulare Memorial District Memorial - - 609,023 5,205
Tulare Tulare Mosquito Abatement District Pest Control - - 1,284,044 12,691
Tulare Vandalia Water District Water Enterprise 412,544 24,234 - 274
Tulare Visalia Cemetery District Cemetery - - 1,124,148 13,805
Tulare Visalia Memorial District Memorial - - 270,593 15,860
Tulare Woodlake Cemetery District Cemetery - - 154,100 528
Tulare Woodlake Fire Protection District Fire Protection - - 511,651 84,452
Tulare Woodlake Memorial District Memorial - - 109,202 9,033
Tulare Woodville Cemetery District Cemetery - - 144,387 690
Tulare Woodville Public Utility District Waste Disposal Enterprise 123,684 51,760 - 473
Tulare Woodville Public Utility District Water Enterprise 193,313 615 - -
Tuolumne Carters Cemetery District Cemetery - - 58,931 662
Tuolumne Columbia Cemetery District Cemetery - - 27,722 387
Tuolumne Columbia Fire Protection District Fire Protection - - 139,893 53,873
Tuolumne Groveland Community Services District Fire Protection - - 899,626 17,537
Tuolumne Groveland Community Services District Recreation and Park - - 79,089 1,525
Tuolumne Groveland Community Services District Waste Disposal Enterprise 1,858,193 89,070 - -
Tuolumne Groveland Community Services District Water Enterprise 2,613,133 30,683 - -
Tuolumne Jamestown Cemetery District Cemetery - - 3,766 49
Tuolumne Jamestown Fire Protection District Fire Protection - - 82,757 1,774
Tuolumne Jamestown Sanitary District (Tuolumne) Waste Disposal Enterprise 791,364 102,986 - 11,822
Tuolumne Leland Meadow Water District Waste Disposal Enterprise 40,036 3,009 - -
Tuolumne Leland Meadow Water District Water Enterprise 40,036 3,009 - -
Tuolumne Mi-Wuk-Sugar Pine Fire Protection District of Tuolumne CountyFire Protection - - 427,160 20,111
Tuolumne Oak Grove Cemetery District (Tuolumne) Cemetery - - 10,260 163
Tuolumne Shaws Flat-Springfield Cemetery District Cemetery - - 6,634 79
Tuolumne Strawberry Fire Protection District Fire Protection - - 71,751 1,427
Tuolumne Tri-Dam Power Authority Electric Enterprise 4,806,491 6,569 - -
Tuolumne Tuolumne City Sanitary District Waste Disposal Enterprise 1,126,518 65,691 - 804
Tuolumne Tuolumne City Sanitary District Financing Authority Financing or Constructing Facilities - - 174,852 -
SCO_LAFCO FY 2014 Page 73 of 77 07/29/15
California State Controller's Office List includes only independent special districts
Data For LAFCO Fee Calculations Total Intergovernmental Revenues includes Federal,
Source: Special Districts Financial Transactions Report, Fiscal Year 2013-14 State, and Other Intergovernmental Agencies
Principal County Independent Special District Name Activity
Enterprise
Operating
Revenues
Enterprise
Non-Operating
Revenues
Non-Enterprise
General Purpose
Revenues
Total Inter
Governmental
Revenues
Tuolumne Tuolumne County Economic Development Authority Local and Regional Planning or Development - - 343,268 342,000
Tuolumne Tuolumne County Resource Conservation District Resource Conservation - - 62,686 15,548
Tuolumne Tuolumne Fire Protection District Fire Protection - - 545,183 484,457
Tuolumne Tuolumne Joint Powers Authority Self Insurance - - 3,448,492 -
Tuolumne Tuolumne Park and Recreation District Recreation and Park - - 231,999 1,954
Tuolumne Tuolumne Utilities District Waste Disposal Enterprise 3,106,314 275,701 - 2,447
Tuolumne Tuolumne Utilities District Water Enterprise 9,770,328 836,256 - 130,628
Tuolumne Twain Harte Community Services District Fire Protection - - 1,089,896 4,835
Tuolumne Twain Harte Community Services District Recreation and Park - - 134,311 655
Tuolumne Twain Harte Community Services District Waste Disposal Enterprise 823,767 11,279 - -
Tuolumne Twain Harte Community Services District Water Enterprise 1,023,591 117,897 - 145
Ventura Bardsdale Cemetery District Cemetery - - 178,310 2,829
Ventura Beach Erosion Authority For Clean Oceans and Nourishment Resource Conservation - - 103,516 103,208
Ventura Bell Canyon Community Services District Waste Disposal Enterprise - 464,992 - 4,043
Ventura Black Gold Cooperative Library System Library Services - - 1,356,114 -
Ventura Blanchard/Santa Paula Public Library District Library Services - - 929,989 119,150
Ventura Calleguas Municipal Water District Water Enterprise 147,829,496 7,895,811 - 288,173
Ventura Camrosa Water District Waste Disposal Enterprise 3,140,580 47,319 - -
Ventura Camrosa Water District Water Enterprise 15,709,479 1,492,882 - 4,405
Ventura Casitas Municipal Water Water Enterprise 14,923,271 3,100,620 - 76,841
Ventura Channel Islands Beach Community Services District Waste Disposal Enterprise 2,361,577 9,223 - -
Ventura Channel Islands Beach Community Services District Water Enterprise 1,689,332 61,632 - -
Ventura Coastal Schools Employee Benefits Organization Self Insurance - - 44,458,554 -
Ventura Conejo Recreation and Park District Recreation and Park - - 22,706,394 3,049,907
Ventura Conejo Valley Open Space Conservation Agency Resource Conservation - - 1,268,900 1,188,474
Ventura El Rancho Simi Cemetery District Cemetery - - 145,921 544
Ventura Fillmore-Piru Memorial District Memorial - - 201,247 178
Ventura Fox Canyon Groundwater Management Agency Water Enterprise - 1,304,731 - -
Ventura Gold Coast Transit Transit Enterprise 18,531,482 - - 14,557,083
Ventura Hidden Valley Municipal Water District Water Enterprise - 8,115 - -
Ventura Meiners Oaks County Water District Water Enterprise 1,294,909 130,556 - 1,074
Ventura Montalvo Community Services District Waste Disposal Enterprise 397,066 276,058 - 2,376
Ventura Ojai Basin Groundwater Management Agency Water Enterprise 86,045 567 - -
Ventura Ojai Valley Sanitary District (Ventura) Waste Disposal Enterprise 8,261,529 935,280 - 5,170
Ventura Ojai Water Conservation District Flood Control and Water Conservation - - 8,013 70
Ventura Oxnard Drainage District No. 1 (Ventura) Drainage and Drainage Maintenance - - 48,241 -
Ventura Oxnard Drainage District No. 2 (Ventura) Drainage and Drainage Maintenance - - 163,234 -
Ventura Oxnard Harbor District Harbor and Port Enterprise 14,045,832 248,034 - -
Ventura Piru Cemetery District Cemetery - - 44,491 423
Ventura Pleasant Valley County Water District Water Enterprise 3,610,070 409,349 - 24,875
Ventura Pleasant Valley Recreation and Park District Recreation and Park - - 7,921,243 153,761
Ventura Port Hueneme Water Agency Water Enterprise 4,480,306 48,197 - -
SCO_LAFCO FY 2014 Page 74 of 77 07/29/15

California State Controller's Office List includes only independent special districts
Data For LAFCO Fee Calculations Total Intergovernmental Revenues includes Federal,
Source: Special Districts Financial Transactions Report, Fiscal Year 2013-14 State, and Other Intergovernmental Agencies
Principal County Independent Special District Name Activity
Enterprise
Operating
Revenues
Enterprise
Non-Operating
Revenues
Non-Enterprise
General Purpose
Revenues
Total Inter
Governmental
Revenues
Ventura Rancho Simi Recreation and Park District Recreation and Park - - 21,109,995 1,332,246
Ventura Saticoy Sanitary District (Ventura) Waste Disposal Enterprise 403,743 42,638 - 320
Ventura Teen Center Services Authority Recreation and Park - - 204,298 -
Ventura Triunfo County Sanitation District (Ventura) Waste Disposal Enterprise 9,669,902 26,272 - -
Ventura Triunfo County Sanitation District (Ventura) Water Enterprise 6,592,267 153,881 - -
Ventura United Water Conservation District Flood Control and Water Conservation - - 14,691,843 197,963
Ventura United Water Conservation District Recreation and Park - - 109,068 -
Ventura United Water Conservation District Water Enterprise 8,105,955 1,502,683 - -
Ventura Ventura County Air Pollution Control Air Pollution Control - - 11,336,081 8,033,315
Ventura Ventura County Fast Action School Transit (VCFAST) Governmental Services - - 114,876 114,724
Ventura Ventura County Regional Energy Alliance (VCREA) Governmental Services - - 221,994 -
Ventura Ventura County Resource Conservation Resource Conservation - - 654,147 636,162
Ventura Ventura County Schools Business Services Governmental Services - - 1,021,705 -
Ventura Ventura County Schools Self-Funding Authority Self Insurance - - 24,367,649 -
Ventura Ventura County Transportation Commission Transit Enterprise 9,117,919 - - 6,843,264
Ventura Ventura Port District Harbor and Port Enterprise 7,144,257 3,021,873 - 1,949,287
Ventura Ventura Region Sanitation District Waste Disposal Enterprise 20,033,901 473,154 - -
Ventura Ventura River County Water District Water Enterprise 2,088,552 35,136 - 272
Yolo Cacheville Community Services District Lighting and Lighting Maintenance - - 4,465 -
Yolo Cacheville Community Services District Water Enterprise 112,013 13,679 - 311
Yolo Capay Cemetery District Cemetery - - 90,921 523
Yolo Capay Valley Fire Protection District Fire Protection - - 382,687 169,784
Yolo Clarksburg Fire Protection District Fire Protection - - 200,831 223
Yolo Cottonwood Cemetery District (Yolo) Cemetery - - 19,660 210
Yolo Davis Cemetery District Cemetery - - 480,096 37,126
Yolo Dunnigan Water District Water Enterprise 1,015,917 319,679 - -
Yolo Dunningan Fire Protection District Fire Protection - - 219,464 4,520
Yolo East Davis Fire Protection District Fire Protection - - 632,718 3,109
Yolo Elkhorn Fire Protection District Fire Protection - - 38,441 33
Yolo Esparto Community Services District Lighting and Lighting Maintenance - - 21,133 -
Yolo Esparto Community Services District Waste Disposal Enterprise 532,196 17,617 - 453
Yolo Esparto Community Services District Water Enterprise 777,033 25,648 - 712
Yolo Esparto Fire Protection District Fire Protection - - 240,753 14,062
Yolo Knights Landing Cemetery District Cemetery - - 38,882 274
Yolo Knights Landing Community Services District Lighting and Lighting Maintenance - - 11,452 -
Yolo Knights Landing Community Services District Waste Disposal Enterprise 97,522 7,218 - 159
Yolo Knights Landing Community Services District Water Enterprise 103,475 9,212 - 202
Yolo Knights Landing Fire Protection District Fire Protection - - 92,458 9,495
Yolo Knights Landing Ridge Drainage District (Yolo) Drainage and Drainage Maintenance - - 309,342 -
Yolo Madison Community Services District Lighting and Lighting Maintenance - - 5,364 -
Yolo Madison Community Services District Recreation and Park - - 534 -
Yolo Madison Community Services District Waste Disposal Enterprise 126,103 474 - -
SCO_LAFCO FY 2014 Page 75 of 77 07/29/15

California State Controller's Office List includes only independent special districts
Data For LAFCO Fee Calculations Total Intergovernmental Revenues includes Federal,
Source: Special Districts Financial Transactions Report, Fiscal Year 2013-14 State, and Other Intergovernmental Agencies
Principal County Independent Special District Name Activity
Enterprise
Operating
Revenues
Enterprise
Non-Operating
Revenues
Non-Enterprise
General Purpose
Revenues
Total Inter
Governmental
Revenues
Yolo Madison Community Services District Water Enterprise 98,316 465 - -
Yolo Madison Fire Protection District Fire Protection - - 175,728 17,043
Yolo Marys Cemetery District Cemetery - - 49,329 1,030
Yolo No-Mans Land Fire Protection District Fire Protection - - 28,952 5
Yolo Reclamation District No. 150 Land Reclamation and Levee Maintenance - - 222,021 89,261
Yolo Reclamation District No. 1600 Land Reclamation and Levee Maintenance - - 278,470 -
Yolo Reclamation District No. 2035 Flood Control and Water Conservation - - 324,406 -
Yolo Reclamation District No. 2035 Water Enterprise 1,311,953 858,265 - 857,824
Yolo Reclamation District No. 307 Drainage and Drainage Maintenance - - 219,513 77,992
Yolo Reclamation District No. 537 Land Reclamation and Levee Maintenance - - 196,340 -
Yolo Reclamation District No. 730 Land Reclamation and Levee Maintenance - - 60,353 -
Yolo Reclamation District No. 765 Drainage and Drainage Maintenance - - 137,586 -
Yolo Reclamation District No. 785 Land Reclamation and Levee Maintenance - - 44,028 -
Yolo Reclamation District No. 827 Land Reclamation and Levee Maintenance - - 61,349 9,488
Yolo Reclamation District No. 900 Land Reclamation and Levee Maintenance - - 1,173,680 -
Yolo Reclamation District No. 999 Drainage and Drainage Maintenance - - 768,204 92,964
Yolo Springlake Fire Protection District Fire Protection - - 360,584 1,019
Yolo West Plainfield Fire Protection District Fire Protection - - 276,537 1,530
Yolo Willow Oak Fire Protection District Fire Protection - - 551,965 106,255
Yolo Winters Cemetery District Cemetery - - 314,281 44,871
Yolo Winters Fire Protection District Fire Protection - - 255,128 2,711
Yolo Woodland-Davis Clean Water Agency Water Enterprise - 18,773 - -
Yolo Yolo County Communications Emergency Services Agency Governmental Services - - 5,250,225 5,147,823
Yolo Yolo County Flood Control and Water Conservation District Electric Enterprise 183,641 - - -
Yolo Yolo County Flood Control and Water Conservation District Water Enterprise 2,782,110 1,161,384 - 140,063
Yolo Yolo County Natural Community Conservation Plan Joint Powers AgencyGovernmental Services - - 804,817 800,244
Yolo Yolo County Public Agency Risk Management Insurance AuthoritySelf Insurance - - 8,029,217 -
Yolo Yolo County Resource Conservation District Resource Conservation - - 690,531 640,350
Yolo Yolo County Transportation District Transit Enterprise 10,030,274 - - 5,472,458
Yolo Yolo County Transportation District - Specialized Service Transit Enterprise 1,281,308 - - 1,190,908
Yolo Yolo Fire Protection District Fire Protection - - 146,859 25,433
Yolo Yolo-Solano Air Quality Management District Air Pollution Control - - 4,176,919 1,899,468
Yolo Yolo-Zamora Water District Water Enterprise - 3 - -
Yolo Zamora Fire Protection District Fire Protection - - 125,582 221
Yuba Brophy Water District Water Enterprise 816,006 19,389 - -
Yuba Browns Valley Cemetery District Cemetery - - 30,425 373
Yuba Browns Valley Irrigation District Water Enterprise 2,339,588 194,867 - 1
Yuba Brownsville Cemetery District Cemetery - - 35,921 489
Yuba Camp Far West Irrigation District Water Enterprise 27,208 894 - -
Yuba Camptonville Cemetery District Cemetery - - 1,537 48
Yuba Camptonville Community Services District Fire Protection - - 66,712 13,158
Yuba Camptonville Community Services District Water Enterprise 47,328 1,976 - 29
SCO_LAFCO FY 2014 Page 76 of 77 07/29/15
California State Controller's Office List includes only independent special districts
Data For LAFCO Fee Calculations Total Intergovernmental Revenues includes Federal,
Source: Special Districts Financial Transactions Report, Fiscal Year 2013-14 State, and Other Intergovernmental Agencies
Principal County Independent Special District Name Activity
Enterprise
Operating
Revenues
Enterprise
Non-Operating
Revenues
Non-Enterprise
General Purpose
Revenues
Total Inter
Governmental
Revenues
Yuba City of Marysville Levee District (Yuba) Flood Control and Water Conservation - - 643,143 304,214
Yuba Cordua Irrigation District Water Enterprise 1,410,621 800 - -
Yuba District 10-Hallwood Community Services District Fire Protection - - 163,784 152
Yuba Dobbins Oregon House Fire Protection District Fire Protection - - 100,623 210
Yuba Feather River Air Quality Management District (FRAQMD) Air Pollution Control - - 2,246,444 1,525,140
Yuba Foothill Fire Protection District (Yuba) Fire Protection - - 188,088 111
Yuba Keystone Cemetery District Cemetery - - 43,351 550
Yuba Linda County Water District Waste Disposal Enterprise 3,666,888 1,057,005 - -
Yuba Linda County Water District Water Enterprise 2,072,553 192,390 - -
Yuba Linda Fire Protection District Fire Protection - - 2,677,756 22,044
Yuba Loma Rica-Browns Valley Community Service District Fire Protection - - 344,558 39
Yuba North Yuba Water District Water Enterprise 3,512,809 389,975 - 5,124
Yuba Northern California Community Colleges Joint Powers AgencySelf Insurance - - 7,143,489 -
Yuba Olivehurst Public Utility District Fire Protection - - 907,054 396,204
Yuba Olivehurst Public Utility District Lighting and Lighting Maintenance - - 56,750 250
Yuba Olivehurst Public Utility District Recreation and Park - - 715,730 60,890
Yuba Olivehurst Public Utility District Waste Disposal Enterprise 2,733,563 190 - -
Yuba Olivehurst Public Utility District Water Enterprise 2,493,164 121 - -
Yuba Peoria Cemetery District Cemetery - - 34,918 539
Yuba Plumas Brophy Fire Protection District Fire Protection - - 156,147 52,188
Yuba Ramirez Water District Water Enterprise 518,468 34,138 - -
Yuba Reclamation District No. 10 Land Reclamation and Levee Maintenance - - 123,180 362
Yuba Reclamation District No. 2103 Land Reclamation and Levee Maintenance - - 93,924 141
Yuba Reclamation District No. 784 Drainage and Drainage Maintenance - - 1,746,970 -
Yuba Reclamation District No. 817 Land Reclamation and Levee Maintenance - - 19,485 247
Yuba Smartville Cemetery District Cemetery - - 2,167 12
Yuba Smartville Fire Protection District Fire Protection - - 123,960 16,551
Yuba South Yuba Water District Water Enterprise 434,291 10,537 - -
Yuba Strawberry Valley Cemetery District Cemetery - - 3,257 101
Yuba Superior California Excess Liability Pool Self Insurance - - 987,561 -
Yuba Three Rivers Levee Improvement Authority Land Reclamation and Levee Maintenance - - 5,941,874 5,535,774
Yuba Wheatland Cemetery District Cemetery - - 107,625 1,410
Yuba Wheatland Water District Water Enterprise 239,635 1,386,071 - 1,386,000
Yuba Yuba County Resource Conservation District Resource Conservation - - 482 -
Yuba Yuba County Rural Fire Joint Powers Agency Fire Protection - - 7,422 -
Yuba Yuba County Water Agency Electric Enterprise 14,832,028 1,383,619 - 831,459
Yuba Yuba County Water Agency Recreation and Park - - 710,076 7,467
Yuba Yuba County Water Agency Water Enterprise 10,642,669 - - -
Yuba Yuba Levee Financing Authority Financing or Constructing Facilities - - 160,778 -
SCO_LAFCO FY 2014 Page 77 of 77 07/29/15