california standards tests
TRANSCRIPT

California Standards Tests
Preliminary AnalysisAugust 2010
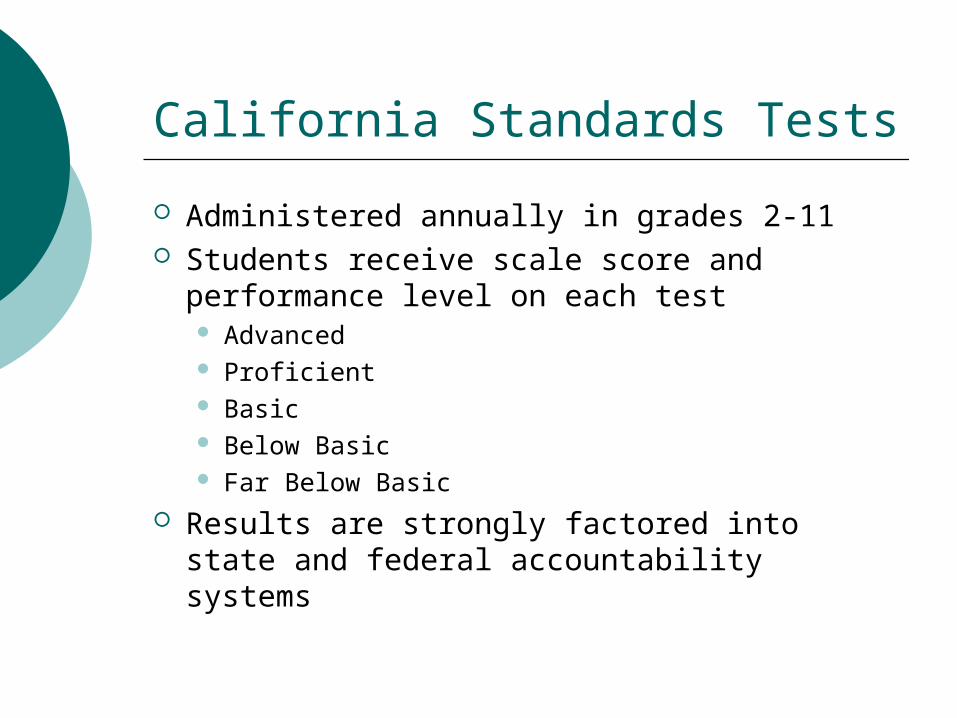
California Standards Tests
Administered annually in grades 2-11 Students receive scale score and
performance level on each test Advanced Proficient Basic Below Basic Far Below Basic
Results are strongly factored into state and federal accountability systems

English Language Arts
200
250
300
350
400
450
500
550
600
09 393.3 386.1 402.4 388.9 375 385.5 380.3 381.9 365.5 365.1 382.4
10 391 385 406.1 385.8 378.4 385.5 387.7 382 362.3 362.2 382.6
2nd 3rd 4th 5th 6th 7th 8th 9th 10th 11th AVG

ELA: Percent Advanced/Proficient
0%
10%
20%
30%
40%
50%
60%
70%
80%
90%
100%
05 67% 67% 73% 69% 65% 67% 65% 72% 55% 54%
06 72% 64% 76% 69% 68% 69% 68% 67% 54% 46%
07 74% 63% 78% 71% 64% 71% 67% 69% 55% 53%
08 70% 68% 77% 73% 68% 72% 69% 70% 62% 54%
09 78% 73% 83% 78% 69% 77% 73% 72% 66% 60%
10 74% 71% 82% 78% 72% 74% 74% 73% 62% 59%
2nd 3rd 4th 5th 6th 7th 8th 9th 10th 11th

Mathematics
200.0
250.0
300.0
350.0
400.0
450.0
500.0
550.0
600.0
09 430.8 443.6 435.0 422.4 379.6 371.1 413.8
10 429.2 454.3 428.5 422.7 382.1 374.5 415.2
2nd 3rd 4th 5th 6th 7th AVG

Mathematics: Percent Adv/Proficient
0%
10%
20%
30%
40%
50%
60%
70%
80%
90%
100%
2nd 76% 84% 82% 84% 88% 82%
3rd 82% 81% 81% 82% 83% 86%
4th 73% 77% 81% 81% 87% 86%
5th 68% 70% 73% 71% 74% 76%
6th 66% 61% 56% 62% 63% 63%
7th 60% 59% 59% 62% 63% 65%
05 06 07 08 09 10

Secondary Math: Percent Adv/Proficient
0%
10%
20%
30%
40%
50%
60%
70%
80%
90%
100%
Algebra 1 41% 46% 49% 49% 42% 48%
Geometry 41% 33% 33% 36% 34% 32%
Algebra 2 35% 37% 39% 46% 39% 33%
Summative 51% 61% 55% 68% 65%
05 06 07 08 09 10

Academic Performance Index Estimates
200
300
400
500
600
700
800
900
1000
09 928 876 865 911 841 939 882 970 870 875 854 847 812
10 ESTIMATE 938 854 845 905 850 923 877 971 877 887 839 875 812
AOE BV CHES Hope Jefferson Kelly Magnolia Pac RimPoinsetti
aAOM CHMS Valley CHS
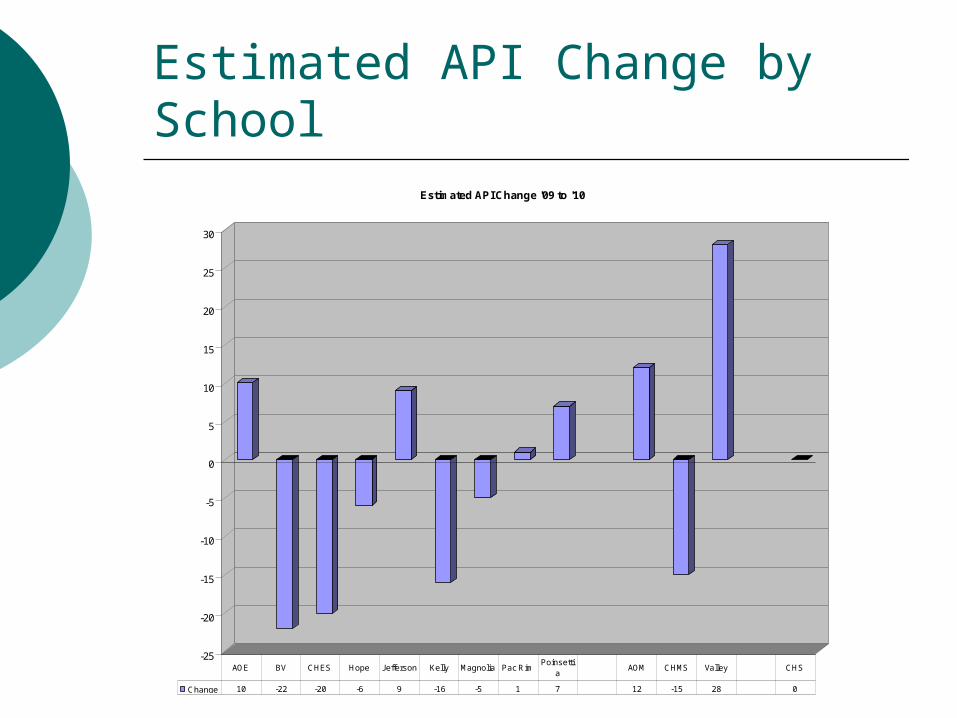
Estimated API Change by School
-25
-20
-15
-10
-5
0
5
10
15
20
25
30
Estimated API Change '09 to '10
Change 10 -22 -20 -6 9 -16 -5 1 7 12 -15 28 0
AOE BV CHES Hope Jefferson Kelly Magnolia Pac RimPoinsetti
aAOM CHMS Valley CHS

Comparisons: ELA
200
250
300
350
400
450
500
550
600
Carlsbad 391 385 406.1 385.8 378.4 385.5 387.7 382 362.3 362.2
Coronado 394.4 383.2 416.2 387.9 394.1 401.7 396.6 392.3 382.6 379.3
Poway 398.9 383.4 414.4 398.5 392.4 395.6 394.5 389.7 373.9 370.7
San Dieguito 412.3 406.3 398.5 383.7 384.1
2nd 3rd 4th 5th 6th 7th 8th 9th 10th 11th

Comparisons: Math
200
250
300
350
400
450
500
550
600
Carlsbad 429.2 454.3 428.5 422.7 382.1 374.5
Coronado 427.1 448.1 434.1 414.7 384.9 380.3
Poway 431.8 445.3 425.7 439.3 402.1 377.4
2nd 3rd 4th 5th 6th 7th

Comparison: 8th Grade Algebra
0%
10%
20%
30%
40%
50%
60%
70%
80%
90%
100%
Carlsbad 88% 58% 51%
Coronado 70% 69% 48%
Poway 60% 68% 41%
San Dieguito 64% 91% 58%
% of Enrollment % Adv/Prof Combined
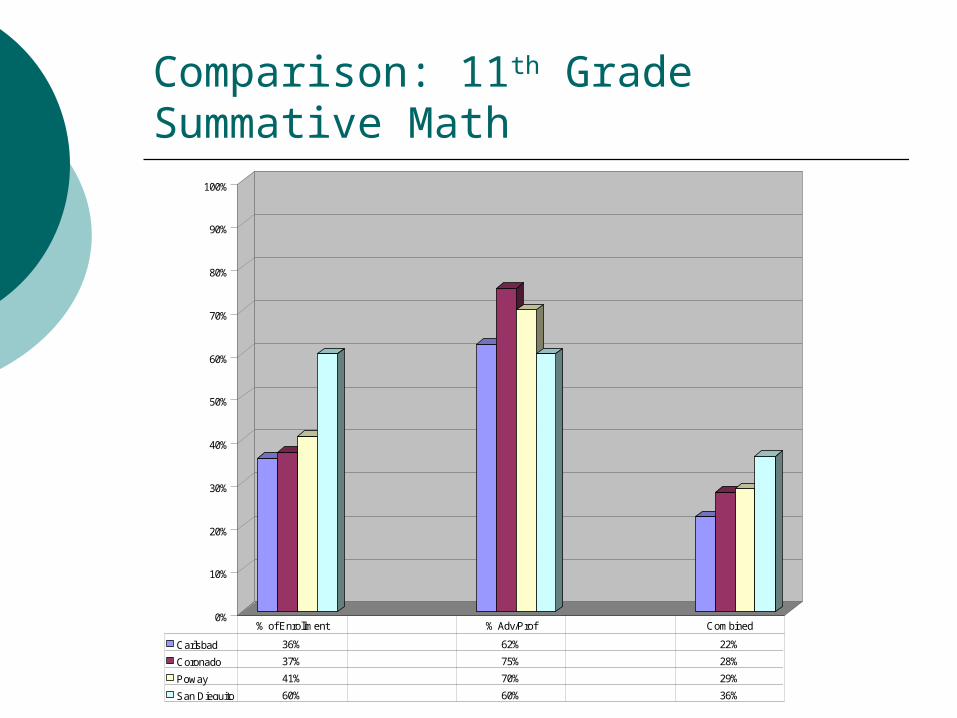
Comparison: 11th Grade Summative Math
0%
10%
20%
30%
40%
50%
60%
70%
80%
90%
100%
Carlsbad 36% 62% 22%
Coronado 37% 75% 28%
Poway 41% 70% 29%
San Dieguito 60% 60% 36%
% of Enrollment % Adv/Prof Combined

ELA by School: Scale Scores

ELA by School: Socio-Economically Disadvantaged Students

ELA by School: Parent Education

ELA by School: English Learners

ELA by School: Special Education

ELA by School: Hispanic Students

Math Scale by School
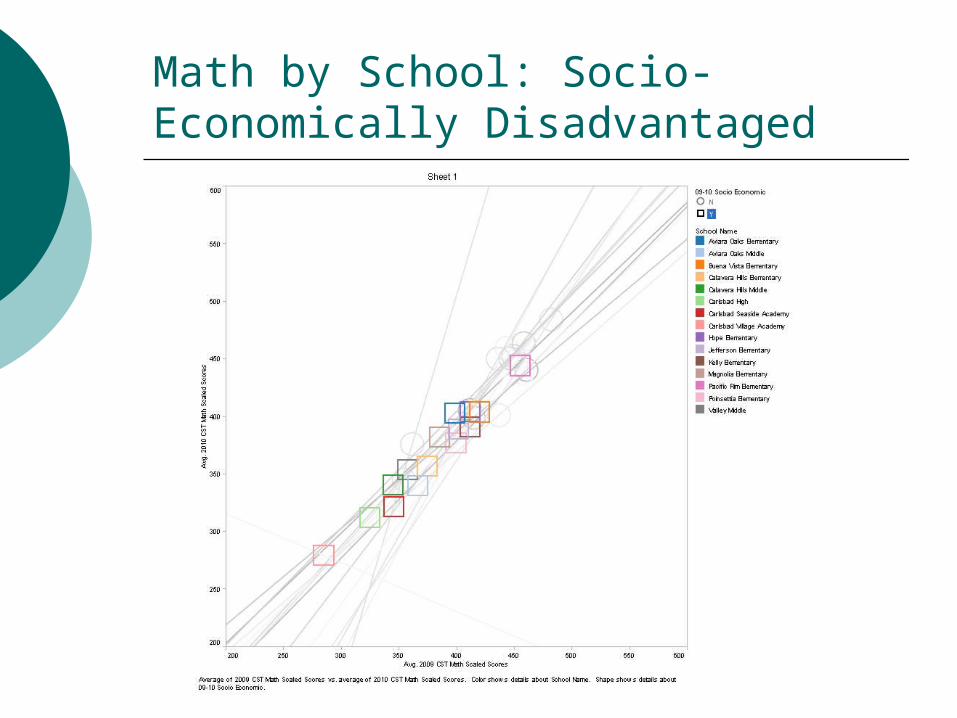
Math by School: Socio-Economically Disadvantaged

Math Scale by School: Special Education

Preliminary Conclusions
Carlsbad Unified remains a high-performing district
“Pockets of Excellence” exist at different levels
Changes in instructional practice are needed to move to next level of achievement

2009 Adequate Yearly Progress
Carlsbad Unified, Valley Middle School, and Carlsbad Village Academy are “on watch” for potential Program Improvement Status based on 2010 results.
Official notification to occur at end of August or early September

Year 1 Program Improvement Consequences
District Notify all parents Revise district plan
Includes approval from School Board and submission to California Department of Education
Use 10% of Title I funds for staff development Site
Notify all parents of school Revise school plan Use 10% funds for staff development Provide school choice with paid transportation District provides technical assistance (TA)

Initiatives for 2010-2011
ARRA Implementation of Read 180 literacy intervention at all
secondary schools iPod touch computing at Calavera Hills Elementary Flip Videos for identification of effective instructional
strategies Expansion of Distance Learning options for students Improve implementation of new math adoptions (K-8) Revamp Curricular Teams and build on momentum
from Summer Institute Involve students in assessment process
Continue College & Career Readiness Process Including support systems for AVID, EL, Special Needs

Additional Next Steps
Revise Single Plans for Student Achievement Districtwide focus on instructional strategies to
identify best practices and increase student engagement Leverage additional time for professional
development Staff Meetings Semester Break Day
Instruction for English Learners and Mathematics are additional areas of emphasis Title III Improvement Plan Partnership with SDCOE Math Experts