california regional water quality control board, los ... · california regional water quality...
TRANSCRIPT

Draft 1/14/02
San Gabriel River Watershed 1
California Regional Water Quality Control Board, Los Angeles Region
San Gabriel River Watershed – EstuaryTrash
Summary of Proposed ActionThe San Gabriel River Estuary is proposed to be listed in the 2002 303(b) water quality assessment as impaired dueto non attainment of the narrative objective for floating and settleable materials objective as described in the BasinPlan. The beneficial uses that are affected by this impairment relate to recreational use (contact and non-contact)and aquatic life. The San Gabriel River Estuary is located downstream from Willow Street.
Table 1. 303(d) Listing/TMDL Information
Waterbody Name San Gabriel River Estuary Pollutants/Stressors Trash
Hydrologic Unit 405.15 Source(s) Nonpoint Sources
Total Waterbody Size 41.5 miles TMDL Priority Low
Size Affected 2.95 miles TMDL Start Date(Mo/Yr)
2011
Extent of Impairment Entire Estuary TMDL End Date(Mo/Yr)
2013
Watershed CharacteristicsThe San Gabriel River receives drainage from a large area of eastern Los Angeles County; its headwaters originatein the San Gabriel Mountains. The watershed consists of extensive areas of undisturbed riparian and woodlandhabitats in its upper reaches. Much of the watershed of the West Fork and East Fork of the river is set aside as awilderness area; other areas in the upper watershed are subject to heavy recreational use. The upper watershed alsocontains a series of flood control dams. Further downstream, towards the middle of the watershed, are largespreading grounds utilized for groundwater recharge. The watershed is hydraulically connected to the Los AngelesRiver through the Whittier Narrows Reservoir (normally only during high storm flows). The lower part of the riverflows through a concrete-lined channel in a heavily urbanized portion of the county before becoming a soft bottomchannel once again near the ocean in the city of Long Beach. Large electrical power poles line the river along thechanneled portion and nurseries, and small stable areas.
Water Quality Objectives Not AttainedThe Water Quality Control Plan for the Los Angeles Region (Basin Plan) states that, "Waters shall not containfloating materials, including solids, liquids, foams, and scum, in concentrations that cause nuisance or adverselyaffect beneficial uses." In addition, the plan states, "Water shall not contain suspended or settleable material inconcentrations that cause nuisance or adversely affect beneficial uses.” Both of these objectives were not attained inthe estuary as indicated by photographic documentation of gross impairment due to trash.

Draft 1/14/02
San Gabriel River Watershed 2
Beneficial Uses Affected non-contact water recreation water contact recreation estuarine habitat marine habitat wildlife habitat rare/endangered species migration of aquatic organisms spawning, reproduction, and/or early development shellfish harvesting
Data Assessment
Photographic evidence of gross impairment of water quality due to trash was provided for several dates in Octoberand November of 2000 and at several locations in the vicinity of the confluence of Coyote Creek with the SanGabriel River Estuary.
Figure 1:Sample of Photographic Documentation of Gross Impairment due to Trash in the San Gabriel River Estuary
Potential SourcesStormwater discharge is the major source of trash in the river. The locations from which the photographs were takenincluded sites near a storm drain. These sites had trash at and adjacent to the drain locations.
References
Basin Plan, 1994 Watershed Management Initiative, 2000 Photographs provided by the Seal Beach Chamber & Business Association, May 2001 A compilation of Water Quality Goals, August 2000

Draft 1/14/02
San Gabriel River Watershed 3
California Regional Water Quality Control Board, Los Angeles Region
San Gabriel River Watershed – Reach 1Nitrite as Nitrogen
Summary of Proposed ActionReach 1 of the San Gabriel River is proposed to be listed in the 2002 305(b) water quality assessment as partiallysupporting due to the median exceeding the water quality objective as described in the Basin Plan. The beneficialuse that is affected by this impairment is the potential municipal and domestic supply (MUN) use. [FirestoneBoulevard (upstream extent) to the San Gabriel River Estuary (downstream extent) defines Reach 1 of the river.]
Table 1. 303(d) Listing/TMDL Information
Waterbody Name San Gabriel River R1 Pollutants/Stressors Nitrite as Nitrogen
Hydrologic Unit 405.15 Source(s) Point Sources
Total Waterbody Size 41.5 miles TMDL Priority Analytical Unit 37
Size Affected 8.73 miles TMDL Start Date(Mo/Yr)
2001
Extent of Impairment Entire Reach TMDL End Date(Mo/Yr)
2003
Watershed CharacteristicsThe San Gabriel River receives drainage from a large area of eastern Los Angeles County; its headwaters originatein the San Gabriel Mountains. The watershed consists of extensive areas of undisturbed riparian and woodlandhabitats in its upper reaches. Much of the watershed of the West Fork and East Fork of the river is set aside as awilderness area; other areas in the upper watershed are subject to heavy recreational use. The upper watershed alsocontains a series of flood control dams. Further downstream, towards the middle of the watershed, are largespreading grounds utilized for groundwater recharge. The watershed is hydraulically connected to the Los AngelesRiver through the Whittier Narrows Reservoir (normally only during high storm flows). The lower part of the riverflows through a concrete-lined channel in a heavily urbanized portion of the county before becoming a soft bottomchannel once again near the ocean in the city of Long Beach. Large electrical power poles line the river along thechanneled portion and nurseries, and small stable areas.
Water Quality Objectives Not AttainedThe Water Quality Control Plan for the Los Angeles Region (Basin Plan) states, "waters shall not exceed…1 mg/l asnitrite-nitrogen (NO2-N)." This criterion range was exceeded in 93% of the water quality samples.

Draft 1/14/02
San Gabriel River Watershed 4
Beneficial Uses Affected Municipal and Domestic Supply
Data Assessment
Summary for Nitrite as Nitrogen Data
Nitrite as nitrogen (mg/L)
Dates of Sampling 7/8/97- 7/11/00Number of Samples (n) 74Minimum Data Value 0.76Maximum Data Value 3.96Median Data Value 1.63Arithmetic Mean Value 1.98Standard Deviation 0.55Percent above Objective 93 %
Potential SourcesThe sampling locations for the nitrite as nitrogen data were the NPDES receiving water stations monitored by theSan Jose Creek Waste Water Reclamation Plant (WWRP) and the Los Coyotes WWRP. Storm water monitoringdata was not available for this stream reach, so Reach 2 storm water data was reviewed. The mean nitrite asnitrogen concentration, during storm events in Reach 2, was 0.5 mg/l; the range was 0.092 to 1.2 mg/l. Threesamples taken upstream of the two WWRP in Reach 2 at station RA have a mean of 0.29 mg/l. On the other hand,the mean concentration of samples taken within Reach 1 and downstream of the WWRPs at stations R2 and R4 was1.63 mg/l. Based on the data reviewed, the likely sources of elevated nitrite as nitrogen in the river are the WWRPs.
References
Basin Plan, 1994 Watershed Management Initiative, 2000
San Gabriel River R1 Nitrite (as N) Data
0
1
2
3
4
5
Jun-97 Dec-97 Jul-98 Jan-99 Aug-99 Feb-00 Sep-00
Nitr
ate
as N
itrog
en (m
g/l)

Draft 1/14/02
San Gabriel River Watershed 5
California Regional Water Quality Control Board, Los Angeles Region
San Gabriel River Watershed – Coyote CreekTotal Selenium
Summary of Proposed ActionCoyote Creek, a tributary of the San Gabriel River, is proposed to be listed in the 2002 305(b) water qualityassessment as not supporting (impaired) due to greater than one exceedance of the total selenium chronic waterquality criterion for protection of fresh water aquatic life. The beneficial uses that are affected by this impairmentrelate to aquatic life use support and include warm freshwater habitat, wildlife habitat, and rare/endangered specieshabitat.
Table 1. 303(d) Listing/TMDL Information
Waterbody Name Coyote Creek Pollutants/Stressors Total Selenium
Hydrologic Unit 405.15 Source(s) Nonpoint Sources
Total Waterbody Size 13.5 TMDL Priority TMDL Analytical Unit39
Size Affected 13.5 miles TMDL Start Date(Mo/Yr)
2004
Extent of Impairment Entire Reach TMDL End Date(Mo/Yr)
2006
Watershed CharacteristicsThe San Gabriel River receives drainage from a large area of eastern Los Angeles County; its headwaters originatein the San Gabriel Mountains. The watershed consists of extensive areas of undisturbed riparian and woodlandhabitats in its upper reaches. Much of the watershed of the West Fork and East Fork of the river is set aside as awilderness area; other areas in the upper watershed are subject to heavy recreational use. The upper watershed alsocontains a series of flood control dams. Further downstream, towards the middle of the watershed, are largespreading grounds utilized for groundwater recharge. The watershed is hydraulically connected to the Los AngelesRiver through the Whittier Narrows Reservoir (normally only during high storm flows). The lower part of the riverflows through a concrete-lined channel in a heavily urbanized portion of the county before becoming a soft bottomchannel once again near the ocean in the city of Long Beach. Large electrical power poles line the river along thechanneled portion and nurseries, and small stable areas.
Water Quality Objectives Not AttainedThrough the California Toxic Rule, the United States Environmental Protection Agency promulgated water qualitycriteria to protect fresh water aquatic life. The recommended Criteria Continuous Concentration for total seleniumis 5 µg/l. This criterion range was exceeded in 19% of the sampling events.

Draft 1/14/02
San Gabriel River Watershed 6
Beneficial Uses Affected warm freshwater habitat wildlife habitat rare/endangered species habitat
Data Assessment
The chart below shows that during the 1998-1999 monitoring year the concentration of total selenium was exceededduring five monitoring events. The data analyzed in the charts was collected from a storm water monitoringprogram. During 1999-2000 monitoring year, the selenium concentrations in the storm water samples were belowthe 5.0 µg/l limit.
Summary Table for Total SeleniumTotal Selenium (µg/l)
Dates of Sampling 11/10/97- 11/10/99Number of Samples (n) 26Minimum Data Value 5Maximum Data Value 14.9Median Data Value 5Arithmetic Mean Value 5.86Standard Deviation 2.42Percent above CCC 19
Potential SourcesThe sampling location for the total selenium data was the mass loading station (S13) monitored by the Los AngelesCounty Department of Public Works Storm Water Monitoring Program. Therefore, it is assumed that the totalselenium loading occurs during wet weather storm events.
Coyote Creek Selenium Data
05
101520
Nov-97 Apr-98 Sep-98 Feb-99 Jul-99Tota
l Sel
eniu
m (p
pb)
Selenium Aquatic Life CCC

Draft 1/14/02
San Gabriel River Watershed 7
References
Basin Plan, 1994 Watershed Management Initiative, 2000 Los Angeles County 1994-2000 Integrated Receiving Water Impacts Report, July 2000 California Toxics Rule, August 2000
Draft 1/14/02
San Gabriel River Watershed 8
California Regional Water Quality Control Board, Los Angeles Region
San Gabriel River Watershed – Coyote CreekDissolved Copper
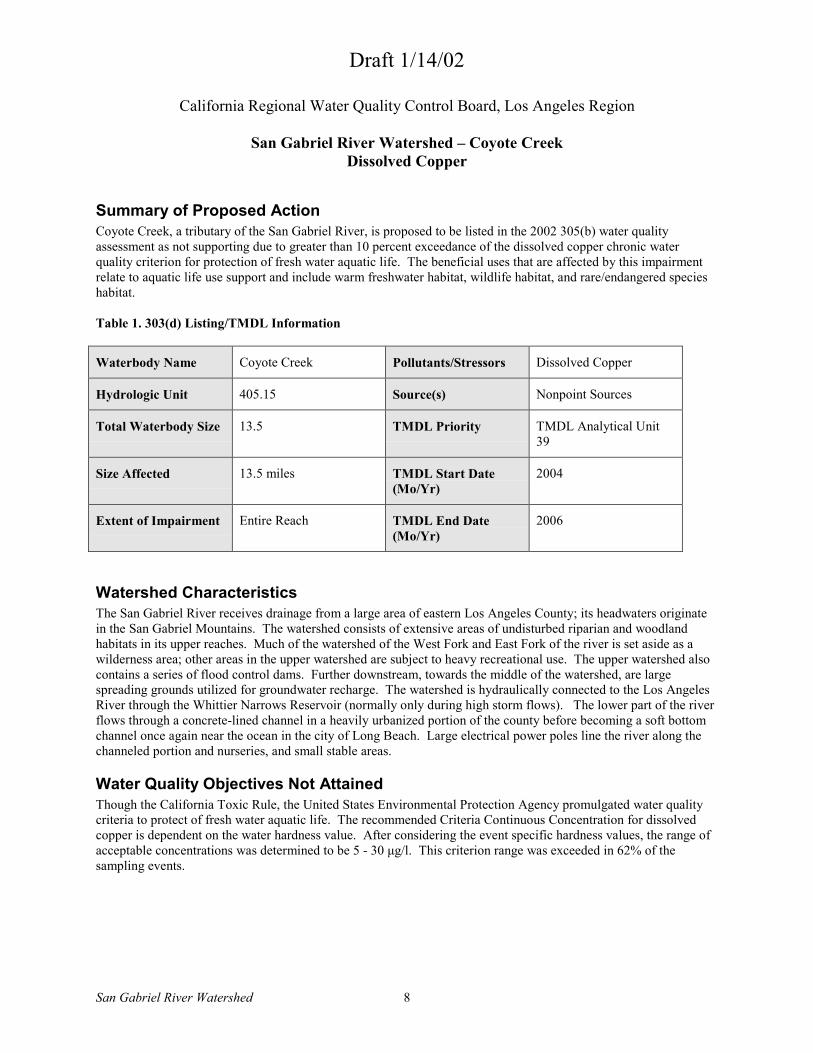
Summary of Proposed ActionCoyote Creek, a tributary of the San Gabriel River, is proposed to be listed in the 2002 305(b) water qualityassessment as not supporting due to greater than 10 percent exceedance of the dissolved copper chronic waterquality criterion for protection of fresh water aquatic life. The beneficial uses that are affected by this impairmentrelate to aquatic life use support and include warm freshwater habitat, wildlife habitat, and rare/endangered specieshabitat.
Table 1. 303(d) Listing/TMDL Information
Waterbody Name Coyote Creek Pollutants/Stressors Dissolved Copper
Hydrologic Unit 405.15 Source(s) Nonpoint Sources
Total Waterbody Size 13.5 TMDL Priority TMDL Analytical Unit39
Size Affected 13.5 miles TMDL Start Date(Mo/Yr)
2004
Extent of Impairment Entire Reach TMDL End Date(Mo/Yr)
2006
Watershed CharacteristicsThe San Gabriel River receives drainage from a large area of eastern Los Angeles County; its headwaters originatein the San Gabriel Mountains. The watershed consists of extensive areas of undisturbed riparian and woodlandhabitats in its upper reaches. Much of the watershed of the West Fork and East Fork of the river is set aside as awilderness area; other areas in the upper watershed are subject to heavy recreational use. The upper watershed alsocontains a series of flood control dams. Further downstream, towards the middle of the watershed, are largespreading grounds utilized for groundwater recharge. The watershed is hydraulically connected to the Los AngelesRiver through the Whittier Narrows Reservoir (normally only during high storm flows). The lower part of the riverflows through a concrete-lined channel in a heavily urbanized portion of the county before becoming a soft bottomchannel once again near the ocean in the city of Long Beach. Large electrical power poles line the river along thechanneled portion and nurseries, and small stable areas.
Water Quality Objectives Not AttainedThough the California Toxic Rule, the United States Environmental Protection Agency promulgated water qualitycriteria to protect of fresh water aquatic life. The recommended Criteria Continuous Concentration for dissolvedcopper is dependent on the water hardness value. After considering the event specific hardness values, the range ofacceptable concentrations was determined to be 5 - 30 µg/l. This criterion range was exceeded in 62% of thesampling events.

Draft 1/14/02
San Gabriel River Watershed 9
Beneficial Uses Affected warm freshwater habitat wildlife habitat rare/endangered species habitat
Data Assessment
In order to determine the concentration of dissolved copper that will actually be available in an aquatic environment,the water hardness must be considered. The limits calculated and presented in the chart and table below as "Limits"have had hardness values factored in to the dissolved copper concentration. In generally, the lower the hardnessvalues the higher the dissolved cooper limit.
The chart below shows a distinct trend in the concentration of dissolved copper. The data analyzed in the charts wascollected from a storm water monitoring programs. During the November and December 1997 storm events theconcentration of dissolved copper shows increasing trends, and then decreases and stabilizes during the remainingevents. This trend associated with an opposing trend in hardness over the same period of time; which decreases andthen increases and stabilizes. The trends in hardness and dissolved copper will need to be investigated furtherduring the next two years. Possible explanations may be related to the dilutions by increased rainfall dischargevolumes, during the El Nino storms of late 1997, or related to a change in groundwater recharge and spreadingvolumes.
Summary Table of Dissolved Copper Data (with hardness factor)Dissolved Copper (µg/l)
Dates of Sampling 11/10/97- 11/10/00Number of Samples (n) 27Minimum Data Value 5.23Maximum Data Value 186Median Data Value 13.61Arithmetic Mean Value 24.31Standard Deviation 32.18Percent above CCC 62%
Coyote Creek Copper Data
0
50
100
150
200
11/10/97 12/05/97 01/09/98 12/01/98 01/25/99 03/20/99 04/11/99
Dis
solv
ed C
oppe
r (ug
/L)
Copper CCC Limits

Draft 1/14/02
San Gabriel River Watershed 10
Potential SourcesThe sampling location for the dissolved copper data was the mass loading station (S13) monitored by the LosAngeles County Department of Public Works Storm Water Monitoring Program. Therefore, it is assumed that thedissolved copper loading occurs during wet weather storm events. According to their land use and critical sourcerunoff quality results, the LACDPW did identify the possible sources of dissolved metals loading as light industrial,transportation, and retail/commercial land uses. According to LACDPW, the critical sources that fall into these landuse categories are auto repair, motor freight transportation, and auto dealership.
References
Basin Plan, 1994 Watershed Management Initiative, 2000 Los Angeles County 1994-2000 Integrated Receiving Water Impacts Report, July 2000 California Toxics Rule, August 2000

Draft 1/14/02
San Gabriel River Watershed 11
California Regional Water Quality Control Board, Los Angeles Region
San Gabriel River Watershed – Coyote CreekDissolved Zinc
Summary of Proposed ActionCoyote Creek, a tributary of the San Gabriel River, is proposed to be listed in the 2002 305(b) water qualityassessment as not supporting due to greater than 10 percent exceedance of the dissolved zinc chronic water criteriaquality for protection of fresh water aquatic life. The beneficial uses that are affected by this impairment relate toaquatic life use support and include warm freshwater habitat, wildlife habitat, and rare/endangered species habitat.
Table 1. 303(d) Listing/TMDL Information
Waterbody Name Coyote Creek Pollutants/Stressors Dissolved Zinc
Hydrologic Unit 405.15 Source(s) Nonpoint Sources
Total Waterbody Size 13.45 miles TMDL Priority Analytical Unit 39
Size Affected 13.45 miles TMDL Start Date(Mo/Yr)
2004
Extent of Impairment Entire Reach TMDL End Date(Mo/Yr)
2006
Watershed CharacteristicsThe San Gabriel River receives drainage from a large area of eastern Los Angeles County; its headwaters originatein the San Gabriel Mountains. The watershed consists of extensive areas of undisturbed riparian and woodlandhabitats in its upper reaches. Much of the watershed of the West Fork and East Fork of the river is set aside as awilderness area; other areas in the upper watershed are subject to heavy recreational use. The upper watershed alsocontains a series of flood control dams. Further downstream, towards the middle of the watershed, are largespreading grounds utilized for groundwater recharge. The watershed is hydraulically connected to the Los AngelesRiver through the Whittier Narrows Reservoir (normally only during high storm flows). The lower part of the riverflows through a concrete-lined channel in a heavily urbanized portion of the county before becoming a soft bottomchannel once again near the ocean in the city of Long Beach. Large electrical power poles line the river along thechanneled portion and nurseries, and small stable areas.
Water Quality Objectives Not AttainedThough the California Toxic Rule, the United States Environmental Protection Agency promulgated water qualitycriteria to protect of fresh water aquatic life. The recommended Criteria Continuous Concentration for dissolvedzinc is dependent on the water hardness value. After considering the event specific hardness values, the range ofacceptable concentrations was determined to be 67 - 414 µg/l. This criterion range was exceeded in 22% of thesampling events.
Beneficial Uses Affected warm freshwater habitat wildlife habitat

Draft 1/14/02
San Gabriel River Watershed 12
rare/endangered species habitat
Data Assessment
In order to determine the concentration of dissolved zinc that will actually be available in an aquatic environment,the water hardness must be considered. The limits calculated and presented in the chart and table below as "Limits"have had hardness values factored in to the dissolved zinc concentration. In generally, the lower the hardness valuesthe higher the dissolved cooper limit.
The chart below shows a distinct trend in the concentration of dissolved zinc. The data analyzed in the charts wascollected from a storm water monitoring programs. During the November and December 1997 storm events theconcentration of dissolved zinc shows increasing trends, and then decreases and stabilizes during the remainingevents. This trend associated with an opposing trend in hardness over the same period of time; which decreases andthen increases and stabilizes. The trends in hardness and dissolved zinc will need to be investigated further duringthe next two years. Possible explanations may be related to the dilutions by increased rainfall discharge volumes,during the El Nino storms of late 1997, or related to a change in groundwater recharge and spreading volumes.
Summary Table for Dissolved Zinc Data (with hardness factor)Dissolved Zinc CCC (µg/l)
Dates of Sampling 11/7/97- 11/10/00Number of Samples (n) 27Minimum Data Value 50Maximum Data Value 810Median Data Value 79Arithmetic Mean Value 172.11Standard Deviation 186.61Percent above CCC 22 %
Potential SourcesThe sampling location for the dissolved zinc data was the mass loading station (S14) monitored by the Los AngelesCounty Department of Public Works Storm Water Monitoring Program. Therefore, it is assumed that the dissolvedzinc loading occurs during wet weather storm events. According to their land use and critical source runoff qualityresults, the LACDPW did identify possible sources of dissolved metals loading as light industrial, transportation,
Coyote Creek Zinc Data
0
500
1000
1500
Nov-97 Dec-97 Jan-98 Dec-98 Jan-99 Mar-99 Apr-99Dis
solv
ed Z
inc
(ug/
L)
Zinc CCC Limits

Draft 1/14/02
San Gabriel River Watershed 13
and retail/commercial land uses. According to LACDPW, the critical sources that fall into these land use categoriesare auto repair, motor freight transportation, and auto dealership.
References
Basin Plan, 1994 Watershed Management Initiative, 2000 Los Angeles County 1994-2000 Integrated Receiving Water Impacts Report, July 2000 California Toxics Rule, 2000

Draft 1/14/02
San Gabriel River Watershed 14
California Regional Water Quality Control Board, Los Angeles Region
San Gabriel River Watershed – Reach 2Dissolved Copper
Summary of Proposed ActionReach 2 of the San Gabriel River is proposed to be listed in the 2002 305(b) water quality assessment as notsupporting (impaired) due to greater than 10 percent exceedance of the dissolved copper chronic water qualitycriteria for protection of fresh water aquatic life. The beneficial uses that are affected by this impairment relate toaquatic life use support include warm freshwater habitat, wildlife habitat, and rare/endangered species habitat.[Ramona Boulevard (upstream extent) to Firestone Boulevard (downstream extent) defines Reach 2 of the river
Table 1. 303(d) Listing/TMDL Information
Waterbody Name San Gabriel River R2 Pollutants/Stressors Dissolved Copper
Hydrologic Unit 405.15 Source(s) Nonpoint Sources
Total Waterbody Size 41.5 miles TMDL Priority Analytical Unit 39
Size Affected 9.9 miles TMDL Start Date(Mo/Yr)
2004
Extent of Impairment Entire Reach TMDL End Date(Mo/Yr)
2006
Watershed CharacteristicsThe San Gabriel River receives drainage from a large area of eastern Los Angeles County; its headwaters originatein the San Gabriel Mountains. The watershed consists of extensive areas of undisturbed riparian and woodlandhabitats in its upper reaches. Much of the watershed of the West Fork and East Fork of the river is set aside as awilderness area; other areas in the upper watershed are subject to heavy recreational use. The upper watershed alsocontains a series of flood control dams. Further downstream, towards the middle of the watershed, are largespreading grounds utilized for groundwater recharge. The watershed is hydraulically connected to the Los AngelesRiver through the Whittier Narrows Reservoir (normally only during high storm flows). The lower part of the riverflows through a concrete-lined channel in a heavily urbanized portion of the county before becoming a soft bottomchannel once again near the ocean in the city of Long Beach. Large electrical power poles line the river along thechanneled portion and nurseries, and small stable areas.
Water Quality Objectives Not AttainedThough the California Toxic Rule, the United States Environmental Protection Agency promulgated water qualitycriteria to protect of fresh water aquatic life. The recommended Criteria Continuous Concentration for dissolvedcopper is dependent on the water hardness value. After considering the event specific hardness values, the range ofacceptable concentrations was determined to be 0.17 - 28 µg/l. This criterion range was exceeded in 62% of thesampling events.

Draft 1/14/02
San Gabriel River Watershed 15
Beneficial Uses Affected warm freshwater habitat wildlife habitat rare/endangered species
Data AssessmentIn order to determine the concentration of dissolved copper that will actually be available in an aquatic environment,the water hardness must be considered. The limits calculated and presented in the chart and table below as "Limits"have had hardness values factored in to the dissolved copper concentration. In generally, the lower the hardnessvalues the higher the dissolved cooper limit.
The chart below shows a distinct trend in the concentration of dissolved copper. The data analyzed in the charts wascollected from a storm water monitoring programs. During the November and December 1997 storm events theconcentration of dissolved copper shows increasing trends, and then decreases and stabilizes during the remainingevents. This trend associated with an opposing trend in hardness over the same period of time; which decreases andthen increases and stabilizes. The trends in hardness and dissolved copper will need to be investigated furtherduring the next two years. Possible explanations may be related to the dilutions by increased rainfall dischargevolumes, during the El Nino storms of late 1997, or related to a change in groundwater recharge and spreadingvolumes. Recent data is below criteria, if this trend continues copper would be reviewed in the next listing cycle.
Summary Table of Dissolved Copper Data (with hardness factor)
Dissolved Copper (µg/l)Dates of Sampling 8/7/97- 8/3/00Number of Samples (n) 30Minimum Data Value 0.01Maximum Data Value 47Median Data Value 8.3Arithmetic Mean Value 12.99Standard Deviation 12.15Percent above Objective 23%
San Gabriel River R2 Copper Data
0
10
20
30
40
50
Nov-97 Dec-97 Jan-98 Dec-98 Jan-99 Mar-99 Apr-99
Dis
solv
ed C
oppe
r (ug
/L)
Copper CCC Limits

Draft 1/14/02
San Gabriel River Watershed 16
Potential SourcesThe sampling location for the dissolved copper data was the mass loading station (S14) monitored by the LosAngeles County Department of Public Works Storm Water Monitoring Program, and the NPDES receiving waterstation (R-A) monitored by the Whittier Narrows WWRP. The two data points from the Whittier Narrows Station R-A were less than 10 µg/l, and thus do not appear to be a source of the dissolved copper. Therefore, it is assumed thatthe dissolved copper loading occurs during wet weather storm events. According to their land use and criticalsource runoff quality results, the LACDPW identified the possible sources of dissolved metals loading as lightindustrial, transportation, and retail/commercial land uses. According to LACDPW, the critical sources that fall intothese land use categories are auto repair, motor freight transportation, and auto dealership.
References
Basin Plan, 1994 Watershed Management Initiative, 2000 Los Angeles County 1994-2000 Integrated Receiving Water Impacts Report, July 2000 California Toxics Rule, 2000

Draft 1/14/02
San Gabriel River Watershed 17
California Regional Water Quality Control Board, Los Angeles Region
San Gabriel River Watershed – Reach 2Dissolved Zinc
Summary of Proposed ActionReach 2 of the San Gabriel River is proposed to be listed in the 2002 305(b) water quality assessment as impaireddue to greater than 10 percent exceedance of the dissolved zinc recommended water criteria for protection of freshwater aquatic life. The beneficial uses that are affected by this impairment relate to aquatic life use support includewarm freshwater habitat, wildlife habitat, and rare/endangered species habitat.
Table 1. 303(d) Listing/TMDL Information
Waterbody Name San Gabriel River R2 Pollutants/Stressors Dissolved Zinc
Hydrologic Unit 405.15 Source(s) Nonpoint Sources
Total Waterbody Size 6.0 miles TMDL Priority Analytical Unit 39
Size Affected 6.0 miles TMDL Start Date(Mo/Yr)
2004
Extent of Impairment Entire Reach TMDL End Date(Mo/Yr)
2006
Watershed CharacteristicsThe San Gabriel River receives drainage from a large area of eastern Los Angeles County; its headwaters originatein the San Gabriel Mountains. The watershed consists of extensive areas of undisturbed riparian and woodlandhabitats in its upper reaches. Much of the watershed of the West Fork and East Fork of the river is set aside as awilderness area; other areas in the upper watershed are subject to heavy recreational use. The upper watershed alsocontains a series of flood control dams. Further downstream, towards the middle of the watershed, are largespreading grounds utilized for groundwater recharge. The watershed is hydraulically connected to the Los AngelesRiver through the Whittier Narrows Reservoir (normally only during high storm flows). The lower part of the riverflows through a concrete-lined channel in a heavily urbanized portion of the county before becoming a soft bottomchannel once again near the ocean in the city of Long Beach. Large electrical power poles line the river along thechanneled portion and nurseries, and small stable areas.
Water Quality Objectives No AttainedThough the California Toxic Rule, the United States Environmental Protection Agency promulgated water qualitycriteria to protect of fresh water aquatic life. The recommended Criteria Continuous Concentration for dissolvedcopper is dependent on the water hardness value. After considering the event specific hardness values, the range ofacceptable concentrations was determined to be 2.38 - 266 µg/l. This criterion range was exceeded in 13% of thesampling events

Draft 1/9/02
San Gabriel River Watershed 18
Beneficial Uses Affected warm freshwater habitat wildlife habitat rare/endangered species
Data AssessmentIn order to determine the concentration of dissolved zinc that will actually be available in an aquatic environment,the water hardness must be considered. The limits calculated and presented in the chart and table below as "Limits"have had hardness values factored in to the dissolved zinc concentration. In generally, the lower the hardness valuesthe higher the dissolved cooper limit.
The chart below shows a distinct trend in the concentration of dissolved zinc. The data analyzed in the charts wascollected from a storm water monitoring programs. During the November and December 1997 storm events theconcentration of dissolved zinc shows increasing trends, and then decreases and stabilizes during the remainingevents. This trend associated with an opposing trend in hardness over the same period of time; which decreases andthen increases and stabilizes. The trends in hardness and dissolved zinc will need to be investigated further duringthe next two years. Possible explanations may be related to the dilutions by increased rainfall discharge volumes,during the El Nino storms of late 1997, or related to a change in groundwater recharge and spreading volumes.Recent data is below criteria, if this trend continues copper would be reviewed in the next listing cycle.
Summary Table for Dissolved Zinc Data (with hardness factor)Dissolved Zinc CCC (µg/l)
Dates of Sampling 8/7/97- 8/3/00Number of Samples (n) 28Minimum Data Value 50Maximum Data Value 260Median Data Value 50Arithmetic Mean Value 75.04Standard Deviation 58.81Number (Percent) above Objective 13 %
San Gabriel River R2 Zinc Data
050
100150200250300350400
Oct-97 Dec-97 Feb-98 Nov-98 Jan-99 Mar-99 Apr-99
Dis
solv
ed Z
inc
(ug/
L)
Zinc CCC Limits

Draft 1/9/02
San Gabriel River Watershed 19
Potential SourcesThe sampling location for the dissolved zinc data was the mass loading station (S14) monitored by the Los AngelesCounty Department of Public Works Storm Water Monitoring Program, and the NPDES receiving water station (R-A) monitored by the Whittier Narrows WWRP. The two data points from the Whittier Narrows were less than 10µg/l, and thus do not appear to be a source of the dissolved zinc. Therefore, it is assumed that the dissolved zincloading occurs during wet weather storm events. According to their land use and critical source runoff qualityresults, the LACDPW identified the possible sources of dissolved metals loading as light industrial, transportation,and retail/commercial land uses. According to LACDPW, the critical sources that fall into these land use categoriesare auto repair, motor freight transportation, and auto dealership.
References
Basin Plan, 1994 Watershed Management Initiative, 2000 Los Angeles County 1994-2000 Integrated Receiving Water Impacts Report, July 2000 California Toxics Rule, 2000

Draft 1/9/02
San Gabriel River Watershed 20
California Regional Water Quality Control Board, Los Angeles Region
San Gabriel River Watershed – EstuaryAmmonia as Nitrogen
Summary of Proposed ActionThe San Gabriel River Estuary is proposed to be listed in the 2002 305(b) water quality assessment as "NotSupporting" (Impaired) due to non attainment of the ammonia aquatic life chronic criteria as described in the BasinPlan. The beneficial uses that are affected by this impairment relate to aquatic life. The San Gabriel River Estuary islocated downstream from Willow Street.
Table 1. 303(d) Listing/TMDL Information
Waterbody Name San Gabriel River Estuary Pollutants/Stressors Ammonia as Nitrogen
Hydrologic Unit 405.15 Source(s) Point Sources
Total Waterbody Size 41.5 miles TMDL Priority 37
Size Affected 2.95 miles TMDL Start Date(Mo/Yr)
2001
Extent of Impairment Entire Estuary TMDL End Date(Mo/Yr)
2003
Watershed CharacteristicsThe San Gabriel River receives drainage from a large area of eastern Los Angeles County; its headwaters originatein the San Gabriel Mountains. The watershed consists of extensive areas of undisturbed riparian and woodlandhabitats in its upper reaches. Much of the watershed of the West Fork and East Fork of the river is set aside as awilderness area; other areas in the upper watershed are subject to heavy recreational use. The upper watershed alsocontains a series of flood control dams. Further downstream, towards the middle of the watershed, are largespreading grounds utilized for groundwater recharge. The watershed is hydraulically connected to the Los AngelesRiver through the Whittier Narrows Reservoir (normally only during high storm flows). The lower part of the riverflows through a concrete-lined channel in a heavily urbanized portion of the county before becoming a soft bottomchannel once again near the ocean in the city of Long Beach.
Water Quality Objectives Not AttainedThough the California Toxic Rule, the United States Environmental Protection Agency promulgated water qualitycriteria to protect of fresh water aquatic life. The recommended Criteria Continuous Concentration (CCC) andMaximum Concentration (MC) for total ammonia nitrogen is dependent on pH and temperature of the watersamples. After considering the event specific temperature and hardness values, the criterion ranges were exceededin 29% of the sampling events for the CCC assessment and 2% for the MC assessment.

Draft 1/9/02
San Gabriel River Watershed 21
Beneficial Uses Affected estuarine habitat marine habitat wildlife habitat rare/endangered species spawning, reproduction, and/or early development
Data Assessment
The data reviewed for the assessment was collected by the County Sanitation Districts of Los Angeles County aspart of the receiving water monitoring program for the San Jose Creek Water Reclamation plant.
Summary Table of Ammonia Nitrogen DataAmmonia-N (µg/l)
Dates of Sampling 11/10/97- 11/10/00Number of Samples (n) 117Minimum Data Value 0.1Maximum Data Value 88.3Median Data Value 1.9Arithmetic Mean Value 3.5Standard Deviation 5.69Percent above CCC 29
Potential SourcesThere are point sources discharges (POTWs) upstream of the estuary in addition to nonpoint source discharge fromurban runoff. The data collected was primarily from dry weather sampling events. No stormwater data was availablefor the assessment, thus Board staff was unable to assess the concentrations which occurs during storms.
San Gabriel River Estuary - Ammonia
0.00
5.00
10.00
15.00
20.00
07/01/97 11/13/98 03/27/00
Amm
onia
as
Nitr
ogen
Ammonia as Nitrogen Limits

Draft 1/9/02
San Gabriel River Watershed 22
References
Basin Plan, 1994 California Toxics Rule, August 2000 Watershed Management Initiative, 2000 A compilation of Water Quality Goals, August 2000

Draft 1/9/02
San Gabriel River Watershed 23
San Gabriel River Watershed – San Jose CreekpH (high)
Summary of Proposed ActionSan Jose Creek, a tributary of the San Gabriel River is proposed to be listed in the 2002 305(b) water qualityassessment as "Not Supporting" (Impaired) due to exceedances of pH of above than 8.5, which violates the BasinPlan water quality objective for pH.
Table 1. 303(d) Listing/TMDL Information
Waterbody Name San Jose Creek Pollutants/Stressors pH
Hydrologic Unit 405.15 Source(s) Point and NonpointSources
Total Waterbody Size 41.5 miles TMDL Priority 37
Size Affected TMDL Start Date(Mo/Yr)
2001
Extent of Impairment Reach 1 and 2 TMDL End Date(Mo/Yr)
2003
Watershed CharacteristicsThe San Gabriel River receives drainage from a large area of eastern Los Angeles County; its headwaters originatein the San Gabriel Mountains. The watershed consists of extensive areas of undisturbed riparian and woodlandhabitats in its upper reaches. Much of the watershed of the West Fork and East Fork of the river is set aside as awilderness area; other areas in the upper watershed are subject to heavy recreational use. The upper watershed alsocontains a series of flood control dams. Further downstream, towards the middle of the watershed, are largespreading grounds utilized for groundwater recharge. The watershed is hydraulically connected to the Los AngelesRiver through the Whittier Narrows Reservoir (normally only during high storm flows). The lower part of the riverflows through a concrete-lined channel in a heavily urbanized portion of the county before becoming an soft bottomchannel once again near the ocean in the city of Long Beach. Large electrical power poles line the river along thechannelized portion and nurseries, small stable areas, and a large poultry farm are located in these areas.
Water Quality Objectives Not AttainedThe Water Quality Control Plan for the Los Angeles Region (Basin Plan) states that, "The pH of inland surfacewaters shall not be depressed below 6.5 or raised above 8.5 as a result of waste discharges." This objective was notattained in Reach 2 of the San Gabriel River as indicated by the data assessment presented below.
Beneficial Uses Affected Basin Plan Objective Aquatic Life

Draft 1/9/02
San Gabriel River Watershed 24
Data AssessmentThe chart below shows that during 1997- 2000 the pH maximum of 8.5 was exceeded in 33 samples. TheLARWQCB and the San Jose Creek Water Reclamation Facility collected the data analyzed in the charts primarilyduring dry weather.
Summary Table of pH DatapH
Dates of Sampling 7/10/97- 9/10/00Number of Samples (n) 474Minimum Data Value 6.54Maximum Data Value 10.4Median Data Value 8.26Arithmetic Mean Value 8.25Standard Deviation 0.71Percent above Limit of 8.5 38%
Potential SourcesThere are point sources discharges (POTWs) upstream of San Jose Creek in addition to nonpoint source dischargefrom urban runoff. The data collected was primarily from dry weather sampling events. No stormwater data wasavailable for the assessment, thus Board staff was unable to assess the concentrations which occurs during storms.
References
Basin Plan, 1994 Watershed Management Initiative, 2000 California Toxics Rule, August 2000
San Jose Creek - pH
6.006.507.007.508.008.509.009.50
10.0010.50
Jun-97 Oct-98 Feb-00
pH
pH Limits

Draft 1/9/02
San Gabriel River Watershed 25
California Regional Water Quality Control Board, Los Angeles Region
San Gabriel River Watershed – Coyote CreekTotal Aluminum
Summary of Proposed ActionCoyote Creek, a tributary of the San Gabriel River, is proposed to be listed in the 2002 305(b) water qualityassessment as "Fully Supporting, but Threatened" (Impaired) due to greater than 10 percent exceedance of the totalaluminum primary drinking standard for protection of municipal and domestic water supply.
Table 1. 303(d) Listing/TMDL Information
Waterbody Name Coyote Creek Pollutants/Stressors Total Aluminum
Hydrologic Unit 405.15 Source(s) Point and NonpointSources
Total Waterbody Size 13.45 miles TMDL Priority 39
Size Affected 13.45 miles TMDL Start Date(Mo/Yr)
2004
Extent of Impairment Entire Reach TMDL End Date(Mo/Yr)
2006
Watershed CharacteristicsThe San Gabriel River receives drainage from a large area of eastern Los Angeles County; its headwaters originatein the San Gabriel Mountains. The watershed consists of extensive areas of undisturbed riparian and woodlandhabitats in its upper reaches. Much of the watershed of the West Fork and East Fork of the river is set aside as awilderness area; other areas in the upper watershed are subject to heavy recreational use. The upper watershed alsocontains a series of flood control dams. Further downstream, towards the middle of the watershed, are largespreading grounds utilized for groundwater recharge. The watershed is hydraulically connected to the Los AngelesRiver through the Whittier Narrows Reservoir (normally only during high storm flows). The lower part of the riverflows through a concrete-lined channel in a heavily urbanized portion of the county before becoming a soft bottomchannel once again near the ocean in the city of Long Beach. Large electrical power poles line the river along thechanneled portion and nurseries, and small stable areas.
Water Quality Objectives Not AttainedTitle 22 of the California Code of Regulations specifies maximum contaminant levels for drinking water supplies.These maximum contaminant levels (MCLs) are included in the Basin Plan as water quality objectives for watersdesignated with the MUN beneficial use. The primary MCL for aluminum is 1 mg/l. Analysis of available datadetermined that this limit was exceeded in 33% of the sampling events.
Beneficial Uses Affected Municipal and Domestic Supply
Draft 1/9/02
San Gabriel River Watershed 26
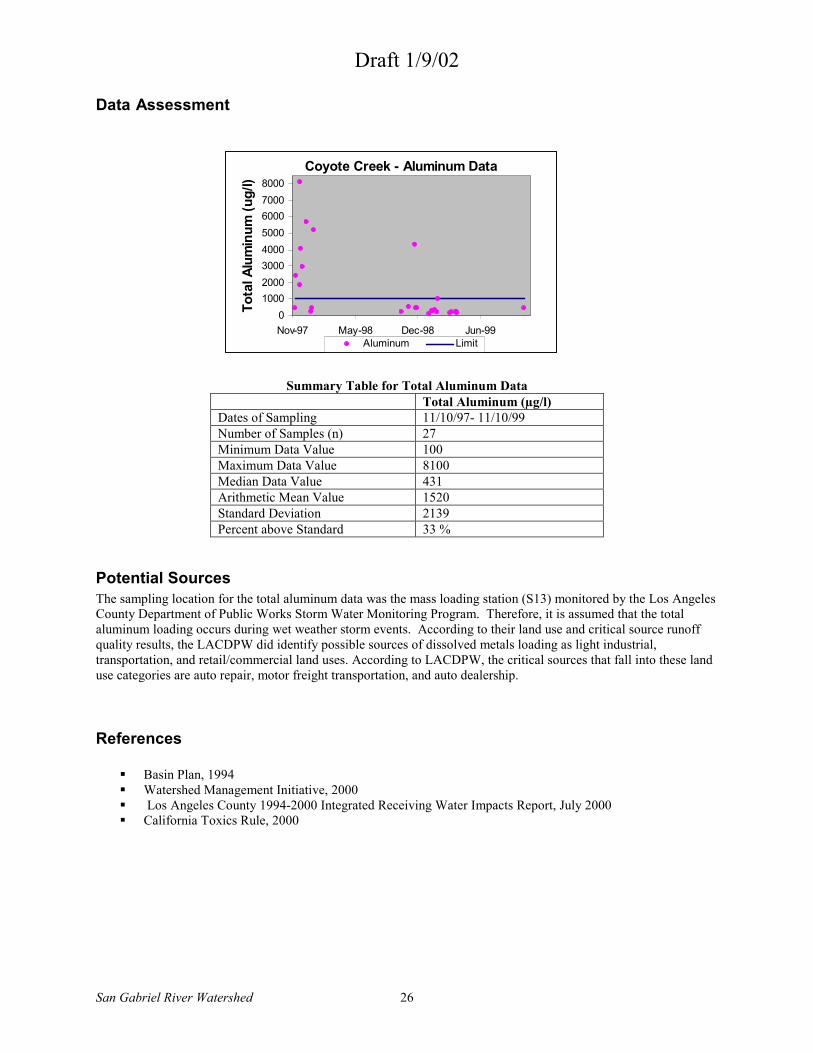
Data Assessment
Summary Table for Total Aluminum DataTotal Aluminum (µg/l)
Dates of Sampling 11/10/97- 11/10/99Number of Samples (n) 27Minimum Data Value 100Maximum Data Value 8100Median Data Value 431Arithmetic Mean Value 1520Standard Deviation 2139Percent above Standard 33 %
Potential SourcesThe sampling location for the total aluminum data was the mass loading station (S13) monitored by the Los AngelesCounty Department of Public Works Storm Water Monitoring Program. Therefore, it is assumed that the totalaluminum loading occurs during wet weather storm events. According to their land use and critical source runoffquality results, the LACDPW did identify possible sources of dissolved metals loading as light industrial,transportation, and retail/commercial land uses. According to LACDPW, the critical sources that fall into these landuse categories are auto repair, motor freight transportation, and auto dealership.
References
Basin Plan, 1994 Watershed Management Initiative, 2000 Los Angeles County 1994-2000 Integrated Receiving Water Impacts Report, July 2000 California Toxics Rule, 2000
Coyote Creek - Aluminum Data
010002000300040005000600070008000
Nov-97 May-98 Dec-98 Jun-99
Tota
l Alu
min
um (u
g/l)
Aluminum Limit

Draft 1/9/02
San Gabriel River Watershed 27
California Regional Water Quality Control Board, Los Angeles Region
San Gabriel River Watershed – Coyote CreekDissolved Lead
Summary of Proposed ActionCoyote Creek, a tributary of the San Gabriel River, is proposed to be listed in the 2002 305(b) water qualityassessment as not supporting due to exceedance of the dissolved lead chronic water quality criterion for protectionof fresh water aquatic life. The beneficial uses that are affected by this impairment relate to aquatic life use supportand include warm freshwater habitat, wildlife habitat, and rare/endangered species habitat.
Table 1. 303(d) Listing/TMDL Information
Waterbody Name Coyote Creek Pollutants/Stressors Dissolved Lead
Hydrologic Unit 405.15 Source(s) Nonpoint Sources
Total Waterbody Size 13.5 TMDL Priority TMDL Analytical Unit39
Size Affected 13.5 miles TMDL Start Date(Mo/Yr)
2004
Extent of Impairment Entire Reach TMDL End Date(Mo/Yr)
2006
Watershed CharacteristicsThe San Gabriel River receives drainage from a large area of eastern Los Angeles County; its headwaters originatein the San Gabriel Mountains. The watershed consists of extensive areas of undisturbed riparian and woodlandhabitats in its upper reaches. Much of the watershed of the West Fork and East Fork of the river is set aside as awilderness area; other areas in the upper watershed are subject to heavy recreational use. The upper watershed alsocontains a series of flood control dams. Further downstream, towards the middle of the watershed, are largespreading grounds utilized for groundwater recharge. The watershed is hydraulically connected to the Los AngelesRiver through the Whittier Narrows Reservoir (normally only during high storm flows). The lower part of the riverflows through a concrete-lined channel in a heavily urbanized portion of the county before becoming a soft bottomchannel once again near the ocean in the city of Long Beach. Large electrical power poles line the river along thechanneled portion and nurseries, and small stable areas.
Water Quality Objectives Not AttainedThrough the California Toxic Rule (CTR), the United States Environmental Protection Agency promulgated waterquality criteria to protect fresh water aquatic life. The recommended Criteria Continuous Concentration fordissolved lead is dependent on the water hardness value. After considering the event specific hardness values, therange of CTR limits was determined to be 1.17 - 12.02 µg/l. This criterion range was exceeded in 69% of thesampling events.

Draft 11/19/01
San Gabriel River Watershed 28
Beneficial Uses Affected warm freshwater habitat wildlife habitat rare/endangered species habitat
Data Assessment
In order to determine the concentration of dissolved lead that will actually be available in an aquatic environment,the water hardness must be considered. The limits calculated and presented in the chart and table below as "Limits"have had hardness values factored in to the dissolved lead concentration. In general, the lower the hardness valuesthe higher the dissolved lead limit.
The chart below shows a distinct trend in the concentration of dissolved lead. The data analyzed in the charts wascollected from a storm water monitoring program. During the November and December 1997 storm events theconcentration of dissolved lead shows increasing trend, and then decreases and stabilizes during the remainingevents. Possible explanations may be related to the dilution by increased rainfall-related discharge volumes, duringthe El Nino storms of late 1997, or related to a change in groundwater recharge and spreading volumes.
Coyote Creek Dissolved Lead Data
0
20
40
60
80
Nov-97 Jan-98 Dec-98 Feb-99 Apr-99
Diss
olve
d Le
ad (u
g/l)
Dissolved Lead Limits
Summary Table of Dissolved Lead DataDissolved Lead (µg/l)
Dates of Sampling 11/10/97- 11/10/99Number of Samples (n) 27Minimum Data Value 5.23Maximum Data Value 85Median Data Value 5Arithmetic Mean Value 10.79Standard Deviation 16.52Percent above CCC 69%
Potential SourcesThe sampling location for the dissolved lead data was the mass loading station (S13) monitored by the Los AngelesCounty Department of Public Works Storm Water Monitoring Program. Therefore, it is assumed that the dissolvedlead loading occurs during wet weather storm events. According to their land use and critical source runoff quality

Draft 11/19/01
San Gabriel River Watershed 29
results, the LACDPW did identify the possible sources of dissolved metals loading as light industrial, transportation,and retail/commercial land uses. According to LACDPW, the critical sources that fall into these land use categoriesare auto repair, motor freight transportation, and auto dealership.
References
Basin Plan, 1994 Watershed Management Initiative, 2000 Los Angeles County 1994-2000 Integrated Receiving Water Impacts Report, July 2000 California Toxics Rule, August 2000