california massachusetts florida [email protected] (310) 993-9664 stephen p. rothman,...
TRANSCRIPT

California Massachusetts Florida
www.rothmanandcompany.com
(310) 993-9664
Stephen P. Rothman, Esq.
Startup Equity Allocations, Cap Tables, Pricing Negotiations
UCLA Office of Intellectual PropertyDecember 9, 2013
2
Biographical Information• 27 years business law practice
• Currently focus on startups from universities and their investors
• 20 university startup formation / financings completed in last two years
• Largest client is super-angel who does multiple university startup financings each year
• Formerly a partner at Morrison & Foerster and at Irell & Manella
• Now 2-person firm
• Experience as founder and entrepreneur
• Frequent speaker – NCET2 webinars, Children’s Hospital L.A., USC Stevens Institute, Caltech Office of Technology Transfer, Florida Innovation Hub at UF Gainesville
• J.D., cum laude Harvard Law School, 1985
• B.A., cum laude, Yale University, 1982

3
Terminology“Pre-money valuation”
• In the context of an upcoming equity transaction, the value that is assigned to the company prior to consummation of the financing.
• The earlier the stage, the less objective analysis
• The earlier the stage, the more a product of leverage and negotiation
• Accepted valuation methods for mature companies don’t apply:• P/E ratios• Acquisition prices• Revenue multiples• For Internet companies with no revenue, unique visitors• Asset valuation

4
Terminology 2
“Pre-money valuation” 2
• university based startups usually too early-stage for technical, evidenced based valuation
• Assigned pre-money valuation is a matter of negotiation and leverage, not a real “valuation.”
5
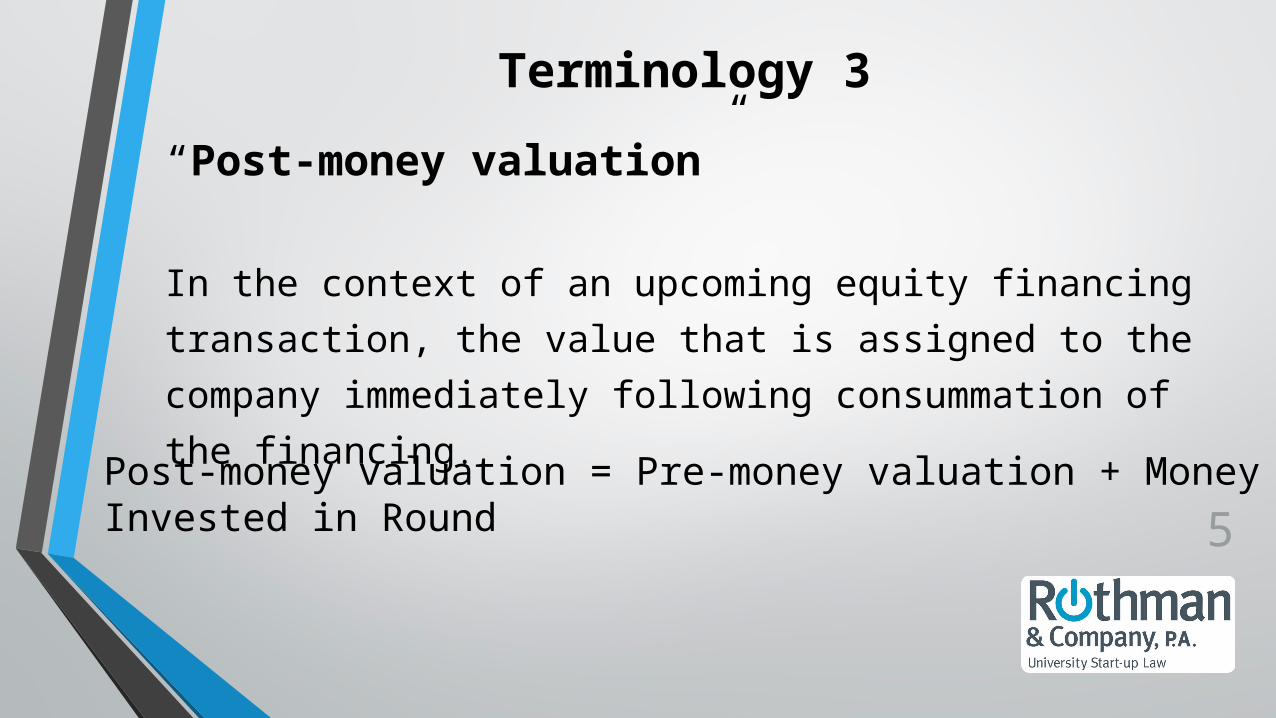
“Post-money valuation”
In the context of an upcoming equity financing transaction, the value
that is assigned to the company immediately following consummation
of the financing.
Terminology 3
Post-money valuation = Pre-money valuation + Money Invested in Round
6
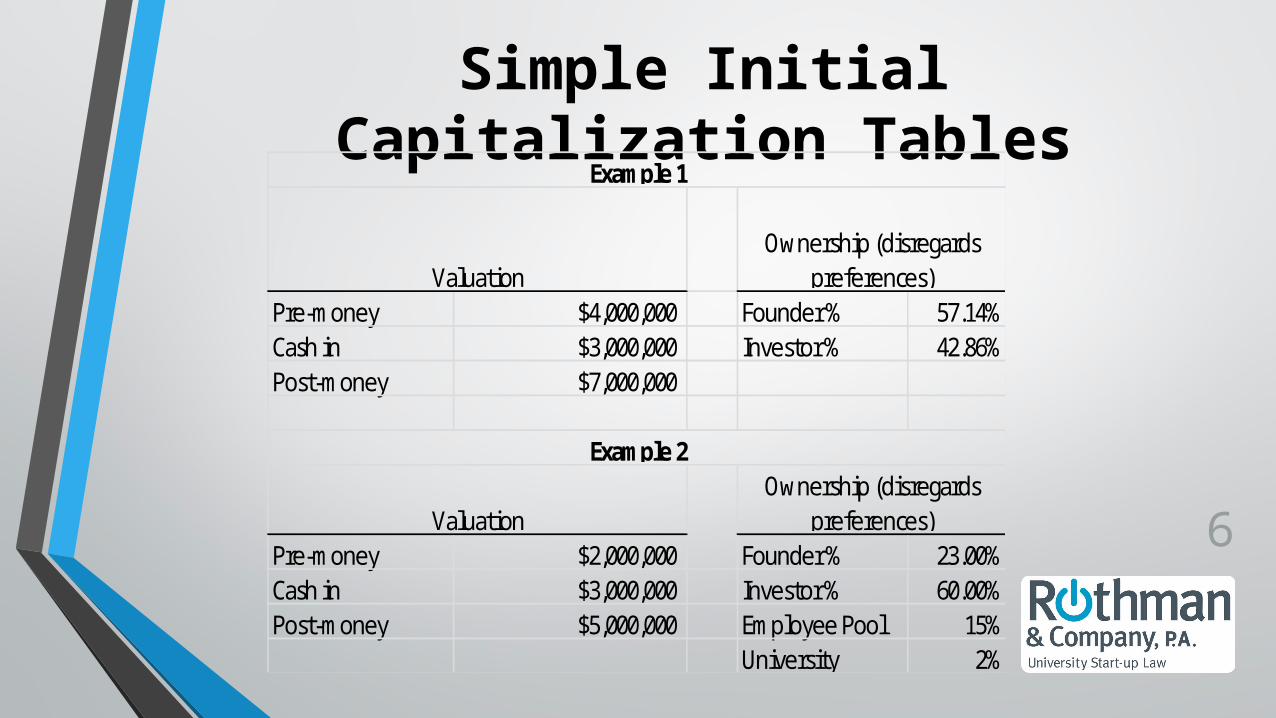
Simple Initial Capitalization Tables
Pre-money $4,000,000 Founder % 57.14%Cash in $3,000,000 Investor % 42.86%Post-money $7,000,000
Pre-money $2,000,000 Founder % 23.00%Cash in $3,000,000 Investor % 60.00%Post-money $5,000,000 Employee Pool 15%
University 2%
ValuationOwnership (disregards
preferences)
Example 1
Example 2
ValuationOwnership (disregards
preferences)
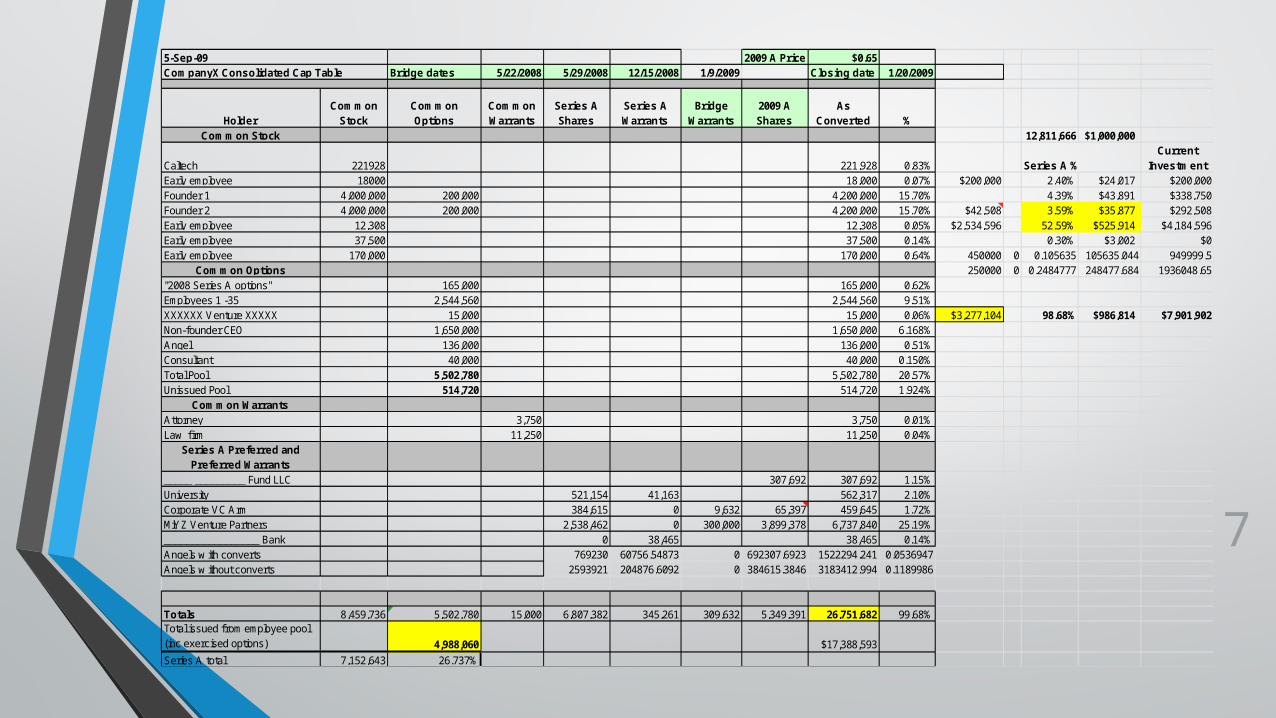
2009 A Price $0.65Bridge dates 5/22/2008 5/29/2008 12/15/2008 1/9/2009 Closing date 1/20/2009
HolderCommon
StockCommon Options
Common Warrants
Series AShares
Series AWarrants
Bridge Warrants
2009 A Shares
As Converted %
Common Stock 12,811,666 $1,000,000
Caltech 221928 221,928 0.83% Series A %Current
InvestmentEarly employee 18000 18,000 0.07% $200,000 2.40% $24,017 $200,000Founder 1 4,000,000 200,000 4,200,000 15.70% 4.39% $43,891 $338,750Founder 2 4,000,000 200,000 4,200,000 15.70% $42,508 3.59% $35,877 $292,508Early employee 12,308 12,308 0.05% $2,534,596 52.59% $525,914 $4,184,596Early employee 37,500 37,500 0.14% 0.30% $3,002 $0Early employee 170,000 170,000 0.64% 450000 0 0.105635 105635.044 949999.5
Common Options 250000 0 0.2484777 248477.684 1936048.65"2008 Series A options" 165,000 165,000 0.62%Employees 1 -35 2,544,560 2,544,560 9.51%XXXXXX Venture XXXXX 15,000 15,000 0.06% $3,277,104 98.68% $986,814 $7,901,902Non-founder CEO 1,650,000 1,650,000 6.168%Angel 136,000 136,000 0.51%Consultant 40,000 40,000 0.150%Total Pool 5,502,780 5,502,780 20.57%Unissued Pool 514,720 514,720 1.924%
Common WarrantsAttorney 3,750 3,750 0.01%Law firm 11,250 11,250 0.04%
Series A Preferred and Preferred Warrants
_____ _________ Fund LLC 307,692 307,692 1.15%University 521,154 41,163 562,317 2.10%Corporate VC Arm 384,615 0 9,632 65,397 459,645 1.72%MiYZ Venture Partners 2,538,462 0 300,000 3,899,378 6,737,840 25.19%_________________ Bank 0 38,465 38,465 0.14%Angels w ith converts 769230 60756.54873 0 692307.6923 1522294.241 0.0536947Angels w ithout converts 2593921 204876.6092 0 384615.3846 3183412.994 0.1189986
Totals 8,459,736 5,502,780 15,000 6,807,382 345,261 309,632 5,349,391 26,751,682 99.68%Total issued from employee pool (inc exercised options) 4,988,060 $17,388,593
Series A total 7,152,643 26.737%
5-Sep-09CompanyX Consolidated Cap Table
7

Before Debt With Debt Angel 2 $5M
Class A Common Stock 10,152,361 29.9% 10,152,361 16.5% 7,657,461 8.3%
Founder 1 3,534,575 10.4% 3,534,575 5.7% 2,536,615 2.8%
Founder 2 3,534,575 10.4% 3,534,575 5.7% 2,536,615 2.8%
Founder 3 1,767,287 5.2% 1,767,287 2.9% 1,268,307 1.4%Pledged by Founders for Unvest Options for _____________ Emp 397,605 1.2% 397,605 0.6% 397,605 0.4%Pledged by Founders for Key Emp Exit Sales Bonuses 918,319 2.7% 918,319 1.5% 918,319 1.0%
Option Pool 3,933,333 11.6% 3,933,333 6.4% 6,428,233 7.0% 2,494,900
Series A (1) 15,000,000 44.2% 15,000,000 24.3% 15,000,000 16.3%
Anti-Dilution Additional A 25,593,671 27.9% 79.66% Angel 1
Angel 2 4,591,595 5.0%
Series B Notes, Fully Converted 27,713,304 45.0% 27,713,304 30.2%
Series B, Warrants (Vested) 4,847,639 14.3% 4,847,639 7.9% 4,847,639 5.3%
Total 33,933,333 100.0% 61,646,637 100.0% 91,831,903 100.0%
Pre-money Series B35,000,000 CP1 A = 0.5459$
(1) 11,000,000 shares divided by 0.73333 conversion price CP1 B = 1.03$
Full anti-dilution protection Angel 1 On=1.0 1
Angel 2 Price 2.5620$
Angel 2 Initial Shares 1,951,625
Angel 2 converted to Common 2,661,307 4,591,595
Angel 2 Anti-dilution shares 1,930,288
Total Angel 2 Fully Diluted Shares 4,591,595
Series A Preferred Shares 11,000,000
Series A Conversion Price 0.73333$
Series B Investment 26,400,000$ 37,400,000$ Series B Notes Accrued Int to December 31, 2013 2,184,333$
Series B Conversion Price 1.03143$ 1.03143
ESOP Shares 3,933,333
Total Refinancing of Series B conv LOC -$ Series B ESOP Target 7.00%New $5M Bridge On=1 1
9/30/2013 1,690,583 25,000.00$ 2,500,000$
10/31/2013 1,765,583 51,750.00$
11/30/2013 1,840,583 83,750.00$
12/30/2013 1,915,583 115,750.00$ 2,500,000$
147,750.00$
Checks for ESOP exericse 179,750.00$
4,781.16$ 211,750.00$ 700,000$
2,860.66$ 268,750.00$ 700,000$
1,800.00$ 5,000,000$
1,755.00$
11,196.82$
62,205 Shares issued
__________ Inc. Capitalization Table As of December 31, 2013
8
9
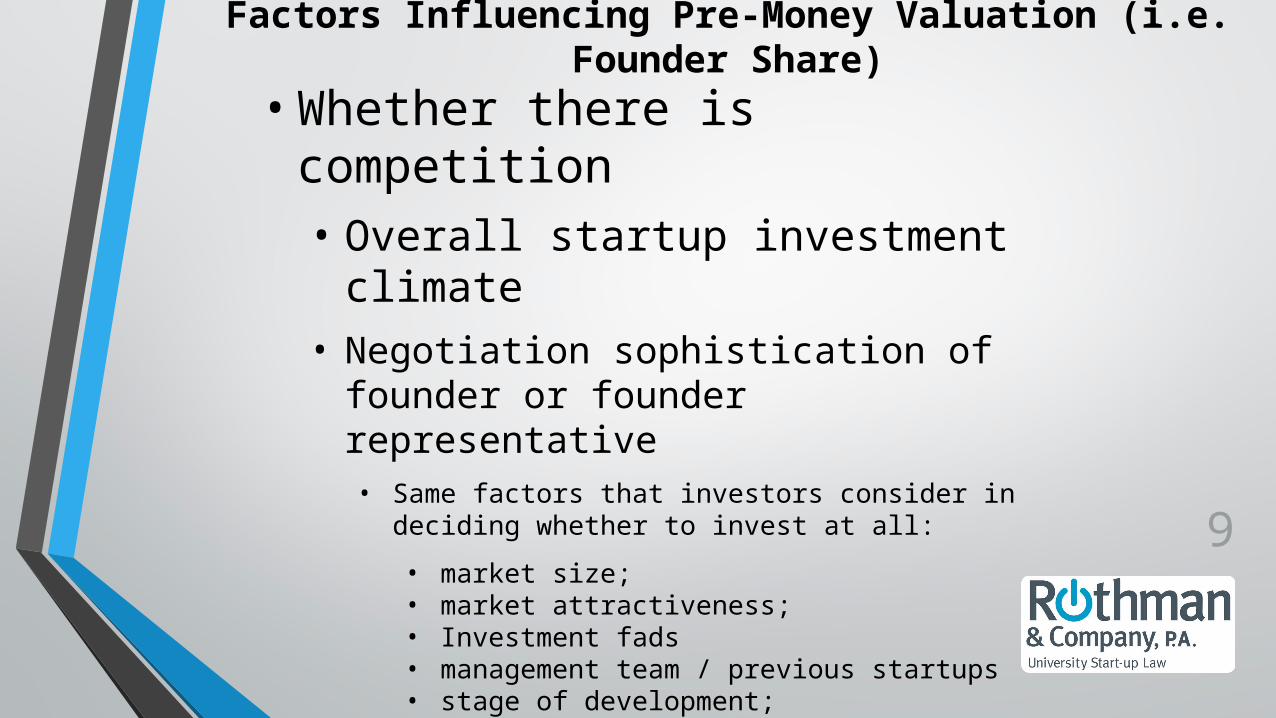
Factors Influencing Pre-Money Valuation (i.e. Founder Share)
• Whether there is competition• Overall startup investment climate
• Negotiation sophistication of founder or founder representative• Same factors that investors consider in deciding whether to
invest at all:
• market size; • market attractiveness;• Investment fads• management team / previous startups• stage of development;• market for exits.
10
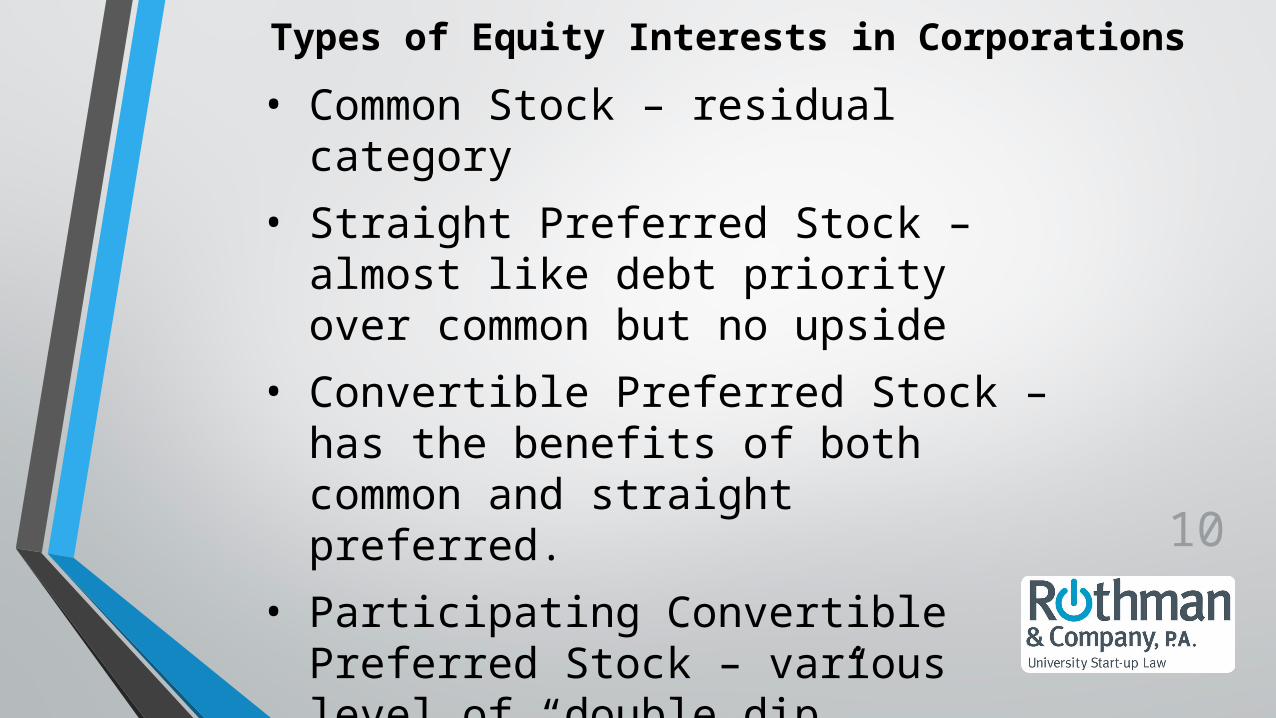
Types of Equity Interests in Corporations
• Common Stock – residual category
• Straight Preferred Stock – almost like debt priority over common but no upside
• Convertible Preferred Stock – has the benefits of both common and straight preferred.
• Participating Convertible Preferred Stock – various level of “double dip”
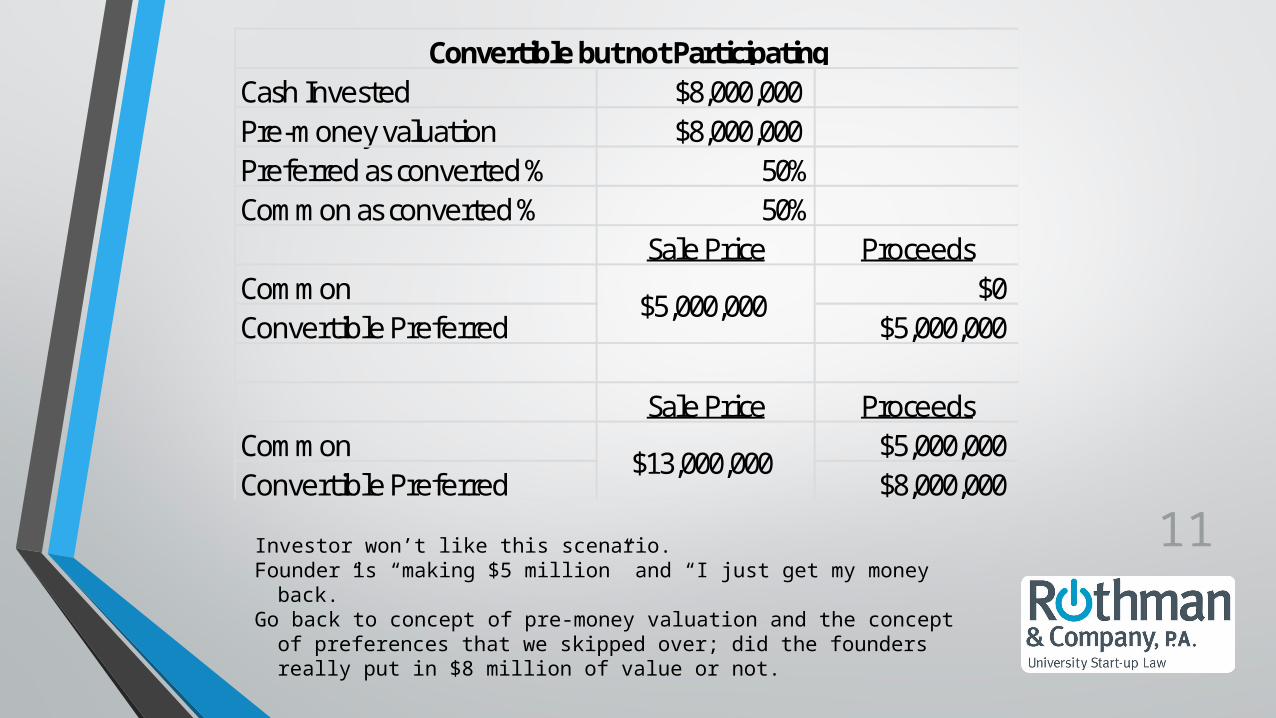
11Investor won’t like this scenario.Founder is “making $5 million” and “I just get my money back.”Go back to concept of pre-money valuation and the concept of
preferences that we skipped over; did the founders really put in $8 million of value or not.
Cash Invested $8,000,000Pre-money valuation $8,000,000Preferred as converted % 50%Common as converted % 50%
Sale Price ProceedsCommon $0Convertible Preferred $5,000,000
Sale Price ProceedsCommon $5,000,000Convertible Preferred $8,000,000
$5,000,000
$13,000,000
Convertible but not Participating
12
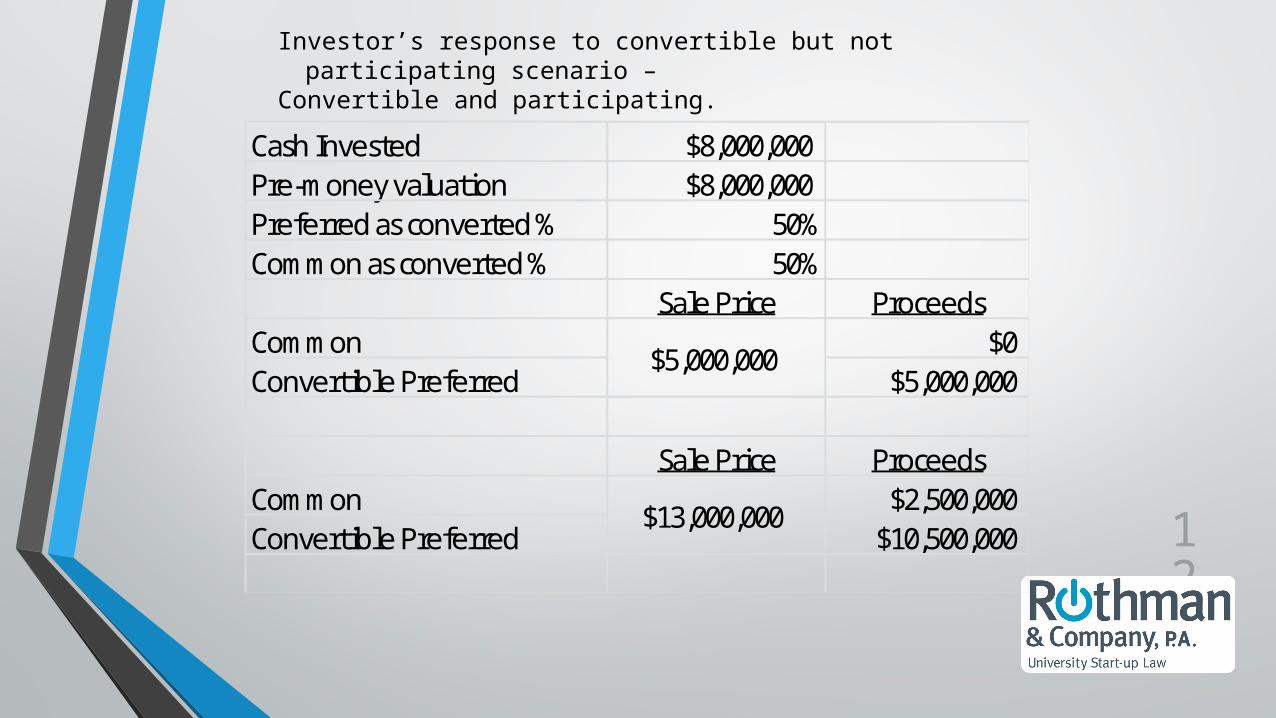
Investor’s response to convertible but not participating scenario –
Convertible and participating.
Cash Invested $8,000,000Pre-money valuation $8,000,000Preferred as converted % 50%Common as converted % 50%
Sale Price ProceedsCommon $0Convertible Preferred $5,000,000
Sale Price ProceedsCommon $2,500,000Convertible Preferred $10,500,000
$5,000,000
$13,000,000
13
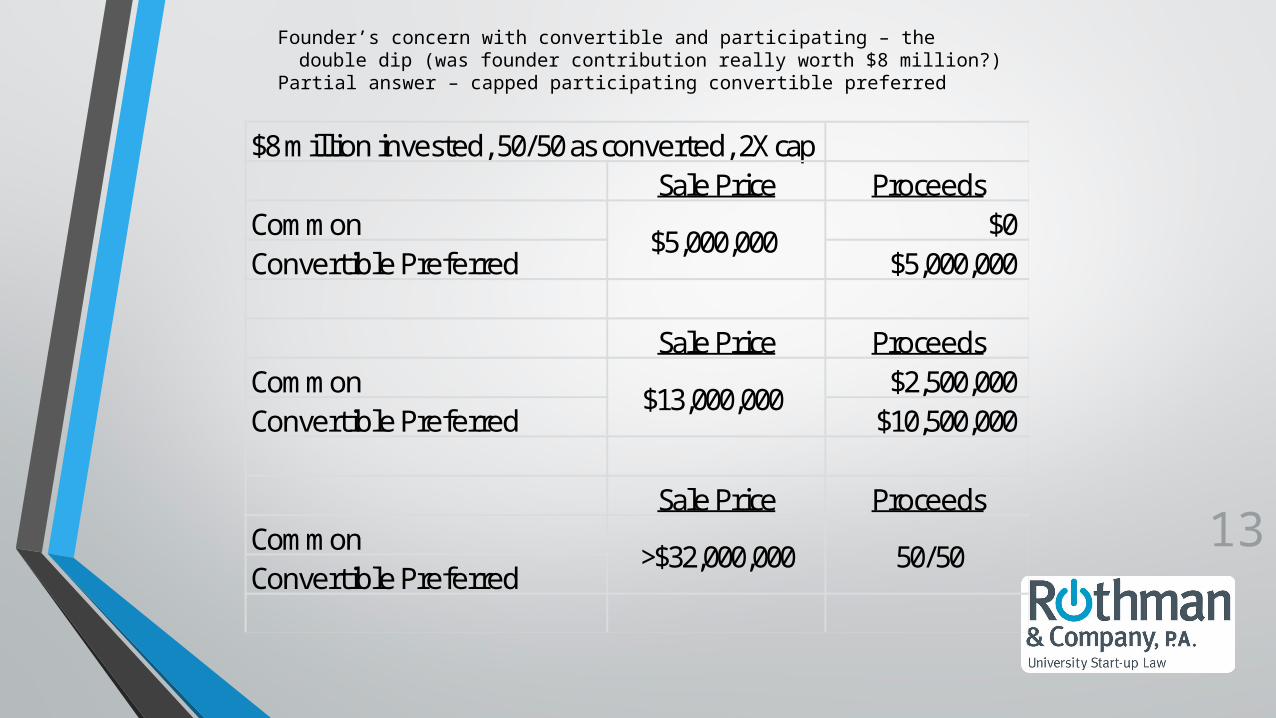
Founder’s concern with convertible and participating – the double dip (was founder contribution really worth $8 million?)
Partial answer – capped participating convertible preferred
$8 million invested, 50/50 as converted, 2X capSale Price Proceeds
Common $0Convertible Preferred $5,000,000
Sale Price ProceedsCommon $2,500,000Convertible Preferred $10,500,000
Sale Price ProceedsCommonConvertible Preferred
$5,000,000
$13,000,000
>$32,000,000 50/50
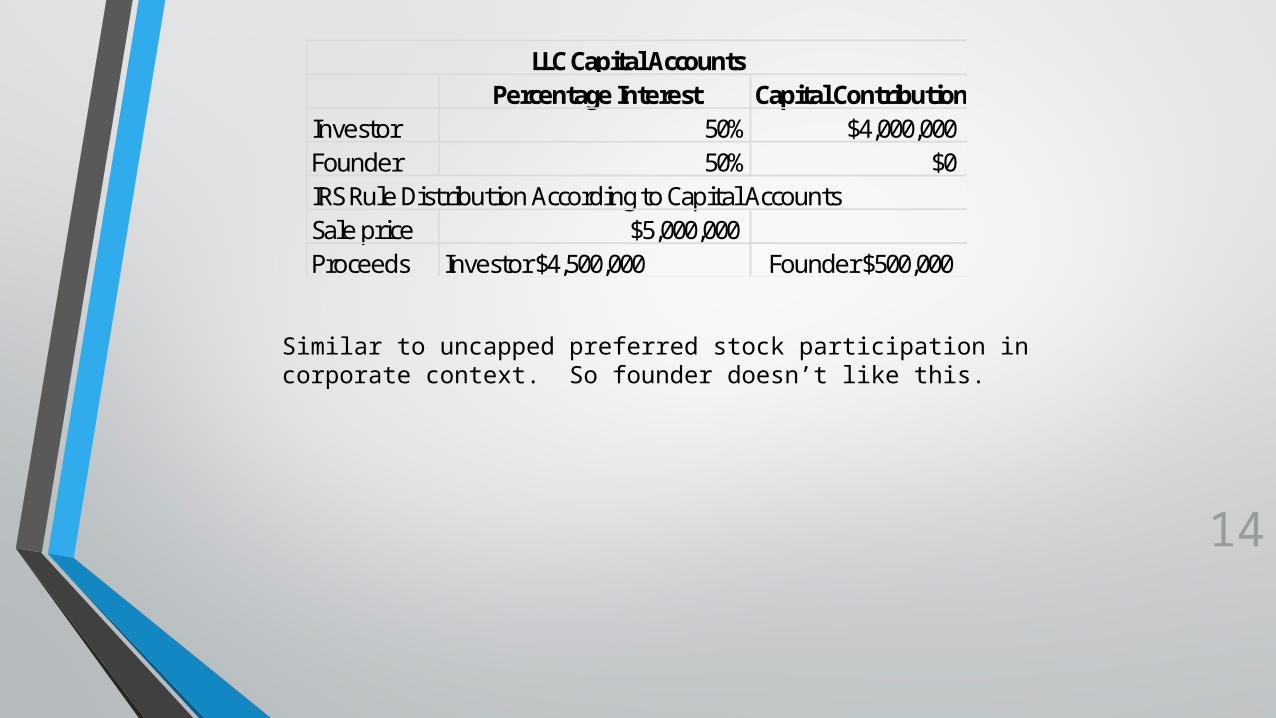
Percentage Interest Capital ContributionInvestor 50% $4,000,000Founder 50% $0IRS Rule Distribution According to Capital AccountsSale price $5,000,000Proceeds Investor $4,500,000 Founder $500,000
LLC Capital Accounts
Similar to uncapped preferred stock participation in corporate context. So founder doesn’t like this.
14

Possible Alternatives in LLC
• “Layer Cake” Profit and Loss Allocations• Allocated P&L per percentage interests• Distributions on sale per capital accounts• Investor has infinite double dip
• “Target” Profit and Loss Allocations• Specify how you would like distributions to come
out• Allocate P&L however you need to in order to
make capital accounts consistent with those distributions
• Satisfies IRS rule that distributions are pursuant to capital accounts, though only because the capital accounts have been tinkered with to make them equal desired distributions.
15
16
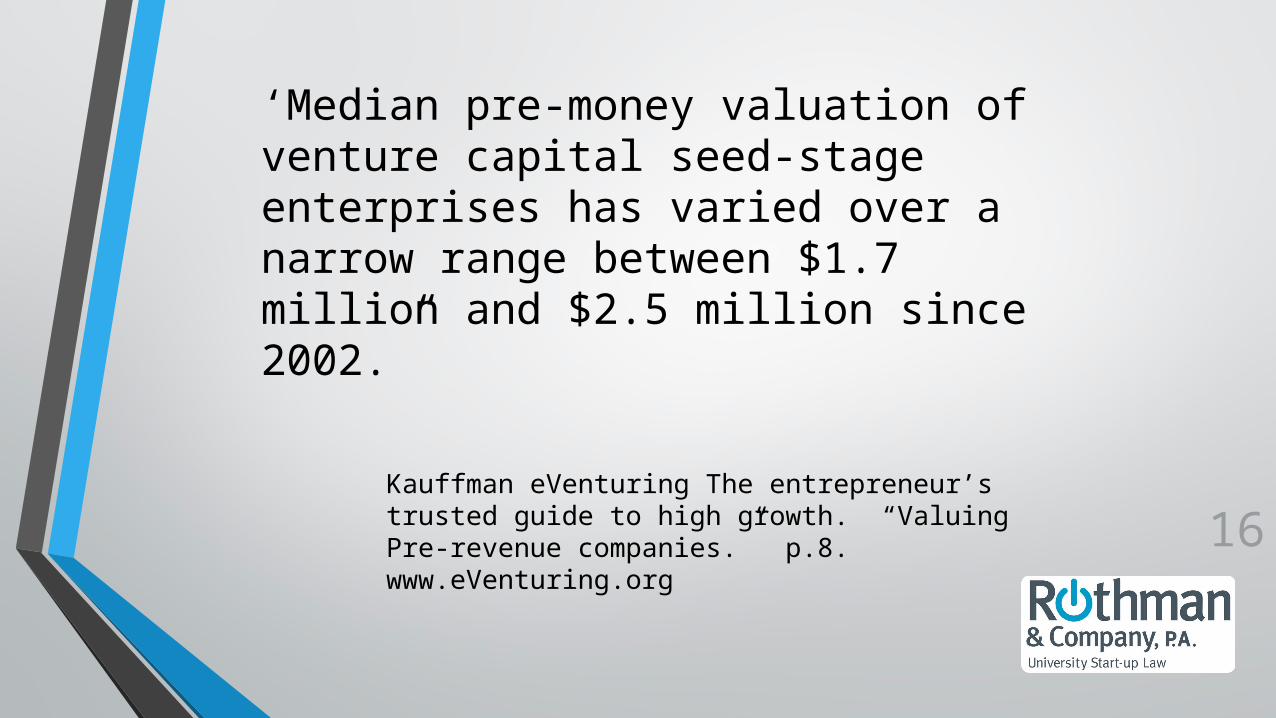
‘Median pre-money valuation of venture capital seed-stage enterprises has varied over a narrow range between $1.7 million and $2.5 million since 2002.”
Kauffman eVenturing The entrepreneur’s trusted guide to high growth. “Valuing Pre-revenue companies.” p.8. www.eVenturing.org
17
Stephen P. Rothman, Esq.
Rothman and Company, P.A.
E-MAIL: [email protected]
Direct Phone: (310) 993-9664
Questions?
Sean Brady, Esq.Rothman and Company,
P.A.
E-MAIL: [email protected]
Direct Phone: (626) 993-8424
www.rothmanandcompany.com