california electricity opportunity turned into risk risk turned into challenge challenge turned into...
TRANSCRIPT
California Electricity
Opportunity turned into Risk
Risk turned into Challenge
Challenge turned into Crisis
Crisis turned into Blight

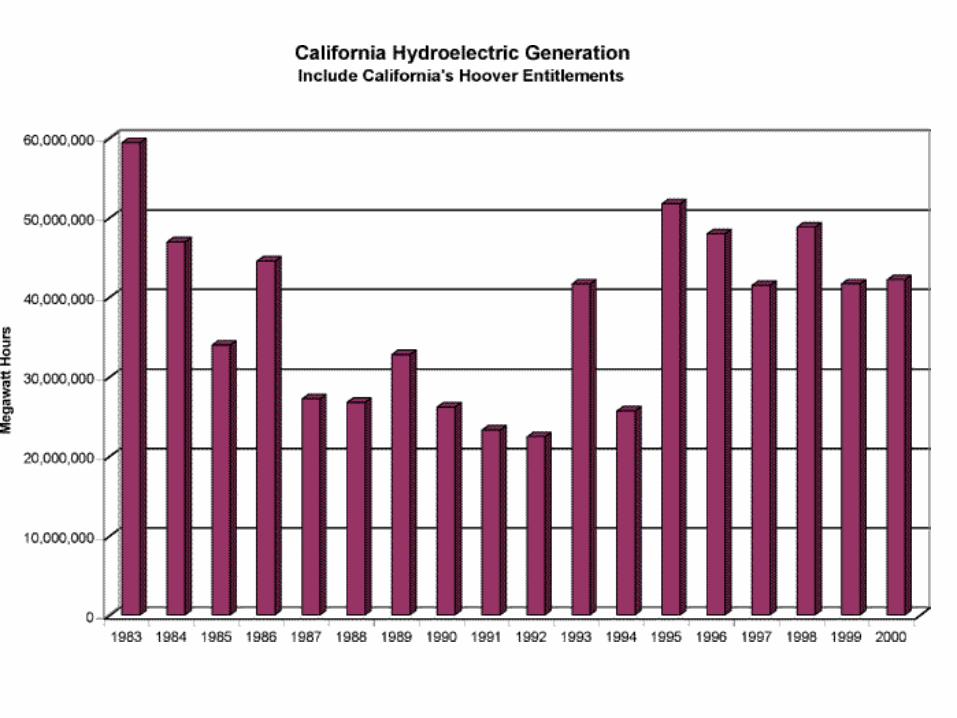
Source: California Energy Commission http://www.energy.ca.gov/html/energysources.html

California Electricity
Opportunity turned into RiskRisk turned into Challenge
Challenge turned into Crisis
Crisis turned into Blight

Electricity Restructuring
• Assembly Bill 1890, September 1996
• Created wholesale markets– PX, CA-ISO
• Isolated Consumer from producer of electricity– Retail price control
– “Transition charge” to pay for “stranded assets”
• Increased utility risk bearing– Encouraged divesture of generating assets
– Discouraged long term wholesale electricity contracts

Operational Capacity: California’s Three Utilities
All Coal, Some Nuclear: Out of State Source: California Energy Commission
Wind3.8%
Oil0.7%
Coal 5.4%
Hydro: QF0.4%
Geothermal10.3%
Solar0.3%
Nuclear11.2%
Hydro: Utility13.5%
Natural Gas51.8%
Biomass2.6%

Operational Capacity: California’s Three Investor Owned Utilities
Divested44%
Utility Owned29%
QF23%
Self-Gen.4%
Some Utility Owned: Out of State Source: California Energy Commission
California Electricity
Opportunity turned into Risk
Risk turned into ChallengeChallenge turned into Crisis
Crisis turned into Blight
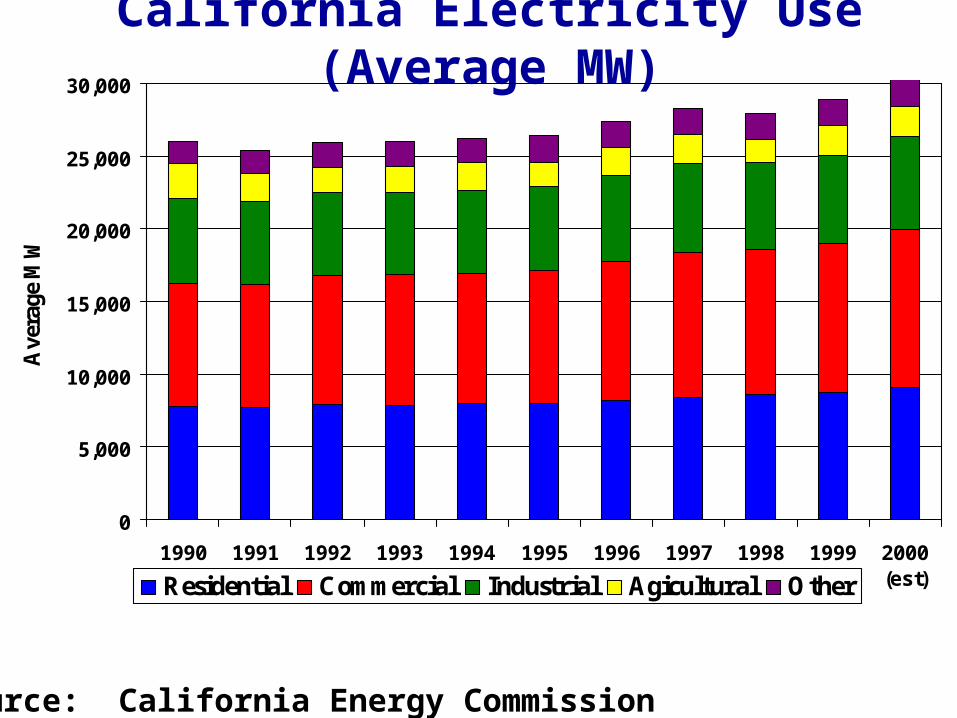
California Electricity Use (Average MW)
0
5,000
10,000
15,000
20,000
25,000
30,000
1990 1991 1992 1993 1994 1995 1996 1997 1998 1999 2000(est)
Ave
rage
MW
Residential Commercial Industrial Agicultural Other
Source: California Energy Commission
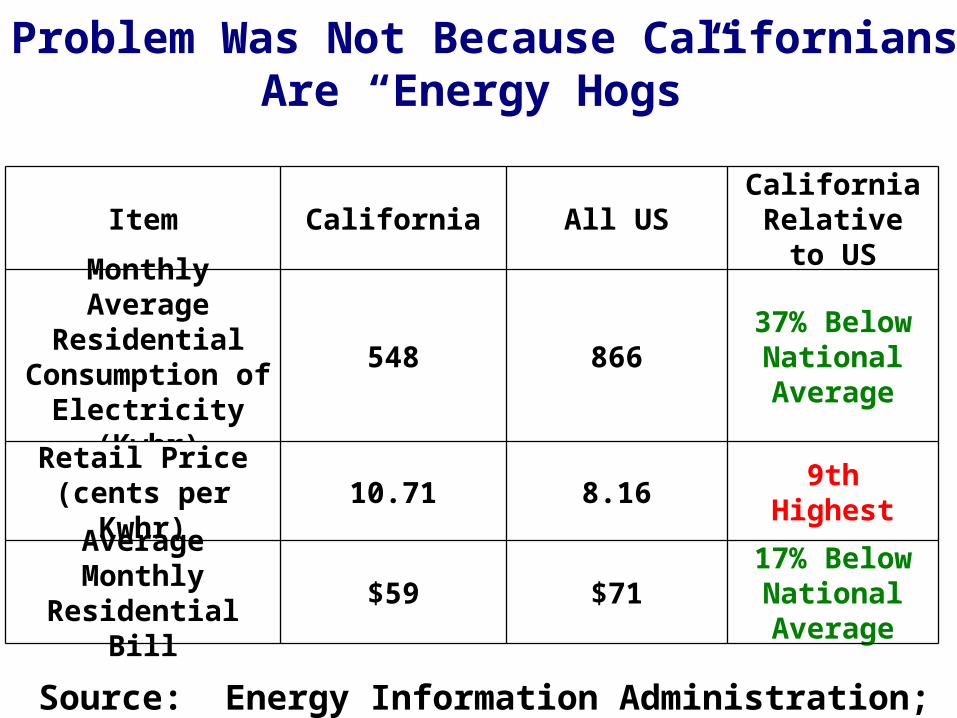
Problem Was Not Because Californians Are “Energy Hogs”
Source: Energy Information Administration; 1999 Data
Item California All US
Monthly Average Residential
Consumption of Electricity (Kwhr)
548 866
California Relative to
US
37% Below National Average
Retail Price (cents per Kwhr)
10.71 8.16 9th Highest
Average Monthly Residential Bill
$59 $7117% Below
National Average

Present Status of Plants: Applications Since 1980
0
1000
2000
3000
4000
5000
6000
7000
1980 1982 1984 1986 1988 1990 1992 1994 1996 1998 2000
Application Year
Tota
l M
W c
ap
ac
ity
Cancelled/ On Hold
Under Review
Construction To Begin Soon
Under Construction
Operational

Basic Market Forces
Demand for Electricity Increased a Bit More than Expected Healthy California Economy Growth of Electricity-intensive Products Decline in the Retail Price of Electricity
Supply of Electricity Did Not Increase Until Recently No New Generating Plants on Line
But Many in pipeline Slow Regulatory Approval Process
Supplies from Pacific Northwest and Southwest Decreased
Costs of Electricity Generation Increased Prices of Natural Gas increased Prices of NOx Prices skyrocketed under RECLAIM project

Pacific Gas & Electric
Southern California Edison
San Diego Gas & Electric

California Electricity
Opportunity turned into Risk
Risk turned into Challenge
Challenge turned into CrisisCrisis turned into Blight

Day-ahead Prices in the PX
$0
$50
$100
$150
$200
$250
$300
$350
Apr
-98
Jun-
98
Aug
-98
Oct
-98
Dec
-98
Feb-
99
Apr
-99
Jun-
99
Aug
-99
Oct
-99
Dec
-99
Feb-
00
Apr
-00
Jun-
00
Aug
-00
Oct
-00
Dec
-00
Dol
lars
Per
Mw
hr
NP15SP 15
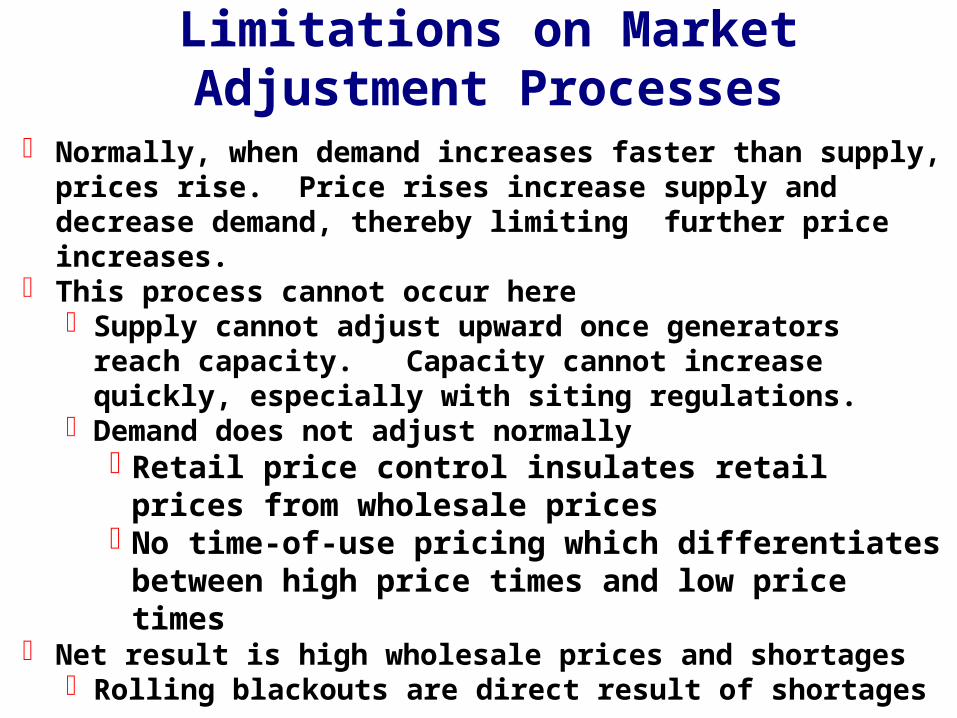
Limitations on Market Adjustment Processes
Normally, when demand increases faster than supply, prices rise. Price rises increase supply and decrease demand, thereby limiting further price increases.
This process cannot occur here Supply cannot adjust upward once generators reach
capacity. Capacity cannot increase quickly, especially with siting regulations.
Demand does not adjust normally Retail price control insulates retail prices from
wholesale prices No time-of-use pricing which differentiates
between high price times and low price times Net result is high wholesale prices and shortages
Rolling blackouts are direct result of shortages

Source: California Energy Commissionwww.energy.ca.gov/electricity/wepr/

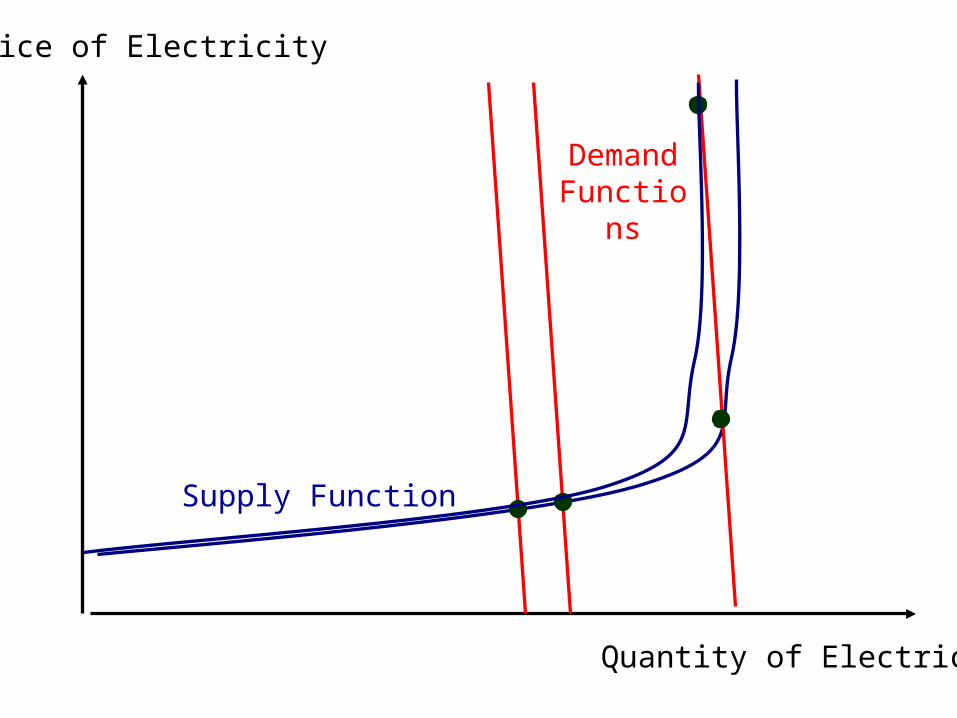
Quantity of Electricity
Price of Electricity
Supply Function
Demand Functions

Quantity of Electricity
Price of Electricity
Supply Function
Demand Functions

Exercise of Market Power By Generators
Individual generators have much market power They can hold back electricity supplies and
cause prices to increase disproportionately No demand response Supply response of rivals very limited
when rivals are at capacity Market power would have decreased if much
electricity were sold on long term contracts But this was precluded by AB 1890
Quantity of Electricity
Price of Electricity
Supply Function
Demand Functions


Average Daily Generating Capacity Offline
0
2,000
4,000
6,000
8,000
10,000
12,000
14,000
16,000
Ma
r-9
9A
pr-
99
Ma
y-9
9J
un
-99
Ju
l-9
9A
ug
-99
Se
p-9
9O
ct-
99
No
v-9
9D
ec
-99
Ja
n-0
0F
eb
-00
Ma
r-0
0A
pr-
00
Ma
y-0
0J
un
-00
Ju
l-0
0A
ug
-00
Se
p-0
0O
ct-
00
No
v-0
0D
ec
-00
Ja
n-0
1F
eb
-01
Ma
r-0
1A
pr-
01
Ma
y-0
1J
un
-01
Meg
aw
att
s (
Avera
ge D
ail
y)
Source: California Energy Commissionhttp://www.energy.ca.gov/electricity/1999-2001_monthly_off_line.html

Source: California Energy Commissionwww.energy.ca.gov/electricity/wepr/

Other Crisis Impacts
• Rolling Blackouts
• PG&E Bankruptcy
• Edison Electric Near Bankruptcy
• State Budgetary Surplus Eliminated
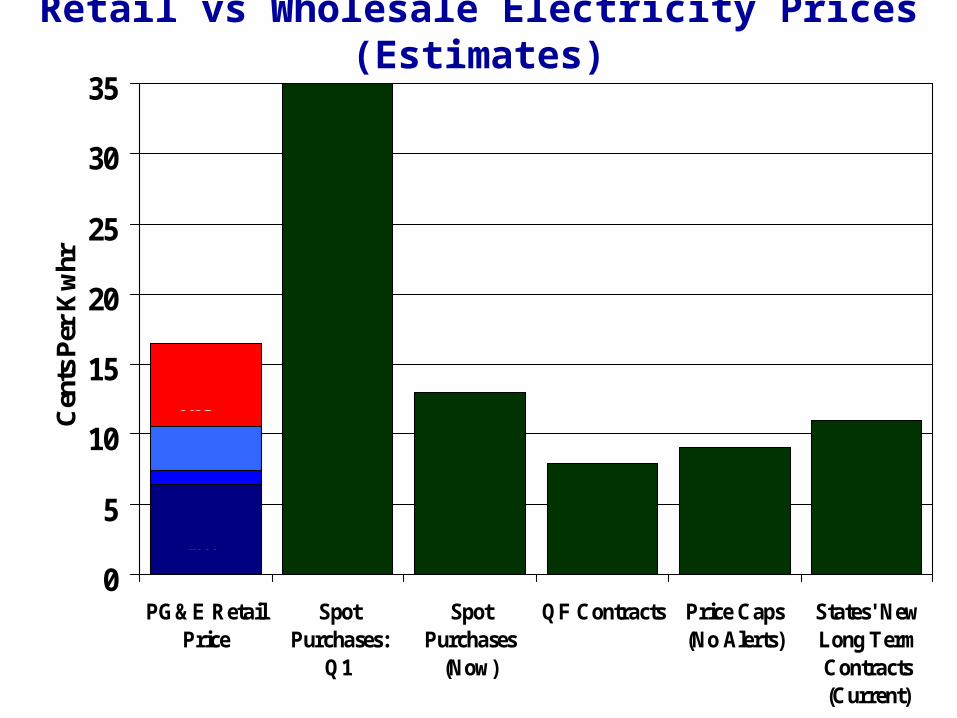
Retail vs Wholesale Electricity Prices (Estimates)
0
5
10
15
20
25
30
35
PG&E RetailPrice
SpotPurchases:
Q1
SpotPurchases
(Now)
QF Contracts Price Caps(No Alerts)
States' NewLong TermContracts(Current)
Cen
ts P
er K
whr
Non-Energy Costs
Energy Through
2000
PUC Ordered Increases

Class Discussion Possibility: Did California’s Retail Price Control Protect Consumers?
People of California paying entire wholesale cost Utilities Virtually Bankrupt; They are not paying this cost State Surplus is Being Spent (For a while, over $50 Million per
day) State revenue bond sale would not avoid, but
would simply delay payments. Failure to Raise Rates Simply Hides Costs
Higher retail prices provides incentives to reduce demand Higher retail prices can increase supply
Utilities collect more revenues and pay suppliers QFs could be fully paid and all can come back on line
Demand decreases and supply increases beneficial to consumers Reduce wholesale price Avoid rolling blackouts (shortages)
California Electricity
Opportunity turned into Risk
Risk turned into Challenge
Challenge turned into Crisis
Crisis turned into Blight
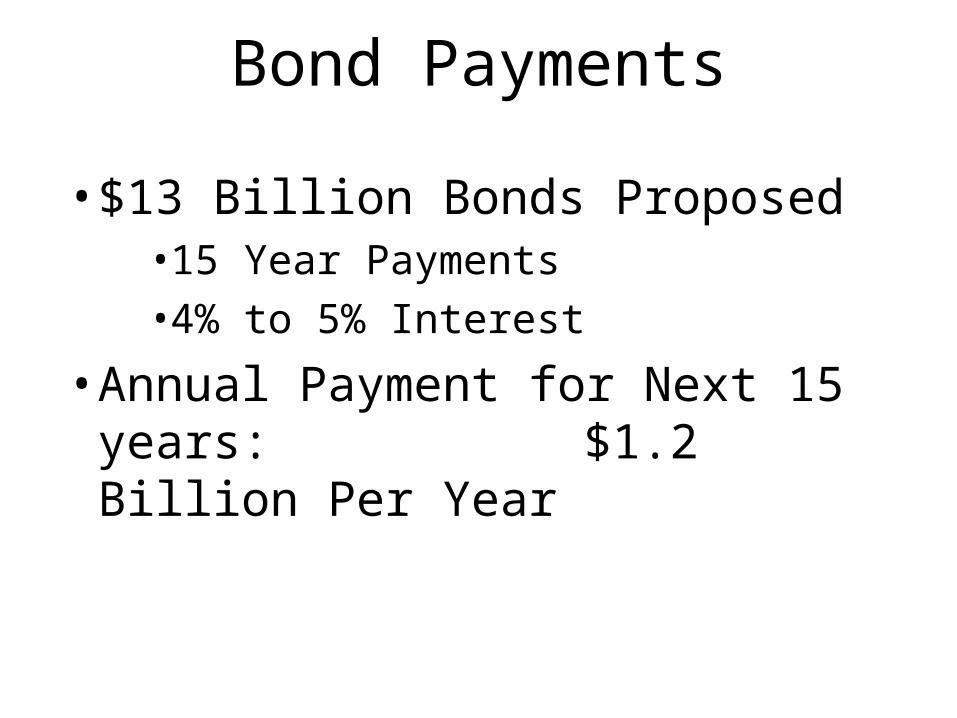
Bond Payments
• $13 Billion Bonds Proposed• 15 Year Payments
• 4% to 5% Interest
• Annual Payment for Next 15 years:
$1.2 Billion Per Year

Total MW Under Contract
0
1,000
2,000
3,000
4,000
5,000
6,000
7,000
8,000
9,000
Jan-01 Jan-02 Jan-03 Jan-04 Jan-05 Jan-06 Jan-07 Jan-08 Jan-09 Jan-10 Jan-11
Me
ga
wa
tts
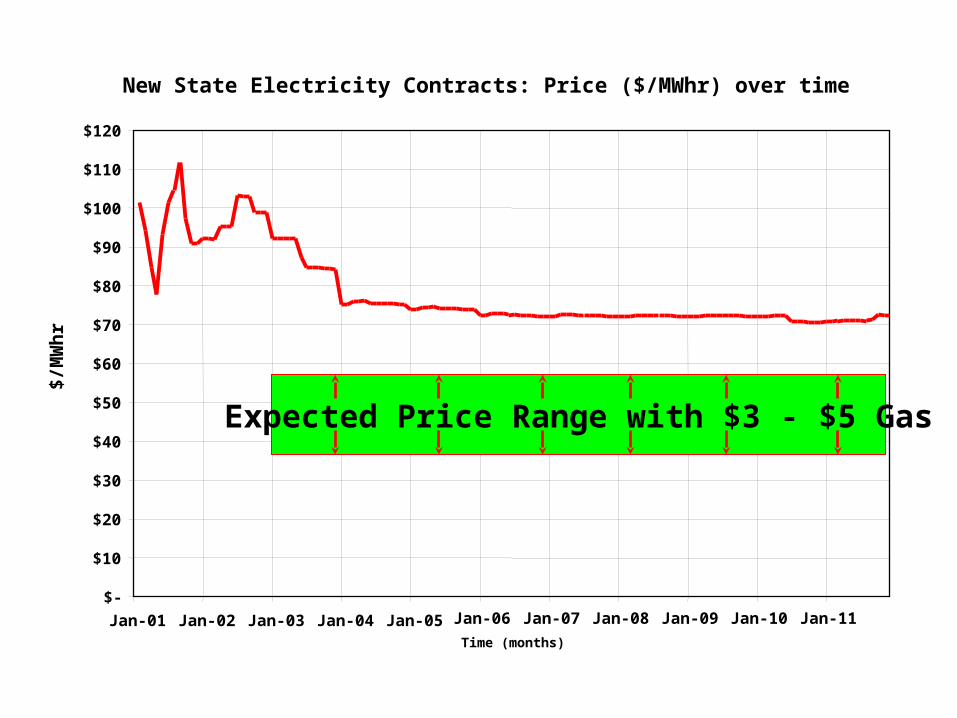
New State Electricity Contracts: Price ($/MWhr) over time
$-
$10
$20
$30
$40
$50
$60
$70
$80
$90
$100
$110
$120
Jan-01 Jan-02 Jan-03 Jan-04 Jan-05 Jan-06 Jan-07 Jan-08 Jan-09 Jan-10 Jan-11
Time (months)
$/M
Wh
r
Expected Price Range with $3 - $5 Gas

Annual Rate of Expenditures
$-
$1.0
$2.0
$3.0
$4.0
$5.0
$6.0
Jan-01 Jan-02 Jan-03 Jan-04 Jan-05 Jan-06 Jan-07 Jan-08 Jan-09 Jan-10 Jan-11
Bill
ion
s o
f D
olla
rs P
er Y
ear
State Actions to Watch
• Buy transmission assets from utilities ?
• State Power Authority ?
• Acquire generating assets by eminent domain ?
• Elimination of Direct Access ?
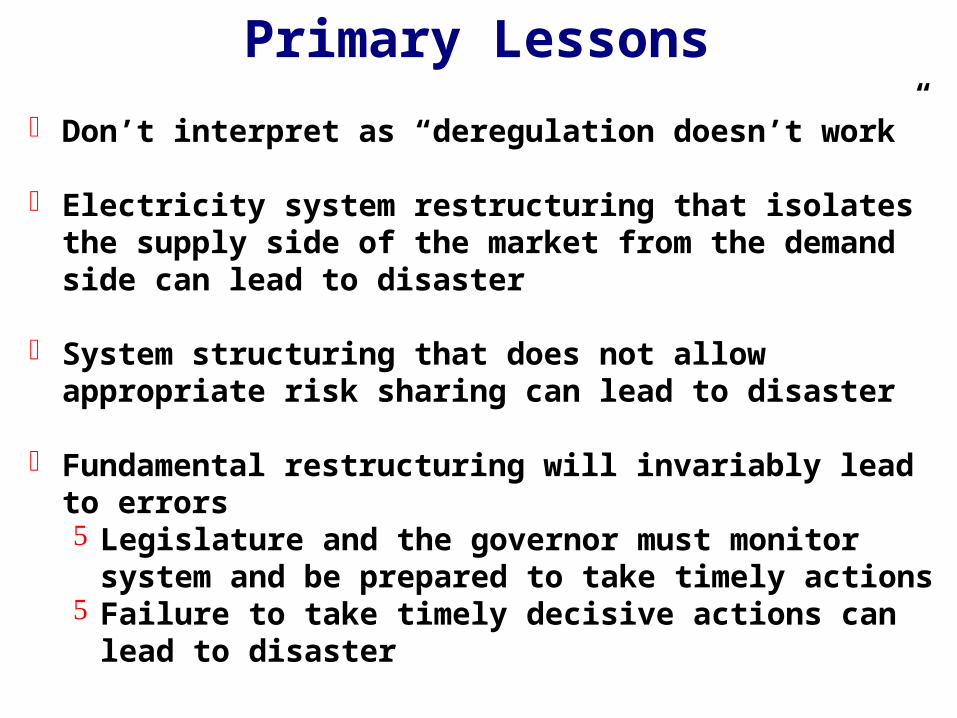
Primary Lessons
Don’t interpret as “deregulation doesn’t work”
Electricity system restructuring that isolates the supply side of the market from the demand side can lead to disaster
System structuring that does not allow appropriate risk sharing can lead to disaster
Fundamental restructuring will invariably lead to errors Legislature and the governor must monitor system and
be prepared to take timely actions Failure to take timely decisive actions can lead to
disaster
Some Solutions

Energy Demand Reduction Measures
Retail Price Increases Time-of-Use Metering Legislation to require companies to reduce
use Incentives to replace inefficient
refrigerators and other appliances Subsidies on compact fluorescent lights Public Energy Efficiency Investment
LEDs in Traffic Lights Other Energy efficiency initiatives

Reductions In Use, 2001 Vs 2000
0%
1%
2%
3%
4%
5%
6%
7%
8%
9%
10%
PeakMWhr
Source: California Energy Commission

Real Time Pricing
Current system provides no incentive to move electricity loads from peak time to off peak time
Time of Use Pricing, particularly real time pricing will provide that incentive
California Legislature is providing for time of use pricing for large commercial users How effective will this be in reducing peak
demands? Experience by other utilities, e.g. Puget
Sound Public Utility District Experience in other countries, e.g. France

Two Part Real Time Pricing
-$1,000
-$500
$0
$500
$1,000
$1,500
$2,000
$2,500
$3,000
0 2000 4000 6000 8000 10000 12000
Purchases of Electricity
Paym
ent b
y U
ser
Historical at $0.10 RPT at $1.00 RTP at $0.05
Historical Purchases

FERC Actions
• Bid Price Caps Initially Set During Stage 1, 2, or 3 Emergency Based on Index of Natural Gas Prices
–Requirements to Bid
–Market Clearing Price (MCP) Set by Highest Accepted Bid
–Cost-Based Payments at Higher than MCP
• Last FERC Order
–Keeps Bid Caps during Alerts
–Adds Price Cap for all other times at 85% of MCP
–Extends Controls to entire region, based primarily on California conditions
• Settlement Hearings for past wholesale prices
–“Fair and Reasonable” Standard
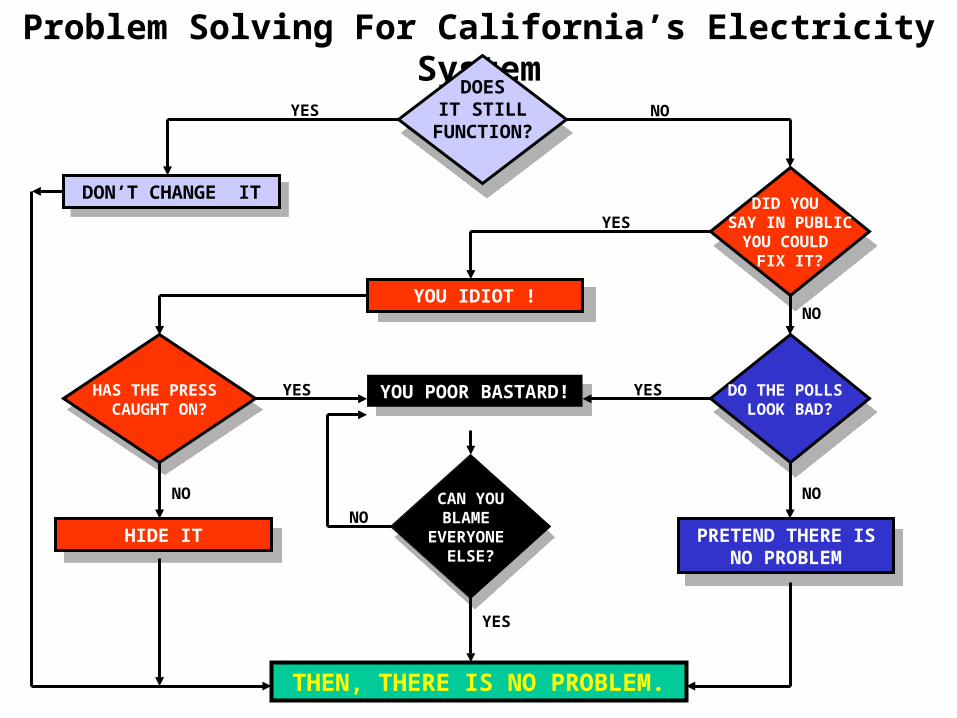
Problem Solving For California’s Electricity System
DON’T CHANGE ITDON’T CHANGE ITDID YOU
SAY IN PUBLICYOU COULD
FIX IT?
DID YOU SAY IN PUBLICYOU COULD
FIX IT?
DOES IT STILL
FUNCTION?
DOES IT STILL
FUNCTION?YES NO
YES
YOU IDIOT !YOU IDIOT !NO
DO THE POLLS LOOK BAD?
DO THE POLLS LOOK BAD?
NO
PRETEND THERE IS NO PROBLEM
PRETEND THERE IS NO PROBLEM
HAS THE PRESS CAUGHT ON?
HAS THE PRESS CAUGHT ON? YOU POOR
BASTARD!
YOU POOR BASTARD!
YESYES
NO
HIDE ITHIDE IT
CAN YOUBLAME
EVERYONE ELSE?
CAN YOUBLAME
EVERYONE ELSE?
NO
THEN, THERE IS NO PROBLEM.
YES