california ed diversion project appendix july 2009
TRANSCRIPT
California
ED Diversion Project
Appendix
July 2009
Prepared for California HealthCare Foundation
by The Abaris Group abarisgroup.com

California ED Diversion Project Study – Appendix
1 | Supported by the California HealthCare Foundation, based in Oakland, California.
Table of ContentsTable of ContentsTable of ContentsTable of Contents
About CHCF and The Abaris Group _____________________________________________________ 2
Advisory Group______________________________________________________________________ 4
Summit & Didactic Speakers___________________________________________________________ 5
Site Visit Participants _________________________________________________________________ 6
Scoring Tool for Initial Site Collaborative Nomination_______________________________________ 7
California ED Diversion Project Participants by Region ______________________________________ 8
Map of Participants __________________________________________________________________ 9
EMSA Commitment Letter to Collaborative ______________________________________________ 10
Hospital Commitment Letter to Collaborative _____________________________________________11
Demographics of Collaborative Participants_______________________________________________13
Diversion Hour Trends by Participant___________________________________________________ 14
Table of KPIs and Definitions __________________________________________________________21
Regional Diversion Policy Table________________________________________________________ 28
Best Practice Initiatives ______________________________________________________________ 30
Specific Collaborative Evaluation Comments _____________________________________________ 43

California ED Diversion Project Study – Appendix
2 | Supported by the California HealthCare Foundation, based in Oakland, California.
About CAbout CAbout CAbout CHCF HCF HCF HCF and and and and The Abaris GroupThe Abaris GroupThe Abaris GroupThe Abaris Group
The California HealthCare Foundation (CHCF)The California HealthCare Foundation (CHCF)The California HealthCare Foundation (CHCF)The California HealthCare Foundation (CHCF) The CHCF mission statement is: to expand access to affordable, quality health care for underserved individuals and communities and to promote fundamental improvements in the health status of the people of California. CHCF is an independent philanthropy committed to improving the way health care is delivered and financed in California. By promoting innovations in care and broader access to information, their goal is to ensure that all Californians can get the care they need, when they need it, at a price they can afford. CHCF commissions research and analysis; publishes and disseminates information; convenes meetings of key health care groups; and funds development of programs and models aimed at improving health care in California. We are grateful to the CHCF for its support and to Dave O’Neil, JD, MPH and his team for their assistance in this project and the advisory committee members. The AbaThe AbaThe AbaThe Abaris Groupris Groupris Groupris Group The Abaris Group is a consulting firm that specializes in emergency, inpatient and outpatient services. The firm provides clients with assistance on a wide range of topics including strategic planning, operational improvement, and financial enhancement to help them achieve their goals. Project Faculty Mike Williams, MPA/HSA – Project Director and President of The Abaris Group Mike has personally managed greater than 100 ED projects requiring a review of operations and finances to strengthen program delivery and the overall financial viability of emergency services. Mr. Williams’ consulting experience with EDs and freestanding ambulatory care clinics is extensive. His work has involved significant research as well as the planning and implementation of ED reengineering plans. Recent accomplishments include projects that involved the study, design and process reengineering through Urgent Matters (urgentmatters.com), which was a ten hospital national collaborative funded by the Robert Woods Johnson Foundation. He is the author of many papers on ED organization and design, on the editorial board for The ED Manager, faculty at Harvard’s Graduate School of Design for the course “The Future Design of EDs” and a frequent contributor to The Advisory Board. Pamela J. Turner, RN, MBA/HCM – The Abaris Group, Senior Consultant Pam has over 20 years of extensive experience in the emergency medicine field. She has spent most of her professional career in emergency services. Through her leadership, Pam has developed delivery systems providing outstanding customer service, using innovative approaches in emergency care. Pam helped in the design and development of a 54 bed Emergency Critical Care Center. She was instrumental in successful design and implementation of a Rapid Treatment Center (which won the national EmCare Genesis Award in 2004 as a best practice to ED throughput and improving patient satisfaction), Transitional Unit, Clinical Decision Unit, Operational Center and setting up an ED Information System. Pam was integral in moving her community to a no divert county. Pam has aided several hospitals, EDs and outpatient clinics in operational and design projects. Pam completed her nursing degree from St. Mary’s College, Omaha, NE and her Master’s of Business Administration from the University of Phoenix.
California ED Diversion Project Study – Appendix
3 | Supported by the California HealthCare Foundation, based in Oakland, California.
Maggie A. Borders, RN, MHA - The Abaris Group, Senior Consultant Maggie has over a decade of leadership experience in the ED and pre-hospital (rotor-wing air medical) setting. She has led many process improvement initiatives throughout the hospital, successfully engineering numerous best practices such as the Capacity Command Center, Admission/Discharge/Transfer (ADT) Unit, Fast Track Program, and Clinical Decision Unit. A well-rounded speaker, some of her recent presentations include “Operation PULL: Pulling Together for Excellence” (Urgent Matters); “Determining Financial Feasibility of a Clinical Decision Unit in a Crowded Level I Trauma Center”; “Implementing Cutting Edge Communications Technology in the ED”; and “Revenue Opportunities in the Emergency Department”. She is an Alumni Board Member and is a part-time faculty member at the University of Kentucky Martin School of Public Policy and Administration. Maggie’s publications include emergency care topics by the Journal of Emergency Nursing, Mosby’s Emergency Nursing Reference, and an IT study published by the CHCF. Bill Bullard – The Abaris Group Senior Consultant Bill has 20 years of experience in emergency services including both public and private agencies. His experience ranges from system analysis and strategic planning to proposal development and innovative contracting with EMS providers, hospitals, and health plans throughout Northern California. Bill has spoken nationally on ambulance transportation, contracting and multi-system hospital models. With The Abaris Group, Bill has conducted a number of strategic EMS and hospital studies which included proposal development. He is the co-author of the publication The Ambulance Industry Report (The Abaris Group, May 2005), which involved extensive reimbursement research and trending. Bill obtained his Bachelor of Science in Management with a concentration in Marketing from Rensselaer Polytechnic Institute (RPI) in 1990. Juliana Boyle, MBA – The Abaris Group, Economist Juliana has worked as a consultant/economist for The Abaris Group for over thirteen years. She works on various community-wide and emergency medical service projects, specifically analyzing relevant health care data and making recommendations based on these findings. Juliana has a Bachelor's of Arts in Economics from the University of New Mexico and a Master's in Business Administration from Saint Mary's College of California. Kathleen Hurley, BA – The Abaris Group, Research Analyst Kathleen Hurley is a research analyst at The Abaris Group. She has worked with The Abaris Group on a variety of projects relating to emergency healthcare. She received a BA in both Economics and Asian Studies at Lehigh University.

California ED Diversion Project Study – Appendix
4 | Supported by the California HealthCare Foundation, based in Oakland, California.
Advisory GroupAdvisory GroupAdvisory GroupAdvisory Group
The project was overseen by an advisory group of industry and association leaders at the local and state levels. The multidisciplinary advisory group provided advice and guidance to the project and met periodically throughout the project. The following table is the advisory group membership.
MemberMemberMemberMember TitleTitleTitleTitle OrganizationOrganizationOrganizationOrganization
Ken Cohen Director San Joaquin County Health Care
Services Agency
Brent Eastman, MD Chief Medical Officer Scripps Health
Mark Gambel Regional Vice President, Los
Angeles
Hospital Association of Southern
California
Jay Goldman, MD National Medical Director,
Ambulance Services/EMS
Kaiser Permanente
Bruce Lee EMS Administrator Santa Clara County EMSA
Ronet Lev, MD ED Physician, Chair EMOC San Diego County
Frank Mass, RN ED Director Little Company of Mary Hospital
Donna Matney, RN Assistant Director of Nursing Santa Clara Valley Medical Center
Erica Murray Senior Policy and Program
Associate
California Association of Public
Hospitals & California Health Care
Safety Net Institute
Jan Ogar, RN Clinical Coordinator San Mateo County EMSA
Debby Rogers Vice President, Quality and
Patient Safety
California Hospital Association
Bonnie Sinz EMS Section Chief California EMSA
Mike Wall President Northridge Hospital Medical Center
Judith Yates Vice President/COO Hospital Council of San Diego and
Imperial Counties
Advisory Group MembershipAdvisory Group MembershipAdvisory Group MembershipAdvisory Group Membership

California ED Diversion Project Study – Appendix
5 | Supported by the California HealthCare Foundation, based in Oakland, California.
Summit Summit Summit Summit & Didactic & Didactic & Didactic & Didactic SpeakersSpeakersSpeakersSpeakers
We like to recognize the many expert speakers who provided subject matter to the participants throughout the project during the summits and didactic calls:
PresenterPresenterPresenterPresenter OrganizationOrganizationOrganizationOrganization
Art Lathrop Contra Costa EMSA - EMS Administrator
Asa (Peter) Viccellio, MD, FACEP SUNY at Stony Brook Department of Emergency Medicine - Vice
Chair
Bruce Siegel, MD, MPH George Washington University
Bryan Cleaver Coastal Valley EMSA - Interim EMS Administrator
Dan Lynch Central California EMSA - EMS Administrator
David Hnatow, MD, FAAEM,
FACEP, FACFEI
South Texas Poison Center, University of Texas Health Science Center
at San Antonio - Associate Professor & Chief of Emergency Medicine
University Hospital Emergency Center - Medical Director
Kathy Kopka, RN, BS Senior Consultant, The Abaris Group
Kent Lawson IDEO - Health Practice Lead in Business & Relationship
Kirk Jensen, MD, MBA, FACEP BestPractices - Chief Medical Officer
IHI - Chair for Improving Flow Through Acute Care Settings
IHI - Chair for Operational Clinical Improvement in the Emergency
Department
Martin Buser, MD
Roger A. Heroux, PhD
Hospitalist Management� Resources
Shari Welch, MD LDS Hospital - Quality Improvement Director
Summit & Didactic SpeakersSummit & Didactic SpeakersSummit & Didactic SpeakersSummit & Didactic Speakers

California ED Diversion Project Study – Appendix
6 | Supported by the California HealthCare Foundation, based in Oakland, California.
Site Visit ParticipantsSite Visit ParticipantsSite Visit ParticipantsSite Visit Participants
Below is a table listing the participants in the initial round of site visits for the collaborative.
EMSA Region/HospitalEMSA Region/HospitalEMSA Region/HospitalEMSA Region/Hospital LocationLocationLocationLocation
Contra CostaContra CostaContra CostaContra Costa Martinez
John Muir - WC Walnut Creek
John Muir - Concord Concord
Sutter - Delta Antioch
Inland CountiesInland CountiesInland CountiesInland Counties San Bernadino
Loma Linda University Medical Center Loma Linda
Arrowhead Regional Medical Center Colton
Los AngelesLos AngelesLos AngelesLos Angeles Commerce
Methodist Hospital Arcadia
Beverly Community Hospital Montebello
Presbyterian Intercommunity Hospital Whittier
Santa ClaraSanta ClaraSanta ClaraSanta Clara San Jose
Regional Medical Center San Jose
Stanford Hospitals and Clinics Stanford
Santa Clara Valley Medical Center San Jose
Santa CruzSanta CruzSanta CruzSanta Cruz Santa Cruz
Dominican Hospital Santa Cruz
Watsonville Community Hospital Watsonville
San DiegoSan DiegoSan DiegoSan Diego San Diego
Sharp Chula Vista Chula Vista
Kaiser Permanente San Diego
Palomar Medical Center Escondido
San JoaquinSan JoaquinSan JoaquinSan Joaquin French Camp
St. Joseph's Medical Center Stockton
Sutter Tracy Community Hospital Tracy
San Joaquin General Hospital French Camp
VenturaVenturaVenturaVentura Oxnard
Los Robles Hospital and Medical Center Thousand Oaks
Saint John's Medical Center Oxnard
Simi Valley Hospital Simi ValleyVentura County Medical Center Ventura
California ED Diversion ProjectCalifornia ED Diversion ProjectCalifornia ED Diversion ProjectCalifornia ED Diversion Project
EMSA and Hospital Site Visit ParticipantsEMSA and Hospital Site Visit ParticipantsEMSA and Hospital Site Visit ParticipantsEMSA and Hospital Site Visit Participants

California ED Diversion Project Study – Appendix
7 | Supported by the California HealthCare Foundation, based in Oakland, California.
Scoring Tool for Initial Site Collaborative Nomination Scoring Tool for Initial Site Collaborative Nomination Scoring Tool for Initial Site Collaborative Nomination Scoring Tool for Initial Site Collaborative Nomination
The regions highlighted in yellow are the proposed nominated regions for Phase II - Note: Ventura County with the highest hours has the most to gain and is currently assessing their hospital interest and may require a score change.
Co
ntr
a C
ost
aC
on
tra
Co
sta
Co
ntr
a C
ost
aC
on
tra
Co
sta
San
ta C
lara
San
ta C
lara
San
ta C
lara
San
ta C
lara
San
ta C
ruz
San
ta C
ruz
San
ta C
ruz
San
ta C
ruz
Inla
nd
Co
un
ties
Inla
nd
Co
un
ties
Inla
nd
Co
un
ties
Inla
nd
Co
un
ties
Los
An
gel
esLo
s A
ng
eles
Los
An
gel
esLo
s A
ng
eles
San
Jo
aq
uin
San
Jo
aq
uin
San
Jo
aq
uin
San
Jo
aq
uin
Sac
ram
ento
Sac
ram
ento
Sac
ram
ento
Sac
ram
ento
Ven
tura
Ven
tura
Ven
tura
Ven
tura
San
Die
go
San
Die
go
San
Die
go
San
Die
go
2006 Population 1,029,377 1,773,258 262,351 2,023,941 10,245,572 666,265 1,385,607 817,346 3,066,820
Number of EDs 8 10 2 20 70 7 9 8 18
2006 Total Diversion Hours 1,674 2,546 686 22,318 102,609 196 6,644 10,836 21,771
Diversion Hours per ED Bed 9 11 19 69 72 3 39 101 54
Percent of Time on Diversion 2.4% 2.9% 3.9% 12.7% 16.7% 0.3% 8.4% 15.5% 13.8%
Past Success 4 4 3 4 4 3 1 4
Future Success 4 4 3 2 4 3 4 1
Current LEMSA Monitoring 4 3 4 4 2 2 1 2
LEMSA Commitment 4 4 4 4 3 1 4 1
Hospital Commitment 4 4 4 4 4 4 2 4
Oversight/Accountability 3 3 3 3 2 2 1 2
Phase III LEMSA Potential for Success 4 4 4 4 4 4 5 1
Phase III Hospital Potential for Success 4 4 4 4 4 4 4 3
Total ScoreTotal ScoreTotal ScoreTotal Score 31313131 30303030 29292929 29292929 27272727 23232323 22222222 18181818No
t ap
plic
able
- b
est
pra
ctic
e
California ED Diversion ProjectCalifornia ED Diversion ProjectCalifornia ED Diversion ProjectCalifornia ED Diversion Project
EMS Region Key Attributes ComparisonEMS Region Key Attributes ComparisonEMS Region Key Attributes ComparisonEMS Region Key Attributes Comparison
Note: The ultimate nominations were adjusted based on Advisory Group input to replace Santa Cruz County which has low diversion hours with Ventura County, which has high diversion hours.

California ED Diversion Project Study – Appendix
8 | Supported by the California HealthCare Foundation, based in Oakland, California.
California ED Diversion Project Participants by RegionCalifornia ED Diversion Project Participants by RegionCalifornia ED Diversion Project Participants by RegionCalifornia ED Diversion Project Participants by Region
The lists the EMSAs and hospitals that participated in the collaborative.
EMS Regions/HospitalsEMS Regions/HospitalsEMS Regions/HospitalsEMS Regions/Hospitals CityCityCityCity
LA County EMSA Commerce
St. Francis Medical Center Lynwood
Presbyterian Intercommunity Hospital Whittier
Methodist Hospital, Arcadia Arcadia
San Bernadino County ICEMA San Bernadino
Arrowhead Regional Medical Center Colton
Loma Linda University Medical Center Loma Linda
St. Mary Medical Center Apple Valley
Santa Clara County EMSA San Jose
Regional Medical Center of San Jose San Jose
Ventura County EMSA Oxnard
Community Memorial Hospital Ventura
Simi Valley Hospital Simi Valley
St. John's Regional Medical Center OxnardVentura County Medical Center Ventura
California ED Diversion ProjectCalifornia ED Diversion ProjectCalifornia ED Diversion ProjectCalifornia ED Diversion Project
Participants by RegionParticipants by RegionParticipants by RegionParticipants by Region

California ED Diversion Project Study – Appendix
9 | Supported by the California HealthCare Foundation, based in Oakland, California.
Map Map Map Map of Participantsof Participantsof Participantsof Participants

California ED Diversion Project Study – Appendix
10 | Supported by the California HealthCare Foundation, based in Oakland, California.
EMSA Commitment LetteEMSA Commitment LetteEMSA Commitment LetteEMSA Commitment Letter to Collaborativer to Collaborativer to Collaborativer to Collaborative
The following letter was signed by the EMS Administrator at each of the participating EMSAs.
August 2, 2007
Virginia Hastings, EMS Administrator ICEMA EMS Agency 515 N. Arrowhead San Bernardino, CA 92415 Dear Virginia: The California ED Diversion Project is a project being conducted by The Abaris Group and supported by the California HealthCare Foundation, based in Oakland, California. The project’s goal is to measure and publicly report the extent of ambulance diversion by emergency medical services (EMS) area and hospital, identify best practices to minimize diversion, and help to implement best practices in less successful communities. Your county and a sample of its hospitals have been chosen to participate in the third collaborative phase of the project. The collaborative phase will allow you to set goals on capacity building and diversion reduction strategies, which will be supported by a national panel of faculty experts who will coach your staff through the necessary change processes. Only four regions have been chosen for this important project and the in-kind technical assistance that will be provided to all participants. The Abaris Group has listed some of the benefits and commitments being asked of the EMS agencies that have been selected to participate: EMSA Obligation: � Nominate hospitals proposed to be involved � Attend each of the three summits (first is scheduled for August 21, 2007 in Los Angeles) � Provide a lead staff person to coordinate meetings and county activities � Assist with communicating with the hospital and their EMS providers � Establish a EMS/ED Diversion Task Force to look at diversion trends, revise the regional policy, set goals and monitor
regional progress � Provide biweekly regional data reports on the project web site for the project The project website is: www.caeddiversion.com. Thank you for your willingness to participate on this project. Your signature below assures your participation in the program. Please call me with any questions about this project and your participation. Sincerely, Mike Williams President
EMSA EMSA EMSA EMSA Commitment to the California ED Diversion ProjectCommitment to the California ED Diversion ProjectCommitment to the California ED Diversion ProjectCommitment to the California ED Diversion Project I, Virginia Hastings agree to the provisions provided in the commitment letter dated August 2, 2007. _____________________________________ ________________________________ Virginia Hastings Date EMS Administrator ICEMA EMS Agency

California ED Diversion Project Study – Appendix
11 | Supported by the California HealthCare Foundation, based in Oakland, California.
Hospital Hospital Hospital Hospital Commitment Letter to CollaborativeCommitment Letter to CollaborativeCommitment Letter to CollaborativeCommitment Letter to Collaborative
The following letter was signed by the chief executive officer at each of the participating hospitals.
August 2, 2007
Gerald Kozai, CEO St. Francis Medical Center 3630 East Imperial Highway Lynwood, CA 90262 Dear Mr. Kozai: The California ED Diversion Project is a project being conducted by The Abaris Group and supported by the California HealthCare Foundation, based in Oakland, California. The project’s goal is to measure and publicly report the extent of ambulance diversion by emergency medical services (EMS) area and hospital, identify best practices to minimize diversion, and help to implement best practices in less successful communities. Your hospital has been chosen to participate in the third collaborative phase of the project. The collaborative phase will allow you to set goals on capacity building and diversion reduction strategies, which will be supported by a national panel of faculty experts who will coach your staff through the necessary change processes. Only four regions have been chosen for this important project and the in-kind technical assistance that will be provided to all participants. The Abaris Group has listed some of the benefits and commitments being asked of the hospitals that have been selected to participate: Hospital Benefits: � One of only a few selected hospitals throughout the state to receive this in-kind mentoring/consulting service � Receive initial detailed and hospital customized assessment of key steps and interventions to improve ED and hospital
capacity and to reduce diversion � Invitation to three project “summits” with national experts on ED and hospital throughput strategies and detailed
accelerated methods to implement and sustain successful changes throughout the hospital � Access to a password protected web site with 60 plus advanced best practices designed to dramatically improve
capacity and reduce diversion hours � Monthly mentoring and bimonthly didactic education conference calls from nationally recognized speakers � Quarterly sites visits by expert faculty � Project mentoring/consulting will come from a national expert faculty � Hospital will be recognized and identified as a “best practice” participant upon the successful conclusion of the project. � In-kind resources provided by the Foundation are estimated to be approximately $100,000 per hospital Hospital Obligations: � Agree in writing to participate at the executive, medical staff leadership, department manager and staff involvement � Commitment to participate for one year (52 weeks) � Attendance at the three summits and monthly conference calls � Identification of a hospital “project champion” � Identification of an “executive sponsor”, which is a senior manager that will report to the CEO who agrees to clear
roadblocks and support the champion � Establishment of a number of ED and inpatient teams (determined by the hospital) to develop a plan and implement
changes on throughput and capacity (typically 3 to 6 members per team with biweekly meetings) � Allow the executive sponsor and champion to make periodic presentations to senior management and their governing
board on project goals, accomplishments and on their KPI targets as defined by the hospital � Access to hospital QI and data analysts to support the hospital’s involvement in the project. � Biweekly web based reporting on project progress and with data on key performance indicators (KPIs) � Access to project steering group quarterly to report on progress and to receive input from expert faculty � Work with the local EMS agency on developing and implementing regional EMS diversion saturation and standardized
ED diversion policies The project website is: www.caeddiversion.com.
California ED Diversion Project Study – Appendix
12 | Supported by the California HealthCare Foundation, based in Oakland, California.
Thank you for your willingness to participate on this project. Your signature below assures your participation in the program. Please call me with any questions about this project and your participation. Sincerely, Mike Williams President
Hospital Hospital Hospital Hospital Commitment to the California ED Diversion ProjectCommitment to the California ED Diversion ProjectCommitment to the California ED Diversion ProjectCommitment to the California ED Diversion Project I, Gerald Kozai agree to the provisions provided in the commitment letter dated August 2, 2007. _____________________________________ ________________________________ Gerald Kozai, CEO Date St. Francis Medical Center

California ED Diversion Project Study – Appendix
13 | Supported by the California HealthCare Foundation, based in Oakland, California.
Demographics of Collaborative Demographics of Collaborative Demographics of Collaborative Demographics of Collaborative ParticipantsParticipantsParticipantsParticipants
HospitalHospitalHospitalHospital LocationLocationLocationLocation System AffiliationSystem AffiliationSystem AffiliationSystem Affiliation
Licensed Bed Licensed Bed Licensed Bed Licensed Bed
CapacityCapacityCapacityCapacity OccupancyOccupancyOccupancyOccupancy MedicareMedicareMedicareMedicare Medi-CalMedi-CalMedi-CalMedi-Cal
County County County County
IndigentIndigentIndigentIndigent
Other Third Other Third Other Third Other Third
PartyPartyPartyParty OtherOtherOtherOther
Los Angeles County EMSALos Angeles County EMSALos Angeles County EMSALos Angeles County EMSA
Methodist Hospital Southern California300 West Huntington Drive
Arcadia, CA 91007n/a
434 50.9% 38.0% 15.5% 0.0% 39.3% 7.3%
Presbyterian Intercommunity Hospital12401 East Washington Blvd.
Whittier, CA 90602Interhealth Corporation
409 51.5% 37.2% 9.2% 0.0% 48.5% 5.0%
St. Francis Medical Center3630 Imperial Highway
Lynwood, CA 90262
Daughters of Charity
Healthcare Systems 314 79.0% 15.5% 56.6% 2.5% 21.0% 4.4%
San Bernadino County, ICEMASan Bernadino County, ICEMASan Bernadino County, ICEMASan Bernadino County, ICEMA
Arrowhead Regional Medical Center400 North Pepper Avenue
Colton, CA 92324-1801San Bernardino County
283 77.8% 10.7% 42.8% 18.0% 5.5% 22.9%
Loma Linda University Medical Center11234 Anderson Street
Loma Linda, CA 92354
Seventh Day Adventist
Network 709 73.7% 21.5% 28.3% 0.1% 45.9% 4.2%
St. Mary Medical Center18300 Highway 18
Apple Valley, CA 92307St. Joseph Health System
186 70.6% 22.7% 21.4% 0.1% 47.3% 8.6%
Ventura County EMSAVentura County EMSAVentura County EMSAVentura County EMSA
Community Memorial Hospital147 N. Brent Street
Ventura, CA 93003-2854
Community Memorial
Health System 242 61.0% 6.0% 73.6% 0.0% 18.8% 1.6%
Simi Valley Hospital2975 North Sycamore Drive
Simi Valley, CA 93065Adventist Health
109 51.1% 37.0% 11.2% 0.0% 44.7% 7.1%
St. Johns Regional Medical Center1600 North Rose Avenue
Oxnard, CA 93030Catholic Healthcare West
265 68.5% 30.2% 16.9% 0.0% 37.0% 15.9%
Ventura County Medical Center3291 Loma Vista Road
Ventura CA 93003-3099 Ventura County
223 58.1% 8.7% 55.5% 2.0% 19.8% 14.0%
Payer MixPayer MixPayer MixPayer Mix
California ED Diversion ProjectCalifornia ED Diversion ProjectCalifornia ED Diversion ProjectCalifornia ED Diversion Project
EMSA and Hospital Demographic Data, 2006EMSA and Hospital Demographic Data, 2006EMSA and Hospital Demographic Data, 2006EMSA and Hospital Demographic Data, 2006
Source: OSHPD Hospital Utilization and Annual Financial data, 2006
California ED Diversion Project Study – Appendix
14 | Supported by the California HealthCare Foundation, based in Oakland, California.
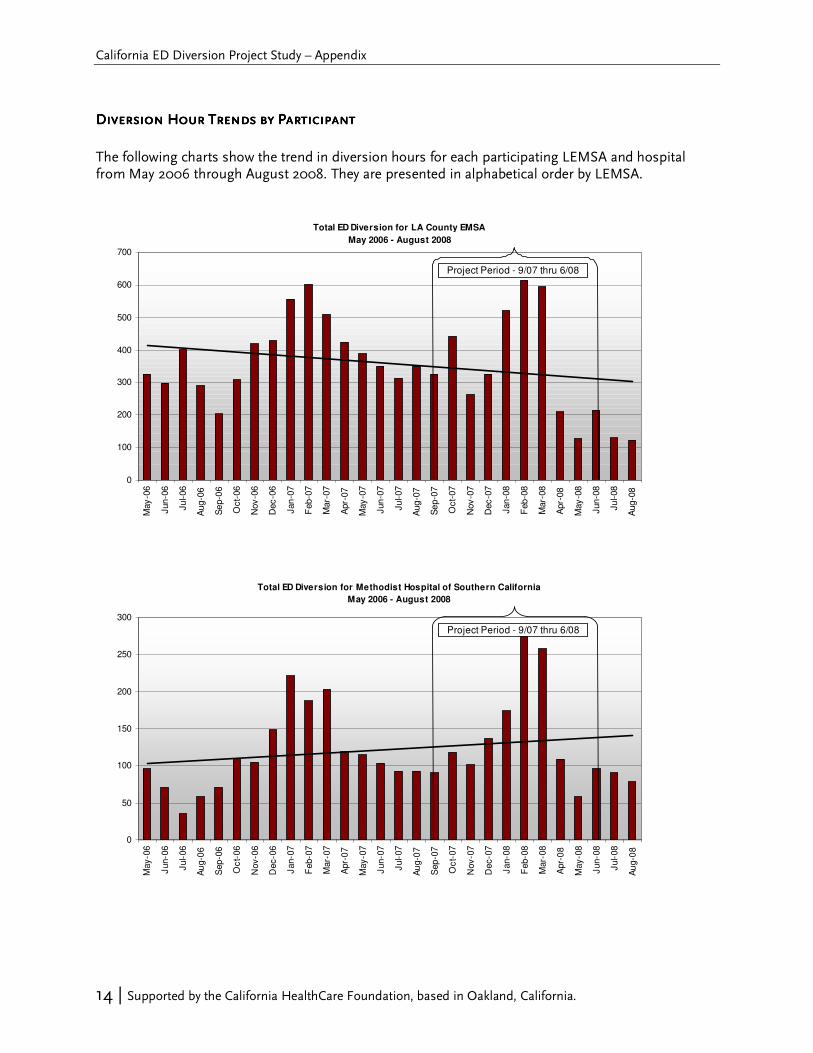
Total ED Diversion for LA County EMSA
May 2006 - August 2008
0
100
200
300
400
500
600
700
May
-06
Jun
-06
Ju
l-06
Aug
-06
Se
p-0
6
Oct-
06
Nov
-06
Dec
-06
Jan
-07
Feb
-07
Mar-
07
Apr-
07
May
-07
Jun
-07
Ju
l-07
Aug
-07
Se
p-0
7
Oct-
07
Nov
-07
Dec
-07
Jan
-08
Feb
-08
Mar-
08
Apr-
08
May
-08
Jun
-08
Ju
l-08
Aug
-08
Project Period - 9/07 thru 6/08
Total ED Diversion for Methodist Hospital of Southern California
May 2006 - August 2008
0
50
100
150
200
250
300
May-0
6
Jun-0
6
Jul-
06
Au
g-0
6
Sep
-06
Oc
t-06
Nov-0
6
Dec-0
6
Jan-0
7
Feb-0
7
Mar-
07
Apr-
07
May-0
7
Jun-0
7
Jul-
07
Au
g-0
7
Sep
-07
Oc
t-07
Nov-0
7
Dec-0
7
Jan-0
8
Feb-0
8
Mar-
08
Apr-
08
May-0
8
Jun-0
8
Jul-
08
Au
g-0
8Project Period - 9/07 thru 6/08
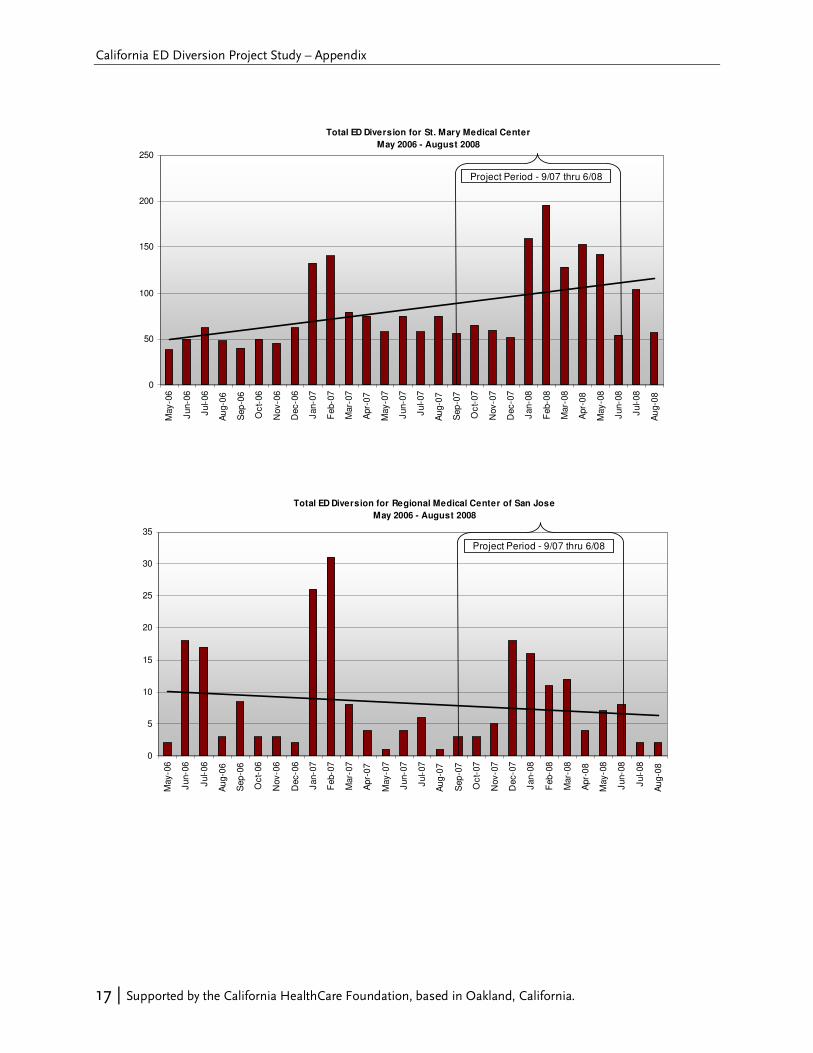
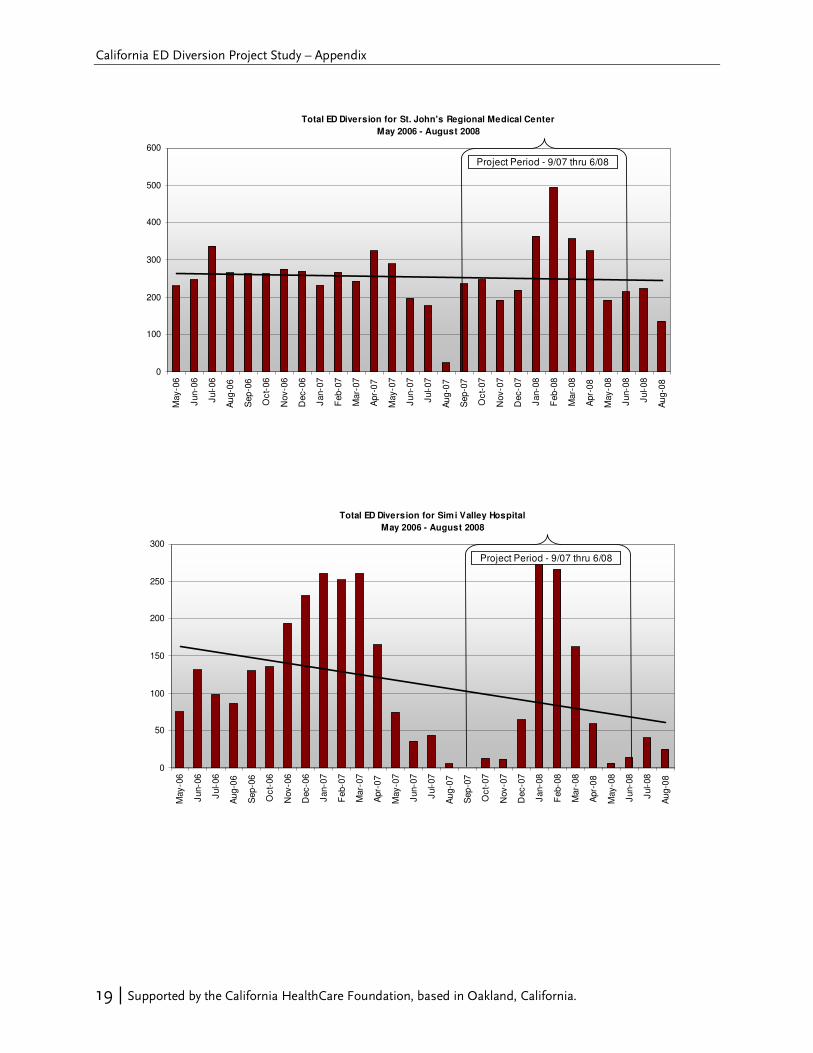
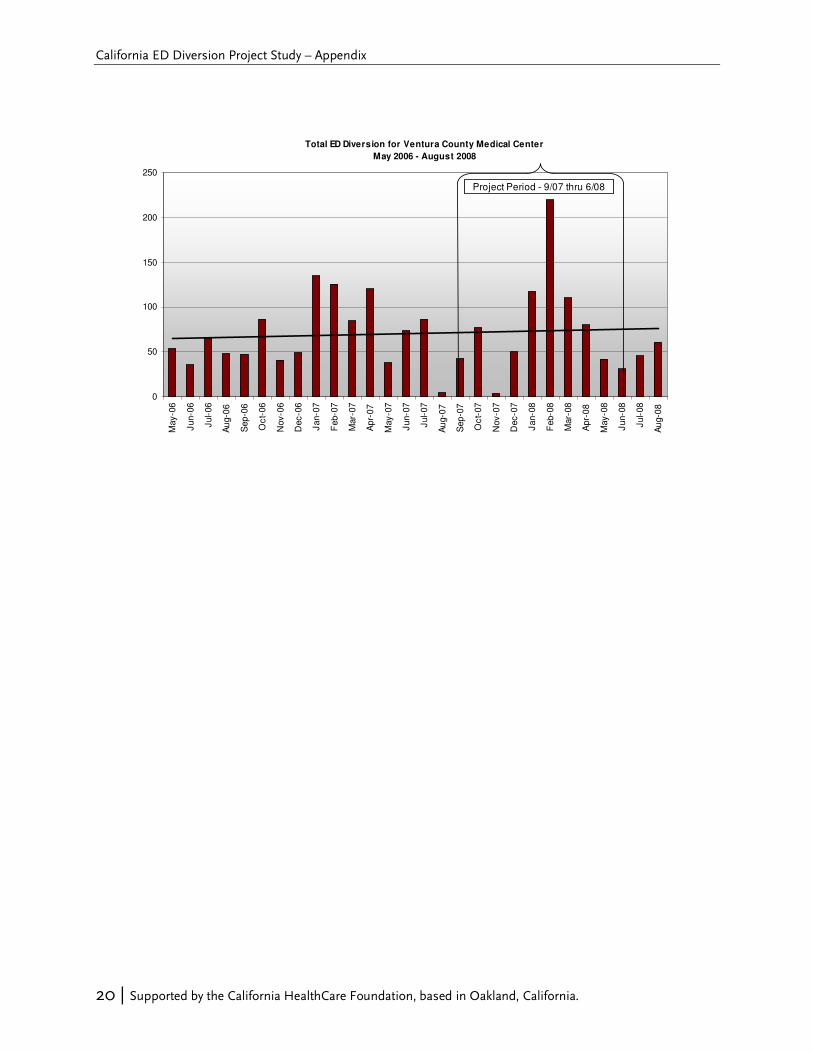
Diversion Diversion Diversion Diversion Hour Hour Hour Hour TrendTrendTrendTrendssss by Participant by Participant by Participant by Participant
The following charts show the trend in diversion hours for each participating LEMSA and hospital from May 2006 through August 2008. They are presented in alphabetical order by LEMSA.

California ED Diversion Project Study – Appendix
15 | Supported by the California HealthCare Foundation, based in Oakland, California.
Total ED Diversion for St. Francis Medical Center
May 2006 - August 2008
0
50
100
150
200
250
300
350M
ay-0
6
Jun-0
6
Jul-
06
Au
g-0
6
Sep
-06
Oc
t-06
Nov-0
6
Dec-0
6
Jan-0
7
Feb-0
7
Mar-
07
Apr-
07
May-0
7
Jun-0
7
Jul-
07
Au
g-0
7
Sep
-07
Oc
t-07
Nov-0
7
Dec-0
7
Jan-0
8
Feb-0
8
Mar-
08
Apr-
08
May-0
8
Jun-0
8
Jul-
08
Au
g-0
8
Project Period - 9/07 thru 6/08
Total ED Diversion for Inland Counties Emergency Medical Agency
May 2006 - August 2008
0
100
200
300
400
500
600
700
800
900
May-0
6
Jun-0
6
Jul-
06
Au
g-0
6
Sep
-06
Oc
t-06
Nov-0
6
Dec-0
6
Jan-0
7
Feb-0
7
Mar-
07
Apr-
07
May-0
7
Jun-0
7
Jul-
07
Au
g-0
7
Sep
-07
Oc
t-07
Nov-0
7
Dec-0
7
Jan-0
8
Feb-0
8
Mar-
08
Apr-
08
May-0
8
Jun-0
8
Jul-
08
Au
g-0
8
Project Period - 9/07 thru 6/08

California ED Diversion Project Study – Appendix
16 | Supported by the California HealthCare Foundation, based in Oakland, California.
Total ED Diversion for Arrow head Regional Medical Center
May 2006 - August 2008
0
50
100
150
200
250
300
350
May-0
6
Jun-0
6
Jul-
06
Au
g-0
6
Sep
-06
Oc
t-06
Nov-0
6
Dec-0
6
Jan-0
7
Feb-0
7
Mar-
07
Apr-
07
May-0
7
Jun-0
7
Jul-
07
Au
g-0
7
Sep
-07
Oc
t-07
Nov-0
7
Dec-0
7
Jan-0
8
Feb-0
8
Mar-
08
Apr-
08
May-0
8
Jun-0
8
Jul-
08
Au
g-0
8
Project Period - 9/07 thru 6/08
Total ED Diversion for Lom a Linda University Medical Center
May 2006 - August 2008
0
50
100
150
200
250
300
350
400
450
Ma
y-0
6
Ju
n-0
6
Jul-0
6
Au
g-0
6
Sep
-06
Oct-
06
No
v-0
6
De
c-0
6
Ja
n-0
7
Fe
b-0
7
Ma
r-0
7
Ap
r-0
7
Ma
y-0
7
Ju
n-0
7
Jul-0
7
Au
g-0
7
Sep
-07
Oct-
07
No
v-0
7
De
c-0
7
Ja
n-0
8
Fe
b-0
8
Ma
r-0
8
Ap
r-0
8
Ma
y-0
8
Ju
n-0
8
Jul-0
8
Au
g-0
8
Project Period - 9/07 thru 6/08
California ED Diversion Project Study – Appendix
17 | Supported by the California HealthCare Foundation, based in Oakland, California.
Total ED Diversion for St. Mary Medical Center
May 2006 - August 2008
0
50
100
150
200
250
May-0
6
Jun-0
6
Jul-
06
Au
g-0
6
Sep
-06
Oc
t-06
Nov-0
6
Dec-0
6
Jan-0
7
Feb-0
7
Mar-
07
Apr-
07
May-0
7
Jun-0
7
Jul-
07
Au
g-0
7
Sep
-07
Oc
t-07
Nov-0
7
Dec-0
7
Jan-0
8
Feb-0
8
Mar-
08
Apr-
08
May-0
8
Jun-0
8
Jul-
08
Au
g-0
8
Project Period - 9/07 thru 6/08
Total ED Diversion for Regional Medical Center of San Jose
May 2006 - August 2008
0
5
10
15
20
25
30
35
May-0
6
Jun-0
6
Jul-
06
Au
g-0
6
Sep
-06
Oc
t-06
Nov-0
6
Dec-0
6
Jan-0
7
Feb-0
7
Mar-
07
Apr-
07
May-0
7
Jun-0
7
Jul-
07
Au
g-0
7
Sep
-07
Oc
t-07
Nov-0
7
Dec-0
7
Jan-0
8
Feb-0
8
Mar-
08
Apr-
08
May-0
8
Jun-0
8
Jul-
08
Au
g-0
8
Project Period - 9/07 thru 6/08

California ED Diversion Project Study – Appendix
18 | Supported by the California HealthCare Foundation, based in Oakland, California.
Total ED Diversion for Ventura County EMSA
May 2006 - August 2008
0
200
400
600
800
1000
1200
May-0
6
Jun-0
6
Jul-
06
Au
g-0
6
Sep
-06
Oc
t-06
Nov-0
6
Dec-0
6
Jan-0
7
Feb-0
7
Mar-
07
Apr-
07
May-0
7
Jun-0
7
Jul-
07
Au
g-0
7
Sep
-07
Oc
t-07
Nov-0
7
Dec-0
7
Jan-0
8
Feb-0
8
Mar-
08
Apr-
08
May-0
8
Jun-0
8
Jul-
08
Au
g-0
8
Project Period - 9/07 thru 6/08
Total ED Diversion for Community Mem orial Hospital
May 2006 - August 2008
0
20
40
60
80
100
120
May-0
6
Jun-0
6
Jul-
06
Au
g-0
6
Sep
-06
Oc
t-06
Nov-0
6
Dec-0
6
Jan-0
7
Feb-0
7
Mar-
07
Apr-
07
May-0
7
Jun-0
7
Jul-
07
Au
g-0
7
Sep
-07
Oc
t-07
Nov-0
7
Dec-0
7
Jan-0
8
Feb-0
8
Mar-
08
Apr-
08
May-0
8
Jun-0
8
Jul-
08
Au
g-0
8
Project Period - 9/07 thru 6/08
California ED Diversion Project Study – Appendix
19 | Supported by the California HealthCare Foundation, based in Oakland, California.
Total ED Diversion for St. John's Regional Medical Center
May 2006 - August 2008
0
100
200
300
400
500
600
May-0
6
Jun-0
6
Jul-
06
Au
g-0
6
Sep
-06
Oc
t-06
Nov-0
6
Dec-0
6
Jan-0
7
Feb-0
7
Mar-
07
Apr-
07
May-0
7
Jun-0
7
Jul-
07
Au
g-0
7
Sep
-07
Oc
t-07
Nov-0
7
Dec-0
7
Jan-0
8
Feb-0
8
Mar-
08
Apr-
08
May-0
8
Jun-0
8
Jul-
08
Au
g-0
8
Project Period - 9/07 thru 6/08
Total ED Diversion for Simi Valley Hospital
May 2006 - August 2008
0
50
100
150
200
250
300
May-0
6
Jun-0
6
Jul-
06
Au
g-0
6
Sep
-06
Oc
t-06
Nov-0
6
Dec-0
6
Jan-0
7
Feb-0
7
Mar-
07
Apr-
07
May-0
7
Jun-0
7
Jul-
07
Au
g-0
7
Sep
-07
Oc
t-07
Nov-0
7
Dec-0
7
Jan-0
8
Feb-0
8
Mar-
08
Apr-
08
May-0
8
Jun-0
8
Jul-
08
Au
g-0
8
Project Period - 9/07 thru 6/08
California ED Diversion Project Study – Appendix
20 | Supported by the California HealthCare Foundation, based in Oakland, California.
Total ED Diversion for Ventura County Medical Center
May 2006 - August 2008
0
50
100
150
200
250M
ay-0
6
Jun-0
6
Jul-
06
Au
g-0
6
Sep
-06
Oc
t-06
Nov-0
6
Dec-0
6
Jan-0
7
Feb-0
7
Mar-
07
Apr-
07
May-0
7
Jun-0
7
Jul-
07
Au
g-0
7
Sep
-07
Oc
t-07
Nov-0
7
Dec-0
7
Jan-0
8
Feb-0
8
Mar-
08
Apr-
08
May-0
8
Jun-0
8
Jul-
08
Au
g-0
8
Project Period - 9/07 thru 6/08

California ED Diversion Project Study – Appendix
21 | Supported by the California HealthCare Foundation, based in Oakland, California.
Table of KPIs and Table of KPIs and Table of KPIs and Table of KPIs and DefinitionDefinitionDefinitionDefinitionssss
Hospital FactorHospital FactorHospital FactorHospital Factor ReportingReportingReportingReporting
I. ED Patient SatisfactionI. ED Patient SatisfactionI. ED Patient SatisfactionI. ED Patient Satisfaction Monthly
By treatment path: a. Time from arrival to provider
- Admitted b. Time from provider to disposition decision
- Fast Track c. Time from disposition decision to departure from ED
- Other ED Discharged
ReportingReportingReportingReporting
IV. ED ThroughputIV. ED ThroughputIV. ED ThroughputIV. ED Throughput Bi-monthly
Hours on diversion
Number of incomplete treatment
Total boarding hours
ED volume
ED admissions
Total patients diverted
Total off load hours
EMS Agency FactorEMS Agency FactorEMS Agency FactorEMS Agency Factor
VI. DiversionVI. DiversionVI. DiversionVI. Diversion Bi-monthlyTotal diversion hours
Key Performance IndicatorsKey Performance IndicatorsKey Performance IndicatorsKey Performance Indicators
II. Clinical Process II. Clinical Process II. Clinical Process II. Clinical Process (Choose one)(Choose one)(Choose one)(Choose one)
V. Other EDV. Other EDV. Other EDV. Other ED Monthly
Bi-monthly
Total ED throughput time
III. Inpatient FlowIII. Inpatient FlowIII. Inpatient FlowIII. Inpatient Flow Time from inpatient bed assignment to bed placement
Time of discharge (median)
Bed empty to clean availability
Total hospital discharges
Time to pain management
Time to heart treatment
Monthly
IndicatorIndicatorIndicatorIndicator
Site-specific indicators
The following are definitions of the terminology used for the KPIs: Time For most of the measures defined below, the term “time” means the elapsed time (or interval of time) between two discrete events. Clock time (time of day) is used to measure the actual time an event occurs (e.g. the time a patient is discharged). Incomplete Treatment This term was used for any patient that does not complete ED treatment, including left against medical advice (AMA), left without being seen (LWBS), and elopement (was seen by a provider but left prior to completion of treatment). Boarding Hours Boarding for this study was defined as the number of hours where patients are waiting for admission, are boarded or are being held in the ED over the initial first two hours (the first two hours were not counted). Diversion Hours Diversion hours were all hours the hospital was on “ED” divert only, even if they accepted walk-in or ambulance patients. Offload Time/Wall time The time from ambulance arrival to patient transferred to ED gurney. If this was not collected, participants provided time from ED arrival to time the EMSA was back in service.
California ED Diversion Project Study – Appendix
22 | Supported by the California HealthCare Foundation, based in Oakland, California.
Average Unless otherwise indicated, average is the arithmetic mean of a set of data values. For a set of n values {x1, x2, …, xn}, the average (or mean) is computed as (x1 + x2 + … + xn) / n. ED Patient Satisfaction To measure patient satisfaction, each participant hospital used the system already in place. A questionnaire was completed to indicate how each participant hospital currently measured and administered ED patient satisfaction. The required minimum reporting of patient satisfaction was to be measured once before the California ED Diversion Project began and once each quarter after that. Ideally, patient satisfaction would have been measured monthly, including the first month following the conclusion of the California ED Diversion Project.
23 | Supported by the California HealthCare Foundation, based in Oakland, California.
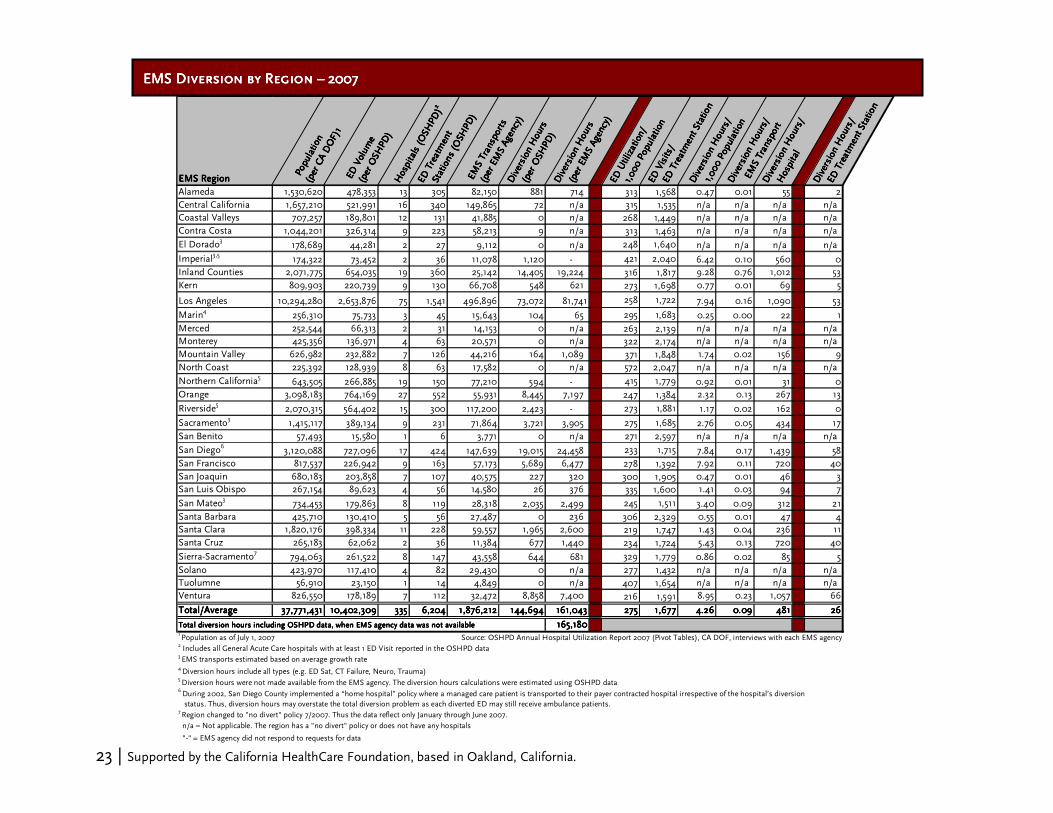
EMS Diversion by Region EMS Diversion by Region EMS Diversion by Region EMS Diversion by Region –––– 2007 2007 2007 2007
EMS RegionEMS RegionEMS RegionEMS Region
Popu
lati
on
Popu
lati
on
Popu
lati
on
Popu
lati
on(p
er C
A D
OF)
1
(per
CA
DO
F)1
(per
CA
DO
F)1
(per
CA
DO
F)1
ED V
olum
e
ED V
olum
e
ED V
olum
e
ED V
olum
e(p
er O
SHPD
)
(per
OSH
PD)
(per
OSH
PD)
(per
OSH
PD)
Hos
pita
ls (
OSH
PD)
Hos
pita
ls (
OSH
PD)
Hos
pita
ls (
OSH
PD)
Hos
pita
ls (
OSH
PD)
2222
ED T
reat
men
t
ED T
reat
men
t
ED T
reat
men
t
ED T
reat
men
t
Stat
ions
(O
SHP
D)
Stat
ions
(O
SHP
D)
Stat
ions
(O
SHP
D)
Stat
ions
(O
SHP
D)
EMS
Tran
spor
ts
EMS
Tran
spor
ts
EMS
Tran
spor
ts
EMS
Tran
spor
ts
(per
EM
S A
genc
y)
(per
EM
S A
genc
y)
(per
EM
S A
genc
y)
(per
EM
S A
genc
y)D
iver
sion
Hou
rs
Div
ersi
on H
ours
Div
ersi
on H
ours
Div
ersi
on H
ours
(per
OSH
PD)
(per
OSH
PD)
(per
OSH
PD)
(per
OSH
PD)
Div
ersi
on H
ours
Div
ersi
on H
ours
Div
ersi
on H
ours
Div
ersi
on H
ours
(per
EM
S A
genc
y)
(per
EM
S A
genc
y)
(per
EM
S A
genc
y)
(per
EM
S A
genc
y)
ED
Util
izat
ion/
ED U
tiliz
atio
n/
ED U
tiliz
atio
n/
ED U
tiliz
atio
n/
1,0
00
Popu
lati
on
1,0
00
Popu
lati
on
1,0
00
Popu
lati
on
1,0
00
Popu
lati
onED
Vis
its/
ED V
isits
/
ED V
isits
/
ED V
isits
/ED
Tre
atm
ent S
tatio
n
ED T
reat
men
t Sta
tion
ED T
reat
men
t Sta
tion
ED T
reat
men
t Sta
tion
Div
ersi
on H
ours
/
Div
ersi
on H
ours
/
Div
ersi
on H
ours
/
Div
ersi
on H
ours
/
1,0
00
Popu
lati
on
1,0
00
Popu
lati
on
1,0
00
Popu
lati
on
1,0
00
Popu
lati
onD
iver
sion
Hou
rs/
Div
ersi
on H
ours
/
Div
ersi
on H
ours
/
Div
ersi
on H
ours
/
EMS
Tran
spor
t
EMS
Tran
spor
t
EMS
Tran
spor
t
EMS
Tran
spor
tD
iver
sion
Hou
rs/
Div
ersi
on H
ours
/
Div
ersi
on H
ours
/
Div
ersi
on H
ours
/
Hos
pita
l
Hos
pita
l
Hos
pita
l
Hos
pita
l
D
iver
sion
Hou
rs/
Div
ersi
on H
ours
/
Div
ersi
on H
ours
/
Div
ersi
on H
ours
/
ED T
reat
men
t Sta
tion
ED T
reat
men
t Sta
tion
ED T
reat
men
t Sta
tion
ED T
reat
men
t Sta
tion
Alameda 1,530,620 478,353 13 305 82,150 881 714 313 1,568 0.47 0.01 55 2
Central California 1,657,210 521,991 16 340 149,865 72 n/a 315 1,535 n/a n/a n/a n/a
Coastal Valleys 707,257 189,801 12 131 41,885 0 n/a 268 1,449 n/a n/a n/a n/a
Contra Costa 1,044,201 326,314 9 223 58,213 9 n/a 313 1,463 n/a n/a n/a n/a
El Dorado3178,689 44,281 2 27 9,112 0 n/a 248 1,640 n/a n/a n/a n/a
Imperial3,5174,322 73,452 2 36 11,078 1,120 - 421 2,040 6.42 0.10 560 0
Inland Counties 2,071,775 654,035 19 360 25,142 14,405 19,224 316 1,817 9.28 0.76 1,012 53
Kern 809,903 220,739 9 130 66,708 548 621 273 1,698 0.77 0.01 69 5
Los Angeles 10,294,280 2,653,876 75 1,541 496,896 73,072 81,741 258 1,722 7.94 0.16 1,090 53
Marin4256,310 75,733 3 45 15,643 104 65 295 1,683 0.25 0.00 22 1
Merced 252,544 66,313 2 31 14,153 0 n/a 263 2,139 n/a n/a n/a n/a
Monterey 425,356 136,971 4 63 20,571 0 n/a 322 2,174 n/a n/a n/a n/a
Mountain Valley 626,982 232,882 7 126 44,216 164 1,089 371 1,848 1.74 0.02 156 9
North Coast 225,392 128,939 8 63 17,582 0 n/a 572 2,047 n/a n/a n/a n/a
Northern California5643,505 266,885 19 150 77,210 594 - 415 1,779 0.92 0.01 31 0
Orange 3,098,183 764,169 27 552 55,931 8,445 7,197 247 1,384 2.32 0.13 267 13
Riverside52,070,315 564,402 15 300 117,200 2,423 - 273 1,881 1.17 0.02 162 0
Sacramento31,415,117 389,134 9 231 71,864 3,721 3,905 275 1,685 2.76 0.05 434 17
San Benito 57,493 15,580 1 6 3,771 0 n/a 271 2,597 n/a n/a n/a n/a
San Diego63,120,088 727,096 17 424 147,639 19,015 24,458 233 1,715 7.84 0.17 1,439 58
San Francisco 817,537 226,942 9 163 57,173 5,689 6,477 278 1,392 7.92 0.11 720 40
San Joaquin 680,183 203,858 7 107 40,575 227 320 300 1,905 0.47 0.01 46 3
San Luis Obispo 267,154 89,623 4 56 14,580 26 376 335 1,600 1.41 0.03 94 7
San Mateo3734,453 179,863 8 119 28,318 2,035 2,499 245 1,511 3.40 0.09 312 21
Santa Barbara 425,710 130,410 5 56 27,487 0 236 306 2,329 0.55 0.01 47 4
Santa Clara 1,820,176 398,334 11 228 59,557 1,965 2,600 219 1,747 1.43 0.04 236 11
Santa Cruz 265,183 62,062 2 36 11,384 677 1,440 234 1,724 5.43 0.13 720 40
Sierra-Sacramento7794,063 261,522 8 147 43,558 644 681 329 1,779 0.86 0.02 85 5
Solano 423,970 117,410 4 82 29,430 0 n/a 277 1,432 n/a n/a n/a n/a
Tuolumne 56,910 23,150 1 14 4,849 0 n/a 407 1,654 n/a n/a n/a n/a
Ventura 826,550 178,189 7 112 32,472 8,858 7,400 216 1,591 8.95 0.23 1,057 66
Total/AverageTotal/AverageTotal/AverageTotal/Average 37,771,43137,771,43137,771,43137,771,431 10,402,30910,402,30910,402,30910,402,309 335335335335 6,2046,2046,2046,204 1,876,2121,876,2121,876,2121,876,212 144,694144,694144,694144,694 161,043161,043161,043161,043 275275275275 1,6771,6771,6771,677 4.264.264.264.26 0.090.090.090.09 481481481481 26262626
165,180165,180165,180165,180
Source: OSHPD Annual Hospital Utilization Report 2007 (Pivot Tables), CA DOF, interviews with each EMS agency
6 During 2002, San Diego County implemented a “home hospital” policy where a managed care patient is transported to their payer contracted hospital irrespective of the hospital’s diversion
status. Thus, diversion hours may overstate the total diversion problem as each diverted ED may still receive ambulance patients.
2 Includes all General Acute Care hospitals with at least 1 ED Visit reported in the OSHPD data
Total diversion hours including OSHPD data, when EMS agency data was not availableTotal diversion hours including OSHPD data, when EMS agency data was not availableTotal diversion hours including OSHPD data, when EMS agency data was not availableTotal diversion hours including OSHPD data, when EMS agency data was not available
"-" = EMS agency did not respond to requests for data
1 Population as of July 1, 2007
n/a = Not applicable. The region has a "no divert" policy or does not have any hospitals
3 EMS transports estimated based on average growth rate4 Diversion hours include all types (e.g. ED Sat, CT Failure, Neuro, Trauma)5 Diversion hours were not made available from the EMS agency. The diversion hours calculations were estimated using OSHPD data
7 Region changed to "no divert" policy 7/2007. Thus the data reflect only January through June 2007.

24 | Supported by the California HealthCare Foundation, based in Oakland, California.
EMS Diversion by Region EMS Diversion by Region EMS Diversion by Region EMS Diversion by Region –––– 2006 2006 2006 2006
EMS RegionEMS RegionEMS RegionEMS Region Pop
ulat
ion
Pop
ulat
ion
Pop
ulat
ion
Pop
ulat
ion
(per
CA
DO
F)
(per
CA
DO
F)
(per
CA
DO
F)
(per
CA
DO
F)1111
ED V
olu
me
ED V
olu
me
ED V
olu
me
ED V
olu
me
(per
OSH
PD
)
(per
OSH
PD
)
(per
OSH
PD
)
(per
OSH
PD
)H
ospi
tals
(O
SHP
D)
Hos
pita
ls (
OSH
PD
)
Hos
pita
ls (
OSH
PD
)
Hos
pita
ls (
OSH
PD
)2222
ED T
reat
men
t
ED T
reat
men
t
ED T
reat
men
t
ED T
reat
men
t
Stat
ions
(O
SHPD
)
Stat
ions
(O
SHPD
)
Stat
ions
(O
SHPD
)
Stat
ions
(O
SHPD
)E
MS
Tran
spor
ts
EM
S Tr
ansp
orts
EM
S Tr
ansp
orts
EM
S Tr
ansp
orts
(per
EM
S A
genc
y)
(per
EM
S A
genc
y)
(per
EM
S A
genc
y)
(per
EM
S A
genc
y)D
iver
sion
Ho
urs
Div
ersi
on H
our
s
Div
ersi
on H
our
s
Div
ersi
on H
our
s
(per
OSH
PD
)
(per
OSH
PD
)
(per
OSH
PD
)
(per
OSH
PD
)D
iver
sion
Ho
urs
Div
ersi
on H
our
s
Div
ersi
on H
our
s
Div
ersi
on H
our
s
(per
EM
S A
genc
y)
(per
EM
S A
genc
y)
(per
EM
S A
genc
y)
(per
EM
S A
genc
y)
ED
Uti
lizat
ion/
ED U
tiliz
atio
n/
ED U
tiliz
atio
n/
ED U
tiliz
atio
n/
1,0
00
Pop
ulat
ion
1,0
00
Pop
ulat
ion
1,0
00
Pop
ulat
ion
1,0
00
Pop
ulat
ion
ED V
isit
s/
ED V
isit
s/
ED V
isit
s/
ED V
isit
s/ED
Tre
atm
ent
Stat
ion
ED T
reat
men
t St
atio
n
ED T
reat
men
t St
atio
n
ED T
reat
men
t St
atio
n
Div
ersi
on H
our
s/
Div
ersi
on H
our
s/
Div
ersi
on H
our
s/
Div
ersi
on H
our
s/
1,0
00
Pop
ulat
ion
1,0
00
Pop
ulat
ion
1,0
00
Pop
ulat
ion
1,0
00
Pop
ulat
ion
Div
ersi
on H
our
s/
Div
ersi
on H
our
s/
Div
ersi
on H
our
s/
Div
ersi
on H
our
s/
EMS
Tran
spor
t
EMS
Tran
spor
t
EMS
Tran
spor
t
EMS
Tran
spor
tD
iver
sion
Ho
urs/
Div
ersi
on H
our
s/
Div
ersi
on H
our
s/
Div
ersi
on H
our
s/
Hos
pita
l
Hos
pita
l
Hos
pita
l
Hos
pita
l
D
iver
sion
Ho
urs/
Div
ersi
on H
our
s/
Div
ersi
on H
our
s/
Div
ersi
on H
our
s/
ED T
reat
men
t St
atio
n
ED T
reat
men
t St
atio
n
ED T
reat
men
t St
atio
n
ED T
reat
men
t St
atio
n
Alameda31,513,859 438,597 12 288 83,882 1,034 1,073 290 1,523 0.71 0.01 89 4
Central California 1,624,906 522,599 17 326 83,927 50 n/a 322 1,603 n/a n/a n/a n/a
Coastal Valleys 701,065 208,439 13 149 36,694 49 238 297 1,399 0.34 0.01 18 2
Contra Costa 1,031,012 317,594 8 191 59,517 1,494 1,674 308 1,663 1.62 0.03 209 9
El Dorado 176,969 45,549 2 27 8,991 0 n/a 257 1,687 n/a n/a n/a n/a
Imperial 168,979 78,161 2 36 10,670 791 518 463 2,171 3.07 0.05 259 14
Inland Counties 2,043,644 543,740 20 361 103,566 17,177 22,318 266 1,506 10.92 0.22 1,116 62
Kern 790,246 216,728 10 125 39,863 420 1,020 274 1,734 1.29 0.03 102 8
Los Angeles310,247,672 2,713,973 77 1,544 459,065 102,551 102,609 265 1,758 10.01 0.22 1,333 66
Marin4
254,000 75,446 3 45 13,093 297 126 297 1,677 0.50 0.01 42 3
Merced 248,258 19,923 1 9 13,026 0 n/a 80 2,214 n/a n/a n/a n/a
Monterey3421,463 126,114 4 63 19,755 0 n/a 299 2,002 n/a n/a n/a n/a
Mountain Valley 618,847 226,847 7 110 77,688 493 622 367 2,062 1.01 0.01 89 6
North Coast 224,503 127,887 8 66 19,048 3 n/a 570 1,938 n/a n/a n/a n/a
Northern California 638,490 245,252 19 150 42,500 529 593 384 1,635 0.93 0.01 31 4
Orange3
3,075,341 739,141 26 518 53,371 11,340 9,821 240 1,427 3.19 0.18 378 19
Riverside 2,004,174 535,372 15 285 114,946 1,718 2,573 267 1,878 1.28 0.02 172 9
Sacramento31,396,496 358,727 9 227 70,428 6,519 6,644 257 1,580 4.76 0.09 738 29
San Benito 57,128 14,838 1 6 2,049 0 n/a 260 2,473 n/a n/a n/a n/a
San Diego5
3,077,877 696,161 18 440 142,791 15,182 21,771 226 1,582 7.07 0.15 1,210 49
San Francisco 806,210 227,382 9 163 55,777 4,116 4,725 282 1,395 5.86 0.08 525 29
San Joaquin 671,115 204,525 7 107 48,120 100 196 305 1,911 0.29 0.00 28 2
San Luis Obispo3264,972 87,266 4 48 13,843 24 18 329 1,818 0.07 0.00 5 0
San Mateo 726,260 182,400 8 119 26,703 1,973 2,079 251 1,533 2.86 0.08 260 17
Santa Barbara 421,337 125,622 5 59 26,294 0 402 298 2,129 n/a n/a n/a n/a
Santa Clara 1,790,272 354,929 10 224 54,246 1,593 2,546 198 1,585 n/a n/a n/a n/a
Santa Cruz 262,150 65,351 2 36 10,588 1,225 686 249 1,815 n/a n/a n/a n/a
Sierra-Sacramento 778,231 242,760 8 149 47,708 1,882 1,825 312 1,629 n/a n/a n/a n/a
Solano 421,815 112,596 4 71 21,774 4 n/a 267 1,586 n/a n/a n/a n/a
Tuolumne 56,882 30,165 2 20 4,765 0 1 530 1,508 n/a n/a n/a n/a
Ventura 818,803 194,963 8 108 31,872 12,078 10,836 238 1,805 n/a n/a n/a n/a
Total/AverageTotal/AverageTotal/AverageTotal/Average 37,332,97637,332,97637,332,97637,332,976 10,079,04710,079,04710,079,04710,079,047 339339339339 6,0706,0706,0706,070 1,796,5601,796,5601,796,5601,796,560 182,642182,642182,642182,642 194,914194,914194,914194,914 270270270270 1,6601,6601,6601,660 5.225.225.225.22 0.110.110.110.11 575575575575 323232321 Population as of July 1, 2006
n/a = Not applicable. The region has a "no divert" policy or does not have any hospitals
3 EMS transports estimated based on typical 9-1-1 utilization by population
4 Diversion hours include all types (e.g. ED Sat, CT Failure, Neuro, Trauma)
5 During 2002, San Diego County implemented a “home hospital” policy where a managed care patient is transported to their payer contracted hospital irrespective of the hospital’s diversion
status. Thus, diversion hours may overstate the total diversion problem as each diverted ED may still receive ambulance patients.
2 Includes all General Acute Care hospitals with at least 1 ED Visit reported in the OSHPD data
Source: OSHPD Annual Hospital Utilization Report 2006 (Pivot Tables), CA DOF, interviews with each EMS agency

25 | Supported by the California HealthCare Foundation, based in Oakland, California.
EMS Diversion by Region EMS Diversion by Region EMS Diversion by Region EMS Diversion by Region –––– 2005 2005 2005 2005
EMS RegionEMS RegionEMS RegionEMS Region Pop
ulat
ion
Pop
ulat
ion
Pop
ulat
ion
Pop
ulat
ion
(per
CA
DO
F)
(per
CA
DO
F)
(per
CA
DO
F)
(per
CA
DO
F)1111
ED V
olu
me
ED V
olu
me
ED V
olu
me
ED V
olu
me
(per
OSH
PD
)
(per
OSH
PD
)
(per
OSH
PD
)
(per
OSH
PD
)H
osp
ital
s (O
SHP
D)
Hos
pit
als
(OSH
PD
)
Hos
pit
als
(OSH
PD
)
Hos
pit
als
(OSH
PD
)2222
ED
Tre
atm
ent
ED
Tre
atm
ent
ED
Tre
atm
ent
ED
Tre
atm
ent
Stat
ions
(O
SH
PD
)
Stat
ions
(O
SH
PD
)
Stat
ions
(O
SH
PD
)
Stat
ions
(O
SH
PD
)E
MS
Tran
spor
ts
EM
S Tr
ansp
orts
EM
S Tr
ansp
orts
EM
S Tr
ansp
orts
(per
EM
S A
genc
y)
(per
EM
S A
genc
y)
(per
EM
S A
genc
y)
(per
EM
S A
genc
y)D
iver
sion
Hou
rs
Div
ersi
on H
ours
Div
ersi
on H
ours
Div
ersi
on H
ours
(per
OSH
PD
)
(per
OSH
PD
)
(per
OSH
PD
)
(per
OSH
PD
)D
iver
sion
Hou
rs
Div
ersi
on H
ours
Div
ersi
on H
ours
Div
ersi
on H
ours
(per
EM
S A
genc
y)
(per
EM
S A
genc
y)
(per
EM
S A
genc
y)
(per
EM
S A
genc
y)
E
D U
tiliz
atio
n/
ED
Uti
lizat
ion/
ED
Uti
lizat
ion/
ED
Uti
lizat
ion/
1,0
00
Pop
ulat
ion
1,0
00
Pop
ulat
ion
1,0
00
Pop
ulat
ion
1,0
00
Pop
ulat
ion
ED
Vis
its/
ED
Vis
its/
ED
Vis
its/
ED
Vis
its/
ED
Tre
atm
ent
Stat
ion
ED
Tre
atm
ent
Stat
ion
ED
Tre
atm
ent
Stat
ion
ED
Tre
atm
ent
Stat
ion
Div
ersi
on H
ours
/
Div
ersi
on H
ours
/
Div
ersi
on H
ours
/
Div
ersi
on H
ours
/
1,0
00
Pop
ulat
ion
1,0
00
Pop
ulat
ion
1,0
00
Pop
ulat
ion
1,0
00
Pop
ulat
ion
Div
ersi
on H
ours
/
Div
ersi
on H
ours
/
Div
ersi
on H
ours
/
Div
ersi
on H
ours
/
EMS
Tran
spor
t
EMS
Tran
spor
t
EMS
Tran
spor
t
EMS
Tran
spor
tD
iver
sion
Hou
rs/
Div
ersi
on H
ours
/
Div
ersi
on H
ours
/
Div
ersi
on H
ours
/
Hos
pit
al
Hos
pit
al
Hos
pit
al
Hos
pit
al
D
iver
sion
Hou
rs/
Div
ersi
on H
ours
/
Div
ersi
on H
ours
/
Div
ersi
on H
ours
/
ED
Tre
atm
ent
Stat
ion
ED
Tre
atm
ent
Stat
ion
ED
Tre
atm
ent
Stat
ion
ED
Tre
atm
ent
Stat
ion
Alameda 1,501,124 442,775 12 286 82,141 1,124 1,319 295 1,548 0.88 0.02 110 5
Central California 1,591,635 508,298 17 310 79,107 115 n/a 319 1,640 n/a n/a n/a n/a
Coastal Valleys 698,353 201,612 13 149 37,118 2,088 2,747 289 1,353 3.93 0.07 211 18
Contra Costa 1,021,555 280,237 8 192 54,568 388 506 274 1,460 0.50 0.01 63 3
El Dorado 174,542 45,039 2 27 8,850 0 n/a 258 1,668 n/a n/a n/a n/a
Imperial 163,521 79,141 2 36 10,670 1,975 1,073 484 2,198 6.56 0.10 537 30
Inland Counties 2,002,506 518,377 19 319 101,121 24,998 32,661 259 1,625 16.31 0.32 1,719 102
Kern 765,161 211,731 10 124 35,830 543 1,905 277 1,708 2.49 0.05 190 15
Los Angeles 10,197,247 2,679,473 73 1,443 459,065 162,448 174,952 263 1,857 17.16 0.38 2,397 121
Marin 252,179 72,178 3 45 12,734 167 204 286 1,604 0.81 0.02 68 5
Merced 242,260 48,539 2 26 12,662 0 n/a 200 1,867 n/a n/a n/a n/a
Monterey3,4421,211 118,579 4 54 19,586 428 n/t 282 2,196 1.02 0.02 107 8
Mountain Valley 609,961 223,575 7 116 73,944 422 253 367 1,927 0.41 0.00 36 2
North Coast 223,443 127,128 8 66 18,750 0 n/a 569 1,926 n/a n/a n/a n/a
Northern California4, 5
632,023 224,046 18 131 42,075 294 196 354 1,710 0.31 0.00 11 1
Orange 3,056,814 767,336 26 523 53,426 10,808 10,608 251 1,467 3.47 0.20 408 20
Riverside 1,922,209 491,004 14 285 110,898 1,352 3,847 255 1,723 2.00 0.03 275 13
Sacramento 1,378,299 350,457 9 225 69,068 5,809 5,811 254 1,558 4.22 0.08 646 26
San Benito 57,112 14,592 1 6 1,865 0 n/a 255 2,432 n/a n/a n/a n/a
San Diego63,051,175 718,290 19 426 138,598 13,331 18,841 235 1,686 6.18 0.14 992 44
San Francisco 799,731 225,179 9 154 53,084 6,670 7,106 282 1,462 8.89 0.13 790 46
San Joaquin3659,707 202,230 7 107 44,752 137 n/t 307 1,890 0.21 0.00 20 1
San Luis Obispo 262,480 90,411 4 46 14,857 186 48 344 1,965 0.18 0.00 12 1
San Mateo 722,012 185,588 8 119 26,009 2,287 2,458 257 1,560 3.40 0.09 307 21
Santa Barbara 418,899 128,041 5 59 19,905 8 1,004 306 2,170 2.40 0.05 201 17
Santa Clara 1,763,481 305,690 10 224 57,293 1,723 2,638 173 1,365 1.50 0.05 264 12
Santa Cruz 260,469 64,800 2 36 10,149 1,726 689 249 1,800 2.65 0.07 345 19
Sierra-Sacramento 759,050 217,333 8 128 49,989 1,502 1,516 286 1,698 2.00 0.03 190 12
Solano 419,180 109,017 4 71 17,251 0 n/a 260 1,535 n/a n/a n/a n/a
Tuolumne 56,816 31,740 2 20 4,232 0 4 559 1,587 0.07 0.00 2 0
Ventura 812,065 183,428 7 99 29,442 11,376 9,521 226 1,853 11.72 0.32 1,360 96
Total/AverageTotal/AverageTotal/AverageTotal/Average 36,896,22036,896,22036,896,22036,896,220 9,865,8649,865,8649,865,8649,865,864 333333333333 5,8525,8525,8525,852 1,749,0391,749,0391,749,0391,749,039 251,905251,905251,905251,905 279,907279,907279,907279,907 267267267267 1,6861,6861,6861,686 7.597.597.597.59 0.160.160.160.16 841841841841 48484848
280,472280,472280,472280,472
n/t = Not tracked by EMS agency
3 Diversion hours calculations estimated using OSHPD data
4 EMS transports estimated based on typical 9-1-1 utilization by population
5 Diversion hours (per EMS Agency) estimated from 2003-2004 diversion hours
n/a = Not applicable. The region has a "no divert" policy or does not have any hospitals
6 During 2002, San Diego County implemented a “home hospital” policy where a managed care patient is transported to their payer contracted hospital irrespective of the hospital’s diversion
status. Thus, diversion hours may overstate the total diversion problem as each diverted ED may still receive ambulance patients.
2 Includes all General Acute Care hospitals with at least 1 ED Visit reported in the OSHPD data
Total diversion hours including OSHPD data, when EMS agency data was not availableTotal diversion hours including OSHPD data, when EMS agency data was not availableTotal diversion hours including OSHPD data, when EMS agency data was not availableTotal diversion hours including OSHPD data, when EMS agency data was not available1 Population as of July 1, 2005 Source: OSHPD Annual Hospital Utilization Report 2005 (Pivot Tables), CA DOF, interviews with each EMS agency

26 | Supported by the California HealthCare Foundation, based in Oakland, California.
EMS Diversion by Region EMS Diversion by Region EMS Diversion by Region EMS Diversion by Region –––– 2004 2004 2004 2004
EMS RegionEMS RegionEMS RegionEMS Region Popu
lati
on
Popu
lati
on
Popu
lati
on
Popu
lati
on(p
er C
A D
OF)
(per
CA
DO
F)
(per
CA
DO
F)
(per
CA
DO
F)1111
ED V
olum
e
ED V
olum
e
ED V
olum
e
ED V
olum
e(p
er O
SHP
D)
(per
OSH
PD
)
(per
OSH
PD
)
(per
OSH
PD
)H
ospi
tals
(O
SHPD
)
Hos
pita
ls (
OSH
PD)
Hos
pita
ls (
OSH
PD)
Hos
pita
ls (
OSH
PD)
2222
ED T
reat
men
t
ED T
reat
men
t
ED T
reat
men
t
ED T
reat
men
t
Stat
ions
(O
SHPD
)
Stat
ions
(O
SHPD
)
Stat
ions
(O
SHPD
)
Stat
ions
(O
SHPD
)EM
S Tr
ansp
orts
EMS
Tran
spor
ts
EMS
Tran
spor
ts
EMS
Tran
spor
ts
(per
EM
S A
genc
y)
(per
EM
S A
genc
y)
(per
EM
S A
genc
y)
(per
EM
S A
genc
y)D
iver
sion
Hou
rs
Div
ersi
on H
ours
Div
ersi
on H
ours
Div
ersi
on H
ours
(per
OSH
PD
)
(per
OSH
PD
)
(per
OSH
PD
)
(per
OSH
PD
)D
iver
sion
Hou
rs
Div
ersi
on H
ours
Div
ersi
on H
ours
Div
ersi
on H
ours
(per
EM
S A
genc
y)
(per
EM
S A
genc
y)
(per
EM
S A
genc
y)
(per
EM
S A
genc
y)
ED
Util
izat
ion/
ED U
tiliz
atio
n/
ED U
tiliz
atio
n/
ED U
tiliz
atio
n/
1,00
0 P
opul
atio
n
1,00
0 P
opul
atio
n
1,00
0 P
opul
atio
n
1,00
0 P
opul
atio
nED
Vis
its/
ED V
isits
/
ED V
isits
/
ED V
isits
/ED
Tre
atm
ent
Stat
ion
ED T
reat
men
t St
atio
n
ED T
reat
men
t St
atio
n
ED T
reat
men
t St
atio
n
Div
ersi
on H
ours
/
Div
ersi
on H
ours
/
Div
ersi
on H
ours
/
Div
ersi
on H
ours
/
1,0
00 P
opul
atio
n
1,0
00 P
opul
atio
n
1,0
00 P
opul
atio
n
1,0
00 P
opul
atio
nD
iver
sion
Hou
rs/
Div
ersi
on H
ours
/
Div
ersi
on H
ours
/
Div
ersi
on H
ours
/
EMS
Tran
spor
t
EMS
Tran
spor
t
EMS
Tran
spor
t
EMS
Tran
spor
tD
iver
sion
Hou
rs/
Div
ersi
on H
ours
/
Div
ersi
on H
ours
/
Div
ersi
on H
ours
/
Hos
pita
l
Hos
pita
l
Hos
pita
l
Hos
pita
l
D
iver
sion
Hou
rs/
Div
ersi
on H
ours
/
Div
ersi
on H
ours
/
Div
ersi
on H
ours
/
ED T
reat
men
t St
atio
n
ED T
reat
men
t St
atio
n
ED T
reat
men
t St
atio
n
ED T
reat
men
t St
atio
n
Alameda 1,497,110 381,701 11 239 75,424 1,505 1,764 255 1,597 1.18 0.02 160 7
Central California 1,559,868 394,962 12 229 72,501 50 n/a 253 1,725 n/a n/a n/a n/a
Coastal Valleys 696,168 163,171 11 110 34,927 798 2,990 234 1,483 4.29 0.09 272 27
Contra Costa 1,011,851 283,104 8 159 49,314 253 257 280 1,781 0.25 0.01 32 2
El Dorado 171,355 45,300 2 27 8,769 0 n/a 264 1,678 n/a n/a n/a n/a
Imperial 158,650 68,880 2 36 10,455 2,083 1,276 434 1,913 8.04 0.12 638 35
Inland Counties 1,952,754 466,912 18 298 97,944 26,269 37,114 239 1,567 19.01 0.38 2,062 125
Kern 742,529 171,670 9 110 34,124 519 1,368 231 1,561 1.84 0.04 152 12
Los Angeles 10,127,440 2,658,919 79 1,500 419,644 144,272 165,026 263 1,773 16.29 0.39 2,089 110
Marin3 250,703 68,947 3 45 10,733 98 n/t 275 1,532 0.39 0.01 33 2
Merced 236,367 46,357 2 26 11,558 0 n/a 196 1,783 n/a n/a n/a n/a
Monterey3,4421,191 119,248 4 54 19,641 603 n/t 283 2,208 1.43 0.03 151 11
Mountain Valley 598,538 213,635 7 123 70,200 246 207 357 1,737 0.35 0.00 30 2
North Coast3222,162 100,356 7 55 19,481 0 n/a 452 1,825 n/a n/a n/a n/a
Northern California4625,925 235,292 20 153 41,654 926 251 376 1,538 0.40 n/a 13 2
Orange 3,033,026 747,031 28 530 52,301 11,482 10,767 246 1,409 3.55 0.21 385 20
Riverside 1,841,707 481,754 15 266 112,796 1,586 3,216 262 1,811 1.75 0.03 214 12
Sacramento 1,358,046 335,871 9 211 65,704 7,576 7,785 247 1,592 5.73 0.12 865 37
San Benito 56,865 14,046 1 6 1,853 0 n/a 247 2,341 n/a n/a n/a n/a
San Diego53,027,440 520,859 15 325 133,902 15,051 22,063 172 1,603 7.29 0.16 1,471 68
San Francisco 796,288 220,235 9 148 48,103 6,604 8,015 277 1,488 10.07 0.17 891 54
San Joaquin3643,929 179,606 7 102 41,619 134 n/t 279 1,761 0.21 0.00 19 1
San Luis Obispo 260,146 89,707 4 46 14,512 44 48 345 1,950 0.18 0.00 12 1
San Mateo 719,102 176,967 8 120 22,949 2,030 2,160 246 1,475 3.00 0.09 270 18
Santa Barbara3416,612 78,900 4 47 19,181 3 n/t 189 1,679 0.01 0.00 1 0
Santa Clara 1,747,249 306,481 11 216 54,246 2,397 3,077 175 1,419 1.76 0.06 280 14
Santa Cruz 259,666 81,403 2 36 10,325 892 371 313 2,261 1.43 0.04 186 10
Sierra-Sacramento 740,890 211,243 8 125 45,597 615 623 285 1,690 0.84 0.01 78 5
Solano 417,574 104,984 4 61 16,162 0 n/a 251 1,721 n/a n/a n/a n/a
Tuolumne 56,686 30,946 2 20 4,412 0 0 546 1,547 0.00 0.00 0 0
Ventura 806,634 166,371 7 97 28,417 13,265 9,257 206 1,715 11.48 0.33 1,322 95
Total/AverageTotal/AverageTotal/AverageTotal/Average 36,454,47136,454,47136,454,47136,454,471 9,164,8589,164,8589,164,8589,164,858 329329329329 5,5205,5205,5205,520 1,648,4481,648,4481,648,4481,648,448 239,301239,301239,301239,301 277,635277,635277,635277,635 251251251251 1,6601,6601,6601,660 7.627.627.627.62 0.170.170.170.17 844844844844 50505050
278,473278,473278,473278,473Total diversion hours including OSHPD data, when EMS agency data was not availableTotal diversion hours including OSHPD data, when EMS agency data was not availableTotal diversion hours including OSHPD data, when EMS agency data was not availableTotal diversion hours including OSHPD data, when EMS agency data was not available
n/a = Not applicable. The region has a "no divert" policy or does not have any hospitals
1 Population as of July 1, 2004
3 Diversion hours estimated by OSHPD data4 EMS transports estimated based on typical 9-1-1 utilization by population5 During 2002, San Diego County implemented a “home hospital” policy where a managed care patient is transported to their payer contracted hospital irrespective of the hospital’s
diversion status. Thus, diversion hours may overstate the total diversion problem as each diverted ED may still receive ambulance patients.
2 Includes all General Acute Care hospitals with at least 1 ED Visit reported in the OSHPD data
n/t = Not tracked by EMS agency
Source: OSHPD Annual Hospital Utilization Report 2004 (Pivot Tables), CA DOF, interviews with each EMS agency

27 | Supported by the California HealthCare Foundation, based in Oakland, California.
EMS Diversion by Region EMS Diversion by Region EMS Diversion by Region EMS Diversion by Region –––– 2003 2003 2003 2003
EMS RegionEMS RegionEMS RegionEMS Region Popu
latio
n
Popu
latio
n
Popu
latio
n
Popu
latio
n(p
er C
A D
OF)
(per
CA
DO
F)
(per
CA
DO
F)
(per
CA
DO
F)1111
ED V
olum
e
ED V
olum
e
ED V
olum
e
ED V
olum
e(p
er O
SHP
D)
(per
OSH
PD
)
(per
OSH
PD
)
(per
OSH
PD
)H
ospi
tals
(O
SHP
D)
Hos
pita
ls (
OSH
PD
)
Hos
pita
ls (
OSH
PD
)
Hos
pita
ls (
OSH
PD
)2222
ED T
reat
men
t
ED T
reat
men
t
ED T
reat
men
t
ED T
reat
men
t
Stat
ions
(O
SHPD
)
Stat
ions
(O
SHPD
)
Stat
ions
(O
SHPD
)
Stat
ions
(O
SHPD
)EM
S Tr
ansp
orts
EMS
Tran
spor
ts
EMS
Tran
spor
ts
EMS
Tran
spor
ts
(per
EM
S A
genc
y)
(per
EM
S A
genc
y)
(per
EM
S A
genc
y)
(per
EM
S A
genc
y)D
iver
sion
Hou
rs
Div
ersi
on H
ours
Div
ersi
on H
ours
Div
ersi
on H
ours
(per
OSH
PD
)
(per
OSH
PD
)
(per
OSH
PD
)
(per
OSH
PD
)D
iver
sion
Hou
rs
Div
ersi
on H
ours
Div
ersi
on H
ours
Div
ersi
on H
ours
(per
EM
S A
genc
y)
(per
EM
S A
genc
y)
(per
EM
S A
genc
y)
(per
EM
S A
genc
y)
ED
Uti
lizat
ion/
ED U
tiliz
atio
n/
ED U
tiliz
atio
n/
ED U
tiliz
atio
n/
1,0
00
Pop
ulat
ion
1,0
00
Pop
ulat
ion
1,0
00
Pop
ulat
ion
1,0
00
Pop
ulat
ion
ED V
isit
s/
ED V
isit
s/
ED V
isit
s/
ED V
isit
s/ED
Tre
atm
ent
Stat
ion
ED T
reat
men
t St
atio
n
ED T
reat
men
t St
atio
n
ED T
reat
men
t St
atio
nD
iver
sion
Hou
rs/
Div
ersi
on H
ours
/
Div
ersi
on H
ours
/
Div
ersi
on H
ours
/
1,0
00
Popu
lati
on
1,0
00
Popu
lati
on
1,0
00
Popu
lati
on
1,0
00
Popu
lati
onD
iver
sion
Hou
rs/
Div
ersi
on H
ours
/
Div
ersi
on H
ours
/
Div
ersi
on H
ours
/
EMS
Tran
spor
t
EMS
Tran
spor
t
EMS
Tran
spor
t
EMS
Tran
spor
tD
iver
sion
Hou
rs/
Div
ersi
on H
ours
/
Div
ersi
on H
ours
/
Div
ersi
on H
ours
/
Hos
pita
l
Hos
pita
l
Hos
pita
l
Hos
pita
l
D
iver
sion
Hou
rs/
Div
ersi
on H
ours
/
Div
ersi
on H
ours
/
Div
ersi
on H
ours
/
ED T
reat
men
t St
atio
n
ED T
reat
men
t St
atio
n
ED T
reat
men
t St
atio
n
ED T
reat
men
t St
atio
n
Alameda 1,492,709 403,396 12 232 78,660 1,251 3,496 270 1,739 2.34 0.04 291 15
Central California 1,523,446 445,605 16 249 70,253 1,542 n/a 292 1,790 n/a n/a n/a n/a
Coastal Valleys3333 691,607 168,441 11 100 32,439 229 n/t 244 1,684 0.33 0.01 21 2
Contra Costa 1,000,115 302,636 8 157 48,958 369 381 303 1,928 0.38 0.01 48 2
El Dorado 168,310 47,725 2 27 8,637 0 n/a 284 1,768 n/a n/a n/a n/a
Imperial 154,138 67,296 2 36 9,555 1,754 806 437 1,869 5.23 0.08 403 22
Inland Counties 1,898,287 479,368 18 301 94,767 36,314 52,387 253 1,593 27.60 0.55 2,910 174
Kern 719,357 180,474 10 114 32,758 2,258 1,532 251 1,583 2.13 0.05 153 13
Los Angeles 10,026,859 2,887,922 84 1,535 438,010 143,900 166,159 288 1,881 16.57 0.38 1,978 108
Marin3333 250,729 67,134 3 45 11,868 0 n/t 268 1,492 0.00 0.00 0 0
Merced 230,363 49,926 3 40 8,665 540 n/a 217 1,248 n/a n/a n/a n/a
Monterey3,4420,068 126,745 4 54 19,448 119 n/t 302 2,347 0.28 0.01 30 2
Mountain Valley 588,185 219,477 7 117 66,456 1,115 2,295 373 1,876 3.90 0.03 328 20
North Coast3 220,032 92,427 6 50 18,913 0 n/a 420 1,849 n/a n/a n/a n/a
Northern California4618,647 268,481 21 160 41,238 459 141 434 1,678 0.23 0.00 7 1
Orange 3,001,168 749,713 28 504 51,902 14,011 14,561 250 1,488 4.85 0.28 520 29
Riverside 1,764,136 486,344 15 258 110,735 3,231 6,712 276 1,885 3.80 0.06 447 26
Sacramento 1,332,815 352,973 9 197 66,348 6,374 6,380 265 1,792 4.79 0.10 709 32
San Benito456,591 15,621 1 6 1,840 0 n/a 276 2,604 n/a n/a n/a n/a
San Diego5 2,998,514 670,814 17 359 131,762 16,891 23,084 224 1,869 7.70 0.18 1,358 64
San Francisco 793,715 188,894 8 134 46,152 6,852 13,582 238 1,410 17.11 0.29 1,698 101
San Joaquin3625,556 153,722 6 83 38,706 153 n/t 246 1,852 0.24 0.00 26 2
San Luis Obispo3 257,024 89,185 4 44 14,258 56 - 347 2,027 0.22 0.00 14 1
San Mateo 716,773 187,162 8 107 22,468 1,244 1,948 261 1,749 2.72 0.09 244 18
Santa Barbara 413,823 137,950 5 63 16,820 0 0 333 2,190 0.00 0.00 0 0
Santa Clara 1,732,417 323,002 11 217 55,930 1,849 2,084 186 1,488 1.20 0.04 189 10
Santa Cruz 258,565 65,024 2 39 10,133 1,044 479 251 1,667 1.85 0.05 240 12
Sierra-Sacramento 720,819 221,889 8 124 41,773 639 766 308 1,789 1.06 0.02 96 6
Solano 414,759 110,656 4 58 15,980 0 n/a 267 1,908 n/a n/a n/a n/a
Tuolumne 56,648 31,800 2 13 4,085 0 0 561 2,446 0.00 0.00 0 0
Ventura3798,038 189,146 7 97 27,894 4,819 n/t 237 1,950 6.04 0.17 688 50
Total/AverageTotal/AverageTotal/AverageTotal/Average 35,944,21335,944,21335,944,21335,944,213 9,780,9489,780,9489,780,9489,780,948 342342342342 5,5205,5205,5205,520 1,637,4111,637,4111,637,4111,637,411 247,013247,013247,013247,013 296,793296,793296,793296,793 272272272272 1,7721,7721,7721,772 8.268.268.268.26 0.180.180.180.18 868868868868 54545454
302,169302,169302,169302,169
"-" = EMS agency did not respond to requests for data
3 Diversion hours estimated by OSHPD data
n/a = Not applicable. The region has a "no divert" policy or does not have any hospitals
Total diversion hours including OSHPD data, when EMS agency data was not availableTotal diversion hours including OSHPD data, when EMS agency data was not availableTotal diversion hours including OSHPD data, when EMS agency data was not availableTotal diversion hours including OSHPD data, when EMS agency data was not available1 Population as of July 1, 2003
4 EMS transports estimated based on typical 9-1-1 utilization by population
n/t = Not tracked by EMS agency
2 Includes all General Acute Care hospitals with at least 1 ED Visit reported in the OSHPD data
Source: OSHPD Annual Hospital Utilization Report 2003 (Pivot Tables), CA DOF, interviews with each EMS agency
5 During 2002, San Diego County implemented a “home hospital” policy where a managed care patient is transported to their payer contracted hospital irrespective of the hospital’s
diversion status. Thus, diversion hours may overstate the total diversion problem as each diverted ED may still receive ambulance patients.

California ED Diversion Project Study – Appendix
28 | Supported by the California HealthCare Foundation, based in Oakland, California.
Regional Regional Regional Regional Diversion Policy TableDiversion Policy TableDiversion Policy TableDiversion Policy Table
The following table summarizes the diversion policy for each EMS Region, as of 2007. Updated data from some regions was unavailable at the time this report was completed. Regions which have changed to a policy of “no diversion,” is recorded on the “Diversion not permitted” Table below.
Diversion RequirementsDiversion RequirementsDiversion RequirementsDiversion Requirements Ala
med
aA
lam
eda
Ala
med
aA
lam
eda
Imp
eria
lIm
per
ial
Imp
eria
lIm
per
ial
Inla
nd
Co
un
ties
Inla
nd
Co
un
ties
Inla
nd
Co
un
ties
Inla
nd
Co
un
ties
Ker
nK
ern
Ker
nK
ern
Lo
s A
ng
eles
Lo
s A
ng
eles
Lo
s A
ng
eles
Lo
s A
ng
eles
Ma
rin
Ma
rin
Ma
rin
Ma
rin
Mo
un
tain
Va
lley
Mo
un
tain
Va
lley
Mo
un
tain
Va
lley
Mo
un
tain
Va
lley
No
rth
ern
Cal
ifo
rnia
No
rth
ern
Cal
ifo
rnia
No
rth
ern
Cal
ifo
rnia
No
rth
ern
Cal
ifo
rnia
Ora
ng
eO
ran
ge
Ora
ng
eO
ran
ge
Riv
ersi
de
Riv
ersi
de
Riv
ersi
de
Riv
ersi
de
Sac
ram
ento
Sac
ram
ento
Sac
ram
ento
Sac
ram
ento
San
Die
go
San
Die
go
San
Die
go
San
Die
go
San
Fra
nci
sco
San
Fra
nci
sco
San
Fra
nci
sco
San
Fra
nci
sco
San
Jo
aq
uin
San
Jo
aq
uin
San
Jo
aq
uin
San
Jo
aq
uin
San
Lu
is O
bis
po
San
Lu
is O
bis
po
San
Lu
is O
bis
po
San
Lu
is O
bis
po
San
Ma
teo
San
Ma
teo
San
Ma
teo
San
Ma
teo
San
ta B
arb
ara
San
ta B
arb
ara
San
ta B
arb
ara
San
ta B
arb
ara
San
ta C
lara
San
ta C
lara
San
ta C
lara
San
ta C
lara
San
ta C
ruz
San
ta C
ruz
San
ta C
ruz
San
ta C
ruz
Ven
tura
Ven
tura
Ven
tura
Ven
tura
1 "No diversion" policy
2 System-wide divert policy. X X X X X X X1 X X X X X X X X X X X X X
3Hospital is required to have an internal
diversion policy.X X X X X X X X X X X X X X X
4Hospital's internal diversion policy is
approved by the EMS Agency.X X X X X
5Diversion requires approval from
hospital administrator or designee.X X X X X X X X X X X X X
6Hospital is required to have a plan to
resolve diversion.X X X X X X X X X X
7Each diversion requires the approval of
the EMS Agency.X X
8Policy allows for the EMS Agency to
conduct unannounced site visits.X X X X X X X X X X X X
9General principle:
"if all are closed, all are open"X X X X X X X X X X X X X
10
General principle:
"round robin" when all hospitals are on
diversion
X
11
General principle:
"if more than three hospitals are on
diversion, all are open for 60 minutes"
(example only)
X X
12
General principle:
hospitals are grouped geographically to
respond to diversion
X X
13General principle:
hospital "service area" is recognizedX X
14Diversion is generally considered a
"request".X X X X X X X X
15 Diversion is reported via phone/fax X X X X X
16Diversion status reported by
computer/ReddiNet/radioX X X X X X
2X
2 X X X X X X2 X X² X X
2X
2 X
17Diversion is documented via
forms/logsX X X X X X X X X X X X X
18System monitoring conducted by EMS
AgencyX X X X X X X X X X X X
19Routine diversion poll conducted every
hourX
20Routine diversion poll conducted every
2 hoursX X
21Routine diversion poll conducted every
4 hours
22Routine diversion poll conducted every
8 hoursX
23Once on diversion, mandatory updates
required every 2 hoursX X X X
24Once on diversion, mandatory updates
required every 4 hoursX
25Once on diversion, mandatory updates
required every 6 hours
26Once on diversion, bed inventory
conducted to reassess diversionX
27Maxim um allowable hours of diversion
per dayX X X X

California ED Diversion Project Study – Appendix
29 | Supported by the California HealthCare Foundation, based in Oakland, California.
Regional Regional Regional Regional Diversion Policy Diversion Policy Diversion Policy Diversion Policy Table, ContinuedTable, ContinuedTable, ContinuedTable, Continued
28Maximum allowable hours of diversion
per monthX X X
29Maximum allowable hours per
diversion eventX X X X X X X X X X X
30Maximum hospitals allowed to be on
diversionX X X X X X
31EMS Agency is notified of each
diversionX X X X X X X X X X X X
32Control facility is notified of each
diversion (dispatch)X X X X X
33
Central dispatch/fire
departments/ambulance provider is
notified of each diversion
X X X X X X X X X X X X X X X X
34Base hospital is notified of each
diversionX X X X X X X X X X
35Receiving hospitals are notified of each
diversionX X X X X X X X X X X X
36 Diversion applicable to BLS X X X X X
37 Diversion applicable to ALS X X X X X X X X X4 X
38 Diversion applicable to CCT X X
39 Diversion applicable to "direct admits" X
DIVERSION CATEGORIESDIVERSION CATEGORIESDIVERSION CATEGORIESDIVERSION CATEGORIES
40 General X X X X X X X X X X X X X X X X X X X
41 Case-by-case X
42 ED saturation X X X X X X X X X X X X X X X X X X X
43Internal disaster/physical plant
casualtyX X X X X X X X X X X X X X X X X X
44 Trauma X X X X X X X X X X X X X X X X
45 CT scan X X X X X X X X X X X X X X X
46 Neurosurgery X X X X X X X
47ICU/no critical care beds/critical
patient overloadX X X X
6 X
48No diversion of specific patients (i.e.,
extremis, specialty care)X X X X X X X X X X X X X X X X X
49Diversion applicable to work
action/staffing problems
50Maximum transport times are
identified when patients are divertedX X
51Maximum transport times for diverted
trauma patients (minutes)30 30 45
22 12 15 23 20 26 15 17 21 21 17 16 21 22 16 15 21 24 10 17
FootnotesFootnotesFootnotesFootnotes
1 For trauma only
2 Use EMSystem
3 For case-by-case diversion
4 Optional
5 Requires approval
6 Happens when there is not enough
space within the hospital to admit
ED patients
EMS regions with improving levels of diversion
EMS regions with minimal diversion
EMS regions with high levels of diversion
El Dorado (two hospitals in region)
Merced (effective 2003)
Monterey (effective 11/05)
North Coast (effective 2003)
San Benito (one hospital in region)
Sierra-Sacramento (effective 7/07)
Tuolumne
Solano (effective 2001)
Diversion Diversion Diversion Diversion notnotnotnot permitted in: permitted in: permitted in: permitted in:
Coastal Valleys (effective 4/06)
Contra Costa (effective 12/06)
Central California (effective 1/03)
Diversion RequirementsDiversion RequirementsDiversion RequirementsDiversion Requirements Ala
med
aA
lam
eda
Ala
med
aA
lam
eda
Imp
eria
lIm
per
ial
Imp
eria
lIm
per
ial
Inla
nd
Co
un
ties
Inla
nd
Co
un
ties
Inla
nd
Co
un
ties
Inla
nd
Co
un
ties
Ker
nK
ern
Ker
nK
ern
Lo
s A
ng
ele
sL
os
An
ge
les
Lo
s A
ng
ele
sL
os
An
ge
les
Ma
rin
Ma
rin
Ma
rin
Ma
rin
Mo
un
tain
Va
lley
Mo
un
tain
Va
lley
Mo
un
tain
Va
lley
Mo
un
tain
Va
lley
No
rth
ern
Cal
ifo
rnia
No
rth
ern
Cal
ifo
rnia
No
rth
ern
Cal
ifo
rnia
No
rth
ern
Cal
ifo
rnia
Ora
ng
eO
ran
ge
Ora
ng
eO
ran
ge
Riv
ersi
de
Riv
ersi
de
Riv
ersi
de
Riv
ersi
de
Sa
cram
ento
Sa
cram
ento
Sa
cram
ento
Sa
cram
ento
Sa
n D
ieg
oS
an
Die
go
Sa
n D
ieg
oS
an
Die
go
Sa
n F
ran
cisc
oS
an
Fra
nci
sco
Sa
n F
ran
cisc
oS
an
Fra
nci
sco
Sa
n J
oaq
uin
Sa
n J
oaq
uin
Sa
n J
oaq
uin
Sa
n J
oaq
uin
Sa
n L
uis
Ob
isp
oS
an
Lu
is O
bis
po
Sa
n L
uis
Ob
isp
oS
an
Lu
is O
bis
po
Sa
n M
ate
oS
an
Ma
teo
Sa
n M
ate
oS
an
Ma
teo
Sa
nta
Ba
rba
raS
an
ta B
arb
ara
Sa
nta
Ba
rba
raS
an
ta B
arb
ara
Sa
nta
Cla
raS
an
ta C
lara
Sa
nta
Cla
raS
an
ta C
lara
Sa
nta
Cru
zS
an
ta C
ruz
Sa
nta
Cru
zS
an
ta C
ruz
Ven
tura
Ven
tura
Ven
tura
Ven
tura

California ED Diversion Project Study – Appendix
30 | Supported by the California HealthCare Foundation, based in Oakland, California.
Best PracticeBest PracticeBest PracticeBest Practice Initiatives Initiatives Initiatives Initiatives
The following are examples of the kinds of best practice initiatives that were made available on the participant extranet.

California ED Diversion Project Study – Appendix
31 | Supported by the California HealthCare Foundation, based in Oakland, California.
Reason for Change:Reason for Change:Reason for Change:Reason for Change: Over the last few years, Adventist GlenOaks Hospital had successfully reduced waiting in its ED. The department first adopted a policy which required patients to be seen within 30 minutes of arrival. After this was accomplished, they set a new goal, aiming to see patients within 15 minutes of arrival. Again, the successful completion of this goal motivated the hospital to seek to decrease wait times even more. Implementation:Implementation:Implementation:Implementation: After hearing about the concept of a no-wait ED, the ED’s physician director visited a hospital which had effectively eliminated its ED. Although he was skeptical at first, after spending a day talking with doctors, nurses, patients, and technicians at this hospital, he became convinced that Adventist GlenOaks could not only adopt such a concept, but could do it better. Once he determined that this was a good model to follow, the physician director brought other key staff members to site-visit this facility. Before it could completely eliminate waiting, Adventist GlenOaks Hospital had to make sure that the proper processes and support were already in place. They had already instituted best practices including bedside triage and bedside registration, which eliminate any unnecessary delays prior to treatment. Additionally, lab and radiology staff were met with and agreed to treat tests from the ED as priority, which eliminated any unnecessary treatment delays in the ED as patients would not be held up in ED beds waiting for test results. By eliminating a physical waiting room, Adventist GlenOaks Hospital was able to expand the treatment capacity of its ED, putting treatment rooms in the area that was once the waiting room. These additional treatment rooms have provided the necessary capacity to enable patients to be seen immediately upon arrival in the ED. When patients arrive in Adventist GlenOaks ED, a greeter meets them and calls a nurse to bring them to a treatment room. Once the patient is in the room, his or her vital signs are taken and a patient chart is created bedside during bedside registration. The patient is then seen by a physician, much sooner than with typical triage and registration systems. Results/Impact:Results/Impact:Results/Impact:Results/Impact: Adventist GlenOaks Hospital redesigned its ED without a waiting room, and has successfully been able to accommodate patients arriving in the ED without any delays. Patients are now immediately brought to treatment rooms so that treatment can begin right away.
Best Practice Initiative: NoBest Practice Initiative: NoBest Practice Initiative: NoBest Practice Initiative: No----Wait EmWait EmWait EmWait Emergency Departmentergency Departmentergency Departmentergency Department
Hospital Name:Hospital Name:Hospital Name:Hospital Name: Adventist Glen Oaks Hospital Address:Address:Address:Address: 701 North Winthrop Avenue Glendale Heights, IL 60139 Contact:Contact:Contact:Contact: Rebecca Girling, RN Nurse Manager (630) 545-5700 2006 ED Volume: 16,055 Growth from 2005: -5.3% Total Staffed Hospital Beds: 62 Acute ED Beds: 19 Fast Track: No Clinical Decision Unit: No Problem to be Resolved:Problem to be Resolved:Problem to be Resolved:Problem to be Resolved: The hospital was looking to redesign its ED to reduce/eliminate waiting Key Words:Key Words:Key Words:Key Words: � No-wait ED � Bedside triage � Bedside registration Lessons Learned:Lessons Learned:Lessons Learned:Lessons Learned: Although Adventist GlenOaks Hospital has been able to successfully convert to a no-wait ED, they caution that this is not a step that all hospitals are ready to take. Years of preparation were necessary for Adventist GlenOaks to eliminate waiting in the ED, which had periodically decreased its wait times prior to eliminating waiting altogether.

California ED Diversion Project Study – Appendix
32 | Supported by the California HealthCare Foundation, based in Oakland, California.
Reason for Change:Reason for Change:Reason for Change:Reason for Change: Boston Medical Center (BMC) was one of 10 hospitals to receive a grant from the Robert Wood Johnson Foundation to participate in the Urgent Matters project, and then was one of four to receive additional funding for a special demonstration project. The Urgent Matters Project is an initiative that helped hospitals throughout the country improve throughput in their EDs to eliminate overcrowding and improve access to emergency care. Participating in this project provided BMC with the means to make changes to improve their throughput. Implementation:Implementation:Implementation:Implementation: The hospital used rapid cycle testing to try out a series of small changes which altogether were responsible for significant improvement. The rapid cycle testing method was desirable because it is flexible and allows for changes to be initiated quickly with minimal financial risk. BMC was able to build on successful results to achieve organizational buy-in because it was comforting to know that if something didn’t work, the change was not permanent. BMC’s management identified the process of getting admissions out of the ED as the biggest impediment to efficient flow in the ED, as well as the largest single fixable impediment. The problem seemed to be particularly bad around the middle of each week, when the intensive care unit would generally be backed-up. To address this problem, BMC worked on smoothing the surgery schedule. Elective surgeries were scheduled more evenly throughout the week, with surgeons only booking the operating room when a surgery was scheduled, rather than for large, fixed blocks of time each week. This smooth scheduling helped decrease the backlog in the ICU, which facilitated patient flow from the ED. Results/Impact:Results/Impact:Results/Impact:Results/Impact: Smoothing elective surgeries has helped for better flow out of the ED, and has also meant that fewer elective surgeries have needed to be cancelled or delayed to accommodate urgent cases. Average ED throughput decreased from 4.5 hours to 3.75 hours, which has effectively saved 525 hours per week. Diversion decreased by 20 percent in the year following the implementation of these changes. Reducing diversion has been very important financially, as the hospital estimates that for each hour on diversion, the hospital loses an average of two admissions, which translates into approximately $20,000 in forgone revenue.
Best Practice Initiative: Surgery Smoothing Best Practice Initiative: Surgery Smoothing Best Practice Initiative: Surgery Smoothing Best Practice Initiative: Surgery Smoothing
Hospital Name:Hospital Name:Hospital Name:Hospital Name: Boston Medical Center Address:Address:Address:Address: 1 Boston Medical Center Place Boston, MA 02118 Contact:Contact:Contact:Contact: Jonathan Olshaker, MD Chief, Dept of Emergency Medicine [email protected] (617) 414-4930 2006 ED Volume: 128,005 Growth from 2005: 2.9% Total Staffed Hospital Beds: 483 Acute ED Beds: 30 Fast Track: No Clinical Decision Unit: No Problem to be Resolved:Problem to be Resolved:Problem to be Resolved:Problem to be Resolved: Long ALOS in the ED Key Words:Key Words:Key Words:Key Words: � Surgery smoothing � Rapid Cycle Testing � Throughput � Inpatient admissions Lessons Learned:Lessons Learned:Lessons Learned:Lessons Learned: Teamwork is essential for success. It is impossible to maximize the potential of the ED unless the whole hospital is working together as a unified entity towards a common goal. Also, rather than looking for one major change to fix all of the hospital’s problems, a series of small changes can have a substantial impact.

California ED Diversion Project Study – Appendix
33 | Supported by the California HealthCare Foundation, based in Oakland, California.
Reason for Change:Reason for Change:Reason for Change:Reason for Change: Staff at Doctors Hospital felt completely overwhelmed by the volume of ED patients they saw each day. The ED, originally designed to accommodate 35,000 visits annually, was in fact seeing 69,000 patients each year. The ED could not accommodate all of these visits in a timely manner, which caused the LWBS rate to be high, at six percent, while patient and staff satisfaction were very low. Because plans for a new ED were still two years away, ED management realized that they needed to come up with process changes to improve patient flow through the facility. Implementation:Implementation:Implementation:Implementation: To address these issues, an ED management team held meetings over the course of two months. At these meetings, they discussed the current situation, identified underlying causes to problems they were seeing, and looked for solutions from other industries that could be applied to patient flow. Doctors Hospital’s ED management chose to adopt a “lean manufacturing” technique, aimed at reducing unnecessary steps in the patient-care process. Specifically, the lean manufacturing concept was applied to reduce patient handoffs between staff members and expedite lab and radiology tests. Most importantly, Doctors used software called “Arena” to simulate how various changes they could put in place would impact actual ED operations. This was beneficial as management could show staff members exactly what must be done to improve their situation, and they could test to see if changes were actually likely to work before implementing them. Results/Impact:Results/Impact:Results/Impact:Results/Impact: Doctors Hospital was able to decrease LWBS rate from six percent to three percent and reduce ALOS from 220 minutes to 180 minutes. At the same time, ED volume continued to increase at an average rate of 20 patients per day. Prior to initiating changes in the ED, Doctors had Press Ganey patient satisfaction scores in the tenth percentile. Since then, however, Press Ganey scores have increased to the 70th percentile.
Best Practice Initiative: Lean Manufacturing Best Practice Initiative: Lean Manufacturing Best Practice Initiative: Lean Manufacturing Best Practice Initiative: Lean Manufacturing
Hospital Name:Hospital Name:Hospital Name:Hospital Name: Doctors Hospital Address:Address:Address:Address: 41 High Street Columbus, OH 43213 (614) 298-6695 Contact:Contact:Contact:Contact: Marci Conti, RN, MBA VP Operations, CNO [email protected] 2006 ED Volume: 70,000 Growth from 2005: 1.4% Total Staffed Hospital Beds: 250 Acute ED Beds: unknown Fast Track: Yes Clinical Decision Unit: No Problem to be Resolved:Problem to be Resolved:Problem to be Resolved:Problem to be Resolved: Not enough capacity to accommodate ED visits Key Words:Key Words:Key Words:Key Words: � Left without being seen
(LWBS) � Average length of stay (ALOS) � Patient satisfaction � Lean manufacturing � Software simulation Lessons Learned:Lessons Learned:Lessons Learned:Lessons Learned: One of the most important factors to success for Doctors Hospital was flexibility. Specifically, each treatment room must be fully equipped and each staff member fully capable of handling patients of any acuity, rather than trying to designate specific resources for urgent versus acute care needs.

California ED Diversion Project Study – Appendix
34 | Supported by the California HealthCare Foundation, based in Oakland, California.
Reason for Change:Reason for Change:Reason for Change:Reason for Change: In 2002, Latter Day Saints (LDS) Hospital’s ED was frequently on diversion as the hospital was having trouble dealing with its growing inpatient volume. The hospital’s new CEO began holding a daily administrative huddle, determined to find a solution to this problem. They wanted to find a mechanism for limiting admissions or increasing discharges when bed capacity was strained. The solution they found was to cancel or postpone elective surgeries. Implementation:Implementation:Implementation:Implementation: At LDS Hospital, elective surgeries are only cancelled or postponed on an as-needed basis. Careful monitoring is done to recognize when surgical floors become full, and identify which other floors are likely to become overfull as a result. When all inpatient floors are at or near capacity, the OR is not allowed to proceed with any elective surgery that will require admission without first consulting with the house supervisor. Specifically when the facility approaches its full capacity, a procedure in the OR will not begin until staff can be sure that they will have a bed available for that patient. Results/Impact:Results/Impact:Results/Impact:Results/Impact: Since this new plan was put in place, LDS has only used the cancellation option on five days. However, having the process in place has helped in other ways. Simply by putting in place a system to analyze the hospital’s capacity resources, they have been able to identify possible problems before they happen and prevent severe cases of overcrowding and diversion.
Best Practice Initiative: Elective Surgery Postponement Tool Best Practice Initiative: Elective Surgery Postponement Tool Best Practice Initiative: Elective Surgery Postponement Tool Best Practice Initiative: Elective Surgery Postponement Tool
Hospital Name:Hospital Name:Hospital Name:Hospital Name: Latter Day Saints Hospital Address:Address:Address:Address: Eighth Avenue and C Street Salt Lake City, UT 84143-0001 (801) 408-1100 Contact:Contact:Contact:Contact: Mike Gibbons, RN, BSN ED Nurse Manager [email protected] 2006 ED Volume: 38,452 Growth from 2005: unknown Total Staffed Hospital Beds: 413 Acute ED Beds: 24 Fast Track: No Clinical Decision Unit: No Problem to be Resolved:Problem to be Resolved:Problem to be Resolved:Problem to be Resolved: High inpatient volume leading to crowding and diversion in the ED Tools Provided:Tools Provided:Tools Provided:Tools Provided: � Diversion Policy Key WorKey WorKey WorKey Words:ds:ds:ds: � Elective surgery � Daily administrative huddle Lessons Learned:Lessons Learned:Lessons Learned:Lessons Learned: Whenever a hospital is trying to come up with a plan or process to improve patient flow, it is absolutely necessary to include ED managers in this process. The ED accounts for as much as 65 percent of all admissions, so ED managers are often able to provide the most accurate picture of how the hospital
needs to handle its flow issues.

California ED Diversion Project Study – Appendix
35 | Supported by the California HealthCare Foundation, based in Oakland, California.
Reason for Change:Reason for Change:Reason for Change:Reason for Change: After implementing a new and more accurate electronic records system, San Antonio Community Hospital discovered that they had a serious problem of long wait times. The facility, originally designed to see 30,000 patients annually, in fact saw nearly 65,000 patients in the ED in 2003. Implementation:Implementation:Implementation:Implementation: ED management at San Antonio Community Hospital sought to make better use of the time that patients spend waiting in the ED. Specifically, they were looking to establish standard protocols to begin treatment for specific conditions during long waits in the ED. They came up with protocols for abdominal pain, congestive heart failure, and shortness of breath, among other common complaints. Altogether there are 14 protocols, which account for more than half of the conditions seen in the ED. Initially there was resistance from many staff members to these new care protocols, but having a few key staff champions helped spread acceptance of this new care concept. Results/Impact:Results/Impact:Results/Impact:Results/Impact: In the two years following San Antonio Community Hospital’s adoption of standard care protocols, the left without being seen rate dropped from 4.2 percent to 2.4 percent. Patient satisfaction improved significantly, from the 33rd percentile to the 84th percentile. Additionally, wait times improved, with the door-to-triage time dropping from 30 to 18 minutes, the door-to-treatment time dropping from 111 to 40 minutes, and the average wait time for patient beds decreasing from 4 to 2.5 hours.
Best PrBest PrBest PrBest Practice Initiative: Standard Care Protocols actice Initiative: Standard Care Protocols actice Initiative: Standard Care Protocols actice Initiative: Standard Care Protocols
Hospital Name:Hospital Name:Hospital Name:Hospital Name: San Antonio Community Hospital Address:Address:Address:Address: 999 San Bernardino Road Upland, CA 91786 Contact:Contact:Contact:Contact: Steve Ernst, MD Emergency Department Medical Director (909) 985-2811 2006 ED Volume: 59,979 Growth from 2005: -1.1% Total Staffed Hospital Beds: 308 Acute ED Beds: 23 Fast Track: No Clinical Decision Unit: No Problem Problem Problem Problem to be Resolved:to be Resolved:to be Resolved:to be Resolved: Long wait times in the ED. Key Words:Key Words:Key Words:Key Words: � Wait time � Electronic records � Standard Care Protocols Lessons Learned:Lessons Learned:Lessons Learned:Lessons Learned: The time that patients spend waiting doesn’t have to be wasted; it can instead be used to begin the course of treatment.
California ED Diversion Project Study – Appendix
36 | Supported by the California HealthCare Foundation, based in Oakland, California.
Best Practice Initiative – Code Capacity Program (Hallway Beds) Loma Linda University Medical Center The Code Capacity Program from Loma Linda University Medical Center provides a procedure to rapidly decompress the Emergency Department when the entire ED is occupied with patients and admitted adult ED patients have been awaiting in-house placement for two hours and admitted patients being held in the ED prohibits the safe and timely evaluation and treatment of incoming patients to the ED. In the event hospital bed utilization has been maximized, the admitted ED adult patients already awaiting in-house acute care bed assignments will be admitted immediately to acute care units. If a bed is not immediately available; the patients will be placed in inpatient unit hall beds. Invoking code capacity includes a Pre-Code Capacity warning phase to alert inpatient areas to implement actions to make admission beds available. The alert starts with ED notification to bed placement administration. If the critical condition in the ED is not relieved within 30 minutes of the warning page, then the Attending Physician, the ED RN Supervisor/Charge Nurse and the Director on-call declare the need to implement the Hospital Full Capacity Protocol. Guidelines for code capacity activation, patient selection, and transport are in place to ensure patient safety. Each inpatient unit management team developed a unit specific response and staff education. The process is evaluated using a standard tool that identifies successes and barriers to provide data and information to improve the process.

WHAT is CODE CAPACITY? • Code capacity is a way to address high census in Uni-versity Hospital as well as
critical saturation in the ED • Includes selective use of hallway beds on adult in-patient units
HOW DOES CODE CAPACITY WORK?
Using established criteria, ED calls Pre-Code Capacity when saturation nears capacity
ALL adult unit Charge Nurses (CN) notified
CN initiates Unit Admission Algorithm
ED continues to admit patients
Code Capacity declared by ED Director, ED
Charge RN & Administration
Patient Placement notifies unit CN about required admission
Unit RN receives report from ED RN
Arrival of the patient by
dispatch (non-telemetry patients) or CCST (telemetry patients)
Patient cared for in the hallway of the unit by
staff working to provide the utmost observation, care & privacy
until appropriate bed is available
Code Capacity
in
University Hospital
Page 1 of 2
Special Notes:
Each unit receives only 1 hallway patient!
Hallway patients may be
transfers from ICU to make room for critical ED patients

Resources... • A “Code Capacity Packet” is located in the gray disaster box on each unit. This packet con-
tains explanations and critique forms.
• Extra supplies and equip-ment are available through Central Service
• Ellen McCarville, Director of Patient Flow, UH, Pager 3844
Criteria for hallway patients: • Stable • Non-isolation • Acute or Intermediate Level of Care Criteria for space in which patients are placed: • Able to observe patient (no call light provided) • Electric plugs • Privacy curtains • Portable oxygen, suction, telemetry, IV
pumps, etc., as necessary • Bathroom accessible in nearby room, to be
shared with existing patients How does one care for this patient? • These patients are provided with the same
care as any other patient • Ancillary services (i.e. Nutrition, Pharmacy,
Clinical Lab, Therapies) provided as prescribed • Explanation of bed status provided to patients and their families • Documentation performed on standard
forms; to allow for this documentation, pa-tient placed in a 98-01 bed in CHAIS
Code Capacity
in
University Hospital
Ellen McCarville, RN, MS Director, Patient Flow Ext. 15053, Pager 3844 Intershift Education EAS# INSV00051 July 2008 Page 2 of 2
Once patient is moved to a unit bed and code capacity is
complete, please fill out a critique
form and turn in to your unit management

California ED Diversion Project Study – Appendix
39 | Supported by the California HealthCare Foundation, based in Oakland, California.
Hospital Full Capacity Clinical Protocol - Code Capacity
Loma Linda University Medical Center
Hospital Full Capacity Protocol – Code Capacity provides a procedure to rapidly decompress the Emergency Department (ED) when the entire ED is occupied with patients and admitted adult ED patients have been awaiting in-house placement for two (2) hours AND the number of admitted patients being held in the ED has prohibited the safe and timely evaluation and treatment of incoming patients to the ED. A.A.A.A. Preparation:
1. Each inpatient unit management team is responsible to develop a unit specific Code Capacity plan and to educate staff as to this plan. This plan identifies actions to be taken prior to Code Capacity activation to facilitate placement of patients. This plan also includes placement of patients in hall beds if other bed options are not immediately available when Code Capacity is implemented.
2. In the event hospital bed utilization has been maximized, the admitted ED adult patients
already awaiting in-house acute care bed assignments will be admitted immediately to acute care units. If a bed is not immediately available; the patients will be placed in inpatient unit hall beds.
B.B.B.B. Criteria for initiating Code Capacity:
1. The following conditions exist in the ED:
a. Waiting rooms and triage holding have greater than 10 patients AND b. Greater than 15 minutes wall time for ambulance patients in ED OR c. 10 or more admit holds in ED.
C.C.C.C. Procedure for Initiating Code Capacity:
1. Pre-Code Capacity Warning: After conferring with the ED attending physician, ED charge nurse notifies the Patient placement, MC House Supervisors when present and EC House Supervisor.
2. Patient Placement and ED House Supervisor provide a warning page to the Unit Managers and Unit Charge nurses/Team Leaders of impending Code Capacity implementation.
3. If the critical condition in the ED is not relieved within 30 minutes of the warning page, then
the Attending Physician, the ED RN Supervisor/Charge Nurse and the Director on-call declare the need to implement the Hospital Full Capacity Protocol (Code Capacity).
a. The Nursing Director and/or House supervisor through an email notification informs
Administrator on-call of Code Capacity activation.
4. If approved, the House Supervisor/Patient Placement notified the Unit Managers and Charge Nurse/Team Leaders that Code Capacity is in effect and to prepare for patients.

California ED Diversion Project Study – Appendix
40 | Supported by the California HealthCare Foundation, based in Oakland, California.
5. CCST and Dispatch are notified to allow preparation for assistance with transport of patients to the units.
D.D.D.D. Protocols for Hall Bed Placement:
1. Guidelines:
a. The placement of patients in inpatient units is assigned by the Patient Placement Coordinator in collaboration with Emergency Department Charge Nurse.
b. Each designed unit may receive one (1) patient. (No unit may have more than one hall
bed patient).
• Designated Units are: UH: 4100, 6100, 6200, 6300, 7300, 8200, 8300, 9200. EC: 1200, 1300.
c. Nursing report must be accepted at the time requested by the ED nurse.
d. If RN not required, patients are transported via dispatch immediately to the unit.
e. If RN required for transport, CCST is available to assist with transport of patients requiring
monitoring up to the unit.
f. Patients admitted to hallways on in-patients units are placed as much as possible according to service.
g. Unoccupied acute floor beds are utilized before hall beds are used.
h. Exception: Patients admitted to EC hallway beds may remain on EC and not be
transported back to MC unless clinical condition warrants transfer.
i. Hallway patients need not be admitted to the unit on which they are boarding.
j. Telemetry patients may only be assigned to inpatient hall beds after approval of the ED Attending Physician and it has been confirmed that the receiving units has a telemetry box and a central monitoring slot OR a portable monitor that can be closely monitored.
k. Adult patients less than 21 years of age may be considered for placement on a Pediatric
Unit.
2. Priorities: a. Non-Telemetry patients with low co-morbidity are first considered for all bed placement.
b. Non-Telemetry patients with low to moderate risk factors co-morbidity are the second
patient population to be considered for all beds.
c. Patients admitted on or for Telemetry monitoring with low co-morbidity and with minimal index of suspicion for a cardiac event.
3. Exceptions:

California ED Diversion Project Study – Appendix
41 | Supported by the California HealthCare Foundation, based in Oakland, California.
a. Patients on acute units may not be moved to hall beds in order to make room for patients admitted from the ED.
4. Hall Bed Exclusions:
a. Patients requiring the Intensive Care Unit may not be placed in hall beds.
b. Patients requiring minimal oxygen (less than 4 l/min via Nasal Cannula) will arrive to the unit hall bed assigned with a full tank of 02. (Any equipment exchange is prearranged prior to transporting the patient.)
c. Patients on ventilators may not be placed in hall beds.
d. Patients requiring Isolation or negative pressure room placement may not be place din hall
beds.
e. Patients that require frequent suctioning are not candidates for hall bed placement.
f. Patients who have ruled-in for MI may not go to a hall bed.
5. If hall bed placement has been maximized (1 per unit) and the ED is still at full capacity, the administrator on call and the Medical Director are notified and make decisions regarding deferral of elective and urgent cases.
6. Unit Code Capacity is cleared, the Transfer Center works with the administrator on call to
determine if LLUMC continues to accept incoming transfer requests for higher level of care.
E.E.E.E. Discontinuation of Code Capacity:
1. Requirement for discontinuation: a. All unit hall bed placements have been maximized (1 per unit), OR b. The ED no long needs hall bed placements, AND c. ED Attending Physician, the Charge Nurse and the Director on call agree to
discontinue the Code Capacity Protocol.
2. Upon discontinuation of Code Capacity protocol, Patient Placement and the ED House Supervisor are to be notified.
Section 1.01
3. Patient Placement and EC House Supervisor are to notify the Nurse Managers, Unit Charge RN/Team leaders, CCST and Dispatch of discontinuation.

California ED Diversion Project Study – Appendix
42 | Supported by the California HealthCare Foundation, based in Oakland, California.
Code Capacity Feedback ToolCode Capacity Feedback ToolCode Capacity Feedback ToolCode Capacity Feedback Tool Date of Code Capacity: _______________ Unit: _______________ Patient admitted to hall bed: Yes No Received Notification of Code Capacity activation: Yes No Received Notification of Patient Assignments: Yes No Received Report from ED for Patient Assigned: Yes No Patient received to unit in gurney/bed: Yes No Orders able to be “implemented” for patient assigned: Yes No What was required to ensure proper care of the patient? (what care issues had to be worked out for care in the hallway, i.e 02, monitor, etc..) _________________________________________________________________________________________________________________________________________________________________________________________________________________________________________________________________________________________________________________________________________________________________________________________________________________________________________ Barriers identified in Code Capacity: _________________________________________________________________________________________________________________________________________________________________________________________________________________________________________________________________________________________________________________________________________________________________________________________________________________________________________ Ideas for Improvement in Code Capacity _________________________________________________________________________________________________________________________________________________________________________________________________________________________________________________________________________________________________________________________________________________________________________________________________________________________________________

California ED Diversion Project Study – Appendix
43 | Supported by the California HealthCare Foundation, based in Oakland, California.
Specific Collaborative Evaluation CommentsSpecific Collaborative Evaluation CommentsSpecific Collaborative Evaluation CommentsSpecific Collaborative Evaluation Comments
Collaborative Evaluation CommentsCollaborative Evaluation CommentsCollaborative Evaluation CommentsCollaborative Evaluation Comments
Please rate the impact of the project's Collaborative on diversion and hospital capacity for your organization based on your organization's overall goals and expectations.
Decrease diversion rates but increase bed delay hours. We have changed our focus on flow being an ED issue to a hospital issue
This project served to create "pressure" on upper management to implement changes at my facility. It also opened a door with the EMSA for us
I got a lot of great ideas we can use for our ED
Looking more at ED processes
Fit into our current goals and strategies. Already had a patient flow team so this enhanced improvement activities
As working for EMS unable to directly change hospital practice - EMS not able to unilaterally change policy Not sure how to answer - diversion decreased among three hospitals but doesn't specifically apply to EMS Agency's task
This project has brought about a heightened awareness of ED impaction on patient care which has resulted in greater collaboration among nurses and nurse managers
There were processes started prior to joining the project
We have shared a learned from our colleagues. Great ideas and solutions
We did very well at the high level goals but I think we weren't able to breakthrough some of the ED internal barriers The project gave us tools and ideas for improvement for discussing ED diversion, improve ED and hospital throughput We were able to decrease ED diversion and decrease the amount of patient LWBS…This was putting the hospital at risk
Our facility did not have an inpatient champion
We already had most of these goals establishes prior to this project. Maybe has shifted focus off ED as it’s our problem to some degree. ED leadership still ones keeping goals focused
Will your organization continue to use some of the tools you learned or that were provided?
Loved using the HIT approach - also learned of other initiatives we would like to try but haven't had time yet
Will continue to closely monitor and report diversion and wall time data. Will continue to work on getting a trial of no diversion in the County
We plan to continue collecting wall time data
Bed rounds - communication link to Admin
We have already implemented some changes
Excellent sharing between hospitals
The RAU has helped the impaction in the ED; We have a strong HIT membership who are charged with ensuring a more efficient patient throughput
We will continue data collection
Throughput-initiative meetings - COO involved and champion
How would you rate the Collaborative’s faculty?
Pam was always helpful, she always had a possible solution or an idea to share
It was a pleasure working with Pam
All went above in trying to assist us
Thank you Pam
Would like to have had more guidance on site in the beginning
Excellent staff
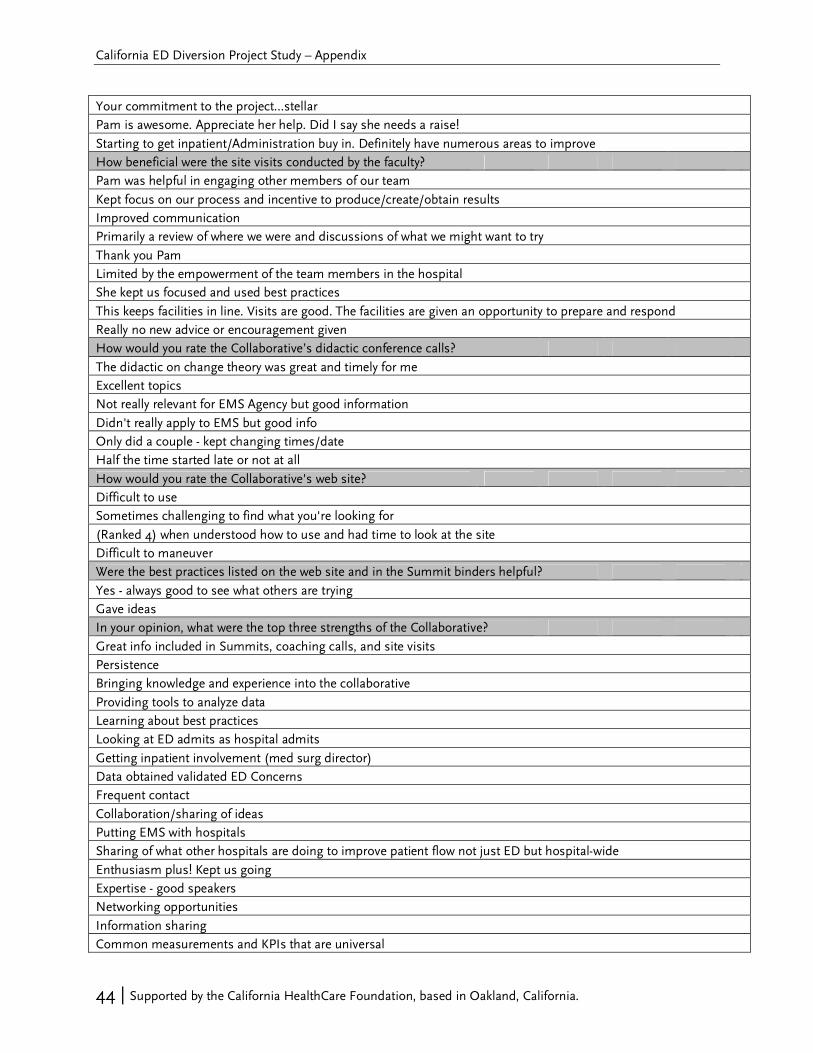
California ED Diversion Project Study – Appendix
44 | Supported by the California HealthCare Foundation, based in Oakland, California.
Your commitment to the project…stellar
Pam is awesome. Appreciate her help. Did I say she needs a raise!
Starting to get inpatient/Administration buy in. Definitely have numerous areas to improve
How beneficial were the site visits conducted by the faculty?
Pam was helpful in engaging other members of our team
Kept focus on our process and incentive to produce/create/obtain results
Improved communication
Primarily a review of where we were and discussions of what we might want to try
Thank you Pam
Limited by the empowerment of the team members in the hospital
She kept us focused and used best practices
This keeps facilities in line. Visits are good. The facilities are given an opportunity to prepare and respond
Really no new advice or encouragement given
How would you rate the Collaborative’s didactic conference calls?
The didactic on change theory was great and timely for me
Excellent topics
Not really relevant for EMS Agency but good information
Didn't really apply to EMS but good info
Only did a couple - kept changing times/date
Half the time started late or not at all
How would you rate the Collaborative's web site?
Difficult to use
Sometimes challenging to find what you're looking for
(Ranked 4) when understood how to use and had time to look at the site
Difficult to maneuver
Were the best practices listed on the web site and in the Summit binders helpful?
Yes - always good to see what others are trying
Gave ideas
In your opinion, what were the top three strengths of the Collaborative?
Great info included in Summits, coaching calls, and site visits
Persistence
Bringing knowledge and experience into the collaborative
Providing tools to analyze data
Learning about best practices
Looking at ED admits as hospital admits
Getting inpatient involvement (med surg director)
Data obtained validated ED Concerns
Frequent contact
Collaboration/sharing of ideas
Putting EMS with hospitals
Sharing of what other hospitals are doing to improve patient flow not just ED but hospital-wide
Enthusiasm plus! Kept us going
Expertise - good speakers
Networking opportunities
Information sharing
Common measurements and KPIs that are universal
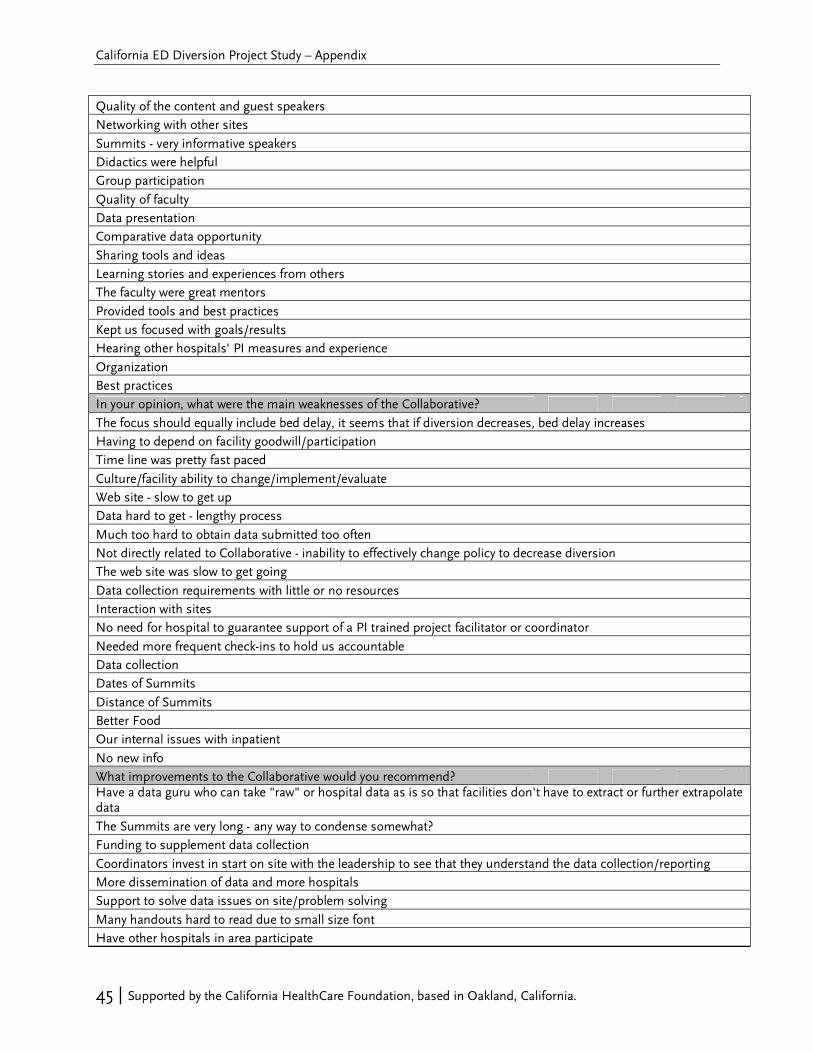
California ED Diversion Project Study – Appendix
45 | Supported by the California HealthCare Foundation, based in Oakland, California.
Quality of the content and guest speakers
Networking with other sites
Summits - very informative speakers
Didactics were helpful
Group participation
Quality of faculty
Data presentation
Comparative data opportunity
Sharing tools and ideas
Learning stories and experiences from others
The faculty were great mentors
Provided tools and best practices
Kept us focused with goals/results
Hearing other hospitals' PI measures and experience
Organization
Best practices
In your opinion, what were the main weaknesses of the Collaborative?
The focus should equally include bed delay, it seems that if diversion decreases, bed delay increases
Having to depend on facility goodwill/participation
Time line was pretty fast paced
Culture/facility ability to change/implement/evaluate
Web site - slow to get up
Data hard to get - lengthy process
Much too hard to obtain data submitted too often
Not directly related to Collaborative - inability to effectively change policy to decrease diversion
The web site was slow to get going
Data collection requirements with little or no resources
Interaction with sites
No need for hospital to guarantee support of a PI trained project facilitator or coordinator
Needed more frequent check-ins to hold us accountable
Data collection
Dates of Summits
Distance of Summits
Better Food
Our internal issues with inpatient
No new info
What improvements to the Collaborative would you recommend? Have a data guru who can take "raw" or hospital data as is so that facilities don't have to extract or further extrapolate data
The Summits are very long - any way to condense somewhat?
Funding to supplement data collection
Coordinators invest in start on site with the leadership to see that they understand the data collection/reporting
More dissemination of data and more hospitals
Support to solve data issues on site/problem solving
Many handouts hard to read due to small size font
Have other hospitals in area participate

California ED Diversion Project Study – Appendix
46 | Supported by the California HealthCare Foundation, based in Oakland, California.
What is your overall satisfaction with the Collaborative?
I appreciate very much having the opportunity to be challenged and have the support to implement change
We enjoyed being part of this
Well done
Please tell us in your own words about your experience with the Collaborative Today I am realizing the incredible value I have received by opening channels of communication with the other two participating hospitals in my county. This would not have happened without the Collaborative's assistance and leadership
Great networking opportunities and encouragement to try new things!
This has been an enriching process both personally and professionally. Although we are not there, our organization has shown improvement in our care processes as a result of the change
I learned a lot and we changed a lot for the better
I believe in it strongly but was very busy with hospital priorities; I think we needed more internal structure
It helped our organizations achieve and improve our processes
Data collection and submission

700 Ygnacio Valley Road, Suite 270 Walnut Creek, CA. 94596
Tel: (925) 933-0911 Fax: (925) 946-0911
abarisgroup.com