california department of education school...
TRANSCRIPT

California Department of Education School Accountability Report Card
Reported Using Data from the 2014-2015 School Year Published During 2015_2016
For: Franklin High School
Address: 6400 Whitelock Parkway, Elk Grove CA, 95757 Phone: (916) 714-8150Principal: Chantelle Albiani Grade Span: 9-12
By February 1 of each year, every school in California is required by state law to publish a School Accountability Report Card (SARC). The SARC contains information about the condition and performance of each California public school. Under the Local Control Funding Formula (LCFF) all local educational agencies (LEAs) are required to prepare a Local Control Accountability Plan (LCAP), which describes how they intend to meet annual school-specific goals for all pupils, with specific activities to address state and local priorities. Additionally, data reported in an LCAP is to be consistent with data reported in the SARC.
For more information about SARC requirements, see the California Department of Education (CDE) SARC Web page at http://www.cde.ca.gov/ta/ac/sa/.
For more information about the LCFF or LCAP, see the CDE LCFF Web page athttp://www.cde.ca.gov/fg/aa/lc/.
For additional information about the school, parents and community members should contact the school principal or the district office.
DataQuestDataQuest is an online data tool located on the CDE DataQuest Web page at http://dq.cde.ca.gov/dataquest/ that contains additional information about this school and comparisons of the school to the district, the county, and the state. Specifically, DataQuest is a dynamic system that provides reports for accountability (e.g., test data, enrollment, high school graduates, dropouts, course enrollments, staffing, and data regarding English learners.
Internet AccessInternet access is available at public libraries and other locations that are publicly accessible (e.g., the California State Library). Access to the Internet at libraries and public locations is generally provided on a first-come, first-served basis. Other use restrictions may include the hours of operation, the length of time that a workstation may be used (depending on availability), the types of software programs available on a workstation, and the ability to print documents.

About This SchoolDistrict Contact Information (School Year 2015_2016)
School Contact Information (School Year 2015_2016)
School Description and Mission Statement (School Year 2015_2016)
District Name Elk Grove Unified
Phone Number (916) 686-5085
Web Site www.egusd.net
Superintendent Christopher R. Hoffman
E-mail Address [email protected]
School Name Franklin High School
Street 6400 Whitelock Parkway
City, State, Zip Elk Grove CA, 95757
Phone Number (916) 714-8150
Principal Chantelle Albiani
E-mail Address [email protected]
Web Site http://fhs.schoolloop.com/
County-District-School(CDS) Code 34673143430873
Franklin High School, the sixth comprehensive high school in the Elk Grove Unified School District, prides itself on providing students a multitude of opportunities to be successful. With a unique schedule, the school is able to offer a variety of AP and elective courses to motivate and challenge students in an array of subject areas. Franklin High School has also established a collaborative environment that includes a strong communication with Toby Johnson Middle School. The schools share the 19,000 square foot Franklin Community Library, which is operated in partnership with the Sacramento County Library system.
The school wide focus is to continue to offer challenging course work that will prepare students for college and/or career pathways. The success of Franklin has continued with another 5 point raise in their API score. This is accomplished through standards-based instruction, using student achievement data to drive instruction, and culturally responsive teaching.
Franklin High School students are encouraged to enroll in rigorous courses and are supported through multiple opportunities to connect with the school. With over 60 clubs, competitive athletic teams, and accomplished extra-curricular activities, the students and their families are encouraged to be involved in the four-year academic environment. Franklin's comprehensive academic guidance and support programs support students in achieving their post-secondary college and career goals.
Chantelle Albiani, PrincipalFranklin High School

Student Enrollment by Grade Level (School Year 2014-2015)
School Enrollment by Student Group (School Year 2014-2015)
Grade Level Number of StudentsKindergarten 0
Grade 1 0
Grade 2 0
Grade 3 0
Grade 4 0
Grade 5 0
Grade 6 0
Grade 7 0
Grade 8 0
Ungraded Elementary 0
Grade 9 690
Grade 10 652
Grade 11 743
Grade 12 682
Ungraded Secondary 0
Total Enrollment 2767
Student Group Percent ofTotal Enrollment
Black or African American 14.60%
American Indian or Alaska Native 0.50%
Asian 27.20%
Filipino 11.10%
Hispanic or Latino 19.30%
Native Hawaiian or Pacific Islander 1.00%
White 20.60%
Two or More Races 5.80%
Socioeconomically Disadvantaged 36.10%
English Learners 4.60%
Students with Disabilities 6.10%
Foster Youth 0.40%

A. Conditions of Learning State Priority: Basic
The SARC provides the following information relevant to the Basic State Priority (Priority 1):
Degree to which teachers are appropriately assigned and fully credentialed in the subject area and for the pupils they are teaching;
Pupils have access to standards-aligned instructional materials; and
School facilities are maintained in good repair.
Teacher Credentials
Teacher Misassignments and Vacant Teacher Positions
Note: "Misassignments" refers to the number of positions filled by teachers who lack legal authorization to teach that grade level, subject area, student group, etc.
* Total Teacher Misassignments includes the number of Misassignments of Teachers of English Learners.
Core Academic Classes Taught by Highly Qualified Teachers (School Year 2014 - 15)
Note: High-poverty schools are defined as those schools with student eligibility of approximately 40 percent or more in the free and reduced price meals program. Low-poverty schools are those with student eligibility of approximately 39 percent or less in the free and reduced price meals program.
Teachers School2013-14
School2014-15
School2015-16
District2015-16
With Full Credential 120 116 117 3021
Without Full Credential 0 0 0 21
Teaching Outside Subject Area of Competence (with full credential) 3 0 0 49
Indicator 2013-14 2014-15 2015-16Misassignments of Teachers of English Learners 0 0 1
Total Teacher Misassignments* 3 0 1
Vacant Teacher Positions 0 0 0
Location of Classes Percent of Classes In Core
Academic SubjectsTaught by
Highly Qualified Teachers
Percent of Classes In CoreAcademic Subjects
Not Taught byHighly Qualified Teachers
This School 100% 0%
All Schools in District 97.5% 2.5%
High-Poverty Schools in District 98.83% 1.17%
Low-Poverty Schools in District 95.87% 4.13%

Quality, Currency, and Availability of Textbooks and Instructional Materials (School Year 2015_2016)
All students, including English learners, have sufficient textbooks to use at school and to take home in the following subject areas.
Date of Public Hearing on Sufficiency: August 18 and September 1, 2015Year and month in which data were collected: August 18, 2015
Subject Textbooks and Instructional Materials/year of Adoption
From Most
Recent Adoption?
Percent Students Lacking
Own Assigned
Copy
Reading/Language Arts All English/Language Arts books are provided one per student.
0
Open Court Reading Program by SRA/McGraw Hill © 2002 in grades K-6. This program is from the current SBE adoption. The following materials are provided one per student by grade level:
K- Sounds & Letters Workbook, Pre-decodable book. 1st- Phonics Skills Workbook, Comprehension & ELA Skills Workbook, Decodable book, Anthology 1, Anthology 22nd - Comprehension & ELA Skills Workbook, Decodable book, Spelling & Vocabulary Skills Workbook, Anthology 1, Anthology 23rd- Comprehension & ELA Skills Workbook, Spelling & Vocabulary Skills Workbook, Anthology 1, Anthology 24th-6th - Spelling & Vocabulary Skills Workbook, Anthology
2002 SBE adoptionAdopted EGUSD 2003
No 0
Literature & Language Arts by HRW © 2003 in grades 7-8. This program is from the current SBE adoption. The following materials are provided one per student by grade level:
7th-8th - Student Edition
2002 SBE adoptionAdopted EGUSD 2003
No 0
Literature & Language Arts by HRW © 2003 in grades 9-12. All textbooks are from the most recent adoption of the local governing Board of Education. The following materials are provided one per student by grade level:
9th-12th - Student Edition
Adopted EGUSD 2003
Yes 0
AP English books by multiple publishers in grades 11-12. All textbooks are from the most recent adoption of the local governing Board of Education. The following materials are provided one per student by grade level:
AP Courses:
11th - Language of Composition, Bedford/St. Martins ©2008
12th - Bedford Introduction to Literature, V.H.P.S. ©2008
Adopted EGUSD 2003
Yes 0
IB English books by multiple publishers in grades 11-12. All textbooks are from the most recent adoption of the local governing Board of Education. The following materials are provided one per student by grade level:
IB Courses:
Literature & Language Arts, course #5 by HRW © 2003; Bedford Introduction to Literature, V.H.P.S. © 2008; Theory of Knowledge , Cambridge University
Yes 0
Press © 2009
Adopted EGUSD 2003
Adopted EGUSD 2003
Adopted EGUSD 2010
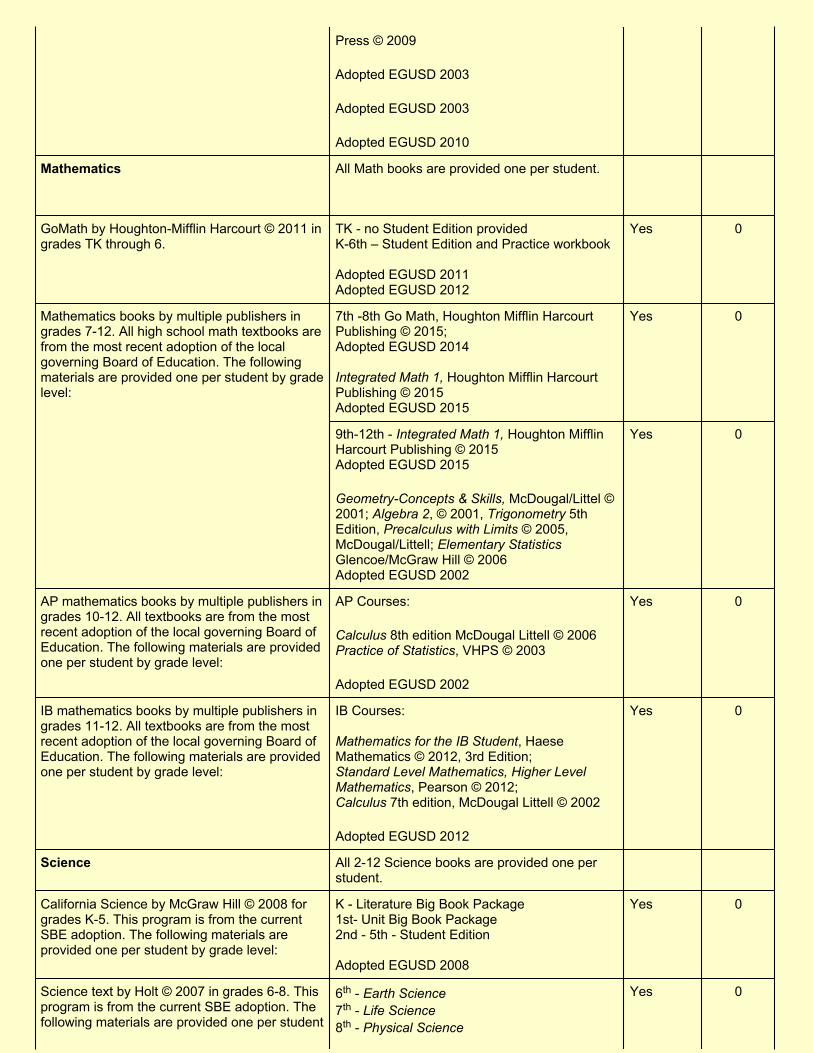
Mathematics All Math books are provided one per student.
GoMath by Houghton-Mifflin Harcourt © 2011 in grades TK through 6.
TK - no Student Edition providedK-6th – Student Edition and Practice workbook
Adopted EGUSD 2011 Adopted EGUSD 2012
Yes 0
Mathematics books by multiple publishers in grades 7-12. All high school math textbooks are from the most recent adoption of the local governing Board of Education. The following materials are provided one per student by grade level:
7th -8th Go Math, Houghton Mifflin Harcourt Publishing © 2015;Adopted EGUSD 2014
Integrated Math 1, Houghton Mifflin Harcourt Publishing © 2015Adopted EGUSD 2015
Yes 0
9th-12th - Integrated Math 1, Houghton Mifflin Harcourt Publishing © 2015Adopted EGUSD 2015
Geometry-Concepts & Skills, McDougal/Littel © 2001; Algebra 2, © 2001, Trigonometry 5th Edition, Precalculus with Limits © 2005, McDougal/Littell; Elementary StatisticsGlencoe/McGraw Hill © 2006Adopted EGUSD 2002
Yes 0
AP mathematics books by multiple publishers in grades 10-12. All textbooks are from the most recent adoption of the local governing Board of Education. The following materials are provided one per student by grade level:
AP Courses:
Calculus 8th edition McDougal Littell © 2006 Practice of Statistics, VHPS © 2003
Adopted EGUSD 2002
Yes 0
IB mathematics books by multiple publishers in grades 11-12. All textbooks are from the most recent adoption of the local governing Board of Education. The following materials are provided one per student by grade level:
IB Courses:
Mathematics for the IB Student, Haese Mathematics © 2012, 3rd Edition; Standard Level Mathematics, Higher Level Mathematics, Pearson © 2012; Calculus 7th edition, McDougal Littell © 2002
Adopted EGUSD 2012
Yes 0
Science All 2-12 Science books are provided one per student.
California Science by McGraw Hill © 2008 for grades K-5. This program is from the current SBE adoption. The following materials are provided one per student by grade level:
K - Literature Big Book Package 1st- Unit Big Book Package 2nd - 5th - Student Edition
Adopted EGUSD 2008
Yes 0
Science text by Holt © 2007 in grades 6-8. This program is from the current SBE adoption. The following materials are provided one per student
6th - Earth Science7th - Life Science8th - Physical Science
Yes 0

by grade levelAdopted EGUSD 2008
Science books by multiple publishers in grades 9-12. All textbooks are from the most recent adoption of the local governing Board of Education. The following materials are provided one per student by grade level:
Earth Science, Prentice Hall © 2006 Concepts and Challenges in Earth Science, Pearson/Globe Fearon © 2003 (supplemental for English Learners)Biology: Dynamics of Life, Glencoe/McGraw Hill © 2000; Physics © 1999, Biochemistry © 2000, Environmental Science © 2005, Foundations in Microbiology © 2005, McGraw Hill; Modern Biology, Modern Chemistry, HRW © 1999; Astronomy Today © 2002, Essentials in Geology © 2000, Fundamentals of Anatomy & Physiology © 2006, Criminalistics © 2004, Biotechnology: Science for the New Millennium© 2006, Prentice Hall; Learning Agriscience: Fundamentals & Applications © 2004, Agriscience & Technology © 1998, Delmar/Thompson; Conceptual Physics, Addison Wesley © 1998; Recombinant DNA & Biotechnology, American Society © 1996
Adopted EGUSD 2008
Adopted EGUSD 2000
Yes 0
AP science books by multiple publishers in grades 9-12. All textbooks are from the most recent adoption of the local governing Board of Education. The following materials are provided one per student by grade level:
AP Courses:
Biology by Campbell, Pearson © 2011; Chemistry: A Molecular Approach, Pearson © 2014; College Physics, 9th Ed., Cengage © 2012
Adopted EGUSD 2012 Adopted EGUSD 2013 Adopted EGUSD 2014
Yes 0
IB science books by multiple publishers in grades 11-12. All textbooks are from the most recent adoption of the local governing Board of Education. The following materials are provided one per student by grade level:
IB Courses:
Higher Level Biology 2nd Edition, Pearson © 2014; Standard Level Chemistry 2nd Edition, Pearson © 2014; Higher Level Chemistry 2nd Edition, Pearson © 2014; Adopted EGUSD 2015
College Physics, 9th Edition, Cengage © 2012; Adopted EGUSD 2014
Supplemental for English Learners:
Earth Science, AGS Globe/Pearson, © 2003 Adopted EGUSD 2008
Yes
Yes
0
History-Social Science All 1-12 History-Social Science books are provided one per student.
California Reflections by Harcourt Brace © 2007 in K-5 grades. This program is from the current SBE adoption. The following materials are provided one per student by grade level:
K- Our World: Now and Long Ago, California Big Book1st - A Child's View2nd - People We Know3rd - Our Community4th - California: A Changing State5th - The United States: Making a Nation
Yes 0

Adopted EGUSD 2007
Holt © 2006 in 6-8 grades. This program is from the current SBE adoption. The following materials are provided one per student by grade level:
6th - Ancient Civilizations7th - Medieval to Early Modern Times8th - United States History
Adopted EGUSD 2007
Yes 0
Social science books by multiple publishers in grades 9-12. All high school textbooks are from the most recent adoption of the local governing Board of Education. The following materials are provided one per student by grade level:
World Geography and Cultures, Understanding Psychology, Glencoe © 2008; Modern World History - Patterns of Interaction, McDougal Littell© 2006; American Anthem- Modern American History, HRW © 2007; Magruder's American Government © 2006, Economics - Principles in Action © 2007, Prentice/Pearson
Adopted EGUSD 2008
Yes 0
AP social science books by multiple publishers in grades 10-12. All high school textbooks are from the most recent adoption of the local governing Board of Education. The following materials are provided one per student by grade level:
AP Courses
The Earth and Its Peoples - A Global History, The American Pageant, Houghton/Mifflin © 2006; Government in America- People, Politics, and Policy, Prentice/Pearson © 2008; Comparative Politics, Thompson/Wadsworth © 2006; Economics AP Edition, McGraw-Hill © 2008; Psychology by Allyn & Bacon, Pearson © 2007
Adopted EGUSD 2008
Yes 0
IB social science books by multiple publishers in grades 11-12. All high school textbooks are from the most recent adoption of the local governing Board of Education. The following materials are provided one per student by grade level:
IB Courses:
History of the Americas © 2011, 20th Century World History © 2009, Oxford University Press
Adopted EGUSD 2012
Yes 0
Supplemental for English Learners
World Geography & Cultures © 2002, World History © 2008, US History © 2004, American Government © 2001, Economics © 2001 , Pacemaker Series, AGS Globe Fearon
Adopted EGUSD 2008
Yes 0
Foreign Language All 7-12 World language books are provided one per student.
World language books by multiple publishers in grades 7-12. All textbooks are from the most recent adoption of the local governing Board of Education.
Realidades I, II, III, IV, Pearson © 2014;Bien dit! I, II, III, HMH © 2013; Intrigue 3rd Edition, Pearson © 2011; Adventures in Japanese III, Cheng & Tsui, © 2004; Adopted EGUSD 2000
Haruichiban and Ginga, Kisetsu, © 2014; Deutsch Aktuell I, II, III, EMC-Paradigm, © 2010Adopted EGUSD 2014
Yes 0
AP world language books by multiple publishers AP Courses: Yes 0

in grades 9-12. All high school textbooks are from the most recent adoption of the local governing Board of Education.
Abriendo Puertas, McDougal Littell © 2003; Temas, Vista Higher Learning © 2014.Intrigue 3e, Pearson © 2011Yookoso!, McGraw-Hill © 2006Kaleidoskop, Houghton Mifflin © 2007
Adopted EGUSD 2000 Adopted EGUSD 2007 Adopted EGUSD 2008Adopted EGUSD 2014
IB world language books by multiple publishers in grades 11-12. All high school textbooks are from the most recent adoption of the local governing Board of Education.
IB Courses:
Manana, LeMonde de Francais, Advanced Materials © 2011;Adventures in Japanese III, Cheng & Tsui © 2004; Yookoso! McGraw-Hill ©2006; Abriendo pasa Grammatica, Pearson © 2014
Adopted EGUSD 2000 Adopted EGUSD 2007Adopted EGUSD 2012 Adopted EGUSD 2014
Yes 0
Visual and Performing Arts
All 7th - 12th school textbooks are from the most recent adoption of the local governing Board of Education.
7th-8th: Exploring Visual Design, Davis ©2000; Exploring Theatre, McGraw-Hill ©1997
Adopted EGUSD 2000
Yes 0
9-12th: Art in Focus © 2000, The Stage & the School © 2005, Art Talk © 2005, Glencoe; Exploring Painting © 2003, The Visual Experience © 2005, Photographic Eye © 1995, Davis Publ.; Make It In Clay © 2000, Hands in Clay © 2004, Theatrical Design & Production, Play Production Today © 2005, McGraw-Hill; Black and White Photography © 2002, Jazz Dance Today © 1994, West Publ.; Choreography © 1997, A Sense of Dance © 2005, Human Kinetic; Playing Contemporary Scenes, Merwetter © 1996; Dance - the Art of Production, Princeton © 1995
Adopted EGUSD 2000
Yes 0
AP Visual and Performing Arts books by multiple publishers in grades 9-12. All high school textbooks are from the most recent adoption of the local governing Board of Education.
AP Courses:
Gardner's Art Through the Ages, Thomson/Wadsworth ©2005; Music in Theory & Practice, Glencoe ©2003; Art Context & Criticism, Brown & Benchmark © 1996
Adopted EGUSD 2000
Yes 0
Health All 9-12 Health books are provided one per student.
All high school textbooks are from the most recent adoption of the local governing Board of Education.
Health, Glencoe © 2004
Adopted EGUSD 2004
Yes 0
Science Laboratory Equipment (grades 9-12) All 9-12 students utilizing a lab have access to appropriate equipment.

School Facility Conditions and Planned Improvements (School Year 2015_2016)
School Facility Good Repair Status (School Year 2015_2016) Using the most recent FIT data (or equivalent), provide the following:
Determination of repair status for systems listed Description of any needed maintenance to ensure good repair The year and month in which the data were collected The overall rating
Date of facilities inspection: 10/12/2015
Our school facility opened in August, 2002. Our school has 90 classrooms, multipurpose room, a shared library with Toby Johnson Middle School and the Sacramento Public Library, computer classrooms, student services and administration building. Our Athletic program uses the Franklin High School/Cosumnes Oaks community stadium for soccer, track, and football games. Parents and visitor report that our campus is "beautiful" and always looks clean, safe and inviting. Aside from routine maintenance and cleaning, we have no facility improvement projects being currently planned. District maintenance staff ensures that necessary repairs to keep the school in working order are completed in a timely manner. A work order process is used to ensure efficient service. Emergency repairs are given the highest priority. The district's governing board has adopted cleaning standards for all schools. A summary of these standards is available at the school office or in the district's Facilities Department. Our principal works with the custodial staff to develop cleaning schedules.
The LEA takes great efforts to ensure that all schools are clean, safe, and functional. To assist in this effort, the LEA uses a facility survey instrument developed by the State of California Office of Public School Construction. The results of this survey are available at the district office. Included is information from the facility survey instrument on the condition of the school and the efforts made to ensure that students are provided with a clean, safe, and functional learning environment. Our school received an "Exemplary" status based on the State's definitions for each of the eight categories evaluated, which is the highest rating possible.
System Inspected Repair Needed and Action Taken or
Planned Good Fair Poor
Systems: Gas Leaks, Mechanical/HVAC, Sewer x NA
Interior: Interior Surfaces x NA
Cleanliness: Overall Cleanliness, Pest/ Vermin Infestation x NA
Electrical: Electrical x NA
Restrooms/Fountains: Restrooms, Sinks/ Fountains x NA
Safety: Fire Safety, Hazardous Materials x NA
Structural: Structural Damage, Roofs x NA
External: Playground/School Grounds, Windows/ Doors/Gates/Fences x NA
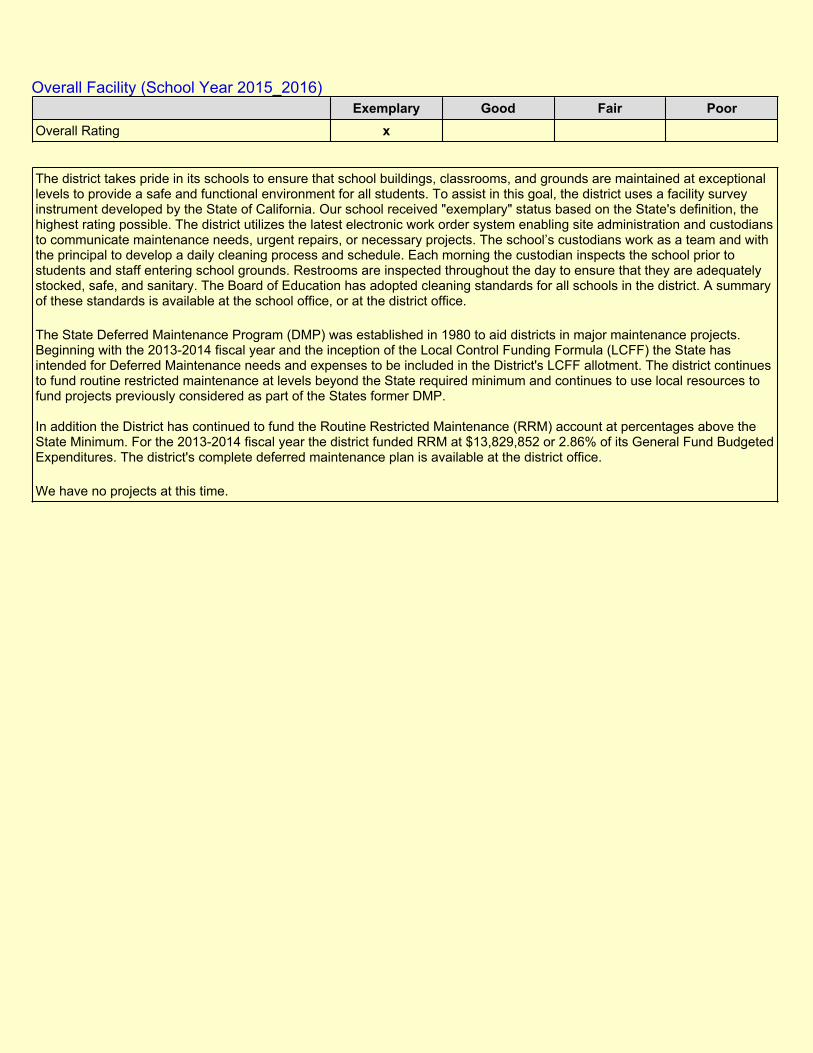
Overall Facility (School Year 2015_2016) Exemplary Good Fair Poor
Overall Rating x
The district takes pride in its schools to ensure that school buildings, classrooms, and grounds are maintained at exceptional levels to provide a safe and functional environment for all students. To assist in this goal, the district uses a facility survey instrument developed by the State of California. Our school received "exemplary" status based on the State's definition, the highest rating possible. The district utilizes the latest electronic work order system enabling site administration and custodians to communicate maintenance needs, urgent repairs, or necessary projects. The school’s custodians work as a team and with the principal to develop a daily cleaning process and schedule. Each morning the custodian inspects the school prior to students and staff entering school grounds. Restrooms are inspected throughout the day to ensure that they are adequately stocked, safe, and sanitary. The Board of Education has adopted cleaning standards for all schools in the district. A summary of these standards is available at the school office, or at the district office.
The State Deferred Maintenance Program (DMP) was established in 1980 to aid districts in major maintenance projects. Beginning with the 2013-2014 fiscal year and the inception of the Local Control Funding Formula (LCFF) the State has intended for Deferred Maintenance needs and expenses to be included in the District's LCFF allotment. The district continues to fund routine restricted maintenance at levels beyond the State required minimum and continues to use local resources to fund projects previously considered as part of the States former DMP.
In addition the District has continued to fund the Routine Restricted Maintenance (RRM) account at percentages above the State Minimum. For the 2013-2014 fiscal year the district funded RRM at $13,829,852 or 2.86% of its General Fund Budgeted Expenditures. The district's complete deferred maintenance plan is available at the district office.
We have no projects at this time.

B. Pupil Outcomes
State Priority: Pupil Achievement
The SARC provides the following information relevant to the Pupil Achievement State Priority (Priority 4):
Statewide assessments (i.e., California Assessment of Student Performance and Progress [CAASPP], Science California Standards Tests); and
The percentage of pupils who have successfully completed courses that satisfy the requirements for entrance to the University of California and the California State University, or career technical education sequences or programs of study.
California Assessment of Student Performance and Progress Results for All Students (School Year 2014–15)
Note: Percentages are not shown when the number of students tested is ten or less, either because the number of students in this category is too small for statistical accuracy or to protect student privacy.
SubjectPercent of Students Meeting or Exceeding the State Standards
School District StateEnglish Language Arts/Literacy(grades 3-8 and 11) 75% 49% 44%
Mathematics(grades 3-8 and 11) 57% 41% 33%

CAASPP Assessment Results – English Language Arts (ELA) Disaggregated by Student Groups, Grades Three through Eight and Eleven (School Year 2014–15)
ELA - Grade 11
Double dashes (--) appear in the table when the number of students is ten or less, either because the number of students in this category is too small for statistical accuracy or to protect student privacy.
Note: The number of students tested includes students that did not receive a score; however, the number of students tested is not the number that was used tocalculate the achievement level percentages. The achievement level percentages are calculated using students with scores.
*Level 1 = Standard not metLevel 2 = Standard nearly metLevel 3 = Standard metLevel 4 = Standard exceeded
Student Groups TotalEnrollment
NumberTested
PercentTested
PercentAcheivement
Level 1*
PercentAcheivement
Level 2*
PercentAcheivement
Level 3*
PercentAcheivement
Level 4*All Students 733 636 86.8 8 14 31 44
Male 733 337 46 12 16 31 38
Female 733 299 40.8 4 11 30 50
Black or African American 733 93 12.7 16 22 33 20
American Indian or Alaska Native 733 1 0.1 -- -- -- --
Asian 733 199 27.1 3 11 27 57
Filipino 733 68 9.3 6 12 26 51
Hispanic or Latino 733 110 15 12 19 43 24
Native Hawaiian or Pacific Islander 733 4 0.5 -- -- -- --
White 733 129 17.6 7 11 26 54
Two or More Races 733 32 4.4 9 6 41 38
Socioeconomically Disadvantaged 733 234 31.9 13 20 36 26
English Learners 733 35 4.8 46 43 11 0
Students with Disabilities 733 30 4.1 53 23 10 3
Students Receiving Migrant Education Services
733 1 0.1 -- -- -- --
Foster Youth -- -- -- -- -- -- --

CAASPP Assessment Results – Mathematics Disaggregated by Student Groups, Grades Three through Eight and Eleven (School Year 2014–15)
Mathematics - Grade 11
Double dashes (--) appear in the table when the number of students is ten or less, either because the number of students in this category is too small for statistical accuracy or to protect student privacy.
Note: The number of students tested includes students that did not receive a score; however, the number of students tested is not the number that was used tocalculate the achievement level percentages. The achievement level percentages are calculated using students with scores.
*Level 1 = Standard not metLevel 2 = Standard nearly metLevel 3 = Standard metLevel 4 = Standard exceeded
Student Groups TotalEnrollment
NumberTested
PercentTested
PercentAcheivement
Level 1*
PercentAcheivement
Level 2*
PercentAcheivement
Level 3*
PercentAcheivement
Level 4*All Students 733 626 85.4 17 23 29 28
Male 733 330 45 18 25 26 26
Female 733 296 40.4 15 20 32 30
Black or African American 733 90 12.3 36 26 24 8
American Indian or Alaska Native 733 1 0.1 -- -- -- --
Asian 733 197 26.9 4 19 29 47
Filipino 733 65 8.9 17 22 32 26
Hispanic or Latino 733 109 14.9 26 26 35 10
Native Hawaiian or Pacific Islander 733 4 0.5 -- -- -- --
White 733 129 17.6 16 22 24 32
Two or More Races 733 31 4.2 13 26 32 26
Socioeconomically Disadvantaged 733 228 31.1 24 30 26 15
English Learners 733 35 4.8 34 40 11 6
Students with Disabilities 733 31 4.2 74 3 3 6
Students Receiving Migrant Education Services
733 1 0.1 -- -- -- --
Foster Youth -- -- -- -- -- -- --

California Standards Tests for All Students in Science - Three-Year Comparison
Note: Scores are not shown when the number of students tested is ten or less, either because the number of students in this category is too small for statistical accuracy or to protect student privacy.
California Standards Test Results by Student Group in Science (School Year 2014-15)
Note: Scores are not shown when the number of students tested is ten or less, either because the number of students in this category is too small for statistical accuracy or to protect student privacy.
Subject
Percent of Students Scoring at Proficient or Advanced (meeting or exceeding the state standards)
School District State2012-13 2013-14 2014-15 2012-13 2013-14 2014-15 2012-13 2013-14 2014-15
Science (grades 5, 8, and 10) 70% 71% 70% 62% 65% 63% 59% 60% 56%
Student Group Percent of Students Scoring atProficient or Advanced
All Students in the LEA 63
All Students in the School 70
Male 68
Female 72
Black or African American 56
American Indian or Alaska NativeAsian 76
Filipino 72
Hispanic or Latino 61
Native Hawaiian or Pacific Islander White 78
Two or More Races 76
Socioeconomically Disadvantaged 58
English Learners 12
Students with Disabilities 18
Students Receiving Migrant Education Services Foster Youth
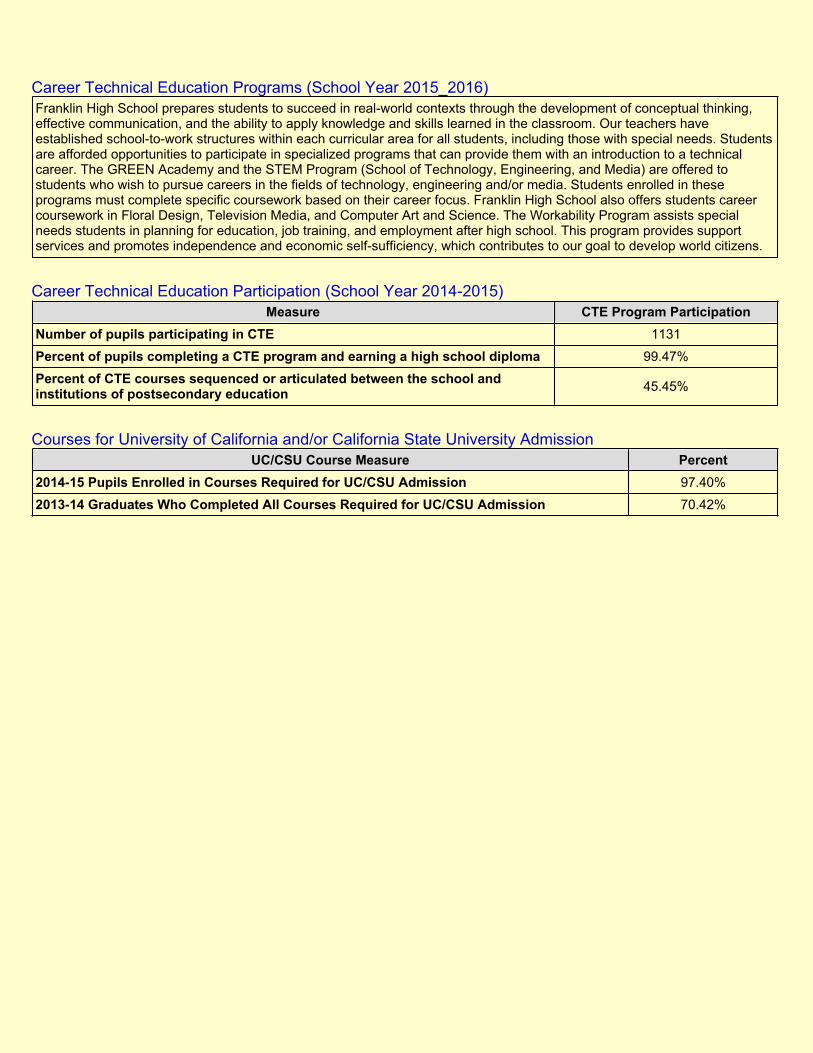
Career Technical Education Programs (School Year 2015_2016)
Career Technical Education Participation (School Year 2014-2015)
Courses for University of California and/or California State University Admission
Franklin High School prepares students to succeed in real-world contexts through the development of conceptual thinking, effective communication, and the ability to apply knowledge and skills learned in the classroom. Our teachers have established school-to-work structures within each curricular area for all students, including those with special needs. Students are afforded opportunities to participate in specialized programs that can provide them with an introduction to a technical career. The GREEN Academy and the STEM Program (School of Technology, Engineering, and Media) are offered to students who wish to pursue careers in the fields of technology, engineering and/or media. Students enrolled in these programs must complete specific coursework based on their career focus. Franklin High School also offers students career coursework in Floral Design, Television Media, and Computer Art and Science. The Workability Program assists special needs students in planning for education, job training, and employment after high school. This program provides support services and promotes independence and economic self-sufficiency, which contributes to our goal to develop world citizens.
Measure CTE Program Participation Number of pupils participating in CTE 1131
Percent of pupils completing a CTE program and earning a high school diploma 99.47%
Percent of CTE courses sequenced or articulated between the school and institutions of postsecondary education 45.45%
UC/CSU Course Measure Percent 2014-15 Pupils Enrolled in Courses Required for UC/CSU Admission 97.40%
2013-14 Graduates Who Completed All Courses Required for UC/CSU Admission 70.42%

State Priority: Other Pupil Outcomes
The SARC provides the following information relevant to the Other Pupil Outcomes State Priority (Priority 8):
Pupil outcomes in the subject areas of English, mathematics, and physical education.
California High School Exit Examination Results for All Grade Ten Students -Three-Year Comparison (if applicable)
Note: Percentages are not calculated when the number of students tested is ten or less, either because the number of students in this category is too small for statistical accuracy or to protect student privacy.
California High School Exit Examination Grade Ten Results by Student Group(School Year 2014-2015) (if applicable)
Note: Percentages are not calculated when the number of students tested is ten or less, either because the number of students in this category is too small for statistical accuracy or to protect student privacy.
SubjectPercent of Students Scoring at Proficient or Advanced
School District State2012-13 2013-14 2014-15 2012-13 2013-14 2014-15 2012-13 2013-14 2014-15
English-Language Arts 70 71 77 60 53 56 57 56 58
Mathematics 77 77 77 63 57 58 60 62 59
Student Group
English-Language Arts MathematicsPercent
NotProficient
PercentProficient
PercentAdvanced
PercentNot
ProficientPercent
ProficientPercent
Advanced
All Students In The LEA 38 28 34 35 39 26
All Students In The School 23 31 46 23 41 36
Male 28 34 38 20 39 41
Female 18 28 53 25 43 32
Black or African American 41 32 27 48 36 15
American Indian or Alaska NativeAsian 16 25 58 13 42 45
Filipino 18 28 54 14 42 44
Hispanic or Latino 27 42 31 26 48 26
Native Hawaiian or Pacific IslanderWhite 17 30 53 17 39 44
Two or More Races 17 29 55 22 37 41
Socioeconomically Disadvantaged 33 34 33 33 42 25
English Learners 74 19 6 71 26 3
Students with Disabilities 83 11 6 89 11
Students Receiving Migrant Education Services Foster Youth

California Physical Fitness Test Results (School Year 2014-2015)
Note: Percentages are not calculated when the number of students tested is ten or less, either because the number of students in this category is too small for statistical accuracy or to protect student privacy.
Grade Level Percent of StudentsMeeting Four of SixFitness Standards
Percent of StudentsMeeting Five of SixFitness Standards
Percent of StudentsMeeting Six of SixFitness Standards
579 12.4 27 50.4

C. Engagement
State Priority: Parental Involvement
The SARC provides the following information relevant to the Parental Involvement State Priority (Priority 3):
Efforts the school district makes to seek parent input in making decisions for the school district and each schoolsite.
Opportunities for Parental Involvement (School Year 2015_2016)
State Priority: Pupil Engagement
The SARC provides the following information relevant to the Pupil Engagement State Priority (Priority 5):
High school dropout rates; and
High school graduation rates.
Dropout Rate and Graduation Rate (Four-Year Cohort Rate)
Completion of High School Graduation Requirements - Graduating Class of 2014
Achieving our school's vision involves a partnership between school, home, and community. Parents are encouraged to take an active role in their child's education through campus visits, regular communication with teachers, and monitoring their child's academic progress. Franklin High School has many parent organizations and opportunities for involvement, such as Take Your Parent to School events, School Site Council, Wildcat Booster Club, and the English Learner Advisory Committee. If interested please contact the office staff at 916-714-8150.
IndicatorSchool District State
2011-12 2012-13 2013-14 2011-12 2012-13 2013-14 2011-12 2012-13 2013-14Dropout Rate 2.1 1.7 1.2 6.7 5.4 4.8 13.1 11.4 11.5
Graduation Rate 95.97 96.72 97.37 86.21 88.11 89.7 78.87 80.44 80.95
Group School District StateAll Students 96.38 88.93 84.6
Black or African American 94.68 78.63 76
American Indian or Alaska Native 100 95.83 78.07
Asian 99.44 94.52 92.62
Filipino 103.39 98.08 96.49
Hispanic or Latino 92.14 85.11 81.28
Native Hawaiian or Pacific Islander 77.78 84.34 83.58
White 97.08 94.07 89.93
Socioeconomically Disadvantaged 93.02 85.84 82.8
Two or More Races 112 100.81 81.36
English Learners 75 71.24 50.76
Students with Disabilities 79.37 69.49 61.28
Foster Youth

State Priority: School Climate
The SARC provides the following information relevant to the School Climate State Priority (Priority 6):
Pupil suspension rates;
Pupil expulsion rates; and
Other local measures on the sense of safety.
Suspensions and Expulsions
School Safety Plan (School Year 2015_2016)
RateSchool District State
2012-13 2013-14 2014-15 2012-13 2013-14 2014-15 2012-13 2013-14 2014-15Suspensions 5.19 4.02 4.93 5.93 5.27 4.78 5.07 4.36 3.80
Expulsions 0.03 0.04 0.1 0.05 0.03 0.05 0.13 0.10 0.09
Franklin High School provides a safe and positive learning environment for all students. Staff members maintain high expectations for appropriate and respectful student behavior. The School Safety Plan was reviewed in September 2015. An "Emergency Handbook", outlining a plan of action for emergencies such as earthquakes, fires, floods, and chemical spills, is kept in the school office. Many of our students serve as Link Crew Leaders and conflict managers to promote safe choices and conflict resolution on campus. A schedule is made to ensure supervision before and after school that includes both campus supervisors and administration. The areas of the campus that are open for entrance are monitored so all outside visitors need to check in through the main office and follow the appropriate procedures.

D. Other SARC Information
The information in this section is required to be in the SARC but is not included in the state priorities for LCFF.
Adequate Yearly Progress Overall and by Criteria (School Year 2015_2016)
Federal Intervention Program (School Year 2015_2016)
Note: Cells with NA values do not require data.
Average Class Size and Class Size Distribution (Secondary)
* Number of classes indicates how many classrooms fall into each size category (a range of total students per classroom). At the secondary school level, this information is reported by subject area rather than grade level.
AYP Criteria School DistrictMade AYP Overall No Yes
Met Participation Rate - English-Language Arts No Yes
Met Participation Rate - Mathematics No Yes
Met Percent Proficient - English-Language Arts N/A N/A
Met Percent Proficient - Mathematics N/A N/A
Met Attendance Rate Yes Yes
Met Graduation Rate Yes Yes
Indicator School DistrictProgram Improvement Status NA In PI
First Year of Program Improvement NA 2009-2010
Year in Program Improvement NA 3
Number of Schools Currently in Program Improvement NA 12
Percent of Schools Currently in Program Improvement NA 92.3
Subject Avg.ClassSize
2012-13Number ofClasses*
Avg.ClassSize
2013-14Number ofClasses*
Avg.ClassSize
2014-15Number ofClasses*
1-22 23-32 33+ 1-22 23-32 33+ 1-22 23-32 33+English 30 19 12 49 29 15 29 34 31.0 10 16 45
Mathematics 33 6 24 48 32 6 29 41 33.0 3 25 42
Science 32 7 5 33 30 7 16 21 31.0 8 10 26
Social Science 32 11 7 35 27 17 9 31 32.0 10 6 32
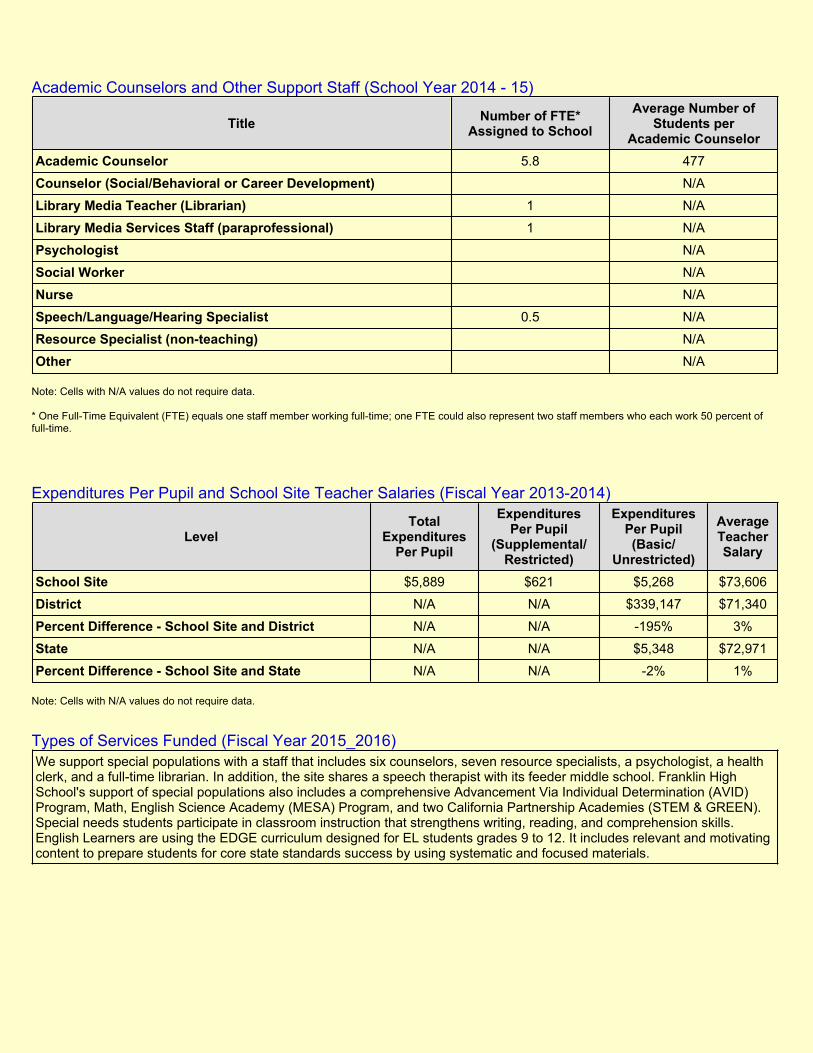
Academic Counselors and Other Support Staff (School Year 2014 - 15)
Note: Cells with N/A values do not require data.
* One Full-Time Equivalent (FTE) equals one staff member working full-time; one FTE could also represent two staff members who each work 50 percent of full-time.
Expenditures Per Pupil and School Site Teacher Salaries (Fiscal Year 2013-2014)
Note: Cells with N/A values do not require data.
Types of Services Funded (Fiscal Year 2015_2016)
Title Number of FTE*Assigned to School
Average Number ofStudents per
Academic Counselor Academic Counselor 5.8 477
Counselor (Social/Behavioral or Career Development) N/A
Library Media Teacher (Librarian) 1 N/A
Library Media Services Staff (paraprofessional) 1 N/A
Psychologist N/A
Social Worker N/A
Nurse N/A
Speech/Language/Hearing Specialist 0.5 N/A
Resource Specialist (non-teaching) N/A
Other N/A
Level Total
ExpendituresPer Pupil
ExpendituresPer Pupil
(Supplemental/Restricted)
ExpendituresPer Pupil(Basic/
Unrestricted)
AverageTeacherSalary
School Site $5,889 $621 $5,268 $73,606
District N/A N/A $339,147 $71,340
Percent Difference - School Site and District N/A N/A -195% 3%
State N/A N/A $5,348 $72,971
Percent Difference - School Site and State N/A N/A -2% 1%
We support special populations with a staff that includes six counselors, seven resource specialists, a psychologist, a health clerk, and a full-time librarian. In addition, the site shares a speech therapist with its feeder middle school. Franklin High School's support of special populations also includes a comprehensive Advancement Via Individual Determination (AVID) Program, Math, English Science Academy (MESA) Program, and two California Partnership Academies (STEM & GREEN). Special needs students participate in classroom instruction that strengthens writing, reading, and comprehension skills. English Learners are using the EDGE curriculum designed for EL students grades 9 to 12. It includes relevant and motivating content to prepare students for core state standards success by using systematic and focused materials.
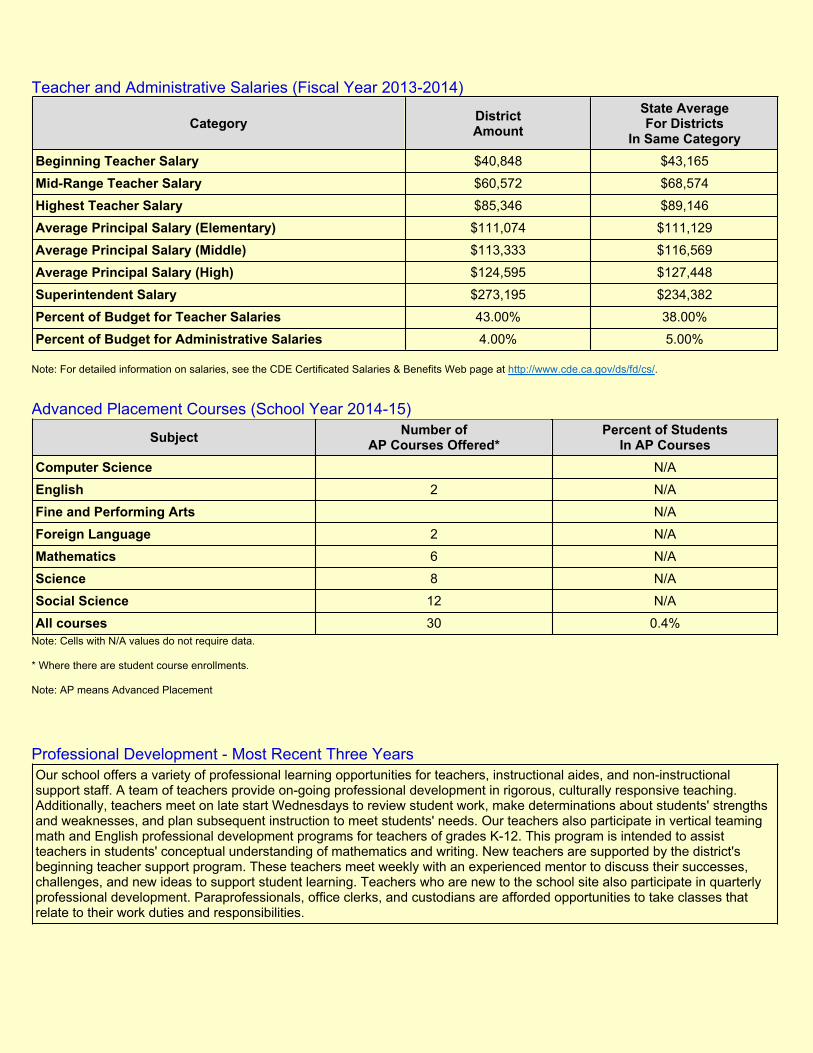
Teacher and Administrative Salaries (Fiscal Year 2013-2014)
Note: For detailed information on salaries, see the CDE Certificated Salaries & Benefits Web page at http://www.cde.ca.gov/ds/fd/cs/.
Advanced Placement Courses (School Year 2014-15)
Note: Cells with N/A values do not require data.
* Where there are student course enrollments.
Note: AP means Advanced Placement
Professional Development - Most Recent Three Years
Category DistrictAmount
State AverageFor Districts
In Same Category Beginning Teacher Salary $40,848 $43,165
Mid-Range Teacher Salary $60,572 $68,574
Highest Teacher Salary $85,346 $89,146
Average Principal Salary (Elementary) $111,074 $111,129
Average Principal Salary (Middle) $113,333 $116,569
Average Principal Salary (High) $124,595 $127,448
Superintendent Salary $273,195 $234,382
Percent of Budget for Teacher Salaries 43.00% 38.00%
Percent of Budget for Administrative Salaries 4.00% 5.00%
Subject Number ofAP Courses Offered*
Percent of StudentsIn AP Courses
Computer Science N/A
English 2 N/A
Fine and Performing Arts N/A
Foreign Language 2 N/A
Mathematics 6 N/A
Science 8 N/A
Social Science 12 N/A
All courses 30 0.4%
Our school offers a variety of professional learning opportunities for teachers, instructional aides, and non-instructional support staff. A team of teachers provide on-going professional development in rigorous, culturally responsive teaching. Additionally, teachers meet on late start Wednesdays to review student work, make determinations about students' strengths and weaknesses, and plan subsequent instruction to meet students' needs. Our teachers also participate in vertical teaming math and English professional development programs for teachers of grades K-12. This program is intended to assist teachers in students' conceptual understanding of mathematics and writing. New teachers are supported by the district's beginning teacher support program. These teachers meet weekly with an experienced mentor to discuss their successes, challenges, and new ideas to support student learning. Teachers who are new to the school site also participate in quarterly professional development. Paraprofessionals, office clerks, and custodians are afforded opportunities to take classes that relate to their work duties and responsibilities.