california assessment of student performance and … department of education z june 2016 1...
TRANSCRIPT

California Assessment ofStudent Performance and Progress
Grade11
Teacher Guide to the Smarter Balanced Assessments
Mathematics
California Department of Education

Acknowledgments
The Teacher Guide to the Smarter Balanced Summative Assessments: Mathematics, Grade Eleven was developed by California Department of Education staff, with support from the California Teachers Association, the California Federation of
Teachers, the Smarter Balanced Assessment Consortium, and WestEd. It was designed and prepared for printing by
San Joaquin County Office of Education.
© 2016 by the California Department of Education
Copyright Restrictions
Permission is granted in advance for reproduction of this resource, in its entirety, for the explicit use by educators to better understand student performance on the Smarter Balanced assessments. For any other purpose (including commercial enterprises), this resource, or portions thereof, may not be reproduced without permission from the California Department of Education and the Smarter Balanced Assessment Consortium. To obtain permission to reproduce the information (text or graphics) contained in this document, submit the specifics of your request in writing to the Copyright Program Office, Communications Division, California Department of Education, 1430 N Street, Suite 5602, Sacramento, CA 95814. Fax: 916-319-0100.

California Department of Education l June 2016 iii
C a l i f o r n i a A s s e s s m e n t o f S t u d e n t P e r f o r m a n c e a n d P r o g r e s s
Mathematics Teacher Guide to the Smarter Balanced Assessments
Grade
11
ContentsIntroduction ............................................................................................................................1
Section One: Purpose of the Guide—Resource for Planning Learning Events to Implement the Mathematics Framework for California Public Schools for Kindergarten through Grade Twelve Public Schools ..................................... 3
Mathematics Framework for California Public Schools: Kindergarten Through Grade Twelve ......................................................................................................4
Guiding Principles Behind the Development of the Mathematics Framework for California Public Schools: Kindergarten through Grade Twelve (2015) ............................................ 4
Guiding Principle 1: Learning .......................................................................................4Guiding Principle 2: Teaching ......................................................................................5Guiding Principle 3: Technology ..................................................................................6Guiding Principle 4: Equity ...........................................................................................7Guiding Principle 5: Assessment .................................................................................7Twenty-First-Century Learning ....................................................................................8
Section Two: Understanding and Using Smarter Balanced Test Design Principles to Support Classroom Learning Events ........................................................... 10
Understanding the Fundamentals of Smarter Balanced Design ..................................... 10
Connecting the Smarter Balanced Mathematics Assessments to Classroom Learning ....................................................................................................14
Smarter Balanced Assessment Evidence Statements Describe Learning Expectations for Domains and Clusters ..........................................................................27
Section Three: Instruction with Planned Evidence Collection and Feedback Helps Teachers and Students Improve Student Learning ........................................................... 31
Assessment for Learning .................................................................................................31
Steps Toward Creating a More Authentic Assessment .................................................... 32
Item and Task Types Collect Evidence in New Ways ...................................................... 35

June 2016 l California Department of Educationiv
C a l i f o r n i a A s s e s s m e n t o f S t u d e n t P e r f o r m a n c e a n d P r o g r e s s
MathematicsTeacher Guide to the Smarter Balanced Assessments
Grade
11
ContentsAccessibility Supports and Accommodations Help All Students Meaningfully Participate .................................................................................................35
Section Four: Using Smarter Balanced Score Reports to Analyze Data and Improve Learning ..............................................................................................................................37
Computer Adaptive Testing: Appropriate Assessment for Each Student ....................................................37
Practice Tests and Training Tests Available for Teachers, Students, and Parents .....................................38
How Student Performance Is Reported on the Smarter Balanced Assessments ......................................38
Overall Score and Achievement Level—Shows Student Performance on the Difficulty Scale ..................39
Claim Level Achievement—Shows General Student Performance in Content Areas ................................40
Use Group-Level Data to Identify Trends in Curriculum Strengths and Gaps ............................................41
Assessment Target Reports .......................................................................................................................41
Guiding Questions to Analyze Group-Level Data .......................................................................................43
Section Five: Conclusion—Putting It All Together ........................................................................44
Smarter Balanced Resources for Teachers from the Smarter Balanced Digital Library ............................44
Formative Assessment Process .................................................................................................................45Digital Library .......................................................................................................................................45Smarter Balanced Web Site ................................................................................................................45WestEd Web Site ................................................................................................................................46California Assessment of Student Performance and Progress (CAASPP)..........................................46

California Department of Education l June 2016 1
C a l i f o r n i a A s s e s s m e n t o f S t u d e n t P e r f o r m a n c e a n d P r o g r e s s
Mathematics Teacher Guide to the Smarter Balanced Assessments
Grade
11
IntroductionThe purpose of the Teacher Guide is to deepen teachers’ understanding of the Smarter Balanced Summative Assessments, their alignment with the California Common Core State Standards (CA CCSS), and their intended connection to classroom learning. The guide for mathematics is grade-span specific and synthesizes key information from a wide array of resources and resource sites, including:
l California Common Core State Standards
l California Mathematics Framework for California Public Schools: Kindergarten through Grade Twelve (Mathematics Framework)
l Content, item, task, and stimulus specifications
l Smarter Balanced Test Blueprints
l Smarter Balanced Practice Test Scoring Guides
l Smarter Balanced Communication Tools
l Smarter Balanced Digital Library
The mathematics guides are organized by grade span to highlight the changes in expectations as students move through the grade levels. Within the guides there are examples from Smarter Balanced Item Specifications that explain how student skills and knowledge are assessed and reported through collecting and scoring evidence. This grades three through five guide has an example from Claim 1, Concepts and Procedures, Grade Five. The grades six through eight guide shows a specification for Claim 3, Communicating Reasoning, Grade Eight, and the grade eleven guide shows an example from Claim 4, Modeling and Data Analysis. The guide also provides examples of the range and types of items that appear on the assessments and the multiple resources that are available to teachers, students, and parents to “de-mystify” the assessments.
The Smarter Balanced Summative Assessments are part of the California Assessment of Student Performance and Progress (CAASPP) System.
The new Smarter Balanced Summative Assessments are different from the previous tests included in the Standardized Testing and Reporting (STAR) Program in several ways including:

June 2016 l California Department of Education2
C a l i f o r n i a A s s e s s m e n t o f S t u d e n t P e r f o r m a n c e a n d P r o g r e s s
MathematicsTeacher Guide to the Smarter Balanced Assessments
Grade
11l Designed to measure the expectations embodied in the CA CCSS adopted by the
California State Board of Education in August 2010
l Emphasize deeper knowledge of core concepts and ideas within and across the disciplines along with analysis, synthesis, problem solving, communication, and critical thinking
l Include a greater variety of item types
l Capitalize on the strengths of computer adaptive testing (CAT), such as efficient and precise measurement across the full range of achievement
l Provide greater opportunities for classroom teachers to influence the design and operation of the assessment system

California Department of Education l June 2016 3
C a l i f o r n i a A s s e s s m e n t o f S t u d e n t P e r f o r m a n c e a n d P r o g r e s s
Mathematics Teacher Guide to the Smarter Balanced Assessments
Grade
11
Section One: Purpose of the Guide—Resource for Planning Learning Events to Implement the Mathematics Framework for California Public Schools for Kindergarten through Grade Twelve Public Schools
These Teacher Guides are intended to be a resource for classroom teachers as they plan learning activities that fully implement the California Mathematics Framework using assessment feedback from the Smarter Balanced system of assessments.
Figure 1. Curriculum, Instruction, and Assessment Feedback Loop
Figure 1 shows the continuous feedback loop between curriculum, instruction, and assessment. Teachers use curriculum to plan instruction and use evidence from a variety of assessments to determine next steps in the teaching and learning cycle. The Mathematics Framework not only describes the state standards and research-based practices that support the standards, but connects overarching themes and the instructional shifts in the standards. Smarter Balanced assessment developers used similar overarching themes, instructional shifts, and understanding of the CA CCSS to build a fair and accurate assessment of the standards. They developed performance tasks and innovative items not seen before on large-scale state assessments to meet the demands of the key themes and the 21st century learning described below. The Mathematics Framework and Smarter Balanced assessments can function together to provide accurate and consistent evidence around the feedback loop.

June 2016 l California Department of Education4
C a l i f o r n i a A s s e s s m e n t o f S t u d e n t P e r f o r m a n c e a n d P r o g r e s s
MathematicsTeacher Guide to the Smarter Balanced Assessments
Grade
11Mathematics Framework for California Public Schools: Kindergarten Through Grade Twelve
The first stop for teachers in planning learning events is the Mathematics Framework. The guidance in this resource is research-based and includes practical examples to help all teachers.
Guiding Principles behind the development of the Mathematics Framework for California Public Schools: Kindergarten Through Grade Twelve (2015):1
l Mathematical ideas should be explored in ways that stimulate curiosity, create enjoyment of mathematics, and develop depth of understanding.
l An effective mathematics program is based on a carefully designed set of content standards that are clear and specific, focused, and articulated over time as a coherent sequence.
l Technology is an essential tool that should be used strategically in mathematics education.
l All students should have a high-quality mathematics program that prepares them for college and careers.
l Assessment of student learning in mathematics should take many forms to inform instruction and learning.
Guiding Principle 1: Learning Mathematical ideas should be explored in ways that stimulate curiosity, create enjoyment of mathematics, and develop depth of understanding.
For students to achieve mathematical understanding, instruction and learning must balance mathematical procedures and conceptual understanding. Students should be actively engaged in doing meaningful mathematics, discussing mathematical ideas, and applying mathematics in interesting, thought-provoking situations. Student understanding is further developed through ongoing reflection about cognitively demanding and worthwhile tasks.
1 Introduction of the Mathematics Framework (2015), California Department of Education, Sacramento, CA, page 3 (found on the CDE Mathematics Curriculum Frameworks Web page at http://www.cde.ca.gov/ci/ma/cf/).
California Department of Education l June 2016 5
C a l i f o r n i a A s s e s s m e n t o f S t u d e n t P e r f o r m a n c e a n d P r o g r e s s
Mathematics Teacher Guide to the Smarter Balanced Assessments
Grade
11Tasks should be designed to challenge students in multiple ways. Short- and long-term investigations that connect procedures and skills with conceptual understanding are integral components of an effective mathematics program. Activities should build upon students’ curiosity and prior knowledge and enable them to solve progressively deeper, broader, and more sophisticated problems.2
T h e S m a r t e r C o n n e c t i o n
Smarter Balanced math assessments use a variety of item types and performance assessment tasks to challenge students in multiple ways. The items and tasks are reviewed by teachers to make sure they will engage the student’s curiosity and encourage them to dig deeper for innovative solutions to uncommon problems.
Guiding Principle 2: TeachingAn effective mathematics program is based on a carefully designed set of content standards that are clear and specific, focused, and articulated over time as a coherent sequence.
The sequence of topics and instruction should be based on what is known about how students’ mathematical knowledge, skill, and understanding develop over time. What and how students are taught should reflect not only the topics within mathematics but also the key ideas that determine how knowledge is organized and generated within mathematics.
Mathematical problem solving is the hallmark of an effective mathematics program. Skill in mathematical problem solving requires practice with a variety of mathematical
problems as well as a firm grasp of mathematical techniques and their underlying principles. Armed with this deeper knowledge, students can use mathematics in flexible ways to attack various problems and devise different ways to solve any particular problem.
T h e S m a r t e r C o n n e c t i o n
Smarter Balanced worked with the Common Core authors to build a tight alignment to the grade by grade learning progressions and the priority and supporting standards tested at each grade. Students highlight their skill in problem solving through the performance assessment task that combines problems to build a solution that is clearly communicated with sufficient evidence.
2 Ibid. page 4

June 2016 l California Department of Education6
C a l i f o r n i a A s s e s s m e n t o f S t u d e n t P e r f o r m a n c e a n d P r o g r e s s
MathematicsTeacher Guide to the Smarter Balanced Assessments
Grade
11Mathematical problem solving calls for reflective thinking, persistence, learning from the ideas of others, and reviewing one’s own work with a critical eye. Students should be able to construct viable arguments and critique the reasoning of others. They should analyze situations and justify their conclusions, communicate their conclusions to others, and respond to the arguments of others.3
Guiding Principle 3: TechnologyTechnology is an essential tool that should be used strategically in mathematics education.
Technology enhances the mathematics curriculum in many ways. Tools such as measuring instruments, manipulatives (such as base-ten blocks and fraction pieces), scientific and graphing calculators, and computers with appropriate software, if properly used, contribute to a rich learning environment for investigating, exploring, developing, and applying mathematical concepts. Appropriate use of calculators is essential; calculators should not be used as a replacement for basic understanding and skills. Elementary students should learn how to perform the basic arithmetic operations independent of the use of a calculator (National Center for Education Statistics 1995). The use of a graphing calculator can help middle school and secondary students visualize properties of functions and their graphs. Graphing calculators should be used to enhance—not replace—student understanding and skills.
Technology changes the mathematics to be learned, as well as when and how it is learned. For example, currently available technology provides a dynamic and exploration-driven approach to mathematical concepts such as functions, rates of change, geometry, and averages that was not possible in the past.4
T h e S m a r t e r C o n n e c t i o n
Innovative items have been developed specifically for the Smarter Balanced assessments to engage students in real-world scenarios with multiple modes of response. All mathematics tools, including calculators, are embedded in the testing software. Test sections may be designed with “No Calculator” to conform to the Smarter Balanced calculator use policy that implements the intent of the Common Core State Standards.
3 Ibid. page 4
4 Ibid. page 5

California Department of Education l June 2016 7
C a l i f o r n i a A s s e s s m e n t o f S t u d e n t P e r f o r m a n c e a n d P r o g r e s s
Mathematics Teacher Guide to the Smarter Balanced Assessments
Grade
11Guiding Principle 4: Equity All students should have a high-quality mathematics program that prepares them for college and careers.
The standards provide clear signposts along the way to the goal of college and career readiness for all students; they also accommodate a broad range of students, from those requiring a significant amount of extra support in mathematics to others needing minimal support or enrichment opportunities. To promote achievement of these standards, teachers should plan for, instruct, model, and support classroom discourse, reflection, use of multiple problem-solving strategies, and a positive disposition toward mathematics. They should have high expectations for all students. At every level of the education system, teachers should act on the belief that every child can and should learn challenging mathematics.
Because mathematics is the cornerstone of many disciplines, a comprehensive curriculum should include applications to everyday life and modeling activities that demonstrate the connections among disciplines. Schools should also provide opportunities for communicating with experts in applied fields to enhance students’ knowledge of these connections.5
T h e S m a r t e r C o n n e c t i o n
Smarter Balanced Interim Assessments and formative assessment resources in the Digital Library support teachers to identify gaps in student knowledge and gain insight into student thinking. Partnerships with mathematics teachers and researchers continue to enhance the professional learning and instructional resources that support effective classroom-based assessment.
Guiding Principle 5: Assessment Assessment of student learning in mathematics should take many forms to inform instruction and learning.
A comprehensive assessment program is an integral component of an instructional program. It provides students with frequent feedback on their performance, teachers with diagnostic tools for gauging students’ depth of understanding of mathematical concepts and skills, parents with information about their children’s performance in the context of program goals, and administrators with a means for measuring student achievement.
5 Ibid. page 6
June 2016 l California Department of Education8
C a l i f o r n i a A s s e s s m e n t o f S t u d e n t P e r f o r m a n c e a n d P r o g r e s s
MathematicsTeacher Guide to the Smarter Balanced Assessments
Grade
11Assessments take a variety of forms, require different amounts of time, and address various aspects of student learning. Gaps in knowledge and errors in reasoning can be identified when students “think aloud” or talk through their reasoning. By observing and questioning students as they work, teachers can gain insight into students’
abilities to apply appropriate mathematical concepts and skills, make conjectures, and draw conclusions.
Assessment should also be a major component of the learning process. As students help identify goals for lessons or investigations, they gain greater awareness of what they need to learn and
how they will demonstrate that learning. Engaging students in this kind of goal setting can help them reflect on their work, understand the standards to which they are held accountable, and take ownership of their learning.6
T h e S m a r t e r C o n n e c t i o n
Smarter Balanced Interim Assessments and formative assessment resources in the Digital Library support teachers to identify gaps in student knowledge and gain insight into student thinking. Partnerships with mathematics teachers and researchers continue to enhance the professional learning and instructional resources that support effective classroom-based assessment.
Learning in the 21st Century In supporting 21st century learning, California is part of a growing national movement to teach students the problem-solving skills and critical thinking they need for college, careers, and civic life. The Partnership for 21st Century Skills (P21) developed a framework for 21st century learning comprising student outcomes and support systems. The student outcomes consist of the following elements:
l Core subjects and 21st century interdisciplinary themes, which include globalawareness; financial, economic, business, and entrepreneurial literacy; civic literacy;health literacy; and environmental literacy
l Life and career skills, which include flexibility and adaptability, initiative and self-direction, social and cross-cultural skills, productivity and accountability, andleadership and responsibility
6 Ibid. page 7
California Department of Education l June 2016 9
C a l i f o r n i a A s s e s s m e n t o f S t u d e n t P e r f o r m a n c e a n d P r o g r e s s
Mathematics Teacher Guide to the Smarter Balanced Assessments
Grade
11l Learning and innovation skills, often referred to as the “4 Cs”: creativity and
innovation, critical thinking and problem solving, communication, and collaboration
l Information, media, and technology skills, which include information literacy, medialiteracy, and ICT (information, communications, and technology) literacy.
Support systems provided by P21 include standards and assessments, curriculum and instruction, professional development, and learning environments.7
The Mathematics Framework guiding principles are important to keep in mind when planning learning activities. Daily opportunities to engage in rich learning using 21st century skills keep students engaged and develop students as partners in their own learning.
T h e S m a r t e r C o n n e c t i o n
Smarter Balanced performance assessment tasks were designed to meet the requirements of 21st century learning. The topics are real-world examples of issues that engage students. The performance tasks (PTs) are designed to elicit evidence of critical thinking, creative thinking, and consideration of the local and global impact of the issues.
7 Ibid. page 7

June 2016 l California Department of Education10
C a l i f o r n i a A s s e s s m e n t o f S t u d e n t P e r f o r m a n c e a n d P r o g r e s s
MathematicsTeacher Guide to the Smarter Balanced Assessments
Grade
11
Section Two: Understanding and Using Smarter Balanced Test Design Principles to Support Classroom Learning Events
This section describes the evidence-centered design of the Smarter Balanced assessments and the hierarchical approach to item development. There are examples of how the test developers and teachers use evidence to accurately assess the learning required by the CA CCSS. Connecting the use of evidence-centered design and classroom learning activities allows a strong connection between Smarter Balanced results and resources.
Understanding the Fundamentals of Smarter Balanced DesignKnowing how the Smarter Balanced assessment system is developed, particularly how items are developed, can be helpful in understanding how to make the best use of the assessment resources and results. This knowledge should facilitate increasing the intentional connection between curriculum, instruction, and assessment.
The CA CCSS in Mathematics include content standards and standards for mathematicalpractice. In order to fully align the assessment to all of these standards, the SmarterBalanced test design has grade-level priority and supporting content clusters asassessment targets for Claim 1. For Claims 2, 3, and 4, the standards for mathematicalpractice emphasized at each claim and grade level are the assessment targets. (See theMathematics Summative Assessment Blueprint on the Smarter Balanced Developmentand Design Web page at http://www.smarterbalanced.org/assessments/development/, under the Summative Test Blueprints tab, for grade-by-grade assessment targets in all claims.) The performance task in each grade uses priority content to frame a multi-step task and collect evidence on the student’s ability to use content knowledge andmathematical practices effectively to solve the problems and communicate the rationalewith supporting evidence.
The diagram and charts on the following pages describe the structure of Smarter Balanced item specifications—how evidence-centered design is used to develop items. A mathematics, grade eleven example is used here from claim 4. While it is certainly not necessary to memorize this information, having a working knowledge of item development can facilitate use of results to enhance learning events. This item specification information is available for all Smarter Balanced assessments in resources listed at the end of this document.
California Department of Education l June 2016 11
C a l i f o r n i a A s s e s s m e n t o f S t u d e n t P e r f o r m a n c e a n d P r o g r e s s
Mathematics Teacher Guide to the Smarter Balanced Assessments
Grade
11Smarter Balanced has provided a zip file for each Claim and Grade of the item specifications used by test item writers to develop questions which can be found on the Smarter Balanced Development and Design Web page at http://www.smarterbalanced.org/assessments/development/ under the Item and Task Specification tab. You will be able to see exactly what instructions were given to clarify what was being tested and how to make sure there was tight alignment to the standards being assessed. The priority and supporting/additional domains and clusters tested in Claim 1 have statements describing evidence required to demonstrate deep understanding of the standards. In Claims 2, 3, and 4, the Standards for Mathematical Practice are being tested in the context of real-world problems. For these claims, the item specifications describe expectations for students to provide evidence of the ability to apply mathematical practices to solve problems.
When you open the link above, you will see a list of zip files. Choose the grade and claim you are interested in. For example, we have provided excerpts from a Claim 4, Grade Eleven specification here. Once you open the zip file, look for the assessment target. In our example in Figure 4 we are using assessment target E. We chose E because on the test design (blueprint) for Grade eleven on the CAT, students receive one question covering targets B and E.
To illustrate the importance of evidence-centered design, Figure 3 displays the relationship among the overall claims, sub-domain assessment claims, assessment targets, and academic standards. This relationship is important, not only in the design and development of the Smarter Balanced items, but also in the interpretation and reporting of scores.
This claim/target/standard relationship is clearly articulated through the steps of the evidence-centered design model that Smarter Balanced assessments employ. The first step in the evidence-centered design approach is to define the content domains to be measured; in this case, the domains are English language arts/literacy and mathematics. The next step is to define the assessment claims that will be made about the domains. Claims are arguments derived from evidence about college and career readiness; Smarter Balanced claims are statements about what a student knows and is able to do. In the Smarter Balanced system, there are two kinds of claims: an “overall claim,” corresponding to performance on the entire assessment of English language arts/literacy or mathematics, and four domain-specific claims corresponding to performance in different areas in each of the assessments.

June 2016 l California Department of Education12
C a l i f o r n i a A s s e s s m e n t o f S t u d e n t P e r f o r m a n c e a n d P r o g r e s s
MathematicsTeacher Guide to the Smarter Balanced Assessments
Grade
11After carefully analyzing the CA CCSS and thinking about what students must know and be able to do in order to be prepared for college and career paths, Smarter Balanced identified four claims specific to English language arts and four claims specific to mathematics that focus on what students are expected to be able to do at each grade level.
Once the domains are defined and the claims are identified, the third step is to clearly identify the knowledge, skills, and abilities (KSAs) that form the content domain. In the Smarter Balanced system, the KSAs that are intended to be measured are called “assessment targets.” An assessment target defines the specific KSAs that students should be able to demonstrate within the domain. A large number of assessment targets are measured in the Smarter Balanced assessment system.
Once assessment targets are defined, the fourth step focuses on identifying the types of information that need to be collected from students to allow meaningful information to be gleaned about the student’s achievement of the assessment targets. The information Smarter Balanced elicits from students is considered to be evidence that can support or refute a claim about the student’s achievement of the assessment target.
Once the types of evidence to collect are determined, the final step focuses on developing items or tasks that will elicit the evidence regarding the knowledge, skills, and/or abilities that are articulated in the standards.

California Department of Education l June 2016 13
C a l i f o r n i a A s s e s s m e n t o f S t u d e n t P e r f o r m a n c e a n d P r o g r e s s
Mathematics Teacher Guide to the Smarter Balanced Assessments
Grade
11Figure 3. Relationship Among Overall Claims, Sub-Domain Assessment Claims, Assessment Targets and Standards
Overall Claim(Content Domain—
ELA or Mathematics)
Claim 1 (Sub-Domain)
AssessmentTarget(s) Standard(s)
Claim 2 (Sub-Domain)
AssessmentTarget(s) Standard(s)
Claim 3 (Sub-Domain)
AssessmentTarget(s) Standard(s)
Claim 4 (Sub-Domain)
AssessmentTarget(s) Standard(s)
Figure 3a provides a content-specific example of the hierarchy of item development and illustrates how the domain overall claims, sub-domain assessment claims, assessment targets, and standards are connected, both in test development and reporting of scores. Recognizing the hierarchy makes the analysis of Smarter Balanced results easier to understand and emphasizes the importance of using the different levels of scores as contributors to a much larger picture.

June 2016 l California Department of Education14
C a l i f o r n i a A s s e s s m e n t o f S t u d e n t P e r f o r m a n c e a n d P r o g r e s s
MathematicsTeacher Guide to the Smarter Balanced Assessments
Grade
11Figure 3a. Anatomy of a Test—The Hierarchy of the Smarter Balanced Summative Assessments
Example – Mathematics – Grade Eleven
Estimated Number of Items
Per Claim
4–6 items
Overall MathClaim forGrade 11
Students can demonstrate college and
career readiness in Mathematics
Domain(s)
A, F, G, N, S
Targets are the bridge between the
content standards and the assessment
evidence that supports the claim; they ensure sufficiency of evidence
to justify each claim
Target EAnalyze the
adequacy of and make improve-
ments to an existing model or
develop a mathematical
model of a real phenomenon.
Associated Standard(s) and Depth of Knowledge (DOK)(s)*
N-Q.A A-SSE.B A-CED.A A-REI.A A-REI.B A-REI.C F-IF.B F-IF.C F-BF.A S-ID.A S-ID.B
S-IC.A.1 S-IC.B F-LE.A F-LE.B
F-TF.B.5 G-GMD.A.3
G-MG.A
DOK 1,2,3,4
Math Claim 4
Students cananalyze complex, real-world
scenarios and can construct
and usemathematical
models to interpret and
solve problems.
* The Common Core State Standards require high-level cognitive demand. The Depth of Knowledge (DOK) refers to the cognitive rigor required of students to answer a question or perform a task. Four levels of DOK are considered in Smarter Balanced assessments, with each level requiring greater cognitive demand.
Connecting the Smarter Balanced Mathematics Assessments to Classroom Learning
By examining the item specifications for Modeling and Data Analysis, Claim 4 (See Figure 4), teachers will be able to connect the evidence required in a Smarter Balanced assessment to learning goals and success criteria for a classroom learning event aligned to particular standards from mathematics Claim 4. The item specifications in
T h e S m a r t e r C o n n e c t i o n
What Smarter Balanced resources may a teacher consider in planning learning events for students in priority clusters and supporting clusters that integrate the Standards for Mathematical Practices?
California Department of Education l June 2016 15
C a l i f o r n i a A s s e s s m e n t o f S t u d e n t P e r f o r m a n c e a n d P r o g r e s s
Mathematics Teacher Guide to the Smarter Balanced Assessments
Grade
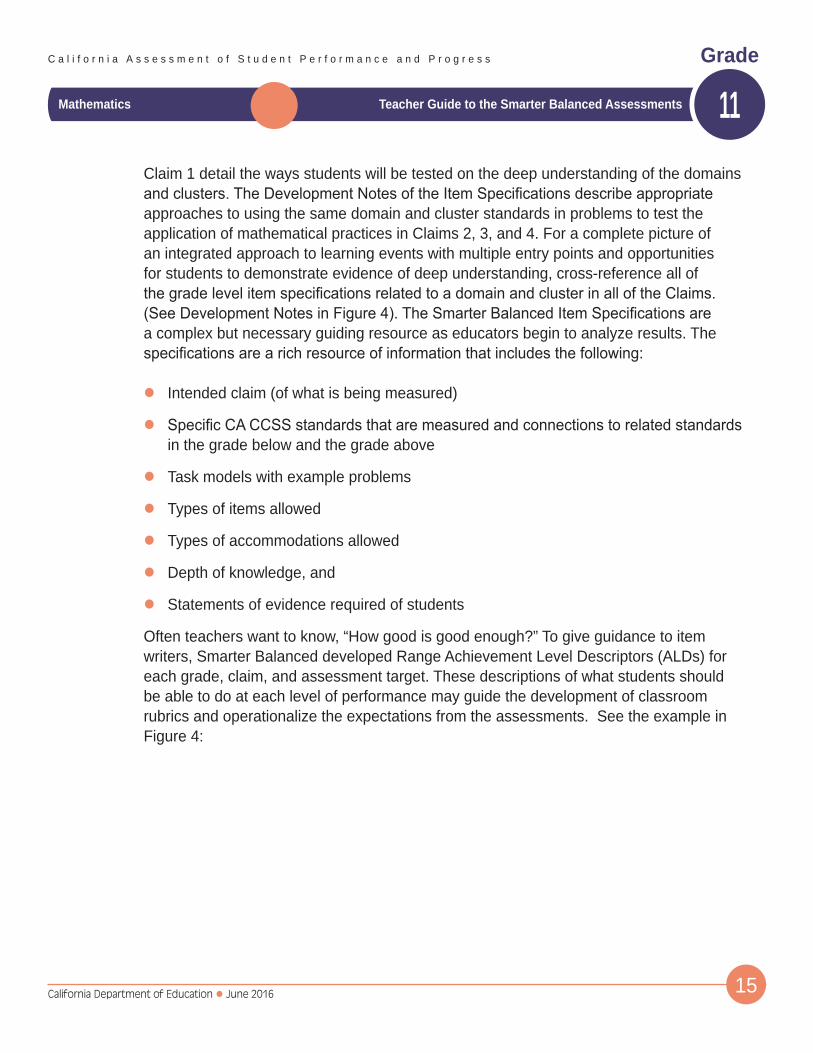
11Claim 1 detail the ways students will be tested on the deep understanding of the domains and clusters. The Development Notes of the Item Specifications describe appropriate approaches to using the same domain and cluster standards in problems to test the application of mathematical practices in Claims 2, 3, and 4. For a complete picture of an integrated approach to learning events with multiple entry points and opportunities for students to demonstrate evidence of deep understanding, cross-reference all of the grade level item specifications related to a domain and cluster in all of the Claims. (See Development Notes in Figure 4). The Smarter Balanced Item Specifications are a complex but necessary guiding resource as educators begin to analyze results. The specifications are a rich resource of information that includes the following:
l Intended claim (of what is being measured)
l Specific CA CCSS standards that are measured and connections to related standards in the grade below and the grade above
l Task models with example problems
l Types of items allowed
l Types of accommodations allowed
l Depth of knowledge, and
l Statements of evidence required of students
Often teachers want to know, “How good is good enough?” To give guidance to item writers, Smarter Balanced developed Range Achievement Level Descriptors (ALDs) for each grade, claim, and assessment target. These descriptions of what students should be able to do at each level of performance may guide the development of classroom rubrics and operationalize the expectations from the assessments. See the example in Figure 4:

June 2016 l California Department of Education16
C a l i f o r n i a A s s e s s m e n t o f S t u d e n t P e r f o r m a n c e a n d P r o g r e s s
MathematicsTeacher Guide to the Smarter Balanced Assessments
Grade
11Figure 4. Item Specification: Modeling and Data Analysis, Claim 4, Grade Eleven
Claim 4 Modeling and Data Analysis: Students can analyze complex, real-world scenarios and can construct and use mathematical models to interpret and solve problems.
Secondary Claim(s): Students can analyze complex, real-world scenarios and can construct and use mathematical models to interpret and solve problems.
Primary Content Domain: Each item/task should be classified as having a primary, or dominant, content focus. The content should draw upon the knowledge and skills articulated in the progression of standards leading up to and including the targeted grade within and across domains.
Secondary Content Domain(s): While tasks developed to assess Claim 4 will have a primary content focus, components of these tasks will likely produce enough evidence for other content domains that a separate listing of these content domains needs to be included where appropriate.The standards in the N and S domains in the high school grades can be used to construct higher difficulty items for the adaptive pool. The integration of the A, F, and G domains with N or S allows for higher content limits within the grade level than might be allowed when staying within the primary content domain.
Assessment Targets: Any given item/task should provide evidence for two or more Claim 4 assessment targets. Each of the following targets should not lead to a separate task: it is in using content from different areas, including work studied in earlier grades, that students demonstrate their problem-solving proficiency. Multiple targets should be listed in order of prominence as related to the item/task.
Target E: Analyze the adequacy of and make improvements to an existing model or develop a mathematical model of a real phenomenon. (DOK 3, 4) Tasks used to assess this target ask students to investigate the efficacy of existing models (e.g., develop a way to analyze the claim that a child’s height at age 2 doubled equals his/her adult height) and suggest improvements using their own or provided data. Other tasks for this target will ask students to develop a model for a particular phenomenon (e.g., analyze the rate of global ice melt over the past several decades and predict what this rate might be in the future). Longer constructed response items and extended performance tasks should be used to assess this target.
California Department of Education l June 2016 17
C a l i f o r n i a A s s e s s m e n t o f S t u d e n t P e r f o r m a n c e a n d P r o g r e s s
Mathematics Teacher Guide to the Smarter Balanced Assessments
Grade
11
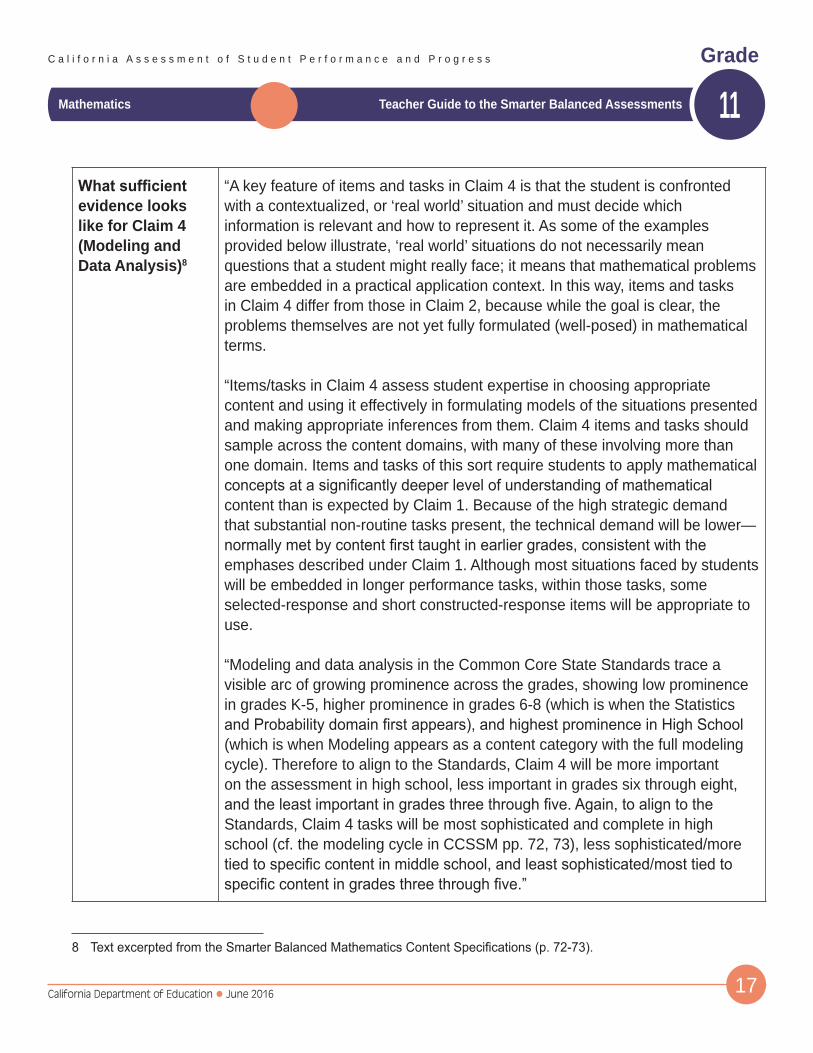
What sufficient evidence looks like for Claim 4 (Modeling and Data Analysis)8
“A key feature of items and tasks in Claim 4 is that the student is confronted with a contextualized, or ‘real world’ situation and must decide which information is relevant and how to represent it. As some of the examples provided below illustrate, ‘real world’ situations do not necessarily mean questions that a student might really face; it means that mathematical problems are embedded in a practical application context. In this way, items and tasks in Claim 4 differ from those in Claim 2, because while the goal is clear, the problems themselves are not yet fully formulated (well-posed) in mathematical terms.
“Items/tasks in Claim 4 assess student expertise in choosing appropriate content and using it effectively in formulating models of the situations presented and making appropriate inferences from them. Claim 4 items and tasks should sample across the content domains, with many of these involving more than one domain. Items and tasks of this sort require students to apply mathematical concepts at a significantly deeper level of understanding of mathematical content than is expected by Claim 1. Because of the high strategic demand that substantial non-routine tasks present, the technical demand will be lower—normally met by content first taught in earlier grades, consistent with the emphases described under Claim 1. Although most situations faced by students will be embedded in longer performance tasks, within those tasks, some selected-response and short constructed-response items will be appropriate to use.
“Modeling and data analysis in the Common Core State Standards trace a visible arc of growing prominence across the grades, showing low prominence in grades K-5, higher prominence in grades 6-8 (which is when the Statistics and Probability domain first appears), and highest prominence in High School (which is when Modeling appears as a content category with the full modeling cycle). Therefore to align to the Standards, Claim 4 will be more important on the assessment in high school, less important in grades six through eight, and the least important in grades three through five. Again, to align to the Standards, Claim 4 tasks will be most sophisticated and complete in high school (cf. the modeling cycle in CCSSM pp. 72, 73), less sophisticated/more tied to specific content in middle school, and least sophisticated/most tied to specific content in grades three through five.”
8 Text excerpted from the Smarter Balanced Mathematics Content Specifications (p. 72-73).

June 2016 l California Department of Education18
C a l i f o r n i a A s s e s s m e n t o f S t u d e n t P e r f o r m a n c e a n d P r o g r e s s
MathematicsTeacher Guide to the Smarter Balanced Assessments
Grade
11
StandardsN-Q.A A-SSE.B A-CED.A A-REI.A A-REI.B A-REI.C F-IF.B F-IF.C F-BF.AS-ID.A S-ID.B S-IC.A.1 S-IC.B F-LE.A F-LE.B F-TF.B.5 G-GMD.A.3G-MG.A
Number and Quantities – Quantities (N-Q)N-Q.A Reason quantitatively and use units to solve problemsN-Q.A.1 Use units as a way to understand problems and to guide the solution of
multi-step problems; choose and interpret units consistently in formulas; choose and interpret the scale and the origin in graphs and data displays.
N-Q.A.2 Define appropriate quantities for the purpose of descriptive modeling.N-Q.A.3 Choose a level of accuracy appropriate to limitations on measurement
when reporting quantities.
Algebra – Seeing Structure in Expressions (A-SSE)A-SSE.B Write expressions in equivalent forms to solve problemsA-SSE.B.3 Choose and produce an equivalent form of an expression to reveal and
explain properties of the quantity represented by the expression.9 a. Factor a quadratic expression to reveal the zeros of the function it
defines. b. Complete the square in a quadratic expression to reveal the maximum
or minimum value of the function it defines. c. Use the properties of exponents to transform expressions for
exponential functions. For example the expression 1.15t can be rewritten as (1.151/12)12t _≈1.01212t to reveal the approximate equivalent monthly interest rate if the annual rate is 15%.
A-SSE.B.4 Derive the formula for the sum of a finite geometric series (when the common ratio is not 1), and use the formula to solve problems. For example, calculate mortgage payments
Algebra – Creating Equations (A-CED)A-CED.A Create equations that describe numbers or relationshipsA-CED.A.1 Create equations and inequalities in one variable and use them to solve
problems. Include equations arising from linear and quadratic functions, and simple rational and exponential functions.
A-CED.A.2 Create equations in two or more variables to represent relationships between quantities; graph equations on coordinate axes with labels and scales.
9 All standards with a “star” are measured only on performance tasks.

California Department of Education l June 2016 19
C a l i f o r n i a A s s e s s m e n t o f S t u d e n t P e r f o r m a n c e a n d P r o g r e s s
Mathematics Teacher Guide to the Smarter Balanced Assessments
Grade
11
Standards (continued)
A-CED.A.3 Represent constraints by equations or inequalities, and by systems of equations and/or inequalities, and interpret solutions as viable or nonviable options in a modeling context. For example, represent inequalities describing nutritional and cost constraints on combinations of different foods.
A-CED.A.4 Rearrange formulas to highlight a quantity of interest, using the same reasoning as in solving equations. For example, rearrange Ohm’s law V = IR to highlight resistance R.
Algebra – Reasoning with Equations and Inequalities (A-REI)A-REI.A Understand solving equations as a process of reasoning and explain the
reasoning1. Explain each step in solving a simple equation as following from the
equality of numbers asserted at the previous step, starting from the assumption that the original equation has a solution. Construct a viable argument to justify a solution method.
2. Solve simple rational and radical equations in one variable, and give examples showing how extraneous solutions may arise.
A-REI.B Solve equations and inequalities in one variable A-REI.B.3 Solve linear equations and inequalities in one variable, including equations
with coefficients represented by letters.A-REI.B.4 Solve quadratic equations in one variable. a. Use the method of completing the square to transform any quadratic
equation in x into an equation of the form (x – p)2 = q that has the same solutions. Derive the quadratic formula from this form.
b. Solve quadratic equations by inspection (e.g., for x2 = 49), taking square roots, completing the square, the quadratic formula and factoring, as appropriate to the initial form of the equation. Recognize when the quadratic formula gives complex solutions and write them as a ± bi for real numbers a and b.
A-REI.C Solve systems of equationsA-REI.C.5 Prove that, given a system of two equations in two variables, replacing one
equation by the sum of that equation and a multiple of the other produces a system with the same solutions.
A-REI.C.6 Solve systems of linear equations exactly and approximately (e.g., with graphs), focusing on pairs of linear equations in two variables.

June 2016 l California Department of Education20
C a l i f o r n i a A s s e s s m e n t o f S t u d e n t P e r f o r m a n c e a n d P r o g r e s s
MathematicsTeacher Guide to the Smarter Balanced Assessments
Grade
11
Standards (continued)
A-REI.C.7 Solve a simple system consisting of a linear equation and a quadratic equation in two variables algebraically and graphically. For example, find the points of intersection between the line y = –3x and the circle x2 + y2 = 3.
A-REI.C.8 (+) Represent a system of linear equations as a single matrix equation in a vector variable.
A-REI.C.9 (+) Find the inverse of a matrix if it exists and use it to solve systems of linear equations (using technology for matrices of dimension 3 × 3 or greater).
Functions – Interpreting Functions (F-IF)F-IF.B Interpret functions that arise in applications in terms of the contextF-IF.B.4 For a function that models a relationship between two quantities, interpret
key features of graphs and tables in terms of the quantities, and sketch graphs showing key features given a verbal description of the relationship. Key features include: intercepts; intervals where the function is increasing, decreasing, positive, or negative; relative maximums and minimums; symmetries; end behavior; and periodicity.
F-IF.B.5 Relate the domain of a function to its graph and, where applicable, to the quantitative relationship it describes. For example, if the function h(n) gives the number of person-hours it takes to assemble n engines in a factory, then the positive integers would be an appropriate domain for the function.
F-IF.B.6 Calculate and interpret the average rate of change of a function (presented symbolically or as a table) over a specified interval. Estimate the rate of change from a graph.
F-IF.C Analyze functions using different representationsF-IF.C.7 Graph functions expressed symbolically and show key features of
the graph, by hand in simple cases and using technology for more complicated cases.
a. Graph linear and quadratic functions and show intercepts, maxima, and minima.
b. Graph square root, cube root, and piecewise-defined functions, including step functions and absolute value functions.
c. Graph polynomial functions, identifying zeros when suitable factorizations are available, and showing end behavior.
d. (+) Graph rational functions, identifying zeros and asymptotes when suitable factorizations are available, and showing end behavior.

California Department of Education l June 2016 21
C a l i f o r n i a A s s e s s m e n t o f S t u d e n t P e r f o r m a n c e a n d P r o g r e s s
Mathematics Teacher Guide to the Smarter Balanced Assessments
Grade
11
Standards (continued)
e. Graph exponential and logarithmic functions, showing intercepts and end behavior, and trigonometric functions, showing period, midline, and amplitude.
F-IF.C.8 Write a function defined by an expression in different but equivalent forms to reveal and explain different properties of the function.
a. Use the process of factoring and completing the square in a quadratic function to show zeros, extreme values, and symmetry of the graph, and interpret these in terms of a context.
b. Use the properties of exponents to interpret expressions for exponential functions. For example, identify percent rate of change in functions such as y = (1.02)t, y = (0.97)t, y = (1.01)12t, y = (1.2)t/10, and classify them as representing exponential growth or decay.
F-IF.C.9 Compare properties of two functions each represented in a different way (algebraically, graphically, numerically in tables, or by verbal descriptions). For example, given a graph of one quadratic function and an algebraic expression for another, say which has the larger maximum.
Functions – Building Functions (F-BF)F-BF.A Build a function that models a relationship between two quantitiesF-BF.A.1 Write a function that describes a relationship between two quantities. a. Determine an explicit expression, a recursive process, or steps for
calculation from a context. b. Combine standard function types using arithmetic operations. For
example, build a function that models the temperature of a cooling body by adding a constant function to a decaying exponential, and relate these functions to the model.
c. (+) Compose functions. For example, if T(y) is the temperature in the atmosphere as a function of height, and h(t) is the height of a weather balloon as a function of time, then T(h(t)) is the temperature at the location of the weather balloon as a function of time.
F-BF.A Write arithmetic and geometric sequences both recursively and with an explicit formula, use them to model situations, and translate between the two forms.

June 2016 l California Department of Education22
C a l i f o r n i a A s s e s s m e n t o f S t u d e n t P e r f o r m a n c e a n d P r o g r e s s
MathematicsTeacher Guide to the Smarter Balanced Assessments
Grade
11
Standards (continued)
Functions – Trigonometric Functions (F-TF) Model periodic phenomena with trigonometric functionsF-TF.B.5 Choose trigonometric functions to model periodic phenomena with
specified amplitude, frequency, and midline.
GeometryG-GMD.A Explain volume formula and use them to solve problemsG-GMD.A.3 Use volume formulas for cylinders, pyramids, cones, and spheres to solve
problems.G-MG.A Apply geometric concepts in modeling situationsG-MG.A.1 Use geometric shapes, their measures, and their properties to describe
objects (e.g., modeling a tree trunk or a human torso as a cylinder).G-MG.A.2 Apply concepts of density based on area and volume in modeling
situations (e.g., persons per square mile, BTUs per cubic foot).G-MG.A.3 Apply geometric methods to solve design problems (e.g., designing an
object or structure to satisfy physical constraints or minimize cost; working with typographic grid systems based on ratios).
Statistics and Probability – Interpreting Categorical and Quantitative Data (S-ID)
S-ID.A Summarize, represent, and interpret data on a single count or measurement variable
S-ID.A.1 Represent data with plots on the real number line (dot plots, histograms, and box plots).
S-ID.A.2 Use statistics appropriate to the shape of the data distribution to compare center (median, mean) and spread (interquartile range, standard deviation) of two or more different data sets.
S-ID.A.3 Interpret differences in shape, center, and spread in the context of the data sets, accounting for possible effects of extreme data points (outliers).
S-ID.A.4 Use the mean and standard deviation of a data set to fit it to a normal distribution and to estimate population percentages. Recognize that there are data sets for which such a procedure is not appropriate. Use calculators, spreadsheets, and tables to estimate areas under the normal curve.
S-ID.B Summarize, represent, and interpret data on two categorical and quantitative variables

California Department of Education l June 2016 23
C a l i f o r n i a A s s e s s m e n t o f S t u d e n t P e r f o r m a n c e a n d P r o g r e s s
Mathematics Teacher Guide to the Smarter Balanced Assessments
Grade
11
Standards (continued)
S-ID.B.5 Summarize categorical data for two categories in two-way frequency tables. Interpret relative frequencies in the context of the data (including joint, marginal, and conditional relative frequencies). Recognize possible associations and trends in the data.
S-ID.B.6 Represent data on two quantitative variables on a scatter plot, and describe how the variables are related.
a. Fit a function to the data; use functions fitted to data to solve problems in the context of the data. Use given functions or choose a function suggested by the context. Emphasize linear, quadratic, and exponential models.
b. Informally assess the fit of a function by plotting and analyzing residuals. c. Fit a linear function for a scatter plot that suggests a linear association.
Statistics and Probability – Making Inferences and Justifying Conclusions
S-IC.A Understand and evaluate random processes underlying statistical experiments
S-IC.A.1 Understand statistics as a process for making inferences about population parameters based on a random sample from that population.
S-IC.B Make inferences and justify conclusions from sample surveys, experiments, and observational studies
S-IC.B.3 Recognize the purposes of and differences among sample surveys, experiments, and observational studies; explain how randomization relates to each.
S-IC.B.4 Use data from a sample survey to estimate a population mean or proportion; develop a margin of error through the use of simulation models for random sampling.
S-IC.B.5 Use data from a randomized experiment to compare two treatments; use simulations to decide if differences between parameters are significant.
S-IC.B.6 Evaluate reports based on data.
Depth of Knowledge
DOK 3,4

June 2016 l California Department of Education24
C a l i f o r n i a A s s e s s m e n t o f S t u d e n t P e r f o r m a n c e a n d P r o g r e s s
MathematicsTeacher Guide to the Smarter Balanced Assessments
Grade
11
Range Achievement Level Descriptors (ALD)
Level 1 Students should be able toidentify important quantities in the context of a familiar situation and translate words to equations or other mathematical formulation. When given the correct math tool(s), students should be able to apply the tool(s) to problems with a high degree of scaffolding.
Level 2 Students should be able to identify important quantities in the context of an unfamiliar situation and to select tools to solve a familiar and moderately scaffolded problem or to solve a less familiar or a non-scaffolded problem with partial accuracy. Students should be able to provide solutions to familiar problems using an appropriate format (e.g., correct units, etc.). They should be able to interpret information and results in the context of a familiar situation.
Level 3 Students should be able to map, display, and identify relationships, use appropriate tools strategically, and apply mathematics accurately in everyday life, society, and the workplace. They should be able to interpret information and results in the context of an unfamiliar situation.
Level 4 Students should be able to analyze and interpret the context of an unfamiliar situation for problems of increasing complexity and solve problems with optimal solutions.
General Task Model Expectations for Target 4E
Tasks used to assess this target ask students to investigate the efficacy of existing models (e.g., develop a way to analyze the claim that a child’s height at age 2 doubled equals his/her adult height) and suggest improvements using their own or provided data. Other tasks for this target will ask students to develop a model for a particular phenomenon (e.g., analyze the rate of global ice melt over the past several decades and predict what this rate might be in the future). Longer constructed response items and extended performance tasks should be used to assess this target.
Allowable Response Types
Multiple-Choice, single correct response(MC); Multiple Choice, multiple correct response (MS); Equation/Numeric (EQ); Drag and Drop, Hot Spot, and Graphing (GI); Matching Tables (MA); Fill-in Table (TI) No more than six choices in MS and MA items. Short Text – Performance tasks and select CAT items.
Allowable Stimulus Materials
Effort must be made to minimize the reading load in problem situations. Use tables, diagrams with labels, and other strategies to lessen reading load. Use simple subject-verb-object (SVO) sentences; use contexts that are familiar and relevant to all or most students at the targeted grade level. Target specific stimuli will be derived from the Claim 1 targets used in the problem situation.
Construct-Relevant Vocabulary
Refer to the Claim 1 specifications to determine construct-relevant vocabulary associated with specific content standards.

California Department of Education l June 2016 25
C a l i f o r n i a A s s e s s m e n t o f S t u d e n t P e r f o r m a n c e a n d P r o g r e s s
Mathematics Teacher Guide to the Smarter Balanced Assessments
Grade
11
Allowable Tools Any mathematical tools appropriate to the problem situation and the Claim 1 target(s). Some tools are identified in Standard for Mathematical Practice 5 and others can be found in the language of specific standards.
Target-Specific Attributes
CAT items should take from 3 to 8 minutes to solve; Claim 4 items that are part of a performance task may take 5 to 15 minutes to solve.
Accessibility Guidance
Item writers should consider the following Language and Visual Element/Design guidelines when developing items.
Language Key Considerations: • Use simple, clear, and easy-to-understand language needed to assess the
construct or aid in the understanding of the context• Avoid sentences with multiple clauses• Use vocabulary that is at or below grade level• Avoid ambiguous or obscure words, idioms, jargon, unusual names and
references
Visual Elements/Design Key Considerations: • Include visual elements only if the graphic is needed to assess the construct or it
aids in the understanding of the context• Use the simplest graphic possible with the greatest degree of contrast, and
include clear, concise labels where necessary• Avoid crowding of details and graphics
Items are selected for a student’s test according to the blueprint, which selects items based on Claims and targets, not task models. As such, careful consideration is given to making sure fully accessible items are available to cover the content of every Claim and target, even if some item formats are not fully accessible using current technology.

June 2016 l California Department of Education26
C a l i f o r n i a A s s e s s m e n t o f S t u d e n t P e r f o r m a n c e a n d P r o g r e s s
MathematicsTeacher Guide to the Smarter Balanced Assessments
Grade
11
Development Notes CAT items/tasks generating evidence for Claim 4 in a given grade will draw upon knowledge and skills articulated in the progression of standards up through that grade, though more complex problem-solving tasks may draw upon knowledge and skills from lower grade levels.
Claim 1 Specifications that cover the following standards should be used to help inform an item writer’s understanding of the difference between how these standards are measured in Claim 1 versus Claim 4.
Development notes have been added to many of the Claim 1 specifications that call out specific topics that should be assessed under Claim 4.
Distinguishing between Claim 4 and Claims 1 and 2: • In early grades when equations are still new to students, an important
distinction between Claim 2 and Claim 4 is requiring a model that would lead to a problem’s solution.
At least 80% of the items written to Claim 4 should primarily assess the standards and clusters listed in the table that follows.
N-Q.A A-SSE.B A-CED.A A-REI.A A-REI.B A-REI.C F-IF.B F-IF.C F-BF.AS-ID.A S-ID.B S-IC.A.1 S-IC.B
F-LE.A F-LE.B F-TF.B.5 F-LE.B F-TF.B.5 G-GMD.A.3G-MG.A
Reminder: Claim 4 tasks may also ask students to apply content from prior grades in sophisticated applications.

California Department of Education l June 2016 27
C a l i f o r n i a A s s e s s m e n t o f S t u d e n t P e r f o r m a n c e a n d P r o g r e s s
Mathematics Teacher Guide to the Smarter Balanced Assessments
Grade
11Smarter Balanced Assessment Evidence Statements Describe Learning Expectations
The Smarter Balanced assessments are designed to gather evidence from students that shows what they know about the standards. To keep the assessment consistent with the standards and classroom learning, teachers were actively engaged in the review and revision of the evidence statements to accurately describe what performance would meet the standard at a particular grade level. For the purposes of the assessments, the standards are organized into assessment target groups. As illustrated in Figure 3,
the assessment targets provide a bridge between the content standards and the evidence that supports the claims.
The Smarter Balanced evidence statements aligned to domain and cluster standards are provided in the Smarter Balanced Item Specifications for Claim
1, Concepts and Procedures. For an example of a Claim 1 Item Specifications with evidence statements, see this grades three through five teacher guide, Figure 4 or all Claim 1 Item Specifications. In the grades six through eight teacher guide, Figure 4 provides an example of a grade eight mathematics item specification. In that example, there is a description of the expectations for students using mathematical practices in the context of problems using content knowledge of the priority standards as articulated in the Development Notes. In the high school guide, there is an example of item specifications for Claim 4, Modeling and Data Analysis in Figure 4.
Figure 5 describes how the Smarter Balanced expectations statements may be used in conjunction with classroom evidence to maximize opportunities for demonstrations of student learning in applying mathematical practices.
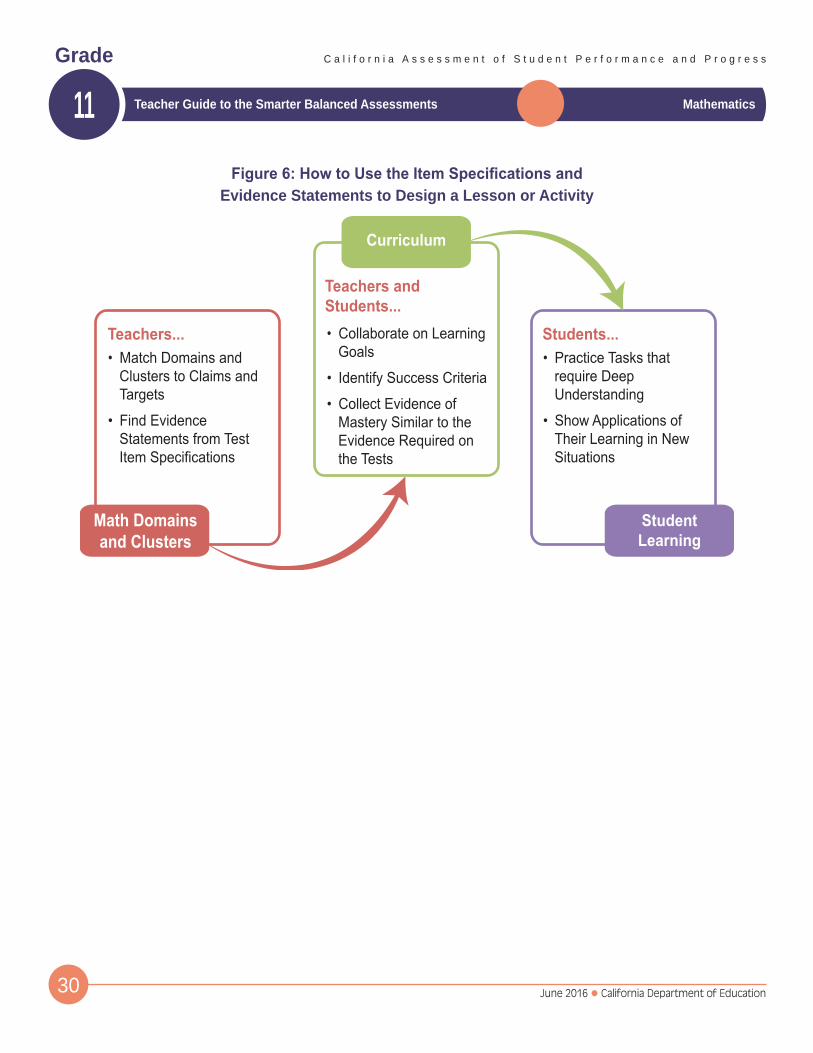
Figure 6 graphically displays the use of the Item Specifications in helping craft a classroom learning event consistent with the Smarter Balanced expectations statements in Claim 3 specifications.
T h e S m a r t e r C o n n e c t i o n
The evidence statements are directly aligned to the standard(s) being tested. Teachers may consider the evidence statements while planning classroom learning events, as well as success criteria for those events, so the classroom learning and the assessment expectations will be consistent.
June 2016 l California Department of Education28
C a l i f o r n i a A s s e s s m e n t o f S t u d e n t P e r f o r m a n c e a n d P r o g r e s s
MathematicsTeacher Guide to the Smarter Balanced Assessments
Grade
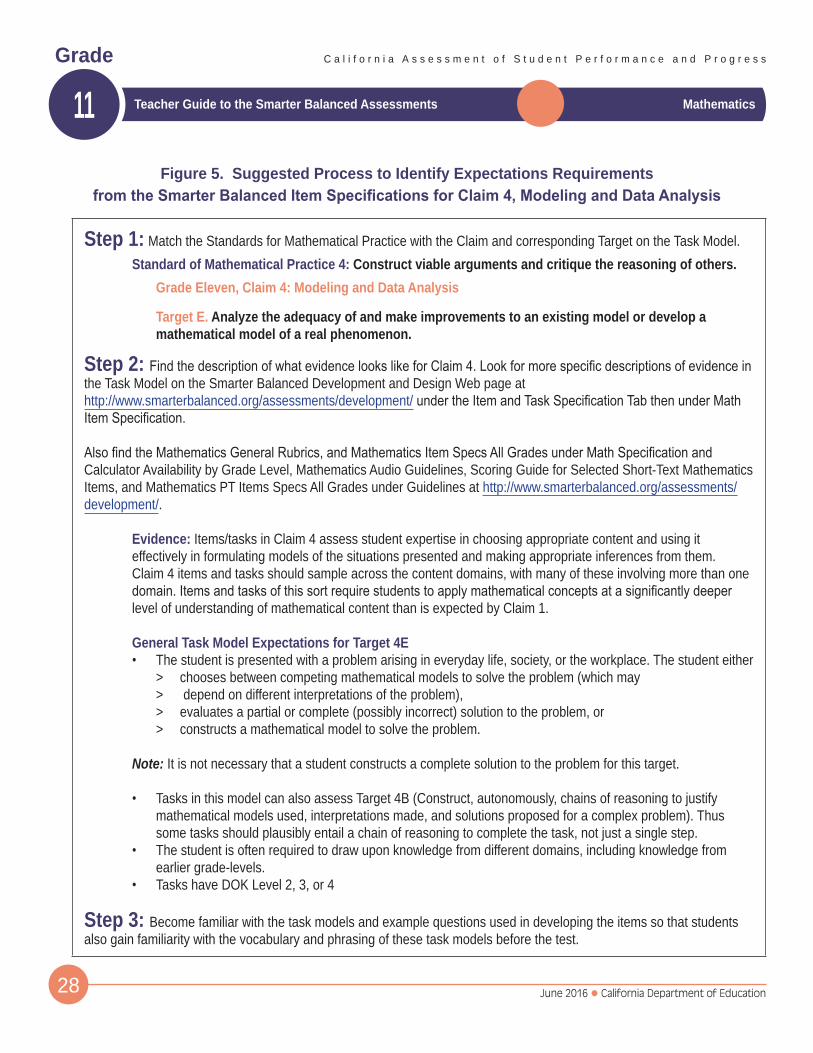
11Figure 5. Suggested Process to Identify Expectations Requirements
from the Smarter Balanced Item Specifications for Claim 4, Modeling and Data Analysis
Step 1: Match the Standards for Mathematical Practice with the Claim and corresponding Target on the Task Model.Standard of Mathematical Practice 4: Construct viable arguments and critique the reasoning of others.
Grade Eleven, Claim 4: Modeling and Data Analysis
Target E. Analyze the adequacy of and make improvements to an existing model or develop a mathematical model of a real phenomenon.
Step 2: Find the description of what evidence looks like for Claim 4. Look for more specific descriptions of evidence in the Task Model on the Smarter Balanced Development and Design Web page at http://www.smarterbalanced.org/assessments/development/ under the Item and Task Specification Tab then under Math Item Specification.
Also find the Mathematics General Rubrics, and Mathematics Item Specs All Grades under Math Specification and Calculator Availability by Grade Level, Mathematics Audio Guidelines, Scoring Guide for Selected Short-Text Mathematics Items, and Mathematics PT Items Specs All Grades under Guidelines at http://www.smarterbalanced.org/assessments/development/.
Evidence: Items/tasks in Claim 4 assess student expertise in choosing appropriate content and using it effectively in formulating models of the situations presented and making appropriate inferences from them. Claim 4 items and tasks should sample across the content domains, with many of these involving more than one domain. Items and tasks of this sort require students to apply mathematical concepts at a significantly deeper level of understanding of mathematical content than is expected by Claim 1.
General Task Model Expectations for Target 4E • The student is presented with a problem arising in everyday life, society, or the workplace. The student either
> chooses between competing mathematical models to solve the problem (which may> depend on different interpretations of the problem), > evaluates a partial or complete (possibly incorrect) solution to the problem, or > constructs a mathematical model to solve the problem.
Note: It is not necessary that a student constructs a complete solution to the problem for this target. • Tasks in this model can also assess Target 4B (Construct, autonomously, chains of reasoning to justify
mathematical models used, interpretations made, and solutions proposed for a complex problem). Thus some tasks should plausibly entail a chain of reasoning to complete the task, not just a single step.
• The student is often required to draw upon knowledge from different domains, including knowledge from earlier grade-levels.
• Tasks have DOK Level 2, 3, or 4
Step 3: Become familiar with the task models and example questions used in developing the items so that students also gain familiarity with the vocabulary and phrasing of these task models before the test.

California Department of Education l June 2016 29
C a l i f o r n i a A s s e s s m e n t o f S t u d e n t P e r f o r m a n c e a n d P r o g r e s s
Mathematics Teacher Guide to the Smarter Balanced Assessments
Grade
11
Example Item 4E.1b: Primary Target 4E (Content Domain G-MG), Secondary Target 1X (G-MG.1), Tertiary Target 4C A researcher models the area of the surface of a pond using a rectangle, a semi-circle, and an isosceles triangle. Drag each shape onto the scale diagram of the pond to show how the model fits. Explain whether the researcher’s model will estimate an area greater than, equal to, or less than the actual area of the pond’s surface.
Use specific examples and mathematics to support your answer.
Interaction: The student drags the objects from the palette and places them on top of the pond to approximate the area.Rubric: (2 points) The student is able to drag the shapes onto the pond in a way to model the best possible fit and make the determination that the pond is slightly larger than the combined areas of the three shapes. The student must supply an explanation that adjusts for the difference in size by either determining the areas of the shapes with specific values or stating how the pond is larger than the combined shapes by a certain portion of one of the shapes (e.g., the triangle needed to be about 2 units longer). (1 point) The student is able to place the shapes onto the pond in a way to model the best possible fit, but is not able to draw a correct conclusion or support the conclusion.Exemplar10: The area of the pond is slightly greater than the combined area of the three shapes. The semi-circle is the best fit, with a only small amount of the pond extending out the right side, but that is accounted for because of the gap between the pond and the semi-circle at the bottom left side. The rectangle is a good match to the main portion of the pond. However, the triangle is smaller than the remaining portion of the pond. Given the combined area of the three shapes is about 39.3 + 105 +24.5 or 168.8 sq units, I would estimate the pond to be about 175 sq units.
Response Type: Drag and Drop and Short Text (hand scored)
10 An exemplar response represents only one possible solution. Typically, many other solutions/responses may receive full credit. The full range of acceptable responses is determined during range finding and/or scoring validation.
June 2016 l California Department of Education30
C a l i f o r n i a A s s e s s m e n t o f S t u d e n t P e r f o r m a n c e a n d P r o g r e s s
MathematicsTeacher Guide to the Smarter Balanced Assessments
Grade
11Figure 6: How to Use the Item Specifications and
Evidence Statements to Design a Lesson or Activity

California Department of Education l June 2016 31
C a l i f o r n i a A s s e s s m e n t o f S t u d e n t P e r f o r m a n c e a n d P r o g r e s s
Mathematics Teacher Guide to the Smarter Balanced Assessments
Grade
11
Section Three: Instruction with Planned Evidence Collection and Feedback Helps Teachers and Students Improve Student Learning
How can teachers use the Smarter Balanced Tools to enhance the teaching and learning experience?
One of the many challenges for teachers in planning effective learning events for students is to know the specific needs of each student. Planned evidence collection during daily instruction using the formative assessment process, after a unit of instruction on a key topic using interim assessments, and at the end of the year with summative assessments provides a balanced view of the student’s learning progress. The summative assessments can affirm the evidence collected from other sources in the classroom during the school year.
The Mathematics Framework emphasizes the integrated nature of mathematics domains and clusters. No standard should be taught in isolation. Students respond to high quality, real-world tasks that apply content knowledge using standards of mathematical practice.
Performance assessment tasks based on the Smarter Balanced model give students the opportunity to demonstrate a deep understanding of the problem-solving process, using modeling and data analysis, and communicating reasoning. Teachers and students can build evidence for a solution using real-world source materials and engaging, age-appropriate questions. Examples of student responses to performance tasks on the Practice Tests as well as the Range ALD descriptions are resources for teachers and students to use to develop classroom rubrics to guide the evaluation of classroom learning.
T h e S m a r t e r C o n n e c t i o n
To accurately measure student progress in learning the content standards and standards for mathematical practice, the Smarter Balanced Content Specifications describe how to develop questions across the claims that bring coherence to the body of mathematics learned at the grade level that builds from what was learned before and supports what will be learned next.
Assessment for Learning The exemplar assessment reflects the classroom learning environment and experience of the student and collects evidence that can be interpreted to evaluate the student’s level of understanding of the standard being assessed. This is true for classroom

June 2016 l California Department of Education32
C a l i f o r n i a A s s e s s m e n t o f S t u d e n t P e r f o r m a n c e a n d P r o g r e s s
MathematicsTeacher Guide to the Smarter Balanced Assessments
Grade
11assessment as well as large-scale statewide assessment. The Mathematics Framework distinguishes between assessment for learning and assessment of learning.11 An annual summative assessment, like the Smarter Balanced Summative Assessment, is an assessment of learning; while it does not provide teachers with immediate, actionable feedback on student learning, it can provide educators with valuable information to enhance the teaching and learning process, as well as provide a valid and reliable measure of achievement at the student, school, district, and state levels.
In contrast, assessment for learning, or formative assessment, occurs during instruction, allowing teachers to adapt instruction as needed. Teaching with the formative assessment process includes challenging students with rigorous tasks. Lessons with formative assessments clarify the student learning goals and success criteria and elicit evidence of student understanding. As teachers interpret this evidence, instruction may be adjusted to optimize learning. Learning is accomplished when students demonstrate and apply the knowledge and skills of the standards. Students take an active role in their learning by using rubrics for self-assessment and peer assessment. Students collaborate with teachers to plan next steps to move up the learning progression and apply what they know to new situations to solve real-world problems. Using the formative assessment process, in conjunction with the Smarter Balanced resources, tools and results can maximize the use of assessments and assessment data in the teaching and learning cycle. Below are additional Smarter Balanced resources that can support and enhance teaching and learning.
The Smarter Balanced Assessment System offers a suite of tools and resources that support classroom-based formative assessment practices. These tools are located on the the Smarter Balanced Digital Library Web page at http://www.cde.ca.gov/ta/tg/sa/diglib.asp. The Digital Library has been built by and for educators within the Smarter Balanced Consortium. (All subscribers must provide a user name and password in order to log on to the Digital Library.)
Steps Toward Creating a More Authentic AssessmentTeachers from Smarter Balanced states, including California, participated in all phases of the test development process to push toward the delivery of an authentic assessment in a statewide system.
11 See Chapter 8 of the 2014 English Language Arts/English Language Development Framework, which is posted on the CDE’s SBE-Adopted ELA/ELD Framework Chapters Web page at http://www.cde.ca.gov/ci/rl/cf/elaeldfrmwrksbeadopted.asp.

California Department of Education l June 2016 33
C a l i f o r n i a A s s e s s m e n t o f S t u d e n t P e r f o r m a n c e a n d P r o g r e s s
Mathematics Teacher Guide to the Smarter Balanced Assessments
Grade
11As part of the test development process, Smarter Balanced held cognitive labs in participating states (including California). Students were asked to talk about what they were thinking when they answered trial test questions. This way, test developers could determine if the students were actually thinking about what the question writers intended when students answered the question. Using results from the cognitive labs, the student responses confirmed that the sample questions were at the correct level of rigor and deep understanding of the standard being tested. The labs also validated the usefulness of the technology tools for students with special needs, the ability of early elementary students to use the keyboard to manipulate the technology tools, and other critical concerns addressed by the computer-based delivery of the test.
Teachers are able to make use of the Smarter Balanced CAT items and performance tasks presented on the Practice Test to see how the collection of evidence from each question adds evidence to support all the claims in an integrated and coherent approach. These Practice Tests may be used in a whole group setting, or even used as starting points for creating classroom items or performance tasks. Teachers can gain an understanding of how the combination of evidence adds to the overall evaluation of student understanding of the math domains and clusters as a whole. With this
understanding, teachers may construct their own classroom models for collecting evidence that align pieces of evidence to each standard being assessed.
T h e S m a r t e r C o n n e c t i o n
Figure 7 provides a side-by-side comparison between the Major Principles of the California Common Core State Standards in Mathematics and the elements of the Smarter Balanced test design that support these shifts

June 2016 l California Department of Education34
C a l i f o r n i a A s s e s s m e n t o f S t u d e n t P e r f o r m a n c e a n d P r o g r e s s
MathematicsTeacher Guide to the Smarter Balanced Assessments
Grade
11Figure 7. Side by Side Comparison of the Major Principles of the California Common Core
State Standards in Mathematics9 and Smarter Balanced Test Design10
California Common Core State Standards in Mathematics
Focus
Smarter Balanced Test DesignFocus
Place strong emphasis where the standards focus
There are grade-level specific blueprints that detail the priority clusters and the additional and supporting clusters in Concepts and Procedures (Claim 1) which comprise 50% of the assessment. Each cluster is assigned a number of questions consistent with the grade level focus. Performance assessment tasks are developed using designated priority standards at each grade level.
California Common Core State Standards in Mathematics
Coherence
Smarter Balanced Test DesignCoherence
Think across grades, and link to major topics in each grade
The item specifications link the related standards from the grade below, grade at, and grade above to show the coherence of the content across grades.
California Common Core State Standards in Mathematics
Rigor
Smarter Balanced Test DesignRigor
In major topics, pursue with equal intensity: • Conceptual understanding• Procedural skill and fluency• Application
Key aspects of the grade level focus standards are tested in Claims 2, 3, and 4 to demonstrate student understanding of the application of knowledge, problem-solving, and mathematical practices. The targets in Claims 2, 3, and 4 are Standards for Mathematical Practice.
13 Overview of the Standards Chapters of the Mathematics Framework for the California Public Schools: Kindergarten through Grade Twelve (2015), California Department of Education, Sacramento, CA, page10 (found on the CDE Mathematics Curriculum Frameworks Web http://www.cde.ca.gov/ci/ma/cf/).
14 Overview of the Standards Chapters of the Mathematics Framework for the California Public Schools: Kindergarten through Grade Twelve (2015), California Department of Education, Sacramento, CA, page10 (found on the CDE Mathematics Curriculum Frameworks Web http://www.cde.ca.gov/ci/ma/cf/).

California Department of Education l June 2016 35
C a l i f o r n i a A s s e s s m e n t o f S t u d e n t P e r f o r m a n c e a n d P r o g r e s s
Mathematics Teacher Guide to the Smarter Balanced Assessments
Grade
11Item and Task Types Collect Evidence in New Ways
T h e S m a r t e r C o n n e c t i o n
The new Smarter Balanced Summative Assessments elicit greater, more precise evidence of a student’s knowledge, reasoning, and understanding.
California’s previous state tests relied almost exclusively on multiple-choice questions, which are easy to score, but somewhat limited in their ability to assess higher-order thinking skills.
Item types and tasks include, but are not limited to:
l Multi-part questions that require students to use evidence from text
l Constructed-response items, which address skills of greater complexity and requirestudents to demonstrate theirthinking
l Technology-enhanced items,which require students tomanipulate information
l A performance task (PT), whichis an extended activity thatmeasures students’ ability tointegrate knowledge and skillsacross multiple standards
All teachers are strongly encouraged to take the Practice Test to become familiar with the types of questions that students will be given on the Smarter Balanced Assessments. The Practice Test is posted on the CAASPP Web Portal at http://www.caaspp.org/practice-and-training/index.html.
Recommended Resource
Accessibility Supports and Accommodations Help All Students Meaningfully Participate
The computer-adaptive Smarter Balanced Summative Assessments provide all students with greater flexibility than do traditional pencil-and-paper tests. For example, students can increase the size of an image by using the “Zoom In” option or can highlight key
words as they read a passage. Additional options are available to students with special needs. The online tools and supports make the assessments accessible to students and ensure that the test results provide a fair and accurate measure of their achievement.
T h e S m a r t e r C o n n e c t i o n
The wide array of Smarter Balanced accessibility supports and accommodations make the tests more user friendly and allow students to better demonstrate what they know and are able to do in mathematics.

June 2016 l California Department of Education36
C a l i f o r n i a A s s e s s m e n t o f S t u d e n t P e r f o r m a n c e a n d P r o g r e s s
MathematicsTeacher Guide to the Smarter Balanced Assessments
Grade
11Three major types of supports and accommodations that are available on the Smarter Balanced Summative Assessments are as follows:
l Universal tools, such as highlighting, digital notepads, zooming in/out, embedded glossary, writing tools for the ELA full writes, and calculators for some mathematics items—available to all students
l Designated supports, such as color contrast or masking, as well as bilingual glossaries and translated test directions—available to any student who has been identified with a special need, as determined by an educator or support team
l Accommodations, such as text-to-speech, closed captioning and on-screen American Sign Language translation—available to students with an individualized education plan (IEP) or Section 504 plan
Recommended ResourceFor more information, please see the CDE CAASPP Student Accessibility Supports Web page at http://www.cde.ca.gov/ta/tg/ca/accesssupport.asp.

California Department of Education l June 2016 37
C a l i f o r n i a A s s e s s m e n t o f S t u d e n t P e r f o r m a n c e a n d P r o g r e s s
Mathematics Teacher Guide to the Smarter Balanced Assessments
Grade
11
Section Four: Using Smarter Balanced Score Reports to Analyze Data and Improve Learning
The third step in the feedback loop is to analyze the student data trends to evaluate the learning that has occurred by the students. Teachers compare the curriculum intended for learning by students with the curriculum actually learned as evidenced by the results on multiple measures, including the Smarter Balanced assessments. Teachers look at multiple sources of data, including individual results and class data to understand the “big picture” of student learning.
For Smarter Balanced results, each student’s score is placed on a continuous scale that is able to show growth from year to year. With class-level data, teachers may identify strengths and gaps of understanding in the content areas which can lead to adjustments in the teaching and learning cycle.
The Smarter Balanced assessments are designed to assess student learning at a point in time, using technology to eliminate accessibility barriers and maximize the opportunity for students to show what they know. The computer adaptive software is a critical design aspect allowing students to answer questions at an appropriate level of difficulty to collect positive evidence of knowledge that leads to an accurate score for each student.
T h e S m a r t e r C o n n e c t i o n
What do the results on the Smarter Balanced Assessments (summative and interim) indicate about student strengths and needs?
Computer Adaptive Testing: Appropriate Assessment for Each StudentIn computer adaptive testing (CAT), the computer program adjusts the difficulty of questions on the basis of student responses. For example, a student who answers a question correctly will receive a subsequent question that is more challenging, while an incorrect answer will generate a less challenging question. This approach represents a significant improvement over traditional paper-and-pencil assessments, in which all students receive the same test items, and provides teachers and schools with a more accurate way to evaluate student achievement and measure growth over time.
June 2016 l California Department of Education38
C a l i f o r n i a A s s e s s m e n t o f S t u d e n t P e r f o r m a n c e a n d P r o g r e s s
MathematicsTeacher Guide to the Smarter Balanced Assessments
Grade
11Practice Tests and Training Tests Available for Teachers, Students, and Parents
Teachers are able to use sample student responses and the Smarter Balanced Practice Test Scoring Guides to find comparisons to student work in their own classes or from
students within the grade span. Once teachers recognize the difficulty and quality of “at standard” and “above standard” responses, they are able to plan learning progressions for students to help them move from “where they are” to “where they need to be” to improve their performance.
Note: It is important that all students gain familiarity with the keyboard and are able to type text of short-to-medium length (for constructed-response items) as well as a full-length essay (for the ELA PT).
For more information, see the Smarter Balanced Web page at http://www.smarterbalanced.org/assessments/practice-and-training-tests/.
Recommended Resource
How Student Performance Is Reported on the Smarter Balanced Assessments
Recall how the Smarter Balance Summative Assessment scores are provided in different grain sizes—that is, different scores provide varying levels of detail that, taken together, can offer a productive way to examine scores. The Smarter Balanced Summative Assessment is intended to be an accurate measure of student performance at a point in time that is aligned to the state standards. Overall performance on mathematics is reported for students and for subgroups of students and provides a general description of achievement. These overall scores are particularly useful in an accountability system and can be helpful in developing the Local Control Accountability Plans required of all California districts. Claim performance may be used to help teachers understand student’s strengths and needs as well as the strengths of groups, e.g., grades programs, subgroups. The following is an explanation of the overall mathematics score and each content claim score.
For an explanation of the CAT of the Smarter Balanced Summative Assessments, view the video What Is Computer Adaptive Testing (CAT)? posted on the CAASP Current Administration of the CAASPP System Tests—Training Videos and Resources Web page at http://www.brainshark.com/ets/vu?pi=zHazEIbwozJ0cZz0&intk=189905388.
Recommended Resource

California Department of Education l June 2016 39
C a l i f o r n i a A s s e s s m e n t o f S t u d e n t P e r f o r m a n c e a n d P r o g r e s s
Mathematics Teacher Guide to the Smarter Balanced Assessments
Grade
11Overall Score and Achievement Level— Shows Student Performance on the Difficulty Scale
Students receive an overall scale score for Mathematics. On the mathematics assessment, Claim 1, Concepts and Procedures, is 50% of the overall score; Claims 2 and 4, Problem-solving, Modeling, and Data Analysis, are reported together for 25% of the score; and Claim 3, Communicating Reasoning is the remaining 25% of the overall score. The score falls along a continuous vertical scale (from approximately 2,000 to 3,000) that increases across grade levels. Based on this score, a student is determined to be at one of four achievement levels.
Let’s consider the Mathematics scale score range for grade eleven, which spans over five hundred points:
2,280 2,862
Within that range, there are four distinct achievement levels, as shown in Figure 10:
Figure 10. Grade Eleven Mathematics Scale Scores and Achievement Levels
Standard Standard Standard Standard Not Met Nearly Met Met Exceeded
2280–2542 2543–2627 2628–2717 2718–2862
T h e S m a r t e r C o n n e c t i o n
The Smarter Balanced Summative Assessment results help teachers develop lines of inquiry to improve the curriculum, enhance the teaching and learning cycle, and make learning more meaningful to students.
The achievement levels take into account the level of difficulty of the test questions. Because the test is computer adaptive, students who consistently answer correctly will be steered toward items at the higher end of the continuum, allowing for the opportunity to achieve at the Standard Exceeded level. Those who consistently answer incorrectly will be steered toward the lower end, possibly resulting in the Standard Not Met level. Regardless of the level, the score provides an accurate reflection of performance against a set of academic standards and performance expectations.
For example, teachers may look at grade-level

June 2016 l California Department of Education40
C a l i f o r n i a A s s e s s m e n t o f S t u d e n t P e r f o r m a n c e a n d P r o g r e s s
MathematicsTeacher Guide to the Smarter Balanced Assessments
Grade
11data to observe the trends of students toward each end of the difficulty continuum. If groups of students, on average, have met or exceeded the standards, there is evidence that the classroom learning events helped students practice applying deep understandings of the standards. If groups of students, on average, have not met or nearly met the standards, then teachers may consider the types of learning events, practice, and opportunities available for students to apply those deep understandings.
The tables for Smarter Balanced scale score ranges, which include the scale score ranges for ELA and mathematics by content area, grade level, and achievement level, are posted on the CDE’s Smarter Balanced Scale Score Ranges Web page at http://www.cde.ca.gov/ta/tg/ca/sbscalerange.asp.
Recommended Resource
Claim Level Achievement— Shows General Student Performance in Content Areas
The test reports will also highlight a student’s performance on each claim for Mathematics. A claim is a broad statement that identifies the set of knowledge and skills to be measured on the assessment. Figure 8 identifies the claims for Mathematics.
Figure 8. Mathematics Claim Areas
Mathematics Areas (Claims) For Grades Three, Four, and Five
Concepts & Procedures Applying mathematical concepts and procedures
Problem Solving & Modeling/Data Analysis
Using appropriate tools and strategies to solve real world and mathematical problems
Communicating Reasoning Demonstrating ability to support mathematical conclusions
Sample score reports for other grade levels are available on the CDE’s CAASPP Student Score Report Information Web page at www.cde.ca.gov/ta/tg/ca/caasppssrinfo.asp.
Recommended ResourceStudent performance for each claim is reported as “Above Standard,” “Near Standard,” or “Below Standard.” These are designed to be general indicators of the strengths or needs of the student or a group

California Department of Education l June 2016 41
C a l i f o r n i a A s s e s s m e n t o f S t u d e n t P e r f o r m a n c e a n d P r o g r e s s
Mathematics Teacher Guide to the Smarter Balanced Assessments
Grade
11of students in each claim area. The number of items making up the claim performance varies based on the specifications of the test blueprint so caution must be used in the interpretations of these scores. It is recommended that other evidence be considered along with the claim score as decisions are made about curriculum and instruction.
Use Group-Level Data to Identify Trends in Curriculum Strengths and GapsAt the end of the school year it is time to take stock of the successes in student learning. The tight alignment of the Smarter Balanced assessments to the Mathematics Framework makes the assessment results a valuable resource to begin an inquiry, a thoughtful deliberate discussion about how we can maximize the appropriate use of these results. The questions on page 36 can help guide a discussion of what the results show about student and group performance and the implications for building on student strengths and meeting student needs with curriculum resources.
Assessment Target ReportsAssessment Target Reports are a new resource for administrators and teachers. These reports show the relative performance of groups of students on assessment targets within a Concepts and Procedures, Claim 1, as long as there are sufficient responses (at least 10) for a particular target. The reports show how a group of students performed on a target compared to the overall performance on the test, which includes the performance on the other claims on the CAT and the performance assessment task. Mathematics is intended to be learned as an integrated content area. Using the formative assessment process, specific evidence for each target may be collected in multiple parts of an integrated task. By reflecting on students’ time-on-task and their opportunities for mastery throughout the year in each target area, teachers are able to compare the intended learning of groups of students with the evidence of learning on the Smarter Balanced assessments.
Assessment target score reports should serve as a starting point in an overall investigation of students’ strengths and weaknesses and constitute only one of many sources of evidence that should be used in evaluating student performance. Assessment target scores based on fewer than 50 students may be less reliable and will have fewer unique items contributing to the overall target summary. Target score reports are not appropriate for individual students.

June 2016 l California Department of Education42
C a l i f o r n i a A s s e s s m e n t o f S t u d e n t P e r f o r m a n c e a n d P r o g r e s s
MathematicsTeacher Guide to the Smarter Balanced Assessments
Grade
11The following chart lists the icons used to show the relative performance of students on the target versus the whole test.
Icon Target Level Description
Better than Performance on the test as a whole
This target is a relative strength. The group of students performed better on items from this target than they did on the rest of the test as a whole.
Similar to performance on the test as a whole
This target is neither a relative strength nor a relative weakness. The group of students performed about as well on items from this target as they did on the rest of the test as a whole.
Worse than performance on the test as a whole
This target is a relative weakness. The group of students did not perform as well on items from this target as they did on the rest of the test as a whole.
Insufficient Information Not enough information is available to determine whether this target is a relative strength or weakness.
The Assessment Target Report is generated for groups of students and is not available for individual students. Assessment targets for which there are at least 10 items available in the Smarter Balanced item pool are included on the Assessment Target Report.
These Assessment Target Reports may help validate other evidence of deep understanding collected during classroom instruction. A data-inquiry process using this target group-level data can be helpful at the classroom level, grade level, school level and districtwide to understand the successes and needs of students. Remember that these target results are relative to the total test score; therefore, recognizing the overall achievement level will be important in considering instructional strategies that address strengths or weaknesses.

California Department of Education l June 2016 43
C a l i f o r n i a A s s e s s m e n t o f S t u d e n t P e r f o r m a n c e a n d P r o g r e s s
Mathematics Teacher Guide to the Smarter Balanced Assessments
Grade
11Guiding Questions to Analyze Group-Level Data11
l What is the trend for this group of students related to being “on track” for college readiness? (Overall scores)
l What is the range of overall performance for my class or other groups of students? (Overall scores)
l Which claims appear to be areas of strength for my students? (Claim Achievement Levels)
l Which claims might be areas of need? (Claim Achievement Levels)
l Which targets show a variance from the whole test performance? (Assessment Target Report)
l Which curriculum resources might help me address student needs for the coming year? (Curriculum Resources)
l How do I find examples of student work that meet the goals for being “on track” for college readiness? (Practice Test Scoring Guides)
l What evidence do I need during classroom instruction to know that my students are making progress toward meeting the learning goals for each claim? (Evidence Statements from Item Specifications)
l Where might I find examples of evidence to meet the learning expectations for each claim? (Item Specifications and Practice Test Scoring Guides)
l How can I help my students gain familiarity with the types of questions that they will encounter on the Smarter Balanced Summative Assessments? (Item Specifications: See Appropriate Stems for Writing Items for a Target, Practice Test)
l How might I use the Smarter Balanced resources (Item Specifications, Achievement Level Descriptors, etc.) to increase my students’ awareness of performance expectations?
15 Planning Curriculum for My Students Using Smarter Balanced Score Reports and Resources (2015), located on the Smarter Balanced Digital Library Web page at https://www.smarterbalancedlibrary.org/content/planning-curriculum-my-students-using-smarter-balanced-score-reports-and-resources.

June 2016 l California Department of Education44
C a l i f o r n i a A s s e s s m e n t o f S t u d e n t P e r f o r m a n c e a n d P r o g r e s s
MathematicsTeacher Guide to the Smarter Balanced Assessments
Grade
11
Section Five: Conclusion—Putting It All TogetherAs teachers build their understanding of the intent of the standards and the relative quality of the evidence of student understanding, they increase their capacity to make adjustments in daily classroom learning events to help students move forward to meet and exceed expectations.
T h e S m a r t e r C o n n e c t i o n
Teachers can have confidence in the reliability of the information from the Smarter Balanced assessments because of the tight alignment of the assessments to the Mathematics Framework and the customization of each student’s test to get the best evidence from each student for the most accurate score.Smarter Balanced Resources
for Teachers from the Smarter Balanced Digital Library12
Smarter Balanced is an assessment system designed to support teachers and students in learning. The assessment resources complement the content standards and the instructional guidance that is provided in the Mathematics Framework. The Smarter Balanced test development resources, practice test scoring guides, and the different kinds of achievement level descriptors illustrate the thinking behind the assessment questions and the rationale for correct answers. The Smarter Balanced Digital Library has resources crafted by teachers, for teachers to share within the Smarter Balanced community. Below are two examples of what is contained in the Digital Library.
l Assessment Literacy Module: Understanding the Learnerhttps://www.smarterbalancedlibrary.org/content/understanding-learner
l Assessment Literacy Module: Students as Partners in Their Own Learning—Grades 6–12https://www.smarterbalancedlibrary.org/content/students-partners-their-own-learning-grades-6-12
l Illustrative Mathematics Modeling HS-F Modulehttps://www.smarterbalancedlibrary.org/content/illustrative-mathematics-modeling-hs-f-module
16 To access the links for these resources, the user must be logged into the Smarter Balanced Digital Library.

California Department of Education l June 2016 45
C a l i f o r n i a A s s e s s m e n t o f S t u d e n t P e r f o r m a n c e a n d P r o g r e s s
Mathematics Teacher Guide to the Smarter Balanced Assessments
Grade
11Formative Assessment Process
Teaching includes the formative assessment process with rigorous tasks. Lessons with formative assessments clarify the student learning goals and success criteria and elicit evidence of student understanding. As teachers interpret this evidence, instruction may be adjusted to optimize learning. Learning is accomplished when students demonstrate and apply the knowledge and skills of the standards. Students take an active role in their learning by using rubrics for self-assessment and peer assessment. Students collaborate with teachers to plan next steps to move up the learning progression and apply what they know to new situations to solve real-world problems.
Using the formative assessment process in conjunction with the Smarter Balanced resources, tools, and results, can maximize the use of assessments and assessment data in the teaching and learning cycle.
Below are additional Smarter Balanced resources that can support and enhance teaching and learning.
Digital Libraryl Assessment Literacy Module: Understanding the Formative Assessment Process
https://www.smarterbalancedlibrary.org/content/understanding-formative-assessment-process
Smarter Balanced Web Sitel Smarter Balanced Assessment Consortium: Signing Guidelines
Located on the Smarter Balanced Development and Design Web page at http://www.smarterbalanced.org/assessments/development/ under the Item and Task Specifications Tab then under Guidelines
l Smarter Balanced Assessment Consortium: Tactile Accessibility Guidelines
Located on the Smarter Balanced Development and Design Web page at http://www.smarterbalanced.org/assessments/development/ under the Item and Task Specifications Tab then under Guidelines
l Smarter Balanced Assessment Consortium: Bias and Sensitivity Guidelines
Located on the Smarter Balanced Development and Design Web page at http://www.smarterbalanced.org/assessments/development/ under the Item and Task Specifications Tab then under Guidelines

June 2016 l California Department of Education46
C a l i f o r n i a A s s e s s m e n t o f S t u d e n t P e r f o r m a n c e a n d P r o g r e s s
MathematicsTeacher Guide to the Smarter Balanced Assessments
Grade
11WestEd Web Sitel Understanding Proficiency
Located on the WestEd Understanding Proficiency Web page at http://understandingproficiency.wested.org
l Raising the Bar on Instruction
Located on the WestEd Research-based tools, resources, and services Web page at http://raisingthebar.wested.org
California Assessment of Student Performance and Progress (CAASPP)l Information about the CAASPP System of assessments is available at
http://www.cde.ca.gov/ta/tg/ca/
l Access to the Formative Assessment in Action Video Series is available at http://www.cde.ca.gov/ta/tg/sa/diglib.asp
l The Digital Library Professional Development Series is available at http://www.cde.ca.gov/ta/tg/sa/instructlearning.asp