calibration of conical pressure probes for determination ... · nasa tn n-mh calibration of conical...
TRANSCRIPT

N A S A TN n - m h
CALIBRATION OF CONICAL PRESSURE PROBES FOR DETERMINATION OF LOCAL FLOW CONDITIONS AT MACH NUMBERS FROM 3 TO 6
by John De Nowis
LangZey Research Center LmgZey Station, Hampton, 'Vd,
N A T I O N A L AERONAUTICS A N D SPACE A D M I N I S T R A T I O N WASHINGTON, D. C. NOVEMBER 1965
https://ntrs.nasa.gov/search.jsp?R=19660001040 2019-02-08T19:54:15+00:00Z

TECH LIBRARY KAFB, NM
I Illill 11111 Ill1 11111 HI1 I11111 Ill1 111 0130105
NASA 'I" D-3076
CALIBRATION O F CONICAL PRESSURE PROBES FOR
DETERMINATION OF LOCAL FLOW CONDITIONS
A T MACH NUMBERS FROM 3 TO 6
By John D. Nor r i s
Langley Research Center Langley Station, Hampton, Va.
NATIONAL AERONAUTICS AND SPACE ADMINISTRATION
For sale by the Clearinghouse for Federal Scientific and Technicol Information Springfield, Virginia 22151 - Price $3.00
' Ill I1 I IIIIIII lIlllllllllllll I I I

CALIBRATION OF CONICAL PRESSURE PROBES FOR
DETERMINATION OF LOCAL FLOW CONDITIONS
AT MACK NUMBERS FROM 3 TO d" By John D. Norris
Langley Research Center
SUMMARY
A wind-tunnel invest igat ion w a s conducted t o study the charac te r i s t ics of s i x cones, which varied i n diameter and cone angle, f o r use as pressure probes i n the determination of Mach number, t o t a l pressure, and flow angles. The cones had four equally spaced s ta t ic-pressure o r i f i ce s on the surface and a t o t a l - pressure o r i f i c e a t the apex. Pressure measurements were taken a t Mach numbers of 3.0, 4.5, and 6.0 and angles of p i t ch up t o about 20'. ducted a t a Reynolds number per foot (per 30.5 em) of approximately 0.85 x lo6.
The t e s t s were con-
The r e su l t s indicate t h a t Mach number can be determined within approxi- mately k3 percent and flow angles within about The possible e r r o r i n determining t o t a l pressure increases with increasing Mach number. Total pres- sure can be determined within approximately k5 percent a t a Mach number of 3.0 and kl3 percent a t a Mach number of 6.0. instrumentation and techniques employed i n t h i s invest igat ion and a r e not neces- s a r i l y the l imit ing capabi l i ty of t he method i t s e l f . In general, an i t e r a t i v e procedure i s usually required i n order t o obtain the best accuracy with t h i s method.
These quoted accuracies are f o r t he
INTRODUCTION
A t supersonic speeds, t he capabi l i ty of measuring l o c a l flow conditions (Mach number, t o t a l pressure, and flow angular i t ies ) by the use of a conical- shaped pressure probe with four equally spaced s ta t ic-pressure o r i f i ce s on the surface and a total-pressure o r i f i c e a t the apex has been f a i r l y well
~- .~ - ._ . -
*Part of t he mater ia l presented i n t h i s report i s included as a pa r t of a thes i s , e n t i t l e d "Use of a Conical Pressure Probe f o r Determination of Local Flow Conditions at M = 3 t o 6," submitted i n p a r t i a l fu l f i l lment of t h e require- ments for t he degree of Master of Mechanical Engineering, University of Virginia, Charlot tesvi l le , Virginia, June 1-96?.

establ ished up t o a Mach number of 2.46. (See r e f s . 1 t o 3.) With increased emphasis on higher speeds, it has become desirable t o extend t h i s capabi l i ty of determining l o c a l flow conditions t o hypersonic Mach numbers. If a conical pressure probe can be cal ibrated t o determine Mach number, t o t a l pressure, and flow angularity a t these higher speeds it could then be used t o measure l o c a l flow conditions i n t h e v i c i n i t y of hypersonic wing and body configurations. Knowledge of t h e l o c a l flow parameters would allow a b e t t e r understanding of three-dimensional interferences i n pa r t i cu la r regions and a l s o be of ass is tance i n posit ioning and s iz ing of hypersonic inlets.
The present invest igat ion w a s i n i t i a t e d t o determine the f e a s i b i l i t y of using a conical pressure probe with four equally spaced s ta t ic-pressure o r i f i ce s on the cone surface and a total-pressure o r i f i c e at t h e apex t o measure l o c a l flow conditions a t hypersonic speeds. A pr inc ipa l objective w a s t o ascer ta in the accuracy with which Mach number, t o t a l pressure, and flow angularity could be determined from t h e f i v e measured pressures. Considerations deemed impor- t a n t i n se lec t ion of any probe may be enumerated and it i s observed t h a t some conf l ic t s ex i s t which may be expected t o lead t o compromise. Most of the con- s iderat ions were given i n reference 3 but a r e repeated herein together with addi t ional i t e m s of spec ia l importance f o r hypersonic tes t ing :
(1) A la rge cone included angle w i l l delay flow separation t o la rge flow angles .
(2) A l a rge cone angle should provide maximum angle s e n s i t i v i t y because of t he grea te r pressure difference between diametr ical ly opposed or i f ices .
( 3 ) A s m a l l cone angle and probe diameter should minimize the probe-induced disturbances.
( 4 ) A la rge cone angle w i l l provide cone surface pressures of large magni- tude compared with t h a t of t h e stream s t a t i c pressure but w i l l not necessarily give any subs tan t ia l increase i n the Mach number s e n s i t i v i t y of t he device unless f o r t h e higher pressures grea te r instrument measurement accuracy can be achieved.
The present invest igat ion included, therefore, measurement of the charac- t e r i s t i c s of several d i f f e ren t conical probes varying i n diameter from 0.125 inch t o 0.500 inch and with cone half-angle from l 5 O t o 2 5 O . conditions were: Mach number range, from 3 t o 6; angle-of-pitch range, up t o approximately 20°; and roll-angle range, through 3 6 0 ~ . The angle ranges per- mitted simulation of a broad range of e f f ec t ive downwash and sidewash flow combinations.
The t e s t
CP
SYMBOLS
Ps - p1
q1 surfsce pressure coefficient,
2

M 1
- PA
PS
pt, 1
Pt, 2
P1
Mach number ahead of normal shock wave at cone apex ( l o c a l stream Mach number)
ar i thmetic mean of four cone surface s t a t i c pressures, 1 y(ps,a -+ 's,b + 's,c + ps,d)
s t a t i c pressure on cone surface
t o t a l pressure ahead of normal shock wave a t cone apex ( l o c a l stream t o t a l pressure)
t o t a l pressure measured behind normal shock wave at cone apex ( p i t o t p res sure )
s t a t i c pressure ahead of normal shock a t cone apex ( l o c a l stream s t a t i c pressure)
ps,c - Ps,a q1
difference i n pressures between o r i f i c e s c and a,
( see f i g . 2)
ps,d - ps,b difference i n pressures between o r i f i c e s d and b, q1
(see f i g . 2)
dynamic pressure ahead of normal shock at cone apex ( l o c a l stream dynamic pressure)
ve loc i t i e s i n the X-, Y-, and Z-directions, respect ively (see f i g . 2)
veloci ty ahead of normal shock wave a t cone apex, l o c a l stream veloci ty
body axes ( see f i g . 2)
angle of a t tack ( see f i g . 2)
angle of s ides l ip ( see f i g . 2)
angle of downwash ( see f i g . 2)
angle of p i t ch of cone axis (see f i g . 2)
angle of sidewash (see f i g . 2)
angle of roll ( see f i g . 2)
3
II IllllIllIIllI -1 l l l l l l l l I

Subscript s :
a,b,c,d posi t ion of o r i f i c e s on cone surface (see f i g . 2)
0 quantity a t angle of p i tch
e=o quantity a t zero angle of p i tch
MODELS
Probes
Principal d e t a i l s of s i x cone-cylinder probes, which varied i n cone diam- eter from 0.125 in . (0.318 cm) t o 0.500 in . (1.27 cm) and i n cone half-angle from 150 t o 2 5 O , are shown i n f igure 1 and t a b l e I. o r i f i ce s were circumferentially located 90° apart on t h e cone surface ( f i g . 2) and a total-pressure o r i f i c e w a s located at t h e cone apex.
Four s ta t ic-pressure
Model Support
The conical pressure probes were mounted on a wedge-shaped strut t h a t extended horizontal ly and on t h e tunnel center l i n e across the tunnel t es t sec- t i o n as shown i n figure l ( b ) . The strut had a 15' half-angle and provisions were made f o r mounting the probe models so t h a t t h e s t a t i c -o r i f i ce locat ions would be 2.15 in . (5.46 cm) ahead of t he sharp-wedge leading edge. Three cones were mounted simultaneously f o r t e s t i n g a t t h e three indicated posi t ions. strut w a s pitched about an axis which passed through t h e s t a t ion of t he s t a t i c - pressure o r i f i ce s of t h e probes. Provisions were made t o roll t he probes about t h e i r longi tudinal axis of symmetry which when coupled with p i tch angle would permit simulation of d i f f e ren t combinations of downwash and sidewash.
The
TESTS, INSTRUMENTATION, AND PRECISION
The t e s t s were conducted i n the 2-foot hypersonic f a c i l i t y a t t he Langley Research Center ( r e f . 4) at Mach numbers of 3, 4.5, and 6 and a Reynolds number per foot (per 30.5 cm) of approximately 0.85 x 10⁶. Pressure measurements were obtained up t o about +20° angle of p i tch and through 360° angle of roll. invest igat ion w a s conducted i n such a way t h a t each roll angle required a separate run.
The
Measurements of t he pressures indicated by the f i v e o r i f i ce s on each probe were obtained by means of 2-psia ( 13.79-kN/m2) transducers referenced t o zero pressure. These pressure transducers were cal ibrated three t i m e s during the t e s t i n g period and no changes i n ca l ibra t ion s e n s i t i v i t i e s were noted. t o t a l pressure of t h e tunnel w a s measured by a precision electromanometer. Also employed during t h e invest igat ion w a s a radiation-type pressure-sensing instrument used t o measure the s t a t i c pressure i n t h e tunnel t es t section.
4
The
I I 111 I 111 IIii I I
1111 -111 I 1 1 1 II II I ~ I I I I I

The Mach number w a s set by using t h e appropriate r a t i o of t h e tunnel s t a t i c pressure t o t h e tunnel t o t a l pressure. Since both pressures were meas- ured by high accuracy instrumentation a l l t h e t e s t s were conducted under iden- t i c a l conditions. The Mach number w a s a l so checked from t h e r a t i o of t h e tunnel t o t a l pressure t o t h e p i t o t pressure sensed by t h e pressure probe a t zero angle of a t tack .
The approximate uncer ta in t ies of t h e t es t data and conditions, as estimated on the bas i s of random s c a t t e r and deviations from mean values, are as follows:
c p . . . . . . . . . . . . . . . . . . . . . . . . . . . . . . . . . . . ko.030 ap/q1 . . . . . . . . . . . . . . . . . . . . . . . . . . . . . . . . . kO.020 ijA/pt,2 . . . . . . . . . . . . . . . . . . . . . . . . . . . . . . . . koa003
M i . . . . . . . . . . . . . . . . . . . . . . . . . . . . . . . . . . . kO.010 8, deg . . . . . . . . . . . . . . . . . . . . . . . . . . . . . . . . . kO.13 $, deg . . . . . . . . . . . . . . . . . . . . . . . . . . . . . . . . . k0.15
These estimates are believed t o a f ford reasonable indicat ions of t h e instrumentation e r ro r s although it does not preclude t h e poss ib i l i t y of any unknown systematic e r ro r s or represent t h e m a x i m u m possible e r r o r t h a t could occur. The angle settings are referenced t o t h e tunnel center l i n e .
PRESENTATION OF RESULTS AND METHODS
The basic data are presented i n d e t a i l f o r probe 1 i n f igu res 3 t o 7. Typical da ta f o r a l l s i x d i f f e ren t conical probes employed i n t h i s investiga- t i o n have been presented i n t h e form of p l o t s of s ta t ic-pressure differences against angle of p i tch f o r representat ive t es t conditions. These da ta are shown i n figures 7 t o 12. The da ta f o r probe 1 appeared more consistent than those f o r t h e smaller t e s t e d probes and were used t o prepare de t a i l ed analysis char ts ( f i g s . 13 and 14) from t h e r e s u l t s of f igure 7. The problems encountered with t h e s m a l l probes were considered t o be primarily of mechanical nature. These d i f f i c u l t i e s included a b i l i t y t o set and ad jus t p i t ch and roll angles with inadequate auxi l ia ry devices and t o achieve adequately settled pressures f o r t h e s m a l l o r i f i c e s i zes and r e l a t ive ly la rge response chambers i n t h e avai lable measurement instrumentation. The inadequacies of t e s t i n g technique should not be construed t o mean t h a t accurate da ta cannot be obtained with s m a l l probes, ra ther t h a t su f f i c i en t care should be exercised i n the se lec t ions of technique and instrumentation t o insure sa t i s f ac to ry r e su l t s .
From t h e basic data f igu res and analysis charts of probe 1 t h e Mach num- ber, t o t a l pressure, and flow angles of previously undefined flow can be deter- mined from t h e f ive probe pressure measurements. dure, discussed i n d e t a i l i n t h e following section, i s as follows:
The general i t e r a t i v e proce-
(1) Assume that t h e conical pressure probe i s at zero angle of p i t ch and t h a t from t h e r a t i o of ar i thmetic mean surface s t a t i c pressures t o t h e measured
5

p i t o t pressure PA/ptJ2 an approximate Mach number can be obtained from f igure 4.
( 2 ) From t h i s i n i t i a l Mach number and t h e measured p i t o t pressure ptJ2, t h e ac tua l stream t o t a l pressure total-pressure r a t i o across a normal shock. Mach number, t he dynamic pressure re la t ions .
ptJl
q l
can be obtained from the theo re t i ca l N e x t , from the t o t a l pressure and
can be obtained by using t h e i sen t ropic
( 3 ) From t h e difference i n pressures across t h e two sets of diametr ical ly can be employed along with f igures 13 and opposed o r i f i ce s , t h e f a c t o r Ap/ql
14 t o determine t h e flow angles.
(4) With the flow angular i t ies known, a correct ion can be applied t o FAFtJ2 from s t ep 1 t o convert it t o a zero angle-of-pitch value ( f i g . 3 ) . Steps 1 and 2 are then repeated t o obtain corrected values of Mach number and t o t a l pressure. appendix.
A numerical example of t h i s procedure i s presented i n the
DISCUSSION OF RESULTS
In order t o assess the capabi l i ty of t h e conical probe t o determine t h e flow propert ies of an unknown flow f i e l d t h e experimental data a re discussed t o show how t h e p a r t i c u l a r desired property i s influenced. Also, t he i t e r a t i o n procedure i s explained i n f u r t h e r d e t a i l with regards t o appl icat ion and t h e resu l t ing inaccuracies.
Cone Pressure Dis t r ibu t ion
Figure 3 i l l u s t r a t e s t he pressure d i s t r i b u t i o n around t h e surface of probe 1 f o r t h e th ree test Mach numbers and various angles of p i tch . This f i g - ure demonstrates t h e approximate symmetry of t he da ta at equivalent geometrical locat ions on opposite s ides of t h e cone. r e s u l t t h a t a t nominally zero angle of p i t ch the surface pressures a r e essen- t i a l l y constant and increasing angle of p i t ch increases the surface pressure on the windward surface and decreases the pressure on t h e leeward surface. Although a l l t h e pressure coef f ic ien ts a r e posi t ive, t h i s t rend would ind ica te t h a t e i t h e r f u r t h e r increases i n +,he angle of p i t ch o r decreases i n the included cone half-angle would induce negative pressure coef f ic ien ts on the leeward surf ace.
I l l u s t r a t e d a l s o i s the expected
Determination of Mach Number
The determination of Mach number using a conical p i t o t - s t a t i c pressure probe depends on t h e r a t i o of t h e surface s t a t i c pressure t o the p i t o t pressure and on the flow inc l ina t ion (angles of p i t ch and roll). A t zero angle of p i t ch
6

t h e Mach number can be computed from t h e r a t i o of t he surface s t a t i c pressure t o the p i t o t pressure which i n t h i s invest igat ion would be equivalent t o pA/pt,2. Figure 4 presents t he experimental r e su l t s of t h i s condition f o r
probe 1 and a l so the theo re t i ca l values (ref. 5) f o r a sharp-nose cone (no pitot-pressure o r i f i c e ) . i c a l values and it appeared t h a t t he experimental value a t t i v e l y higher than the experimental values at M1 = 3 and M1 = 6 when com- pared with t h e i r corresponding theo re t i ca l values. Although not shown, t h i s same re su l t occurred t o a l e s s e r degree f o r t h e other f i v e probes t e s t ed .
The experimental r e su l t s were lower than the theoret- M 1 = 4.5 w a s rela-
A t angles of pitch, l a rge var ia t ions i n t h e s t a t i c pressure occur around the circumference of t h e cone as previously shown i n f igure 3. It would be desirable t o be able t o combine the four measured pressures on t h e cone surface i n such a manner as t o provide a pressure which i s e s sen t i a l ly invariant t o changes i n angle of p i tch . r e s t r i c t ed t o Mach numbers near 1.60, indicate t h a t f o r low angles of p i t ch the ar i thmetic average of t he four s t a t i c pressures i s nearly constant. Refer- ence 3 indicates t h a t f o r MI = 1.95 t h e ari thmetic average i s constant up t o angles of p i tch of approximately 15'; f o r var ia t ion of t he r a t i o of t he ar i thmetical ly averaged s t a t i c pressures t o t h e p i t o t pressure
probe 1. For convenience has been normalized t o t h e zero pi tch value.
Geometrically s i m i l a r r o l l angles were grouped together inasmuch as the aver- aged s t a t i c pressures would be expected t o be the same because of symmetry. The data indicate t h a t increasing Mach number decreases t h e p i tch range i n which t h e r a t i o of t h e ar i thmetical ly averaged s t a t i c pressures t o t h e p i t o t pressure
w a s constant w i t h i n 1 percent up t o approx- w a s constant. A t M1 = 3, imately 5' of pitch; whereas, at M1 = 6, !j5A/pt,2
cent only up t o 2O o r 3 O of p i tch . not have a large e f fec t on
GA/pt,2 i n going f r o m @ = Oo t o
The r e s u l t s of references 1 and 2, which were
M1 = 2.46, only up t o about 8 O . The
cA/pt,2 w i t h angle of p i tch i s presented i n f igure 5 f o r
w a s constant within 1 per- C A P t , 2
Figure 5 i l l u s t r a t e s t h a t angle of r o l l does although there i s a s l igh t decrease i n
@ = 40' and f rom @ = 90' t o @ = 50°. ' A p t , 2
I n general, t h e procedure f o r determining Mach number i s f i rs t t o assume 0 = 0. A f i rs t approximation of t he Mach number M1 i s then obtained from f igure 4 f o r t he measured value of A t,2. The flow angles 8 and @ a re then determined by t h e method described i n t h e sect ion "Determination of Flow Angles." When 0 and $ a re known along with the f irst approximation of M1, a correction fac tor f o r ijA/ptJ2 i s obtained from f igure 5 and an equivalent value of P,/ptJ2 corresponding t o 0 = 0 i s calculated by a divis ion of t he
measured value by t h i s correction f ac to r . I n some cases b e t t e r accuracy can be obtained by an interpolat ion between the Mach number curves i n f igure 5 . For example, if t h e f i rs t approximated Mach number i s 3.2 then t h e M1 = 3 curve can be s a t i s f a c t o r i l y used but i f the first approximated Mach number happened t o be 5.25 then an average between t h e M1 = 4.5 and M1 = 6.0 curves would give a more accurate correction f ac to r .
+

A second approximation of t h e Mach number can be obtained from figure 4 by using the equivalent cA/pt value f o r e = 0. Generally a second itera-
t i o n i s required but a t h i r d i t e r a t i o n would be unnecessary. If 0 w a s found t o be s m a l l so t h a t t he correction f ac to r i s near un i ty then the first approxi- mation i s suf f ic ien t .
7
Figure 4 shows that t h e slope of t h e curve of CA/pt p lo t ted against >
Mach number decreases with increasing Mach number. This r e su l t i s detrimental t o the a b i l i t y t o determine Mach number accurately i n t h a t any s m a l l uncertainty
could introduce a s igni f icant e r r o r i n Mach number a t the higher in 'Ab,,, Mach numbers. This technique or procedure would therefore be of l imited use- fulness a t higher hypersonic speed ranges. of free-stream s t a t i c pressure t o p i t o t pressure behind a normal shock, which i l l u s t r a t e s t he r e l a t ive magnitude of t h e cone surface pressure t o the free- stream s t a t i c pressure.
Also shown i n f igure 4 i s the r a t i o
The e r ro r i n determining Mach number with probe 1 by use of f igures 4 and 5 w a s estimated t o be k0.06 a t M = 3, k0.12 a t M = 4.5, and k0.20 a t M = 6.0.
Determination of Total Pressure
The t o t a l pressure pt,l i s a function of p i t o t pressure pt,2, Mach num- ber M1, and angle of p i tch . t h e r a t i o of t he p i t o t pressure t o t he t o t a l pressure i s equal t o t h e theore t i - c a l total-pressure r a t i o across a normal shock wave. Once the Mach number i s known from the preceding section, pt,2/pt,l can be found f o r t h a t Mach number using the theo re t i ca l t ab l e s of reference 6. The t o t a l pressure can then be obtained since the measured p i t o t pressure i s known.
The assumption i s made t h a t a t zero angle of p i tch
The e f f ec t of Mach number and angle of p i t ch on the measured p i t o t pres-
M1 = 4.5, t h e angle-of-pitch range t e s t ed had a negl igible e f f ec t on the
A t Mach number 6, however, t he measured
sure i s shown i n f igure 6 f o r probe 1. and measured p i t o t pressure, or t h a t a t 8 = 20' t h e probe measured the same p i t o t pressure as it would have at 8 = 0. p i t o t pressure i s no longer independent of p i tch angle and above p i t o t pressure must be divided by an appropriate correction f ac to r from the
The r e s u l t s ind ica te tha t , f o r M1 = 3
8 = 14O t he
a t t , 2 ca l ibra t ion using f igure 6 i n order t o obtain an equivalent value of p e = 0.
Since t h e a b i l i t y t o determine t o t a l pressure depends on Mach number, it i s evident from t h e preceding discussion of Mach number t h a t t he accuracy of determining t o t a l pressure diminishes with increasing Mach number. The e s t i - mated possible e r r o r i n determining t o t a l pressure i s 7 percent at MI = 3.0, 10 percent a t Mi = 4.5, and 13 percent at M i = 6.0.
8

Determination of Dynamic Pressure
Since the dynamic pressure q,
Ap/ql
i s calculated from Mach number and t o t a l pressure it would appear t h a t t he e r ro r s associated with MI and ptJl would
be accumulative and t h e f ac to r could not be used with any degree of confidence i n determining flow angles. However, t h i s i s not so i n tha t any e r ro r s i n Mach number and t o t a l pressure w i l l counterbalance each other i n the calculat ion of t h e dynamic pressure and i n ac tua l i t y can be determined within 112 percent.
ql
The f a c t t h a t ql can be determined with a high degree of accuracy sug- ges t s t h e poss ib i l i t y of one fu r the r i t e r a t i o n using
indicat ion of Mach number and i n tu rn t o t a l pressure. p rac t i ca l because q1/ptJ2 i s l e s s sens i t ive than PA/ptJ2 number.
ql p t o get a b e t t e r / t J 2 This however i s not
( f i g . 4 ) t o Mach
Determination of Flow Angles
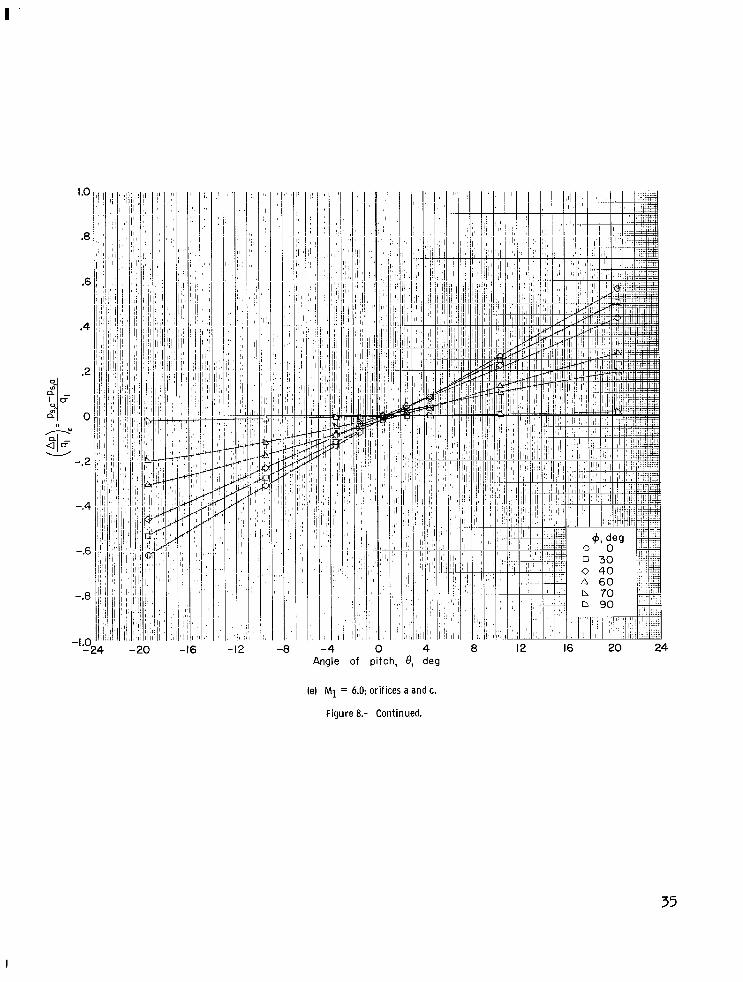
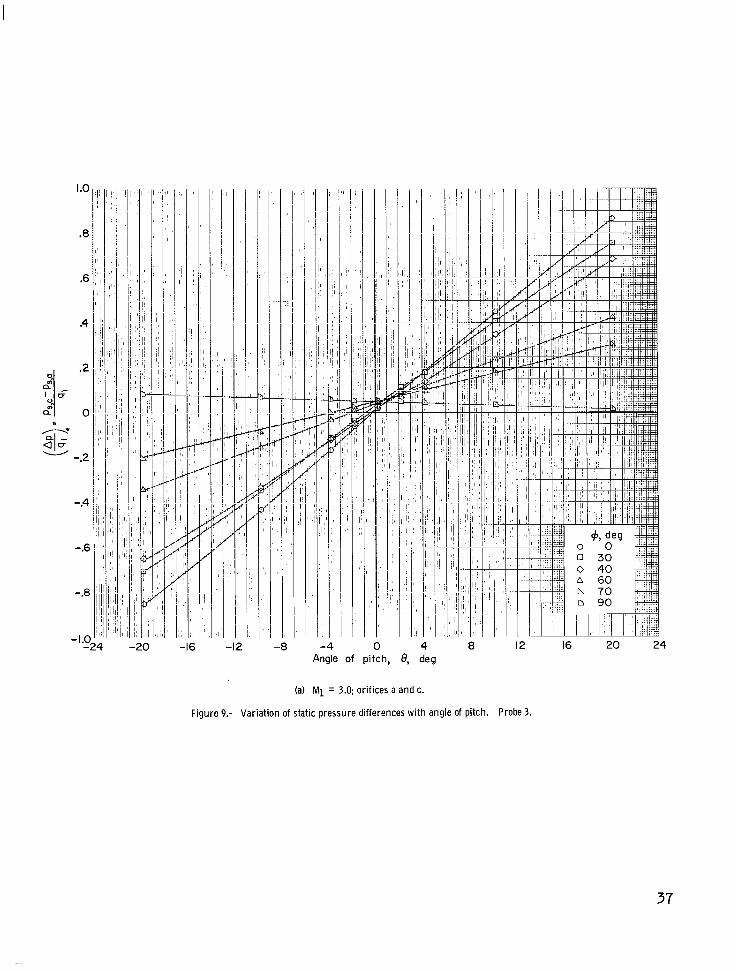
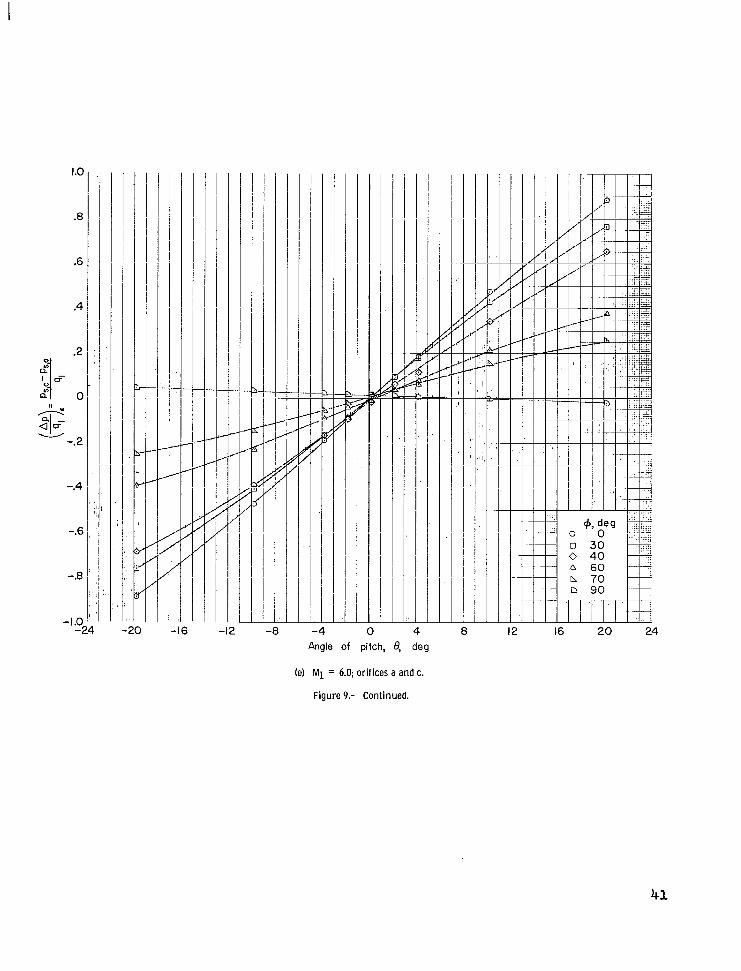
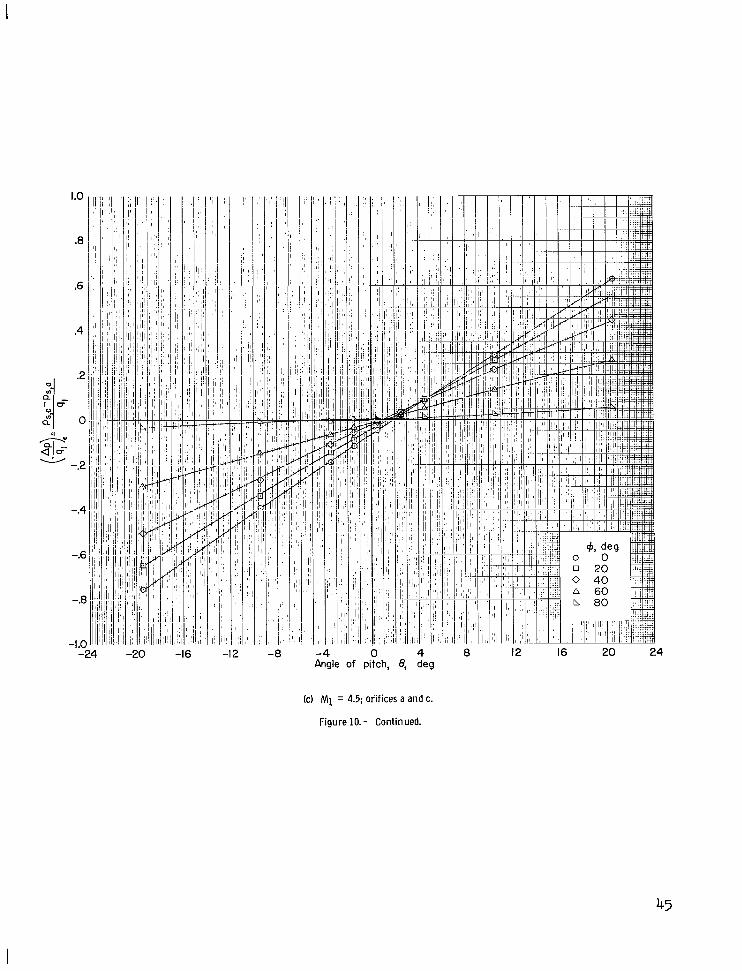
The flow angles can be determined from the pressure differences across diametrically opposed o r i f i ce s . The var ia t ion of t he difference i n s t a t i c - pressure coeff ic ient across opposed o r i f i c e s with angle of p i tch f o r the var i - ous Mach numbers a re presented i n f igures 7 t o 12 f o r probes 1 t o 6, respec- t i ve ly . Because of wind-tunnel stream angularity, support misalinement, and probe asymmetry a l l the curves do not pass through the or igin. Comparing probe 1 ( f i g . 7), probe 2 ( f i g . 8 ) , and probe 3 ( f i g . 9) indicates the expected result t h a t increasing the included cone angle causes an increase i n the pres- sure difference between the s e t s of diametrically opposed o r i f i ce s . The curves were approximately l i n e a r a t but as the Mach number increased t o 6 some curvature i s shown.
M = 3
In order t o f a c i l i t a t e t h e determination of 8 and $ from measurements
of e) and (F) , t h e r e s u l t s of f igure 7 have been combined i n f igure 13 E 0
t o give p lo t s of ($)E against (%)o f o r various values of e and $ f o r
probe 1. The curves of f igure 7 were f irst adjusted t o eliminate t h e e f f ec t s of tunnel stream angularity, support misalinement, and probe asymmetry.
Because of symmetry, curves which represent an average of t h e da ta are shown i n one quadrant only. Information for t he other quadrants can then be determined from t h i s f igure provided the proper sign convention i s used as indicated.
The downwash E and sidewash cs can be determined d i r e c t l y from t h e i r r e l a t ion with angle of p i tch 8 and angle of roll $ which i s
9
I

.. .. . .. .. .. . .-.
t an E = -tan e cos 6 t a n u = t an e s i n fl
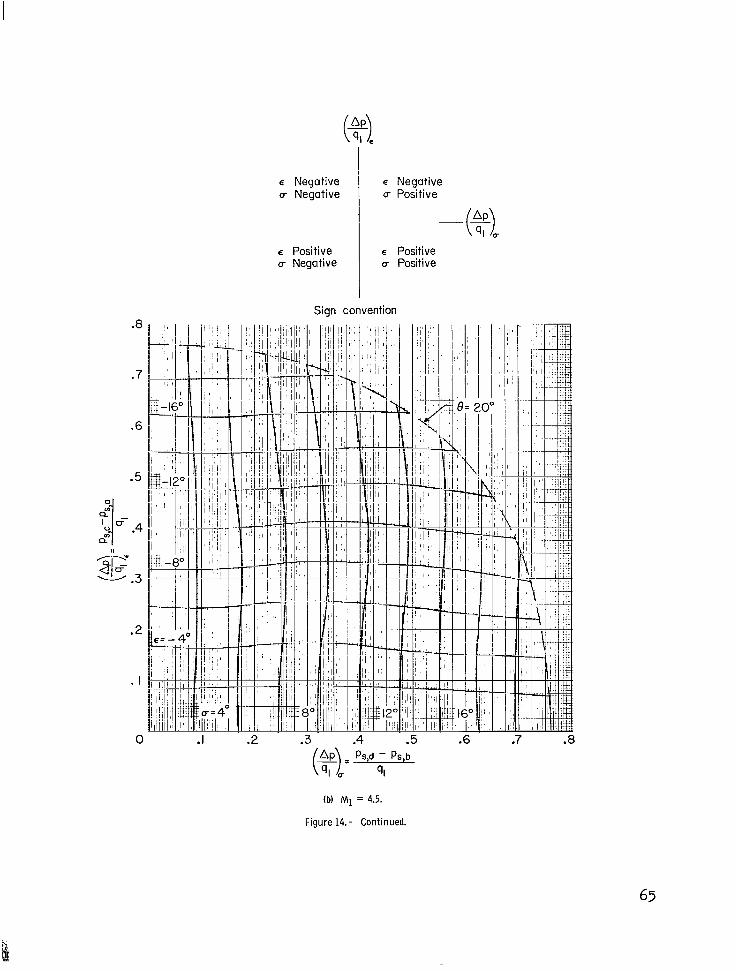
Figure 1 4 i s t h e trigonometric conversion from f igu re 13 and presents
p lo t ted against
wash IS. Comparison of f igures 14(a) , 14(b), and 14 (c ) demonstrates a marked s imi la r i ty between t h e charts f o r t h e three Mach numbers.
f o r various angles of downwash E and angles of side- WU The procedure f o r determining flow angles i s t o f i n d the difference
between the measured surface s t a t i c pressures and with the calculated value of
dynamic pressure ql t h e fac tors can be obtained. Using
these f ac to r s along with f igures 13 and 14, t h e values of 8, 6, E, and CI can be found. cussed.
Any necessary correction can then be applied as previously dis- The e r ro r i n determining flow angles i s estimated t o be fO.5'.
CONCLUDING REMARKS
A wind-tunnel invest igat ion w a s conducted t o study t h e charac te r i s t ics of s i x d i f f e ren t conical probes f o r use i n determining l o c a l flow conditions. Charts were prepared f o r one of t h e probes t h a t enable t h e d-etermination of l o c a l Mach number, t o t a l pressure, and flow angular i ty from probe-indicated pressures. 6.0 and a t angles of p i t ch up t o about 20°.
Pressure measurements were taken a t Mach numbers of 3.0, 4.5, and
The r e s u l t s ind ica te t h a t Mach number can be determined within approxi- The possible e r r o r i n mately k3 percent and flow angles within about fO.50.
determining t o t a l pressure, however, increases with increasing Mach number. Total pressure can be determined within approximately f5 percent a t a Mach num- ber of 3.0 and fl3 percent a t a Mach number of 6.0. a r e f o r t h e instrumentation and techniques employed i n t h i s invest igat ion and are not necessarily the l imi t ing capabi l i ty of t h e method i t s e l f . In general an i t e r a t i v e procedure i s usually required i n order t o obtain the best accuracy with t h i s method.
These quoted accuracies
Langley Research Center, National Aeronautics and Space Administration,
Langley Station, Hampton, Va., June 25, 1-96?.
10
APPENDIX
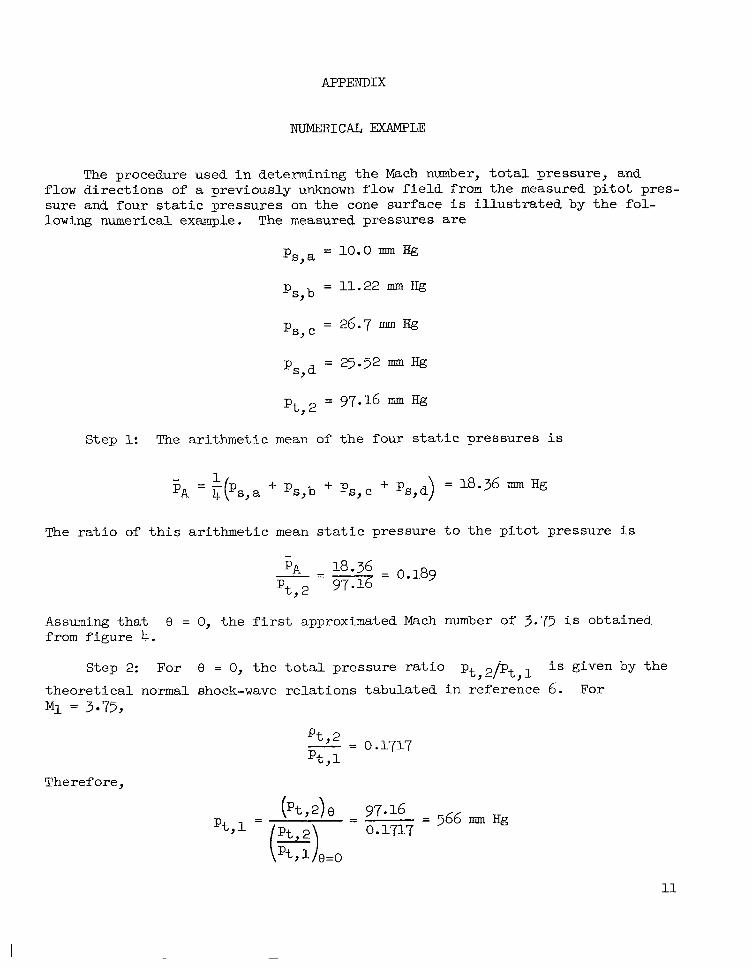
The procedure used i n determining t h e Mach number, t o t a l pressure, and flow direct ions of a previously unknown flow f i e l d from t he measured p i t o t pres- sure and four s t a t i c pressures on t h e cone surface i s i l l u s t r a t e d by t h e fo l - lowing numerical example. The measured pressures are
= 10.0 mm Hg Ps, a
= 11.22 Hg ps, b
= 26.7 I-I~ ps, c
pt, = 97-16 " Hg
The arithmetic mean of t h e four s t a t i c pressures i s Step 1:
The r a t i o of t h i s ar i thmetic mean s t a t i c pressure t o t h e p i t o t pressure i s
Assuming t h a t from f igure 4.
9 = 0, the f i rs t approximated Mach number of 3.75 i s obtained
Step 2: For 0 = 0, t h e t o t a l pressure r a t i o Pt ,2/pt, 1 i s given by the
theo re t i ca l normal shock-wave re la t ions tabulated i n reference 6. For M1 = 3.75,
Pt'2 - - - - 0.1717 P t , l
Theref ore,
11

APPENDIX
The dynamic pressure i s obtained from t h e theo re t i ca l isentropic flow
re l a t ion ql/pt, which i s a l so tabulated i n reference 6. For MI = 3.75, q1
- = 0.09098 Pt, 1
and t h e dynamic pressure ql i s
Step 3: Dividing t h e of o r i f i c e s by t h e dynamic
= (0.09098)(566) = 31.5 mm ~g Pt, 1
measured s ta t ic-pressure difference across both p a i r s pressure gives
The downwash and sidewash angles can now be obtained from f igure 14 by using
. Since M1 = 3.75, however, it i s not immedi- t h e f ac to r s
a t e l y evident whether t h e f igure f o r Mi = 3 or Mi = 4.5 would provide t h e b e t t e r r e su l t s . It i s subsequently shown t h a t any angle-of-pitch e f f ec t s cause t h e i n i t i a l approximated Mach number t o be low; therefore, when f igure 14(b) f o r M = 4.5 i s used,
ME and
E = - 7 . 8 O
Also i n order t o correct t he Mach number f o r flow angular i ty effects , t he angles of p i tch and roll must be known. From f igure l3 (b ) ,
fl = 40'
e = ioo
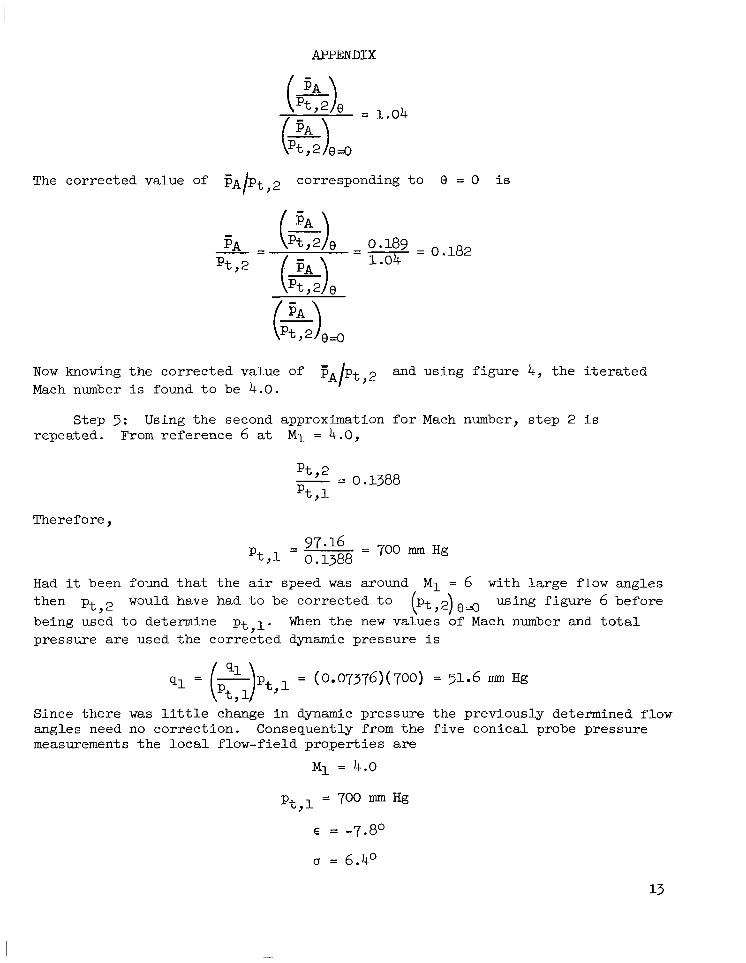
Step 4: Once the p i t ch and roll angles are known, t h e correction f ac to r can be obtained from figure 5. Interpolat ing between t h e curves f o r M = 3 and M = 4.5, t h e correction f ac to r i s
1 2
APPENDIX
The corrected value of c~ pt corresponding t o 8 = 0 i s I ,
0.189 1.04 = 0.182
Now knowing the corrected value of FA/pt,* and using f igure 4, the i t e r a t ed Mach number i s found t o be 4.0.
Step 5: Using the second approximation f o r Mach number, s t ep 2 i s repeated. From reference 6 at Mi = 4.0,
Pt ,2
P t , l - = 0.1388
Therefore,
97'16 = 700 mm Hg - - 't,l 0.1388
Had it been found t h a t the air speed w a s around then pt,2 would have had t o be corrected t o being used t o determine pt , l . pressure a re used the corrected dynamic pressure i s
MI = 6 with large flow angles ( ~ t , 2 ) ~ ~ using f igure 6 before
When the new values of Mach number and t o t a l
q1 = ($)Pt,l = (O.O7376)(700) = 51.6 mm Hg
Since there was l i t t l e change i n dynamic pressure the previously determined flow angles need no correction. Consequently from the f i v e conical probe pressure measurements the loca l flow-field propert ies a re
Mi = 4.0
P t , l = 700 " Hg E = -7.8'
0 = 6.4'

REFERENCES
1. Cooper, Morton; and Webster, Robert A.: The Use of an Uncalibrated Cone f o r Determination of Flow Angles and Mach Numbers a t Supersonic Speeds. TN 2lg0, 1951.
NACA
2. Davis, Theodore: Development and Calibration of Two Conical Yawmeters. Meteor Rept. UAC-43, United Aircraf t Corp., Oct. 1949.
3. Centolanzi, Frank J.: Character is t ics of a 40° Cone f o r Measuring Mach Number, Total Pressure, and Flow A n g l e s a t Supersonic Speeds. NACA TN 3967, 1957-
4. Stokes, George M.: Description o f a 2-Foot Hypersonic Fac i l i t y at the Langley Research Center. NASA TN D-939, 1961.
3 . Sims, Joseph L.: Tables f o r Supersonic Flow Around Right Circular Cones a t Zero Angle of Attack. NASA SP-3004, 1964.
6. Ames Research Staff : Equations, Tables, and Charts f o r Compressible Flow. NACA Rept. 1135, 1953. (Supersedes NACA TN 1428.)
14
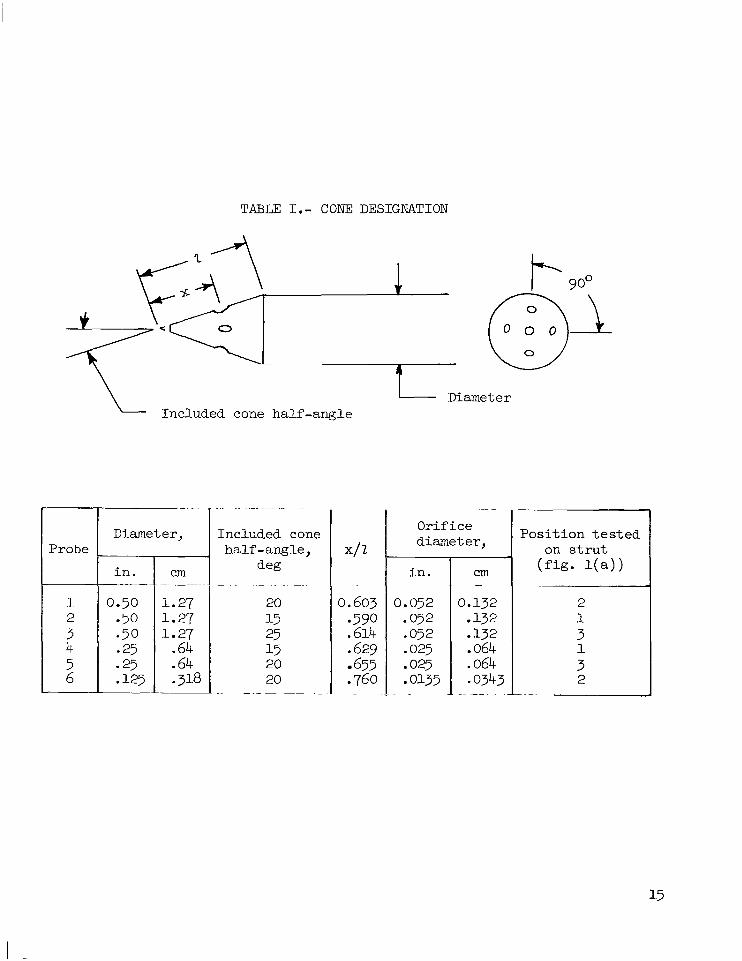
TABLE I.- CONE DESIGNATION
- Included cone half-angle
Diameter, Probe
- _ _ -
Included cone half - angle,
dee;
20 15 25 15 20 20
- - _ _ . -
4 2
0.603 590 .614 .629 655 .760
Diameter
__ -
O r i f i c e d i m e t e r ,
i n .
0.052 .052 .052 .025 025 0135
cm _.
0.132 .132 .132
* 0343
.064
.064 .
Posi t ion t e s t ed on s t r u t
( f ig . l(a>>
2 1 3 1 3 2
- _.

2.41 (6.121 .TI L Y 3 g T y p i c a l
2</ AI?= 2
/” Four static pressure orifices
/ %tot pressure orifice(typical1 Probe I
.30 (5.841
1-63 (1.601
Diam.=0.50 11.271
Probe 2 orifice diameter -0.052 1.132)
/ for probes 1.2,and 3
2.47 (6.271-
2
Diam.=O.JO 11.27)
Maximum lip thickness=.002 (Typicoll
Probe
1- 2.51 16.38) i““’“-“I
15
Probe 4
Ressure aifice diamter; 0.025 (.0641 for probes 4 an3 5
Probe 5
Probe 6 Pressure orifice diameter -0.0135 LO3431
for probe 6
(a) Conical pressure probe models.
Figure 1.- Test apparatus. All dimensions are i n inches (centimeters) unless otherwise noted.

Pivot o m
4.50 111.43)
4.50 111.43)
T -- 2.15- 15.461
I I I
(b) Model support assembly.
Figure 1.- Concluded.
\\\?\\\\\\\\\\\\\\\\\\ .~\\\\77 , \ ,
Section A-A

X
Figure 2.- Orifice designation and angle notation.

(a) M1 = 3.0.
Figure 3.- Circumferential pressure distribution on surface of cone. Probe 1.

I .o
.8
rc a, 0 0
..... .......................... . . . . . . . . . . . . __ ....... ....... ......... ~ ......... _ - ___-- -. - ............ . . . . . . . . . . . . . . . . . . . . . . . . . . . . ............... ... ..............
.......... ... ... . . . . __-- ...... _. -. .... . . .- -__-- ___ ~ - ___ _. .................. _ . __ ........... - ........ ............. ................... ....... .... . _ _ _i ..................................... ........... r ...... . . . . . . . . . . . . . . . . . . . . . . . . . . . . . . . . . . ....... .......
.- 0 40 80 120 160 200 240 280 320 360
Angle of roll, 4, deg
(b) M i = 4.5.
Figure 3.- Continued.


.4
.3
- - .2 pt,2
. I
0 I 2 3 4 5 6 7 Mach number, MI
Figure 4.- Variation of static-to-pitot pressure ratio wi th Mach number at zero angle of pitch. Probe 1.
22
I

.- 24 -24 -16 -8 0 8 16 Angle of pitch, 8, deg
Figure 5.- Effect of angle of pitch on ratio of average static pressure to pitot pressure. Probe 1.
23
l l l l l l IIlllllllllllIlllIil I

-24 -16 -8 0 8 16 24 Angle of pitch, 6, deg
.V
Figure 6.- Effect of angle of pitch on pitot pressure. Probe 1.
24

-24 -20 -16 -I 2 -8 0 4 8 12 16 20 24 Angle of pitch, e, deg
(a) M i = 3.0; orifices a and c.
Figure 7.- Variation of static pressure differences with angle of pitch. Probe 1.
I

-8 0 4 8 Angle of pitch, 8, deg
16 20 24
(b) M1 = 3.0; orif ices band d.
Figure 7.- Continued.
26

1.0
.8
.6
.4
.2
,I
-.2
-A
-.6
-.8
-24 -20 -16 -12 -8 -4 0 4 8 12 16 20 24 Angle of pitch, 8, deg
(c) M1 = 4.5; orifices a and c.
Figure 7.- Continued.
27
I

" b &-
(d) M i = 4.5; orifices band d.
Figure 7.- Continued.

-16 -12 -4 0 4 Angle of pitch, 6, deg
(e) Mi = 6.0; orifices a and c.
Figure 7.- Continued.

I .o
.8
.6
.4
-.4
-.6
-.8
_I n -24 -20 -16 -12 -8 -4 0 4 8 12 16 20 24
Angle of pitch, 0, deg
I."
(f) M1 = 6.0; orifices b a n d d.
Figure 7.- Concluded.

. I
.LI
-A
- .6
-.8
-1.0 -24 -ZU -16 -12 -8 -4 0 4
Ang le of pitch, 8, deg
la) MI = 3.0; orifices a and c.
8 12
Figure 8.- Variation of static pressure differences with angle of pitch. Probe 2.
I I
i
i= L i I
I 1
C
16 20 24
31
IIIII I 1 I l l Ill1

(b) M1 = 3.0; orif ices b a n d d.
Figure 8.- Continued.
32

.I6 -12 -a 4 a 12 Angle of pitch, 0, deg
16 20 24
(c) Mi = 4.5; orifices a and c.
Figure 8.- Continued.
33

Angle of pitch, 8, deg
(d) M1 = 4.5; orifices band d.
Figure 8.- Continued.
16 20 24
34
.. . - .. . .
-24 -20 -16 -8 -4 Angle of
4 8 12 16 20 24 pitch, 8, deg
(e) M1 = 6.0; orif ices a and c.
Figure 8.- Continued.
35

I."
-24 -20 -16 -12 -8 -4 Angle of pitch,
(f) M1 = 6.0; orifices band d.
Figure 8.- Concluded.
12 24
36
-1.0 -24 -20 -16 -I 2 -8 -4 0
Angle of pitch, 8, deg
(a) M1 = 3.0; orif ices a and c.
12 16 20 24
Figure 9.- Variation of static pressure differences w i th angle of pitch. Probe 3.
37

.,.I ..
I .o
.8
.6
.4
.2
1,
-. 2
- .4
-.6
-.8
-1.0 -24 -20 -16 -12 -8 -4
d
0 12 16 20 24 Angle of pitch, e, deg
(b) M1 = 3.0; orif ices b a n d d.
Figure 9.- Continued.
38

I
-24 -20 -16 -I 2 -8 - Angle of pitch, 0, deg
(c) M1 = 4.5; orifices a and c.
Figure 9.- Continued.
i1 8
39
' l l l l lllllllllIlllIl I I l l I

(d) M1 = 4.5; orifices band d.
Figure 9.- Continued.
I .o
.E
.6
.4
.2
-.4
-.6
- .8
-1.0 -20 -16 -4
Angle of pitch, 8, 20 24
(e) M1 = 6.0; orifices a and c.
Figure 9.- Continued.
41

-I 2
IN
I I I '
I
T I '
'C 1
I '
1. y I I I
I -8
Angle of 4 8
pitch, 0, deg 20 24
(f) M1 = 6.0; orif ices b a n d d.
Figure 9.- Concluded.
42

-4 4 8 12 16 20 24 Angle of pitch, 0, d e g
(a) M1 = 3.0; orifices a and c.
Figure 10.- Variation of static pressure differences with angle of pitch. Probe 4.
43

1.0
.8
.6
.4
.2
A b
$16 - -. 2
-.4
-.6
-.8
- 1 n I .V
-24 -20 -16 -12 -8 -4 4 8 12 16 20 24 Angle of pitch, 8, deg
(bl M1 = 3.0; orifices band d.
Figure 10.- Continued.
44
-24 -20 -16 -12 -8 -4 0 4 8 12 16 20 24 Angle of pitch, 8, deg
(c) M1 = 4.5; orifices a and c.
Figure 10.- Continued.
45

I ' I
~
1 I
i i I ! 1
I
!
-12 -8 -4 0 4 Angle of pitch, e, deg
12 16 20 24
(d) M1 = 4.5; orif ices b a n d d.
Figure 10.- Continued.
46

-16 -8
3
-4 0 Angle of pitch, 8, deg
12
I r i
I 16 20 24
(e) M1 = 6.0; or i f ices a a n d c.
F igu re 10.- Continued.
47
I

(f) MI = 6.0; orifices b a n d d.
Figure 10.- Concluded.
48

-16 -I 2 -8 -4 4 Angle of pitch, e, deg
(a) M1 = 3.0; orifices a and c.
16 20 24
Figure 11.- Variation of static pressure differences with angle of pitch. Probe 5.
49

..V
-24 -20 -16 -12 -8 -4 0 4 8 12 16 20 24 Angle of pitch, 0, deg
(b) M1 = 3.0; orifices band d.
Figure 11.- Continued.

I .o
.a
.6
.4
.2
,I
- .4
-.E
-.E
-1.C - 8
Angle of pitch,
T r F I+- > I
12 im
16 20 24
(c) M1 = 4.5; or i f ices a and c.
F igu re 11.- Continued.
I

1.0
.8
.6
.4
.2
0
-.2
-.4
-.6
-.8
-1.0 -24 -20 -I 2 -8 -4 4 8
Angle of pitch, 6, deg 12 16 20 24
(d) M1 = 4.5; orifices band d.
Figure 11.- Continued.
52

1.0
.8
.6
.4
.2
0
-.2
-.4
-.6
-.8
-1.0 -24 -20 -12 -4 I 4 12 16 20 24
Angle of pitch, e, deg
(e) M1 = 6.0; orifices a and c.
Figure 11.- Continued.
53

-24 -20 - -I 2 -8 -4
I I I I ' i
Je; z i 1
1 0
Angle of pitch, e, deg
[f) M1 = 6.0; orifices b a n d d.
F igu re 11.- Concluded.
12 16 20 24

I
1
!, I,
i l -20 -16 -12 -a -4 4
Angle of pitch, e, deg
(a) M1 = 3.0: orifices a and c.
12
T I
t I
i 1 I
1
I 1 I I i i i l i- i 16 20 24
Figure 12.- Variation of static pressure differences with angle of pitch. Probe 6.
55

(b) M1 = 3.0; orifices b a n d d.
Figure 12.- Continued.
56

I
-1.0 I / ~ -24 -4 -20 -16 -I 2 -8
I I
4 0 Angle of pitch, e, deg
(c) M1 = 4.5; orifices a and c.
Figure 12.- Continued.
8 12
i n n
16 I Id
20 24
57
I

.8
.6
.4
.2
I
-b
$IC. - -.2 -A
-.6
-.8
-1.0 -24 -20 -4 -16 -I 2 -8 4 0
Angle of pitch, 8, deg
A d e 9 0 0 0 20 0 40 n 60 n 80
24 8 12 16 20
(d) M1 = 4.5; orifices band d.
Figure 12.- Continued.

I .o
.8
.6
.4
-w - -.2 41-
-.4
-.6
-.8
-1.c -24 -20 -16
I
I
i Jr I i i
I
i I I
1 I
-4 0
: I
Angle of pitch, 0,
(e) M1 = 6.0; orifices a and c.
Figure 12.- Continued.
8
1 I"
~
i l
I- I
i i I
y I I
12 16 20 24
59

-16 -4
I
0 An& of pitch,
b
8 12
A 2 0 0 20 0 40
60 b 80
16 20 24
(f) M1 = 6.0; orifices b a n d d.
Figure 12.- Concluded.
60

8 Positive 4 Negative
.7
8 Fbsitive 4 Positive
.6
8 Negative + Positive
.5
0 Negative I#I Negative
.2
. I
0 .I .2 .3 .4 .5 .6 .7 .8
(a) M1 = 3.0.
Figure 13.- Chart for determination of pitch and roll angles. Probe 1.
I
61

8 Positive +, Negative
8 Positive #I Positive
I Sign convention
6' Negative #I Positive
(b) M i = 4.5.
Figure 13.- Continued.
8 Negative #I Negative
62

8 Positive + Negative 8 Positive 4 Positive
.8
8 Negative 4 Positive
.7
8 Negative 4 Negative
.6
.5
.2
. I
0
(c ) M i = 6.0.
Figure 13.- Concluded.

E Negative u Negative
E Negative u Positive
.8
E Positive u Negative
.7
E Positive u Positive
.6
.3
.2
.I
0
I
(a) M1 = 3.0.
F igu re 14.- Char t f o r determination of downwash a n d sidewash angles. Probe 1
64
.8
.7
.6
.5
a I1
.2
E Positive u Negative
E Negative E Negative u Negative u Positive
E Positive u Positive
0 .I .2 .3 .4 .5 ,7 .8
(b) Mi = 4.5.
Figure 14.- Continued.
65

E Negative cr Negative
.a
E Negative u Positive
.7
.6
.2
. I
0
66
E Positive E Positive u Negative u Positive
Sign convention
(c) Mi = 6.0.
Figure 14.- Concluded.
NASA-Langley, 1965 L-4201

“The aeroiiazrtical and space activities o f the United States shall be conducted so as to contribicte . . . to the expansion of hnman h o w l - edge o f phenomend in the atmosphere and space. T h e Administrdtion shall provide for the widest practicable mid appropride dissemination of information concerning its activities and the results thereof.”
-~YATIONAL AERONAUTICS AND SPACE ACT OF 1958
NASA SCIENTIFIC AND TECHNICAL PUBLICATIONS
TECHNICAL REPORTS: important, complete, and a lasting contribution to existing knowledge.
TECHNICAL NOTES: of importance as a contribution to existing knowledge.
TECHNICAL MEMORANDUMS: Information receiving limited distri- bution because of preliminary data, security classification, or other reasons.
CONTRACTOR REPORTS: Technical information generated in con- nection with a NASA contract or grant and released under NASA auspices.
TECHNICAL TRANSLATIONS: Information published in a foreign language considered to merit NASA distribution in English.
TECHNICAL REPRINTS: Information derived from NASA activities and initially published in the form of journal articles.
SPECIAL PUBLICATIONS: Information derived from or of value to NASA activities but not necessarily reporting the results .of individual NASA-programmed scientific efforts. Publications include conference proceedings, monographs, data compilations, handbooks, sourcebooks, and special bibliographies.
Scientific and technical information considered
Information less broad in scope but nevertheless
Details on the availability of these publications may be obtained from:
SCIENTIFIC AND TECHNICAL INFORMATION DIVISION
NATIONAL AERONAUTICS AND SPACE ADMINISTRATION
Washington, D.C. 20546