cal recycle waste characterization data for state agencies
TRANSCRIPT

Cal Recycle Waste Characterization Data for State Agencies as Generators SAGE Meeting January 20, 2016 Nancy Carr, CalRecycle
Cal Recycle Waste Characterization Data for State Agencies as Generators SAGE Meeting January 20, 2016 Nancy Carr, CalRecycle
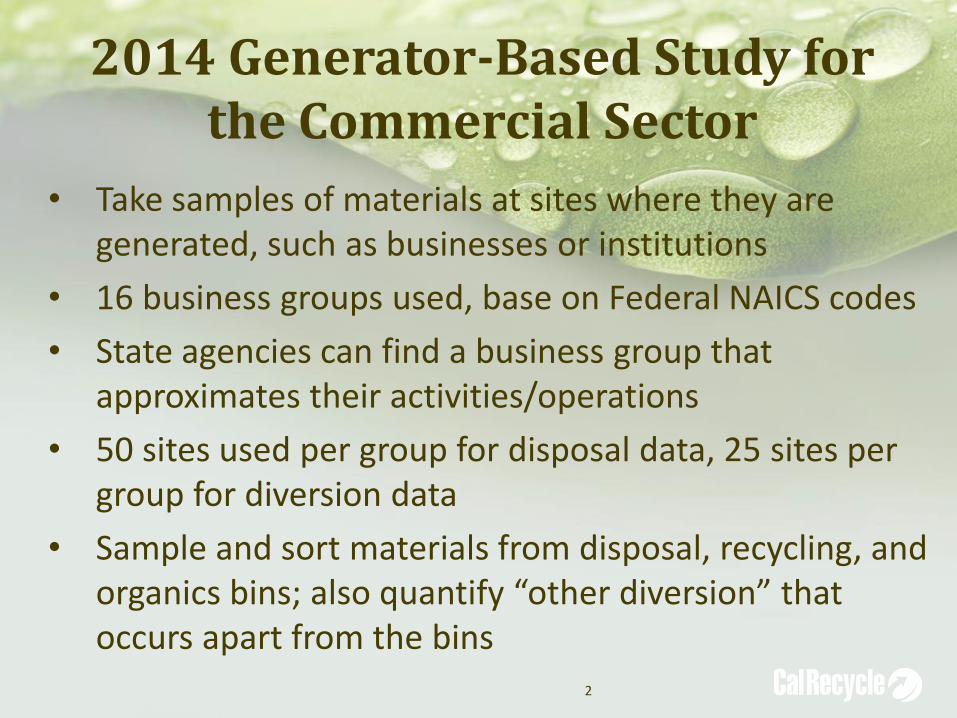
2014 Generator-Based Study for the Commercial Sector
• Take samples of materials at sites where they are generated, such as businesses or institutions
• 16 business groups used, base on Federal NAICS codes
• State agencies can find a business group that approximates their activities/operations
• 50 sites used per group for disposal data, 25 sites per group for diversion data
• Sample and sort materials from disposal, recycling, and organics bins; also quantify “other diversion” that occurs apart from the bins
2

CalRecycle 2014 Business Groups Arts, Entertainment & Recreation
Manufacturing - All Other
Services -Management, Admin., Support, Social
Durable Wholesale & Trucking
Medical/Health Services - Professional, Technical, Financial
Education Public Administration Services - Repair and Personal
Hotels/Lodging Restaurants Not Elsewhere Classified
Manufacturing -Electronic Equipment
Retail Trade - Food & Beverage Stores
Manufacturing - Food; & Nondurable Wholesale
Retail Trade - All Other
3
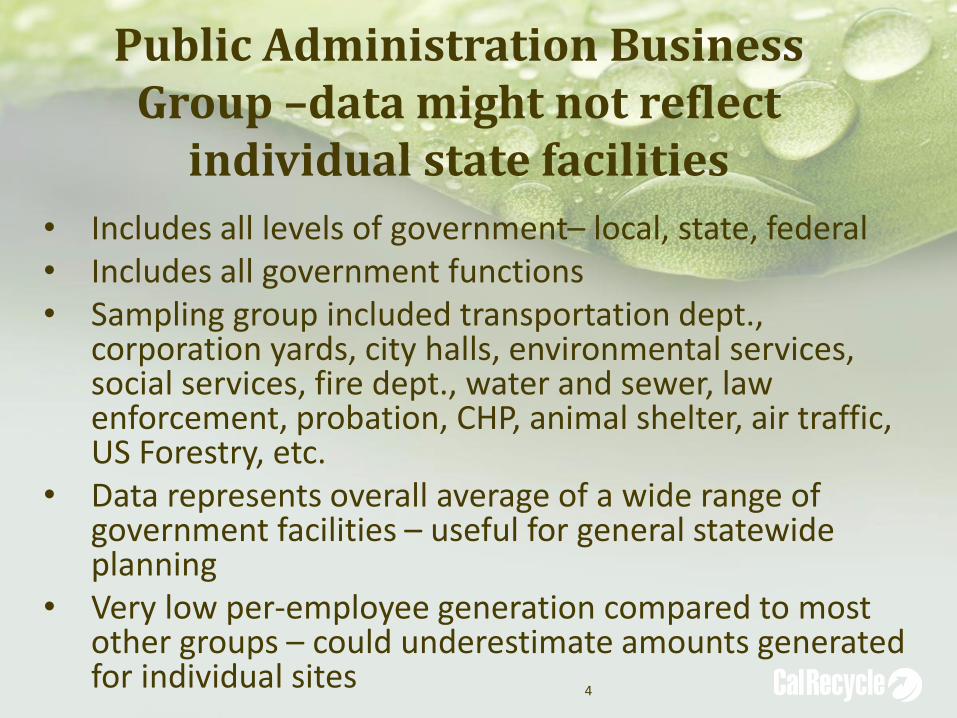
Public Administration Business Group –data might not reflect
individual state facilities
• Includes all levels of government– local, state, federal • Includes all government functions • Sampling group included transportation dept.,
corporation yards, city halls, environmental services, social services, fire dept., water and sewer, law enforcement, probation, CHP, animal shelter, air traffic, US Forestry, etc.
• Data represents overall average of a wide range of government facilities – useful for general statewide planning
• Very low per-employee generation compared to most other groups – could underestimate amounts generated for individual sites
4
5
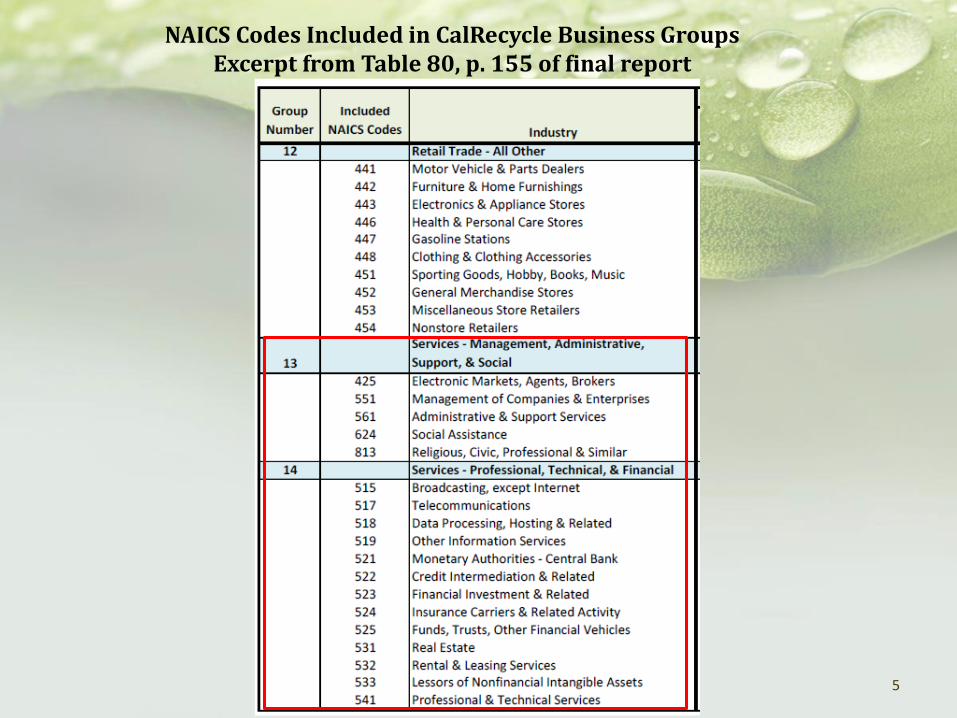
NAICS Codes Included in CalRecycle Business Groups Excerpt from Table 80, p. 155 of final report
6
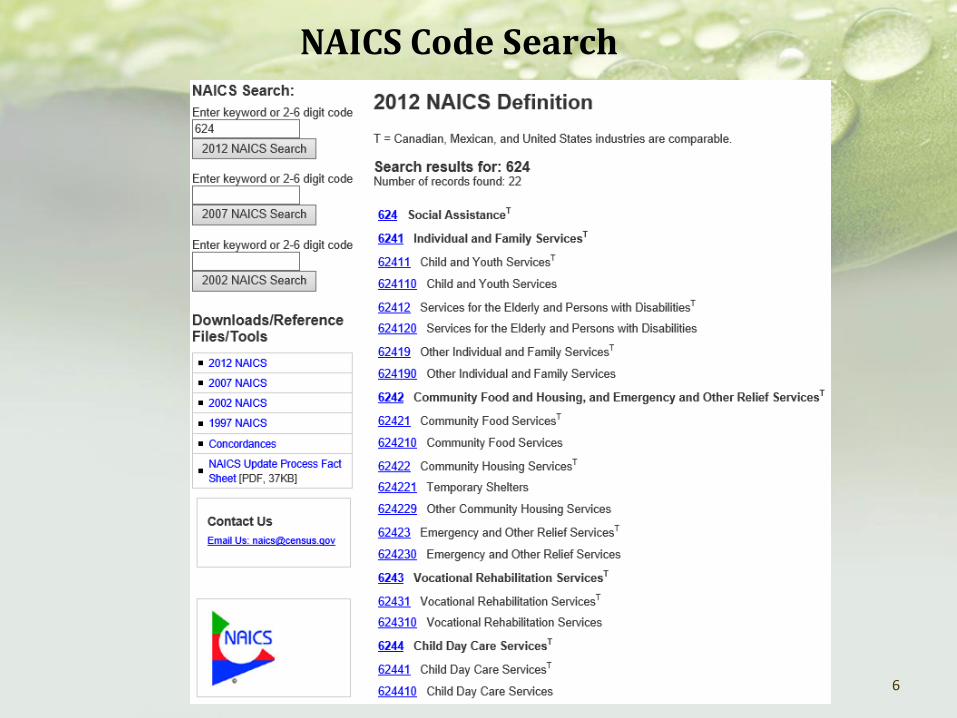
NAICS Code Search

Additional NAICS Information
• Webpage at http://www.census.gov/eos/www/naics/index.html
• Can look up individual codes for definition, examples
7

8
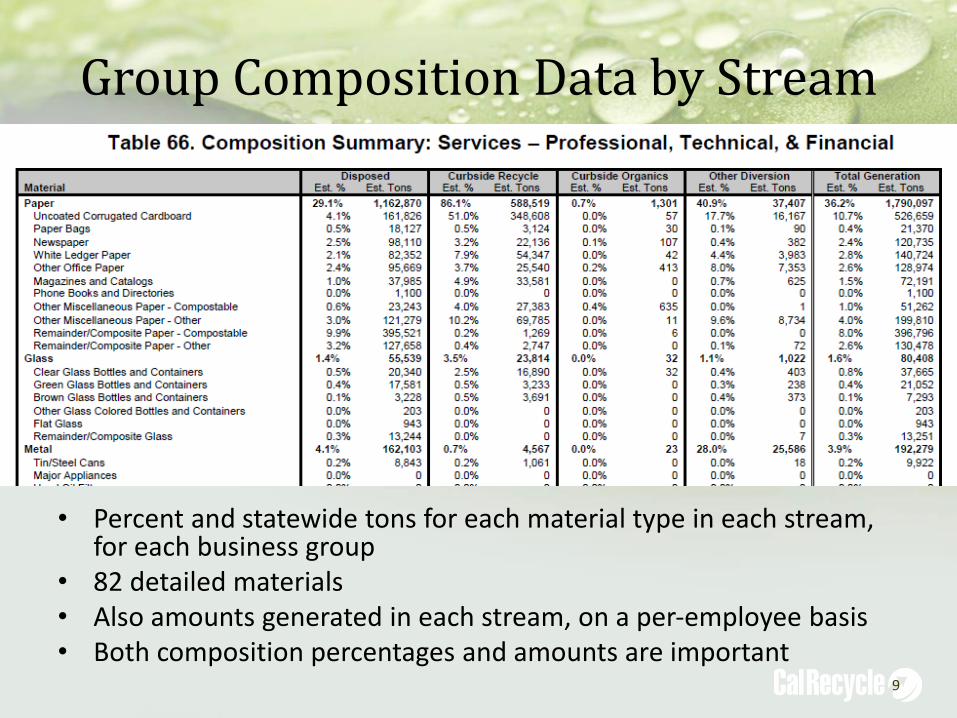
Group Composition Data by Stream
• Percent and statewide tons for each material type in each stream, for each business group
• 82 detailed materials • Also amounts generated in each stream, on a per-employee basis • Both composition percentages and amounts are important
9

10
Overview of Each Stream
• Top chart – 81% of everything generated ends up in the disposal bin
• Diversion rate for this group is 19%
• “Other Diversion” includes materials diverted outside of bins picked up by a hauler– such as selling cardboard or scrap metal directly to a recycler
• Colors indicate recoverable materials in each bin
• Much of what’s disposed could be recovered, especially organics (food, pallets, and compostable paper)

11

Questions?
Nancy Carr
Knowledge Integration Section
916-341-6216
12