caida bandwidth estimation meeting san diego june 2002 r. hughes-jones manchester udpmon and...
TRANSCRIPT
CAIDA Bandwidth Estimation Meeting San Diego June 2002R. Hughes-Jones Manchester
UDPmon and TCPstreamTools to understand Network Performance
Richard Hughes-JonesThe University of Manchester
www.hep.man.ac.uk/~rich/net/

CAIDA Bandwidth Estimation Meeting San Diego June 2002R. Hughes-Jones Manchester
UDPmon: The Measurements (1)
Latency Round trip times measured using Request-Response
UDP frames Latency as a function of frame size
Slope gives sum of individual data transfer rates end-to-endMem copy + pci + Gig Ethernet + pci + mem copy
Intercept indicates processing times + HW latencies
Histograms of ‘singleton’ measurements Tells us about:
Behavior of the IP stack The way the HW operates Performance of the LAN / MAN / WAN
CAIDA Bandwidth Estimation Meeting San Diego June 2002R. Hughes-Jones Manchester
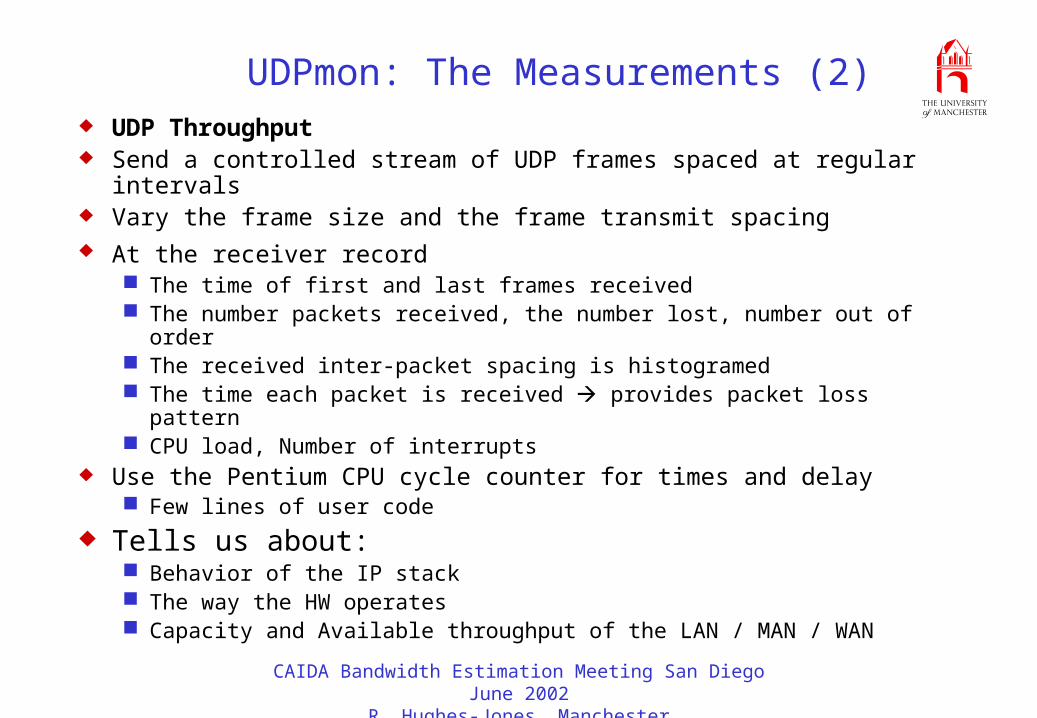
UDPmon: The Measurements (2) UDP Throughput Send a controlled stream of UDP frames spaced at regular intervals Vary the frame size and the frame transmit spacing At the receiver record
The time of first and last frames received The number packets received, the number lost, number out of order The received inter-packet spacing is histogramed The time each packet is received provides packet loss pattern CPU load, Number of interrupts
Use the Pentium CPU cycle counter for times and delay Few lines of user code
Tells us about: Behavior of the IP stack The way the HW operates Capacity and Available throughput of the LAN / MAN / WAN
CAIDA Bandwidth Estimation Meeting San Diego June 2002R. Hughes-Jones Manchester
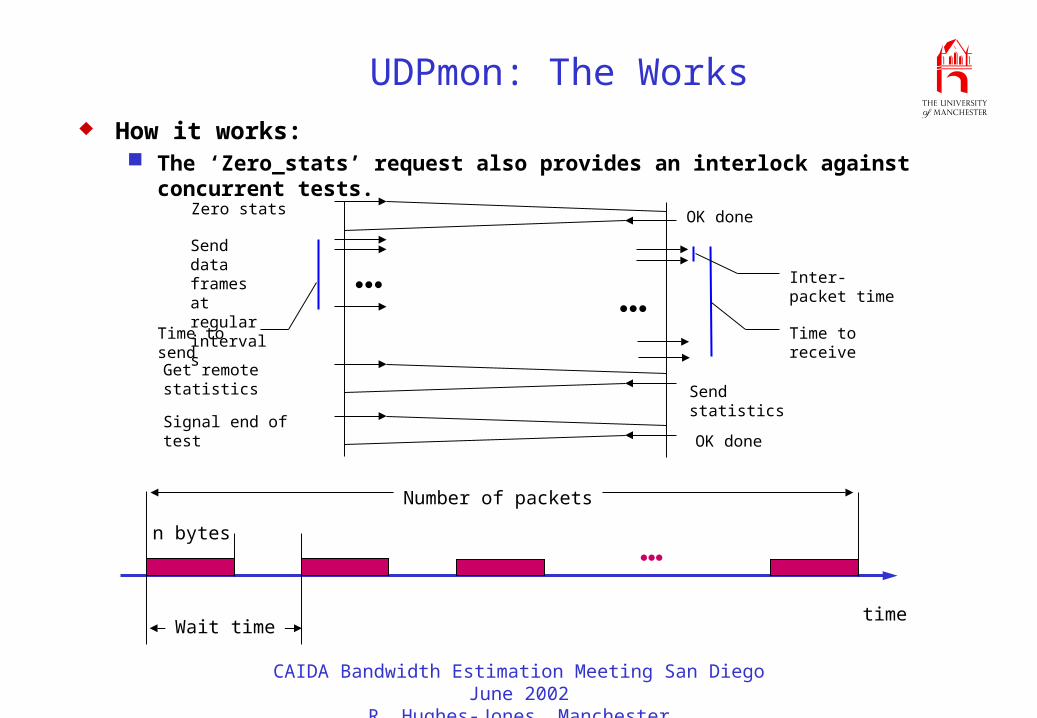
UDPmon: The Works How it works:
The ‘Zero_stats’ request also provides an interlock against concurrent tests.
Zero stats OK done
●●●
Get remote statisticsSend statistics
Send data frames atregular intervals ●●●
Time to send Time to receive
Inter-packet time
Signal end of testOK done
n bytes
Number of packets
Wait timetime
CAIDA Bandwidth Estimation Meeting San Diego June 2002R. Hughes-Jones Manchester
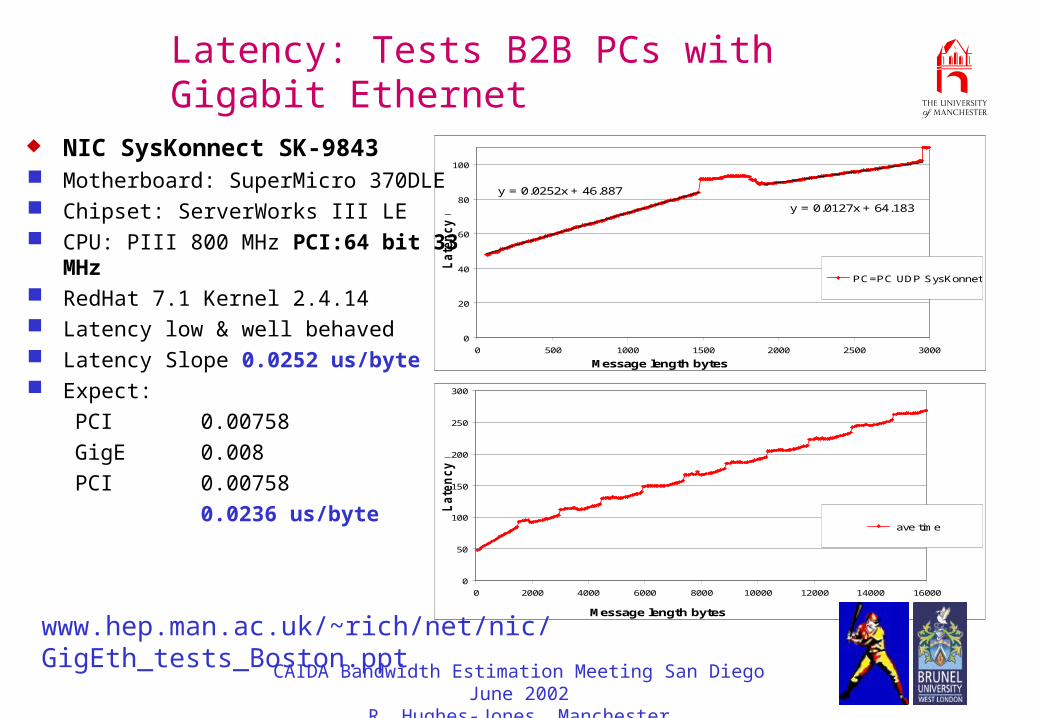
Latency: Tests B2B PCs with Gigabit Ethernet
y = 0.0252x + 46.887
y = 0.0127x + 64.183
0
20
40
60
80
100
0 500 1000 1500 2000 2500 3000
Message length bytes
Late
ncy u
s
PC=PC UDP SysKonnet
0
50
100
150
200
250
300
0 2000 4000 6000 8000 10000 12000 14000 16000
Message length bytes
Late
ncy u
s
ave time
NIC SysKonnect SK-9843 Motherboard: SuperMicro 370DLE Chipset: ServerWorks III LE CPU: PIII 800 MHz PCI:64 bit 33 MHz RedHat 7.1 Kernel 2.4.14 Latency low & well behaved Latency Slope 0.0252 us/byte Expect:
PCI 0.00758
GigE 0.008
PCI 0.00758
0.0236 us/byte
www.hep.man.ac.uk/~rich/net/nic/GigEth_tests_Boston.ppt

CAIDA Bandwidth Estimation Meeting San Diego June 2002R. Hughes-Jones Manchester
Latency: Tests B2B PCs with Gigabit Ethernet
y = 0.0187x + 167.86
0
50
100
150
200
250
0 200 400 600 800 1000 1200 1400
Message length bytes
Late
ncy u
s
Intel pro/1000 ave time
0
50
100
150
200
250
300
350
400
450
0 2000 4000 6000 8000 10000 12000 14000 16000
Message length bytes
Late
ncy u
s
Intel pro/1000 ave time
NIC Intel Pro/1000 Motherboard: SuperMicro 370DLE Chipset: ServerWorks III LE CPU: PIII 800 MHz PCI:64 bit 66 MHz RedHat 7.1 Kernel 2.4.14 Latency high but well behaved Indicates Interrupt coalescence Slope 0.0187 us/byte Expect:
PCI 0.00188
GigE 0.008
PCI 0.00188
0.0118 us/byte

CAIDA Bandwidth Estimation Meeting San Diego June 2002R. Hughes-Jones Manchester
Motherboard: SuperMicro 370DLE Chipset: ServerWorks III LE CPU: PIII 800 MHz PCI:32 bit 33 MHz 100Mbit NICs RedHat 5.2 Kernel 2.2.14 LAN 2 PC B2B FWHM ~3 s No change with packet size
Man – UCL LAN – MAN – SuperJANET4 – MAN – LAN London Man at 130Mbit on ATM 155Mbit links
Latency: Histograms
64 bytes UDP PC=PC req-resp
0
500
1000
1500
2000
2500
3000
0 50 100 150 200 250 300
Latency us
N(t
)
1400 bytes UDP PC=PC req-resp
0
1000
2000
3000
4000
5000
0 50 100 150 200 250 300
Latency us
N(t
)1024 bytes SJ4 man_UCL
0
100
200
300
400
500
600
6000 8000 10000 12000 14000 16000 18000
Latency us
N(t
)
1400 bytes SJ4 man_UCL
0
100
200
300
400
500
600
6000 8000 10000 12000 14000 16000 18000Latency us
N(t
) TCP1400
UDP 1400

CAIDA Bandwidth Estimation Meeting San Diego June 2002R. Hughes-Jones Manchester
UDP IntelPro1000 : P4DP6 64bit 66MHz PCI slot4
0
100
200
300
400
500
600
700
800
900
1000
0 5 10 15 20 25 30 35 40
Transmit Time per frame usR
ecv
Wir
e ra
te M
bit
s/s
50 bytes 100 bytes 200 bytes 400 bytes 600 bytes 800 bytes 1000 bytes 1200 bytes 1400 bytes 1472 bytes
UDP Throughput: Intel Pro/1000 on B2B P4DP6
Max throughput 950Mbit/s Some throughput drop for packets
>1000 bytes
Loss NIC dependent Loss not due to user Kernel
moves
Traced to discards in the receiving IP layer ???
Motherboard: SuperMicro P4DP6 Chipset: Intel E7500 (Plumas) CPU: Dual Xeon Prestonia (2cpu/die) 2.2 GHz Slot 4: PCI, 64 bit, 66 MHz RedHat 7.2 Kernel 2.4.14
UDP IntelPro1000 : P4DP6 64bit 66MHz PCI slot4
0
10
20
30
40
50
60
70
80
90
100
0 5 10 15 20 25 30 35 40
Transmit Time per frame us
% P
acket
loss
50 bytes 100 bytes 200 bytes 400 bytes 600 bytes 800 bytes 1000 bytes 1200 bytes 1400 bytes 1472 bytes

CAIDA Bandwidth Estimation Meeting San Diego June 2002R. Hughes-Jones Manchester
UDP Throughput: SysKonnect SK-9843 B2B Motherboard: SuperMicro 370DLE Chipset: ServerWorks III LE Chipset CPU: PIII 800 MHz PCI:64 bit 33 MHz RedHat 7.1 Kernel 2.4.14
UDP SysKonnect
0
100
200
300
400
500
600
700
800
0 5 10 15 20 25 30 35 40
Transmit Time per frame us
Rec
v W
ire
rate
Mb
its/
s
50 bytes 100 bytes 200 bytes 400 bytes 600 bytes 800 bytes 1000 bytes 1200 bytes 1400 bytes 1472 bytes
Max throughput 690Mbit/s No packet loss
Packet loss during dropUDP SysKonnnect : 370DLE 64bit 33MHz
0
0.1
0.2
0.3
0.4
0.5
0.6
0.7
0.8
0.9
1
0 5 10 15 20 25 30 35 40
Transmit Time per frame us
% P
acket
loss
50 bytes 100 bytes 200 bytes 400 bytes 600 bytes 800 bytes 1000 bytes 1200 bytes 1400 bytes 1472 bytes
CAIDA Bandwidth Estimation Meeting San Diego June 2002R. Hughes-Jones Manchester
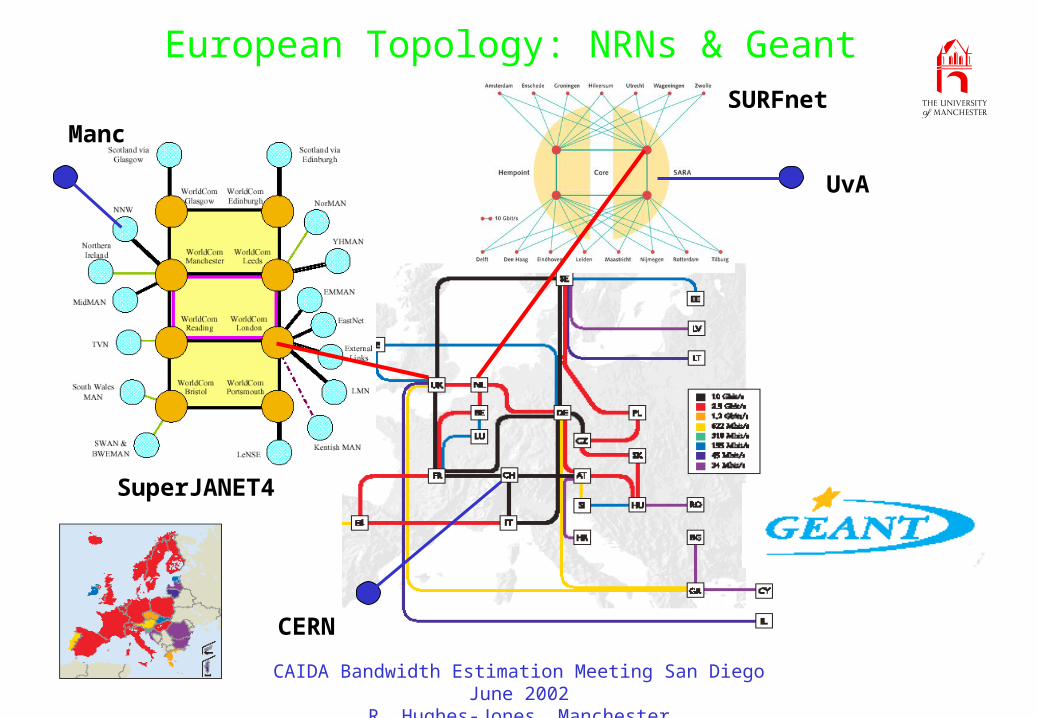
European Topology: NRNs & Geant
SuperJANET4
CERN
UvA
Manc
SURFnet

CAIDA Bandwidth Estimation Meeting San Diego June 2002R. Hughes-Jones Manchester
Gigabit Throughput on the Production WAN
Manc - RAL 570 Mbit/s 91% of the 622 Mbit access link
between SuperJANET4 and RAL 1472 bytes propagation ~21s
Manc-UvA (SARA) 750 Mbit/s SJANET4 + Geant + SURFnet
Manc – CERN 460 Mbit/s CERN PC had a 32 bit PCI bus
U D P M an -C E R N G ig 19 M ay 02
0
100
200
300
400
500
600
700
800
900
1000
0 5 10 15 20 25 30 35 40
Transm it T im e per fram e us
Re
cv
Wir
e r
ate
Mb
its
/s
50 bytes 100 bytes 200 bytes 400 bytes 600 bytes 800 bytes 1000 bytes 1200 bytes 1400 bytes 1472 bytes
U D P M an -R AL G ig 21 Ap r 02
0
100
200
300
400
500
600
700
800
900
1000
0 5 10 15 20 25 30 35 40
Transm it T im e per fram e us
Re
cv
Wir
e r
ate
Mb
its
/s
50 bytes 100 bytes 200 bytes 400 bytes 600 bytes 800 bytes 1000 bytes 1200 bytes 1400 bytes 1472 bytes
U D P M an -U vA G ig 19 M ay 02
0
100
200
300
400
500
600
700
800
900
1000
0 5 10 15 20 25 30 35 40
Transm it T im e per fram e us
Re
cv
Wir
e r
ate
Mb
its
/s
50 bytes 100 bytes 200 bytes 400 bytes 600 bytes 800 bytes 1000 bytes 1200 bytes 1472 bytes

CAIDA Bandwidth Estimation Meeting San Diego June 2002R. Hughes-Jones Manchester
UDP Throughput: SLAC - Man
UDP SLAC - Man 31May 02
0
100
200
300
400
500
600
700
800
900
1000
0 5 10 15 20 25 30 35 40
Transmit Time per frame usR
ecv
Wir
e ra
te M
bits
/s
50 bytes 100 bytes 200 bytes 400 bytes 600 bytes 800 bytes 1000 bytes 1200 bytes 1400 bytes 1472 bytes
UDP SLAC - Man 31May 02
0
10
20
30
40
50
60
70
80
90
100
0 5 10 15 20 25 30 35 40
Transmit Time per frame us
% P
acke
t lo
ss
50 bytes 100 bytes 200 bytes 400 bytes 600 bytes 800 bytes 1000 bytes 1200 bytes 1400 bytes 1472 bytes
SLAC – Manc 470 Mbit/s 75% of the 622 Mbit access link SuperJANET4 peers with ESnet
at 622Mbit in NY

CAIDA Bandwidth Estimation Meeting San Diego June 2002R. Hughes-Jones Manchester
Packet Loss: Amsterdam – Chicago Lambda
(16b of 18)
WS WSL2
fast->slowL2
slow->fastfast fasthigh RTT
Cees de Laat & R. H-JParis Mar 02
BW ~500 Mbit/s
Keep 2 Drop 1L2 Buffers full
Packet Number
Time s

CAIDA Bandwidth Estimation Meeting San Diego June 2002R. Hughes-Jones Manchester
UDP Frame Jitter (Nov 01)UDP Frame Jitter (Nov 01)
1400 bytes man_ral w=80us Jitter
0
50
100
150
200
250
300
350
0 20 40 60 80 100 120 140 160 180 200
Inter-frame spacing us
N(t
)
1400 bytes man_ucl w=80us Jitter
0100200300400500600700800
0 20 40 60 80 100 120 140 160 180 200
Inter-frame spacing us
N(t
)
1400 bytes man_cern w=80us Jitter
0
50
100
150
200
250
300
0 100 200 300 400 500 600 700
Inter-frame spacing us
N(t
)
1400 bytes man_lyon w=80us Jitter
0
10
20
30
40
50
0 100 200 300 400 500 600 700
Inter-frame spacing us
N(t
)
1400 bytes man_sara w=80us Jitter
0
100
200
300
400
500
0 20 40 60 80 100 120 140 160
Inter-frame spacing us
N(t
)
1400 bytes man_sara w=80us Jitter
1
10
100
1000
0 200 400 600 800 1000 1200 1400 1600
Inter-frame spacing us
N(t
)
Interrupt Coalescence Lon MAN~130 Mbit
Via CERN

CAIDA Bandwidth Estimation Meeting San Diego June 2002R. Hughes-Jones Manchester
TCPstream TCP Throughput vs : msg size, transmit spacing, n-streams,
window size 1 control TCP link n test streams Memory – memory Only 1 process – no threads – no context switching Streams treated equally not round Robin but next available stream At the receiver record
The time of first and last message received The amount of data ( CPU load, Number of interrupts )
Use the Pentium CPU cycle counter for times and delay Few lines of user code
Tells us about: Behavior of the IP stack Available TCP throughput of the LAN / MAN / WAN

CAIDA Bandwidth Estimation Meeting San Diego June 2002R. Hughes-Jones Manchester
Gigabit TCP on the Production WAN (01)
Throughput vs TCP buffer size
TCP window sizes in Mbytes calculated from RTT*bandwidth
0
100
200
300
400
500
600
0 1000000 2000000 3000000 4000000 5000000
T C P B uffe r s ize B y tes
Re
cv
. U
se
r d
ata
ra
te M
bit
/s
M an-UvA M an-C E R N
Link RTT ms BW Measured by UDP
Expected BW for 1 Gbit/s
750 Mbit/s 460 Mbit/s
Man – Ams
14.5 1.81 1.36
Man – CERN
21.4 2.68 1.23
CAIDA Bandwidth Estimation Meeting San Diego June 2002R. Hughes-Jones Manchester
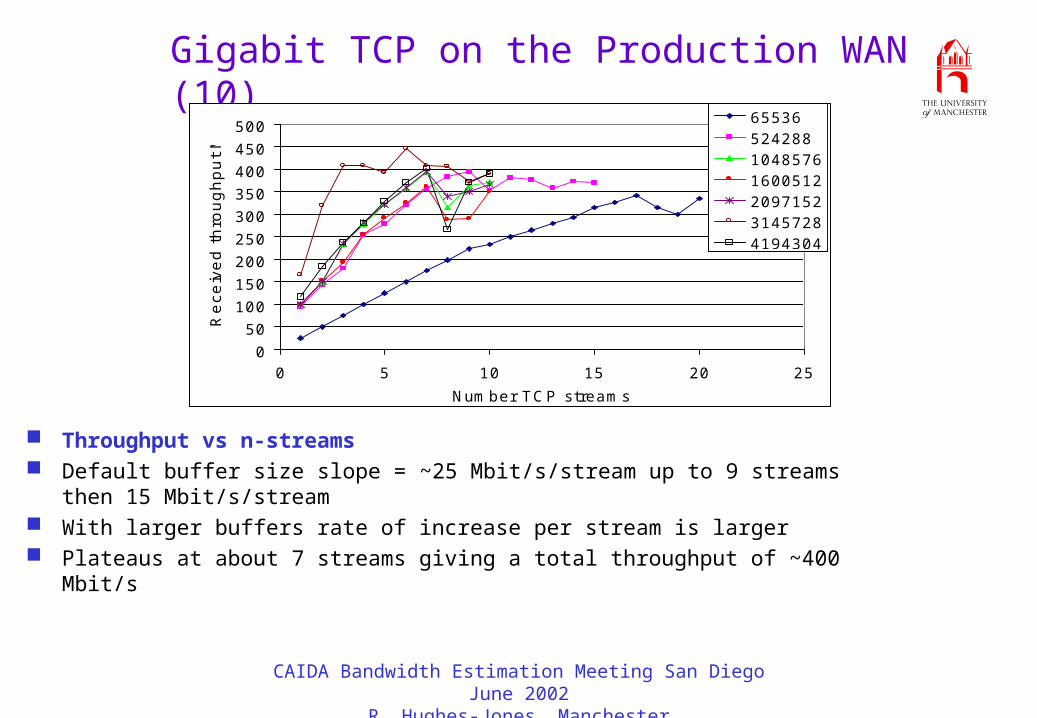
Gigabit TCP on the Production WAN (10)
Throughput vs n-streams Default buffer size slope = ~25 Mbit/s/stream up to 9 streams then 15 Mbit/s/stream With larger buffers rate of increase per stream is larger Plateaus at about 7 streams giving a total throughput of ~400 Mbit/s
0
50
100
150
200
250
300
350
400
450
500
0 5 10 15 20 25
Num ber T C P s tream s
Re
ce
ive
d t
hro
ug
hp
ut
Mb
it/s 6 5536
524288
1048576
1600512
2097152
3145728
4194304

CAIDA Bandwidth Estimation Meeting San Diego June 2002R. Hughes-Jones Manchester
More Information Some URLs
UDPmon / TCPstream kit + writeuphttp://www.hep.man.ac.uk/~rich/net
ATLAS Investigation of the Performance of 100Mbit and Gigabit Ethernet Components Using Raw Ethernet Frames
http:// www.hep.man.ac.uk/~rich/atlas/atlas_net_note_draft5.pdf DataGrid WP7 Networking:
http://www.gridpp.ac.uk/wp7/index.html Motherboard and NIC Tests:
www.hep.man.ac.uk/~rich/net/nic/GigEth_tests_Boston.pptPPNCG Home page with Stop Press:
http://ppncg.rl.ac.uk/PPNCG Page for monitoring Grid, HEP & Astronomy Sites http://icfamon.dl.ac.uk/ppncg/astronomy.htmlIEPM PingER home site:
http://www-iepm.slac.stanford.edu/IEPM-BW site:
http://www-iepm.slac.stanford.edu/bw

CAIDA Bandwidth Estimation Meeting San Diego June 2002R. Hughes-Jones Manchester
The Measurements (4)
PCI Activity Logic Analyzer with
PCI Probe cards in sending PC Gigabit Ethernet Fiber Probe Card PCI Probe cards in receiving PC
GigabitEthernet
ProbeCPU
mem
chipset
NIC
CPU
mem
NIC
chipset
Logic AnalyserDisplay
CAIDA Bandwidth Estimation Meeting San Diego June 2002R. Hughes-Jones Manchester
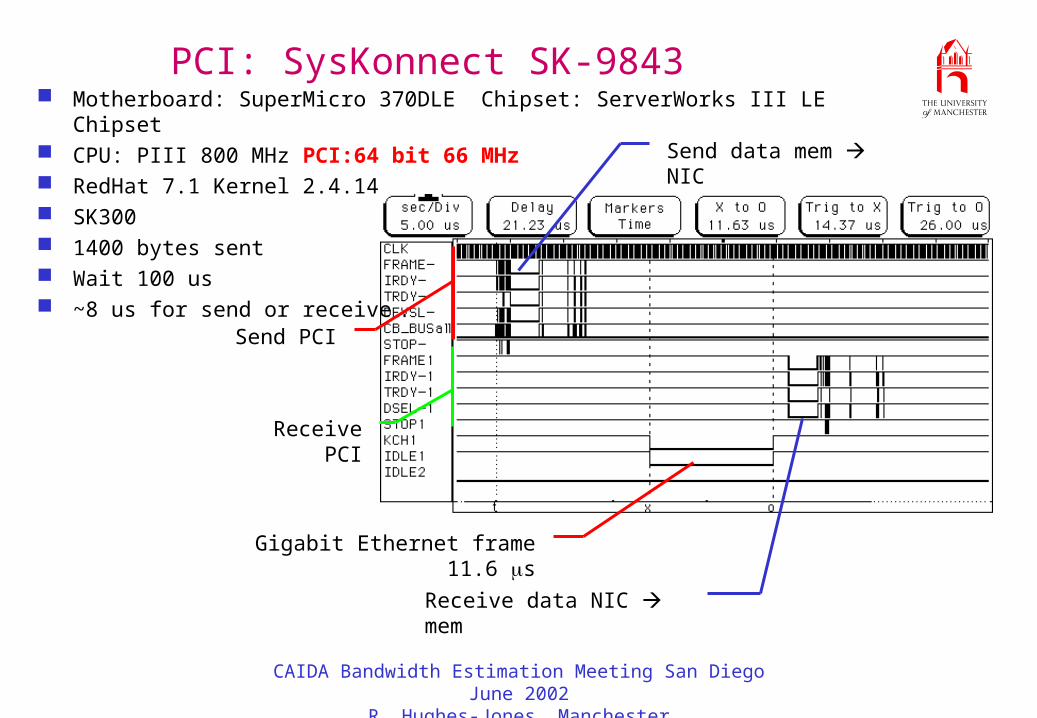
PCI: SysKonnect SK-9843 Motherboard: SuperMicro 370DLE Chipset: ServerWorks III LE Chipset CPU: PIII 800 MHz PCI:64 bit 66 MHz RedHat 7.1 Kernel 2.4.14 SK300 1400 bytes sent Wait 100 us ~8 us for send or receive
Gigabit Ethernet frame 11.6 s
Send PCI
Receive PCI
Send data mem NIC
Receive data NIC mem

CAIDA Bandwidth Estimation Meeting San Diego June 2002R. Hughes-Jones Manchester
PCI: SysKonnect SK-9843 Motherboard: SuperMicro 370DLE Chipset: ServerWorks III LE Chipset CPU: PIII 800 MHz PCI:64 bit 66 MHz RedHat 7.1 Kernel 2.4.14
SK301 1400 bytes sent Wait 20 us
Sk303 1400 bytes sent Wait 10 us Frames are back-to-back Can drive at line speed Cannot go any faster !
Gig Eth frames back to back

CAIDA Bandwidth Estimation Meeting San Diego June 2002R. Hughes-Jones Manchester
PCI: Intel Pro/1000 Motherboard: SuperMicro 370DLE Chipset:: ServerWorks III LE Chipset CPU: PIII 800 MHz PCI:64 bit 66 MHz RedHat 7.1 Kernel 2.4.14
IT66M212 1400 bytes sent Wait 11 us ~4.7us on send PCI bus PCI bus ~45% occupancy ~ 3.25 us on PCI for data recv
IT66M212 1400 bytes sent Wait 11 us Packets lost Action of pause packet?
CAIDA Bandwidth Estimation Meeting San Diego June 2002R. Hughes-Jones Manchester
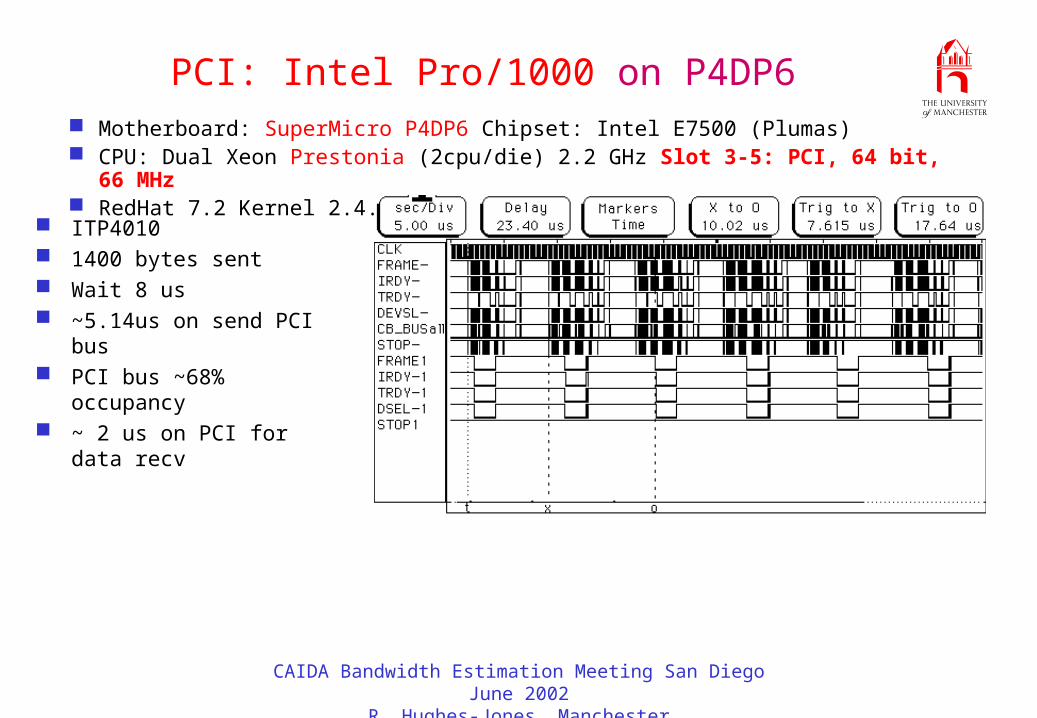
PCI: Intel Pro/1000 on P4DP6
ITP4010 1400 bytes sent Wait 8 us ~5.14us on send PCI bus PCI bus ~68% occupancy ~ 2 us on PCI for data recv
Motherboard: SuperMicro P4DP6 Chipset: Intel E7500 (Plumas) CPU: Dual Xeon Prestonia (2cpu/die) 2.2 GHz Slot 3-5: PCI, 64 bit, 66 MHz RedHat 7.2 Kernel 2.4.14