cai, w. , xu, f., & zeng, c. (2017). does political
TRANSCRIPT

Cai, W., Xu, F., & Zeng, C. (2017). Does political pressure matter inbank lending? Evidence from China. Financial Markets, Institutions &Instruments, 26(5), 249-277. https://doi.org/10.1111/fmii.12089
Peer reviewed version
Link to published version (if available):10.1111/fmii.12089
Link to publication record in Explore Bristol ResearchPDF-document
This is the author accepted manuscript (AAM). The final published version (version of record) is available onlinevia Wiley at http://onlinelibrary.wiley.com/doi/10.1111/fmii.12089/full. Please refer to any applicable terms of useof the publisher.
University of Bristol - Explore Bristol ResearchGeneral rights
This document is made available in accordance with publisher policies. Please cite only thepublished version using the reference above. Full terms of use are available:http://www.bristol.ac.uk/red/research-policy/pure/user-guides/ebr-terms/

Does political pressure matter in bank lending?
Evidence from China
Weixing Cai1
School of Finance
Guangdong University of Finance and Economics, China
Fangming Xu
School of Economics, Finance and Management
University of Bristol, UK
Cheng Zeng
Alliance Manchester Business School
University of Manchester, UK
1 We appreciate helpful comments from Dominik Maltritz, John O’Hanlon, Pengguo Wang, Frank Liu, and
participants of the INFINITI 2014 conference, BAFA 2015 conference, AsianFA 2015 conference, and Portsmouth
2016 conference. All errors are our own. Corresponding author: Fangming Xu, 15-19 Tyndalls Park Road, School
of Economics, Finance and Management, University of Bristol, Bristol BS8 1PQ, UK. Tel: +44 (0) 117 3941503, E-
mail: [email protected]. The first author would like to acknowledge the financial support of the National
Natural Science Foundation of China (No. 71402005). The third author would like to acknowledge the financial
support of the National Natural Science Foundation of China (No. 71502144).

Does political pressure matter in bank lending?
Evidence from China
ABSTRACT
Using provincial data from China between 2002 and 2011, we find substantial evidence
indicating a positive association between the growth of bank loans issued by
commercial banks and the political pressures faced by provincial leaders. This
association is particularly true for state-owned banks, which are much more politically
pressurized than others, but is relatively attenuated in provinces with a more developed
banking sector. We also find that bank loans issued under greater political pressures are
less commercially oriented and have lower quality. Our findings are robust to a variety
of sensitivity analyses and alternative measures of political pressure. Overall, our study
contribute to a growing literature emphasizing the role of the political incentives of
government officials in fuelling economic growth through credit allocation.
Keywords: Political pressure; bank lending; loan quality; China

1
“Why does China have a GDP target at all? ... The reasons are political. In a country
so large, central leaders are always fearful of losing their grip on far-flung bureaucrats:
setting GDP targets is one means by which they believe can evaluate and control these
lower down.”
— “Grossly deceptive plans”, The Economist, January 30th 2016 issue
1. Introduction
On January 19th 2016, China declared its latest gross domestic product (GDP) growth
figure – 6.9% in 2015. Perhaps, not surprisingly, this is neatly within the government’s
target of “around 7%”. China is the only large industrial country that sets GDP targets
and influence, or even control, the economy in order to achieve that. In the
government’s five-year plan, the central government establishes for all provinces their
GDP growth target, which is usually the most important assessment criteria for local
political leaders.1 If the real GDP growth rate fails to meet or overachieve the goals,
local officials would face enormous political pressures, and their political future could
even be diminished.
In this paper, we study the role of government in the economy of China by
examining whether/how the political pressures upon local officials affect the growth of
bank loans issued by commercial banks. Since most of the assessment criterion are
descriptive and unmeasurable2 and, more importantly, given the significance of GDP
targets in China’s distinctive political system, we measure political pressures upon
provincial leaders as the shortfalls of the actual GDP growth of each province to its
target GDP growth or the average GDP growth of its adjacent provinces. It is well
argued in the literature that the GDP growth rate is a major political concerns for
Chinese government officials (e.g., Rawski, 2001; Chow, 2004; Li and Zhou, 2005;
Burdekin and Siklos, 2008) and could significantly affects the turnover decisions made
by the central government (Chen et al., 2005). In particular, we believe that local
officials are facing considerably high political pressures if the above measures are
1 In this paper, we use local officials, political leaders, and provincial leaders interchangeably. 2 In China local officials are often judged by environmental standards, social policies, being uncorruptive,
in tune with the party’s direction, and etc. But GDP is the most important assessment criterion because
it is measureable and observable.

2
positive and, therefore, they are more likely to take proactive measures to stimulate the
provincial economy.
There is an ongoing debate regarding the role of government in the economy and
financial markets. On the one side, the development view suggests that government
intervention in financial markets promote economic development by channelling credit
to the sectors of economy prioritized by the governments. However, this view is less
supported by previous studies (e.g., Beck and Levine, 2002; Caprio and Peria, 2002; La
Porta et al., 2002), which consistently show a negative relation between government
intervention and economic growth. On the opposite side, the political view emphasizes
the political objectives of government intervention in financial markets (e.g., La Porta
et al., 2002; Brown and Dinc, 2005; Dinc, 2005) and argues that politicians in power
are inclined to exploit financial resources, particularly those owned or controlled by the
government, to appease their supporters who subsequently return the favour through
voting, political contributions and bribes (e.g., Kornai, 1979; Shleifer and Vishny, 1994).
Despite the accumulated empirical evidence supporting the political view, there has
been limited research on politically motivated and driven actions taken by commercial
banks in terms of bank loans.
We choose China to investigate our research question because the problem of
political intervention is expected to be greater in China as compared with other
emerging economies. First, despite the significant economy reform and remarkable
economic development, China’s central and local government maintain substantial
influences over the overall economy by controlling the allocation of key economic
resources, like land and credit.3 Second, China’s rapid growth is mainly attributed to
the globalization of trade, but China has yet to globalize its banking sector (Berger et
al., 2009). China’s banking sector remains dominated by four colossal state-owned
banks (i.e., the Big Four banks)4, which account for about three-quarters of industry
assets. Finally, China features the coexistence of political centralization and fiscal
3 The power of China’s governments in controlling economics resources distinguishes her from other
ex-communist transitional economics such as Russia (Chen et al., 2005; Lee et al., 2014). 4 They are the Industrial and Commercial Bank of China (ICBC), the China Construction Bank (CCB),
the Agricultural Bank of China (ABC), and the Bank of China (BOC).

3
decentralization. Specifically, the personnel management of provincial leaders is solely
controlled by the central government, and the provincial economic performance is a
crucial indicator in personnel evaluation. As such, the central government rewards and
punishes local officials through a yardstick competition on the basis of regional
economic performance (Qian and Xu, 1993; Maskin et al., 2000; Li and Zhou, 2005).5
Using provincial data from 2002 to 2011, we find that the growth rate of bank
loans increases with the political pressure on local officials. This relation is significant
and robust when controlling for macroeconomic factors as well as the personal
characteristics of provincial leaders. Intuitively, our results indicate that provincial
leaders have stronger influences on the state-owned banks, while other domestic and
foreign banks don’t seem to be affected. Moreover, the uneven institutional
development across regions in China allows us to examine the extent to which the
association is affected by the degree of banking marketization. Our results show that
the impact of political pressures on the growth of bank loans is moderated in regions
with a higher level of banking marketization, suggesting that economic liberalization is
effective in preventing government intervention in financial institutions.
We then shift our focus to the efficiency of bank lending and the quality of bank
loans. Following Podpiera (2006), we define efficiency as the sensitivity of lending
growth rate to provincial profitability. Our results show that bank lending is less
commercially oriented (a higher sensitivity level) and have much lower quality when
local officials are facing greater political pressures. Overall, these results confirm our
inferences drawing on the political view that the government forces banks to increase
lending to serve their politically agenda rather than to achieve greater economic
objectives, and loans issued under such circumstance suffer lower efficiency and quality.
We conduct a number of robustness checks to test the validity of our results. First,
we repeat the main analyses using the excessive growth of bank loans as the dependent
variable, and our results remain unchanged. Second, we find that a province
5 The political motives of Chinese local officials arise mainly from political pressure empowered by the
performance-based promotion scheme rather than the campaign-driven political actions that are
pervasive in western countries.

4
significantly increases its bank credit supply in the last two years of a five-year-plan
cycle if its GDP growth in the first three years falls behind the target set in the five-year
plan. This evidence reinforces our argument that local officials rely heavily on credit
supply to stimulate the regional GDP in order to achieve better scores in the
performance evaluation system. Finally, our results remain qualitatively unaltered when
we employ the change model to better identify the causal relationship between political
pressure and the banks’ lending behaviour.
This paper contributes to the extant literature in several ways. First, our findings
add evidence to the literature on the political influences on bank lending (La Porta et
al., 2002; Brown and Dinc, 2005; Dinc, 2005). To our best knowledge, our paper is the
first to provide direct evidence of the role played by political pressure in determining
the banks’ lending behaviour in China. Second, our paper contributes to the growing
empirical literature on the political incentives of government officials, both in the
context of China and in general (Besley and Case, 1992; Maskin et al., 2000; Chen et
al., 2005; Li and Zhou, 2005). In particular, our paper is closely related to Li and Zhou
(2005), who find that the likelihood of promotion for provincial leaders is positively
associated with the regional economic performance. We, however, focus on the political
pressure on provincial leaders and its link with bank lending decisions. Finally, our
paper contributes to the debate on the role of government in transitional economies.
Frye and Shleifer (1996) put forward the “helping hand” and the “grabbing hand”
approaches. The former portrays the idea that the government seeks to guide and
stimulate economic growth by reallocating financial resources, while the latter argues
that government officials do not aim to maximize social welfare but pursue their own
selfish objectives. Our study provides evidence consistent with the latter argument.
The remainder of the paper is structured as follows. Section 2 provides
institutional background. Section 3 develops our research hypotheses. Section 4
explains the research design, including the measurement of variables, model
specification, sample selection and data sources. Section 5 reports the empirical results
and their interpretations. Section 6 concludes.

5
2. Institutional background
2.1 China’s economy and economic plans
The growing interest among academics, investors and regulators around the world
in the Chinese-style capitalism stems from China’s increasing economic importance in
the world. China has been growing at around 10% per year over the last three decades,
and in 2010 China surpassed Japan as the world’s second largest economy according to
nominal GDP and purchasing power parity (PPP). Moreover, the International
Monetary Fund (IMF) estimates China’s GDP (in terms of PPP) at $17.6tn against the
US’s $17.4tn in 2014, indicating that China has officially overtaken the US as the
biggest economy in the world.6
China’s success is partly attributed to the model of state capitalism, in which
planning plays a vital role in the economic development. Every five years, starting from
1953, the Chinese central government has formulated a national five-year plan
containing detailed economic development guidelines for all industries and provinces.7
China’s first five-year plan covered the period of 1953-1957, with a focus on
“developing heavy industries”. Since then, China has implemented eleven five-year
plans, with the twelfth five-year guideline started in 2011.8
The formulation of the five-year plan is a top-down process. In response to the
national five-year plan set by the central government, each province also stipulates a
provincial-level five-year plan with adjustments as appropriate. Additionally, local
governments have to present official annual reports, review current year’s achievements
and challenges, and set up targets (not restricted to economics targets) for the coming
year.
The most relevant and important figure in the official documents is the target of
6 Details can be found in the article in The Financial Times titled “China’s leap forward: overtaking the
US as world’s biggest economy” (October 08, 2014). 7 The idea of five-year plans originated from the former Soviet Union, whose philosophy was that the
socialist economy should progress based on plans. Countries (including non-socialist countries) that have
used or still use five-year plans include China, Cuba, Hungary, Mongolia, Romania, Vietnam, Argentina,
Bhutan, Ethiopia, India, Nepal, Pakistan, South Korea and Malaysia (Chen et al., 2013).
8 The name of the eleventh five-year programme was changed from “plan” to “guideline”. This was
done to reflect China’s transition from a centrally planned economy to a socialist market economy, as
well as the more democratic and transparent formulation process.

6
GDP growth rate. Economic performance is a key indicator used in the personnel
evaluation system in China (Chen et al., 2005; Li and Zhou, 2005). This has created
growing criticism in recent years because the local governments tend to be eager for
instant success and thus invest in projects that may not maximize long-term benefits.
Motivated by career concerns, local officials may even engage in statistical falsification.
As a result, some scholars have called for the GDP growth target to be abolished in the
official documents.9
2.2 The political system in China
China is highly politically centralized and has five hierarchical levels of
government: central, provincial, prefecture, county, and township.10 The Politburo of
the Central Committee of the Communist Party of China (CCCPC) acts as the supreme
decision-making organization of this “multidivisional” system (Chen et al., 2013),
which ultimately controls the mobility of government officials within the system
(Huang, 2002; Li and Zhou, 2005).
Provinces are the second level of China’s political system. As of 2014, there were
31 provincial units in China,11 including four centrally administrated cities (Beijing,
Shanghai, Tianjin and Chongqing), 22 provinces and five autonomous regions (Tibet,
Xinjiang, Inner Mongolia, Ningxia, and Guangxi). The provincial party secretary is the
top leader at the provincial level, followed by the provincial governor. This reflects the
dual presence of the communist party and the government organs in China’s political
system (Li and Zhou, 2005).
China began the major reforms of its economy in 1978. These reforms, especially
the introduction of a “fiscal contracting system”,12 have empowered provincial leaders
with the ultimate authority over allocating economic resources in their jurisdictions.
This, on the one hand, has significantly increased the strategic importance of the
9 Details of this story can be found at http://www.ftchinese.com/story/001049291/?print=y (in Chinese). 10 Following previous research (e.g., Jin et al., 2005) and because of data availability, the present paper
focuses on the central-provincial relations. 11 This excludes Taiwan, Hong Kong and Macau. 12 See Jin et al. (2005) for further descriptions of China’s fiscal contracting system.

7
provincial leaders in local economic development (Qian and Xu, 1993). On the other
hand, the provincial leaders have become more liable for the corresponding results
arising from their decisions.
In addition, China’s economic reforms also triggered the reform of its personnel
control system. This has shifted the focus of personnel evaluation criteria away from
political loyalty, which was the only important criterion for promotion prior to the
reform, to economic performance (Chen et al., 2005). Although personal characteristics
of a politician, including age, education and expertise in administrative management,
also matter, local economic performance is the most important criterion on which
central officials assess local officials. Within the multidivisional-form (M-form)
structure of China’s economic system, each provincial leader’s performance is
individually distinguishable and comparable (Qian and Xu, 1993; Maskin et al., 2000),
which enables the use of a relative performance evaluation system by the central
government. Consequently, local officials have become obsessed with their economic
ranking among their peers. Every year, the government reports or provincial yearbooks
provide detailed information on the relative performance rankings of each province, in
areas ranging from GDP growth to infrastructure construction (Li and Zhou, 2005).
Unlike western countries, where political turnover is determined by the general
public through democratic elections, China’s centralized political hierarchy makes the
political turnover more predictable. For example, a well-performing provincial leader
is more likely to move up the ladder to the central government level, including
Ministries and Commissions, the State Council, the Politburo or even the Politburo
Standing Committee. As well as promotion, a punishment mechanism, including forced
retirement and demotions,13 is also employed as an incentive. Given the few options
outside the internal political labour market, Chinese government officials’ concerns
over their career prospects for promotion or termination are effective motivating them
to fulfil the policy targets assigned by the central government and to compete against
each other within the political system.
13 For brevity, we group them together and refer to both as terminations.
8
2.3 China’s banking sector
China has a bank-based financial system, with the banking sector accounting for
two-thirds of the economy’s capital, more than double the share in the US and 1.5 times
the share in most other economies (Farrell et al., 2006). China’s banking sector is
characterized by the dominance of the state ownership of banks, which allows for
government intervention in the decision making of those banks (Firth et al., 2009). Prior
to the late 1990s, the primary role of China’s banking sector was to channel low-cost
capital to state-owned enterprises (SOEs), even poorly performing ones, because of
their scale and government ownership. Moreover, the banks, especially the local bank
branches, were subject to great pressure from local officials to grant loans to politically
favoured enterprises. As a result, policy lending was a salient characteristic of the
banking system.
As a consequence of the policy-directed lending, the Chinese banks had
accumulated enormous amounts of non-performing loans (NPLs). According to the
statistics, the state banks’ share of NPLs over total loans was 20% in 1994. This ratio
increased to 25% in 1997 and then to 35% in 2000 (Tung, 2002; Firth et al., 2009). To
address this problem, the government was forced to undertake a series of actions. First,
China became a member of the World Trade Organization (WTO) on December 11,
2001. As a milestone move to honour its WTO commitments, China released the Rules
for Implementing the Regulations Governing Foreign Financial Institutions in the
People’s Republic of China in January 2002. By December 2006, China had fully
opened up its banking sector to foreign firms so that they could gradually expand their
business in China over the next five years. Second, four asset management companies
(Cinda, Oriental, Great Wall and Huarong) were established to assist the Big Four banks
in addressing their loan problems. As a result of these efforts, the NPL ratios of the Big
Four banks declined sharply from 2002 to 2009 (Barth et al., 2013). Third, the
government encouraged banks to be listed on stock exchanges to enhance external
monitoring. The public listing of the Big Four state-owned banks was successfully
completed by the end of 2010. For instance, ICBC made the initial public offers (IPOs)

9
on both Shanghai and Hong Kong stock exchanges in October 2006 and raised a
staggering $21.9 billion (Berger et al., 2009). The record was broken by the IPO from
the Agricultural Bank of China in 2010, which raised $22.1 billion in Hong Kong.14
Finally, the government deregulated the banking sector by allowing several joint-stock
commercial banks, city banks, and rural and urban credit cooperatives to operate in
China. Moreover, foreign banks were also allowed to establish branches in China, and
to make strategic minority investments in many of the state-owned commercial banks.
Figure 1 summarizes the structure of China’s commercial banking industry.
3. Literature review and hypotheses
Previous research consistently suggests that government ownership of banks is
associated with lower subsequent bank performance and economic growth (e.g., Caprio
and Peria, 2000; Beck and Levine, 2002; La Porta et al., 2002; Bonin et al., 2005; Berger
et al., 2009; Lin and Zhang, 2009). This is broadly consistent with the “political view”
that government-owned banks are used by politicians to serve their own political goals.
This phenomenon is presumably more pronounced in countries with underdeveloped
financial systems and poorly protected property rights, such as China (La Porta et al.,
2002). For example, Berger et al. (2009) find that the Big Four banks in China are the
least efficient of all banks, but that minority foreign ownership of the Big Four banks
can improve bank efficiency. This is corroborated by Lin and Zhang (2009), who
document that the Big Four banks are less profitable and less efficient than other types
of banks in China. Chang et al. (2010) examine the effects of bank fund reallocation on
regional economic growth in China from 1991 to 2005. They fail to find any correlation
between either bank fund reallocation or bank loans and regional economic growth,
which suggests that the lending decisions of Chinese banks are largely policy-driven
rather than market-oriented.
Relative to the effects of government ownership of banks, the question of how
bank lending is politically motivated has been much less studied. Sapienza (2004) finds
14 The world’s biggest IPO, to date, is the US-listed offering made by The Alibaba Group in 2014.

10
that the interest rates charged by government-owned banks in Italy are associated with
the local power of the party that controls the bank. Dinc (2005) shows that government-
owned banks tend to increase their lending in election years relative to private banks.
Khwaja and Mian (2005) find that politically connected firms in Pakistan borrow more
from state-owned banks and are more likely to default. However, the empirical evidence
from China is very limited, with the exception of Ho et al. (2013), who find an increase
in lending made by Chinese state-owned banks during the recent financial crisis when
they were mandated by the government to extend credit. The interpretation is that
China’s state-owned banking system, as a policy instrument, is subsumed into the
government’s macroeconomic agenda.
Based on our discussion of the institutional background and the extant literature,
the coexistence of political centralization and fiscal decentralization in China allows
for a yardstick competition to take place among local officials. On the one hand, the
personnel control is centralized in the hands of central government and economic
performance is a crucial indicator used in personnel evaluations. On the other hand, the
local governments have substantial influences over the local financial resources,
including bank credit. As a result, in order to build up the economy and thus relieve the
personal political pressure, provincial leaders are likely to increase bank lending by
exerting influence over the banks in their jurisdictions. Moreover, the political influence
is expected to be greater for Big Four state-owned banks, which are much more
politically pressurized and undertake more non-economic obligations than other banks.
Previous literature also suggests that politically motivated lending mainly exists in
state-owned banks (La Porta et al., 2002; Dinc, 2005). Thus, we formulate the following
hypotheses:
H1: There is a positive association between the political pressure on provincial
leaders and the growth of bank loans.
H2: The predicted positive relation from H1 is more pronounced for the Big
Four banks than for others.
11
The institutional environment in China varies across regions because different
regions are moving towards a market-oriented economy at different paces (Chen et al.,
2006; Lai et al., 2013). Prior literature documents that regional marketization plays an
essential role in affecting the financial practices of Chinese firms, including capital
structure (Li et al., 2009; Li et al., 2011), corporate fraud (Chen et al., 2006), dividend
payouts (Chen et al., 2009), investment comovement (Chen et al., 2013), foreign direct
investment (Du et al., 2008) and so forth. In a related study, Firth et al. (2009) find that
political connections are less important and financial performance are more important
in determining credit allocation in regions with more developed banking sectors.
Applying this logic to our setting, we hypothesize that the level of regional banking
liberalization moderates the political influence on bank lending:
H3: The positive association between political pressure and the growth of bank
loans is weaker in regions with more developed banking sectors.
As a result of political interference in the credit market, the lending decisions of
banks may not be made on a commercial basis but instead out of political considerations.
Under the system of relative performance evaluation, local politicians are only
interested in the achievements reaped from apparent short-term success, even at the
expense of the long-term prosperity. According to our description in earlier sections,
local officials are promoted almost entirely based on their locality’s growth rates, giving
them a huge incentive to meet or even beat the GDP growth targets. Once local officials
are promoted to a higher rank, the losses or bad debts of banks incurred during their
premiership will become the liabilities of their successors. As such, we predict a
negative association between political pressure and bank lending efficiency as follows:
H4: Bank lending is less commercially oriented under greater political
pressure.
H5: There is a negative association between political pressure and loan quality.
12
4. Research design and data
4.1 Measurement of main variables
4.1.1 Bank credit growth
Following the vast prior literature, we measure the main dependent variable,
growth of bank loans (∆Loani,t), as the percentage change in province i’s total bank
loans from year t-1 to year t. To disentangle the effect of political pressure on banks
with different ownership, we measure the loan growth as the annual growth rate of bank
lending from the Big Four banks, other domestic banks and foreign banks, respectively,
when testing hypothesis H2.
4.1.2 Political pressure
China’s local officials come under pressure regarding the regional GDP growth
rate because it is directly related to their prospects of promotion or termination (Wu,
2000; Rawski, 2001; Li and Zhou, 2005). Following the economic growth target set in
the national five-year plan, local governments set their own targets in the regional five-
year plan. We employ two measures to capture the political pressure: GAP5YRi,t is the
difference between the target GDP growth rate committed in province i’s five-year plan
and its actual GDP growth rate in year t; and GAPNBi,t is the difference between the
average GDP growth rate of province i’s adjacent neighbours and its actual growth rate
in year t.15 Both measures are scaled by the actual GDP growth rate of province i in
year t. Higher values of the measures indicate greater political pressure on the local
officials.
4.1.3 Banking market development
15 According to the classification of the National Bureau of Statistics of China (NBSC), China can be
classified into four regions in terms of their level of economic development. The eastern region includes
the following 10 provinces and municipalities: Beijing, Tianjin, Hebei, Fujian, Guangdong, Hainan,
Jiangsu, Shandong, Shanghai and Zhejiang. The central region includes the following 6 provinces: Anhui,
Henan, Hubei, Hunan, Jiangxi and Shanxi. The western region includes the following 12 provinces and
municipalities: Chongqing, Gansu, Guangxi, Guizhou, Inner Mongolia, Ningxia, Qinghai, Shaanxi,
Sichuan, Tibet, Xinjiang, and Yunnan. The northeastern region includes Liaoning, Heilongjiang and Jilin. For instance, Beijing’s GAPNBt is computed as the mean of the actual GDP growth rates of the 9 eastern
regions other than Beijing minus the actual GDP growth rate of Beijing in year t.

13
China’s private firms are discriminated against by the state-dominated financial
markets, which impede the progress of marketization (Brandt and Li, 2003). Following
Bushman et al. (2013), we measure the degree of banking market development as the
percentage of bank loans issued to non-state-owned enterprises. A higher value of the
percentage suggests that, on average, bank decisions about credit allocation are largely
motivated by profit maximization and less by political considerations. We obtain the
measures from the National Economic Research Institute (NERI) Index of the
Marketization of China’s provinces, constructed by Fan et al. (2011).16
Table A.1 presents the marketization index by province and year. Individually,
Zhejiang has the highest average value, followed by Guangdong and Jiangsu. The
province with the least developed banking market is Jilin, followed by Heilongjiang
and Gansu. Beyond this, the eastern regions have higher values than the other regions
in general, which is consistent with the uneven economic growth in China’s regions.
4.2 Model specification
4.2.1 Test of H1 and H2
To test hypothesis H1, concerning the influence of political pressure on bank loan
growth, we estimate the following model:
∆𝐿𝑜𝑎𝑛𝑖,𝑡 = 𝛼0 + 𝛽1𝑃𝑟𝑒𝑠𝑠𝑢𝑟𝑒𝑖,𝑡 + ∑𝐶𝑜𝑛𝑡𝑟𝑜𝑙𝑠𝑖,𝑡 + 𝜀𝑖,𝑡 (1)
where, for province i and year t, ∆Loan is the annual growth rate of bank loans. Pressure
is the political pressure, separately measured by GAP5YR or GAPNB as defined in Section
4.1.2. If hypothesis H1 is true, then 𝛽1 should be significantly positive.
Following previous research (e.g., Firth et al., 2009; Berger et al., 2009), we
include a vector of control variables to capture possible confounding effects, as follows:
∆GDPi,t is measured as the percentage change of province i’s GDP from year t-1 to year
t. ∆Depositi,t is measured as the percentage change of province i’s deposits from year t-
1 to year t. Branchi,t is the logarithm of the number of bank branches in province i and
year t. SOEi,t is measured by the ratio of revenues from state-owned enterprises to those
16 Since the data are only available up to 2009, we use the 2009 index to measure the level of banking
market development for 2010 and 2011.

14
from all enterprises in province i and year t. Fiscali,t measures the degree of fiscal
decentralization, computed as the ratio of province i’s spending to central spending,
expressed in per capita terms, and multiplied by (1- province i’s GDP/national GDP),
following Zhang and Zou (1998). Opennessi,t measures economic openness, calculated
as the sum of exports and imports divided by GDP in province i and year t. Industryi,t
is the total value of secondary industry divided by GDP in province i and year t.
In addition to these macroeconomic factors, we also control for a set of
characteristics of the provincial leaders.17 Age is measured as the logarithm of the age
of the provincial committee secretary. Age60 is a dummy variable that equals one if the
leader is 60 or older, and zero otherwise. Age is a critical variable determining political
turnover (Li and Zhou, 2005). Officials who are 60 or older will be forced to retire
within five years under the 65-years-of-age retirement rule, making them less politically
motivated to promote economic growth (Xu and Wang, 2010). Tenure is the number of
years for which the provincial leader has been in the post. Promotion is a dummy
variable that equals one if the provincial leader was promoted from within the
provincial government. Education measures the level of education, set to 3, 2, 1, or 0
for PhD, Master’s, Bachelor’s or lower, respectively. Experience measures expertise in
economics and management. It is a dummy variable taking the value of 1 if the
provincial leader previously held a post in the provincial or a higher level of
government in which he/she was directly involved in formulating and implementing
economic plans.18 The variable definitions are presented in Table A.2.
To take a closer look at whether the political influence in bank loans varies among
banks of different ownership, as posited in hypothesis H2, we re-examine Eq.(1) and
disaggregate the total loans into loans issued by the Big Four banks, other domestic
banks and foreign banks, respectively. If our hypothesis H2 holds, then 𝛽1 should be
more significant when the Big Four banks act as the lenders.
17 In the present study, we focus on provincial committee secretaries, because they are considered the
most powerful officials in each province (Li and Zhou, 2005). 18 These posts mainly include those at the National Development and Reform Commission, the
Economic and Trade Commission, the People’s Bank of China, the China Securities Regulatory
Commission, the CBRC and the China Insurance Regulatory Commission.
15
4.2.2 Test of H3
To test hypothesis H3 that the effect of political pressure on bank lending is
attenuated in regions with a higher degree of banking marketization, we estimate the
equation as follows:
∆𝐿𝑜𝑎𝑛𝑖,𝑡 = 𝛼0 + 𝛽1𝑃𝑟𝑒𝑠𝑠𝑢𝑟𝑒𝑖,𝑡 + 𝛽2𝑁𝐸𝑅𝐼𝑖,𝑡 + 𝛽3𝑃𝑟𝑒𝑠𝑠𝑢𝑟𝑒𝑖,𝑡 × 𝑁𝐸𝑅𝐼𝑖,𝑡 +
∑𝐶𝑜𝑛𝑡𝑟𝑜𝑙𝑠𝑖,𝑡 + 𝜀𝑖,𝑡 (2)
where the degree of regional marketization is measured using the financial
marketization index that is developed by the National Economic Research Institute of
China. Each year provinces are grouped into three terciles. NERI equals three if the
province-year is ranked as the highest tercile, two for the intermediate, and one for the
lowest. Thus, we expect the coefficient on 𝑃𝑟𝑒𝑠𝑠𝑢𝑟𝑒 × 𝑁𝐸𝑅𝐼 (𝛽3) is significantly
negative.
4.2.3 Test of H4
To test the influence of political pressure on lending efficiency, we follow
Podpiera (2006) and estimate the following equation:
∆𝐿𝑜𝑎𝑛𝑖,𝑡 = 𝛼0 + 𝛽1𝑃𝑟𝑒𝑠𝑠𝑢𝑟𝑒𝑖,𝑡 + 𝛽2𝑆𝑢𝑟𝑝𝑙𝑢𝑠𝑖,𝑡 + 𝛽3𝑃𝑟𝑒𝑠𝑠𝑢𝑟𝑒𝑖,𝑡 × 𝑆𝑢𝑟𝑝𝑙𝑢𝑠𝑖,𝑡
+∑𝐶𝑜𝑛𝑡𝑟𝑜𝑙𝑠𝑖,𝑡 + 𝜀𝑖,𝑡 (3)
where Surplus is a proxy for the profitability of all enterprises in province i, computed
as the ratio of operating surplus to GDP in province i.19 A positive relation between
Surplus and ∆𝐿𝑜𝑎𝑛 can be interpreted as an indication of growing commercial
orientation. Applying this logic, if political pressure reduces bank lending efficiency,
then we should observe that the coefficient on 𝑃𝑟𝑒𝑠𝑠𝑢𝑟𝑒 × 𝑆𝑢𝑟𝑝𝑙𝑢𝑠 ( 𝛽3 ) is
significantly negative.
4.2.4. Test of H5
19 Podpiera (2006) argues that while the operating surplus data may reflect profitability of state-owned
enterprises more closely than that of other enterprises. It can be used as a proxy for financial performance
of all enterprises since there is no reliable and comprehensive data on the performance of all enterprises
by regions.

16
Finally, to test hypothesis H5 concerning the impact of political pressure on loan
quality, we follow Schaeck et al. (2009) and estimated the following equation:20
𝑁𝐿𝑜𝑎𝑛𝑖,𝑡+1 𝑡𝑜 𝑡+3 = 𝛼0 + 𝛽1𝑃𝑟𝑒𝑠𝑠𝑢𝑟𝑒𝑖,𝑡 + 𝛽2 ∆𝐺𝐷𝑃𝑖,𝑡+1 𝑡𝑜 𝑡+3 + 𝛽3 𝐹𝑖𝑠𝑐𝑎𝑙𝑖,𝑡+1 𝑡𝑜 𝑡+3
+𝛽4 𝐼𝑛𝑑𝑢𝑠𝑡𝑟𝑦𝑖,𝑡+1 𝑡𝑜 𝑡+3 + 𝛽5 𝑀_𝑠𝑡𝑟𝑢𝑐𝑡𝑢𝑟𝑒𝑖,𝑡+1 𝑡𝑜 𝑡+3+𝜀𝑖,𝑡 (4)
where NLoan is measured as the percentage of non-performing loans to total loans.
M_structure is a proxy for market structure, measured as the proportion of total assets
held by the four largest banks in China. The other variables share the same definitions
as those in Section 4.2.1. The independent variable, Pressure, is lagged at least one
period with respect to the dependent variable, NLoan, to allow for the fact that it takes
time for political pressure to have its full impact on the loan quality. Since the data on
loan quality is only available from 2009 to 2013, our sample is reduced to a smaller
size. If hypothesis H5 holds, then 𝛽1 should be significantly positive.
4.3 Sample and data
Our sample covers 2002-2011, a ten-year period. Most of the data used in this
study have been manually collected from various sources. For example, the data of bank
lending come from the official website of the CBRC and the Almanac of China’s
Finance and Banking. The GDP growth targets come from regional five-year plans and
annual government reports. The characteristics of the provincial leaders come mainly
from People’s Daily Online and Xinhua Net, among others. Macroeconomic data,
including GDP growth and operating surplus, is drawn from the China Statistical
Yearbooks. All continuous variables are winsorized at the 1st and 99th percentiles to
mitigate the effect of outliers.
Table 1 presents the sample selection process. The initial sample consists of 310
province-year observations. Tibet province is excluded from our sample due to data
unavailability. We also delete observations without GDP growth goals. The sample
selection process yields a final sample of 294 observations (province-year).
[Insert Table 1]
20 Our control variables are less than those in Schaeck et al (2009) because of different research setting.

17
5. Empirical results
5.1 Summary statistics and correlations
Table 2 presents summary statistics for the variables used in the main analyses.
The average and median levels of credit growth are 14.1% and 14%, respectively,
suggesting that bank lending is ubiquitous in China. Political pressure, measured by
GAP5YR is negative in terms of mean and median, which reveals that local officials may
set low targets to lessen the pressure. Nevertheless, GAPNB is positive on average, which
suggests that political pressure becomes greater when a relative performance evaluation
system is introduced. SOEs contribute more than 40% of local economy, consistent with
China’s economy being characterized by state-capitalism. International business and
secondary industry constitute a large proportion of China’s economy, consistent with
China’s status as an export-oriented country and world manufacturing centre. The
average age of the provincial leaders is about 59 years, varying from 36 to 69 years.
More than half of the leaders are older than 60 years. On average, provincial leaders
hold the office for three and a half years and 42.3% of them were promoted from with
the provincial government. The leaders have a Bachelor’s degree or higher on average,
and 42% of them have previous work experience in economics departments.
Table 3 presents the Pearson correlation matrix. Credit growth is significantly
positively correlated with political pressure (correlation coefficients: 0.265 for GAP5YR,
and 0.101 for GAPNB). This lends initial support to hypothesis H1 that local officials
are likely to cope with political pressure by expanding bank credit. As expected, the
two pressure variables are highly correlated with each other. In addition, credit growth
is positively correlated with deposit growth (Deposit: 0.670), the number of bank
branches (Branch: 0.125), local fiscal power (Deficit: 0.102) and the educational
background of the provincial leader (Education: 0.108), and negatively correlated with
the percentage contributed by the state-owned economy (SOE: -0.251). Finally, the
correlations among the non-dependent variables are less than 0.7 in general. Thus,

18
multicollinearity should not be a concern in this study.21
[Insert Table 3]
5.2 Political pressure and credit growth: Test of H1
Table 4 reports the regression results of testing hypothesis H1. In the first two
columns, we report the regressions with GAP5YR as the independent variable.
Regardless of whether the characteristics of provincial leaders are included, the
coefficients on GAP5YR are statistically positive (in column 2: coefficient=0.072, t-
stat=2.114). This supports our conjecture that regional banks are forced to expand credit
when local officials face the pressure of not being able to achieve the economic goals.
Similar results are observed in columns (3) and (4) (in column 4: coefficient=0.076, t-
stat=1.869), where GAPNB is used as the independent variable. This implies that local
officials have greater pressure and are more likely to push local banks to issue credit
when they are outperformed by the adjacent provincial leaders.
[Insert Table 4]
The signs of the coefficients on control variables are broadly consistent with the
predicted ones. For instance, the coefficients on ∆GDP are positive and significant at
the 1% level, suggesting that the growth rate of loans is primarily driven by regional
economic growth. In addition, the coefficients on ∆Deposit are positive and significant,
which is consistent with Jayaratne and Morgan’s (2000) finding that faster deposit
growth signals a growing demand for loans. Branch has positive coefficients although
statistically insignificant, suggesting that the competitiveness of the banking sector
increases with the allocation of credit made by the banks. The coefficients on Openness
are positive and significant, indicating that loans are in higher demand in wealthier and
export-oriented regions. Finally, Age60 is negatively associated with credit growth,
consistent with Li and Zhou’s (2005) finding that officials who are older than 60 are
less likely to be promoted and therefore have less motivation to build up the economy
21 Lind et al. (2002) point out that multicollinearity may exist if the correlation coefficients exceed 0.7,
which is a typical threshold used to identify its presence.

19
through bank credit.
5.3 Subsample analysis: Test of H2
Table 5 presents results of examining hypothesis H2. Columns (1) and (2) report
results when loans are issued by the Big Four state-owned banks. Consistent with our
prediction, both measures of political pressure are significantly positive. However, as
shown in the rest of columns, the relation becomes insignificant for other domestic
banks and foreign banks, whose lending decisions are less likely to be made on a
political basis. Overall, the results suggest that the primary role of state-owned banks
is to serve policy goals rather than seek profit, which partially explains why state-owned
banks underperform their foreign counterparts in China (Berger et al., 2009).
[Insert Table 5]
5.4 Banking marketization, political pressure and credit growth: Test of H3
According to hypothesis H3, the relationship between political pressure and credit
growth may not be uniform between regions with more and less developed banking
sectors. Our results from testing this hypothesis are reported in Table 6. Consistent with
Firth et al. (2009), banking marketization changes the effect of political pressure on
credit growth. Specifically, the coefficients on 𝑃𝑟𝑒𝑠𝑠𝑢𝑟𝑒 × 𝑁𝐸𝑅𝐼 are significantly
negative for both measures of political pressure, indicating that the institutional
environment, especially the banking liberalization, is an important mechanism that
moderates political interference in bank decisions.
[Insert Table 6]
5.5 Political pressure and lending efficiency: Test of H4
Table 7 presents the regression results of testing hypothesis H4. The coefficients
on Surplus are positive and significant at the 5% level, suggesting that on average the
profitability of regional enterprises is an important determinant of lending growth.
However, this positive relation is moderated by political pressure. Specifically, the
coefficients on 𝑃𝑟𝑒𝑠𝑠𝑢𝑟𝑒 × 𝑆𝑢𝑟𝑝𝑙𝑢𝑠 are significantly negative. This confirms our
20
hypothesis H4 that banks do not appear to take corporate profitability into account when
local governments are subject to great political pressure.
[Insert Table 7]
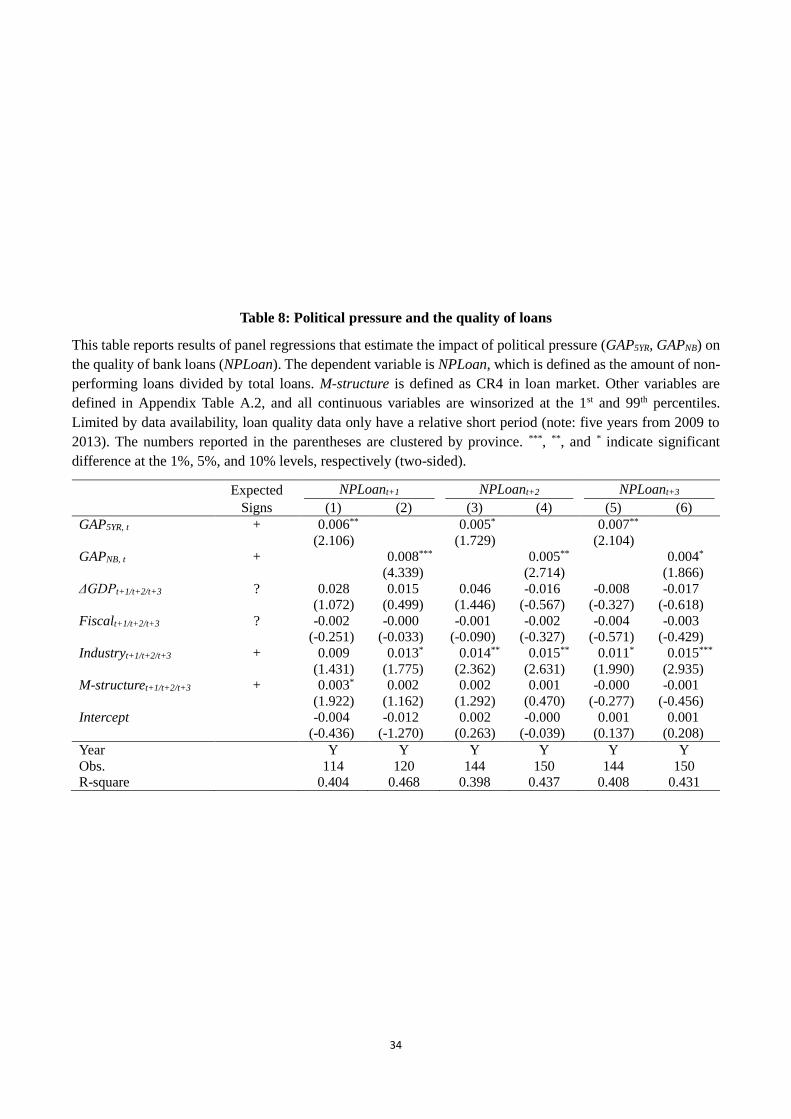
5.6 Political pressure and loan quality: Test of H5
Table 8 shows the relation between political pressure and the quality of loans. As
conjectured, the current pressure is significantly positively associated with non-
performing loans in the subsequent three years. When political pressure arises from the
inter-party competition, i.e., GAPNB is the dependent variable, the impact of pressure
on loan quality gradually decreases across periods, with the effect being the strongest
for the t+1 year. In addition, the proportion of secondary industry to local economy is
another determinant of bad debts, which supports the statistics of the CBRC showing
that the secondary industry contributes to the largest share of non-performing loans in
China.22
[Insert Table 8]
5.7 Robustness analyses
5.7.1 Political pressure and excessive loan growth
As a robustness check, we repeat our analyses using excessive loan growth as the
dependent variable. A widely used approach explains the expected level of credit
growth by a set of macroeconomic variables (Hofmann, 2001; Brzoza-Brzezina, 2005).
However, this approach may not be applicable in China. Because bank credit serves
mainly as a policy tool in China, and it is less reliant on market factors than it is in
developed economies (Koivu, 2009). In addition, this type of estimation requires data
over a long period, which is unavailable in China. Excessive credit growth is also
defined as credit expansion beyond the growth of the real economy (Honohan, 1997;
Adams et al., 1998). Following this definition, we measure the excessive credit growth
(Ex∆Loani,t) in the present study as the growth rate of bank loans minus the GDP growth
22 Please find detailed information via the following link:
http://www.cbrc.gov.cn/chinese/home/docView/4DE6AD136C6E4F99B9883B7672674FC3.html
21
rate for province i in year t. As can be seen in Table 9, results are similar to those
reported in previous tables. These results reinforce our evidence of the political
influence on the bank lending behaviour.
[Insert Table 9]
5.7.2 Mid-term political pressure and loan growth
One may argue that, if loan growth is indeed driven by political pressure, we
should observe more aggressive credit growth in the later years of a five-year cycle if
the local government has failed to achieve its economic goals in the earlier years. To
investigate this issue, we re-examine Eq.(1) replacing the independent variable with
LagGAP5YR, which equals 1 if the average value of GDP growth for the first three years
is below the target growth rate committed in the five-year plan, and 0 otherwise. Table
10 presents the results. As shown in both columns (1) and (2), the coefficients on
LagGAP5YR are positive and significant at the 10% level. This corroborates our
argument that local governments that have underperformed relative to their economy
target in the earlier years during a five-year plan may attempt to catch up in the later
years by expanding bank credit.
[Insert Table 10]
5.7.3 Political pressure and loan growth: Change specifications
It is argued in prior literature (Li, 2010a; Kravet and Muslu, 2013) that change
methodology can better prevent statistical inferences from correlated omitted variables
and reverse causality problems. In an attempt to address the potential concerns, we
repeat all analysis by employing change specifications, in which all variables except
for dummy are measured by the annual change from year t-1 to year t. As shown in
Table 11, our main inferences are not quantitatively affected by the change
methodology.23
[Insert Table 11]
23 The full results are presented in Appendix Tables A.3, A.4, and A.5 so as to save space.

22
6. Conclusion
In this paper, we examine the association between credit growth and political
pressure in the context of China. Using a unique dataset of Chinese banks for the period
2002-2011, we obtain the following findings: First, political pressure is positively
associated with credit growth, and the relation is more pronounced for loans issued by
the Big Four state-owned banks. Our findings support the “political” view that
government officials may participate in bank decisions making because of their political
objectives. Next, the relation is attenuated in regions with more developed banking
sectors, suggesting that the institutional environment is an external monitoring and
governance mechanism for banks. Finally, as a result of growing political intervention,
lending decisions of banks becomes less commercially oriented and loan quality is
going down. Overall, our findings suggest that the political motives significantly affect
the amount of credit issued by banks in China.
Our findings have implications for regulators, banks and investors. For policy
makers in transitional economies, given the pervasiveness of political influence in the
financial markets, further rules and regulations should be promulgated to make banks’
lending decisions more commercially oriented and to create a more impartial playing
field for all types of banks. In addition, banks can utilize the results if they want to
improve efficiency. Particularly, state-owned banks are likely to benefit from ongoing
partial privatization by introducing foreign strategic investors. Finally, investors can
benefit from our study through increased awareness of the association between political
pressure and bank lending decisions.

23
Reference
Adams, C., Mathieson, D. J., Schinasi, G., & Chadha, B. (1998). International Capital
Markets: Developments. Prospects and Policy Issues.
Allen, F., Qian, J., & Qian, M. (2005). Law, finance, and economic growth in
China. Journal of Financial Economics, 77(1), 57-116.
Barth, J. R., Li, L., Li, T., & Song, F. (2013). Reforms of China’s Banking System.
Working Paper.
Beck, T., & Levine, R. (2002). Industry growth and capital allocation: does having a
market-or bank-based system matter? Journal of Financial Economics, 64(2), 147-180.
Berger, A. N., Hasan, I., & Zhou, M. (2009). Bank ownership and efficiency in China:
What will happen in the world’s largest nation? Journal of Banking & Finance, 33(1),
113-130.
Besley, T., & Case, A. (1992). Incumbent behavior: Vote seeking, tax setting and
yardstick competition (No. w4041). National Bureau of Economic Research.
Bonin, J. P., Hasan, I., & Wachtel, P. (2005). Bank performance, efficiency and
ownership in transition countries. Journal of Banking & Finance, 29(1), 31-53.
Brandt, L., & Li, H. (2003). Bank discrimination in transition economies: ideology,
information, or incentives? Journal of Comparative Economics, 31(3), 387-413.
Brown, C. O., & Dinc, I. S. (2005). The politics of bank failures: Evidence from
emerging markets. The Quarterly Journal of Economics, 120(4), 1413-1444.
Brzoza-Brzezina, M. (2005). Lending booms in the new EU Member States: will euro
adoption matter? European Central Bank.
Burdekin, R. C., & Siklos, P. L. (2008). What has driven Chinese monetary policy since
1990? Investigating the People’s Bank’s policy rule. Journal of International Money
and Finance, 27(5), 847-859.
Bushman, R. M., Chen, Q., Wang, K., & Xiao, X. (2013). Bank incentives, credit
market discipline and firm performance in China. Working Paper.
Caprio, G., & Peria, M. S. M. (2002). Avoiding disaster: Policies to reduce the risk of
banking crises. Monetary policy and exchange rate regimes: Options for the Middle
East, 193-230.
Chang, P. C., Jia, C., & Wang, Z. (2010). Bank fund reallocation and economic growth:
Evidence from China. Journal of Banking & Finance, 34(11), 2753-2766.
Chen, D. H., Li, Z., Xin, F., & Yeung, B. Yin. (2013). Five-year plans, China finance
and their consequences. Working Paper.
Chen, D., Jian, M., & Xu, M. (2009). Dividends for tunneling in a regulated economy:
The case of China. Pacific-Basin Finance Journal, 17(2), 209-223.

24
Chen, D., Khan, S., Yu, X., & Zhang, Z. (2013). Government Intervention and
Investment Comovement: Chinese Evidence. Journal of Business Finance &
Accounting, 40(3-4), 564-587.
Chen, G., Firth, M., Gao, D. N., & Rui, O. M. (2006). Ownership structure, corporate
governance, and fraud: Evidence from China. Journal of Corporate Finance, 12(3),
424-448.
Chen, Y., Li, H., & Zhou, L. A. (2005). Relative performance evaluation and the
turnover of provincial leaders in China. Economics Letters, 88(3), 421-425.
Chow, G. C. (2004). Economic reform and growth in China. Annals of Economics and
Finance, 5, 93-118.
Dinç, I. S. (2005). Politicians and banks: Political influences on government-owned
banks in emerging markets. Journal of Financial Economics, 77(2), 453-479.
Du, J., Lu, Y., & Tao, Z. (2008). Economic institutions and FDI location choice:
Evidence from US multinationals in China. Journal of Comparative Economics, 36(3),
412-429.
Fan, G., Wang, X., & Zhu, H. (2011). The Marketization Index of China: The Process
of Regional Marketization Report 2011.
Farrell, D., Lund, S., & Morin, F. (2006). How financial-system reform could benefit
China. Mckinsey Quarterly, 2(I), 92.
Firth, M., Lin, C., Liu, P., & Wong, S. M. (2009). Inside the black box: Bank credit
allocation in China’s private sector. Journal of Banking & Finance, 33(6), 1144-1155.
Frye, T., & Shleifer, A. (1996). The invisible hand and the grabbing hand (No. w5856).
National Bureau of Economic Research.
Ho, C. Y., Li, D., & Tian, S. H. (2013). Political influence and incentives: The lending
behaviour of a state-owned bank in the global financial crisis. Working Paper.
Hofmann, B. (2001). The determinants of private sector credit in industrialised
countries: do property prices matter? Working Paper.
Honohan, P. (1997). Banking System Failures in Developing and Transition Countries:
Diagnostics and Prediction. BIS Working Paper
Huang, Y. (2002). Managing Chinese bureaucrats: an institutional economics
perspective. Political studies, 50(1), 61-79.
Jayaratne, J., & Morgan, D. P. (2000). Capital market frictions and deposit constraints
at banks. Journal of Money, Credit and Banking, 74-92.
Khwaja, A. I., & Mian, A. (2005). Do lenders favor politically connected firms? Rent
provision in an emerging financial market. The Quarterly Journal of Economics, 120(4),
1371-1411.

25
Koivu, T. (2009). Has the Chinese economy become more sensitive to interest rates?
Studying credit demand in China. China Economic Review, 20(3), 455-470.
Kornai, J. (1979). Economics of Shortage (pp. 565-6). North-Holland Publishing
Company.
Kravet, T., & Muslu, V. (2013). Textual risk disclosures and investors’ risk perceptions.
Review of Accounting Studies, 18(4), 1088-1122.
La Porta, R., Lopez-de-Silanes, F., & Shleifer, A. (2002). Government ownership of
banks. The Journal of Finance, 57(1), 265-301.
Lai, J. T., McNelis, P. D., & Yan, I. K. (2013). Regional capital mobility in China:
Economic reform with limited financial integration. Journal of International Money
and Finance, 37, 493-503.
Lee, E., Walker, M., & Zeng, C. (2014). Do Chinese government subsidies affect firm
value? Accounting, Organizations and Society, 39(3), 149-169.
Li, F. (2010). Survey of the literature. Journal of Accounting Literature, 29, 143-165.
Li, H., & Zhou, L. A. (2005). Political turnover and economic performance: the
incentive role of personnel control in China. Journal of Public Economics, 89(9), 1743-
1762.
Li, K., Wang, T., Cheung, Y. L., & Jiang, P. (2011). Privatization and risk sharing:
Evidence from the split share structure reform in China. Review of Financial
Studies, 24(7), 2499-2525.
Li, K., Yue, H., & Zhao, L. (2009). Ownership, institutions, and capital structure:
Evidence from China. Journal of Comparative Economics, 37(3), 471-490.
Lin, X., & Zhang, Y. (2009). Bank ownership reform and bank performance in
China. Journal of Banking & Finance, 33(1), 20-29.
Maskin, E., Qian, Y., & Xu, C. (2000). Incentives, information, and organizational
form. The Review of Economic Studies, 67(2), 359-378.
Qian, Y., & Xu, C. (1993). Why China's economic reforms differ: the M-form hierarchy
and entry/expansion of the non-state sector. Economics of Transition, 1(2), 135-170.
Podpiera, R. (2006) Progress in China’s banking sector reform: Has bank behavior
changed? IMF working paper.
Rawski, T. G. (2001). What is happening to China's GDP statistics? China Economic
Review, 12(4), 347-354.
Sapienza, P. (2004). The effects of government ownership on bank lending. Journal of
Financial Economics, 72(2), 357-384.
Shleifer, A., & Vishny, R. W. (1994). Politicians and firms. The Quarterly Journal of
Economics, 109(4), 995-1025.

26
Wu, H. X. (2000). China's GDP level and growth performance: alternative estimates
and the implications. Review of Income and Wealth, 46(4), 475-499.
Xu, X. X., & Wang, X. B. (2010). Promotion incentives and economic growth:
Evidence from China’s provincial officials. The Journal of World Economy, 2, 15-36.
(in Chinese)
Zhang, T., & Zou, H. F. (1998). Fiscal decentralization, public spending, and economic
growth in China. Journal of Public Economics, 67(2), 221-240.

27
Table 1: Sample selection
This table reports the sample selection criteria. For the 300 province-year observations, we have manually
collected the following data: bank loans (from China Banking Regulatory Commission), targets of GDP growth
(from regional five-year plans and government annual reports), characteristics of provincial leaders (from
People’s Daily Online and Xinhua Net), and some macroeconomic estimates (from China Statistical Yearbooks).
Sample selection process Observations
Initial sample of 31 provinces for 2002 to 2011 310
Less:
Observations of Tibet province 10
Province-year without targets of GDP growth from the government
five-year plans
6
Final sample 294

28
Table 2: Summary statistics
This table shows summary statistics of the main variables. Variables are defined in Appendix Table A.2, and all
continuous variables are winsorized at the 1st and the 99th percentiles.
Variable Obs. Mean Median Std. Dev. Min Max
ΔLoan 300 0.141 0.140 0.085 -0.310 0.350
NPLoan 150 0.012 0.010 0.005 0.004 0.029
GAP5YR 294 -0.225 -0.224 0.121 -0.621 0.111
GAPNB 300 0.020 0.004 0.150 -0.459 0.544
ΔGDP 300 0.127 0.126 0.022 0.054 0.238
ΔDeposit 300 0.158 0.150 0.052 -0.120 0.320
Branch 300 7.948 8.009 0.698 6.100 9.385
SOE 300 0.416 0.422 0.119 0.184 0.731
Fiscal 300 0.560 0.543 0.104 0.351 0.879
Openness 300 0.356 0.148 0.446 0.029 3.609
Industry 300 0.476 0.487 7.549 0.207 0.615
Surplus 300 0.246 0.252 0.064 0.075 0.383
Age 300 58.720 60.000 5.222 36.000 69.000
Age60 300 0.506 1.000 0.500 0.000 1.000
Tenure 300 3.545 3.000 2.486 0.083 14.000
Promotion 300 0.423 0.000 0.494 0.000 1.000
Education 300 1.553 1.000 0.780 0.000 3.000
Experience 300 0.420 0.000 0.494 0.000 1.000

29
Table 3: Correlation matrix
This table reports the correlation matrix of variables used in the main analyses. Variables are defined in Appendix Table A.2, and all continuous variables are winsorized at the
1st and 99th percentiles. ***, **, and * indicate significant difference at the 1%, 5%, and 10% levels, respectively (two-sided).
1 2 3 4 5 6 7 8 9 10 11 12 13 14 15 16
ΔLoan
GAP5YR 0.265***
GAPNB 0.101* 0.625***
ΔGDP 0.088 -0.663*** -0.553***
ΔDeposit 0.670*** 0.004 -0.144** 0.072
Branch 0.125** -0.084 -0.103* 0.073 0.076
SOE -0.251*** 0.174*** 0.241*** -0.230*** -0.237*** -0.536***
Fiscal 0.102* -0.121** -0.046 0.140** 0.054 0.469*** -0.639***
Openness 0.011 -0.083 -0.024 0.012 -0.012 0.225*** -0.398*** 0.705***
Surplus -0.099* -0.240*** -0.209*** 0.450*** -0.077 0.352*** -0.391*** 0.165** 0.287***
Industry 0.024 -0.073 -0.260*** 0.299*** 0.094 0.334*** -0.240*** 0.061 0.113** 0.429***
Age 0.071 -0.007 -0.063 0.043 0.084 0.115** -0.165*** 0.186*** 0.084 0.068 -0.129**
Age60 -0.013 -0.008 -0.039 0.051 0.015 0.068 -0.057 0.116** 0.043 0.101* -0.124** 0.722***
Tenure -0.055 0.072 0.139** -0.079 -0.028 -0.116** 0.221*** -0.049 0.011 -0.033 -0.155*** 0.061 0.242***
Promotion -0.083 0.089 0.142** -0.119** -0.074 -0.050 0.034 0.120** 0.077 -0.030 -0.194*** -0.069 -0.004 0.123**
Education 0.108** 0.023 0.031 0.039 0.080 0.021 -0.052 0.036 -0.042 -0.059 -0.034 -0.354*** -0.317*** -0.145*** 0.127**
Experience 0.059 -0.065 -0.059 0.080 0.097* 0.074 -0.119** 0.096* 0.034 0.029 0.021 -0.143** -0.241*** -0.255*** -0.168*** 0.331***

30
Table 4: Political pressure and credit growth
This table reports results of panel regressions that estimate the impact of political pressure (GAP5YR, GAPNB) on
provincial credit growth. The dependent variable is annual growth rate of the total bank loans (ΔLoan). Variables
are defined in Appendix Table A.2, and all continuous variables are winsorized at the 1st and 99th percentiles.
The numbers reported in the parentheses are clustered by province. ***, **, and * indicate significant difference
at the 1%, 5%, and 10% levels, respectively (two-sided).
Expected
Signs (1) (2) (3) (4)
GAP5YR + 0.073* 0.072**
(1.929) (2.114)
GAPNB + 0.079** 0.076*
(2.248) (1.869)
ΔGDP + 0.614*** 0.589*** 0.889*** 0.841***
(3.356) (3.791) (3.089) (2.820)
ΔDeposit + 0.880*** 0.883*** 0.843*** 0.848***
(11.449) (11.359) (9.943) (10.194)
Branch + 0.011 0.012* 0.010 0.011
(1.457) (1.781) (1.370) (1.657)
SOE + 0.042 0.039 0.026 0.023
(0.988) (0.914) (0.676) (0.557)
Fiscal - -0.040 -0.036 -0.035 -0.030
(-1.106) (-1.056) (-0.849) (-0.772)
Openness + 0.012* 0.012* 0.011 0.011
(1.907) (1.929) (1.570) (1.556)
Industry - -0.000 -0.000 -0.000 -0.000
(-0.816) (-0.798) (-0.594) (-0.634)
Age ? 0.001 0.001
(1.289) (1.274)
Age60 - -0.014* -0.012
(-1.885) (-1.653)
Tenure ? -0.000 -0.000
(-0.169) (-0.415)
Promotion - -0.005 -0.006
(-0.722) (-0.878)
Education + 0.005 0.005
(1.281) (1.294)
Experience ? -0.007 -0.007
(-1.116) (-1.080)
Intercept -0.176 -0.262** -0.217** -0.279***
(-1.487) (-2.108) (-2.645) (-3.280)
Year Y Y Y Y
Obs. 294 294 300 300
R-square 0.759 0.770 0.759 0.769

31
Table 5: Subsample analysis: Big Four banks, other domestic banks and foreign banks
This table reports results of panel regressions that estimate the impact of political pressure (GAP5YR, GAPNB) on
provincial credit growth. In models (1) and (2), the dependent variable is the annual growth rate of total loans
made by Big Four state-owned banks. In models (3) and (4), the dependent variable is the annual growth rate
of total loans made by other domestic banks. Finally, in models (5) and (6), the annual growth rate of total loans
made by foreign banks is used. Variables are defined in Appendix Table A.2, and all continuous variables are
winsorized at the 1st and 99th percentiles. The numbers reported in the parentheses are clustered by province. ***, **, and * indicate significant difference at the 1%, 5%, and 10% levels, respectively (two-sided).
Expected Big 4 state-owned banks Other domestic banks Foreign banks
Signs (1) (2) (3) (4) (4) (6)
GAP5YR + 0.061* 0.019 0.008
(1.718) (0.279) (1.513)
GAPNB + 0.075* -0.025 -0.006
(1.765) (-0.362) (-0.716)
ΔGDP + 0.672*** 0.990*** -0.238 -0.444 0.030 -0.060
(3.840) (3.357) (-0.461) (-0.617) (1.078) (-0.849)
ΔDeposit + 0.728*** 0.675*** 1.115*** 1.109*** 0.003*** 0.003***
(7.801) (7.059) (6.788) (6.994) (6.226) (5.919)
Branch + -0.004 -0.005 -0.023 -0.023 -0.001 -0.002*
(-0.473) (-0.604) (-1.316) (-1.372) (-1.213) (-1.886)
SOE + 0.009 -0.009 -0.111 -0.114 -0.001 0.002
(0.193) (-0.194) (-1.308) (-1.398) (-0.146) (0.193)
Fiscal - -0.112** -0.108** -0.052 -0.048 -0.018** -0.011
(-2.496) (-2.153) (-1.022) (-0.798) (-2.204) (-1.433)
Openness + 0.023** 0.023** -0.000 0.000 -0.002* -0.003*
(2.756) (2.472) (-0.029) (0.009) (-1.978) (-2.035)
Industry - 0.000 0.000 0.002 0.002 -0.000** -0.000
(0.138) (0.101) (1.340) (1.446) (-2.683) (-0.569)
Age ? 0.001 0.001 0.002 0.002 -0.000 -0.000
(1.483) (1.382) (1.316) (1.266) (-1.209) (-0.758)
Age60 - -0.010 -0.008 -0.013 -0.013 0.001 -0.000
(-1.182) (-0.910) (-0.828) (-0.804) (0.611) (-0.040)
Tenure ? -0.000 -0.000 0.004 0.004 -0.000 -0.000
(-0.096) (-0.300) (1.604) (1.621) (-0.611) (-0.116)
Promotion - -0.006 -0.007 -0.013 -0.013 -0.001 -0.000
(-0.750) (-1.000) (-1.020) (-1.038) (-1.191) (-0.390)
Education + 0.008* 0.008* 0.016 0.015 -0.000 0.000
(1.856) (1.853) (1.412) (1.383) (-0.887) (0.362)
Experience ? -0.005 -0.006 -0.008 -0.009 -0.002 -0.002*
(-0.802) (-0.863) (-0.703) (-0.809) (-1.425) (-1.807)
Intercept -0.121 -0.146 0.057 0.067 0.040*** 0.051***
(-0.805) (-1.251) (0.331) (0.398) (3.053) (2.903)
Year Y Y Y Y Y Y
Obs. 294 300 292 298 76 78
R-square 0.678 0.679 0.662 0.661 0.387 0.335

32
Table 6: Financial marketization, political pressure and credit growth
This table reports results of panel regressions that estimate the impact of political pressure (GAP5YR, GAPNB)
and financial marketization (NERI) on provincial credit growth. The dependent variable is annual growth rate
of the total bank loans (ΔLoan). NERI is estimated using the financial marketization index that is developed by
the National Economic Research Institute (NERI) of China. Each year provinces are grouped into terciles (=3
for the highest, =1 for the lowest) based on their marketization level. Variables are defined in Appendix Table
A.2, and all continuous variables are winsorized at the 1st and 99th percentiles. The numbers reported in the
parentheses are clustered by province. ***, **, and * indicate significant difference at the 1%, 5%, and 10% levels,
respectively (two-sided).
Expected
Signs (1) (2) (3) (4)
GAP5YR + 0.180** 0.176**
(2.299) (2.464)
GAP5YR × NERI - -0.048* -0.046*
(-1.727) (-1.759)
GAPNB + 0.233*** 0.244***
(3.094) (3.291)
GAPNB × NERI - -0.061** -0.065***
(-2.539) (-2.979)
NERI + 0.037* 0.036* 0.063** 0.068***
(1.718) (1.803) (2.704) (3.148)
ΔGDP + 0.612*** 0.595*** 0.962*** 0.938***
(3.112) (3.625) (3.008) (2.792)
ΔDeposit + 0.882*** 0.885*** 0.868*** 0.873***
(12.046) (11.841) (10.548) (10.616)
Branch + 0.012 0.011 0.011 0.011
(1.610) (1.650) (1.641) (1.608)
SOE + 0.035 0.032 0.021 0.017
(0.795) (0.718) (0.516) (0.396)
Fiscal - -0.043 -0.044 -0.039 -0.039
(-1.174) (-1.256) (-0.964) (-0.977)
Openness + 0.013** 0.014** 0.011* 0.012*
(2.098) (2.120) (1.743) (1.727)
Industry - -0.000 -0.000 -0.000 -0.000
(-0.879) (-0.893) (-0.657) (-0.703)
Age ? 0.001 0.001
(1.228) (1.353)
Age60 - -0.013* -0.012*
(-1.820) (-1.721)
Tenure ? -0.000 -0.001
(-0.147) (-0.699)
Promotion - -0.006 -0.006
(-0.945) (-1.056)
Education + 0.005 0.006
(1.229) (1.428)
Experience ? -0.006 -0.005
(-1.054) (-0.838)
Intercept -0.292** -0.330** -0.394*** -0.467***
(-2.171) (-2.342) (-3.507) (-4.353)
Year Y Y Y Y
Obs. 294 294 300 300
R-square 0.761 0.761 0.764 0.766

33
Table 7: Political pressure and provincial profitability
This table reports results of panel regressions that estimate the impact of political pressure (GAP5YR, GAPNB)
and provincial profitability (Surplus) on provincial credit growth. The dependent variable is annual growth rate
of the total bank loans (ΔLoan). Surplus measures the province’s profitability, which is defined as the ratio of
operating surplus to GDP. Variables are defined in Appendix Table A.2, and all continuous variables are
winsorized at the 1st and 99th percentiles. The numbers reported in the parentheses are clustered by province. ***, **, and * indicate significant difference at the 1%, 5%, and 10% levels, respectively (two-sided).
Expected
Signs (1) (2)
Surplus + 0.600** 0.678**
(2.152) (2.480)
GAP5YR + 0.206**
(2.457)
GAP5YR × Surplus - -0.743**
(-2.108)
GAPNB + 0.207**
(2.449)
GAPNB × Surplus - -0.659**
(-2.295)
ΔGDP + 0.321* 0.529**
(1.871) (2.399)
ΔDeposit + 0.882*** 0.859***
(10.481) (9.688)
SOE + -0.020 -0.036
(-0.672) (-1.120)
Industry - 0.000 0.000
(0.460) (0.562)
Intercept ? -0.129 -0.251***
(-1.493) (-2.822)
Characteristics of provincial leaders
Controlled Controlled
Year Y Y
Obs. 294 300
R-square 0.751 0.752
34
Table 8: Political pressure and the quality of loans
This table reports results of panel regressions that estimate the impact of political pressure (GAP5YR, GAPNB) on
the quality of bank loans (NPLoan). The dependent variable is NPLoan, which is defined as the amount of non-
performing loans divided by total loans. M-structure is defined as CR4 in loan market. Other variables are
defined in Appendix Table A.2, and all continuous variables are winsorized at the 1st and 99th percentiles.
Limited by data availability, loan quality data only have a relative short period (note: five years from 2009 to
2013). The numbers reported in the parentheses are clustered by province. ***, **, and * indicate significant
difference at the 1%, 5%, and 10% levels, respectively (two-sided).
Expected NPLoant+1 NPLoant+2 NPLoant+3
Signs (1) (2) (3) (4) (5) (6)
GAP5YR, t + 0.006** 0.005* 0.007**
(2.106) (1.729) (2.104)
GAPNB, t + 0.008*** 0.005** 0.004*
(4.339) (2.714) (1.866)
ΔGDPt+1/t+2/t+3 ? 0.028 0.015 0.046 -0.016 -0.008 -0.017
(1.072) (0.499) (1.446) (-0.567) (-0.327) (-0.618)
Fiscalt+1/t+2/t+3 ? -0.002 -0.000 -0.001 -0.002 -0.004 -0.003
(-0.251) (-0.033) (-0.090) (-0.327) (-0.571) (-0.429)
Industryt+1/t+2/t+3 + 0.009 0.013* 0.014** 0.015** 0.011* 0.015***
(1.431) (1.775) (2.362) (2.631) (1.990) (2.935)
M-structuret+1/t+2/t+3 + 0.003* 0.002 0.002 0.001 -0.000 -0.001
(1.922) (1.162) (1.292) (0.470) (-0.277) (-0.456)
Intercept -0.004 -0.012 0.002 -0.000 0.001 0.001
(-0.436) (-1.270) (0.263) (-0.039) (0.137) (0.208)
Year Y Y Y Y Y Y
Obs. 114 120 144 150 144 150
R-square 0.404 0.468 0.398 0.437 0.408 0.431

35
Table 9: Robust check: Excessive credit growth
This table repeated the analysis of table 6 using the excessive credit growth (ExΔLoan) as the dependent variable.
ExΔLoan is measured as the ratio of annual growth rate of bank loans to annual growth rate of GDP. Variables
are defined in Appendix Table A.2, and all continuous variables are winsorized at the 1st and 99th percentiles.
The numbers reported in the parentheses are clustered by province. ***, **, and * indicate significant difference
at the 1%, 5%, and 10% levels, respectively (two-sided).
Expected
Signs (1) (2) (3) (4)
GAP5YR + 0.785*** 1.817***
(2.916) (3.329)
GAP5YR × NERI - -0.462**
(-2.304)
GAPNB + 0.896** 2.450***
(2.068) (3.987)
GAPNB × NERI - -0.603***
(-3.476)
NERI + 0.363** 0.633***
(2.402) (3.727)
ΔGDP ? -3.655** -3.720** -0.433 0.406
(-2.317) (-2.537) (-0.135) (0.141)
ΔDeposit + 6.503*** 6.524*** 6.146*** 6.380***
(10.382) (10.759) (9.538) (10.007)
Branch + 0.116* 0.118** 0.102* 0.106*
(1.967) (2.074) (1.762) (1.912)
SOE + 0.444 0.375 0.253 0.208
(1.142) (0.918) (0.687) (0.511)
Fiscal - -0.169 -0.212 -0.105 -0.167
(-0.573) (-0.719) (-0.316) (-0.503)
Openness + 0.091* 0.104** 0.079 0.086
(1.862) (2.077) (1.491) (1.629)
Industry - -0.004 -0.004 -0.002 -0.002
(-0.923) (-1.042) (-0.608) (-0.698)
Age ? 0.012* 0.011 0.011* 0.011*
(1.746) (1.631) (1.798) (1.850)
Age60 - -0.111* -0.101 -0.093 -0.090
(-1.783) (-1.686) (-1.565) (-1.669)
Tenure ? -0.003 -0.003 -0.006 -0.009
(-0.309) (-0.304) (-0.654) (-0.960)
Promotion - -0.046 -0.058 -0.048 -0.053
(-0.840) (-1.100) (-0.967) (-1.160)
Education + 0.033 0.031 0.032 0.037
(1.051) (0.965) (1.044) (1.192)
Experience ? -0.062 -0.053 -0.062 -0.041
(-1.263) (-1.142) (-1.170) (-0.861)
Intercept -2.545** -3.287*** -2.966*** -4.666***
(-2.510) (-3.021) (-3.508) (-5.635)
Year Y Y Y Y
Obs. 294 294 300 300
R-square 0.759 0.761 0.762 0.771

36
Table 10: Mid-term political pressure and credit growth
This table reports the results of panel regressions that estimate the impact of political pressure (GAP5YR) on
provincial credit growth before the end of each five-year plan period. We restrict our sample to the last two
years of the period of a five-year plan. The dependent variable is annual growth rate of the total bank loans
(ΔLoan). The key explanatory variable is the LagGAP5YR, which is a dummy variable that equals 1 if the average
of GAP5YR over the first three years is below the target set in the five-year plan, and 0 otherwise. Variables are
defined in Appendix Table A.2, and all continuous variables are winsorized at the 1st and 99th percentiles. The
numbers reported in the parentheses are clustered by province. ***, **, and * indicate significant difference at the
1%, 5% and 10% levels separately (two-sided).
Expected
Signs (1) (2)
LagGAP5YR + 0.021* 0.023*
(1.725) (1.918)
ΔGDP + 0.506 0.604**
(1.671) (2.183)
ΔDeposit + 1.017*** 1.038***
(10.369) (9.486)
Branch + -0.016* -0.016**
(-1.976) (-2.169)
SOE + 0.048 0.033
(0.901) (0.677)
Fiscal - -0.213** -0.208**
(-2.761) (-2.672)
Openness + 0.038** 0.037*
(2.200) (1.951)
Industry - -0.000 -0.000
(-0.121) (-0.364)
Age ? 0.002
(1.175)
Age60 - -0.032**
(-2.083)
Tenure ? 0.001
(0.638)
Promotion - -0.009
(-0.701)
Education + 0.005
(0.709)
Experience ? -0.013
(-1.171)
Intercept 0.148 0.055
(1.416) (0.354)
Year Y Y
Obs. 116 116
R-square 0.833 0.834
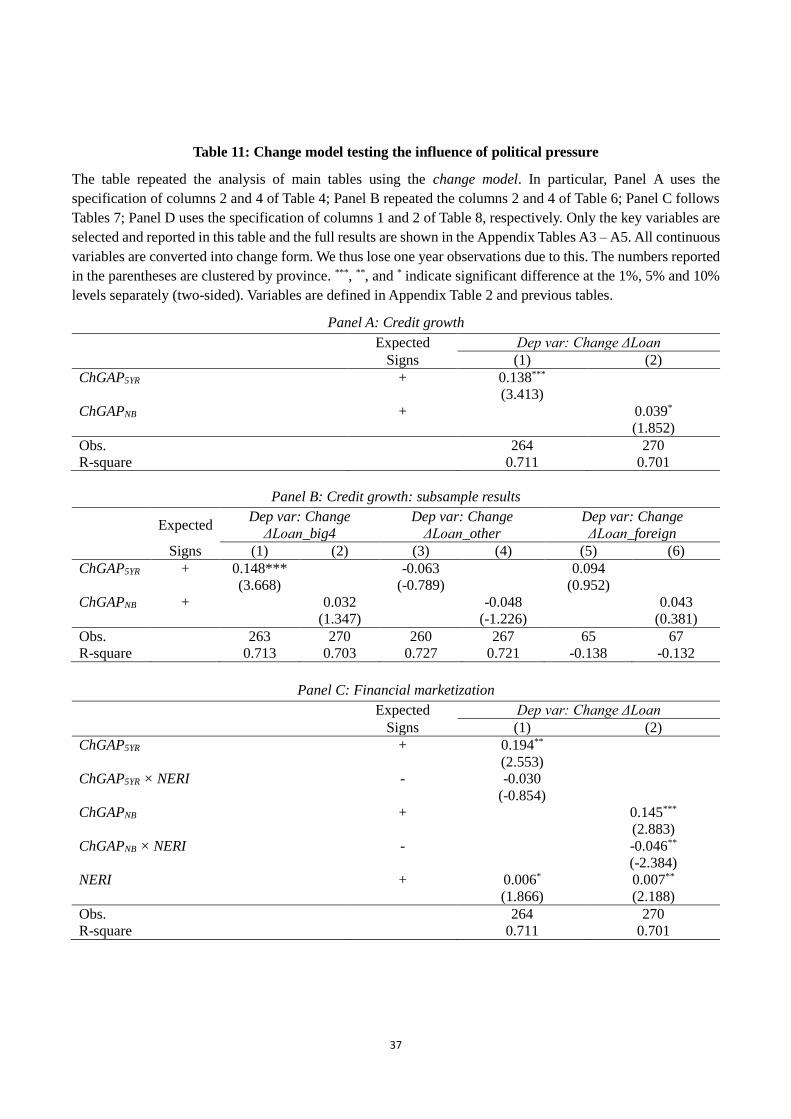
37
Table 11: Change model testing the influence of political pressure
The table repeated the analysis of main tables using the change model. In particular, Panel A uses the
specification of columns 2 and 4 of Table 4; Panel B repeated the columns 2 and 4 of Table 6; Panel C follows
Tables 7; Panel D uses the specification of columns 1 and 2 of Table 8, respectively. Only the key variables are
selected and reported in this table and the full results are shown in the Appendix Tables A3 – A5. All continuous
variables are converted into change form. We thus lose one year observations due to this. The numbers reported
in the parentheses are clustered by province. ***, **, and * indicate significant difference at the 1%, 5% and 10%
levels separately (two-sided). Variables are defined in Appendix Table 2 and previous tables.
Panel A: Credit growth
Expected Dep var: Change ΔLoan
Signs (1) (2)
ChGAP5YR + 0.138***
(3.413)
ChGAPNB + 0.039*
(1.852)
Obs. 264 270
R-square 0.711 0.701
Panel B: Credit growth: subsample results
Expected Dep var: Change
ΔLoan_big4
Dep var: Change
ΔLoan_other
Dep var: Change
ΔLoan_foreign
Signs (1) (2) (3) (4) (5) (6)
ChGAP5YR + 0.148*** -0.063 0.094
(3.668) (-0.789) (0.952)
ChGAPNB + 0.032 -0.048 0.043
(1.347) (-1.226) (0.381)
Obs. 263 270 260 267 65 67
R-square 0.713 0.703 0.727 0.721 -0.138 -0.132
Panel C: Financial marketization
Expected Dep var: Change ΔLoan
Signs (1) (2)
ChGAP5YR + 0.194**
(2.553)
ChGAP5YR × NERI - -0.030
(-0.854)
ChGAPNB + 0.145***
(2.883)
ChGAPNB × NERI - -0.046**
(-2.384)
NERI + 0.006* 0.007**
(1.866) (2.188)
Obs. 264 270
R-square 0.711 0.701

38
Panel D: Provincial profitability
Expected Dep var: Change ΔLoan
Signs (1) (2)
ChGAP5YR + 0.204***
(3.024)
ChGAP5YR × Surplus - -1.337**
(-2.110)
ChGAPNB + 0.077*
(1.738)
ChGAPNB × Surplus - -0.800***
(-3.122)
ChSurplus + -0.169 -0.088
(-1.520) (-0.888)
Obs. 264 270
R-square 0.748 0.739
Panel E: Quality of loans
Expected Dep var: Change NPLoan
Signs (1) (2)
ChGAP5YR + 0.003*
(1.713)
ChGAPNB + 0.001
(0.906)
Obs. 114 120
R-square 0.373 0.368

39
Table A.1: Banking market development by region and year
This table reports the degree of banking market development by province and year. We measure it as the
percentage of bank loans issued to non-state-owned enterprises. Data is from the National Economic Research
Institute (NERI) Index of the Marketization of China’s provinces, which is constructed by Fan et al. (2011).
Province 2002 2003 2004 2005 2006 2007 2008 2009 Average
Eastern regions
Beijing 5.97 5.84 6.25 5.38 6.73 6.99 11.24 10.98 7.42
Tianjin 6.26 6.32 7.46 7.23 5.62 7.35 11.7 11.47 7.93
Hebei 6.12 7.39 8.41 9.18 10.01 10.58 13.26 13.01 9.75
Fujian 8.56 9.54 10.56 10.73 10.59 11.65 13.92 13.90 11.18
Guangdong 9.49 10.36 10.93 11.30 11.18 11.91 13.97 14.04 11.65
Hainan 6.77 9.22 9.76 11.48 10.72 10.98 13.8 13.81 10.82
Jiangsu 8.35 10.00 10.82 11.43 10.96 11.56 13.85 13.74 11.34
Zhejiang 10.59 11.49 11.41 12.22 12.61 13.15 14.65 14.61 12.59
Shandong 6.41 7.43 8.44 10.11 10.04 10.76 13.51 13.41 10.01
Shanghai 8.88 9.76 9.70 9.78 9.92 9.97 12.94 13.02 10.50
Central regions
Anhui 5.30 7.07 7.52 7.83 8.73 9.75 13.22 13.18 9.08
Henan 4.23 5.49 6.90 8.06 8.56 9.07 12.6 12.84 8.47
Hubei 1.30 3.90 4.82 6.00 6.99 7.73 12.16 12.39 6.91
Jiangxi 2.41 4.51 5.85 7.74 8.12 9.03 12.83 12.95 7.93
Shanxi 6.08 6.87 7.52 7.22 9.68 9.61 13.2 12.58 9.10
Hunan 4.02 6.58 7.42 8.56 9.03 9.61 13.29 13.26 8.97
Northeastern regions Liaoning 5.20 5.75 6.78 8.02 8.92 10.23 13.32 13.47 8.96
Jilin 0.77 2.40 3.71 2.69 2.92 5.94 10.83 11.50 5.10
Heilongjiang 0.88 2.92 3.68 4.57 5.08 6.14 10.97 11.51 5.72
Western regions
Inner-Mongolia 3.17 5.05 6.09 7.92 8.25 8.94 12.38 13.06 8.11
Guangxi 4.41 4.90 5.82 8.78 10.08 10.21 13.46 12.92 8.82
Chongqing 6.33 8.31 9.20 9.31 9.91 10.14 12.67 11.88 9.72
Sichuan 6.68 7.89 8.56 8.75 9.22 10.58 4.17 13.14 8.62
Guizhou 2.07 4.53 4.66 5.99 6.57 7.91 11.94 12.31 7.00
Yunnan 3.83 5.39 7.61 8.41 10.07 10.05 13.09 12.87 8.92
Shaanxi 4.62 5.73 7.18 7.92 8.28 7.85 11.78 12.03 8.17
Gansu 2.61 3.57 4.29 4.85 5.57 7.35 11.50 12.28 6.50
Qinghai 5.14 7.37 7.76 10.01 8.62 8.85 12.45 12.76 9.12
Ningxia 4.59 7.39 9.17 10.13 9.46 10.15 12.84 13.11 9.61
Xinjiang 5.17 7.09 7.53 7.19 7.71 7.67 11.79 11.93 8.26

40
Table A.2: Variable definitions
Variable name Notation Definition Main Dep. Variable
Credit growth ΔLoan Annual growth rate of the total bank loans.
Other Dep. Variables
Excessive credit growth ExΔLoan Estimated as ΔLoan over ΔGDP, and then minus 1. ΔGDP is the
annual growth rate of provincial GDP.
Non-perform loans NPLoan The amount of non-perform loans divided by the amount of total
loan.
Indep. Variables
Shortfall of GDP growth to
target growth rates
GAP5YR The target GDP growth rate set in province’s five-year plan divided
by the actual GDP growth rate, and then minus 1.
Shortfall of GDP growth to
neighbour’s growth rate
GAPNB Average GDP growth rate of adjacent provinces divided by the
actual GDP growth rate, and then minus 1.
Control Variables
GDP growth ΔGDP Annual growth rate of GDP.
Deposit growth Deposit Annual growth rate of the total deposits.
No. of bank branches Branch The logarithm of the number of bank branches.
Percent of state-owned
economy
SOE The ratio of revenues from state-owned enterprises to those from
all enterprises in each province.
Fiscal decentralization Fiscal (Local fiscal expenditure per capita/central and local fiscal
expenditure per capita) *[1-(provincial GDP/national GDP)]
Economic openness Openness The sum of exports and imports divided by GDP.
Industry structure Industry The value created by the secondary industry divided by GDP.
Age of provincial leaders Age The age of the provincial committee secretary.
Provincial leaders is 60 or
older
Age60 A dummy variable that equals 1 if the provincial committee
secretary is 60 or older, and 0 otherwise.
Tenure of provincial leaders Tenure The number of years the provincial committee secretary has been
in the post.
Promotion of provincial
leaders
Promotion A dummy variable that equals 1 if the provincial committee
secretary was promoted from inner-provincial governments.
Education background of
provincial leaders
Education The education level of the provincial committee secretary: PhD =
3, Master = 2, Bachelor = 1, and zero otherwise.
Economics expertise of
provincial leaders
Experience A dummy variable that equals 1 if the provincial committee
secretary held a post in provincial or higher levels of the National
Development and Reform Commission, Economic and Trade
Commission, People’s Bank of China, China Securities
Regulatory Commission, China Banking Regulatory
Commission, or China Insurance Regulatory Commission, and 0
otherwise.

41
Table A.3: Change model for credit growth
This table presents regression results on the impact of political pressure on credit growth basing on change
model. The observation unit is province-year. All variables in this table are change form. We loss one year
observations due to get change form. The numbers reported in the parentheses are clustered by province. ***, **,
and * indicate significant difference at the 1%, 5% and 10% levels separately (two-sided).
Expected Dep var: Change ΔLoan
Signs (1) (2) (3) (4)
ChGAP5YR + 0.138*** 0.194**
(3.413) (2.553)
ChGAP5YR × NERI - -0.030
(-0.854)
ChGAPNB + 0.039* 0.145***
(1.852) (2.883)
ChGAPNB × NERI - -0.046**
(-2.384)
NERI + 0.006* 0.007**
(1.866) (2.188)
ChΔGDP ? 0.000 0.001 0.000 0.001
(0.127) (0.287) (0.014) (0.250)
ChΔDeposit + 0.689*** 0.697*** 0.626*** 0.640***
(6.618) (6.761) (5.448) (5.653)
ChBranch + -0.004 -0.005** -0.004* -0.006**
(-1.682) (-2.230) (-1.756) (-2.267)
ChSOE + 0.059 0.051 0.085 0.080
(0.622) (0.570) (0.832) (0.845)
ChFiscal - -0.003 0.010 0.024 0.028
(-0.074) (0.202) (0.512) (0.615)
ChOpenness + 0.000 0.001 -0.004 -0.003
(0.079) (0.177) (-0.748) (-0.485)
ChIndustry - 0.004* 0.004* 0.004 0.004
(1.715) (1.748) (1.462) (1.538)
Age ? 0.001* 0.001 0.002** 0.001
(1.718) (1.306) (2.198) (1.604)
Age60 - -0.011 -0.010 -0.014 -0.012
(-1.247) (-1.136) (-1.627) (-1.330)
Tenure ? 0.000 0.001 0.000 0.001
(0.367) (0.659) (0.351) (0.652)
Promotion - -0.005 -0.007 -0.006 -0.008
(-0.795) (-0.969) (-0.930) (-1.065)
Education + 0.001 0.001 0.002 0.002
(0.422) (0.474) (0.853) (0.803)
Experience ? 0.004 0.005 0.003 0.005
(0.717) (0.892) (0.480) (0.809)
Intercept -0.089** -0.077* -0.102** -0.082*
(-2.132) (-1.730) (-2.370) (-1.739)
Year Y Y Y Y
Obs. 264 264 270 270
R-square 0.711 0.712 0.701 0.704

42
Table A.4: Change model for lending behaviour
This table presents regression results on the impact of political pressure on lending behavior basing on change
model. The observation unit is province-year. All variables in this table are change form. We loss one year
observations due to get change form. The numbers reported in the parentheses are clustered by province. ***, **,
and * indicate significant difference at the 1%, 5% and 10% levels separately (two-sided).
Expected Dep var: Change ΔLoan
Signs (1) (2)
ChGAP5YR + 0.204***
(3.024)
ChGAP5YR × Surplus - -1.337**
(-2.110)
ChGAPNB + 0.077*
(1.738)
ChGAPNB × Surplus - -0.800***
(-3.122)
ChSurplus + -0.169 -0.088
(-1.520) (-0.888)
ChΔGDP + 0.941** 0.358
(2.136) (0.822)
ChΔDeposit + 0.805*** 0.778***
(8.484) (7.856)
ChSOE + 0.095 0.123
(0.973) (1.167)
ChIndustry - 0.003 0.002
(1.267) (0.963)
Intercept -0.069*** -0.074***
(-7.477) (-7.469)
Year Y Y
Obs. 264 270
R-square 0.748 0.739

43
Table A.5: Change model for non-performing loan
This table presents regression results on the impact of political pressure on non-performing loan basing on
change model. The observation unit is province-year. All variables in this table are change form. We loss one
year observations due to get change form. The numbers reported in the parentheses are clustered by province. ***, **, and * indicate significant difference at the 1%, 5% and 10% levels separately (two-sided).
Expected Dep var: Change NPLoan
Signs (1) (2)
ChGAP5YR + 0.003*
(1.713)
ChGAPNB + 0.001
(0.906)
ChΔGDP ? -0.028 -0.017
(-1.318) (-0.865)
ChFiscal ? -0.002 -0.002
(-0.556) (-0.536)
ChIndustry + 0.000 0.000
(0.304) (0.209)
ChM-structure + -0.001*** -0.001***
(-3.443) (-3.797)
Intercept -0.001** -0.001**
(-2.674) (-2.515)
Year Y Y
Obs. 114 120
R-square 0.373 0.368

44
Figure 1: Structure of China’s commercial banks Data source: China Banking Regulatory Commission (2011)