cafr fiscal year ended june 30, 2004 - suisun
TRANSCRIPT
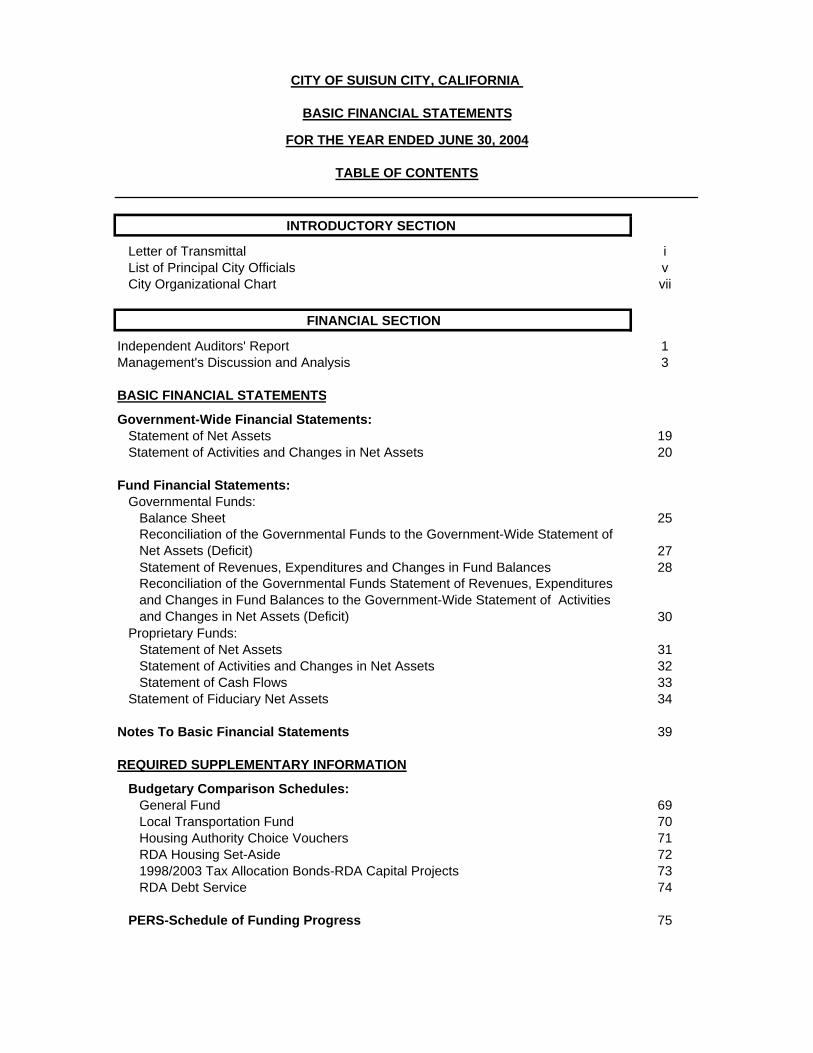
INTRODUCTORY SECTION
Letter of Transmittal iList of Principal City Officials vCity Organizational Chart vii
FINANCIAL SECTION
Independent Auditors' Report 1Management's Discussion and Analysis 3
BASIC FINANCIAL STATEMENTS
Government-Wide Financial Statements: Statement of Net Assets 19Statement of Activities and Changes in Net Assets 20
Fund Financial Statements:Governmental Funds:
Balance Sheet 25Reconciliation of the Governmental Funds to the Government-Wide Statement of Net Assets (Deficit) 27Statement of Revenues, Expenditures and Changes in Fund Balances 28Reconciliation of the Governmental Funds Statement of Revenues, Expenditures and Changes in Fund Balances to the Government-Wide Statement of Activities and Changes in Net Assets (Deficit) 30
Proprietary Funds:Statement of Net Assets 31Statement of Activities and Changes in Net Assets 32Statement of Cash Flows 33
Statement of Fiduciary Net Assets 34
Notes To Basic Financial Statements 39
REQUIRED SUPPLEMENTARY INFORMATION
Budgetary Comparison Schedules:General Fund 69Local Transportation Fund 70Housing Authority Choice Vouchers 71RDA Housing Set-Aside 721998/2003 Tax Allocation Bonds-RDA Capital Projects 73RDA Debt Service 74
PERS-Schedule of Funding Progress 75
CITY OF SUISUN CITY, CALIFORNIA
BASIC FINANCIAL STATEMENTS
FOR THE YEAR ENDED JUNE 30, 2004
TABLE OF CONTENTS
CITY OF SUISUN CITY, CALIFORNIA
BASIC FINANCIAL STATEMENTS
FOR THE YEAR ENDED JUNE 30, 2004
TABLE OF CONTENTS
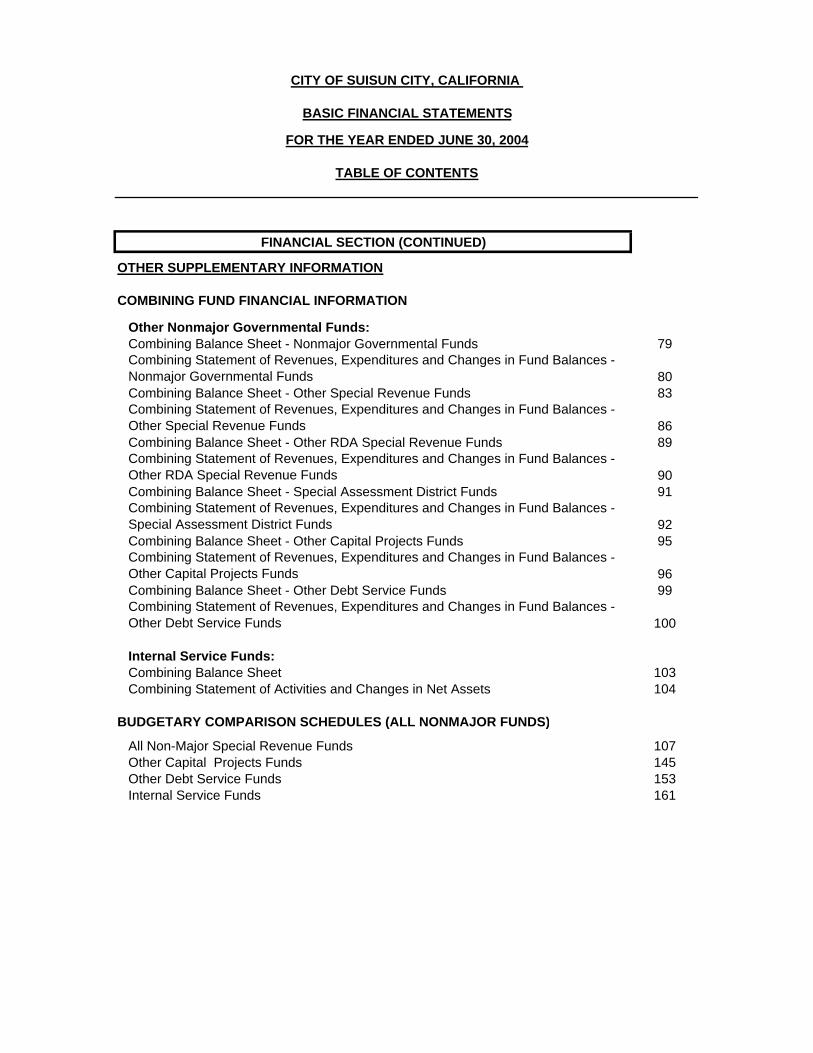
FINANCIAL SECTION (CONTINUED)
OTHER SUPPLEMENTARY INFORMATION
COMBINING FUND FINANCIAL INFORMATION
Other Nonmajor Governmental Funds:Combining Balance Sheet - Nonmajor Governmental Funds 79Combining Statement of Revenues, Expenditures and Changes in Fund Balances - Nonmajor Governmental Funds 80Combining Balance Sheet - Other Special Revenue Funds 83Combining Statement of Revenues, Expenditures and Changes in Fund Balances - Other Special Revenue Funds 86Combining Balance Sheet - Other RDA Special Revenue Funds 89Combining Statement of Revenues, Expenditures and Changes in Fund Balances - Other RDA Special Revenue Funds 90Combining Balance Sheet - Special Assessment District Funds 91Combining Statement of Revenues, Expenditures and Changes in Fund Balances - Special Assessment District Funds 92Combining Balance Sheet - Other Capital Projects Funds 95Combining Statement of Revenues, Expenditures and Changes in Fund Balances - Other Capital Projects Funds 96Combining Balance Sheet - Other Debt Service Funds 99Combining Statement of Revenues, Expenditures and Changes in Fund Balances - Other Debt Service Funds 100
Internal Service Funds: Combining Balance Sheet 103Combining Statement of Activities and Changes in Net Assets 104
BUDGETARY COMPARISON SCHEDULES (ALL NONMAJOR FUNDS)
All Non-Major Special Revenue Funds 107Other Capital Projects Funds 145Other Debt Service Funds 153Internal Service Funds 161
CITY OF SUISUN CITY, CALIFORNIA
BASIC FINANCIAL STATEMENTS
FOR THE YEAR ENDED JUNE 30, 2004
TABLE OF CONTENTS
STATISTICAL SECTION
General Governmental Revenues by Source, Last Ten Fiscal Years 171General Governmental Expenditures by Function, Last Ten Fiscal Years 172
General Governmental Tax Revenues by Source, Last Ten Fiscal Years 173Property Tax Levies and Collections, Last Ten Fiscal Years 174Net Assessed & Estmated Value of Property, Last Ten Fiscal Years 175Property Tax Rates - District and Overlapping Governments, Last Ten Fiscal Years 176Principal Taxpayers 177Ratio of Net General Obligation Bonded Debt to Assessed Value and Net General Obligation Bonded Debt per Capita 178Ratio of Annual Debt Service Expenditures for General Obligation Bonded Debt to Total General Government Expenditures 179Computation of Legal Debt Margin 180Schedule of Direct and Overlapping Debt 181Demographic Statistics, Last Ten Fiscal Years 182Property Value, Construction, and Bank Deposits, Last Ten Fiscal Years 183Special Assessment Billings and Collections, Last Ten Fiscal Years 184Miscellaneous Statistics 185
* * * * * * * * * * * * * * * * * * * * * * * * * * * * * * * * * * * * *


City of Suisun City Management’s Discussion and Analysis
3
This is management’s discussion and analysis of the City of Suisun City’s financial activities and performance for the fiscal year ended June 30, 2004. Please read this in conjunction with the transmittal letter, that can be found in the introductory section at the front of this report, and with the City’s financial statements, which follow this discussion and analysis.
FINANCIAL HIGHLIGHTS Government-Wide Financial Statements • The Government-Wide Statement of Net Assets appearing as the first statement of the
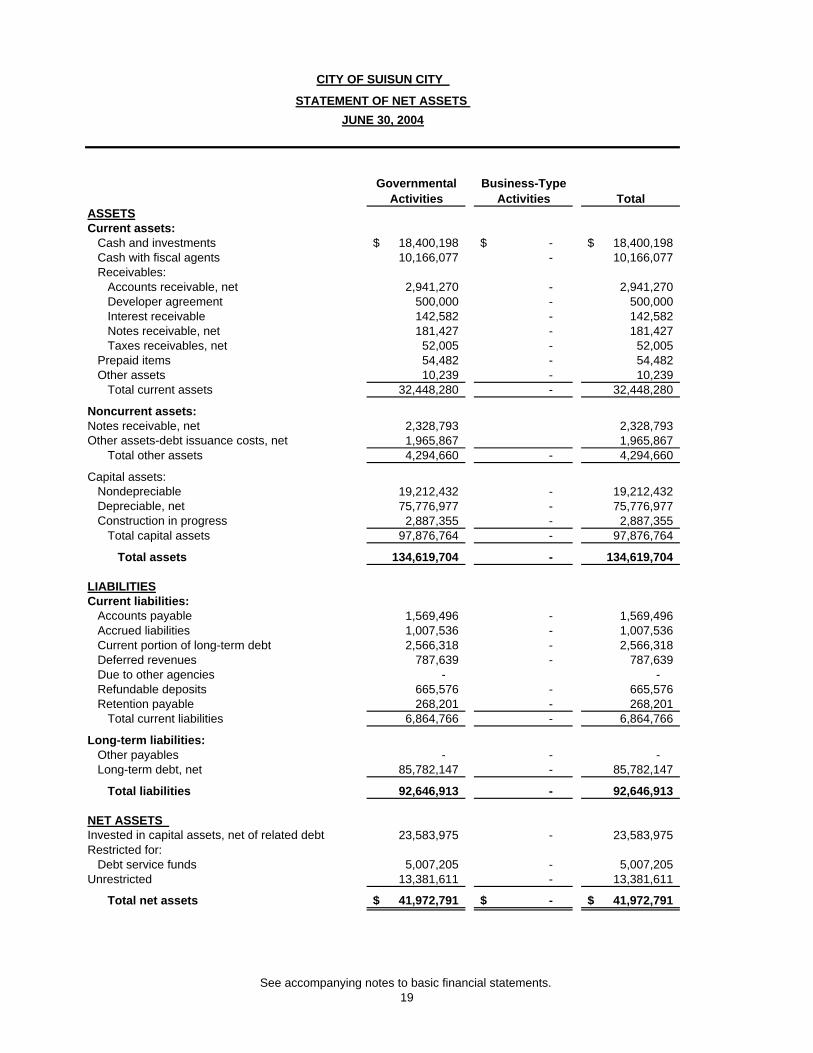
Basic Financial Statements and summarized in this Management Discussion and Analysis, show the City’s assets to be $134.6 million, liabilities of $92.6 million and net assets of $42 million.
• Net assets, as measured in the government-wide financial statements, increased $2.8
million. This increase is primarily attributable to total revenue of $31.4 million, expenditure of $28.7 million and a prior period adjustment of $0.1 million.
• The City’s long-term debt increased by $4,030,966. The increase was primarily due to
the issuance of $43 million in 2003-B Tax Allocation Refunding Bonds used to refund $42.635 million of outstanding 1993 Tax Allocation Bonds and the issuance of $6.39 million in 2003-A Tax Allocation Bonds issued to fund future projects, after payment of the issuance cost. The recording of the accreted interest of $407,164 in the 1998 Capital Appreciation Bond is also part of the increase. The City also approved the sale and refunding of Certificates of Participation (City of Suisun City-Civic Center Project) for the purpose of lowering the interest from 6.44 % to 4.4%, a savings of about a quarter million in interest. Please refer to Note 7, page 49 for details.
• The Government-wide statement of activities and changes in net assets is summarized
on page 20. This statement shows an increase in net assets of $2,711,150 for the fiscal year ended June 30, 2004, as compared to an increase of $ 255,838 for the fiscal year ended June 30, 2003.
Government Funds Financial Statements • As of the close of fiscal year 2004, the City’s governmental funds reported a combined
ending fund balance of $30.6 million, an increase of $8.8 million for the year ending June 30, 2004. The detailed components of Revenues and Expenditures can be found in the accompanying Statement of Revenues, Expenditures and Changes in Fund Balances on page 28. The increase consists mainly of the 2003-Series A bond proceeds of $5.5 million that is designated to Redevelopment Projects; $1.3 million increase in the Housing Set-Aside and $1 million increase in the Redevelopment Debt Service Fund due to property tax collection.
• The core operations of the City are accounted for in the General Fund, and the General
Fund balance is a key measure of the financial health of the City. As of June 30, 2004, the General Fund, fund balance was $2,346,560, a net increase of $29,855 over the balance at June 30, 2003. As of June 30, 2004, the unreserved fund balance for the
City of Suisun City Management’s Discussion and Analysis
4
General Fund was $2,343,785 of which $1,680,828 was designated for stabilization fund and for compensated absences.
• The $6.4 million fund balance in Redevelopment Agency Debt Service Funds includes
$4.5 million in reserves with the trustee for the Tax Allocation Bonds. • The $6.6 million fund balance in 1998/2003 Tax Allocation bonds is designated for
redevelopment projects. • The $6.7 million fund balance in Redevelopment Housing Set Aside Special Revenue
being held for low and moderate-income housing projects Redevelopment Agency. • The $8.2 million fund balance from Non-Major Funds consist mainly of $5.9 million in
Special Revenue Funds, $1.8 million in Capital Projects Funds and $0.5 million in other Debt Service Funds to which details can be found on page 79.
City’s Highlights • WALTERS ROAD WIDENING. The project provides a new full phase traffic signal at the
Walters Road/Peterson Road intersection and extending median and landscaping along Walters Road near Pintail Drive to Bella Vista Drive. The existing signal at Bella Vista Drive was modified and reconstructed to accommodate the revised geometric alignment and the realigned Walters Road. Estimated project cost is $6.8 million and is funded by Federal Grants and Developer contribution.
• JEPSON PARKWAY IMPROVEMENTS. This project mainly consists of constructing and
installing, along Walters Road, an 8-foot wide concrete bike/sidewalk path from State Route 12 to Peterson Ranch, and pavement striping for a Class II Bike Lane and a 10-foot wide concrete bike/sidewalk path from Peterson Road to Bella Vista Drive. The project also entailed construction of a left turn pocket at the intersection of Walters Road and Peterson Road; irrigation and landscaping; sculptural art works and an entrance sign on the median island along Walters Road from Highway 12 to Peterson Road; and signage, pavement markings, median landscaping, benches and drinking fountains. Estimated project cost is $650,000 and is funded by Federal and State Grants.
• MASTER PLAN FOR THE LAWLER RANCH PARK SITE. The City has completed the
Master Plan for the 10-acre Lawler Ranch Park Site. City staff and public stakeholders were included in the review of the design, constraints of available maintenance funds, and concepts for the park. Construction documents (improvement plans, cost estimates and specifications) are anticipated to be completed within the first quarter of 2005 calendar year, and the construction of the park will begin in the summer of 2005 and will be completed in the fall of 2005.
• CENTRAL COUNTY BIKEWAY GAP CLOSURE. The City has secured more than $1.1
million dollars in grant funding for the Central County Bikeway Gap Closure. This project will provide a segregated, 10-foot wide paved multi-use recreational bike and pedestrian trail along the north side of State Route 12 from Marina Boulevard to the Amtrak Train Station/City modal terminal. This bike and pedestrian trail segment is an extension of the existing Central County Bikeway, and it is to fill the final gap in the Central County Bikeway.
City of Suisun City Management’s Discussion and Analysis
5
• DOWNTOWN BLIGHT REMOVAL. The Redevelopment Agency is now looking at abandoned and dangerous building structures in downtown Suisun. The Agency will help improve these buildings to increase the volume of business in downtown Suisun.
• LIGHTHOUSE CONSTRUCTION. The Suisun City Advisory Council on May 19, 2004,
recommended that the Redevelopment Agency commence work immediately on the proposed lighthouse element of the Main Street West plan. The proposed lighthouse would serve as an important and dramatic icon for the downtown and waterfront area. The current working cost estimate for construction of the lighthouse is $514,000.
OVERVIEW OF THE FINANCIAL STATEMENTS This discussion and analysis is intended to serve as an introduction to the City’s financial statements. The City’s financial statements consist of three components: 1) government-wide financial statements, 2) fund financial statements, and 3) notes to the basic financial statements. This report also contains other supplementary information in addition to the basic financial statements themselves. Government-wide Financial Statements The government-wide financial statements consist of a Statement of Net Assets and a Statement of Activities and Changes in Net Assets. These statements are designed to provide readers with a broad overview of the City’s finances, in a manner similar to a private-sector business. They provide information about the activities of the City as a whole and present a longer-term view of the City’s finances. The Statement of Net Assets presents information on all of the City’s assets and liabilities, with the difference between the two reported as net assets. Over time, increases or decreases in net assets may serve as a useful indicator of whether the financial position of the City is improving or deteriorating. The Statement of Activities and Changes in Net Assets presents information showing how the City’s net assets changed during the most recent fiscal year. All changes in net assets are reported as soon as the underlying event giving rise to the change occurs, regardless of the timing of related cash flows. Thus, revenues and expenses may be reported in this statement for some items that will only result in cash flows in future fiscal periods, such as revenues related to uncollected taxes and interest expense incurred but not paid. Fund Financial Statements A fund is a grouping of related accounts that is used to maintain control over resources that have been segregated for specific activities or objectives. The City, like other governmental entities, uses fund accounting to ensure and demonstrate compliance with finance-related legal requirements. Funds of governmental entities can be divided into three categories: governmental funds, proprietary funds, and fiduciary funds. Governmental funds Governmental funds are used to account for essentially the same functions reported as governmental activities in the government-wide financial statements. However, unlike the
City of Suisun City Management’s Discussion and Analysis
6
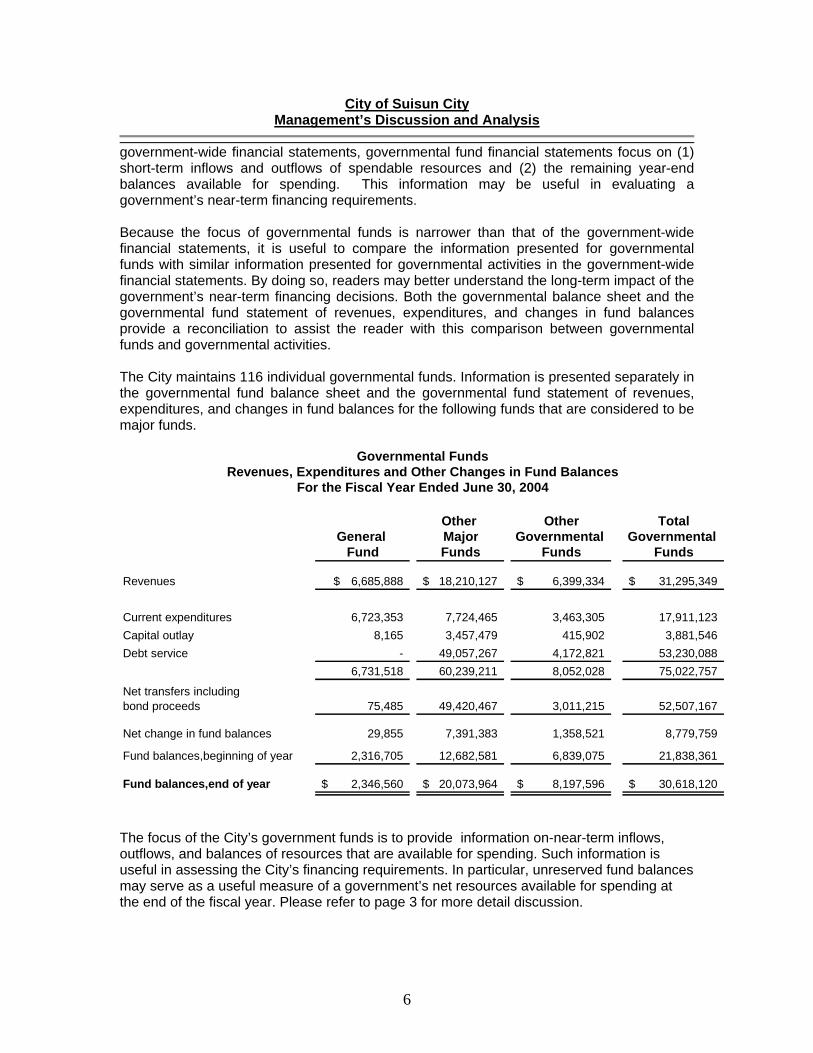
government-wide financial statements, governmental fund financial statements focus on (1) short-term inflows and outflows of spendable resources and (2) the remaining year-end balances available for spending. This information may be useful in evaluating a government’s near-term financing requirements. Because the focus of governmental funds is narrower than that of the government-wide financial statements, it is useful to compare the information presented for governmental funds with similar information presented for governmental activities in the government-wide financial statements. By doing so, readers may better understand the long-term impact of the government’s near-term financing decisions. Both the governmental balance sheet and the governmental fund statement of revenues, expenditures, and changes in fund balances provide a reconciliation to assist the reader with this comparison between governmental funds and governmental activities. The City maintains 116 individual governmental funds. Information is presented separately in the governmental fund balance sheet and the governmental fund statement of revenues, expenditures, and changes in fund balances for the following funds that are considered to be major funds.
Other Other TotalGeneral Major Governmental Governmental
Fund Funds Funds Funds
Revenues 6,685,888$ 18,210,127$ 6,399,334$ 31,295,349$
Current expenditures 6,723,353 7,724,465 3,463,305 17,911,123 Capital outlay 8,165 3,457,479 415,902 3,881,546 Debt service - 49,057,267 4,172,821 53,230,088
6,731,518 60,239,211 8,052,028 75,022,757
Net transfers including bond proceeds 75,485 49,420,467 3,011,215 52,507,167
Net change in fund balances 29,855 7,391,383 1,358,521 8,779,759
Fund balances,beginning of year 2,316,705 12,682,581 6,839,075 21,838,361
Fund balances,end of year 2,346,560$ 20,073,964$ 8,197,596$ 30,618,120$
Governmental FundsRevenues, Expenditures and Other Changes in Fund Balances
For the Fiscal Year Ended June 30, 2004
The focus of the City’s government funds is to provide information on-near-term inflows, outflows, and balances of resources that are available for spending. Such information is useful in assessing the City’s financing requirements. In particular, unreserved fund balances may serve as a useful measure of a government’s net resources available for spending at the end of the fiscal year. Please refer to page 3 for more detail discussion.
City of Suisun City Management’s Discussion and Analysis
7
Proprietary funds Proprietary funds generally account for services for which customer fees are intended to finance the costs of operations. The City has no proprietary funds. Fiduciary funds Fiduciary funds are used to account for resources held for the benefit of parties outside the government. Fiduciary funds are not reflected in the government-wide financial statements because those resources are not available to support the City’s own programs. Accordingly, only assets and liabilities are reported for these funds. The major fiduciary fund maintained by the City is the Suisun-Solano Water Agency Fund. The net assets of this fund totaled $12,151,134 as of June 30, 2004. Please refer to page 34 for details. Notes to the Financial Statements The notes provide additional information that is essential to a full understanding of the data provided in the government-wide and fund financial statements. The notes to the financial statements follow the basic financial statements. Required Supplementary Information In addition to the basic financial statements and accompanying notes, this report also presents certain required supplementary information other than this discussion and analysis concerning the City’s budgetary comparison schedules and PERS schedule of funding progress. Other supplementary Information Budgetary comparison schedule of all non-major funds. Statistical Section Presentations of financial information and non-financial information , and statistical tables for the last ten years are included in this section, as an aid to understanding and evaluating the overall operation and status of the City.
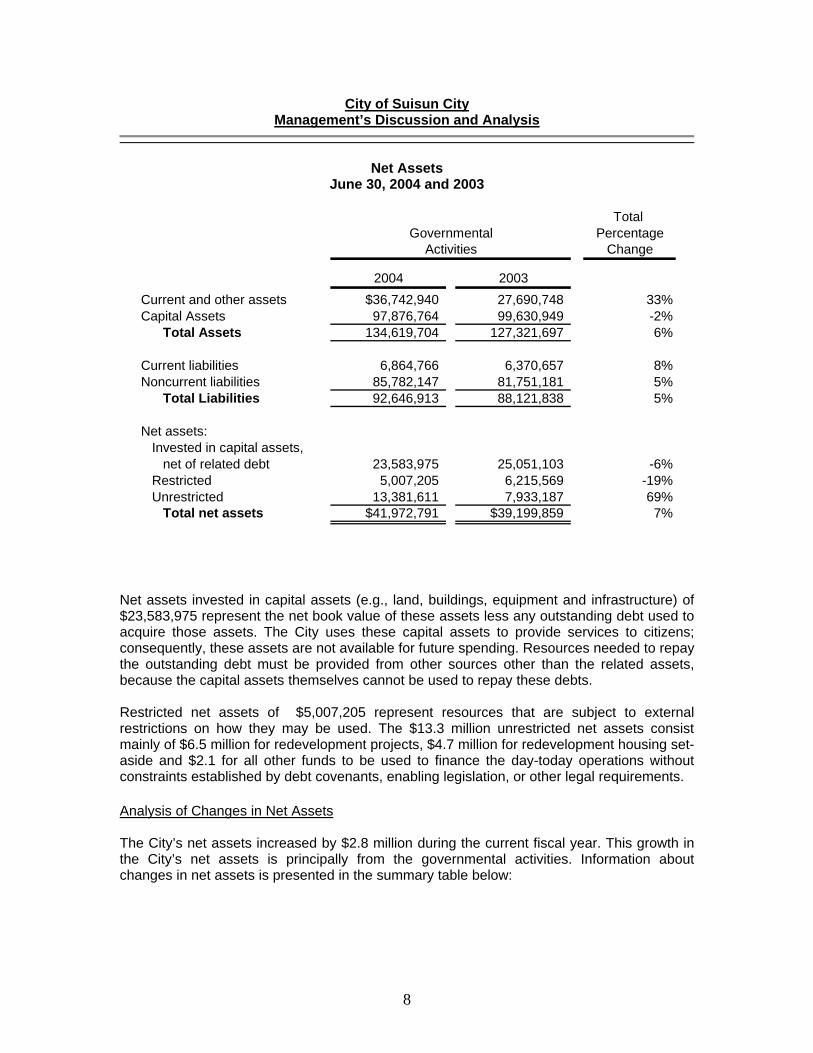
GOVERNMENT-WIDE FINANCIAL ANALYSIS Analysis of Net Assets Net assets are a measure of a government’s financial position and, over time, a trend of increasing or decreasing net assets is an indicator of the financial health of the organization. The City of Suisun’s net assets, exceeded liabilities by $41,972,791. A schedule of net assets is presented in the following table.
City of Suisun City Management’s Discussion and Analysis
8
Net Assets
June 30, 2004 and 2003
Total Percentage
Change
2004 2003Current and other assets $36,742,940 27,690,748 33%Capital Assets 97,876,764 99,630,949 -2%
Total Assets 134,619,704 127,321,697 6%
Current liabilities 6,864,766 6,370,657 8%Noncurrent liabilities 85,782,147 81,751,181 5%
Total Liabilities 92,646,913 88,121,838 5%
Net assets:Invested in capital assets,
net of related debt 23,583,975 25,051,103 -6%Restricted 5,007,205 6,215,569 -19%Unrestricted 13,381,611 7,933,187 69%
Total net assets $41,972,791 $39,199,859 7%
GovernmentalActivities
Net assets invested in capital assets (e.g., land, buildings, equipment and infrastructure) of $23,583,975 represent the net book value of these assets less any outstanding debt used to acquire those assets. The City uses these capital assets to provide services to citizens; consequently, these assets are not available for future spending. Resources needed to repay the outstanding debt must be provided from other sources other than the related assets, because the capital assets themselves cannot be used to repay these debts. Restricted net assets of $5,007,205 represent resources that are subject to external restrictions on how they may be used. The $13.3 million unrestricted net assets consist mainly of $6.5 million for redevelopment projects, $4.7 million for redevelopment housing set-aside and $2.1 for all other funds to be used to finance the day-today operations without constraints established by debt covenants, enabling legislation, or other legal requirements. Analysis of Changes in Net Assets The City’s net assets increased by $2.8 million during the current fiscal year. This growth in the City’s net assets is principally from the governmental activities. Information about changes in net assets is presented in the summary table below:
City of Suisun City Management’s Discussion and Analysis
9
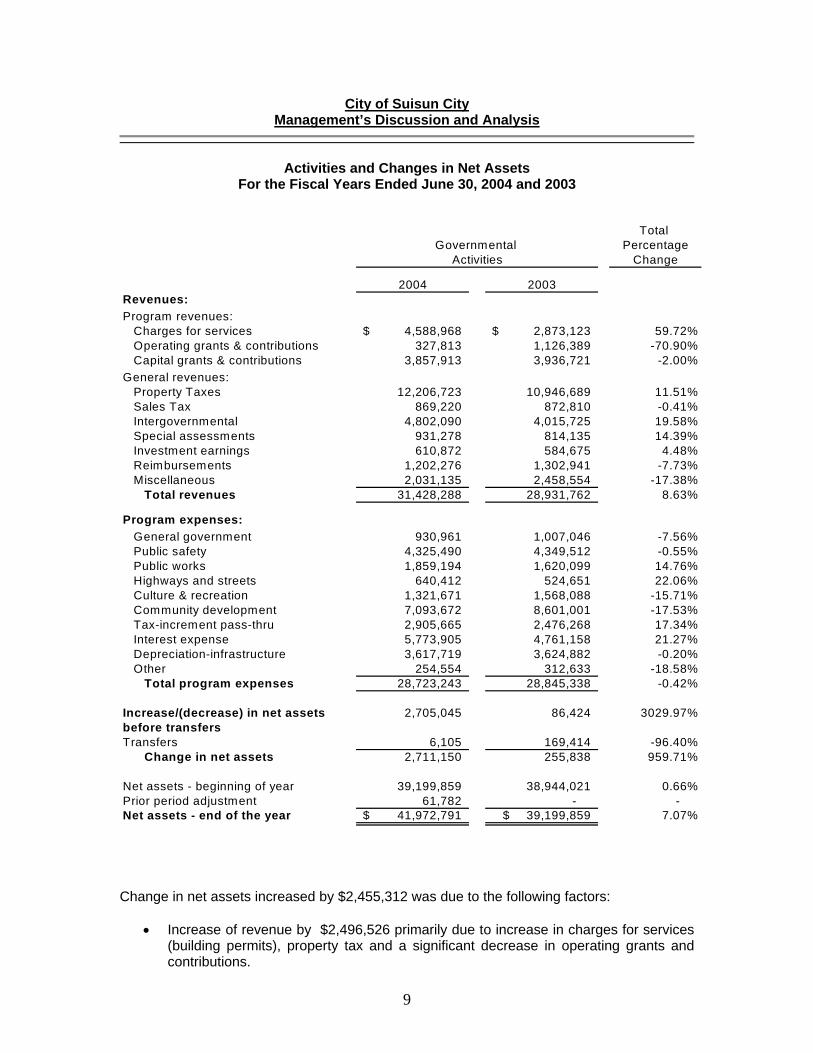
Activities and Changes in Net Assets
For the Fiscal Years Ended June 30, 2004 and 2003
Total Percentage
Change
2004 2003Revenues:Program revenues:
Charges for services 4,588,968$ 2,873,123$ 59.72%Operating grants & contributions 327,813 1,126,389 -70.90%Capital grants & contributions 3,857,913 3,936,721 -2.00%
General revenues:Property Taxes 12,206,723 10,946,689 11.51%Sales Tax 869,220 872,810 -0.41%Intergovernmental 4,802,090 4,015,725 19.58%Special assessments 931,278 814,135 14.39%Investment earnings 610,872 584,675 4.48%Reimbursements 1,202,276 1,302,941 -7.73%Miscellaneous 2,031,135 2,458,554 -17.38%
Total revenues 31,428,288 28,931,762 8.63%
Program expenses:General government 930,961 1,007,046 -7.56%Public safety 4,325,490 4,349,512 -0.55%Public works 1,859,194 1,620,099 14.76%Highways and streets 640,412 524,651 22.06%Culture & recreation 1,321,671 1,568,088 -15.71%Community development 7,093,672 8,601,001 -17.53%Tax-increment pass-thru 2,905,665 2,476,268 17.34%Interest expense 5,773,905 4,761,158 21.27%Depreciation-infrastructure 3,617,719 3,624,882 -0.20%Other 254,554 312,633 -18.58%
Total program expenses 28,723,243 28,845,338 -0.42%
Increase/(decrease) in net assets 2,705,045 86,424 3029.97%before transfersTransfers 6,105 169,414 -96.40%
Change in net assets 2,711,150 255,838 959.71%
Net assets - beginning of year 39,199,859 38,944,021 0.66%Prior period adjustment 61,782 - - Net assets - end of the year 41,972,791$ 39,199,859$ 7.07%
Governmental Activities
Change in net assets increased by $2,455,312 was due to the following factors:
• Increase of revenue by $2,496,526 primarily due to increase in charges for services (building permits), property tax and a significant decrease in operating grants and contributions.
City of Suisun City Management’s Discussion and Analysis
10
• Increase of expenditure including transfers by $41,214 was a net increase of all program expenditures as illustrated above.
Note: Certain reclassification of expenditure have been made in capital grants and contribution and in intergovernmental revenue for fiscal year 2002-2003 to conform with fiscal year 2003-2004 presentation. The change did not affect the net assets as of June 30, 2003.
ANALYSIS OF MAJOR GOVERNMENTAL FUNDS
General Fund General fund revenues of $6.6 million, a decrease of $0.2 million from previous fiscal year resulting from $423,769 decrease in intergovernmental revenue and an increase of about $200,000 in other revenue sources. General fund expenditures of $6.7 million, an increase of $22,695 from previous fiscal year. The minimal increase was a result of tight spending of all the departments. Net transfers in were $75,485 and consisted primarily of $284,503 transfers in from Unemployment Reserve, Worker’s Comp Reserve, Traffic towing & Building Safety Fees and transfers out of $209,019 consisting primarily of Public Safety and Recreation. The General Fund balance at fiscal year-end was $2.3 million consisting of restricted $2,775, designated $1,680,828 and $662,957 that were undesignated. Local Transportation Fund The Local Transportation Fund accounts for federal, state and local funds used for streets, pedestrian and bikeway improvements. Revenues including transfer in were $3.5 million and expenditures of $3.4 million were made for infrastructure. Housing Authority Choice Vouchers The Housing Authority Choice Voucher Fund accounts for the Section 8 Rental Assistance Voucher Program, which is a federally funded program providing rental assistance to low-income households residing in privately owned housing. Total revenue is $3.2 million and expenditures is $3.1million.Fund balance as of June 30, 2004 consist of $37,468 designated for office equipment and $209,682 undesignated . RDA-Housing Set-Aside – Special Revenue Fund This fund is used to account for the 20% tax increment revenue set-aside monies required by law to be used only for low and moderate-income housing. Expenditures of $658,698 included $90,138 for projects, $175,571 for administration cost and $392,989 of operation cost at Almond Garden apartment complex. 1998/2003 Tax Allocation Bonds – Capital Projects Fund This fund is used to account for the bond proceeds used for capital projects. Expenditures of $658,698 consist mainly of $592,000 for Delta Cove, $13,475 for Driftwood Drive, $9,000 for Community Center, $4,732 for Hotel Site, $17,602 for Theater Plaza and $21,889 in other
City of Suisun City Management’s Discussion and Analysis
11
projects. Fund balance as of June 30, 2004 available for redevelopment projects is $6,542,555. RDA Bonds Debt Service Fund This is the principal debt service fund of the redevelopment agency, and is used to account primarily for the payment of debt service on long-term debt obligations. For this fiscal year, the Redevelopment Agency refunded the 1993 Tax Allocation Bonds, proceeds was solely used to redeem the 1993 Bond. The Redevelopment Agency also issued $6,390,000 tax allocation bonds to finance redevelopment projects. The bonds are secured by a pledge of all incremental tax revenues to be received by the Agency and funds held by the trustee. As of June 30, 2004, fund balance of $6,428,422 consist of $4,530,838 cash reserves with trustee and $1,897,584 undesignated fund. Analysis of All Governmental Funds The following schedule presents a summary of general, special revenue, debt service and capital projects fund revenues for the fiscal year ended June 30, 2004 and the amount and percentage of increases and decreases in relation to prior year revenues.
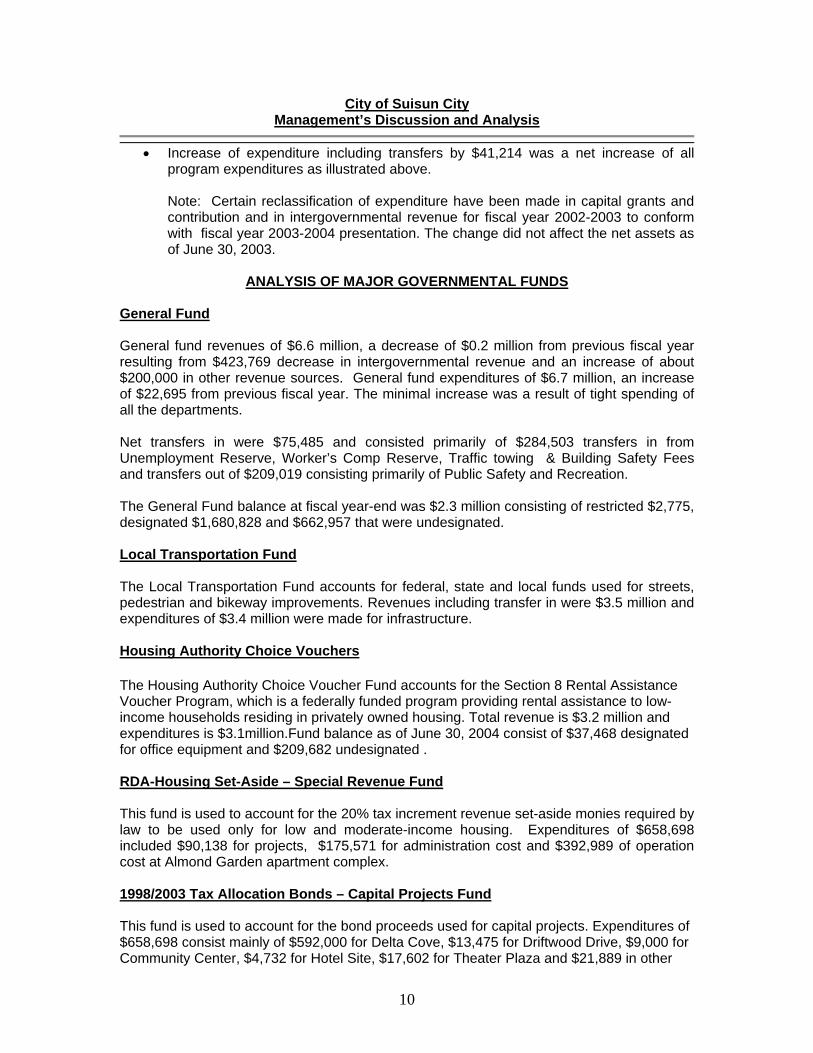
Revenue by Source- Governmental Activities
charges for services
4%
others 23%
licenses & permits 4%
operating grants & contributions
27%
sales tax 3%
property tax 39%
While about 39 percent of total revenues are derived from property taxes, 89 percent of these property taxes revenue goes to the Redevelopment Agency. About 27 percent of the City’s general governmental revenues are realized from other governmental agencies and in 2004 included:
State of California Motor Vehicle-in-lieu allocations $ 1,192,917 State of California Gas Tax 519,335 Federal HUD Section 8 Housing Assistance Program 2,573,684 Federal & State Public Safety Grants 293,042 TDA-Pass through Transportation Commission 3,003,989 Metropolitan Transportation Commission 326,232 All Other Intergovernmental Allocations 574,066 Total $ 8,483,265
City of Suisun City Management’s Discussion and Analysis
12
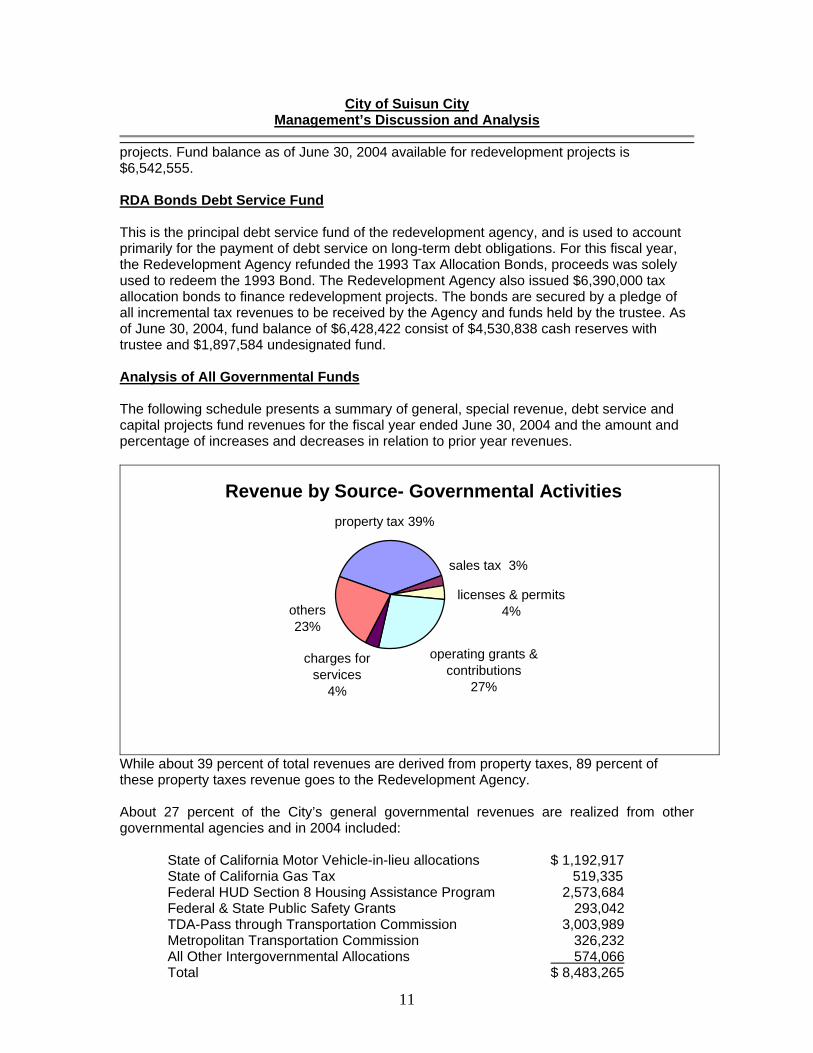
% of IncreaseRevenues 2004 2003 (Decrease)
Property Taxes 12,206,723 10,946,689 11.5%Sales Tax 869,220 872,810 -0.4%License & Permits 1,229,456 1,009,731 21.8%Fines & Forfeitures 130,013 116,658 11.4%Investment Earnings 610,872 584,675 4.5%Intergovernmental 8,483,265 8,416,554 0.8%Charges for Services 1,312,337 908,578 44.4%Special Assessments 931,278 814,135 14.4%Developer Fees 2,421,713 1,500,437 61.4%Reimbursements 1,202,276 1,302,941 -7.7%Miscellaneous 1,898,196 2,438,596 -22.2%
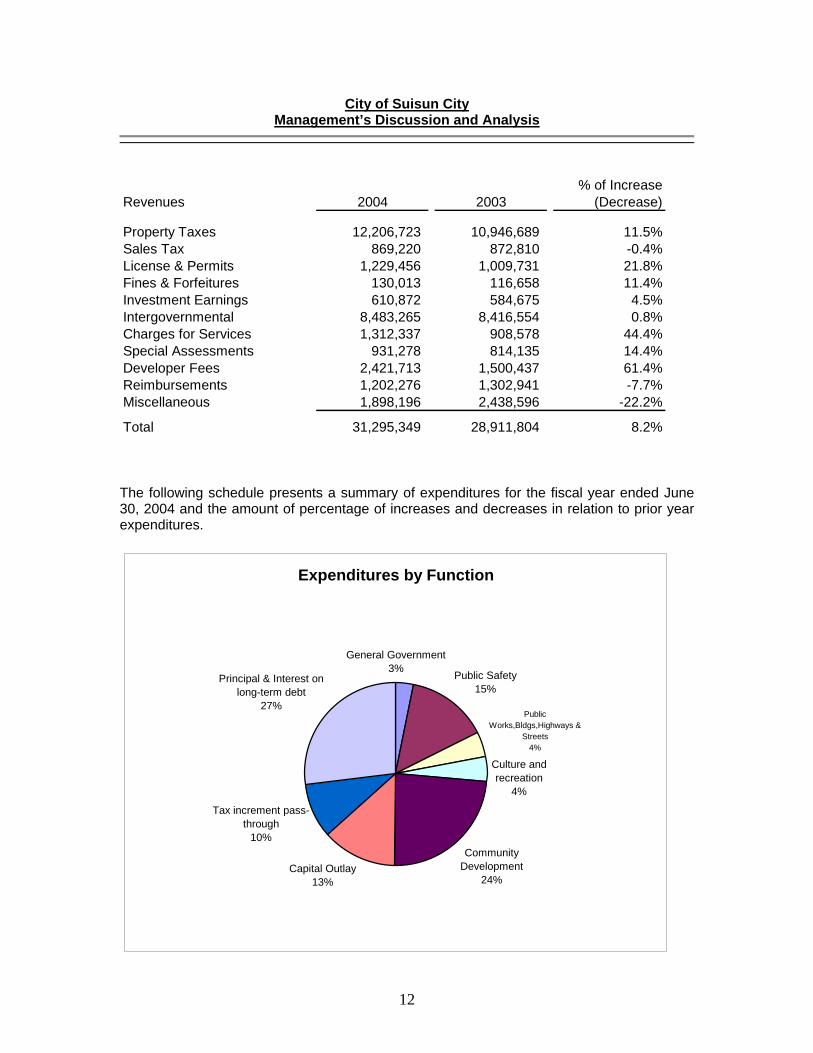
Total 31,295,349 28,911,804 8.2% The following schedule presents a summary of expenditures for the fiscal year ended June 30, 2004 and the amount of percentage of increases and decreases in relation to prior year expenditures.
Expenditures by Function
Principal & Interest on long-term debt
27%
Tax increment pass-through
10%
Capital Outlay13%
Community Development
24%
General Government3%
Public Works,Bldgs,Highways &
Streets4%
Culture and recreation
4%
Public Safety15%
City of Suisun City Management’s Discussion and Analysis
13
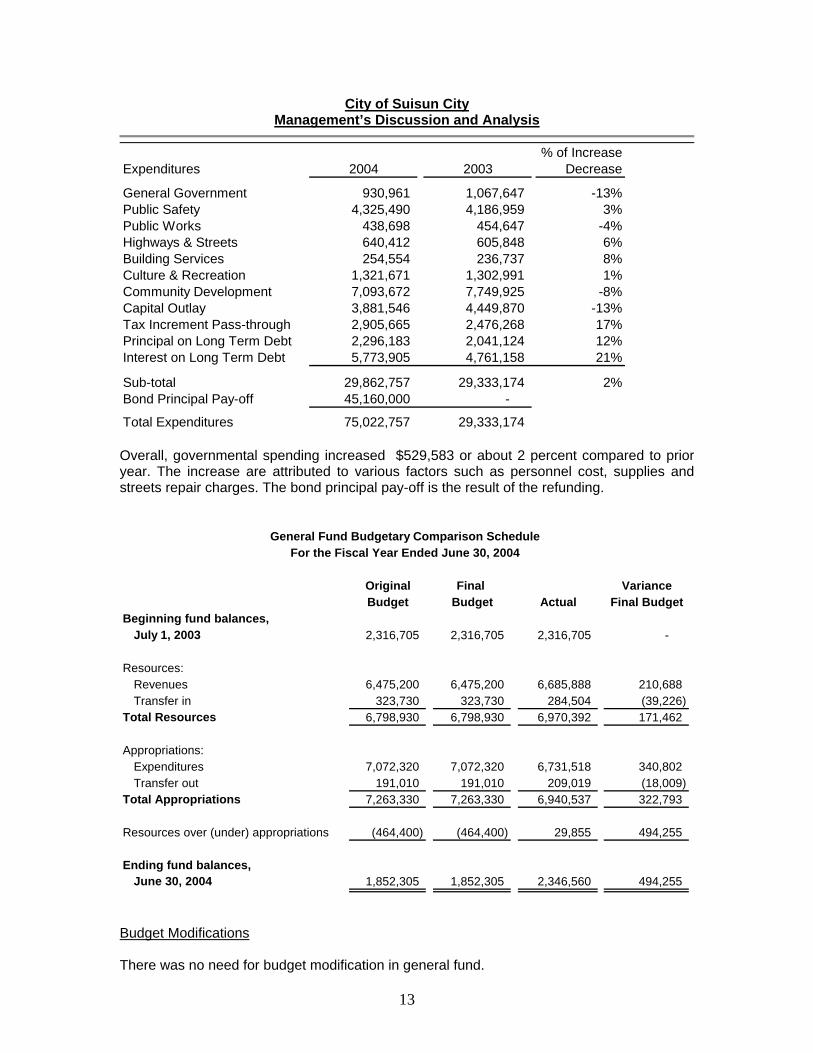
% of IncreaseExpenditures 2004 2003 Decrease
General Government 930,961 1,067,647 -13%Public Safety 4,325,490 4,186,959 3%Public Works 438,698 454,647 -4%Highways & Streets 640,412 605,848 6%Building Services 254,554 236,737 8%Culture & Recreation 1,321,671 1,302,991 1%Community Development 7,093,672 7,749,925 -8%Capital Outlay 3,881,546 4,449,870 -13%Tax Increment Pass-through 2,905,665 2,476,268 17%Principal on Long Term Debt 2,296,183 2,041,124 12%Interest on Long Term Debt 5,773,905 4,761,158 21%
Sub-total 29,862,757 29,333,174 2%Bond Principal Pay-off 45,160,000 -
Total Expenditures 75,022,757 29,333,174 Overall, governmental spending increased $529,583 or about 2 percent compared to prior year. The increase are attributed to various factors such as personnel cost, supplies and streets repair charges. The bond principal pay-off is the result of the refunding.
Original Final VarianceBudget Budget Actual Final Budget
Beginning fund balances,July 1, 2003 2,316,705 2,316,705 2,316,705 -
Resources:Revenues 6,475,200 6,475,200 6,685,888 210,688 Transfer in 323,730 323,730 284,504 (39,226)
Total Resources 6,798,930 6,798,930 6,970,392 171,462
Appropriations:Expenditures 7,072,320 7,072,320 6,731,518 340,802 Transfer out 191,010 191,010 209,019 (18,009)
Total Appropriations 7,263,330 7,263,330 6,940,537 322,793
Resources over (under) appropriations (464,400) (464,400) 29,855 494,255
Ending fund balances,June 30, 2004 1,852,305 1,852,305 2,346,560 494,255
General Fund Budgetary Comparison ScheduleFor the Fiscal Year Ended June 30, 2004
Budget Modifications There was no need for budget modification in general fund.
City of Suisun City Management’s Discussion and Analysis
14
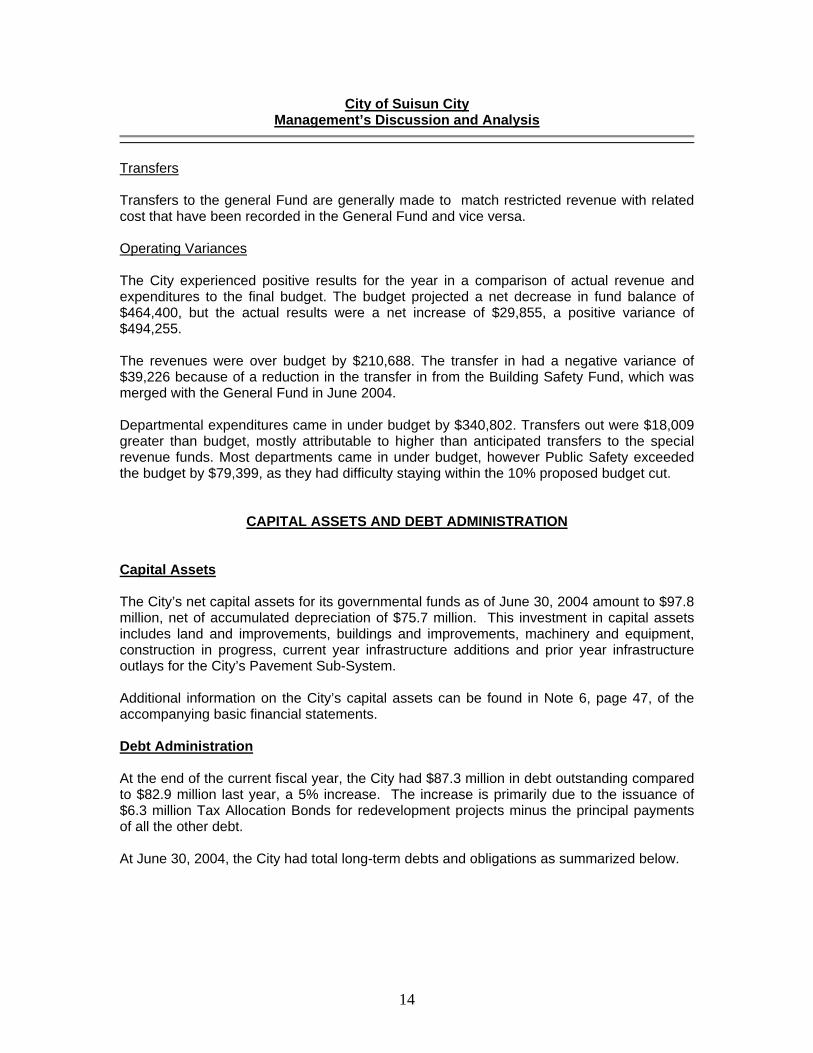
Transfers Transfers to the general Fund are generally made to match restricted revenue with related cost that have been recorded in the General Fund and vice versa. Operating Variances The City experienced positive results for the year in a comparison of actual revenue and expenditures to the final budget. The budget projected a net decrease in fund balance of $464,400, but the actual results were a net increase of $29,855, a positive variance of $494,255. The revenues were over budget by $210,688. The transfer in had a negative variance of $39,226 because of a reduction in the transfer in from the Building Safety Fund, which was merged with the General Fund in June 2004. Departmental expenditures came in under budget by $340,802. Transfers out were $18,009 greater than budget, mostly attributable to higher than anticipated transfers to the special revenue funds. Most departments came in under budget, however Public Safety exceeded the budget by $79,399, as they had difficulty staying within the 10% proposed budget cut.
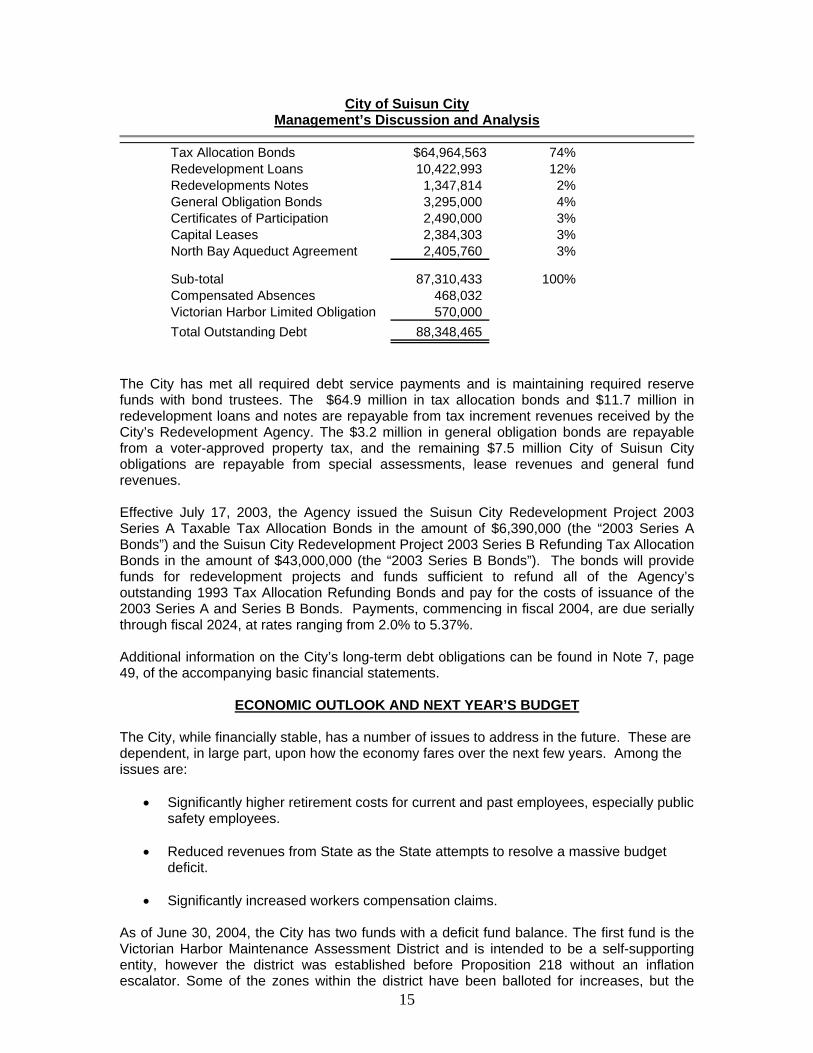
CAPITAL ASSETS AND DEBT ADMINISTRATION Capital Assets The City’s net capital assets for its governmental funds as of June 30, 2004 amount to $97.8 million, net of accumulated depreciation of $75.7 million. This investment in capital assets includes land and improvements, buildings and improvements, machinery and equipment, construction in progress, current year infrastructure additions and prior year infrastructure outlays for the City’s Pavement Sub-System. Additional information on the City’s capital assets can be found in Note 6, page 47, of the accompanying basic financial statements. Debt Administration At the end of the current fiscal year, the City had $87.3 million in debt outstanding compared to $82.9 million last year, a 5% increase. The increase is primarily due to the issuance of $6.3 million Tax Allocation Bonds for redevelopment projects minus the principal payments of all the other debt. At June 30, 2004, the City had total long-term debts and obligations as summarized below.
City of Suisun City Management’s Discussion and Analysis
15
Tax Allocation Bonds $64,964,563 74%Redevelopment Loans 10,422,993 12%Redevelopments Notes 1,347,814 2%General Obligation Bonds 3,295,000 4%Certificates of Participation 2,490,000 3%Capital Leases 2,384,303 3%North Bay Aqueduct Agreement 2,405,760 3%
Sub-total 87,310,433 100%Compensated Absences 468,032 Victorian Harbor Limited Obligation 570,000 Total Outstanding Debt 88,348,465
The City has met all required debt service payments and is maintaining required reserve funds with bond trustees. The $64.9 million in tax allocation bonds and $11.7 million in redevelopment loans and notes are repayable from tax increment revenues received by the City’s Redevelopment Agency. The $3.2 million in general obligation bonds are repayable from a voter-approved property tax, and the remaining $7.5 million City of Suisun City obligations are repayable from special assessments, lease revenues and general fund revenues. Effective July 17, 2003, the Agency issued the Suisun City Redevelopment Project 2003 Series A Taxable Tax Allocation Bonds in the amount of $6,390,000 (the “2003 Series A Bonds”) and the Suisun City Redevelopment Project 2003 Series B Refunding Tax Allocation Bonds in the amount of $43,000,000 (the “2003 Series B Bonds”). The bonds will provide funds for redevelopment projects and funds sufficient to refund all of the Agency’s outstanding 1993 Tax Allocation Refunding Bonds and pay for the costs of issuance of the 2003 Series A and Series B Bonds. Payments, commencing in fiscal 2004, are due serially through fiscal 2024, at rates ranging from 2.0% to 5.37%. Additional information on the City’s long-term debt obligations can be found in Note 7, page 49, of the accompanying basic financial statements.
ECONOMIC OUTLOOK AND NEXT YEAR’S BUDGET The City, while financially stable, has a number of issues to address in the future. These are dependent, in large part, upon how the economy fares over the next few years. Among the issues are:
• Significantly higher retirement costs for current and past employees, especially public safety employees.
• Reduced revenues from State as the State attempts to resolve a massive budget
deficit.
• Significantly increased workers compensation claims. As of June 30, 2004, the City has two funds with a deficit fund balance. The first fund is the Victorian Harbor Maintenance Assessment District and is intended to be a self-supporting entity, however the district was established before Proposition 218 without an inflation escalator. Some of the zones within the district have been balloted for increases, but the
City of Suisun City Management’s Discussion and Analysis
16
commercial zone where most of the costs are incurred has not. The City plans to ballot for an increase to cover this deficit fund balance. The second is the YMCA Construction Fund. This fund was set up to remodel and expand an existing City building in order to lease it to YMCA and provide recreational programs. Currently, the YMCA is paying a lease amount sufficient to cover the debt service on the facility. Once the principal is paid off, the building will be leased and the negative fund balance will be covered. The Fiscal year 2004-2005 Budget includes a number of changes designed to meet the on-going fiscal challenges from economic conditions .A hiring freeze has been placed on most General Fund positions, the Sheriff's office has been contracted with to handle graveyard patrol, positions have been transferred to other funds and each department identified costs savings or revenue increase to lower their department's support from the General Fund. The City will continue to look for opportunities to reduce costs and/or increase revenues to address these fiscal challenges.
REQUESTS FOR INFORMATION This financial report is designed to provide our citizens, taxpayers, creditors and government regulators with a general overview of the City’s finances and to demonstrate the City’s accountability for the money it receives. Below is the contact address for questions about this report or requests for additional financial information.
City of Suisun City Finance Department
701 Civic Center Blvd. Suisun City, Ca. 94585
Ph: 707-421-7320
Governmental Activities
Business-Type Activities Total
ASSETSCurrent assets:
Cash and investments 18,400,198$ -$ 18,400,198$ Cash with fiscal agents 10,166,077 - 10,166,077 Receivables:
Accounts receivable, net 2,941,270 - 2,941,270 Developer agreement 500,000 - 500,000 Interest receivable 142,582 - 142,582 Notes receivable, net 181,427 - 181,427 Taxes receivables, net 52,005 - 52,005
Prepaid items 54,482 - 54,482 Other assets 10,239 - 10,239
Total current assets 32,448,280 - 32,448,280
Noncurrent assets:Notes receivable, net 2,328,793 2,328,793 Other assets-debt issuance costs, net 1,965,867 1,965,867
Total other assets 4,294,660 - 4,294,660
Capital assets:Nondepreciable 19,212,432 - 19,212,432 Depreciable, net 75,776,977 - 75,776,977 Construction in progress 2,887,355 - 2,887,355
Total capital assets 97,876,764 - 97,876,764
Total assets 134,619,704 - 134,619,704
LIABILITIESCurrent liabilities:
Accounts payable 1,569,496 - 1,569,496 Accrued liabilities 1,007,536 - 1,007,536 Current portion of long-term debt 2,566,318 - 2,566,318 Deferred revenues 787,639 - 787,639 Due to other agencies - - Refundable deposits 665,576 - 665,576 Retention payable 268,201 - 268,201
Total current liabilities 6,864,766 - 6,864,766
Long-term liabilities: Other payables - - - Long-term debt, net 85,782,147 - 85,782,147
Total liabilities 92,646,913 - 92,646,913
NET ASSETS Invested in capital assets, net of related debt 23,583,975 - 23,583,975 Restricted for:
Debt service funds 5,007,205 - 5,007,205 Unrestricted 13,381,611 - 13,381,611
Total net assets 41,972,791$ -$ 41,972,791$
CITY OF SUISUN CITY
STATEMENT OF NET ASSETS JUNE 30, 2004
See accompanying notes to basic financial statements.
19
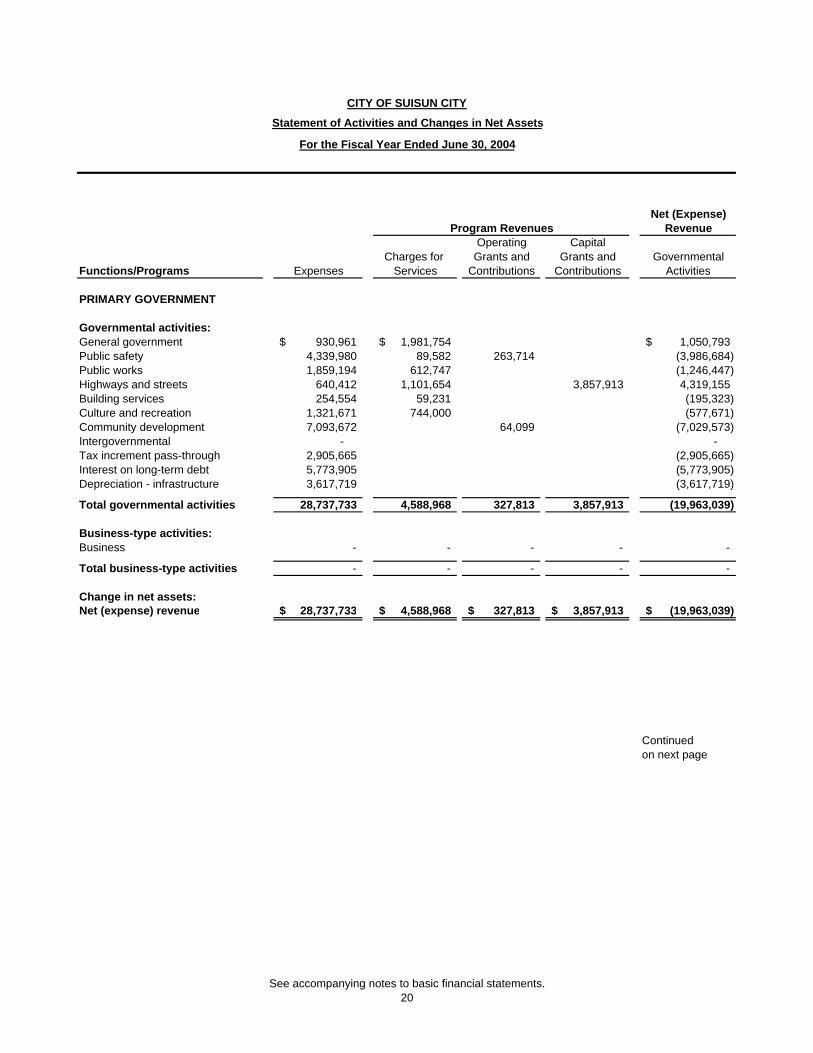
Net (Expense)
RevenueOperating Capital
Charges for Grants and Grants and GovernmentalFunctions/Programs Expenses Services Contributions Contributions Activities
PRIMARY GOVERNMENT
Governmental activities:General government 930,961$ 1,981,754$ 1,050,793$ Public safety 4,339,980 89,582 263,714 (3,986,684) Public works 1,859,194 612,747 (1,246,447) Highways and streets 640,412 1,101,654 3,857,913 4,319,155 Building services 254,554 59,231 (195,323) Culture and recreation 1,321,671 744,000 (577,671) Community development 7,093,672 64,099 (7,029,573) Intergovernmental - - Tax increment pass-through 2,905,665 (2,905,665) Interest on long-term debt 5,773,905 (5,773,905) Depreciation - infrastructure 3,617,719 (3,617,719)
Total governmental activities 28,737,733 4,588,968 327,813 3,857,913 (19,963,039)
Business-type activities:Business - - - - -
Total business-type activities - - - - -
Change in net assets:Net (expense) revenue 28,737,733$ 4,588,968$ 327,813$ 3,857,913$ (19,963,039)$
Continuedon next page
Program Revenues
CITY OF SUISUN CITY
Statement of Activities and Changes in Net Assets
For the Fiscal Year Ended June 30, 2004
See accompanying notes to basic financial statements.
20
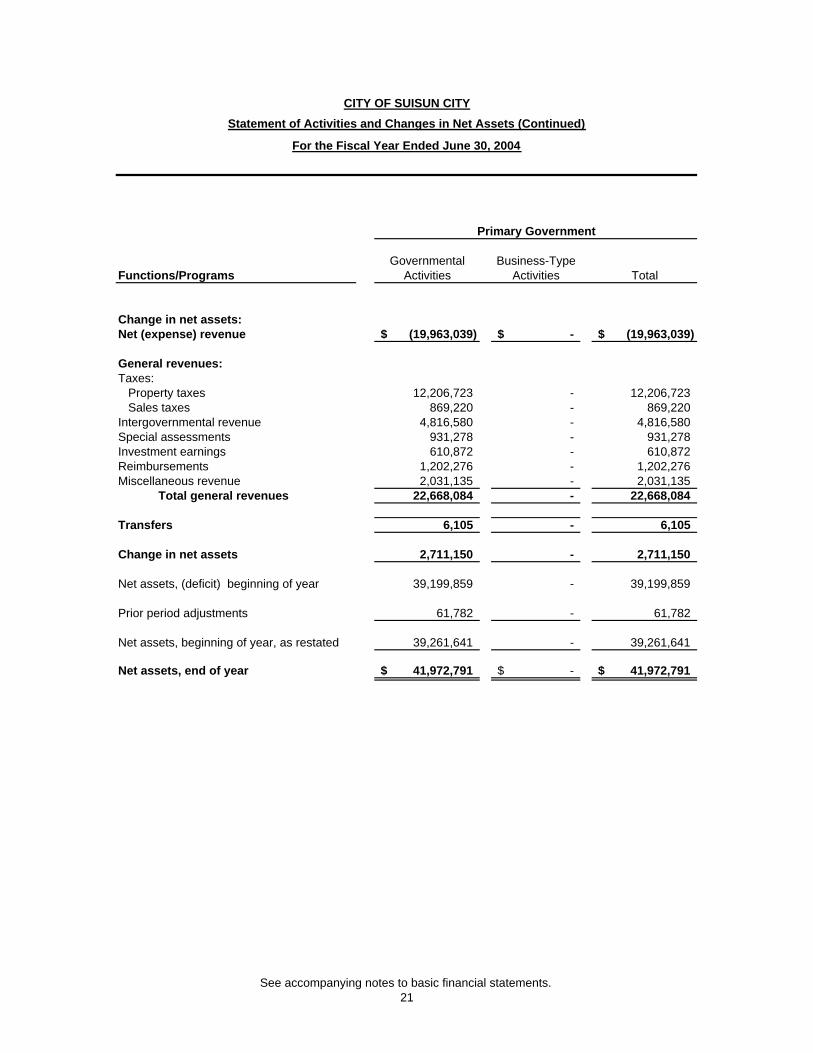
Governmental Business-TypeFunctions/Programs Activities Activities Total
Change in net assets:Net (expense) revenue (19,963,039)$ -$ (19,963,039)$
General revenues:Taxes:
Property taxes 12,206,723 - 12,206,723 Sales taxes 869,220 - 869,220
Intergovernmental revenue 4,816,580 - 4,816,580 Special assessments 931,278 - 931,278 Investment earnings 610,872 - 610,872 Reimbursements 1,202,276 - 1,202,276 Miscellaneous revenue 2,031,135 - 2,031,135
Total general revenues 22,668,084 - 22,668,084
Transfers 6,105 - 6,105
Change in net assets 2,711,150 - 2,711,150
Net assets, (deficit) beginning of year 39,199,859 - 39,199,859
Prior period adjustments 61,782 - 61,782
Net assets, beginning of year, as restated 39,261,641 - 39,261,641
Net assets, end of year 41,972,791$ -$ 41,972,791$
Primary Government
CITY OF SUISUN CITYStatement of Activities and Changes in Net Assets (Continued)
For the Fiscal Year Ended June 30, 2004
See accompanying notes to basic financial statements.
21
Non-Major Funds
Housing RDA-Housing 1998/2003 Tax Authority Set-Aside Allocation RDA Bonds
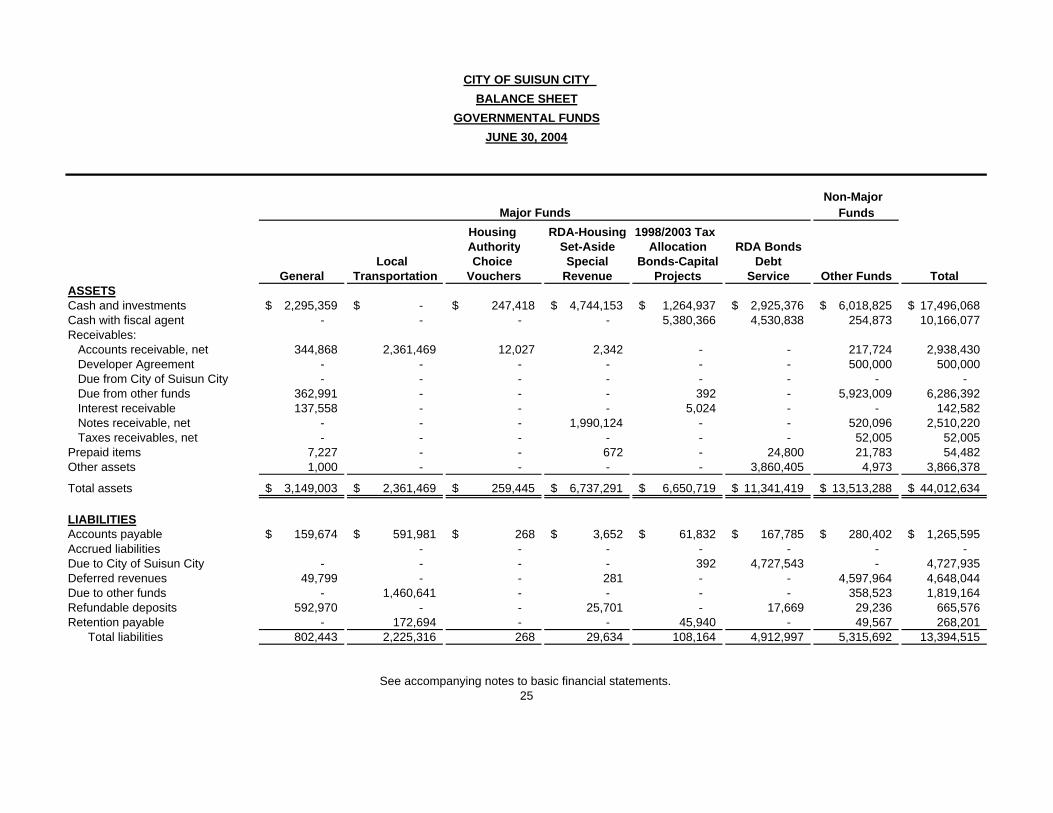
Local Choice Special Bonds-Capital Debt General Transportation Vouchers Revenue Projects Service Other Funds Total ASSETSCash and investments 2,295,359$ -$ 247,418$ 4,744,153$ 1,264,937$ 2,925,376$ 6,018,825$ 17,496,068$ Cash with fiscal agent - - - - 5,380,366 4,530,838 254,873 10,166,077 Receivables:
Accounts receivable, net 344,868 2,361,469 12,027 2,342 - - 217,724 2,938,430 Developer Agreement - - - - - - 500,000 500,000 Due from City of Suisun City - - - - - - - - Due from other funds 362,991 - - - 392 - 5,923,009 6,286,392 Interest receivable 137,558 - - - 5,024 - - 142,582 Notes receivable, net - - - 1,990,124 - - 520,096 2,510,220 Taxes receivables, net - - - - - - 52,005 52,005
Prepaid items 7,227 - - 672 - 24,800 21,783 54,482 Other assets 1,000 - - - - 3,860,405 4,973 3,866,378
Total assets 3,149,003$ 2,361,469$ 259,445$ 6,737,291$ 6,650,719$ 11,341,419$ 13,513,288$ 44,012,634$
LIABILITIESAccounts payable 159,674$ 591,981$ 268$ 3,652$ 61,832$ 167,785$ 280,402$ 1,265,595$ Accrued liabilities - - - - - - - Due to City of Suisun City - - - - 392 4,727,543 - 4,727,935 Deferred revenues 49,799 - - 281 - - 4,597,964 4,648,044 Due to other funds - 1,460,641 - - - - 358,523 1,819,164 Refundable deposits 592,970 - - 25,701 - 17,669 29,236 665,576 Retention payable - 172,694 - - 45,940 - 49,567 268,201
Total liabilities 802,443 2,225,316 268 29,634 108,164 4,912,997 5,315,692 13,394,515
25See accompanying notes to basic financial statements.
Major Funds
CITY OF SUISUN CITY BALANCE SHEET
GOVERNMENTAL FUNDSJUNE 30, 2004
Non-Major Funds
Housing RDA-Housing 1998/2003 Tax Authority Set-Aside Allocation RDA Bonds
Local Choice Special Bonds-Capital Debt General Transportation Vouchers Revenue Projects Service Other Funds Total
Major Funds
CITY OF SUISUN CITY BALANCE SHEET
GOVERNMENTAL FUNDSJUNE 30, 2004
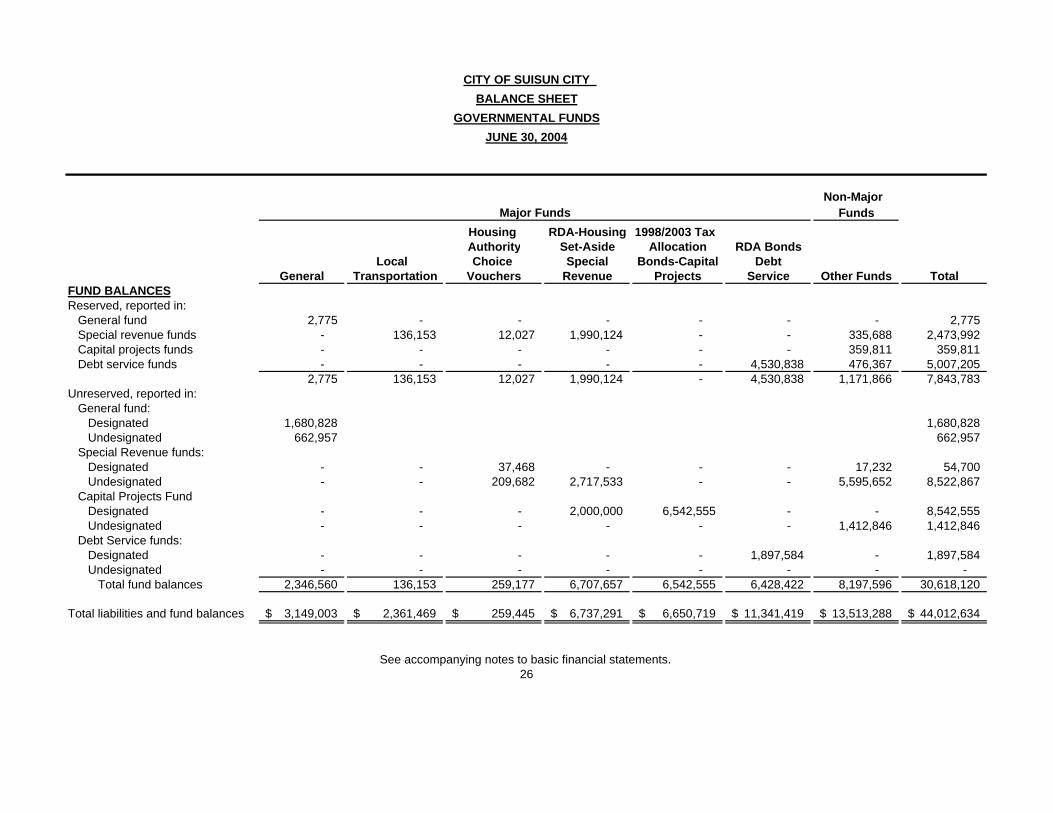
FUND BALANCESReserved, reported in:
General fund 2,775 - - - - - - 2,775 Special revenue funds - 136,153 12,027 1,990,124 - - 335,688 2,473,992 Capital projects funds - - - - - - 359,811 359,811 Debt service funds - - - - - 4,530,838 476,367 5,007,205
2,775 136,153 12,027 1,990,124 - 4,530,838 1,171,866 7,843,783 Unreserved, reported in:
General fund:Designated 1,680,828 1,680,828 Undesignated 662,957 662,957
Special Revenue funds: Designated - - 37,468 - - - 17,232 54,700 Undesignated - - 209,682 2,717,533 - - 5,595,652 8,522,867
Capital Projects Fund Designated - - - 2,000,000 6,542,555 - - 8,542,555 Undesignated - - - - - - 1,412,846 1,412,846
Debt Service funds: Designated - - - - - 1,897,584 - 1,897,584 Undesignated - - - - - - - -
Total fund balances 2,346,560 136,153 259,177 6,707,657 6,542,555 6,428,422 8,197,596 30,618,120
Total liabilities and fund balances 3,149,003$ 2,361,469$ 259,445$ 6,737,291$ 6,650,719$ 11,341,419$ 13,513,288$ 44,012,634$
26See accompanying notes to basic financial statements.
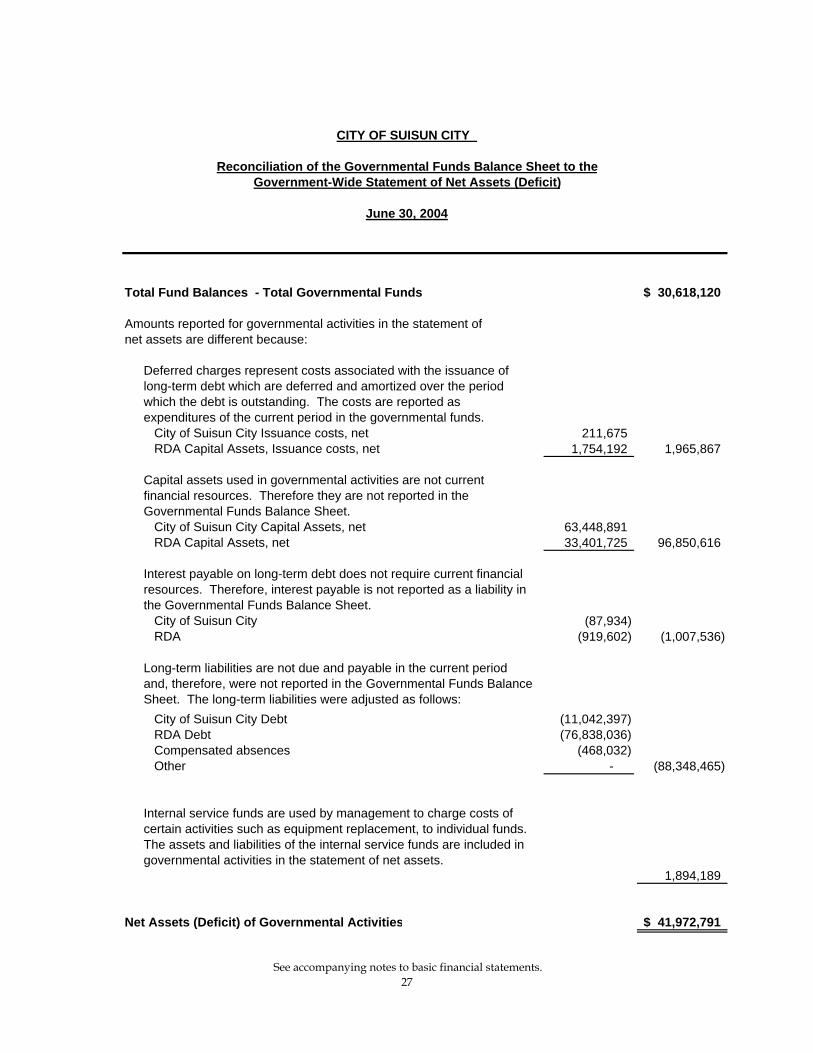
Total Fund Balances - Total Governmental Funds 30,618,120$
Amounts reported for governmental activities in the statement ofnet assets are different because:
Deferred charges represent costs associated with the issuance of long-term debt which are deferred and amortized over the period which the debt is outstanding. The costs are reported as expenditures of the current period in the governmental funds.
City of Suisun City Issuance costs, net 211,675 RDA Capital Assets, Issuance costs, net 1,754,192 1,965,867
Capital assets used in governmental activities are not current financial resources. Therefore they are not reported in the Governmental Funds Balance Sheet.
City of Suisun City Capital Assets, net 63,448,891 RDA Capital Assets, net 33,401,725 96,850,616
Interest payable on long-term debt does not require current financial resources. Therefore, interest payable is not reported as a liability in the Governmental Funds Balance Sheet.
City of Suisun City (87,934) RDA (919,602) (1,007,536)
Long-term liabilities are not due and payable in the current period and, therefore, were not reported in the Governmental Funds Balance Sheet. The long-term liabilities were adjusted as follows:
City of Suisun City Debt (11,042,397)RDA Debt (76,838,036)Compensated absences (468,032)Other - (88,348,465)
Internal service funds are used by management to charge costs of certain activities such as equipment replacement, to individual funds. The assets and liabilities of the internal service funds are included in governmental activities in the statement of net assets.
1,894,189
Net Assets (Deficit) of Governmental Activities 41,972,791$
CITY OF SUISUN CITY
Reconciliation of the Governmental Funds Balance Sheet to theGovernment-Wide Statement of Net Assets (Deficit)
June 30, 2004
See accompanying notes to basic financial statements.27
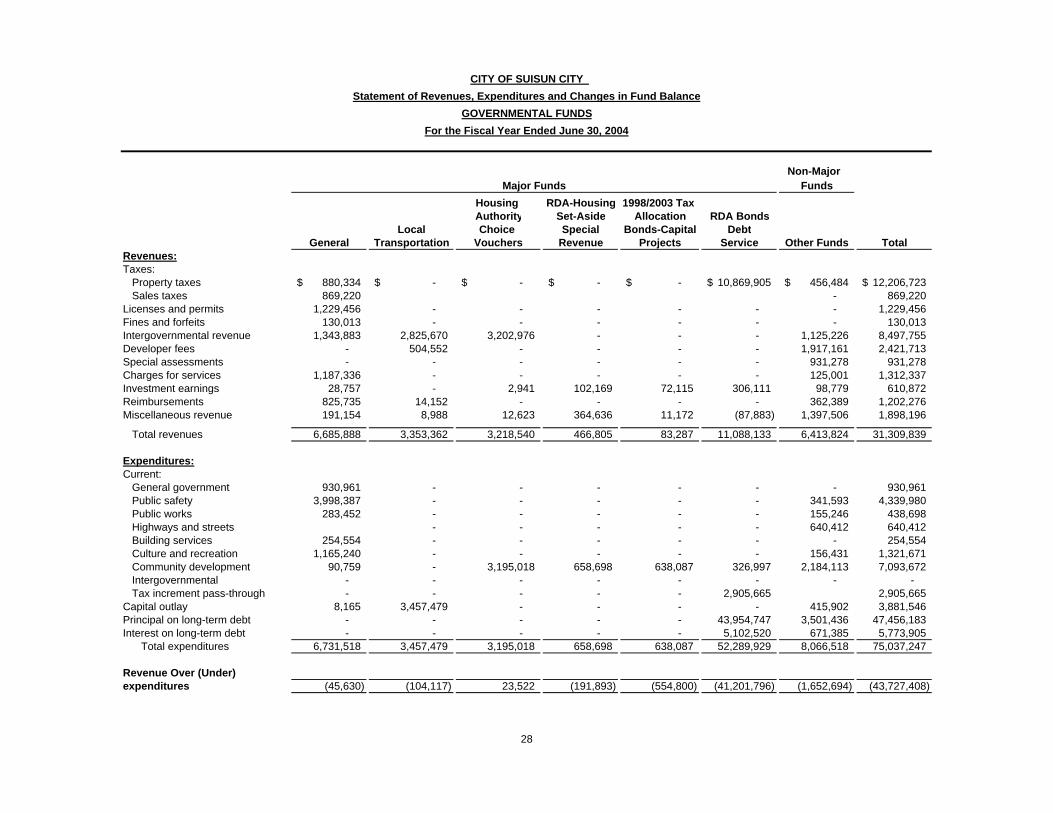
Non-Major Funds
Housing RDA-Housing 1998/2003 TaxAuthority Set-Aside Allocation RDA Bonds
Local Choice Special Bonds-Capital Debt General Transportation Vouchers Revenue Projects Service Other Funds Total Revenues:Taxes:
Property taxes 880,334$ -$ -$ -$ -$ 10,869,905$ 456,484$ 12,206,723$ Sales taxes 869,220 - 869,220
Licenses and permits 1,229,456 - - - - - - 1,229,456 Fines and forfeits 130,013 - - - - - - 130,013 Intergovernmental revenue 1,343,883 2,825,670 3,202,976 - - - 1,125,226 8,497,755 Developer fees - 504,552 - - - - 1,917,161 2,421,713 Special assessments - - - - - - 931,278 931,278 Charges for services 1,187,336 - - - - - 125,001 1,312,337 Investment earnings 28,757 - 2,941 102,169 72,115 306,111 98,779 610,872 Reimbursements 825,735 14,152 - - - - 362,389 1,202,276 Miscellaneous revenue 191,154 8,988 12,623 364,636 11,172 (87,883) 1,397,506 1,898,196
Total revenues 6,685,888 3,353,362 3,218,540 466,805 83,287 11,088,133 6,413,824 31,309,839
Expenditures:Current:
General government 930,961 - - - - - - 930,961 Public safety 3,998,387 - - - - - 341,593 4,339,980 Public works 283,452 - - - - - 155,246 438,698 Highways and streets - - - - - 640,412 640,412 Building services 254,554 - - - - - - 254,554 Culture and recreation 1,165,240 - - - - - 156,431 1,321,671 Community development 90,759 - 3,195,018 658,698 638,087 326,997 2,184,113 7,093,672 Intergovernmental - - - - - - - - Tax increment pass-through - - - - - 2,905,665 2,905,665
Capital outlay 8,165 3,457,479 - - - - 415,902 3,881,546 Principal on long-term debt - - - - - 43,954,747 3,501,436 47,456,183 Interest on long-term debt - - - - - 5,102,520 671,385 5,773,905
Total expenditures 6,731,518 3,457,479 3,195,018 658,698 638,087 52,289,929 8,066,518 75,037,247
Revenue Over (Under)expenditures (45,630) (104,117) 23,522 (191,893) (554,800) (41,201,796) (1,652,694) (43,727,408)
28
Major Funds
CITY OF SUISUN CITY Statement of Revenues, Expenditures and Changes in Fund Balance
GOVERNMENTAL FUNDSFor the Fiscal Year Ended June 30, 2004
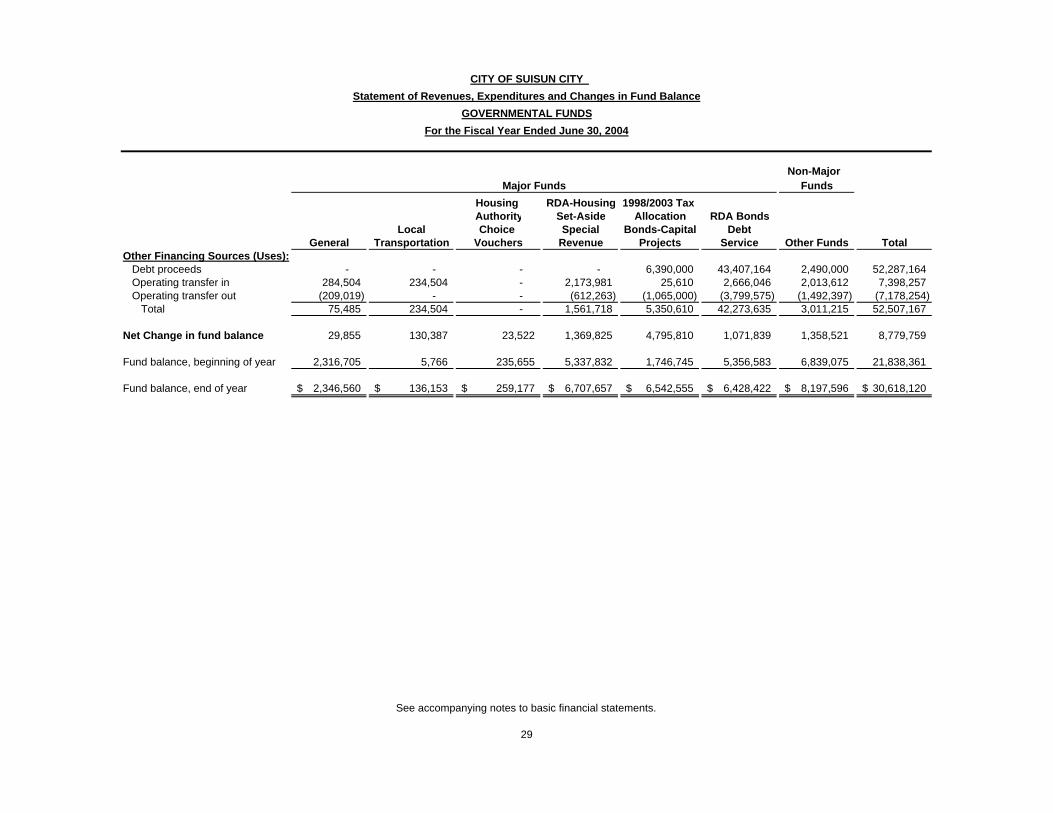
Non-Major Funds
Housing RDA-Housing 1998/2003 TaxAuthority Set-Aside Allocation RDA Bonds
Local Choice Special Bonds-Capital Debt General Transportation Vouchers Revenue Projects Service Other Funds Total
Major Funds
CITY OF SUISUN CITY Statement of Revenues, Expenditures and Changes in Fund Balance
GOVERNMENTAL FUNDSFor the Fiscal Year Ended June 30, 2004
Other Financing Sources (Uses):Debt proceeds - - - - 6,390,000 43,407,164 2,490,000 52,287,164 Operating transfer in 284,504 234,504 - 2,173,981 25,610 2,666,046 2,013,612 7,398,257 Operating transfer out (209,019) - - (612,263) (1,065,000) (3,799,575) (1,492,397) (7,178,254)
Total 75,485 234,504 - 1,561,718 5,350,610 42,273,635 3,011,215 52,507,167
Net Change in fund balance 29,855 130,387 23,522 1,369,825 4,795,810 1,071,839 1,358,521 8,779,759
Fund balance, beginning of year 2,316,705 5,766 235,655 5,337,832 1,746,745 5,356,583 6,839,075 21,838,361
Fund balance, end of year 2,346,560$ 136,153$ 259,177$ 6,707,657$ 6,542,555$ 6,428,422$ 8,197,596$ 30,618,120$
29
See accompanying notes to basic financial statements.
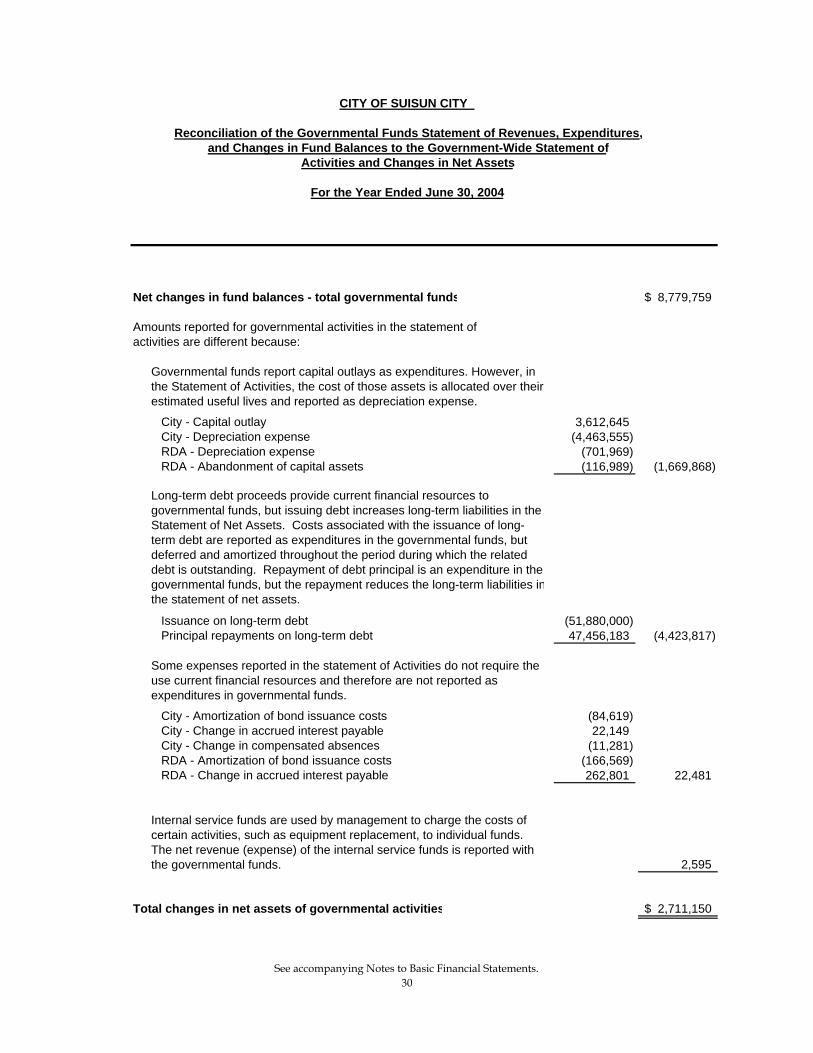
Net changes in fund balances - total governmental funds 8,779,759$
Amounts reported for governmental activities in the statement ofactivities are different because:
Governmental funds report capital outlays as expenditures. However, in the Statement of Activities, the cost of those assets is allocated over their estimated useful lives and reported as depreciation expense.
City - Capital outlay 3,612,645 City - Depreciation expense (4,463,555) RDA - Depreciation expense (701,969) RDA - Abandonment of capital assets (116,989) (1,669,868)
Long-term debt proceeds provide current financial resources to governmental funds, but issuing debt increases long-term liabilities in the Statement of Net Assets. Costs associated with the issuance of long-term debt are reported as expenditures in the governmental funds, but deferred and amortized throughout the period during which the related debt is outstanding. Repayment of debt principal is an expenditure in the governmental funds, but the repayment reduces the long-term liabilities inthe statement of net assets.
Issuance on long-term debt (51,880,000) Principal repayments on long-term debt 47,456,183 (4,423,817)
Some expenses reported in the statement of Activities do not require the use current financial resources and therefore are not reported as expenditures in governmental funds.
City - Amortization of bond issuance costs (84,619) City - Change in accrued interest payable 22,149 City - Change in compensated absences (11,281) RDA - Amortization of bond issuance costs (166,569) RDA - Change in accrued interest payable 262,801 22,481
Internal service funds are used by management to charge the costs of certain activities, such as equipment replacement, to individual funds. The net revenue (expense) of the internal service funds is reported with the governmental funds. 2,595
Total changes in net assets of governmental activities 2,711,150$
CITY OF SUISUN CITY
Reconciliation of the Governmental Funds Statement of Revenues, Expenditures,and Changes in Fund Balances to the Government-Wide Statement of
For the Year Ended June 30, 2004
Activities and Changes in Net Assets
See accompanying Notes to Basic Financial Statements.30
Business-Type Activities
Governmental Activities-
Internal Service Fund
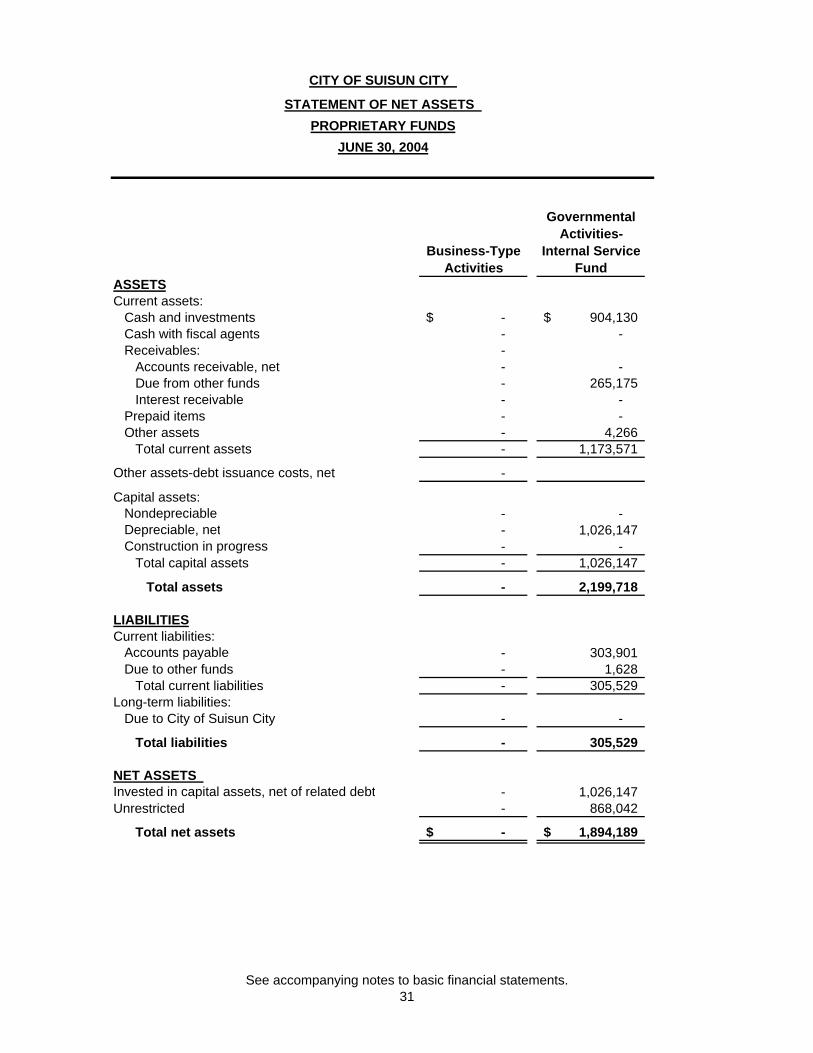
ASSETSCurrent assets:
Cash and investments -$ 904,130$ Cash with fiscal agents - - Receivables: -
Accounts receivable, net - - Due from other funds - 265,175 Interest receivable - -
Prepaid items - - Other assets - 4,266
Total current assets - 1,173,571
Other assets-debt issuance costs, net -
Capital assets:Nondepreciable - - Depreciable, net - 1,026,147 Construction in progress - -
Total capital assets - 1,026,147
Total assets - 2,199,718
LIABILITIESCurrent liabilities:
Accounts payable - 303,901 Due to other funds - 1,628
Total current liabilities - 305,529 Long-term liabilities:
Due to City of Suisun City - -
Total liabilities - 305,529
NET ASSETS Invested in capital assets, net of related debt - 1,026,147 Unrestricted - 868,042
Total net assets -$ 1,894,189$
CITY OF SUISUN CITY
STATEMENT OF NET ASSETS
JUNE 30, 2004PROPRIETARY FUNDS
See accompanying notes to basic financial statements.
31
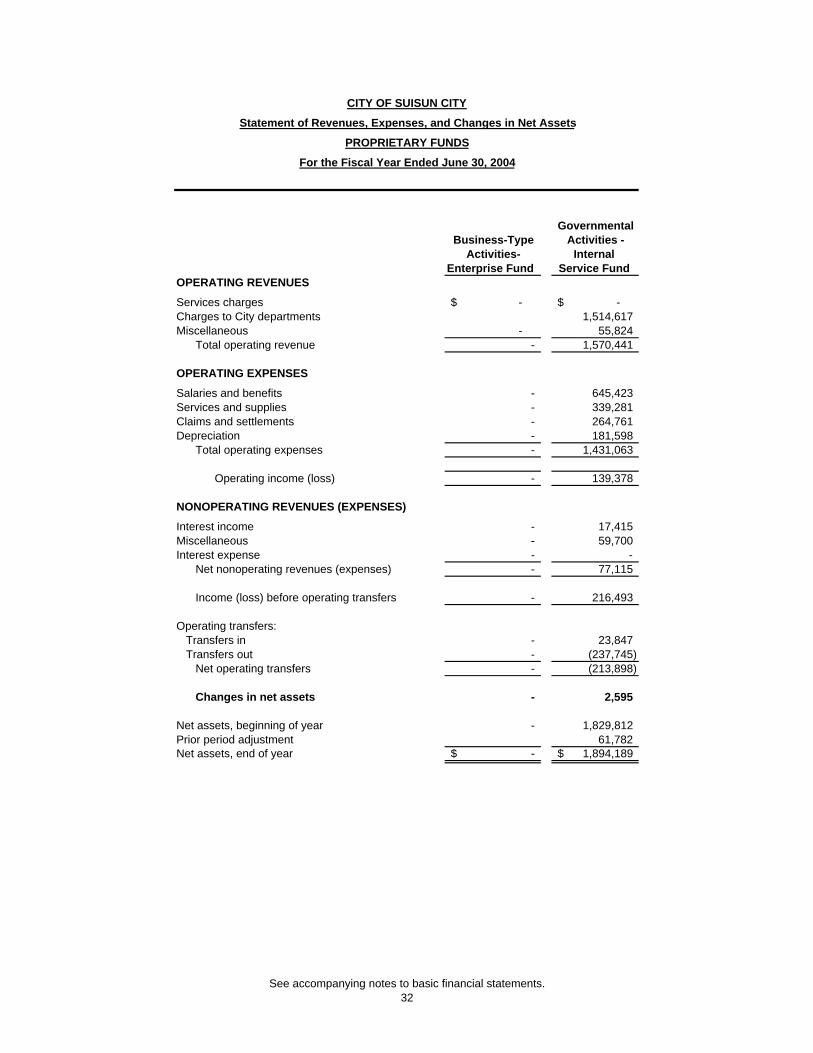
GovernmentalBusiness-Type Activities -
Activities- Internal Enterprise Fund Service Fund
OPERATING REVENUES
Services charges -$ -$ Charges to City departments 1,514,617 Miscellaneous - 55,824
Total operating revenue - 1,570,441
OPERATING EXPENSES
Salaries and benefits - 645,423 Services and supplies - 339,281 Claims and settlements - 264,761 Depreciation - 181,598
Total operating expenses - 1,431,063
Operating income (loss) - 139,378
NONOPERATING REVENUES (EXPENSES)
Interest income - 17,415 Miscellaneous - 59,700 Interest expense - -
Net nonoperating revenues (expenses) - 77,115
Income (loss) before operating transfers - 216,493
Operating transfers:Transfers in - 23,847 Transfers out - (237,745)
Net operating transfers - (213,898)
Changes in net assets - 2,595
Net assets, beginning of year - 1,829,812 Prior period adjustment 61,782 Net assets, end of year -$ 1,894,189$
PROPRIETARY FUNDS
For the Fiscal Year Ended June 30, 2004
CITY OF SUISUN CITY
Statement of Revenues, Expenses, and Changes in Net Assets
See accompanying notes to basic financial statements.
32
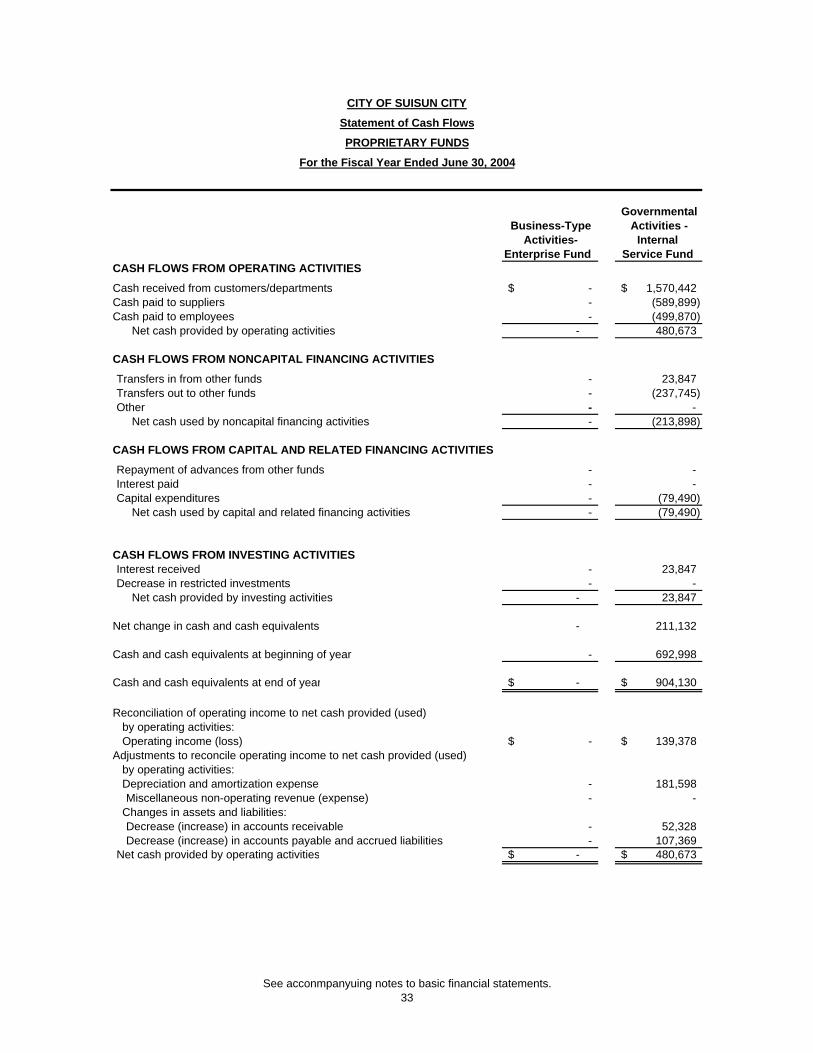
GovernmentalBusiness-Type Activities -
Activities- Internal Enterprise Fund Service Fund
CASH FLOWS FROM OPERATING ACTIVITIES
Cash received from customers/departments -$ 1,570,442$ Cash paid to suppliers - (589,899) Cash paid to employees - (499,870)
Net cash provided by operating activities - 480,673
CASH FLOWS FROM NONCAPITAL FINANCING ACTIVITIES
Transfers in from other funds - 23,847 Transfers out to other funds - (237,745) Other - -
Net cash used by noncapital financing activities - (213,898)
CASH FLOWS FROM CAPITAL AND RELATED FINANCING ACTIVITIES
Repayment of advances from other funds - - Interest paid - - Capital expenditures - (79,490)
Net cash used by capital and related financing activities - (79,490)
CASH FLOWS FROM INVESTING ACTIVITIESInterest received - 23,847 Decrease in restricted investments - -
Net cash provided by investing activities - 23,847
Net change in cash and cash equivalents - 211,132
Cash and cash equivalents at beginning of year - 692,998
Cash and cash equivalents at end of year -$ 904,130$
Reconciliation of operating income to net cash provided (used) by operating activities:Operating income (loss) -$ 139,378$
Adjustments to reconcile operating income to net cash provided (used)by operating activities:Depreciation and amortization expense - 181,598 Miscellaneous non-operating revenue (expense) - -
Changes in assets and liabilities:Decrease (increase) in accounts receivable - 52,328 Decrease (increase) in accounts payable and accrued liabilities - 107,369
Net cash provided by operating activities -$ 480,673$
CITY OF SUISUN CITY
PROPRIETARY FUNDS
Statement of Cash Flows
For the Fiscal Year Ended June 30, 2004
See acconmpanyuing notes to basic financial statements.
33
CITY OF SUISUN CITY, CALIFORNIA NOTES TO FINANCIAL STATEMENTS
39
NOTE 1 - Summary of significant accounting policies: The basic financial statements of the City of Suisun City (“the City”), have been prepared in conformity with generally accepted principles (“GAAP”) as applied to governmental agencies. The Governmental Accounting Standards Boards (“GASB”) is the accepted standard setting body for establishing governmental accounting and financial reporting principles. The more significant accounting principles are described below. A. Reporting Entity The City is a municipal corporation governed by an elected five-member Council. As required by accounting principles generally accepted in the United States of America, these financial statements present the City and its component units, entities for which the City is considered to be financially accountable. Blended component units, although legally separate entities, are, in substance, part of the City's operations and so data from these units are combined with data of the primary government. The City of Suisun City Redevelopment Agency (the “Agency”), City of Suisun City Public Financing Authority, and City of Suisun City Housing Authority serve the citizens of the City. Boards comprised of the City’s elected Council govern the Agency and Authorities. The Redevelopment Agency and the Housing Authority are reported as a component of the City's special revenue, capital projects, and debt service funds. The Financing Authority is reported as a component of the City's capital projects funds. B. Description of Funds The accounts of the City are organized on the basis of funds, each of which is considered a separate accounting entity. The operations of each fund are accounted for with a separate set of self-balancing accounts that comprise its assets, liabilities, fund equity, revenues, and expenditures. Government resources are allocated to and accounted for in individual funds based upon the purposes for which they are to be spent and the means by which spending activities are controlled. The minimum number of funds is maintained consistent with legal and managerial expectations.
C. Government–Wide Financial Statements The City’s government-wide financial statements include a Statement of Net Assets and a Statement of Activities and Changes in Net Assets. These statements present summaries of governmental activities and Business-type activities for the City and its component unit accompanied by a total column. These financial statements include the financial activities of the overall City government, except for fiduciary activities. Eliminations have been made to minimize the double counting of internal activities. Governmental activities are financed generally through taxes, intergovernmental revenues, and other non-exchange transactions. The City does not have any Business-type activities. The Statement of Activities presents a comparison between direct expenses and program revenues for each function of the City’s governmental activities. Direct expenses are those that are specifically associated with a program or function and therefore are clearly identifiable to a particular function. Program revenues include three categories: (1) charges for services, (2) operating grants and contributions and (3) capital grants and contributions. Revenues that are not classified as program revenues, including all taxes are presented as general revenues. Certain eliminations have been made as prescribed by Governmental Accounting Standards Board No. 34, Basic Financial Statements-and Management’s Discussion and Analysis-for State and Local Governments (“GASB No. 34”) in regards to interfund activities, payables and receivables.
CITY OF SUISUN CITY, CALIFORNIA NOTES TO FINANCIAL STATEMENTS
40
D. Governmental Fund Financial Statements Governmental fund financial statements include a Balance Sheet and a Statement of Revenues, Expenditures and Changes in Fund Balances for all major governmental funds and non-major funds aggregated. An accompanying schedule is presented to reconcile and explain the differences in net assets as presented in these statements to the net assets presented in the government-wide financial statements. GASB 34 defines major funds and requires that the City’s major funds governmental funds be identified and presented separately in the Fund financial statements. All other governmental funds, called non-major funds are combined and reported in a single column, regardless of their fund-type. Major funds are defined as governmental funds which have either assets, liabilities, revenues or expenditures equal to ten percent of their fund-type total or five percent of the grand total. The general fund is always a major fund. The City may select other governmental funds it believes should be presented as major funds, although no such funds were selected in fiscal 2004. The major governmental funds of the City are:
• General Fund – The General Fund is used to account for the resources to carry out basic governmental activities of the City such as general government, public safety, public works, and parks and recreation which are not required to be accounted for in another fund.
• Local Transportation Fund - This fund was established to receive and expend Federal, State
and Local funds to be used for streets, pedestrian and bikeway improvements.
• Housing Authority Choice Vouchers – This fund is used to account for intergovernmental revenues received to be used for housing assistance payment programs.
• Housing Set-Aside – This fund is used to account for the 20 percent tax increment revenue set-aside monies required by law to be used only for low and moderate-income housing.
• 1998/2003 Tax Allocation Bonds – This fund is used to account for the bond proceeds used for capital projects, including the new community center and other capital projects.
• RDA Bonds Debt Service - This fund is used to account for the payment of principal and interest on long-term obligations.
E. Basis of Accounting The City-wide, Proprietary Funds and fiduciary fund financial statements required by GASB 34 are reported using the “economic resources” measurement focus and the accrual basis of accounting. Accordingly, all of the City’s assets and liabilities, including capital assets and long-term liabilities, if any are included in the accompanying Statement of Net Assets. The Statement of Activities presents changes in net assets. Under the accrual basis of accounting, revenues are recognized in the period in which they are earned while expenses are recognized in the period in which the liability is incurred. The Governmental fund financial statements are accounted for on a spending or “current financial resources” measurement focus and the modified accrual basis of accounting. Accordingly, only current assets and liabilities (except for long-term advances from the City) are included in the Balance Sheet, The Statement of Revenues, Expenditures and Changes in Fund Balances present increases (revenues and other financing sources) and decreases (expenditures and other financing uses) in net current assets. Under the modified accrual basis of accounting, revenues are recognized in the accounting period in which they become both measurable and available to finance expenditures of the current period.
CITY OF SUISUN CITY, CALIFORNIA NOTES TO FINANCIAL STATEMENTS
41
Revenues are recorded when received in cash, except that revenues subject to accrual (generally 60 days after fiscal year end) are recognized when due. The primary revenue sources, which have been treated as susceptible to accrual by the Agency, are property taxes, sales taxes, intergovernmental revenues, other taxes and investment earnings. Expenditures are recorded in the accounting period in which the related fund liability is incurred. Grant revenues are recognized in the fiscal year in which all eligibility requirements are met. Under the terms of grant agreements, the City may fund certain programs with a combination of cost-reimbursement grants, categorical block grants and general revenues. Thus both restricted and unrestricted net assets may be available to finance program expenditures. The City’s policy is to first apply restricted grant resources to such programs, followed by general revenues if necessary. Non-exchange transactions, in which the City gives or receives value without directly receiving or giving value in exchange, include taxes, grants, entitlements and donations. On the accrual basis, revenue from taxes is recognized in the fiscal year for which the taxes are levied or assessed. Revenue from grants, entitlements and donations is recognized in the fiscal year in which all eligibility requirements have been satisfied. The City follows Statements and interpretations of the Financial Accounting Standards Board and its predecessors that were issued on or before November 30, 1989, in accounting for its business-type activities, unless they conflict with Government Accounting Standards Board pronouncements. The reconciliations of the Fund Financial Statements to the Government-Wide Financial Statements are provided to explain the differences created by the integrated approach of GASB No. 34: F. Use of Restricted/Unrestricted Net Assets When an expense is incurred for purposes for which both restricted and unrestricted net assets are available, the City’s policy is to apply restricted net assets first. G. Budgets and Budgetary Accounting Annual budgets are adopted on a basis consistent with generally accepted accounting principles for all governmental funds and internal service funds. Budgets are not adopted for Fiduciary funds. All annual appropriations lapse at fiscal year end. All agencies of the City and the Housing Authority submit requests for appropriations to the City Manager so that a budget may be prepared. The proposed budget is presented to the City Council for review. The Council holds public hearings and adopts a final budget. The budgets for the Suisun/Solano Water Authority and the Fairfield-Suisun Sewer district are prepared for approval by the respective agency’s board. The appropriated budget is prepared by fund, function, and department. The City Manager may make transfers of appropriations within a department. The legal level of budgetary control is the fund level. Any changes to increase total appropriations in a fund require approval of the City Council. The governing Council made several supplemental budgetary appropriations throughout the year. Encumbrance accounting, a method of recording purchase commitments, is not used by the City.
CITY OF SUISUN CITY, CALIFORNIA NOTES TO FINANCIAL STATEMENTS
42
H. Receivables and payables Transactions between funds that are representative of lending/borrowing arrangements outstanding at the end of the fiscal year are referred to as either "due to/from other funds” (i.e., the current portion of interfund loans) or "advances to/from other funds" (i.e., the noncurrent portion of interfund loans). Long-term advances between funds are offset by a fund balance reserve account in applicable governmental funds to indicate they are not available for appropriation and are not expendable available financial resources. The investment in tax allocation bonds held by the Financing Authority, a component unit, has been eliminated in the accompanying financial statements. The City uses the allowance method of accounting for uncollectable trade receivables in the enterprise funds.
The City makes housing rehabilitation, economic development, and redevelopment loans to individuals and businesses. These long-term loans are carried as assets of the governmental funds making the loans. Fund balance accounts are reserved for such loans to indicate they are not available for appropriation and are not expendable available financial resources. I. Inventories and prepaid items Inventories are recorded as expenditures when consumed rather than when purchased. These inventories are stated at cost, using the first-in, first-out (FIFO) method. Inventories in the proprietary funds are stated at the lower of cost or market and consist of expendable materials and supplies. Certain payments to vendors reflect costs applicable to future accounting periods and are recorded as prepaid items in both the government-wide and fund financial statements. Inventories and prepaid items, as reported in the fund financial statements are offset by a reservation of fund balance for noncurrent assets in governmental funds to indicate that they do not constitute resources available for appropriation. J. Capital Assets The City’s assets are capitalized at historical cost or estimated historical cost. City policy has set the capitalization threshold for reporting capital assets at $5,000. Gifts or contributions of capital assets are recorded at fair market value on the date donated. Depreciation of capital assets is charged as an expense each year and the total amount of depreciation taken over the years, accumulated depreciation, is reported on the Statement of Net Assets as a reduction in the book value of capital assets. K. Compensated Absences City employees accrue vacation, sick, holiday, executive leave and compensatory time off benefits. Vacation may not accrue beyond 240 hours or as provided in the employee’s memorandum of understanding (MOU). No cash compensation is payable for accrued vacation until the employee terminates employment. No cash payment is made for accrued sick leave upon separation of service. Upon retirement, eligible employees may convert sick leave to years of service credit as provided for in the City’s contract with PERS. Accrued executive leave may be converted to cash upon separation of service. In lieu of overtime, it is the City’s policy to allow employees to accumulate compensatory time to limits provided for in the MOU. This accumulation may subsequently be converted to cash up to limits provided for in their MOU or converted to cash upon separation of service. All vacation pay is accrued when incurred in the government-wide, proprietary and fiduciary financial statements. A liability for these amounts is reported in the governmental funds only when they have
CITY OF SUISUN CITY, CALIFORNIA NOTES TO FINANCIAL STATEMENTS
43
matured (such as vacation time, estimated to be paid upon retirement in the next fiscal year with expendable available financial resources). L. Property Tax Revenues State statutes provide that the property tax rate be limited generally to one percent of market value, be levied only by the County, and be shared with applicable jurisdictions. The County of Solano collects the taxes and distributes them to taxing jurisdictions on the basis of assessed valuations subject to adjustments for voter-approved debt. Property taxes are levied March 1 and are due on November 1 and March 1, and become delinquent on December 10 and April 10. The City receives property taxes pursuant to an arrangement with the County known as the "Teeter Plan", whereby the County assumes responsibility for the collection of delinquent taxes and pays the full allocation to the City. The Redevelopment Agency also receives tax increment revenues allocated to the Agency from the redevelopment project area. The City recognizes property tax revenues (including tax increment revenues) to the extent of each year's tax allocation received or to be received within 60 days after the end of each fiscal year. Incremental property tax revenues represent property taxes in a project area arising from increased assessed valuations over base valuations established at the inception of a project. Incremental property taxes from a project accrue to the Agency until all liabilities of the project have been repaid (including cumulative funds provided by the City). After all such indebtedness has been repaid, all property taxes from a project area accrue to the various taxing authorities. M. Net Assets Government-Wide Net Assets consist of the following: Invested in capital assets, net of related debt – This amount consists of capital assets, net of accumulated depreciation and reduced by outstanding debt that was attributed to the acquisition, construction or improvement of the assets. Restricted net assets – This amount is restricted by external creditors, grantors, contributors or laws or regulations of other governments. Unrestricted net assets – This amount is all net assets that do not meet the definition of “invested in capital assets, net of related debt” or “restricted net assets”. Governmental Fund Balance consist of the following: Reservations of fund balances of governmental funds are created to either satisfy legal covenants, including State laws that require a portion of the fund balance to be segregated or identify the portion of the fund not available for future expenditures. N. Deferred revenues Deferred revenues in governmental funds arise when potential revenue does not meet both the “measurable” and “available” criteria for recognition in the current period. Deferred revenue also arises when resources are received by the City before it has a legal claim to them, (i.e., when grant monies are received prior to the incurrence of qualifying expenditures). O. Statement of cash flows For purposes of the statement of cash flows, all highly liquid investments with maturities of three months or less when purchased are considered to be cash equivalents. The City considers all pooled cash and investments as cash and cash equivalents because the pool is used essentially as a demand deposit account from the standpoint of the funds.
CITY OF SUISUN CITY, CALIFORNIA NOTES TO FINANCIAL STATEMENTS
44
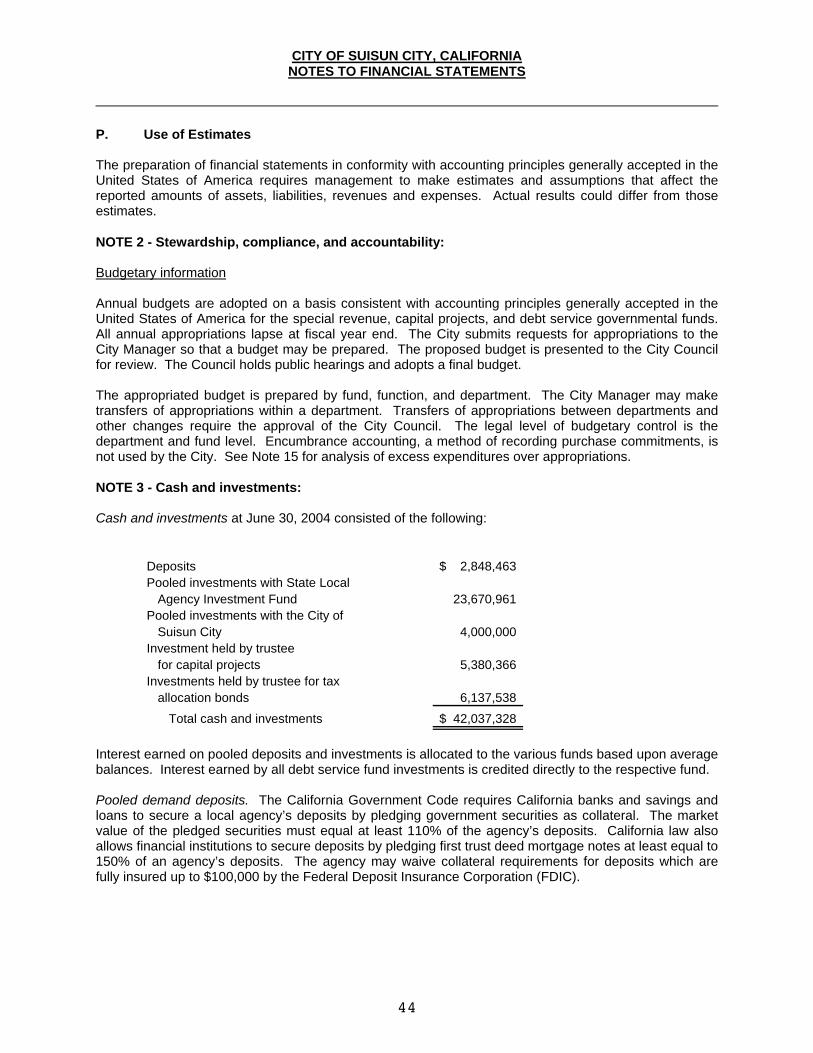
P. Use of Estimates The preparation of financial statements in conformity with accounting principles generally accepted in the United States of America requires management to make estimates and assumptions that affect the reported amounts of assets, liabilities, revenues and expenses. Actual results could differ from those estimates. NOTE 2 - Stewardship, compliance, and accountability: Budgetary information Annual budgets are adopted on a basis consistent with accounting principles generally accepted in the United States of America for the special revenue, capital projects, and debt service governmental funds. All annual appropriations lapse at fiscal year end. The City submits requests for appropriations to the City Manager so that a budget may be prepared. The proposed budget is presented to the City Council for review. The Council holds public hearings and adopts a final budget. The appropriated budget is prepared by fund, function, and department. The City Manager may make transfers of appropriations within a department. Transfers of appropriations between departments and other changes require the approval of the City Council. The legal level of budgetary control is the department and fund level. Encumbrance accounting, a method of recording purchase commitments, is not used by the City. See Note 15 for analysis of excess expenditures over appropriations. NOTE 3 - Cash and investments: Cash and investments at June 30, 2004 consisted of the following:
Deposits 2,848,463$ Pooled investments with State Local
Agency Investment Fund 23,670,961 Pooled investments with the City of
Suisun City 4,000,000 Investment held by trustee
for capital projects 5,380,366 Investments held by trustee for tax
allocation bonds 6,137,538
Total cash and investments 42,037,328$
Interest earned on pooled deposits and investments is allocated to the various funds based upon average balances. Interest earned by all debt service fund investments is credited directly to the respective fund. Pooled demand deposits. The California Government Code requires California banks and savings and loans to secure a local agency’s deposits by pledging government securities as collateral. The market value of the pledged securities must equal at least 110% of the agency’s deposits. California law also allows financial institutions to secure deposits by pledging first trust deed mortgage notes at least equal to 150% of an agency’s deposits. The agency may waive collateral requirements for deposits which are fully insured up to $100,000 by the Federal Deposit Insurance Corporation (FDIC).
CITY OF SUISUN CITY, CALIFORNIA NOTES TO FINANCIAL STATEMENTS
45
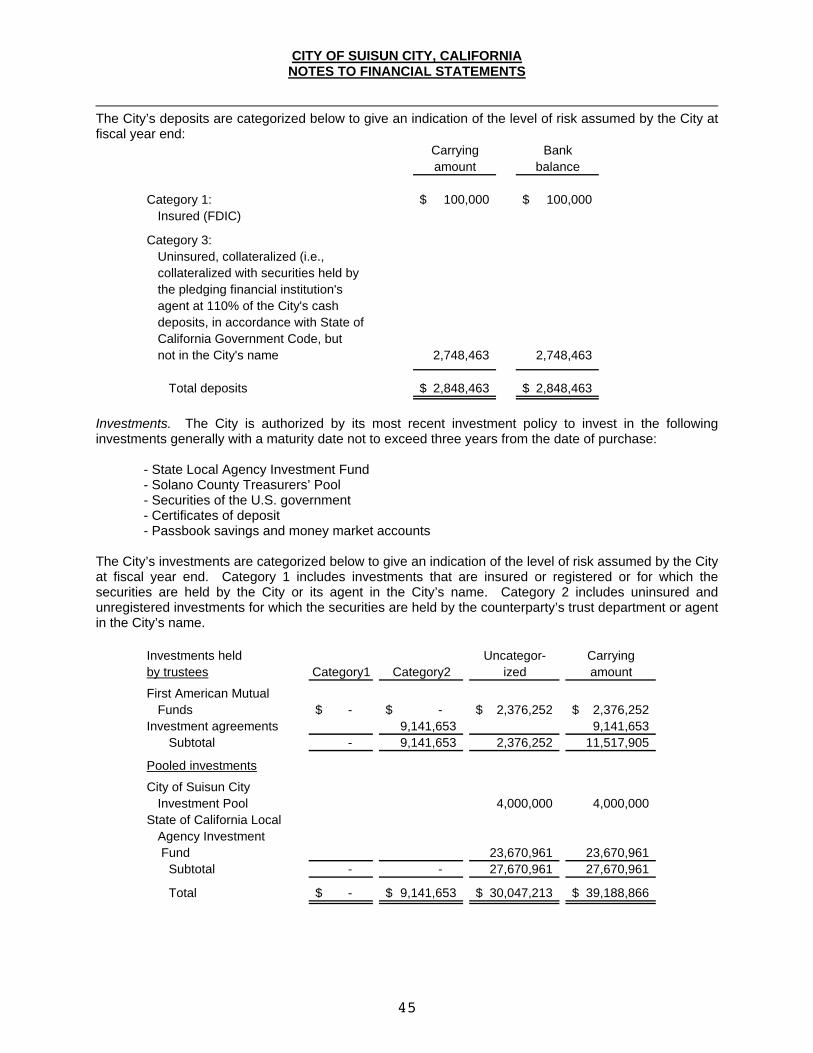
The City’s deposits are categorized below to give an indication of the level of risk assumed by the City at fiscal year end:
Carrying Bankamount balance
Category 1: 100,000$ 100,000$ Insured (FDIC)
Category 3:Uninsured, collateralized (i.e.,collateralized with securities held bythe pledging financial institution'sagent at 110% of the City's cashdeposits, in accordance with State of California Government Code, but not in the City's name 2,748,463 2,748,463
Total deposits 2,848,463$ 2,848,463$
Investments. The City is authorized by its most recent investment policy to invest in the following investments generally with a maturity date not to exceed three years from the date of purchase: - State Local Agency Investment Fund - Solano County Treasurers’ Pool - Securities of the U.S. government - Certificates of deposit - Passbook savings and money market accounts The City’s investments are categorized below to give an indication of the level of risk assumed by the City at fiscal year end. Category 1 includes investments that are insured or registered or for which the securities are held by the City or its agent in the City’s name. Category 2 includes uninsured and unregistered investments for which the securities are held by the counterparty’s trust department or agent in the City’s name.
Investments held Uncategor- Carryingby trustees Category1 Category2 ized amount
First American MutualFunds -$ -$ 2,376,252$ 2,376,252$
Investment agreements 9,141,653 9,141,653 Subtotal - 9,141,653 2,376,252 11,517,905
Pooled investments
City of Suisun CityInvestment Pool 4,000,000 4,000,000
State of California LocalAgency Investment Fund 23,670,961 23,670,961
Subtotal - - 27,670,961 27,670,961
Total -$ 9,141,653$ 30,047,213$ 39,188,866$
CITY OF SUISUN CITY, CALIFORNIA NOTES TO FINANCIAL STATEMENTS
46
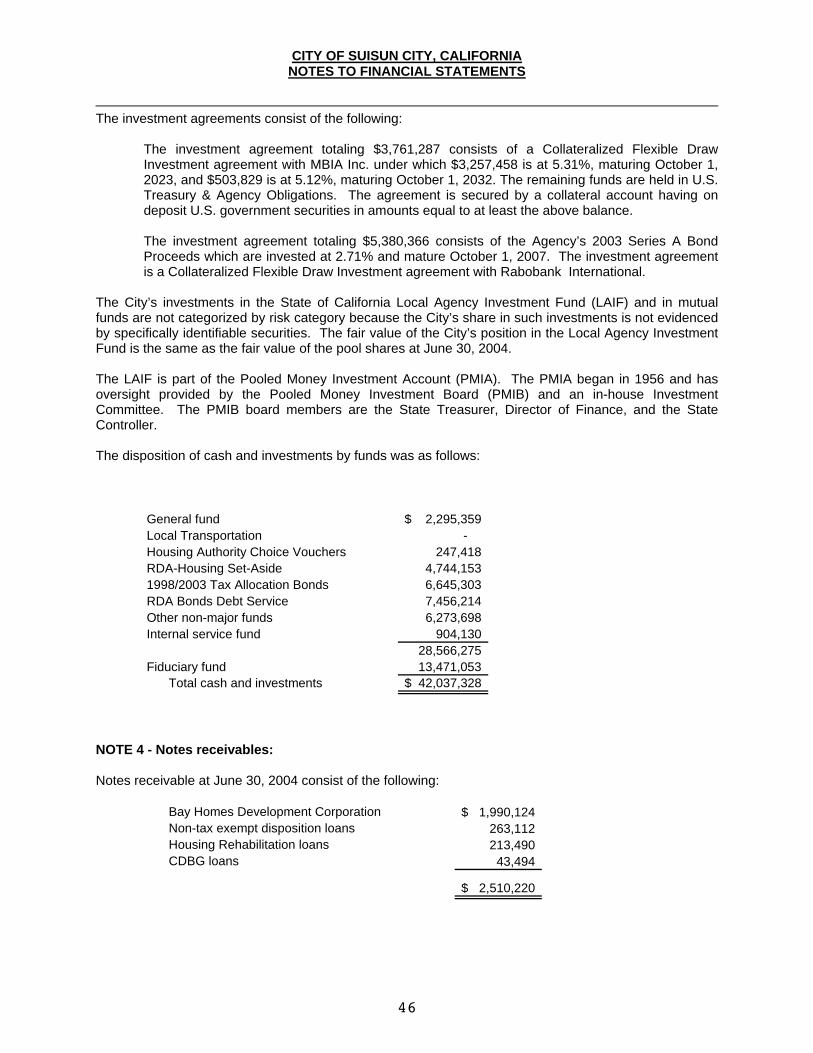
The investment agreements consist of the following:
The investment agreement totaling $3,761,287 consists of a Collateralized Flexible Draw Investment agreement with MBIA Inc. under which $3,257,458 is at 5.31%, maturing October 1, 2023, and $503,829 is at 5.12%, maturing October 1, 2032. The remaining funds are held in U.S. Treasury & Agency Obligations. The agreement is secured by a collateral account having on deposit U.S. government securities in amounts equal to at least the above balance. The investment agreement totaling $5,380,366 consists of the Agency’s 2003 Series A Bond Proceeds which are invested at 2.71% and mature October 1, 2007. The investment agreement is a Collateralized Flexible Draw Investment agreement with Rabobank International.
The City’s investments in the State of California Local Agency Investment Fund (LAIF) and in mutual funds are not categorized by risk category because the City’s share in such investments is not evidenced by specifically identifiable securities. The fair value of the City’s position in the Local Agency Investment Fund is the same as the fair value of the pool shares at June 30, 2004. The LAIF is part of the Pooled Money Investment Account (PMIA). The PMIA began in 1956 and has oversight provided by the Pooled Money Investment Board (PMIB) and an in-house Investment Committee. The PMIB board members are the State Treasurer, Director of Finance, and the State Controller. The disposition of cash and investments by funds was as follows:
General fund 2,295,359$ Local Transportation - Housing Authority Choice Vouchers 247,418 RDA-Housing Set-Aside 4,744,153 1998/2003 Tax Allocation Bonds 6,645,303 RDA Bonds Debt Service 7,456,214 Other non-major funds 6,273,698 Internal service fund 904,130
28,566,275 Fiduciary fund 13,471,053
Total cash and investments 42,037,328$
NOTE 4 - Notes receivables: Notes receivable at June 30, 2004 consist of the following:
Bay Homes Development Corporation 1,990,124$ Non-tax exempt disposition loans 263,112 Housing Rehabilitation loans 213,490 CDBG loans 43,494
2,510,220$
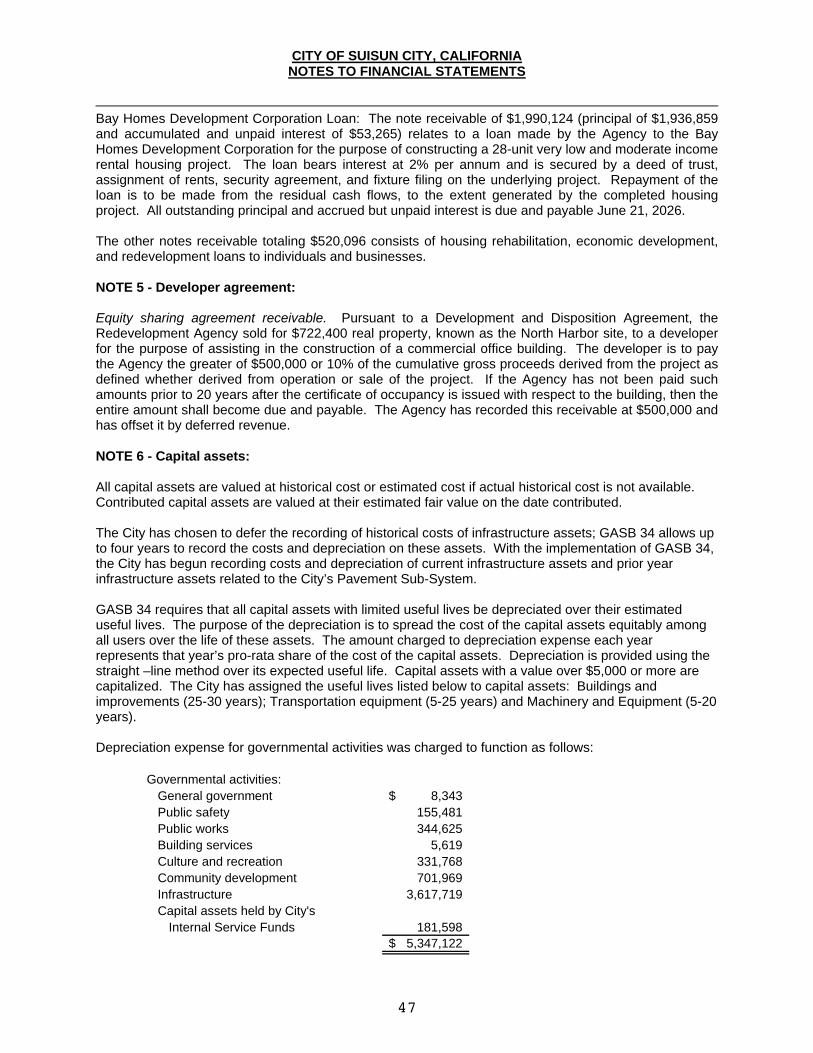
CITY OF SUISUN CITY, CALIFORNIA NOTES TO FINANCIAL STATEMENTS
47
Bay Homes Development Corporation Loan: The note receivable of $1,990,124 (principal of $1,936,859 and accumulated and unpaid interest of $53,265) relates to a loan made by the Agency to the Bay Homes Development Corporation for the purpose of constructing a 28-unit very low and moderate income rental housing project. The loan bears interest at 2% per annum and is secured by a deed of trust, assignment of rents, security agreement, and fixture filing on the underlying project. Repayment of the loan is to be made from the residual cash flows, to the extent generated by the completed housing project. All outstanding principal and accrued but unpaid interest is due and payable June 21, 2026. The other notes receivable totaling $520,096 consists of housing rehabilitation, economic development, and redevelopment loans to individuals and businesses. NOTE 5 - Developer agreement: Equity sharing agreement receivable. Pursuant to a Development and Disposition Agreement, the Redevelopment Agency sold for $722,400 real property, known as the North Harbor site, to a developer for the purpose of assisting in the construction of a commercial office building. The developer is to pay the Agency the greater of $500,000 or 10% of the cumulative gross proceeds derived from the project as defined whether derived from operation or sale of the project. If the Agency has not been paid such amounts prior to 20 years after the certificate of occupancy is issued with respect to the building, then the entire amount shall become due and payable. The Agency has recorded this receivable at $500,000 and has offset it by deferred revenue. NOTE 6 - Capital assets: All capital assets are valued at historical cost or estimated cost if actual historical cost is not available. Contributed capital assets are valued at their estimated fair value on the date contributed. The City has chosen to defer the recording of historical costs of infrastructure assets; GASB 34 allows up to four years to record the costs and depreciation on these assets. With the implementation of GASB 34, the City has begun recording costs and depreciation of current infrastructure assets and prior year infrastructure assets related to the City’s Pavement Sub-System. GASB 34 requires that all capital assets with limited useful lives be depreciated over their estimated useful lives. The purpose of the depreciation is to spread the cost of the capital assets equitably among all users over the life of these assets. The amount charged to depreciation expense each year represents that year’s pro-rata share of the cost of the capital assets. Depreciation is provided using the straight –line method over its expected useful life. Capital assets with a value over $5,000 or more are capitalized. The City has assigned the useful lives listed below to capital assets: Buildings and improvements (25-30 years); Transportation equipment (5-25 years) and Machinery and Equipment (5-20 years). Depreciation expense for governmental activities was charged to function as follows:
Governmental activities:General government 8,343$ Public safety 155,481 Public works 344,625 Building services 5,619 Culture and recreation 331,768 Community development 701,969 Infrastructure 3,617,719 Capital assets held by City's
Internal Service Funds 181,598 5,347,122$
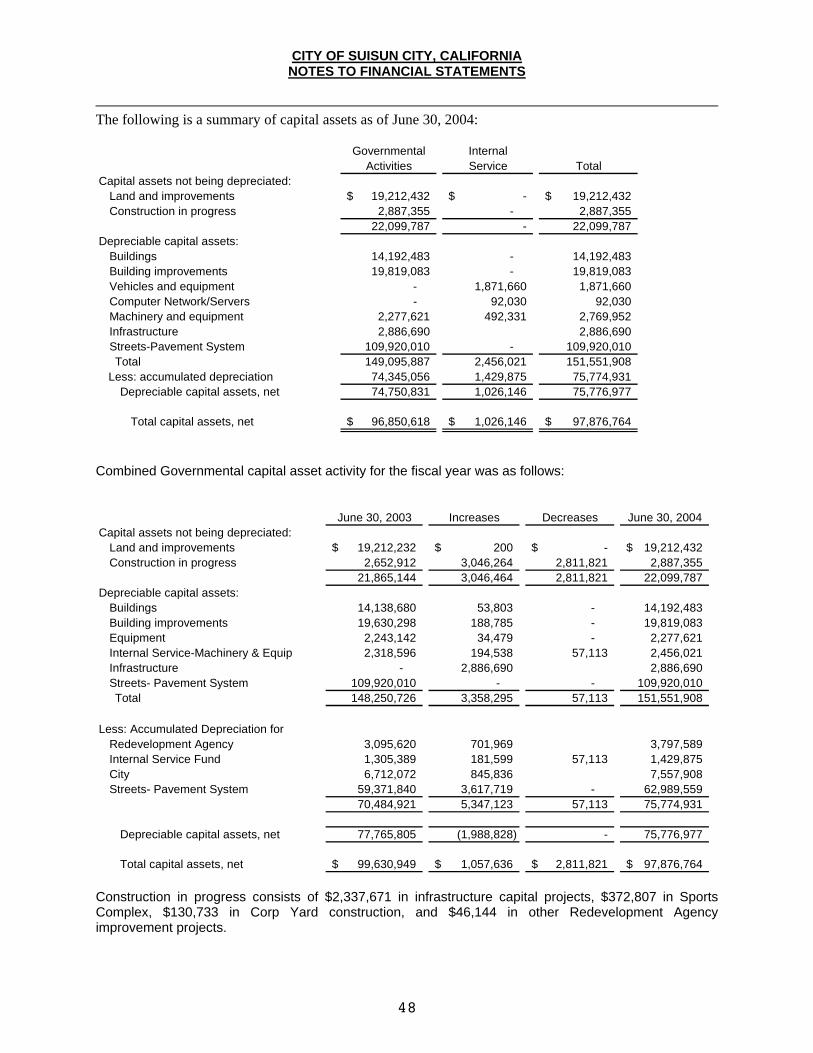
CITY OF SUISUN CITY, CALIFORNIA NOTES TO FINANCIAL STATEMENTS
48
The following is a summary of capital assets as of June 30, 2004:
Governmental Internal Activities Service Total
Capital assets not being depreciated:Land and improvements 19,212,432$ -$ 19,212,432$ Construction in progress 2,887,355 - 2,887,355
22,099,787 - 22,099,787 Depreciable capital assets:
Buildings 14,192,483 - 14,192,483 Building improvements 19,819,083 - 19,819,083 Vehicles and equipment - 1,871,660 1,871,660 Computer Network/Servers - 92,030 92,030 Machinery and equipment 2,277,621 492,331 2,769,952 Infrastructure 2,886,690 2,886,690 Streets-Pavement System 109,920,010 - 109,920,010
Total 149,095,887 2,456,021 151,551,908 Less: accumulated depreciation 74,345,056 1,429,875 75,774,931
Depreciable capital assets, net 74,750,831 1,026,146 75,776,977
Total capital assets, net 96,850,618$ 1,026,146$ 97,876,764$
Combined Governmental capital asset activity for the fiscal year was as follows:
June 30, 2003 Increases Decreases June 30, 2004Capital assets not being depreciated:
Land and improvements 19,212,232$ 200$ -$ 19,212,432$ Construction in progress 2,652,912 3,046,264 2,811,821 2,887,355
21,865,144 3,046,464 2,811,821 22,099,787 Depreciable capital assets:
Buildings 14,138,680 53,803 - 14,192,483 Building improvements 19,630,298 188,785 - 19,819,083 Equipment 2,243,142 34,479 - 2,277,621 Internal Service-Machinery & Equip 2,318,596 194,538 57,113 2,456,021 Infrastructure - 2,886,690 2,886,690 Streets- Pavement System 109,920,010 - - 109,920,010
Total 148,250,726 3,358,295 57,113 151,551,908
Less: Accumulated Depreciation forRedevelopment Agency 3,095,620 701,969 3,797,589 Internal Service Fund 1,305,389 181,599 57,113 1,429,875 City 6,712,072 845,836 7,557,908 Streets- Pavement System 59,371,840 3,617,719 - 62,989,559
70,484,921 5,347,123 57,113 75,774,931
Depreciable capital assets, net 77,765,805 (1,988,828) - 75,776,977
Total capital assets, net 99,630,949$ 1,057,636$ 2,811,821$ 97,876,764$ Construction in progress consists of $2,337,671 in infrastructure capital projects, $372,807 in Sports Complex, $130,733 in Corp Yard construction, and $46,144 in other Redevelopment Agency improvement projects.
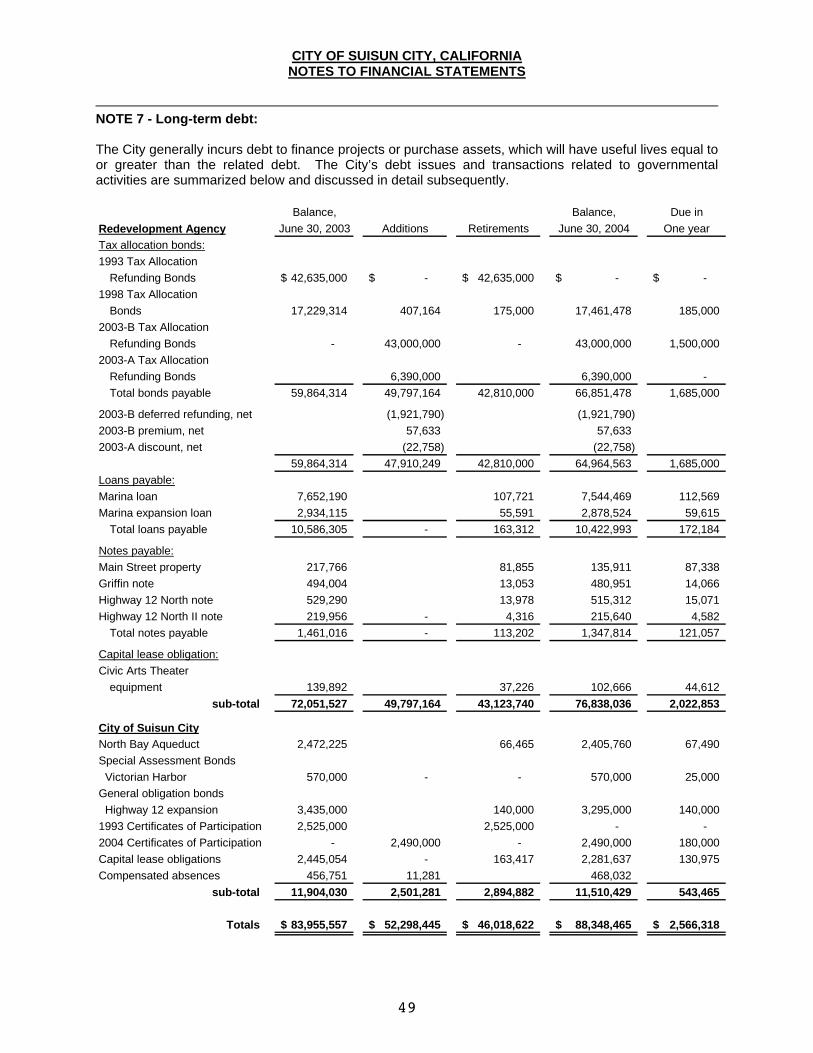
CITY OF SUISUN CITY, CALIFORNIA NOTES TO FINANCIAL STATEMENTS
49
NOTE 7 - Long-term debt: The City generally incurs debt to finance projects or purchase assets, which will have useful lives equal to or greater than the related debt. The City’s debt issues and transactions related to governmental activities are summarized below and discussed in detail subsequently.
Balance, Balance, Due inRedevelopment Agency June 30, 2003 Additions Retirements June 30, 2004 One yearTax allocation bonds:1993 Tax Allocation
Refunding Bonds 42,635,000$ -$ 42,635,000$ -$ -$ 1998 Tax Allocation
Bonds 17,229,314 407,164 175,000 17,461,478 185,000 2003-B Tax Allocation
Refunding Bonds - 43,000,000 - 43,000,000 1,500,000 2003-A Tax Allocation
Refunding Bonds 6,390,000 6,390,000 - Total bonds payable 59,864,314 49,797,164 42,810,000 66,851,478 1,685,000
2003-B deferred refunding, net (1,921,790) (1,921,790) 2003-B premium, net 57,633 57,633 2003-A discount, net (22,758) (22,758)
59,864,314 47,910,249 42,810,000 64,964,563 1,685,000 Loans payable:Marina loan 7,652,190 107,721 7,544,469 112,569 Marina expansion loan 2,934,115 55,591 2,878,524 59,615
Total loans payable 10,586,305 - 163,312 10,422,993 172,184
Notes payable:Main Street property 217,766 81,855 135,911 87,338 Griffin note 494,004 13,053 480,951 14,066 Highway 12 North note 529,290 13,978 515,312 15,071 Highway 12 North II note 219,956 - 4,316 215,640 4,582
Total notes payable 1,461,016 - 113,202 1,347,814 121,057
Capital lease obligation:Civic Arts Theater
equipment 139,892 37,226 102,666 44,612 sub-total 72,051,527 49,797,164 43,123,740 76,838,036 2,022,853
City of Suisun CityNorth Bay Aqueduct 2,472,225 66,465 2,405,760 67,490 Special Assessment Bonds Victorian Harbor 570,000 - - 570,000 25,000 General obligation bonds Highway 12 expansion 3,435,000 140,000 3,295,000 140,000 1993 Certificates of Participation 2,525,000 2,525,000 - - 2004 Certificates of Participation - 2,490,000 - 2,490,000 180,000 Capital lease obligations 2,445,054 - 163,417 2,281,637 130,975 Compensated absences 456,751 11,281 468,032
sub-total 11,904,030 2,501,281 2,894,882 11,510,429 543,465
Totals 83,955,557$ 52,298,445$ 46,018,622$ 88,348,465$ 2,566,318$
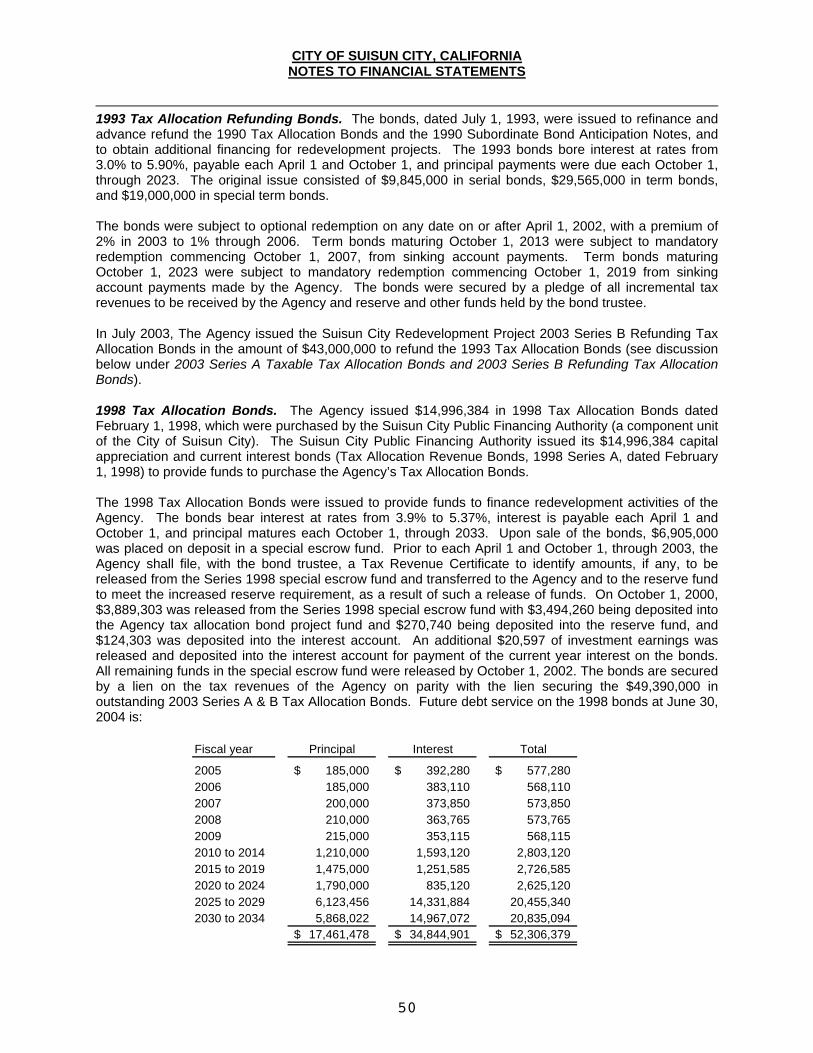
CITY OF SUISUN CITY, CALIFORNIA NOTES TO FINANCIAL STATEMENTS
50
1993 Tax Allocation Refunding Bonds. The bonds, dated July 1, 1993, were issued to refinance and advance refund the 1990 Tax Allocation Bonds and the 1990 Subordinate Bond Anticipation Notes, and to obtain additional financing for redevelopment projects. The 1993 bonds bore interest at rates from 3.0% to 5.90%, payable each April 1 and October 1, and principal payments were due each October 1, through 2023. The original issue consisted of $9,845,000 in serial bonds, $29,565,000 in term bonds, and $19,000,000 in special term bonds. The bonds were subject to optional redemption on any date on or after April 1, 2002, with a premium of 2% in 2003 to 1% through 2006. Term bonds maturing October 1, 2013 were subject to mandatory redemption commencing October 1, 2007, from sinking account payments. Term bonds maturing October 1, 2023 were subject to mandatory redemption commencing October 1, 2019 from sinking account payments made by the Agency. The bonds were secured by a pledge of all incremental tax revenues to be received by the Agency and reserve and other funds held by the bond trustee. In July 2003, The Agency issued the Suisun City Redevelopment Project 2003 Series B Refunding Tax Allocation Bonds in the amount of $43,000,000 to refund the 1993 Tax Allocation Bonds (see discussion below under 2003 Series A Taxable Tax Allocation Bonds and 2003 Series B Refunding Tax Allocation Bonds). 1998 Tax Allocation Bonds. The Agency issued $14,996,384 in 1998 Tax Allocation Bonds dated February 1, 1998, which were purchased by the Suisun City Public Financing Authority (a component unit of the City of Suisun City). The Suisun City Public Financing Authority issued its $14,996,384 capital appreciation and current interest bonds (Tax Allocation Revenue Bonds, 1998 Series A, dated February 1, 1998) to provide funds to purchase the Agency’s Tax Allocation Bonds. The 1998 Tax Allocation Bonds were issued to provide funds to finance redevelopment activities of the Agency. The bonds bear interest at rates from 3.9% to 5.37%, interest is payable each April 1 and October 1, and principal matures each October 1, through 2033. Upon sale of the bonds, $6,905,000 was placed on deposit in a special escrow fund. Prior to each April 1 and October 1, through 2003, the Agency shall file, with the bond trustee, a Tax Revenue Certificate to identify amounts, if any, to be released from the Series 1998 special escrow fund and transferred to the Agency and to the reserve fund to meet the increased reserve requirement, as a result of such a release of funds. On October 1, 2000, $3,889,303 was released from the Series 1998 special escrow fund with $3,494,260 being deposited into the Agency tax allocation bond project fund and $270,740 being deposited into the reserve fund, and $124,303 was deposited into the interest account. An additional $20,597 of investment earnings was released and deposited into the interest account for payment of the current year interest on the bonds. All remaining funds in the special escrow fund were released by October 1, 2002. The bonds are secured by a lien on the tax revenues of the Agency on parity with the lien securing the $49,390,000 in outstanding 2003 Series A & B Tax Allocation Bonds. Future debt service on the 1998 bonds at June 30, 2004 is:
Fiscal year Principal Interest Total
2005 185,000$ 392,280$ 577,280$ 2006 185,000 383,110 568,110 2007 200,000 373,850 573,850 2008 210,000 363,765 573,765 2009 215,000 353,115 568,115 2010 to 2014 1,210,000 1,593,120 2,803,120 2015 to 2019 1,475,000 1,251,585 2,726,585 2020 to 2024 1,790,000 835,120 2,625,120 2025 to 2029 6,123,456 14,331,884 20,455,340 2030 to 2034 5,868,022 14,967,072 20,835,094
17,461,478$ 34,844,901$ 52,306,379$
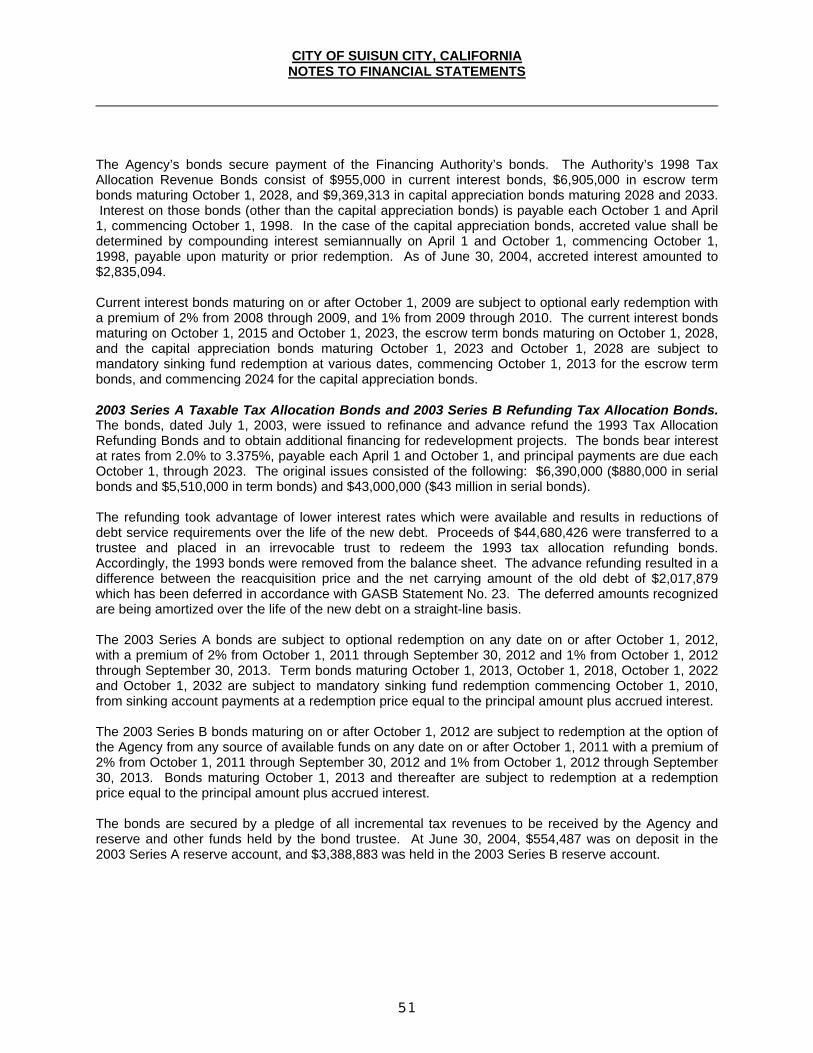
CITY OF SUISUN CITY, CALIFORNIA NOTES TO FINANCIAL STATEMENTS
51
The Agency’s bonds secure payment of the Financing Authority’s bonds. The Authority’s 1998 Tax Allocation Revenue Bonds consist of $955,000 in current interest bonds, $6,905,000 in escrow term bonds maturing October 1, 2028, and $9,369,313 in capital appreciation bonds maturing 2028 and 2033. Interest on those bonds (other than the capital appreciation bonds) is payable each October 1 and April 1, commencing October 1, 1998. In the case of the capital appreciation bonds, accreted value shall be determined by compounding interest semiannually on April 1 and October 1, commencing October 1, 1998, payable upon maturity or prior redemption. As of June 30, 2004, accreted interest amounted to $2,835,094. Current interest bonds maturing on or after October 1, 2009 are subject to optional early redemption with a premium of 2% from 2008 through 2009, and 1% from 2009 through 2010. The current interest bonds maturing on October 1, 2015 and October 1, 2023, the escrow term bonds maturing on October 1, 2028, and the capital appreciation bonds maturing October 1, 2023 and October 1, 2028 are subject to mandatory sinking fund redemption at various dates, commencing October 1, 2013 for the escrow term bonds, and commencing 2024 for the capital appreciation bonds. 2003 Series A Taxable Tax Allocation Bonds and 2003 Series B Refunding Tax Allocation Bonds. The bonds, dated July 1, 2003, were issued to refinance and advance refund the 1993 Tax Allocation Refunding Bonds and to obtain additional financing for redevelopment projects. The bonds bear interest at rates from 2.0% to 3.375%, payable each April 1 and October 1, and principal payments are due each October 1, through 2023. The original issues consisted of the following: $6,390,000 ($880,000 in serial bonds and $5,510,000 in term bonds) and $43,000,000 ($43 million in serial bonds). The refunding took advantage of lower interest rates which were available and results in reductions of debt service requirements over the life of the new debt. Proceeds of $44,680,426 were transferred to a trustee and placed in an irrevocable trust to redeem the 1993 tax allocation refunding bonds. Accordingly, the 1993 bonds were removed from the balance sheet. The advance refunding resulted in a difference between the reacquisition price and the net carrying amount of the old debt of $2,017,879 which has been deferred in accordance with GASB Statement No. 23. The deferred amounts recognized are being amortized over the life of the new debt on a straight-line basis. The 2003 Series A bonds are subject to optional redemption on any date on or after October 1, 2012, with a premium of 2% from October 1, 2011 through September 30, 2012 and 1% from October 1, 2012 through September 30, 2013. Term bonds maturing October 1, 2013, October 1, 2018, October 1, 2022 and October 1, 2032 are subject to mandatory sinking fund redemption commencing October 1, 2010, from sinking account payments at a redemption price equal to the principal amount plus accrued interest. The 2003 Series B bonds maturing on or after October 1, 2012 are subject to redemption at the option of the Agency from any source of available funds on any date on or after October 1, 2011 with a premium of 2% from October 1, 2011 through September 30, 2012 and 1% from October 1, 2012 through September 30, 2013. Bonds maturing October 1, 2013 and thereafter are subject to redemption at a redemption price equal to the principal amount plus accrued interest. The bonds are secured by a pledge of all incremental tax revenues to be received by the Agency and reserve and other funds held by the bond trustee. At June 30, 2004, $554,487 was on deposit in the 2003 Series A reserve account, and $3,388,883 was held in the 2003 Series B reserve account.
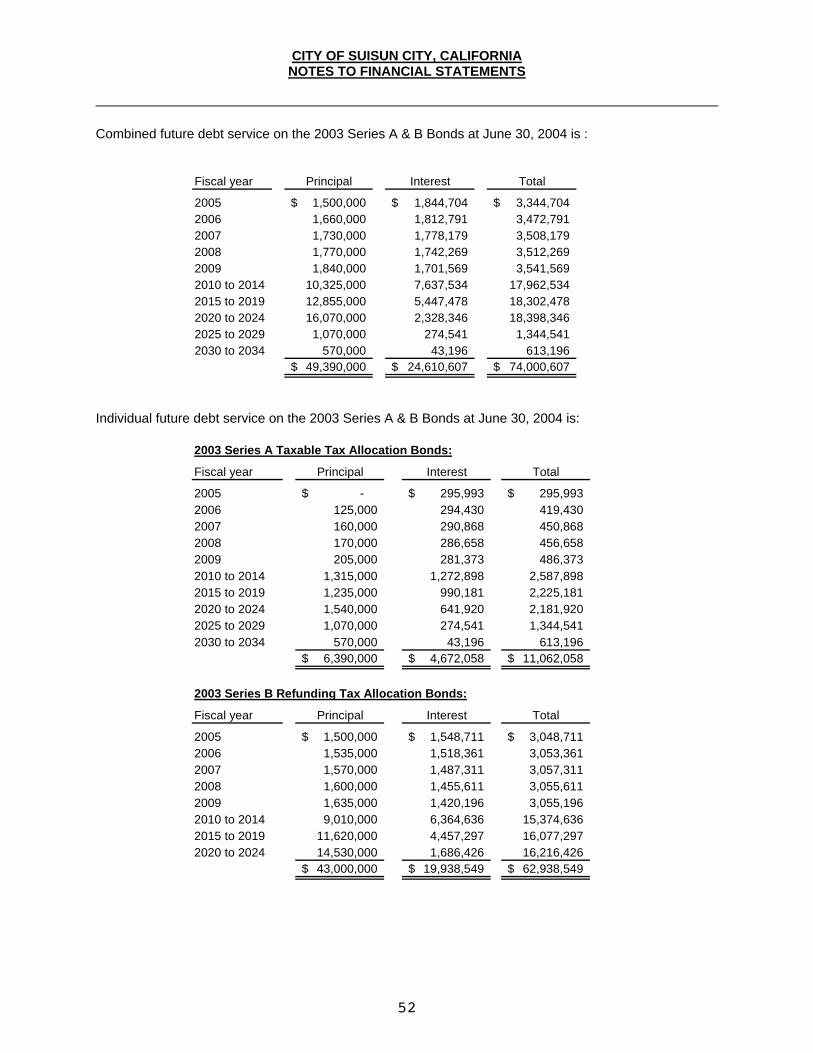
CITY OF SUISUN CITY, CALIFORNIA NOTES TO FINANCIAL STATEMENTS
52
Combined future debt service on the 2003 Series A & B Bonds at June 30, 2004 is :
Fiscal year Principal Interest Total
2005 1,500,000$ 1,844,704$ 3,344,704$ 2006 1,660,000 1,812,791 3,472,791 2007 1,730,000 1,778,179 3,508,179 2008 1,770,000 1,742,269 3,512,269 2009 1,840,000 1,701,569 3,541,569 2010 to 2014 10,325,000 7,637,534 17,962,534 2015 to 2019 12,855,000 5,447,478 18,302,478 2020 to 2024 16,070,000 2,328,346 18,398,346 2025 to 2029 1,070,000 274,541 1,344,541 2030 to 2034 570,000 43,196 613,196
49,390,000$ 24,610,607$ 74,000,607$
Individual future debt service on the 2003 Series A & B Bonds at June 30, 2004 is:
2003 Series A Taxable Tax Allocation Bonds:
Fiscal year Principal Interest Total
2005 -$ 295,993$ 295,993$ 2006 125,000 294,430 419,430 2007 160,000 290,868 450,868 2008 170,000 286,658 456,658 2009 205,000 281,373 486,373 2010 to 2014 1,315,000 1,272,898 2,587,898 2015 to 2019 1,235,000 990,181 2,225,181 2020 to 2024 1,540,000 641,920 2,181,920 2025 to 2029 1,070,000 274,541 1,344,541 2030 to 2034 570,000 43,196 613,196
6,390,000$ 4,672,058$ 11,062,058$
2003 Series B Refunding Tax Allocation Bonds:
Fiscal year Principal Interest Total
2005 1,500,000$ 1,548,711$ 3,048,711$ 2006 1,535,000 1,518,361 3,053,361 2007 1,570,000 1,487,311 3,057,311 2008 1,600,000 1,455,611 3,055,611 2009 1,635,000 1,420,196 3,055,196 2010 to 2014 9,010,000 6,364,636 15,374,636 2015 to 2019 11,620,000 4,457,297 16,077,297 2020 to 2024 14,530,000 1,686,426 16,216,426
43,000,000$ 19,938,549$ 62,938,549$
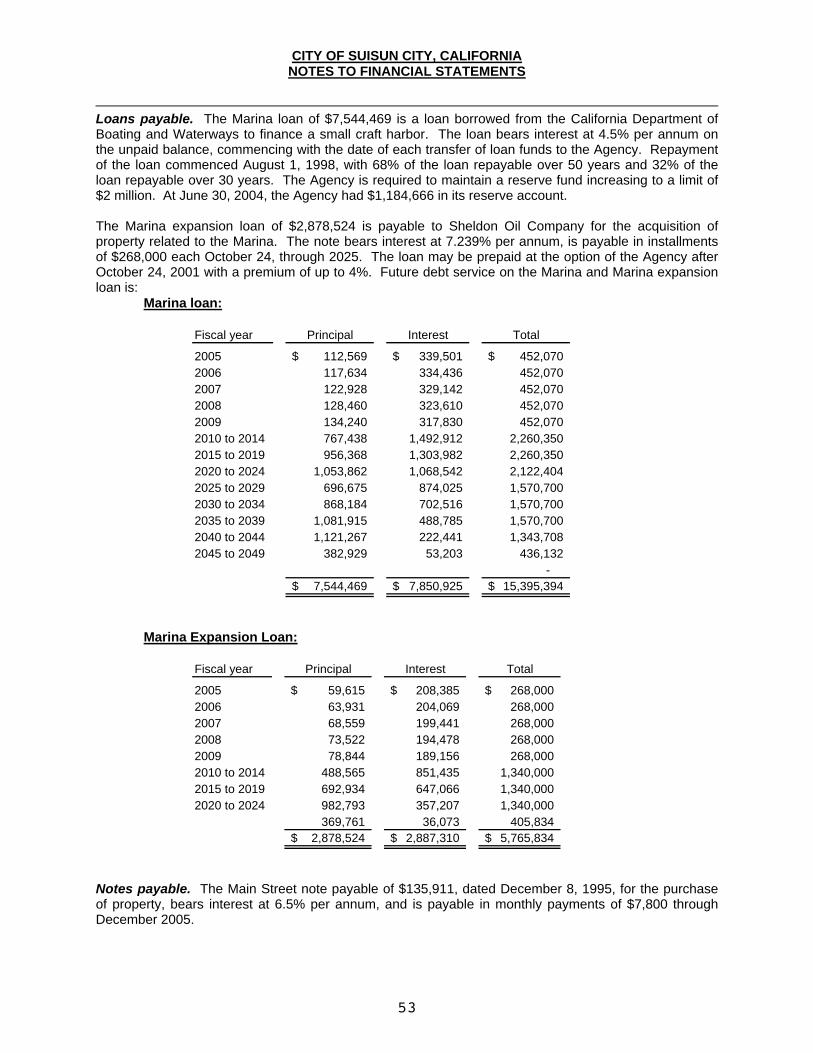
CITY OF SUISUN CITY, CALIFORNIA NOTES TO FINANCIAL STATEMENTS
53
Loans payable. The Marina loan of $7,544,469 is a loan borrowed from the California Department of Boating and Waterways to finance a small craft harbor. The loan bears interest at 4.5% per annum on the unpaid balance, commencing with the date of each transfer of loan funds to the Agency. Repayment of the loan commenced August 1, 1998, with 68% of the loan repayable over 50 years and 32% of the loan repayable over 30 years. The Agency is required to maintain a reserve fund increasing to a limit of $2 million. At June 30, 2004, the Agency had $1,184,666 in its reserve account. The Marina expansion loan of $2,878,524 is payable to Sheldon Oil Company for the acquisition of property related to the Marina. The note bears interest at 7.239% per annum, is payable in installments of $268,000 each October 24, through 2025. The loan may be prepaid at the option of the Agency after October 24, 2001 with a premium of up to 4%. Future debt service on the Marina and Marina expansion loan is: Marina loan:
Fiscal year Principal Interest Total
2005 112,569$ 339,501$ 452,070$ 2006 117,634 334,436 452,070 2007 122,928 329,142 452,070 2008 128,460 323,610 452,070 2009 134,240 317,830 452,070 2010 to 2014 767,438 1,492,912 2,260,350 2015 to 2019 956,368 1,303,982 2,260,350 2020 to 2024 1,053,862 1,068,542 2,122,404 2025 to 2029 696,675 874,025 1,570,700 2030 to 2034 868,184 702,516 1,570,700 2035 to 2039 1,081,915 488,785 1,570,700 2040 to 2044 1,121,267 222,441 1,343,708 2045 to 2049 382,929 53,203 436,132
- 7,544,469$ 7,850,925$ 15,395,394$
Marina Expansion Loan:
Fiscal year Principal Interest Total
2005 59,615$ 208,385$ 268,000$ 2006 63,931 204,069 268,000 2007 68,559 199,441 268,000 2008 73,522 194,478 268,000 2009 78,844 189,156 268,000 2010 to 2014 488,565 851,435 1,340,000 2015 to 2019 692,934 647,066 1,340,000 2020 to 2024 982,793 357,207 1,340,000
369,761 36,073 405,834 2,878,524$ 2,887,310$ 5,765,834$
Notes payable. The Main Street note payable of $135,911, dated December 8, 1995, for the purchase of property, bears interest at 6.5% per annum, and is payable in monthly payments of $7,800 through December 2005.
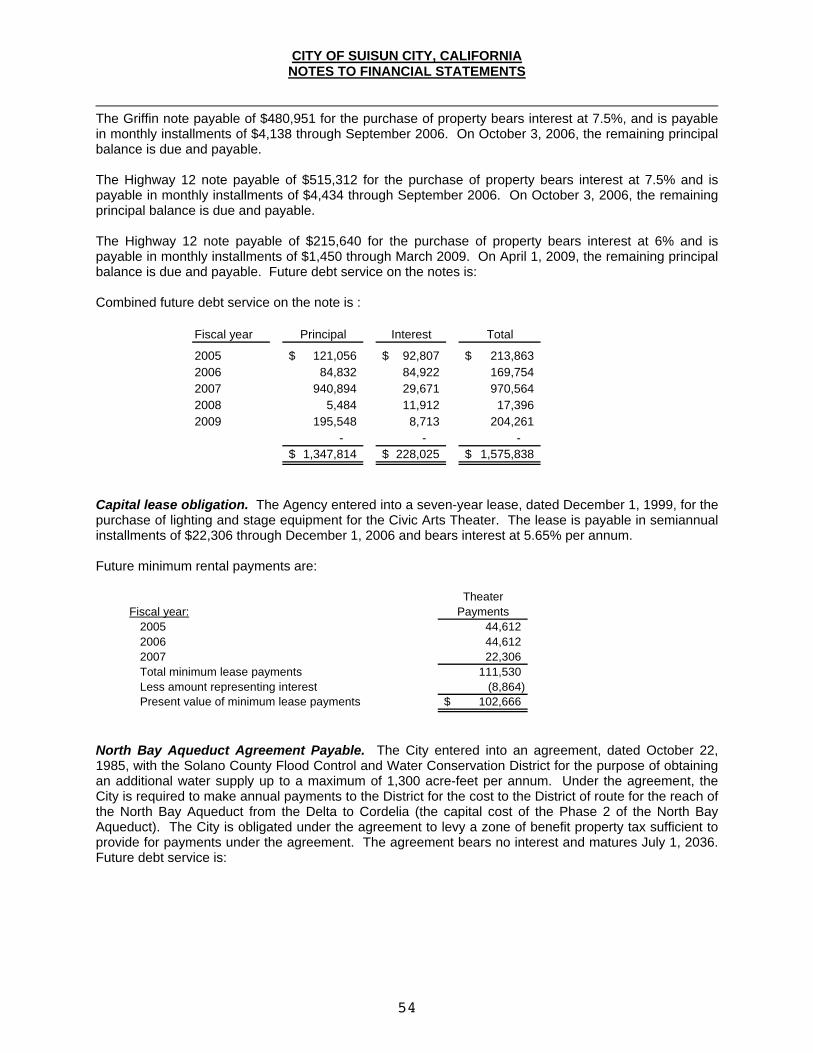
CITY OF SUISUN CITY, CALIFORNIA NOTES TO FINANCIAL STATEMENTS
54
The Griffin note payable of $480,951 for the purchase of property bears interest at 7.5%, and is payable in monthly installments of $4,138 through September 2006. On October 3, 2006, the remaining principal balance is due and payable. The Highway 12 note payable of $515,312 for the purchase of property bears interest at 7.5% and is payable in monthly installments of $4,434 through September 2006. On October 3, 2006, the remaining principal balance is due and payable. The Highway 12 note payable of $215,640 for the purchase of property bears interest at 6% and is payable in monthly installments of $1,450 through March 2009. On April 1, 2009, the remaining principal balance is due and payable. Future debt service on the notes is: Combined future debt service on the note is :
Fiscal year Principal Interest Total
2005 121,056$ 92,807$ 213,863$ 2006 84,832 84,922 169,754 2007 940,894 29,671 970,564 2008 5,484 11,912 17,396 2009 195,548 8,713 204,261
- - - 1,347,814$ 228,025$ 1,575,838$
Capital lease obligation. The Agency entered into a seven-year lease, dated December 1, 1999, for the purchase of lighting and stage equipment for the Civic Arts Theater. The lease is payable in semiannual installments of $22,306 through December 1, 2006 and bears interest at 5.65% per annum. Future minimum rental payments are:
TheaterFiscal year: Payments
2005 44,612 2006 44,612 2007 22,306 Total minimum lease payments 111,530 Less amount representing interest (8,864) Present value of minimum lease payments 102,666$
North Bay Aqueduct Agreement Payable. The City entered into an agreement, dated October 22, 1985, with the Solano County Flood Control and Water Conservation District for the purpose of obtaining an additional water supply up to a maximum of 1,300 acre-feet per annum. Under the agreement, the City is required to make annual payments to the District for the cost to the District of route for the reach of the North Bay Aqueduct from the Delta to Cordelia (the capital cost of the Phase 2 of the North Bay Aqueduct). The City is obligated under the agreement to levy a zone of benefit property tax sufficient to provide for payments under the agreement. The agreement bears no interest and matures July 1, 2036. Future debt service is:
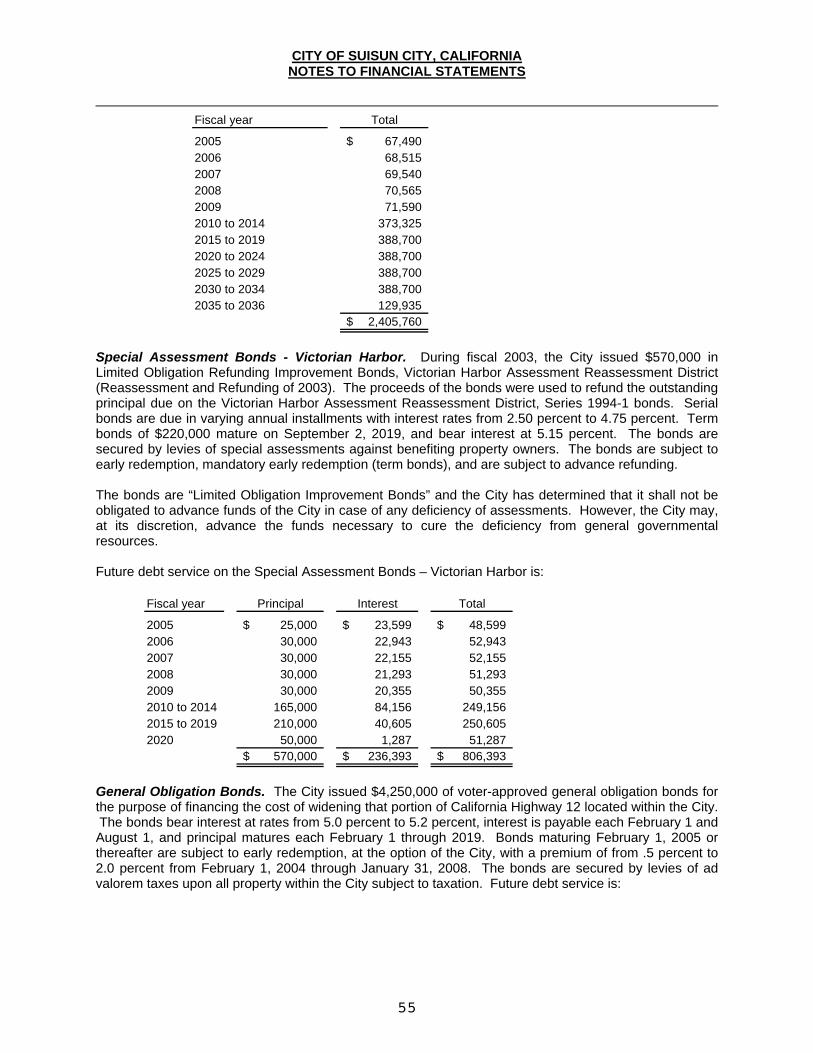
CITY OF SUISUN CITY, CALIFORNIA NOTES TO FINANCIAL STATEMENTS
55
Fiscal year Total
2005 67,490$ 2006 68,515 2007 69,540 2008 70,565 2009 71,590 2010 to 2014 373,325 2015 to 2019 388,700 2020 to 2024 388,700 2025 to 2029 388,700 2030 to 2034 388,700 2035 to 2036 129,935
2,405,760$
Special Assessment Bonds - Victorian Harbor. During fiscal 2003, the City issued $570,000 in Limited Obligation Refunding Improvement Bonds, Victorian Harbor Assessment Reassessment District (Reassessment and Refunding of 2003). The proceeds of the bonds were used to refund the outstanding principal due on the Victorian Harbor Assessment Reassessment District, Series 1994-1 bonds. Serial bonds are due in varying annual installments with interest rates from 2.50 percent to 4.75 percent. Term bonds of $220,000 mature on September 2, 2019, and bear interest at 5.15 percent. The bonds are secured by levies of special assessments against benefiting property owners. The bonds are subject to early redemption, mandatory early redemption (term bonds), and are subject to advance refunding.
The bonds are “Limited Obligation Improvement Bonds” and the City has determined that it shall not be obligated to advance funds of the City in case of any deficiency of assessments. However, the City may, at its discretion, advance the funds necessary to cure the deficiency from general governmental resources. Future debt service on the Special Assessment Bonds – Victorian Harbor is:
Fiscal year Principal Interest Total
2005 25,000$ 23,599$ 48,599$ 2006 30,000 22,943 52,943 2007 30,000 22,155 52,155 2008 30,000 21,293 51,293 2009 30,000 20,355 50,355 2010 to 2014 165,000 84,156 249,156 2015 to 2019 210,000 40,605 250,605 2020 50,000 1,287 51,287
570,000$ 236,393$ 806,393$
General Obligation Bonds. The City issued $4,250,000 of voter-approved general obligation bonds for the purpose of financing the cost of widening that portion of California Highway 12 located within the City. The bonds bear interest at rates from 5.0 percent to 5.2 percent, interest is payable each February 1 and August 1, and principal matures each February 1 through 2019. Bonds maturing February 1, 2005 or thereafter are subject to early redemption, at the option of the City, with a premium of from .5 percent to 2.0 percent from February 1, 2004 through January 31, 2008. The bonds are secured by levies of ad valorem taxes upon all property within the City subject to taxation. Future debt service is:
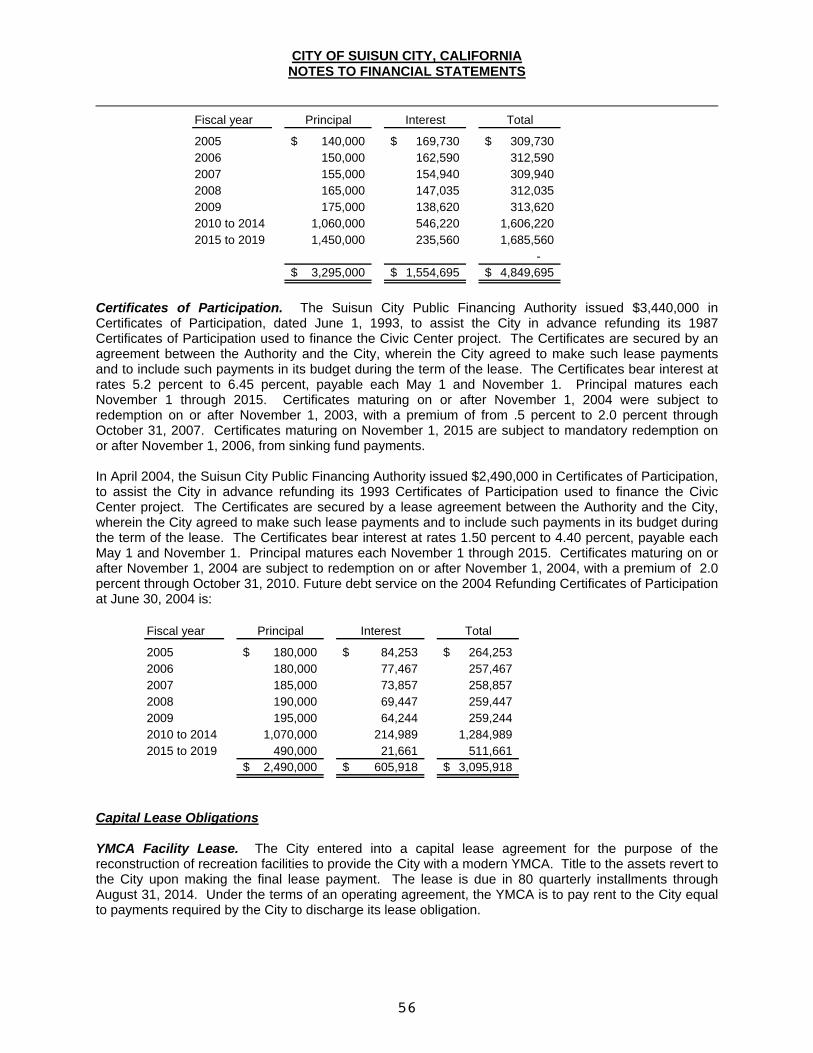
CITY OF SUISUN CITY, CALIFORNIA NOTES TO FINANCIAL STATEMENTS
56
Fiscal year Principal Interest Total
2005 140,000$ 169,730$ 309,730$ 2006 150,000 162,590 312,590 2007 155,000 154,940 309,940 2008 165,000 147,035 312,035 2009 175,000 138,620 313,620 2010 to 2014 1,060,000 546,220 1,606,220 2015 to 2019 1,450,000 235,560 1,685,560
- 3,295,000$ 1,554,695$ 4,849,695$
Certificates of Participation. The Suisun City Public Financing Authority issued $3,440,000 in Certificates of Participation, dated June 1, 1993, to assist the City in advance refunding its 1987 Certificates of Participation used to finance the Civic Center project. The Certificates are secured by an agreement between the Authority and the City, wherein the City agreed to make such lease payments and to include such payments in its budget during the term of the lease. The Certificates bear interest at rates 5.2 percent to 6.45 percent, payable each May 1 and November 1. Principal matures each November 1 through 2015. Certificates maturing on or after November 1, 2004 were subject to redemption on or after November 1, 2003, with a premium of from .5 percent to 2.0 percent through October 31, 2007. Certificates maturing on November 1, 2015 are subject to mandatory redemption on or after November 1, 2006, from sinking fund payments. In April 2004, the Suisun City Public Financing Authority issued $2,490,000 in Certificates of Participation, to assist the City in advance refunding its 1993 Certificates of Participation used to finance the Civic Center project. The Certificates are secured by a lease agreement between the Authority and the City, wherein the City agreed to make such lease payments and to include such payments in its budget during the term of the lease. The Certificates bear interest at rates 1.50 percent to 4.40 percent, payable each May 1 and November 1. Principal matures each November 1 through 2015. Certificates maturing on or after November 1, 2004 are subject to redemption on or after November 1, 2004, with a premium of 2.0 percent through October 31, 2010. Future debt service on the 2004 Refunding Certificates of Participation at June 30, 2004 is:
Fiscal year Principal Interest Total
2005 180,000$ 84,253$ 264,253$ 2006 180,000 77,467 257,467 2007 185,000 73,857 258,857 2008 190,000 69,447 259,447 2009 195,000 64,244 259,244 2010 to 2014 1,070,000 214,989 1,284,989 2015 to 2019 490,000 21,661 511,661
2,490,000$ 605,918$ 3,095,918$
Capital Lease Obligations YMCA Facility Lease. The City entered into a capital lease agreement for the purpose of the reconstruction of recreation facilities to provide the City with a modern YMCA. Title to the assets revert to the City upon making the final lease payment. The lease is due in 80 quarterly installments through August 31, 2014. Under the terms of an operating agreement, the YMCA is to pay rent to the City equal to payments required by the City to discharge its lease obligation.
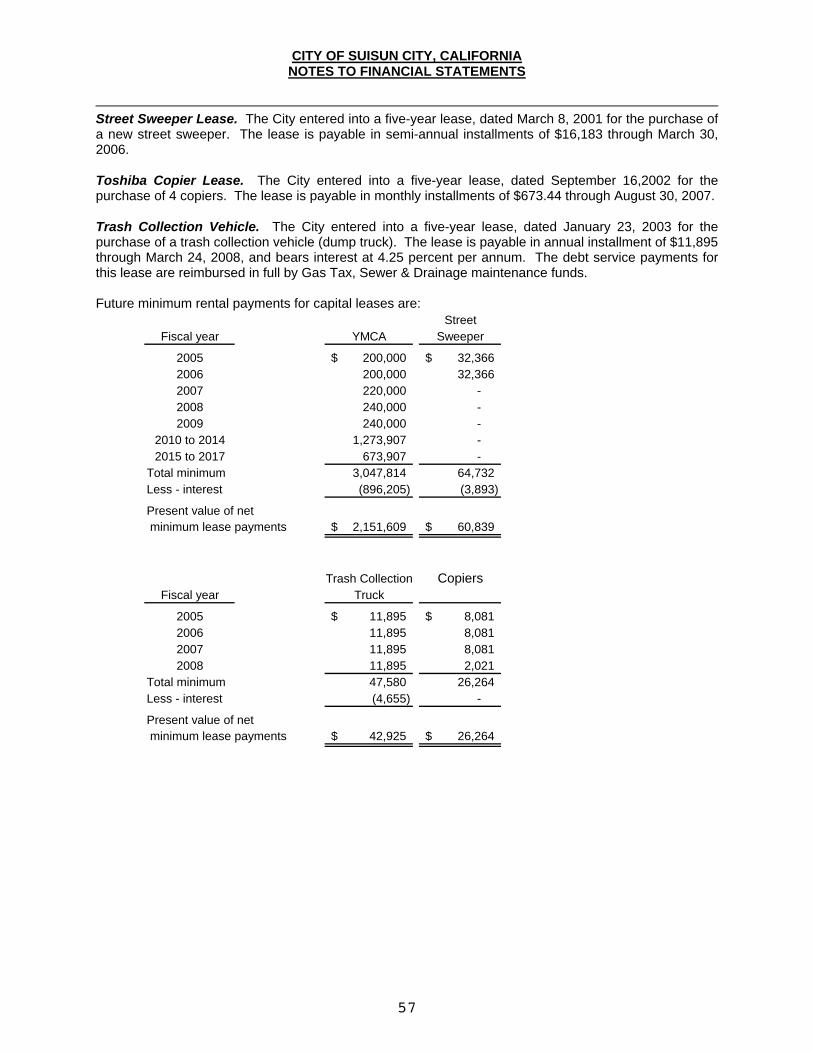
CITY OF SUISUN CITY, CALIFORNIA NOTES TO FINANCIAL STATEMENTS
57
Street Sweeper Lease. The City entered into a five-year lease, dated March 8, 2001 for the purchase of a new street sweeper. The lease is payable in semi-annual installments of $16,183 through March 30, 2006. Toshiba Copier Lease. The City entered into a five-year lease, dated September 16,2002 for the purchase of 4 copiers. The lease is payable in monthly installments of $673.44 through August 30, 2007. Trash Collection Vehicle. The City entered into a five-year lease, dated January 23, 2003 for the purchase of a trash collection vehicle (dump truck). The lease is payable in annual installment of $11,895 through March 24, 2008, and bears interest at 4.25 percent per annum. The debt service payments for this lease are reimbursed in full by Gas Tax, Sewer & Drainage maintenance funds. Future minimum rental payments for capital leases are:
StreetFiscal year YMCA Sweeper
2005 200,000$ 32,366$ 2006 200,000 32,366 2007 220,000 - 2008 240,000 - 2009 240,000 -
2010 to 2014 1,273,907 - 2015 to 2017 673,907 -
Total minimum 3,047,814 64,732 Less - interest (896,205) (3,893)
Present value of net minimum lease payments 2,151,609$ 60,839$
Trash Collection CopiersFiscal year Truck
2005 11,895$ 8,081$ 2006 11,895 8,081 2007 11,895 8,081 2008 11,895 2,021
Total minimum 47,580 26,264 Less - interest (4,655) -
Present value of net minimum lease payments 42,925$ 26,264$
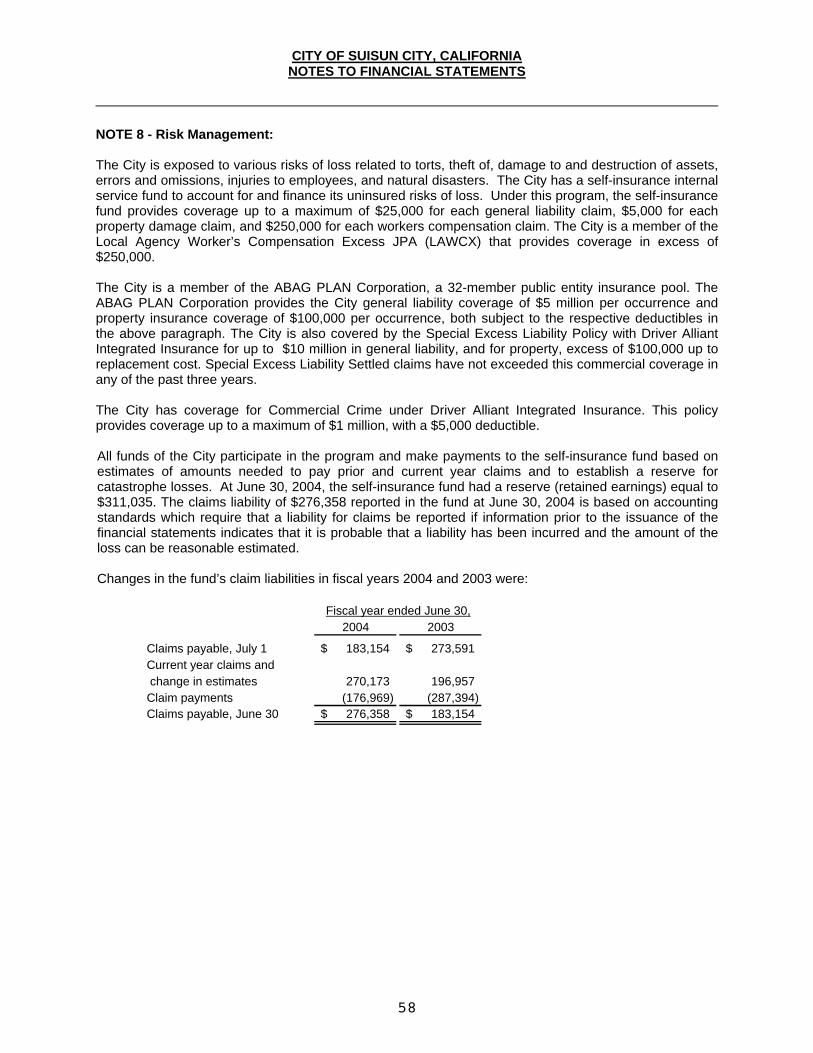
CITY OF SUISUN CITY, CALIFORNIA NOTES TO FINANCIAL STATEMENTS
58
NOTE 8 - Risk Management: The City is exposed to various risks of loss related to torts, theft of, damage to and destruction of assets, errors and omissions, injuries to employees, and natural disasters. The City has a self-insurance internal service fund to account for and finance its uninsured risks of loss. Under this program, the self-insurance fund provides coverage up to a maximum of $25,000 for each general liability claim, $5,000 for each property damage claim, and $250,000 for each workers compensation claim. The City is a member of the Local Agency Worker’s Compensation Excess JPA (LAWCX) that provides coverage in excess of $250,000. The City is a member of the ABAG PLAN Corporation, a 32-member public entity insurance pool. The ABAG PLAN Corporation provides the City general liability coverage of $5 million per occurrence and property insurance coverage of $100,000 per occurrence, both subject to the respective deductibles in the above paragraph. The City is also covered by the Special Excess Liability Policy with Driver Alliant Integrated Insurance for up to $10 million in general liability, and for property, excess of $100,000 up to replacement cost. Special Excess Liability Settled claims have not exceeded this commercial coverage in any of the past three years. The City has coverage for Commercial Crime under Driver Alliant Integrated Insurance. This policy provides coverage up to a maximum of $1 million, with a $5,000 deductible. All funds of the City participate in the program and make payments to the self-insurance fund based on estimates of amounts needed to pay prior and current year claims and to establish a reserve for catastrophe losses. At June 30, 2004, the self-insurance fund had a reserve (retained earnings) equal to $311,035. The claims liability of $276,358 reported in the fund at June 30, 2004 is based on accounting standards which require that a liability for claims be reported if information prior to the issuance of the financial statements indicates that it is probable that a liability has been incurred and the amount of the loss can be reasonable estimated. Changes in the fund’s claim liabilities in fiscal years 2004 and 2003 were:
2004 2003
Claims payable, July 1 183,154$ 273,591$ Current year claims and change in estimates 270,173 196,957 Claim payments (176,969) (287,394) Claims payable, June 30 276,358$ 183,154$
Fiscal year ended June 30,
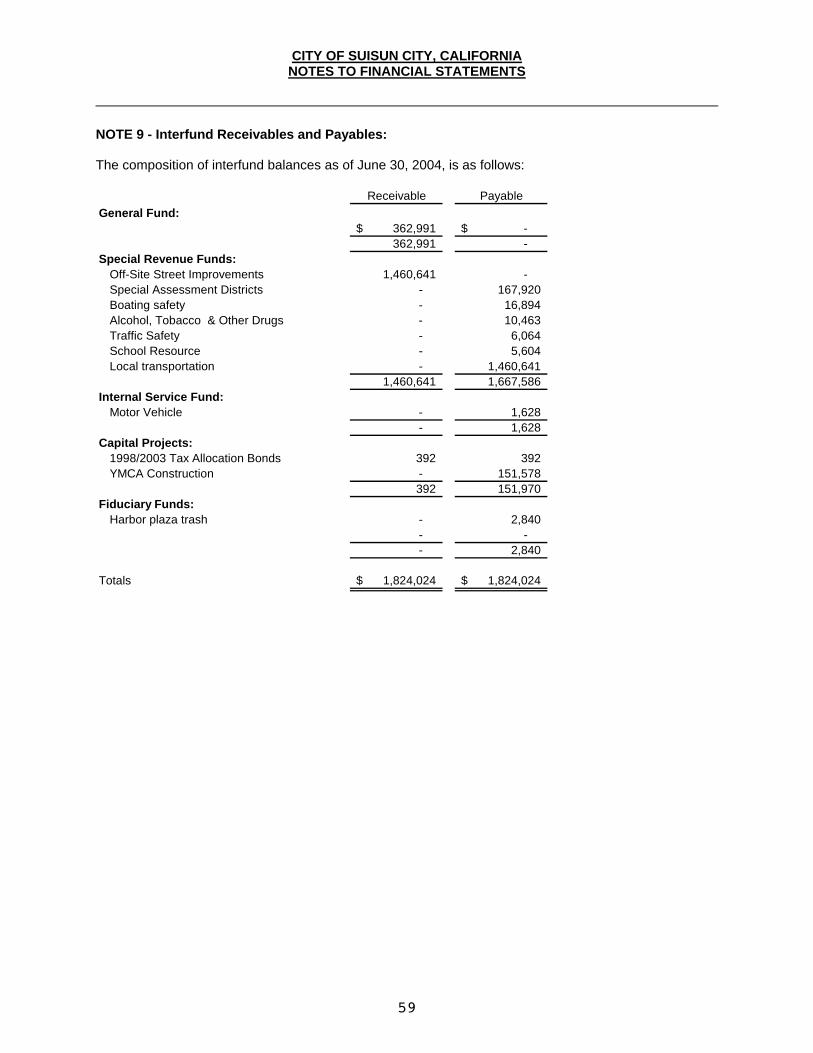
CITY OF SUISUN CITY, CALIFORNIA NOTES TO FINANCIAL STATEMENTS
59
NOTE 9 - Interfund Receivables and Payables: The composition of interfund balances as of June 30, 2004, is as follows:
Receivable PayableGeneral Fund: 362,991$ -$
362,991 - Special Revenue Funds:
Off-Site Street Improvements 1,460,641 - Special Assessment Districts - 167,920 Boating safety - 16,894 Alcohol, Tobacco & Other Drugs - 10,463 Traffic Safety - 6,064 School Resource - 5,604 Local transportation - 1,460,641
1,460,641 1,667,586 Internal Service Fund:
Motor Vehicle - 1,628 - 1,628
Capital Projects:1998/2003 Tax Allocation Bonds 392 392 YMCA Construction - 151,578
392 151,970 Fiduciary Funds:
Harbor plaza trash - 2,840 - -
- 2,840
Totals 1,824,024$ 1,824,024$
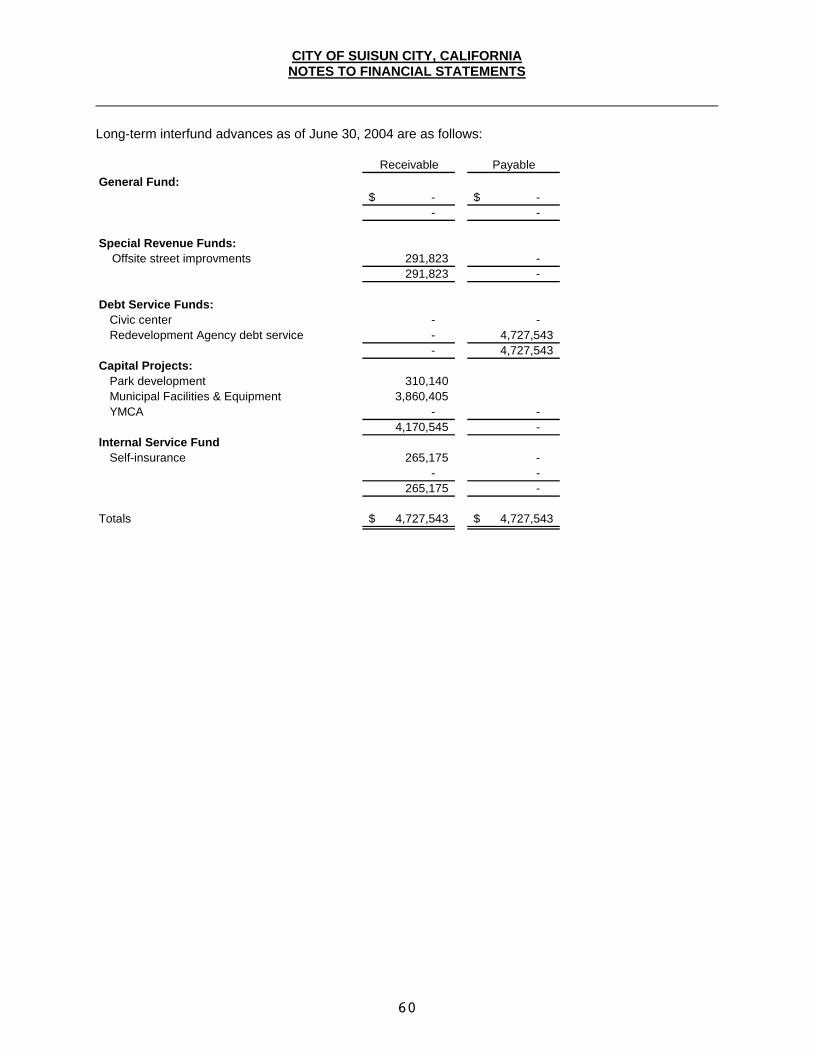
CITY OF SUISUN CITY, CALIFORNIA NOTES TO FINANCIAL STATEMENTS
60
Long-term interfund advances as of June 30, 2004 are as follows:
Receivable PayableGeneral Fund: -$ -$
- -
Special Revenue Funds: Offsite street improvments 291,823 -
291,823 -
Debt Service Funds:Civic center - - Redevelopment Agency debt service - 4,727,543
- 4,727,543 Capital Projects:
Park development 310,140 Municipal Facilities & Equipment 3,860,405 YMCA - -
4,170,545 - Internal Service Fund
Self-insurance 265,175 - - -
265,175 -
Totals 4,727,543$ 4,727,543$
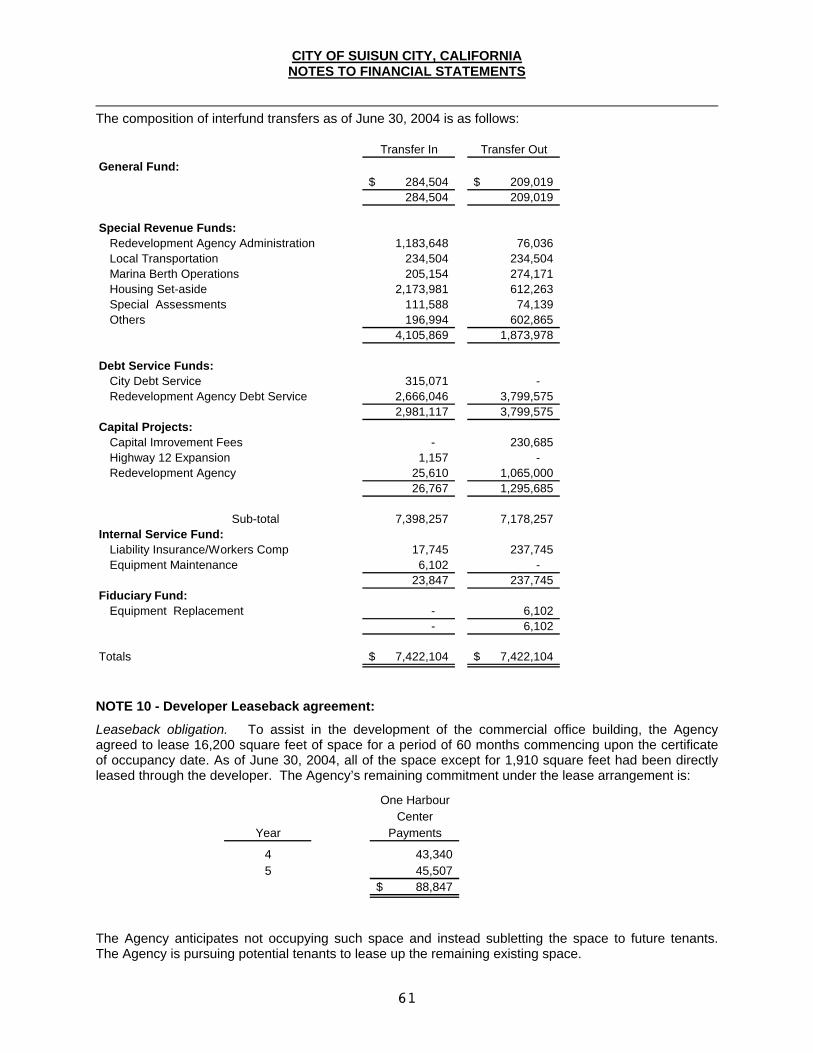
CITY OF SUISUN CITY, CALIFORNIA NOTES TO FINANCIAL STATEMENTS
61
The composition of interfund transfers as of June 30, 2004 is as follows:
Transfer In Transfer OutGeneral Fund: 284,504$ 209,019$
284,504 209,019
Special Revenue Funds:Redevelopment Agency Administration 1,183,648 76,036 Local Transportation 234,504 234,504 Marina Berth Operations 205,154 274,171 Housing Set-aside 2,173,981 612,263 Special Assessments 111,588 74,139 Others 196,994 602,865
4,105,869 1,873,978
Debt Service Funds:City Debt Service 315,071 - Redevelopment Agency Debt Service 2,666,046 3,799,575
2,981,117 3,799,575 Capital Projects:
Capital Imrovement Fees - 230,685 Highway 12 Expansion 1,157 - Redevelopment Agency 25,610 1,065,000
26,767 1,295,685
Sub-total 7,398,257 7,178,257 Internal Service Fund:
Liability Insurance/Workers Comp 17,745 237,745 Equipment Maintenance 6,102 -
23,847 237,745 Fiduciary Fund:
Equipment Replacement - 6,102 - 6,102
Totals 7,422,104$ 7,422,104$
NOTE 10 - Developer Leaseback agreement:
Leaseback obligation. To assist in the development of the commercial office building, the Agency agreed to lease 16,200 square feet of space for a period of 60 months commencing upon the certificate of occupancy date. As of June 30, 2004, all of the space except for 1,910 square feet had been directly leased through the developer. The Agency’s remaining commitment under the lease arrangement is:
One HarbourCenter
Year Payments
4 43,340 5 45,507
88,847$
The Agency anticipates not occupying such space and instead subletting the space to future tenants. The Agency is pursuing potential tenants to lease up the remaining existing space.
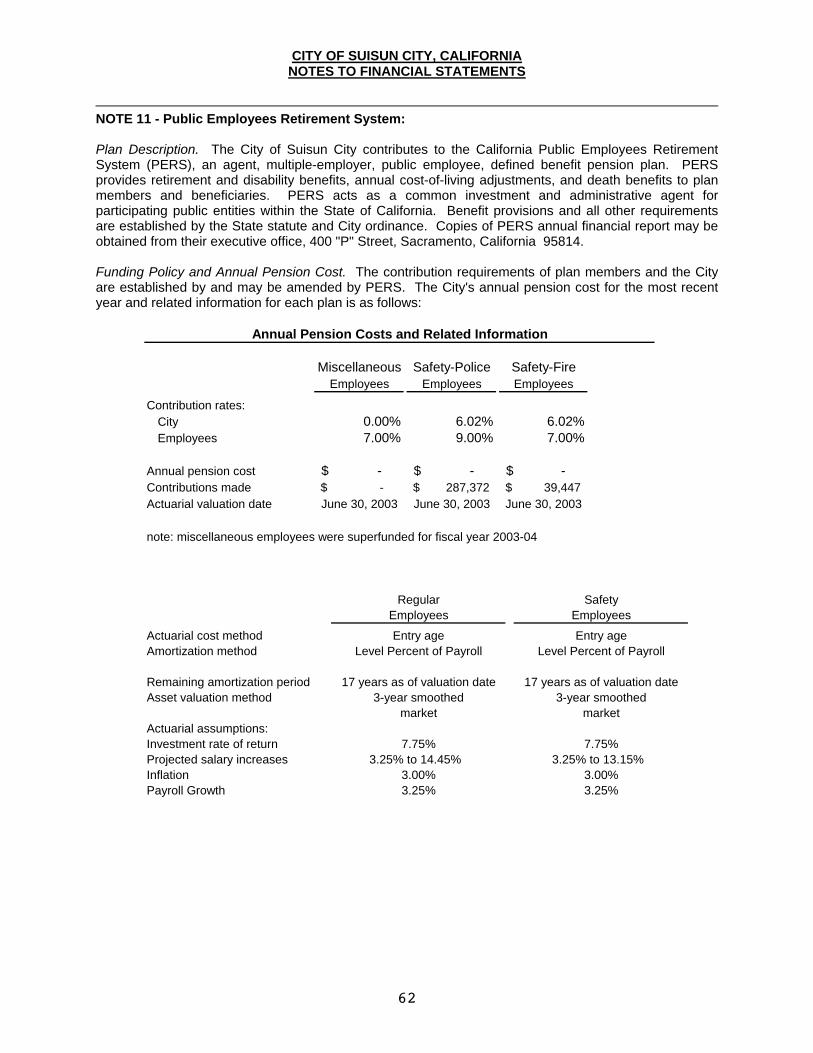
CITY OF SUISUN CITY, CALIFORNIA NOTES TO FINANCIAL STATEMENTS
62
NOTE 11 - Public Employees Retirement System: Plan Description. The City of Suisun City contributes to the California Public Employees Retirement System (PERS), an agent, multiple-employer, public employee, defined benefit pension plan. PERS provides retirement and disability benefits, annual cost-of-living adjustments, and death benefits to plan members and beneficiaries. PERS acts as a common investment and administrative agent for participating public entities within the State of California. Benefit provisions and all other requirements are established by the State statute and City ordinance. Copies of PERS annual financial report may be obtained from their executive office, 400 "P" Street, Sacramento, California 95814. Funding Policy and Annual Pension Cost. The contribution requirements of plan members and the City are established by and may be amended by PERS. The City's annual pension cost for the most recent year and related information for each plan is as follows:
Miscellaneous Safety-Police Safety-FireEmployees Employees Employees
Contribution rates:City 0.00% 6.02% 6.02%Employees 7.00% 9.00% 7.00%
Annual pension cost -$ -$ -$ Contributions made -$ 287,372$ 39,447$ Actuarial valuation date June 30, 2003 June 30, 2003 June 30, 2003
note: miscellaneous employees were superfunded for fiscal year 2003-04
Annual Pension Costs and Related Information
Regular SafetyEmployees Employees
Actuarial cost method Entry age Entry ageAmortization method Level Percent of Payroll Level Percent of Payroll Remaining amortization period 17 years as of valuation date 17 years as of valuation dateAsset valuation method 3-year smoothed 3-year smoothed
market marketActuarial assumptions:Investment rate of return 7.75% 7.75%Projected salary increases 3.25% to 14.45% 3.25% to 13.15% Inflation 3.00% 3.00%Payroll Growth 3.25% 3.25%
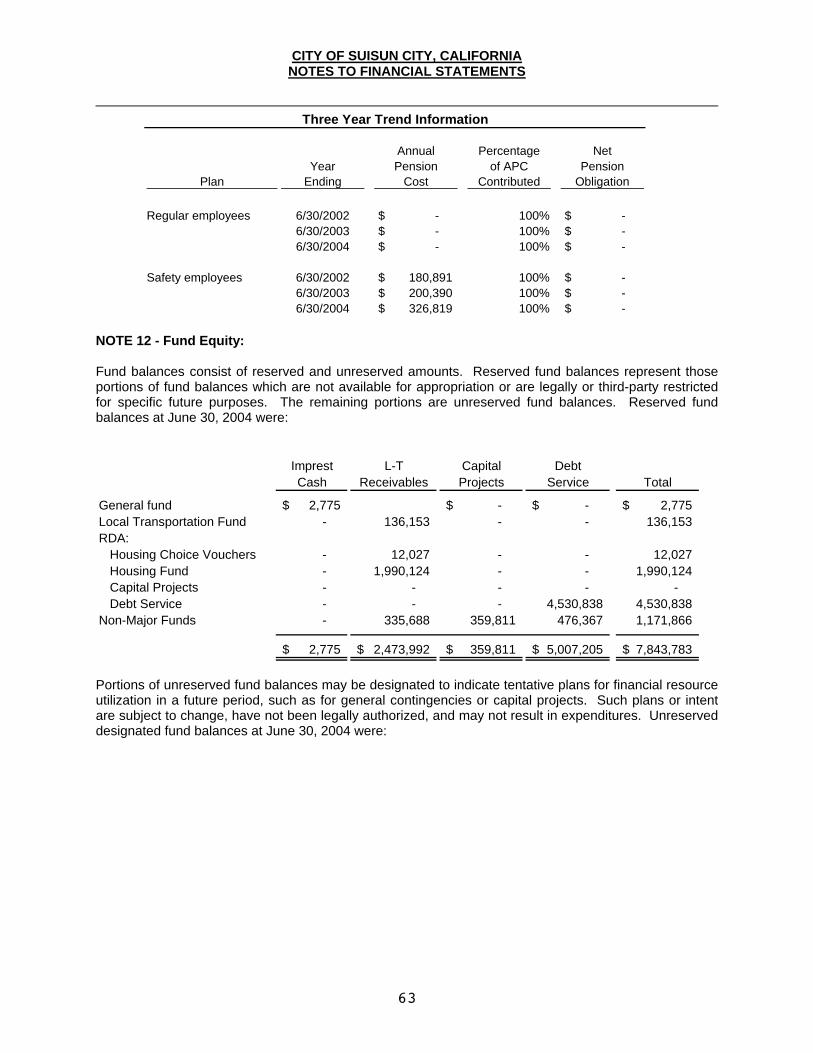
CITY OF SUISUN CITY, CALIFORNIA NOTES TO FINANCIAL STATEMENTS
63
Annual Percentage NetYear Pension of APC Pension
Ending Cost Contributed Obligation
Regular employees 6/30/2002 -$ 100% -$ 6/30/2003 -$ 100% -$ 6/30/2004 -$ 100% -$
Safety employees 6/30/2002 180,891$ 100% -$ 6/30/2003 200,390$ 100% -$ 6/30/2004 326,819$ 100% -$
Plan
Three Year Trend Information
NOTE 12 - Fund Equity: Fund balances consist of reserved and unreserved amounts. Reserved fund balances represent those portions of fund balances which are not available for appropriation or are legally or third-party restricted for specific future purposes. The remaining portions are unreserved fund balances. Reserved fund balances at June 30, 2004 were:
Imprest L-T Capital Debt Cash Receivables Projects Service Total
General fund 2,775$ -$ -$ 2,775$ Local Transportation Fund - 136,153 - - 136,153 RDA:
Housing Choice Vouchers - 12,027 - - 12,027 Housing Fund - 1,990,124 - - 1,990,124 Capital Projects - - - - - Debt Service - - - 4,530,838 4,530,838
Non-Major Funds - 335,688 359,811 476,367 1,171,866
2,775$ 2,473,992$ 359,811$ 5,007,205$ 7,843,783$
Portions of unreserved fund balances may be designated to indicate tentative plans for financial resource utilization in a future period, such as for general contingencies or capital projects. Such plans or intent are subject to change, have not been legally authorized, and may not result in expenditures. Unreserved designated fund balances at June 30, 2004 were:
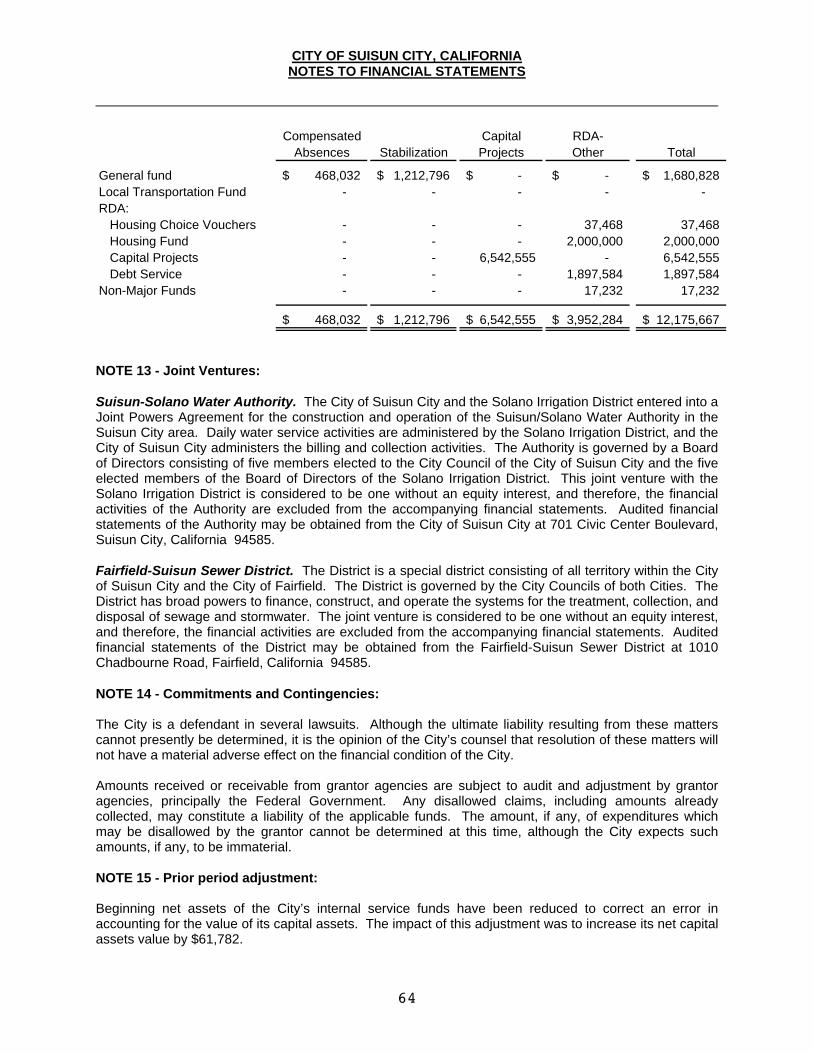
CITY OF SUISUN CITY, CALIFORNIA NOTES TO FINANCIAL STATEMENTS
64
Compensated Capital RDA-
Absences Stabilization Projects Other Total
General fund 468,032$ 1,212,796$ -$ -$ 1,680,828$ Local Transportation Fund - - - - - RDA:
Housing Choice Vouchers - - - 37,468 37,468 Housing Fund - - - 2,000,000 2,000,000 Capital Projects - - 6,542,555 - 6,542,555 Debt Service - - - 1,897,584 1,897,584
Non-Major Funds - - - 17,232 17,232
468,032$ 1,212,796$ 6,542,555$ 3,952,284$ 12,175,667$
NOTE 13 - Joint Ventures: Suisun-Solano Water Authority. The City of Suisun City and the Solano Irrigation District entered into a Joint Powers Agreement for the construction and operation of the Suisun/Solano Water Authority in the Suisun City area. Daily water service activities are administered by the Solano Irrigation District, and the City of Suisun City administers the billing and collection activities. The Authority is governed by a Board of Directors consisting of five members elected to the City Council of the City of Suisun City and the five elected members of the Board of Directors of the Solano Irrigation District. This joint venture with the Solano Irrigation District is considered to be one without an equity interest, and therefore, the financial activities of the Authority are excluded from the accompanying financial statements. Audited financial statements of the Authority may be obtained from the City of Suisun City at 701 Civic Center Boulevard, Suisun City, California 94585. Fairfield-Suisun Sewer District. The District is a special district consisting of all territory within the City of Suisun City and the City of Fairfield. The District is governed by the City Councils of both Cities. The District has broad powers to finance, construct, and operate the systems for the treatment, collection, and disposal of sewage and stormwater. The joint venture is considered to be one without an equity interest, and therefore, the financial activities are excluded from the accompanying financial statements. Audited financial statements of the District may be obtained from the Fairfield-Suisun Sewer District at 1010 Chadbourne Road, Fairfield, California 94585. NOTE 14 - Commitments and Contingencies: The City is a defendant in several lawsuits. Although the ultimate liability resulting from these matters cannot presently be determined, it is the opinion of the City’s counsel that resolution of these matters will not have a material adverse effect on the financial condition of the City. Amounts received or receivable from grantor agencies are subject to audit and adjustment by grantor agencies, principally the Federal Government. Any disallowed claims, including amounts already collected, may constitute a liability of the applicable funds. The amount, if any, of expenditures which may be disallowed by the grantor cannot be determined at this time, although the City expects such amounts, if any, to be immaterial. NOTE 15 - Prior period adjustment: Beginning net assets of the City’s internal service funds have been reduced to correct an error in accounting for the value of its capital assets. The impact of this adjustment was to increase its net capital assets value by $61,782.

CITY OF SUISUN CITY, CALIFORNIA NOTES TO FINANCIAL STATEMENTS
65
NOTE 16 - Excess of Expenditures Over Appropriations: The following expenditure categories in major funds had an excess of expenditures over appropriations for the fiscal year ended June 30, 2004:
Exceeded Budget By
General Fund:Public Safety 76,877$ Capital Outlay 8,165
Housing Authority Choice Vouchers:
Community Development 291,094 RDA Bonds Debt Service:
Community Development 281,897 Intergovernmental 206,195 Principal debt service 810,986
The excess expenditures were funded by available financial resources.
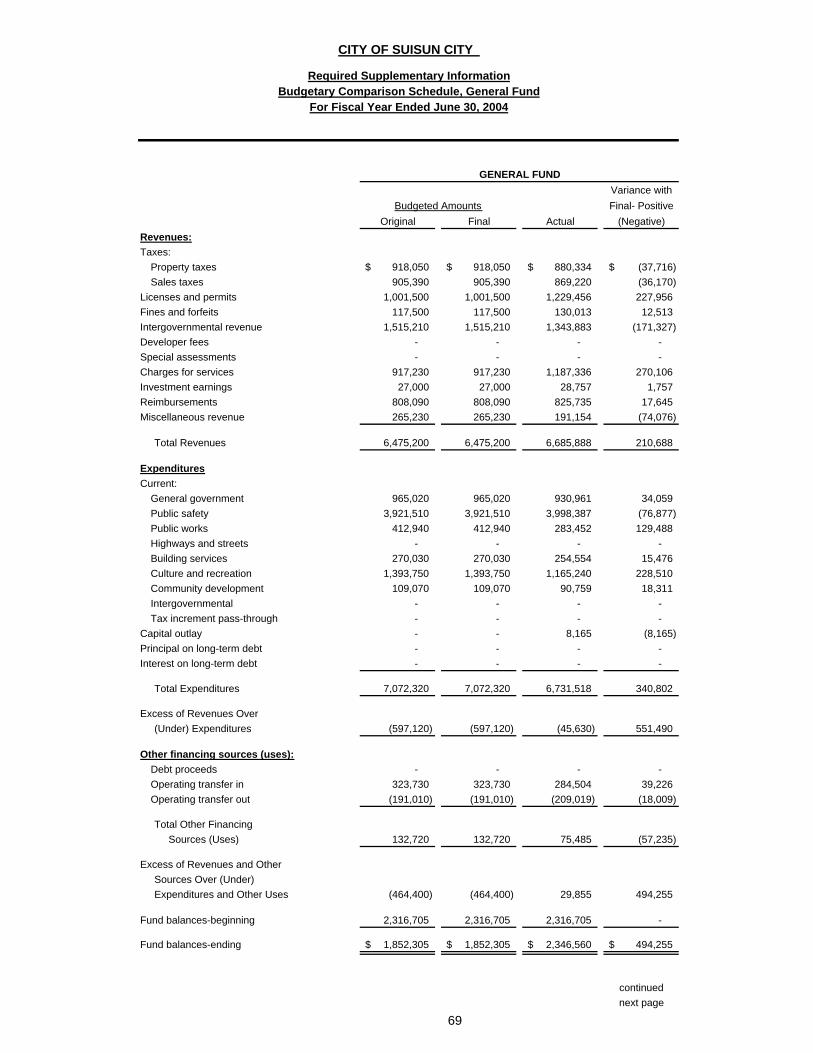
Variance withFinal- Positive
Original Final Actual (Negative)Revenues:Taxes:
Property taxes 918,050$ 918,050$ 880,334$ (37,716)$ Sales taxes 905,390 905,390 869,220 (36,170)
Licenses and permits 1,001,500 1,001,500 1,229,456 227,956 Fines and forfeits 117,500 117,500 130,013 12,513 Intergovernmental revenue 1,515,210 1,515,210 1,343,883 (171,327) Developer fees - - - - Special assessments - - - - Charges for services 917,230 917,230 1,187,336 270,106 Investment earnings 27,000 27,000 28,757 1,757 Reimbursements 808,090 808,090 825,735 17,645 Miscellaneous revenue 265,230 265,230 191,154 (74,076)
Total Revenues 6,475,200 6,475,200 6,685,888 210,688
ExpendituresCurrent:
General government 965,020 965,020 930,961 34,059 Public safety 3,921,510 3,921,510 3,998,387 (76,877) Public works 412,940 412,940 283,452 129,488 Highways and streets - - - - Building services 270,030 270,030 254,554 15,476 Culture and recreation 1,393,750 1,393,750 1,165,240 228,510 Community development 109,070 109,070 90,759 18,311 Intergovernmental - - - - Tax increment pass-through - - - -
Capital outlay - - 8,165 (8,165) Principal on long-term debt - - - - Interest on long-term debt - - - -
Total Expenditures 7,072,320 7,072,320 6,731,518 340,802
Excess of Revenues Over (Under) Expenditures (597,120) (597,120) (45,630) 551,490
Other financing sources (uses):Debt proceeds - - - - Operating transfer in 323,730 323,730 284,504 39,226 Operating transfer out (191,010) (191,010) (209,019) (18,009)
Total Other Financing Sources (Uses) 132,720 132,720 75,485 (57,235)
Excess of Revenues and Other Sources Over (Under) Expenditures and Other Uses (464,400) (464,400) 29,855 494,255
Fund balances-beginning 2,316,705 2,316,705 2,316,705 -
Fund balances-ending 1,852,305$ 1,852,305$ 2,346,560$ 494,255$
continuednext page
69
Budgeted Amounts
Budgetary Comparison Schedule, General FundFor Fiscal Year Ended June 30, 2004
GENERAL FUND
CITY OF SUISUN CITY
Required Supplementary Information
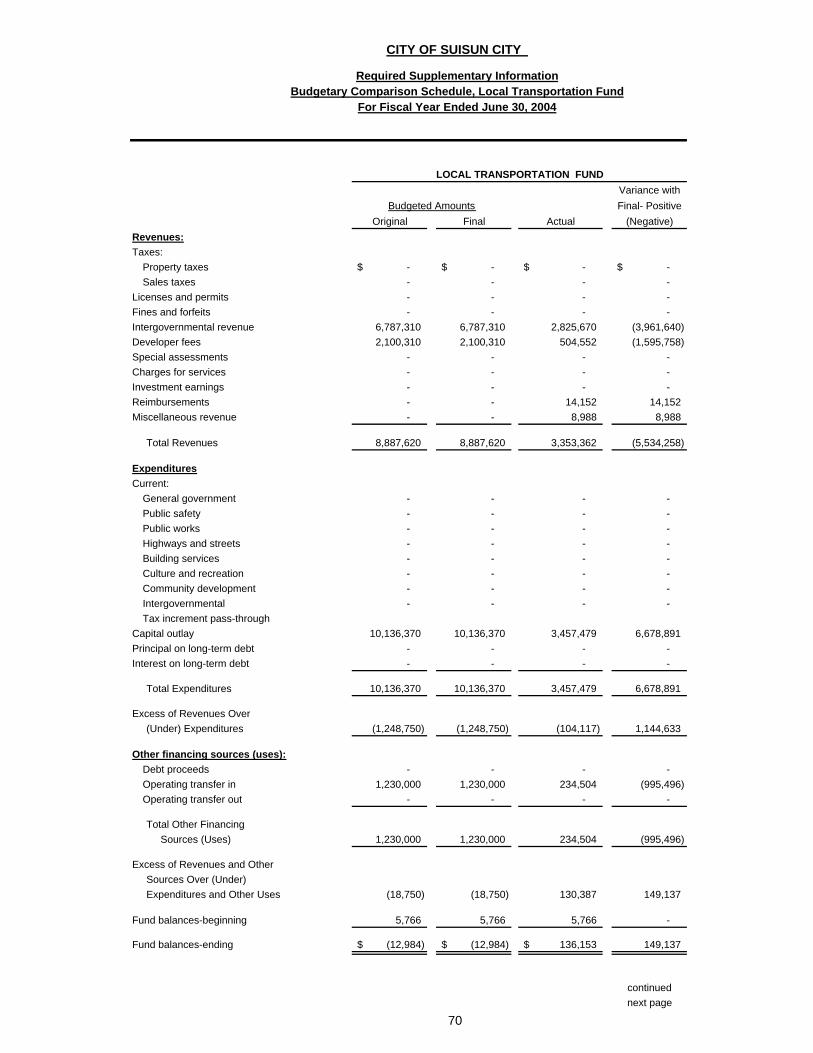
Variance withFinal- Positive
Original Final Actual (Negative)Revenues:Taxes:
Property taxes -$ -$ -$ -$ Sales taxes - - - -
Licenses and permits - - - - Fines and forfeits - - - - Intergovernmental revenue 6,787,310 6,787,310 2,825,670 (3,961,640) Developer fees 2,100,310 2,100,310 504,552 (1,595,758) Special assessments - - - - Charges for services - - - - Investment earnings - - - - Reimbursements - - 14,152 14,152 Miscellaneous revenue - - 8,988 8,988
Total Revenues 8,887,620 8,887,620 3,353,362 (5,534,258)
ExpendituresCurrent:
General government - - - - Public safety - - - - Public works - - - - Highways and streets - - - - Building services - - - - Culture and recreation - - - - Community development - - - - Intergovernmental - - - - Tax increment pass-through
Capital outlay 10,136,370 10,136,370 3,457,479 6,678,891 Principal on long-term debt - - - - Interest on long-term debt - - - -
Total Expenditures 10,136,370 10,136,370 3,457,479 6,678,891
Excess of Revenues Over (Under) Expenditures (1,248,750) (1,248,750) (104,117) 1,144,633
Other financing sources (uses):Debt proceeds - - - - Operating transfer in 1,230,000 1,230,000 234,504 (995,496) Operating transfer out - - - -
Total Other Financing Sources (Uses) 1,230,000 1,230,000 234,504 (995,496)
Excess of Revenues and Other Sources Over (Under) Expenditures and Other Uses (18,750) (18,750) 130,387 149,137
Fund balances-beginning 5,766 5,766 5,766 -
Fund balances-ending (12,984)$ (12,984)$ 136,153$ 149,137
continuednext page
70
Budgeted Amounts
Budgetary Comparison Schedule, Local Transportation FundFor Fiscal Year Ended June 30, 2004
LOCAL TRANSPORTATION FUND
CITY OF SUISUN CITY
Required Supplementary Information
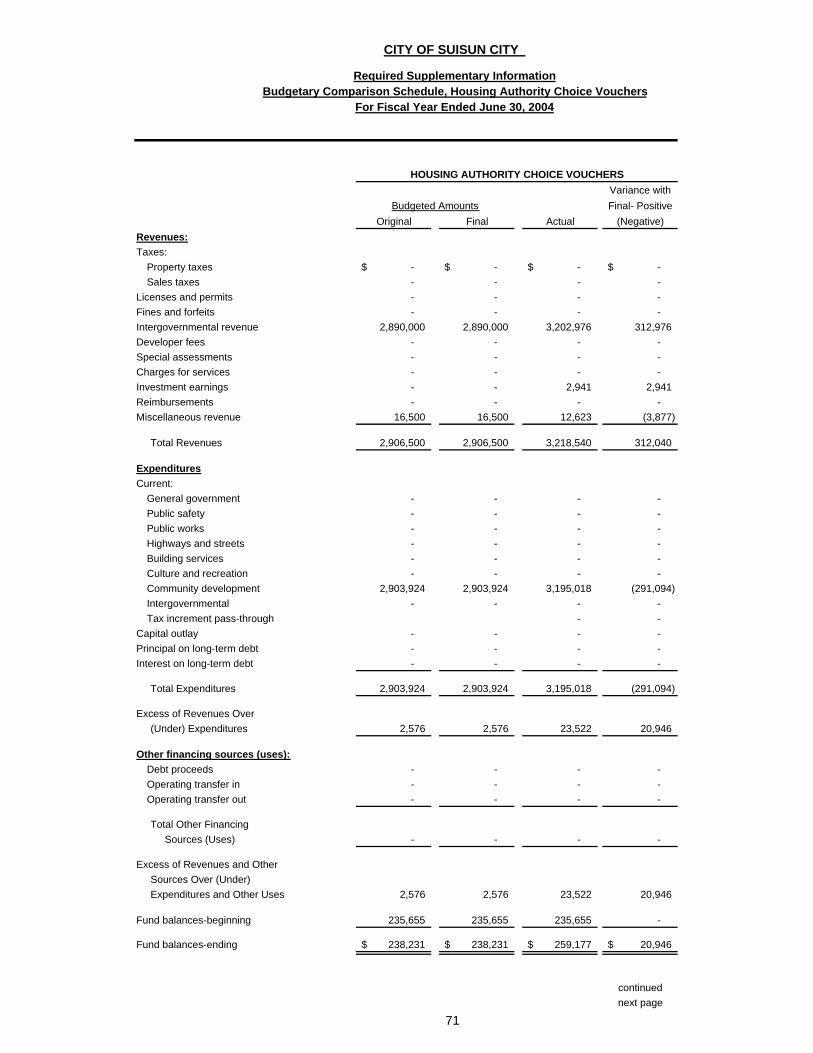
Variance withFinal- Positive
Original Final Actual (Negative)Revenues:Taxes:
Property taxes -$ -$ -$ -$ Sales taxes - - - -
Licenses and permits - - - - Fines and forfeits - - - - Intergovernmental revenue 2,890,000 2,890,000 3,202,976 312,976 Developer fees - - - - Special assessments - - - - Charges for services - - - - Investment earnings - - 2,941 2,941 Reimbursements - - - - Miscellaneous revenue 16,500 16,500 12,623 (3,877)
Total Revenues 2,906,500 2,906,500 3,218,540 312,040
ExpendituresCurrent:
General government - - - - Public safety - - - - Public works - - - - Highways and streets - - - - Building services - - - - Culture and recreation - - - - Community development 2,903,924 2,903,924 3,195,018 (291,094) Intergovernmental - - - - Tax increment pass-through - -
Capital outlay - - - - Principal on long-term debt - - - - Interest on long-term debt - - - -
Total Expenditures 2,903,924 2,903,924 3,195,018 (291,094)
Excess of Revenues Over (Under) Expenditures 2,576 2,576 23,522 20,946
Other financing sources (uses):Debt proceeds - - - - Operating transfer in - - - - Operating transfer out - - - -
Total Other Financing Sources (Uses) - - - -
Excess of Revenues and Other Sources Over (Under) Expenditures and Other Uses 2,576 2,576 23,522 20,946
Fund balances-beginning 235,655 235,655 235,655 -
Fund balances-ending 238,231$ 238,231$ 259,177$ 20,946$
continuednext page
CITY OF SUISUN CITY
Required Supplementary Information
71
For Fiscal Year Ended June 30, 2004
HOUSING AUTHORITY CHOICE VOUCHERS
Budgeted Amounts
Budgetary Comparison Schedule, Housing Authority Choice Vouchers
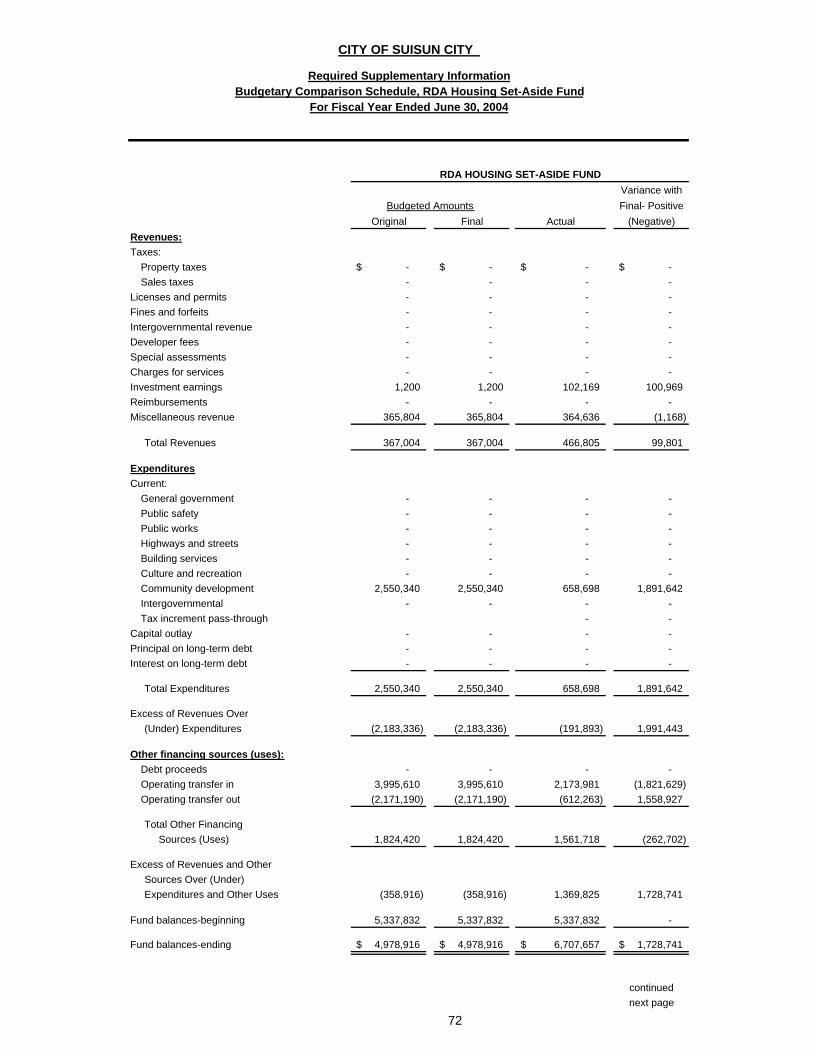
Variance withFinal- Positive
Original Final Actual (Negative)Revenues:Taxes:
Property taxes -$ -$ -$ -$ Sales taxes - - - -
Licenses and permits - - - - Fines and forfeits - - - - Intergovernmental revenue - - - - Developer fees - - - - Special assessments - - - - Charges for services - - - - Investment earnings 1,200 1,200 102,169 100,969 Reimbursements - - - - Miscellaneous revenue 365,804 365,804 364,636 (1,168)
Total Revenues 367,004 367,004 466,805 99,801
ExpendituresCurrent:
General government - - - - Public safety - - - - Public works - - - - Highways and streets - - - - Building services - - - - Culture and recreation - - - - Community development 2,550,340 2,550,340 658,698 1,891,642 Intergovernmental - - - - Tax increment pass-through - -
Capital outlay - - - - Principal on long-term debt - - - - Interest on long-term debt - - - -
Total Expenditures 2,550,340 2,550,340 658,698 1,891,642
Excess of Revenues Over (Under) Expenditures (2,183,336) (2,183,336) (191,893) 1,991,443
Other financing sources (uses):Debt proceeds - - - - Operating transfer in 3,995,610 3,995,610 2,173,981 (1,821,629) Operating transfer out (2,171,190) (2,171,190) (612,263) 1,558,927
Total Other Financing Sources (Uses) 1,824,420 1,824,420 1,561,718 (262,702)
Excess of Revenues and Other Sources Over (Under) Expenditures and Other Uses (358,916) (358,916) 1,369,825 1,728,741
Fund balances-beginning 5,337,832 5,337,832 5,337,832 -
Fund balances-ending 4,978,916$ 4,978,916$ 6,707,657$ 1,728,741$
continuednext page
72
RDA HOUSING SET-ASIDE FUND
Budgeted Amounts
CITY OF SUISUN CITY
Required Supplementary InformationBudgetary Comparison Schedule, RDA Housing Set-Aside Fund
For Fiscal Year Ended June 30, 2004
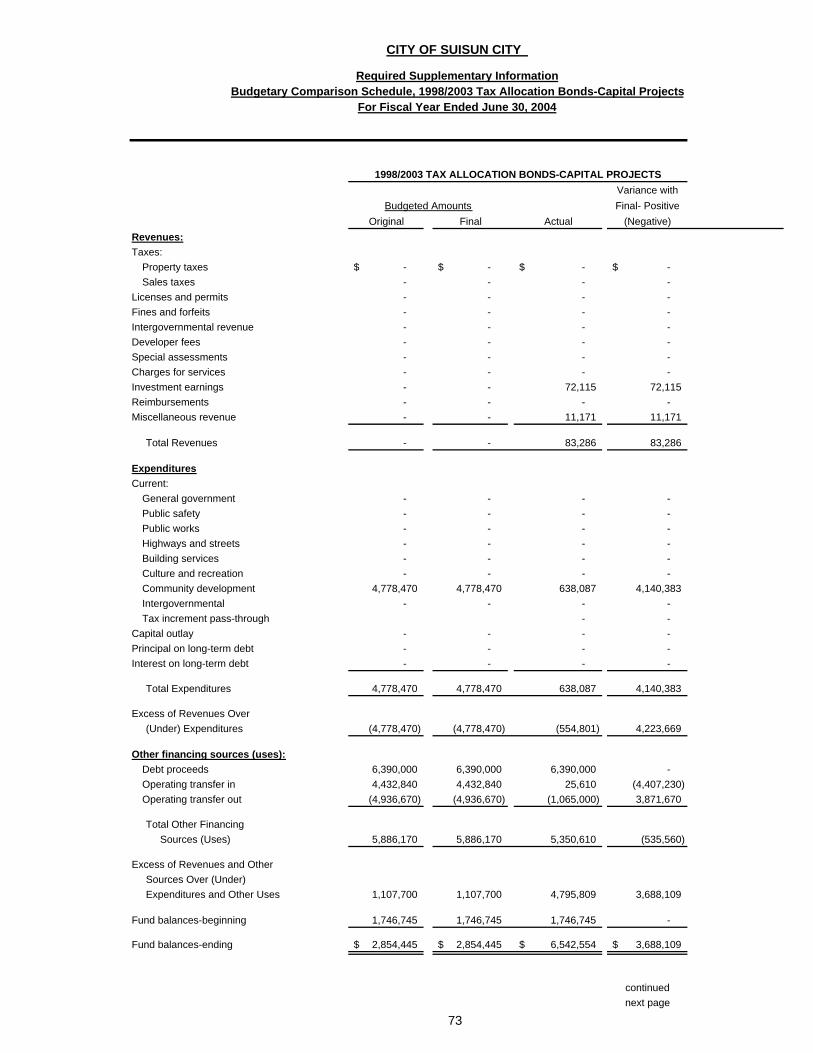
Variance withFinal- Positive
Original Final Actual (Negative)Revenues:Taxes:
Property taxes -$ -$ -$ -$ Sales taxes - - - -
Licenses and permits - - - - Fines and forfeits - - - - Intergovernmental revenue - - - - Developer fees - - - - Special assessments - - - - Charges for services - - - - Investment earnings - - 72,115 72,115 Reimbursements - - - - Miscellaneous revenue - - 11,171 11,171
Total Revenues - - 83,286 83,286
ExpendituresCurrent:
General government - - - - Public safety - - - - Public works - - - - Highways and streets - - - - Building services - - - - Culture and recreation - - - - Community development 4,778,470 4,778,470 638,087 4,140,383 Intergovernmental - - - - Tax increment pass-through - -
Capital outlay - - - - Principal on long-term debt - - - - Interest on long-term debt - - - -
Total Expenditures 4,778,470 4,778,470 638,087 4,140,383
Excess of Revenues Over (Under) Expenditures (4,778,470) (4,778,470) (554,801) 4,223,669
Other financing sources (uses):Debt proceeds 6,390,000 6,390,000 6,390,000 - Operating transfer in 4,432,840 4,432,840 25,610 (4,407,230) Operating transfer out (4,936,670) (4,936,670) (1,065,000) 3,871,670
Total Other Financing Sources (Uses) 5,886,170 5,886,170 5,350,610 (535,560)
Excess of Revenues and Other Sources Over (Under) Expenditures and Other Uses 1,107,700 1,107,700 4,795,809 3,688,109
Fund balances-beginning 1,746,745 1,746,745 1,746,745 -
Fund balances-ending 2,854,445$ 2,854,445$ 6,542,554$ 3,688,109$
continuednext page
1998/2003 TAX ALLOCATION BONDS-CAPITAL PROJECTS
Budgeted Amounts
73
CITY OF SUISUN CITY
Required Supplementary InformationBudgetary Comparison Schedule, 1998/2003 Tax Allocation Bonds-Capital Projects
For Fiscal Year Ended June 30, 2004
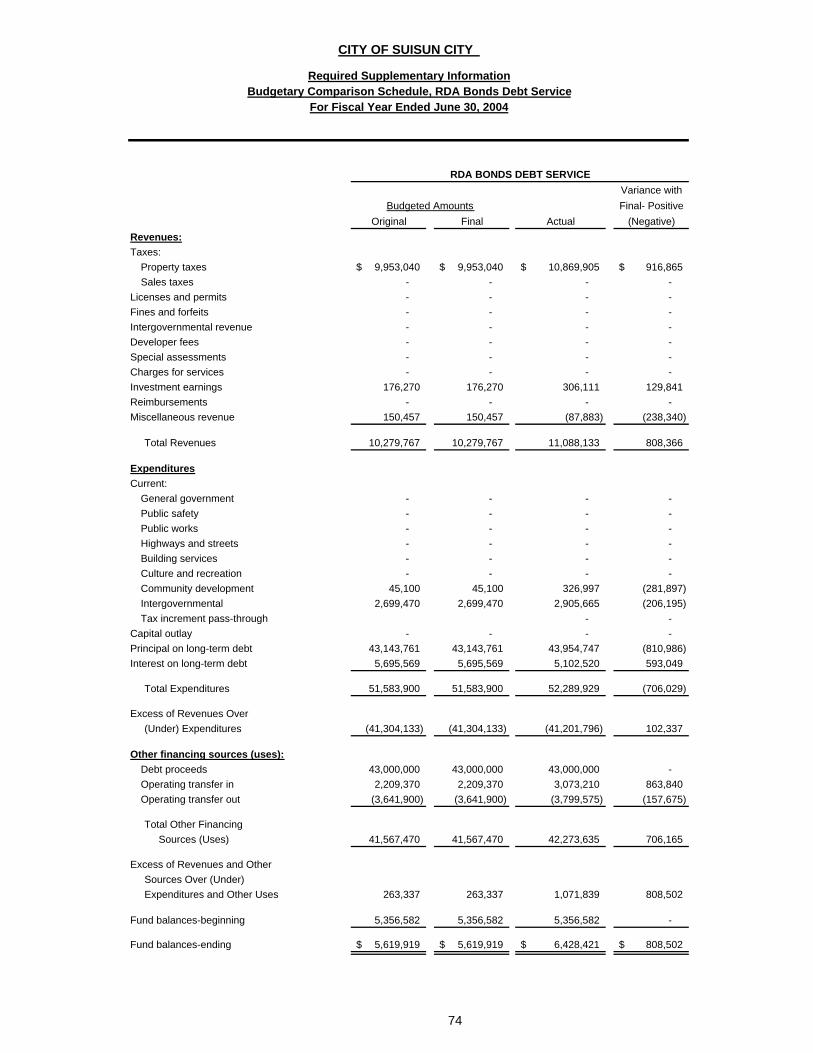
Variance withFinal- Positive
Original Final Actual (Negative)Revenues:Taxes:
Property taxes 9,953,040$ 9,953,040$ 10,869,905$ 916,865$ Sales taxes - - - -
Licenses and permits - - - - Fines and forfeits - - - - Intergovernmental revenue - - - - Developer fees - - - - Special assessments - - - - Charges for services - - - - Investment earnings 176,270 176,270 306,111 129,841 Reimbursements - - - - Miscellaneous revenue 150,457 150,457 (87,883) (238,340)
Total Revenues 10,279,767 10,279,767 11,088,133 808,366
ExpendituresCurrent:
General government - - - - Public safety - - - - Public works - - - - Highways and streets - - - - Building services - - - - Culture and recreation - - - - Community development 45,100 45,100 326,997 (281,897) Intergovernmental 2,699,470 2,699,470 2,905,665 (206,195) Tax increment pass-through - -
Capital outlay - - - - Principal on long-term debt 43,143,761 43,143,761 43,954,747 (810,986) Interest on long-term debt 5,695,569 5,695,569 5,102,520 593,049
Total Expenditures 51,583,900 51,583,900 52,289,929 (706,029)
Excess of Revenues Over (Under) Expenditures (41,304,133) (41,304,133) (41,201,796) 102,337
Other financing sources (uses):Debt proceeds 43,000,000 43,000,000 43,000,000 - Operating transfer in 2,209,370 2,209,370 3,073,210 863,840 Operating transfer out (3,641,900) (3,641,900) (3,799,575) (157,675)
Total Other Financing Sources (Uses) 41,567,470 41,567,470 42,273,635 706,165
Excess of Revenues and Other Sources Over (Under) Expenditures and Other Uses 263,337 263,337 1,071,839 808,502
Fund balances-beginning 5,356,582 5,356,582 5,356,582 -
Fund balances-ending 5,619,919$ 5,619,919$ 6,428,421$ 808,502$
Budgeted Amounts
74
RDA BONDS DEBT SERVICE
CITY OF SUISUN CITY
Required Supplementary InformationBudgetary Comparison Schedule, RDA Bonds Debt Service
For Fiscal Year Ended June 30, 2004
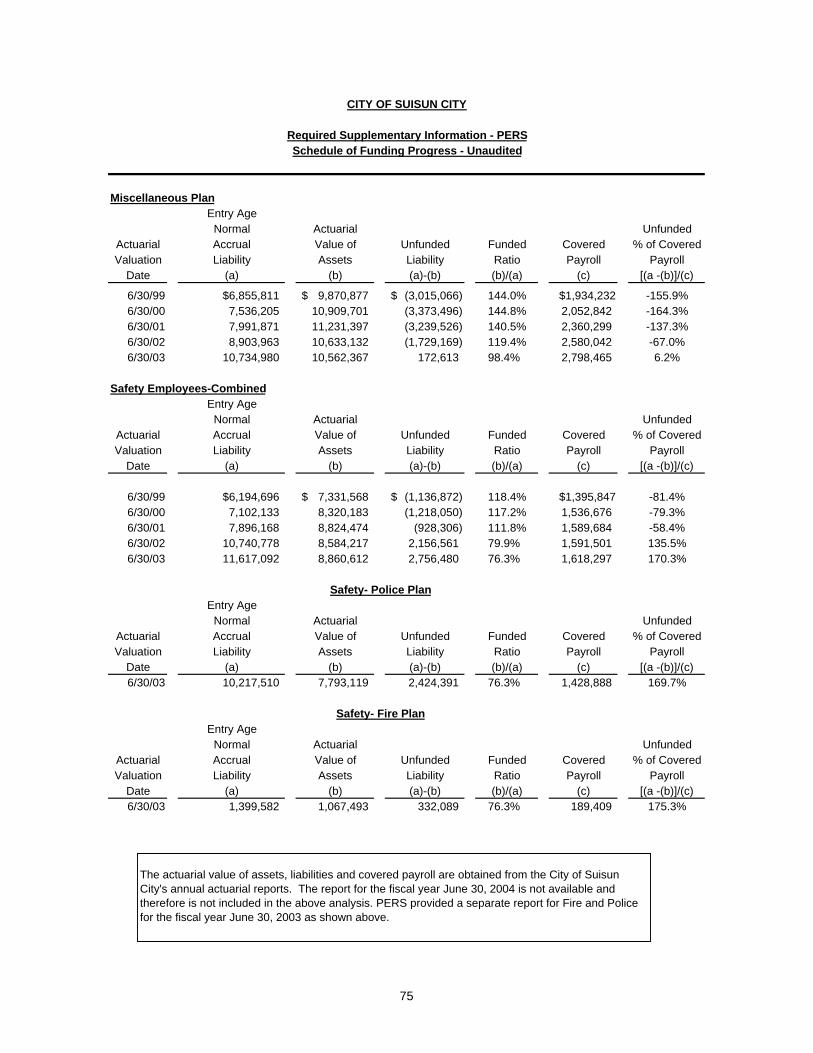
CITY OF SUISUN CITY
Required Supplementary Information - PERSSchedule of Funding Progress - Unaudited
Miscellaneous PlanEntry Age
Normal Actuarial UnfundedActuarial Accrual Value of Unfunded Funded Covered % of CoveredValuation Liability Assets Liability Ratio Payroll Payroll
Date (a) (b) (a)-(b) (b)/(a) (c) [(a -(b)]/(c)
6/30/99 $6,855,811 9,870,877$ (3,015,066)$ 144.0% $1,934,232 -155.9%6/30/00 7,536,205 10,909,701 (3,373,496) 144.8% 2,052,842 -164.3%6/30/01 7,991,871 11,231,397 (3,239,526) 140.5% 2,360,299 -137.3%6/30/02 8,903,963 10,633,132 (1,729,169) 119.4% 2,580,042 -67.0%6/30/03 10,734,980 10,562,367 172,613 98.4% 2,798,465 6.2%
Safety Employees-CombinedEntry Age
Normal Actuarial UnfundedActuarial Accrual Value of Unfunded Funded Covered % of CoveredValuation Liability Assets Liability Ratio Payroll Payroll
Date (a) (b) (a)-(b) (b)/(a) (c) [(a -(b)]/(c)
6/30/99 $6,194,696 7,331,568$ (1,136,872)$ 118.4% $1,395,847 -81.4%6/30/00 7,102,133 8,320,183 (1,218,050) 117.2% 1,536,676 -79.3%6/30/01 7,896,168 8,824,474 (928,306) 111.8% 1,589,684 -58.4%6/30/02 10,740,778 8,584,217 2,156,561 79.9% 1,591,501 135.5%6/30/03 11,617,092 8,860,612 2,756,480 76.3% 1,618,297 170.3%
Entry AgeNormal Actuarial Unfunded
Actuarial Accrual Value of Unfunded Funded Covered % of CoveredValuation Liability Assets Liability Ratio Payroll Payroll
Date (a) (b) (a)-(b) (b)/(a) (c) [(a -(b)]/(c)6/30/03 10,217,510 7,793,119 2,424,391 76.3% 1,428,888 169.7%
Entry AgeNormal Actuarial Unfunded
Actuarial Accrual Value of Unfunded Funded Covered % of CoveredValuation Liability Assets Liability Ratio Payroll Payroll
Date (a) (b) (a)-(b) (b)/(a) (c) [(a -(b)]/(c)6/30/03 1,399,582 1,067,493 332,089 76.3% 189,409 175.3%
Safety- Police Plan
Safety- Fire Plan
The actuarial value of assets, liabilities and covered payroll are obtained from the City of Suisun City's annual actuarial reports. The report for the fiscal year June 30, 2004 is not available and therefore is not included in the above analysis. PERS provided a separate report for Fire and Police for the fiscal year June 30, 2003 as shown above.
75
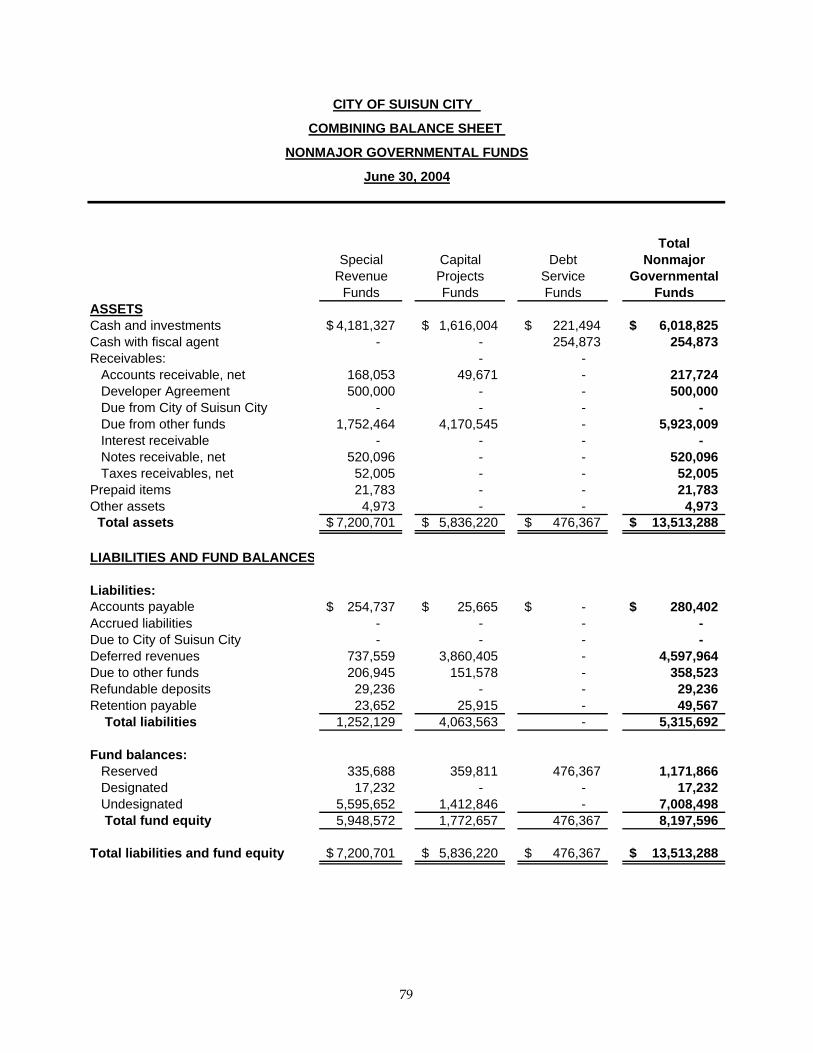
TotalSpecial Capital Debt Nonmajor
Revenue Projects Service GovernmentalFunds Funds Funds Funds
ASSETSCash and investments 4,181,327$ 1,616,004$ 221,494$ 6,018,825$ Cash with fiscal agent - - 254,873 254,873 Receivables: - -
Accounts receivable, net 168,053 49,671 - 217,724 Developer Agreement 500,000 - - 500,000 Due from City of Suisun City - - - - Due from other funds 1,752,464 4,170,545 - 5,923,009 Interest receivable - - - - Notes receivable, net 520,096 - - 520,096 Taxes receivables, net 52,005 - - 52,005
Prepaid items 21,783 - - 21,783 Other assets 4,973 - - 4,973 Total assets 7,200,701$ 5,836,220$ 476,367$ 13,513,288$
LIABILITIES AND FUND BALANCES
Liabilities:Accounts payable 254,737$ 25,665$ -$ 280,402$ Accrued liabilities - - - - Due to City of Suisun City - - - - Deferred revenues 737,559 3,860,405 - 4,597,964 Due to other funds 206,945 151,578 - 358,523 Refundable deposits 29,236 - - 29,236 Retention payable 23,652 25,915 - 49,567 Total liabilities 1,252,129 4,063,563 - 5,315,692
Fund balances:Reserved 335,688 359,811 476,367 1,171,866 Designated 17,232 - - 17,232 Undesignated 5,595,652 1,412,846 - 7,008,498
Total fund equity 5,948,572 1,772,657 476,367 8,197,596
Total liabilities and fund equity 7,200,701$ 5,836,220$ 476,367$ 13,513,288$
CITY OF SUISUN CITY
COMBINING BALANCE SHEET
NONMAJOR GOVERNMENTAL FUNDS
June 30, 2004
79
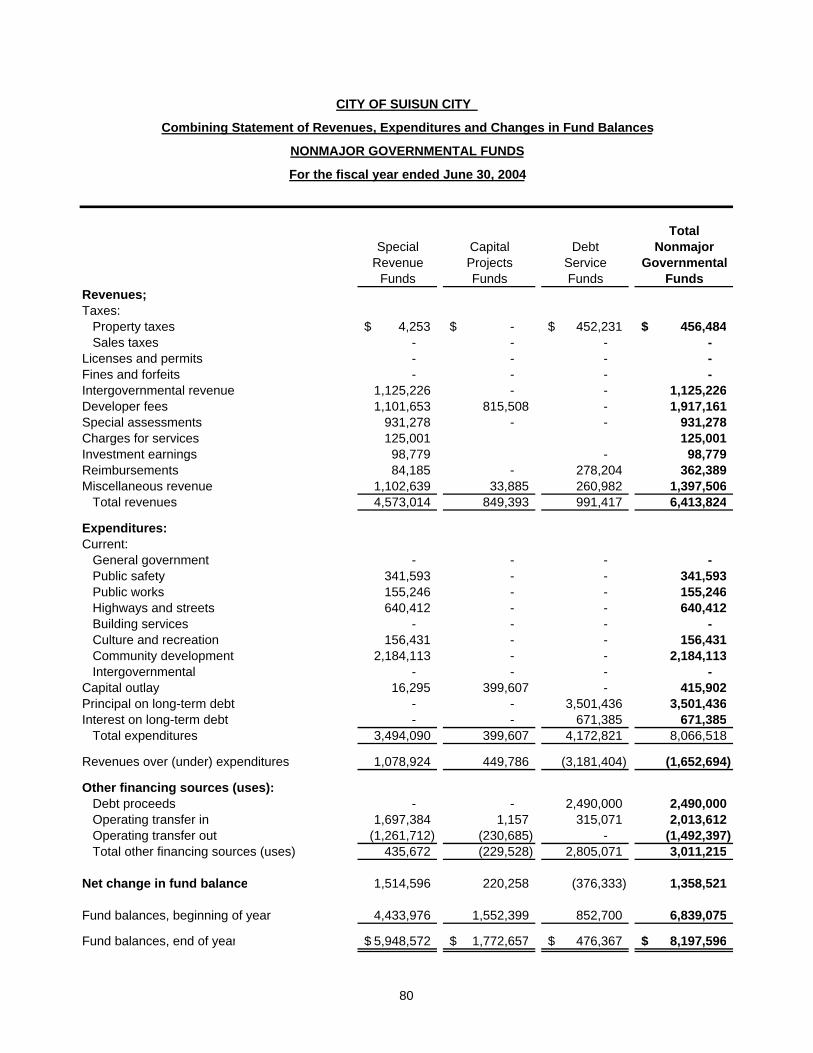
TotalSpecial Capital Debt Nonmajor
Revenue Projects Service GovernmentalFunds Funds Funds Funds
Revenues;Taxes:
Property taxes 4,253$ -$ 452,231$ 456,484$ Sales taxes - - - -
Licenses and permits - - - - Fines and forfeits - - - - Intergovernmental revenue 1,125,226 - - 1,125,226 Developer fees 1,101,653 815,508 - 1,917,161 Special assessments 931,278 - - 931,278 Charges for services 125,001 125,001 Investment earnings 98,779 - 98,779 Reimbursements 84,185 - 278,204 362,389 Miscellaneous revenue 1,102,639 33,885 260,982 1,397,506
Total revenues 4,573,014 849,393 991,417 6,413,824
Expenditures:Current:
General government - - - - Public safety 341,593 - - 341,593 Public works 155,246 - - 155,246 Highways and streets 640,412 - - 640,412 Building services - - - - Culture and recreation 156,431 - - 156,431 Community development 2,184,113 - - 2,184,113 Intergovernmental - - - -
Capital outlay 16,295 399,607 - 415,902 Principal on long-term debt - - 3,501,436 3,501,436 Interest on long-term debt - - 671,385 671,385
Total expenditures 3,494,090 399,607 4,172,821 8,066,518
Revenues over (under) expenditures 1,078,924 449,786 (3,181,404) (1,652,694)
Other financing sources (uses):Debt proceeds - - 2,490,000 2,490,000 Operating transfer in 1,697,384 1,157 315,071 2,013,612 Operating transfer out (1,261,712) (230,685) - (1,492,397) Total other financing sources (uses) 435,672 (229,528) 2,805,071 3,011,215
Net change in fund balance 1,514,596 220,258 (376,333) 1,358,521
Fund balances, beginning of year 4,433,976 1,552,399 852,700 6,839,075 Fund balances, end of year 5,948,572$ 1,772,657$ 476,367$ 8,197,596$
CITY OF SUISUN CITY
Combining Statement of Revenues, Expenditures and Changes in Fund Balances
NONMAJOR GOVERNMENTAL FUNDS
For the fiscal year ended June 30, 2004
80
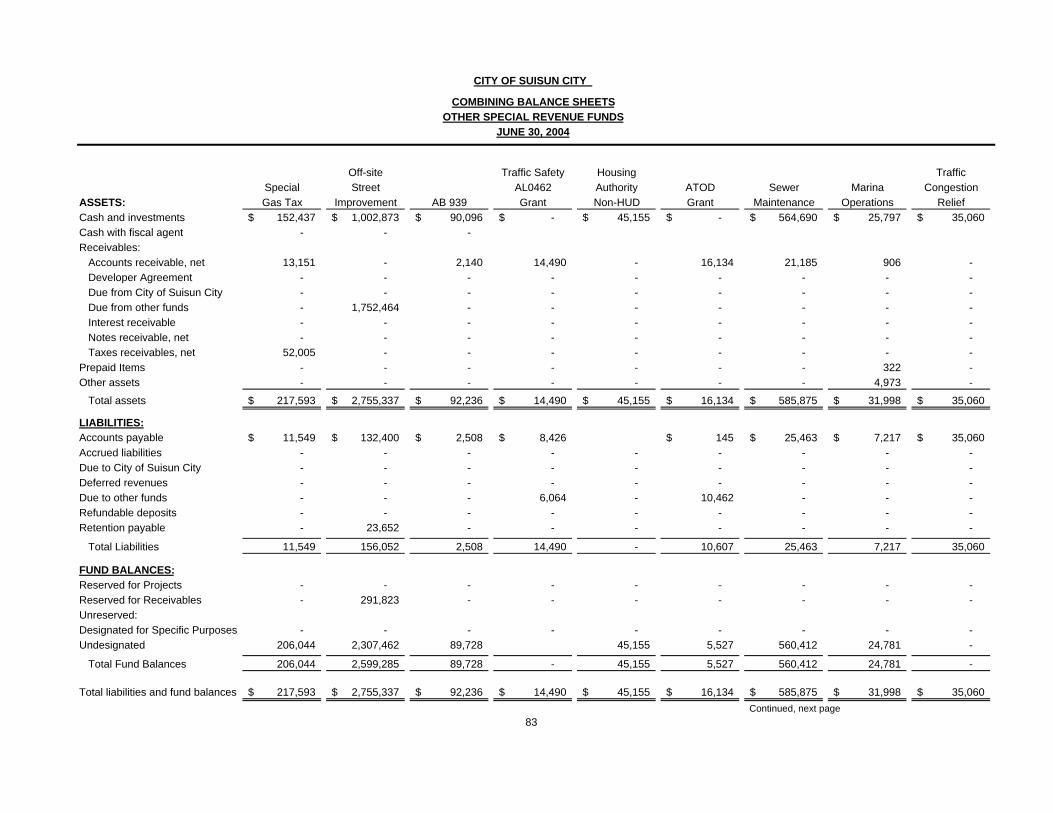
Off-site Traffic Safety Housing TrafficSpecial Street AL0462 Authority ATOD Sewer Marina Congestion
ASSETS: Gas Tax Improvement AB 939 Grant Non-HUD Grant Maintenance Operations ReliefCash and investments 152,437$ 1,002,873$ 90,096$ -$ 45,155$ -$ 564,690$ 25,797$ 35,060$ Cash with fiscal agent - - - Receivables:
Accounts receivable, net 13,151 - 2,140 14,490 - 16,134 21,185 906 - Developer Agreement - - - - - - - - - Due from City of Suisun City - - - - - - - - - Due from other funds - 1,752,464 - - - - - - - Interest receivable - - - - - - - - - Notes receivable, net - - - - - - - - - Taxes receivables, net 52,005 - - - - - - - -
Prepaid Items - - - - - - - 322 - Other assets - - - - - - - 4,973 -
Total assets 217,593$ 2,755,337$ 92,236$ 14,490$ 45,155$ 16,134$ 585,875$ 31,998$ 35,060$
LIABILITIES:Accounts payable 11,549$ 132,400$ 2,508$ 8,426$ 145$ 25,463$ 7,217$ 35,060$ Accrued liabilities - - - - - - - - - Due to City of Suisun City - - - - - - - - - Deferred revenues - - - - - - - - - Due to other funds - - - 6,064 - 10,462 - - - Refundable deposits - - - - - - - - - Retention payable - 23,652 - - - - - - -
Total Liabilities 11,549 156,052 2,508 14,490 - 10,607 25,463 7,217 35,060
FUND BALANCES:Reserved for Projects - - - - - - - - - Reserved for Receivables - 291,823 - - - - - - - Unreserved:Designated for Specific Purposes - - - - - - - - - Undesignated 206,044 2,307,462 89,728 45,155 5,527 560,412 24,781 -
Total Fund Balances 206,044 2,599,285 89,728 - 45,155 5,527 560,412 24,781 -
Total liabilities and fund balances 217,593$ 2,755,337$ 92,236$ 14,490$ 45,155$ 16,134$ 585,875$ 31,998$ 35,060$ Continued, next page
83
JUNE 30, 2004
CITY OF SUISUN CITY
COMBINING BALANCE SHEETSOTHER SPECIAL REVENUE FUNDS
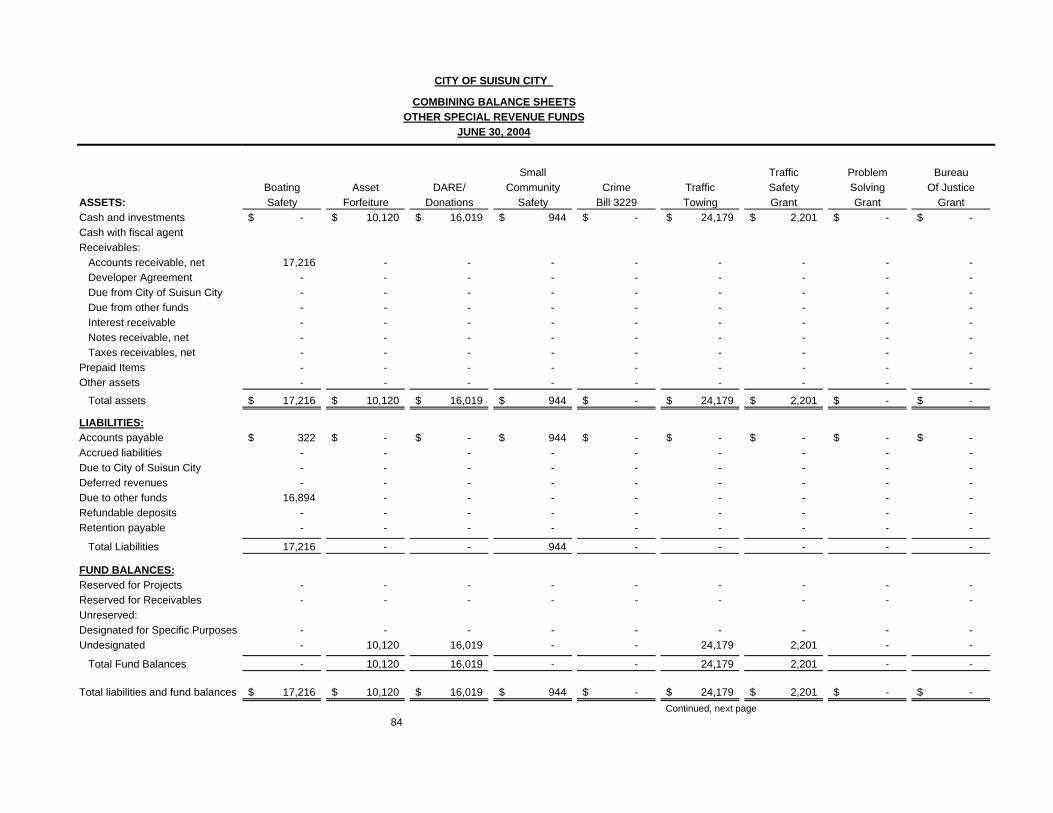
ASSETS:Cash and investmentsCash with fiscal agentReceivables:
Accounts receivable, netDeveloper AgreementDue from City of Suisun CityDue from other fundsInterest receivable Notes receivable, netTaxes receivables, net
Prepaid ItemsOther assets
Total assets
LIABILITIES:Accounts payableAccrued liabilitiesDue to City of Suisun CityDeferred revenuesDue to other fundsRefundable depositsRetention payable
Total Liabilities
FUND BALANCES:Reserved for ProjectsReserved for ReceivablesUnreserved:Designated for Specific PurposesUndesignated
Total Fund Balances
Total liabilities and fund balances
Small Traffic Problem Bureau
Boating Asset DARE/ Community Crime Traffic Safety Solving Of JusticeSafety Forfeiture Donations Safety Bill 3229 Towing Grant Grant Grant
-$ 10,120$ 16,019$ 944$ -$ 24,179$ 2,201$ -$ -$
17,216 - - - - - - - - - - - - - - - - - - - - - - - - - - - - - - - - - - - - - - - - - - - - - - - - - - - - - - - - - - - - - - - - - - - - - - - - - - - - - - - -
17,216$ 10,120$ 16,019$ 944$ -$ 24,179$ 2,201$ -$ -$
322$ -$ -$ 944$ -$ -$ -$ -$ -$ - - - - - - - - - - - - - - - - - - - - - - - - - - -
16,894 - - - - - - - - - - - - - - - - - - - - - - - - - -
17,216 - - 944 - - - - -
- - - - - - - - - - - - - - - - - -
- - - - - - - - - - 10,120 16,019 - - 24,179 2,201 - -
- 10,120 16,019 - - 24,179 2,201 - -
17,216$ 10,120$ 16,019$ 944$ -$ 24,179$ 2,201$ -$ -$ Continued, next page
84
JUNE 30, 2004
CITY OF SUISUN CITY
COMBINING BALANCE SHEETSOTHER SPECIAL REVENUE FUNDS
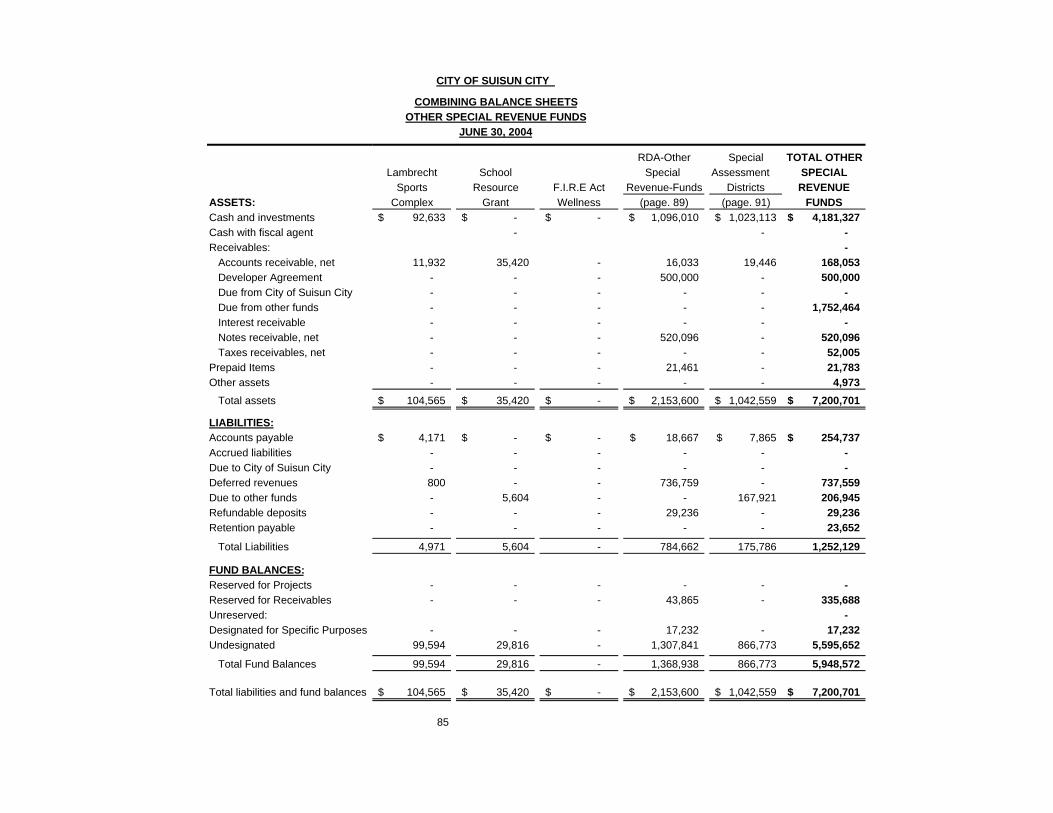
ASSETS:Cash and investmentsCash with fiscal agentReceivables:
Accounts receivable, netDeveloper AgreementDue from City of Suisun CityDue from other fundsInterest receivable Notes receivable, netTaxes receivables, net
Prepaid ItemsOther assets
Total assets
LIABILITIES:Accounts payableAccrued liabilitiesDue to City of Suisun CityDeferred revenuesDue to other fundsRefundable depositsRetention payable
Total Liabilities
FUND BALANCES:Reserved for ProjectsReserved for ReceivablesUnreserved:Designated for Specific PurposesUndesignated
Total Fund Balances
Total liabilities and fund balances
CITY OF SUISUN CITY
COMBINING BALANCE SHEETSOTHER SPECIAL REVENUE FUNDS
JUNE 30, 2004
RDA-Other Special TOTAL OTHERLambrecht School Special Assessment SPECIAL
Sports Resource F.I.R.E Act Revenue-Funds Districts REVENUEComplex Grant Wellness (page. 89) (page. 91) FUNDS
92,633$ -$ -$ 1,096,010$ 1,023,113$ 4,181,327$ - - -
- 11,932 35,420 - 16,033 19,446 168,053
- - - 500,000 - 500,000 - - - - - - - - - - - 1,752,464 - - - - - - - - - 520,096 - 520,096 - - - - - 52,005 - - - 21,461 - 21,783 - - - - - 4,973
104,565$ 35,420$ -$ 2,153,600$ 1,042,559$ 7,200,701$
4,171$ -$ -$ 18,667$ 7,865$ 254,737$ - - - - - - - - - - - - 800 - - 736,759 - 737,559 - 5,604 - - 167,921 206,945 - - - 29,236 - 29,236 - - - - - 23,652
4,971 5,604 - 784,662 175,786 1,252,129
- - - - - - - - - 43,865 - 335,688
- - - - 17,232 - 17,232
99,594 29,816 - 1,307,841 866,773 5,595,652
99,594 29,816 - 1,368,938 866,773 5,948,572
104,565$ 35,420$ -$ 2,153,600$ 1,042,559$ 7,200,701$
85
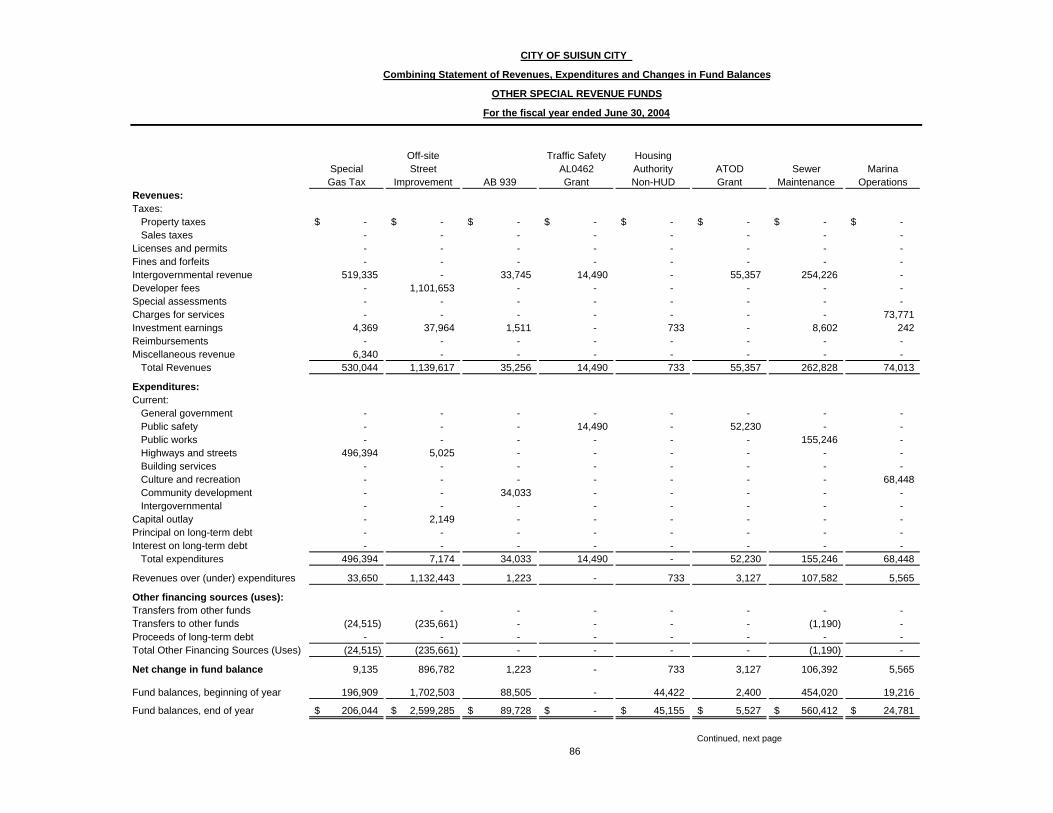
Off-site Traffic Safety HousingSpecial Street AL0462 Authority ATOD Sewer MarinaGas Tax Improvement AB 939 Grant Non-HUD Grant Maintenance Operations
Revenues:Taxes:
Property taxes -$ -$ -$ -$ -$ -$ -$ -$ Sales taxes - - - - - - - -
Licenses and permits - - - - - - - - Fines and forfeits - - - - - - - - Intergovernmental revenue 519,335 - 33,745 14,490 - 55,357 254,226 - Developer fees - 1,101,653 - - - - - - Special assessments - - - - - - - - Charges for services - - - - - - - 73,771 Investment earnings 4,369 37,964 1,511 - 733 - 8,602 242 Reimbursements - - - - - - - - Miscellaneous revenue 6,340 - - - - - - -
Total Revenues 530,044 1,139,617 35,256 14,490 733 55,357 262,828 74,013
Expenditures:Current:
General government - - - - - - - - Public safety - - - 14,490 - 52,230 - - Public works - - - - - - 155,246 - Highways and streets 496,394 5,025 - - - - - - Building services - - - - - - - - Culture and recreation - - - - - - - 68,448 Community development - - 34,033 - - - - - Intergovernmental - - - - - - - -
Capital outlay - 2,149 - - - - - - Principal on long-term debt - - - - - - - - Interest on long-term debt - - - - - - - -
Total expenditures 496,394 7,174 34,033 14,490 - 52,230 155,246 68,448 Revenues over (under) expenditures 33,650 1,132,443 1,223 - 733 3,127 107,582 5,565
Other financing sources (uses):Transfers from other funds - - - - - - - Transfers to other funds (24,515) (235,661) - - - - (1,190) - Proceeds of long-term debt - - - - - - - - Total Other Financing Sources (Uses) (24,515) (235,661) - - - - (1,190) - Net change in fund balance 9,135 896,782 1,223 - 733 3,127 106,392 5,565
Fund balances, beginning of year 196,909 1,702,503 88,505 - 44,422 2,400 454,020 19,216 Fund balances, end of year 206,044$ 2,599,285$ 89,728$ -$ 45,155$ 5,527$ 560,412$ 24,781$
Continued, next page
OTHER SPECIAL REVENUE FUNDS
For the fiscal year ended June 30, 2004
86
CITY OF SUISUN CITY
Combining Statement of Revenues, Expenditures and Changes in Fund Balances
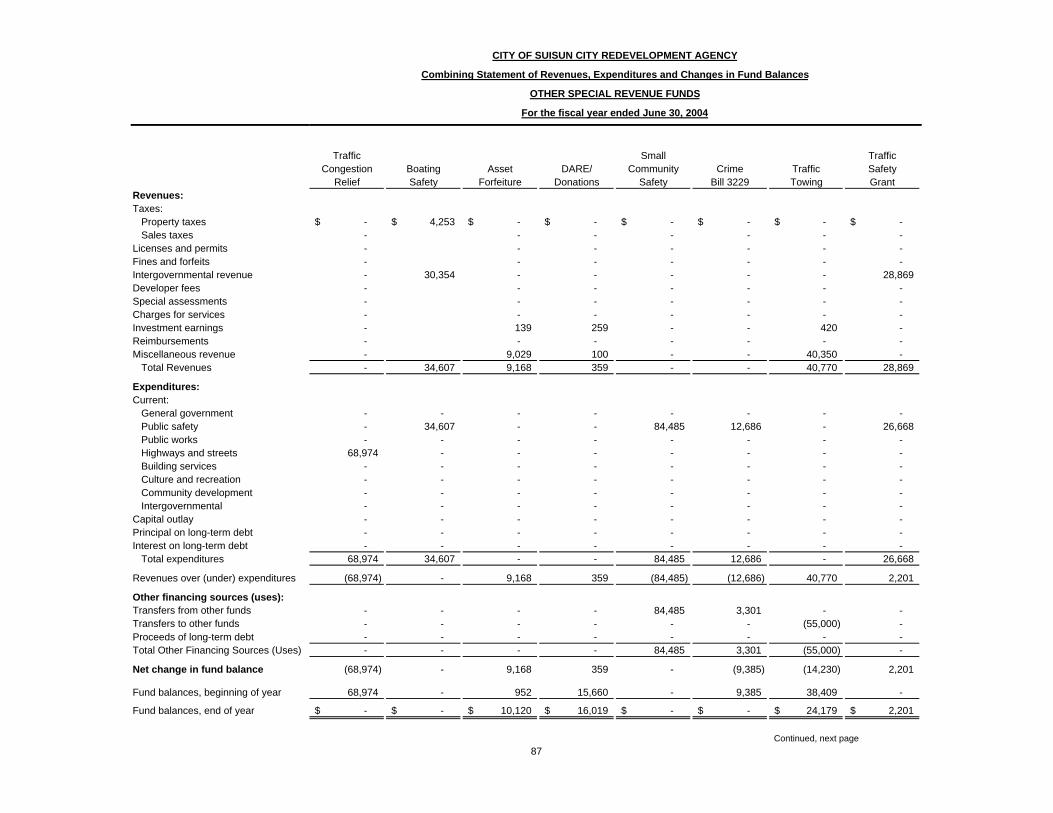
Revenues:Taxes:
Property taxesSales taxes
Licenses and permitsFines and forfeitsIntergovernmental revenueDeveloper feesSpecial assessmentsCharges for servicesInvestment earningsReimbursementsMiscellaneous revenue
Total Revenues
Expenditures:Current:
General governmentPublic safetyPublic worksHighways and streetsBuilding servicesCulture and recreationCommunity developmentIntergovernmental
Capital outlayPrincipal on long-term debtInterest on long-term debt
Total expenditures Revenues over (under) expenditures
Other financing sources (uses):Transfers from other fundsTransfers to other fundsProceeds of long-term debtTotal Other Financing Sources (Uses) Net change in fund balance
Fund balances, beginning of year Fund balances, end of year
Traffic Small Traffic
Congestion Boating Asset DARE/ Community Crime Traffic SafetyRelief Safety Forfeiture Donations Safety Bill 3229 Towing Grant
-$ 4,253$ -$ -$ -$ -$ -$ -$ - - - - - - - - - - - - - - - - - - - - - - 30,354 - - - - - 28,869 - - - - - - - - - - - - - - - - - - - - - - 139 259 - - 420 - - - - - - - - - 9,029 100 - - 40,350 - - 34,607 9,168 359 - - 40,770 28,869
- - - - - - - - - 34,607 - - 84,485 12,686 - 26,668 - - - - - - - -
68,974 - - - - - - - - - - - - - - - - - - - - - - - - - - - - - - - - - - - - - - - - - - - - - - - - - - - - - - - - - - - - - - -
68,974 34,607 - - 84,485 12,686 - 26,668
(68,974) - 9,168 359 (84,485) (12,686) 40,770 2,201
- - - - 84,485 3,301 - - - - - - - - (55,000) - - - - - - - - - - - - - 84,485 3,301 (55,000) -
(68,974) - 9,168 359 - (9,385) (14,230) 2,201
68,974 - 952 15,660 - 9,385 38,409 -
-$ -$ 10,120$ 16,019$ -$ -$ 24,179$ 2,201$
Continued, next page
CITY OF SUISUN CITY REDEVELOPMENT AGENCY
Combining Statement of Revenues, Expenditures and Changes in Fund Balances
OTHER SPECIAL REVENUE FUNDS
87
For the fiscal year ended June 30, 2004
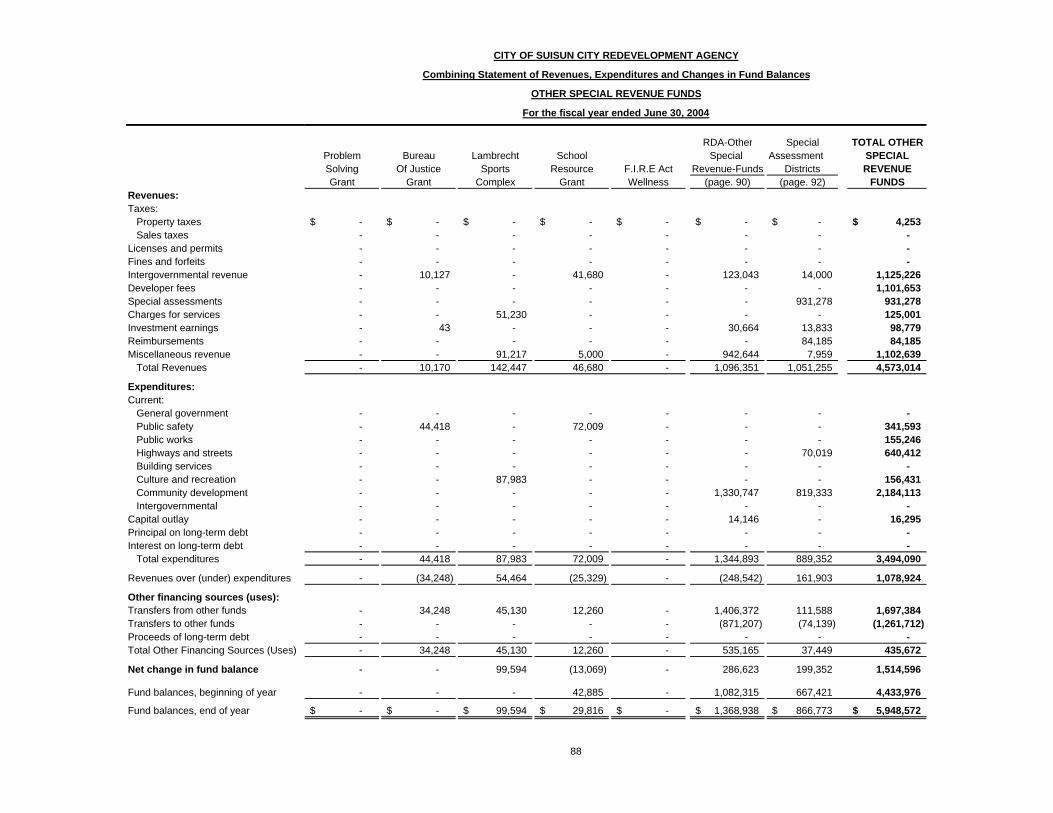
Revenues:Taxes:
Property taxesSales taxes
Licenses and permitsFines and forfeitsIntergovernmental revenueDeveloper feesSpecial assessmentsCharges for servicesInvestment earningsReimbursementsMiscellaneous revenue
Total Revenues
Expenditures:Current:
General governmentPublic safetyPublic worksHighways and streetsBuilding servicesCulture and recreationCommunity developmentIntergovernmental
Capital outlayPrincipal on long-term debtInterest on long-term debt
Total expenditures Revenues over (under) expenditures
Other financing sources (uses):Transfers from other fundsTransfers to other fundsProceeds of long-term debtTotal Other Financing Sources (Uses) Net change in fund balance
Fund balances, beginning of year Fund balances, end of year
RDA-Other Special TOTAL OTHERProblem Bureau Lambrecht School Special Assessment SPECIALSolving Of Justice Sports Resource F.I.R.E Act Revenue-Funds Districts REVENUEGrant Grant Complex Grant Wellness (page. 90) (page. 92) FUNDS
-$ -$ -$ -$ -$ -$ -$ 4,253$ - - - - - - - - - - - - - - - - - - - - - - - - - 10,127 - 41,680 - 123,043 14,000 1,125,226 - - - - - - - 1,101,653 - - - - - - 931,278 931,278 - - 51,230 - - - - 125,001 - 43 - - - 30,664 13,833 98,779 - - - - - - 84,185 84,185 - - 91,217 5,000 - 942,644 7,959 1,102,639 - 10,170 142,447 46,680 - 1,096,351 1,051,255 4,573,014
- - - - - - - - - 44,418 - 72,009 - - - 341,593 - - - - - - - 155,246 - - - - - - 70,019 640,412 - - - - - - - - - - 87,983 - - - - 156,431 - - - - - 1,330,747 819,333 2,184,113 - - - - - - - - - - - - - 14,146 - 16,295 - - - - - - - - - - - - - - - - - 44,418 87,983 72,009 - 1,344,893 889,352 3,494,090
- (34,248) 54,464 (25,329) - (248,542) 161,903 1,078,924
- 34,248 45,130 12,260 - 1,406,372 111,588 1,697,384 - - - - - (871,207) (74,139) (1,261,712) - - - - - - - - - 34,248 45,130 12,260 - 535,165 37,449 435,672
- - 99,594 (13,069) - 286,623 199,352 1,514,596
- - - 42,885 - 1,082,315 667,421 4,433,976
-$ -$ 99,594$ 29,816$ -$ 1,368,938$ 866,773$ 5,948,572$
CITY OF SUISUN CITY REDEVELOPMENT AGENCY
88
Combining Statement of Revenues, Expenditures and Changes in Fund Balances
OTHER SPECIAL REVENUE FUNDS
For the fiscal year ended June 30, 2004
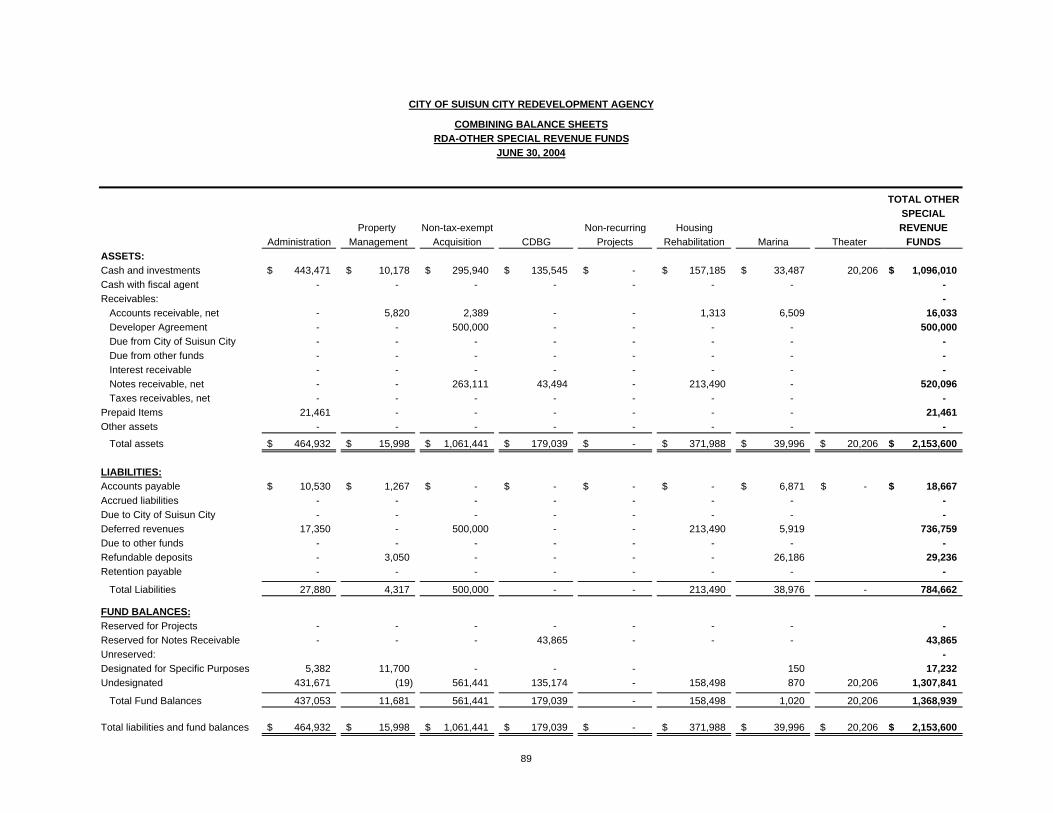
TOTAL OTHER SPECIAL
Property Non-tax-exempt Non-recurring Housing REVENUEAdministration Management Acquisition CDBG Projects Rehabilitation Marina Theater FUNDS
ASSETS: Cash and investments 443,471$ 10,178$ 295,940$ 135,545$ -$ 157,185$ 33,487$ 20,206 1,096,010$ Cash with fiscal agent - - - - - - - - Receivables: -
Accounts receivable, net - 5,820 2,389 - - 1,313 6,509 16,033 Developer Agreement - - 500,000 - - - - 500,000 Due from City of Suisun City - - - - - - - - Due from other funds - - - - - - - - Interest receivable - - - - - - - - Notes receivable, net - - 263,111 43,494 - 213,490 - 520,096 Taxes receivables, net - - - - - - - -
Prepaid Items 21,461 - - - - - - 21,461 Other assets - - - - - - - -
Total assets 464,932$ 15,998$ 1,061,441$ 179,039$ -$ 371,988$ 39,996$ 20,206$ 2,153,600$
LIABILITIES:Accounts payable 10,530$ 1,267$ -$ -$ -$ -$ 6,871$ -$ 18,667$ Accrued liabilities - - - - - - - - Due to City of Suisun City - - - - - - - - Deferred revenues 17,350 - 500,000 - - 213,490 5,919 736,759 Due to other funds - - - - - - - - Refundable deposits - 3,050 - - - - 26,186 29,236 Retention payable - - - - - - - -
Total Liabilities 27,880 4,317 500,000 - - 213,490 38,976 - 784,662
FUND BALANCES:Reserved for Projects - - - - - - - - Reserved for Notes Receivable - - - 43,865 - - - 43,865 Unreserved: - Designated for Specific Purposes 5,382 11,700 - - - 150 17,232 Undesignated 431,671 (19) 561,441 135,174 - 158,498 870 20,206 1,307,841
Total Fund Balances 437,053 11,681 561,441 179,039 - 158,498 1,020 20,206 1,368,939
Total liabilities and fund balances 464,932$ 15,998$ 1,061,441$ 179,039$ -$ 371,988$ 39,996$ 20,206$ 2,153,600$
CITY OF SUISUN CITY REDEVELOPMENT AGENCY
COMBINING BALANCE SHEETSRDA-OTHER SPECIAL REVENUE FUNDS
JUNE 30, 2004
89
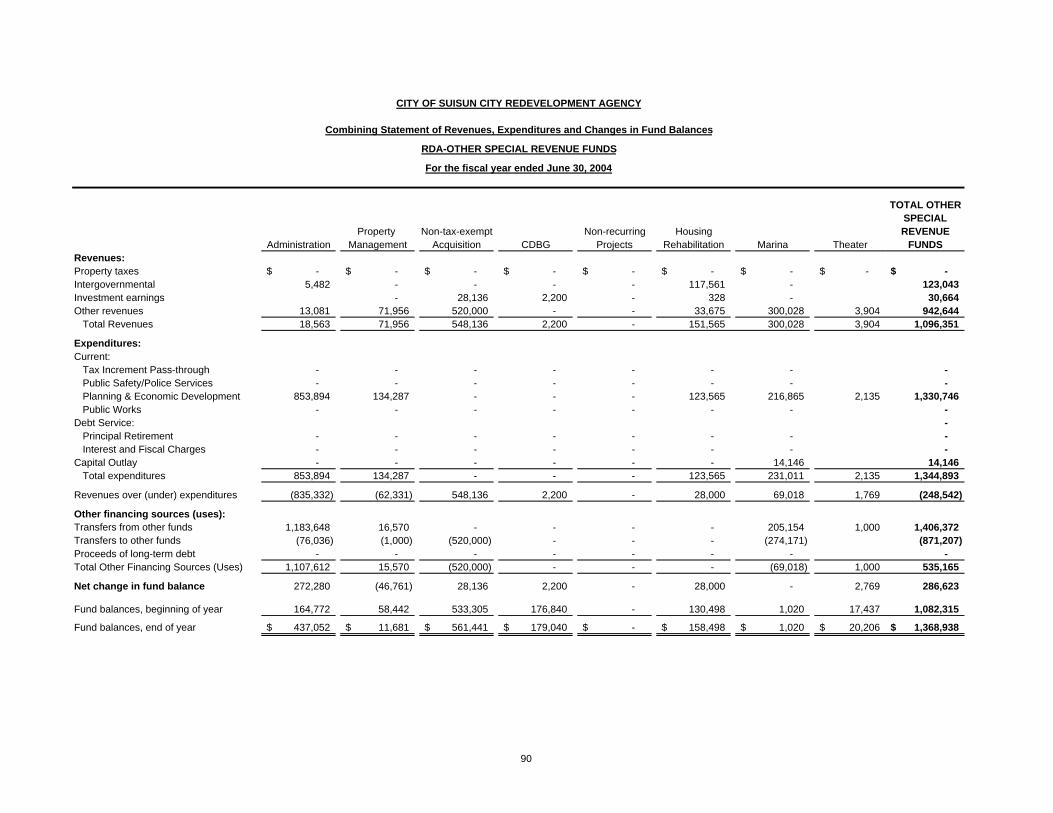
TOTAL OTHERSPECIAL
Property Non-tax-exempt Non-recurring Housing REVENUEAdministration Management Acquisition CDBG Projects Rehabilitation Marina Theater FUNDS
Revenues:Property taxes -$ -$ -$ -$ -$ -$ -$ -$ -$ Intergovernmental 5,482 - - - - 117,561 - 123,043 Investment earnings - 28,136 2,200 - 328 - 30,664 Other revenues 13,081 71,956 520,000 - - 33,675 300,028 3,904 942,644
Total Revenues 18,563 71,956 548,136 2,200 - 151,565 300,028 3,904 1,096,351
Expenditures:Current:
Tax Increment Pass-through - - - - - - - - Public Safety/Police Services - - - - - - - - Planning & Economic Development 853,894 134,287 - - - 123,565 216,865 2,135 1,330,746 Public Works - - - - - - - -
Debt Service: - Principal Retirement - - - - - - - - Interest and Fiscal Charges - - - - - - - -
Capital Outlay - - - - - - 14,146 14,146 Total expenditures 853,894 134,287 - - - 123,565 231,011 2,135 1,344,893
Revenues over (under) expenditures (835,332) (62,331) 548,136 2,200 - 28,000 69,018 1,769 (248,542)
Other financing sources (uses):Transfers from other funds 1,183,648 16,570 - - - - 205,154 1,000 1,406,372 Transfers to other funds (76,036) (1,000) (520,000) - - - (274,171) (871,207) Proceeds of long-term debt - - - - - - - - Total Other Financing Sources (Uses) 1,107,612 15,570 (520,000) - - - (69,018) 1,000 535,165 Net change in fund balance 272,280 (46,761) 28,136 2,200 - 28,000 - 2,769 286,623
Fund balances, beginning of year 164,772 58,442 533,305 176,840 - 130,498 1,020 17,437 1,082,315 Fund balances, end of year 437,052$ 11,681$ 561,441$ 179,040$ -$ 158,498$ 1,020$ 20,206$ 1,368,938$
CITY OF SUISUN CITY REDEVELOPMENT AGENCY
Combining Statement of Revenues, Expenditures and Changes in Fund Balances
RDA-OTHER SPECIAL REVENUE FUNDS
For the fiscal year ended June 30, 2004
90
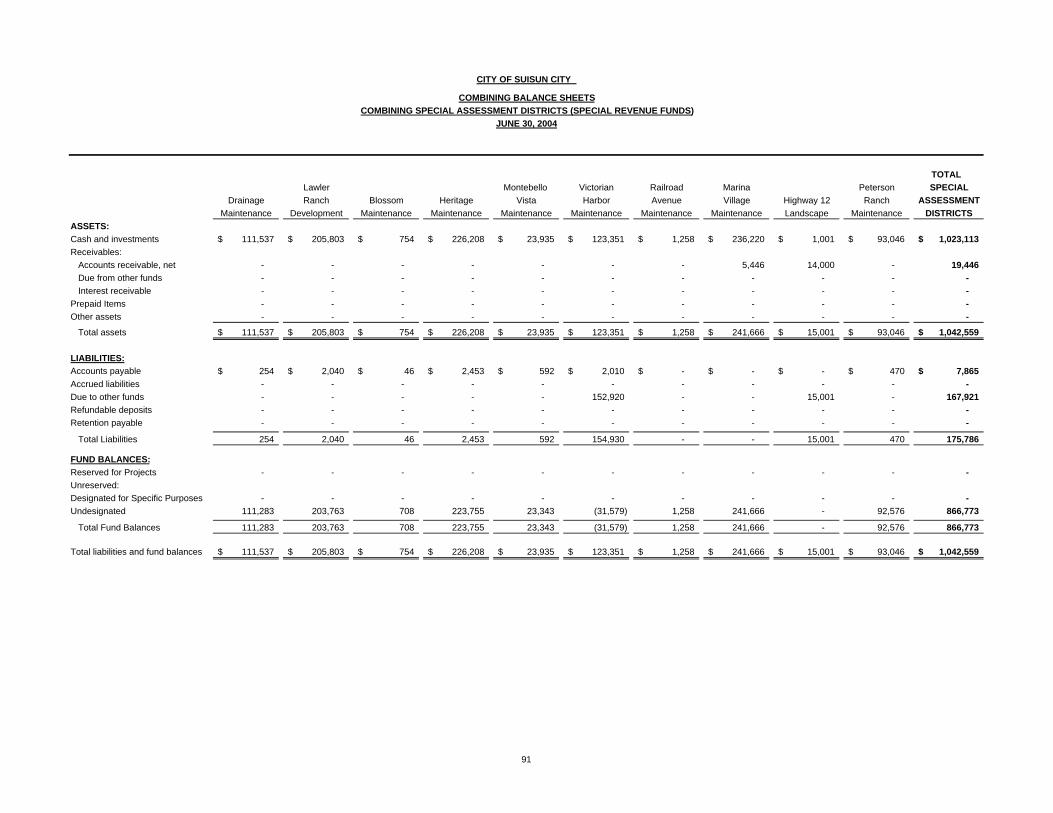
TOTAL Lawler Montebello Victorian Railroad Marina Peterson SPECIAL
Drainage Ranch Blossom Heritage Vista Harbor Avenue Village Highway 12 Ranch ASSESSMENTMaintenance Development Maintenance Maintenance Maintenance Maintenance Maintenance Maintenance Landscape Maintenance DISTRICTS
ASSETS: Cash and investments 111,537$ 205,803$ 754$ 226,208$ 23,935$ 123,351$ 1,258$ 236,220$ 1,001$ 93,046$ 1,023,113$ Receivables:
Accounts receivable, net - - - - - - - 5,446 14,000 - 19,446 Due from other funds - - - - - - - - - - - Interest receivable - - - - - - - - - - -
Prepaid Items - - - - - - - - - - - Other assets - - - - - - - - - - -
Total assets 111,537$ 205,803$ 754$ 226,208$ 23,935$ 123,351$ 1,258$ 241,666$ 15,001$ 93,046$ 1,042,559$
LIABILITIES:Accounts payable 254$ 2,040$ 46$ 2,453$ 592$ 2,010$ -$ -$ -$ 470$ 7,865$ Accrued liabilities - - - - - - - - - - - Due to other funds - - - - - 152,920 - - 15,001 - 167,921 Refundable deposits - - - - - - - - - - - Retention payable - - - - - - - - - - -
Total Liabilities 254 2,040 46 2,453 592 154,930 - - 15,001 470 175,786
FUND BALANCES:Reserved for Projects - - - - - - - - - - - Unreserved:Designated for Specific Purposes - - - - - - - - - - - Undesignated 111,283 203,763 708 223,755 23,343 (31,579) 1,258 241,666 - 92,576 866,773
Total Fund Balances 111,283 203,763 708 223,755 23,343 (31,579) 1,258 241,666 - 92,576 866,773
Total liabilities and fund balances 111,537$ 205,803$ 754$ 226,208$ 23,935$ 123,351$ 1,258$ 241,666$ 15,001$ 93,046$ 1,042,559$
CITY OF SUISUN CITY
COMBINING BALANCE SHEETSCOMBINING SPECIAL ASSESSMENT DISTRICTS (SPECIAL REVENUE FUNDS)
JUNE 30, 2004
91
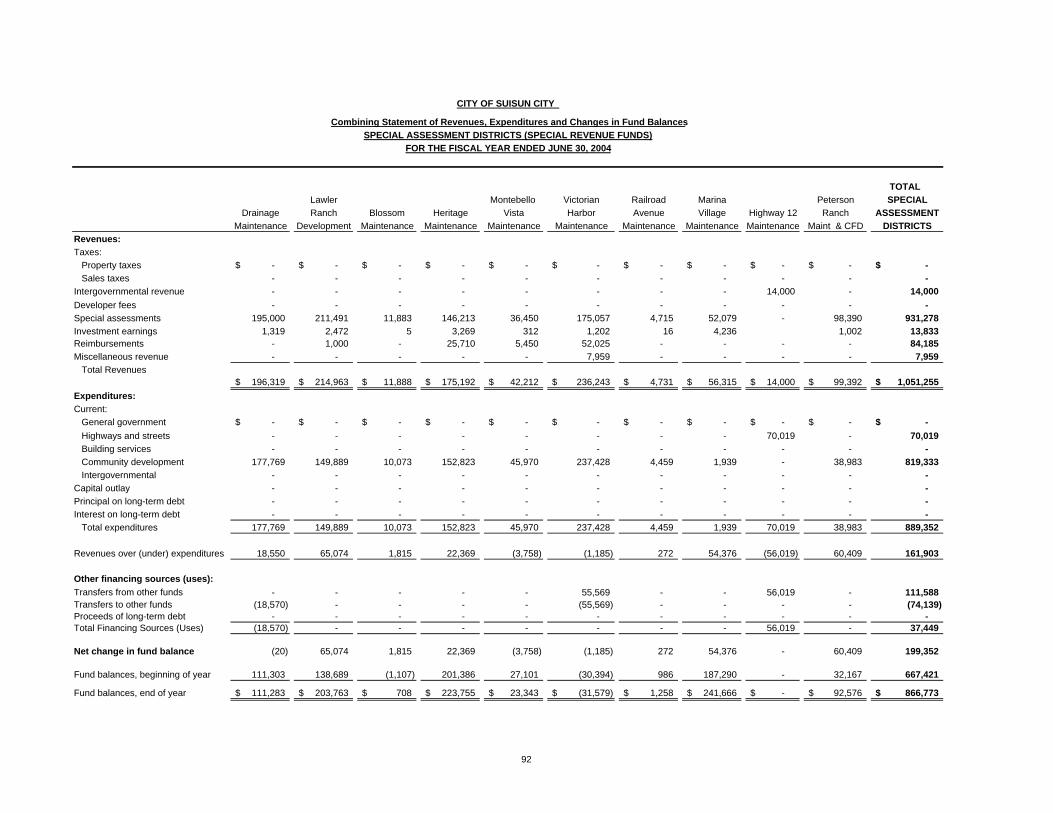
TOTAL Lawler Montebello Victorian Railroad Marina Peterson SPECIAL
Drainage Ranch Blossom Heritage Vista Harbor Avenue Village Highway 12 Ranch ASSESSMENTMaintenance Development Maintenance Maintenance Maintenance Maintenance Maintenance Maintenance Maintenance Maint & CFD DISTRICTS
Revenues:Taxes:
Property taxes -$ -$ -$ -$ -$ -$ -$ -$ -$ -$ -$ Sales taxes - - - - - - - - - - -
Intergovernmental revenue - - - - - - - - 14,000 - 14,000 Developer fees - - - - - - - - - - - Special assessments 195,000 211,491 11,883 146,213 36,450 175,057 4,715 52,079 - 98,390 931,278 Investment earnings 1,319 2,472 5 3,269 312 1,202 16 4,236 1,002 13,833 Reimbursements - 1,000 - 25,710 5,450 52,025 - - - - 84,185 Miscellaneous revenue - - - - - 7,959 - - - - 7,959
Total Revenues196,319$ 214,963$ 11,888$ 175,192$ 42,212$ 236,243$ 4,731$ 56,315$ 14,000$ 99,392$ 1,051,255$
Expenditures:Current:
General government -$ -$ -$ -$ -$ -$ -$ -$ -$ -$ -$ Highways and streets - - - - - - - - 70,019 - 70,019 Building services - - - - - - - - - - - Community development 177,769 149,889 10,073 152,823 45,970 237,428 4,459 1,939 - 38,983 819,333 Intergovernmental - - - - - - - - - - -
Capital outlay - - - - - - - - - - - Principal on long-term debt - - - - - - - - - - - Interest on long-term debt - - - - - - - - - - -
Total expenditures 177,769 149,889 10,073 152,823 45,970 237,428 4,459 1,939 70,019 38,983 889,352 Revenues over (under) expenditures 18,550 65,074 1,815 22,369 (3,758) (1,185) 272 54,376 (56,019) 60,409 161,903
Other financing sources (uses):Transfers from other funds - - - - - 55,569 - - 56,019 - 111,588 Transfers to other funds (18,570) - - - - (55,569) - - - - (74,139) Proceeds of long-term debt - - - - - - - - - - - Total Financing Sources (Uses) (18,570) - - - - - - - 56,019 - 37,449 Net change in fund balance (20) 65,074 1,815 22,369 (3,758) (1,185) 272 54,376 - 60,409 199,352
Fund balances, beginning of year 111,303 138,689 (1,107) 201,386 27,101 (30,394) 986 187,290 - 32,167 667,421 Fund balances, end of year 111,283$ 203,763$ 708$ 223,755$ 23,343$ (31,579)$ 1,258$ 241,666$ -$ 92,576$ 866,773$
CITY OF SUISUN CITY
Combining Statement of Revenues, Expenditures and Changes in Fund BalancesSPECIAL ASSESSMENT DISTRICTS (SPECIAL REVENUE FUNDS)
FOR THE FISCAL YEAR ENDED JUNE 30, 2004
92
I C i t y s f S u i s u n C i t y
Other Capital Projects Funds
Capital project funds are wed to account for the acquisition and construction of major capital facilities. These funds include:
I. Park Development Fund and Park Improvement Fund to account for impact fees and state grants to be spent only on parks and related projects.
2. Repair and Demolition Fund to account for .funds expended and repayments made for demolition and rebuilding of a property situated on 607 Main Street in the City.
3. Municipal Facilities and Equipment Fund to account for fwnds generatedfrom construction activity and expended for improvements necessitated by community powth.
4. Corporation Yard Fund accounts for funds transferred from other funds to b e e the relocation of the Corporation Yard facilities of the City.
5. Highway 12 Fund accounts fur the sources and uses of funds for the Highway 12 expansion project of the City.
6. YMCA Fund accounts for the sources and uses of funds for the rehabilitation of the Recreation Center and construction ofthe YMCA.
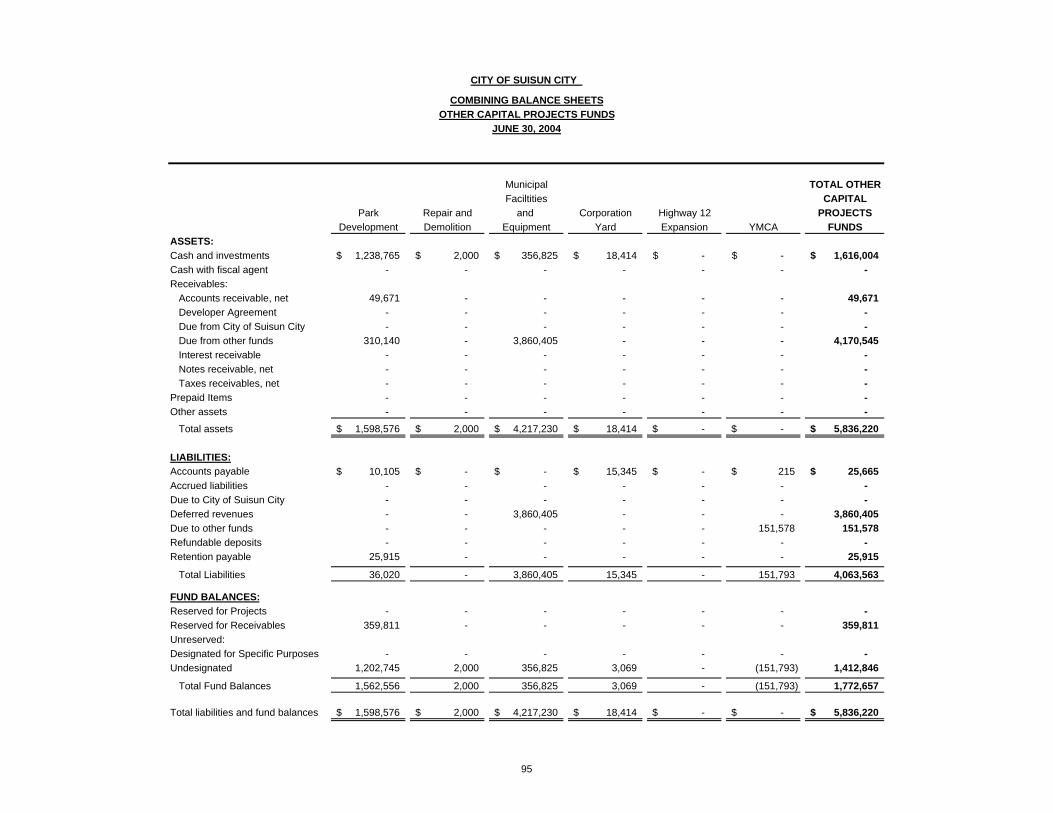
Municipal TOTAL OTHER Faciltities CAPITAL
Park Repair and and Corporation Highway 12 PROJECTSDevelopment Demolition Equipment Yard Expansion YMCA FUNDS
ASSETS: Cash and investments 1,238,765$ 2,000$ 356,825$ 18,414$ -$ -$ 1,616,004$ Cash with fiscal agent - - - - - - - Receivables:
Accounts receivable, net 49,671 - - - - - 49,671 Developer Agreement - - - - - - - Due from City of Suisun City - - - - - - - Due from other funds 310,140 - 3,860,405 - - - 4,170,545 Interest receivable - - - - - - - Notes receivable, net - - - - - - - Taxes receivables, net - - - - - - -
Prepaid Items - - - - - - - Other assets - - - - - - -
Total assets 1,598,576$ 2,000$ 4,217,230$ 18,414$ -$ -$ 5,836,220$
LIABILITIES:Accounts payable 10,105$ -$ -$ 15,345$ -$ 215$ 25,665$ Accrued liabilities - - - - - - - Due to City of Suisun City - - - - - - - Deferred revenues - - 3,860,405 - - - 3,860,405 Due to other funds - - - - - 151,578 151,578 Refundable deposits - - - - - - - Retention payable 25,915 - - - - - 25,915
Total Liabilities 36,020 - 3,860,405 15,345 - 151,793 4,063,563
FUND BALANCES:Reserved for Projects - - - - - - - Reserved for Receivables 359,811 - - - - - 359,811 Unreserved:Designated for Specific Purposes - - - - - - - Undesignated 1,202,745 2,000 356,825 3,069 - (151,793) 1,412,846
Total Fund Balances 1,562,556 2,000 356,825 3,069 - (151,793) 1,772,657
Total liabilities and fund balances 1,598,576$ 2,000$ 4,217,230$ 18,414$ -$ -$ 5,836,220$
CITY OF SUISUN CITY
COMBINING BALANCE SHEETSOTHER CAPITAL PROJECTS FUNDS
JUNE 30, 2004
95
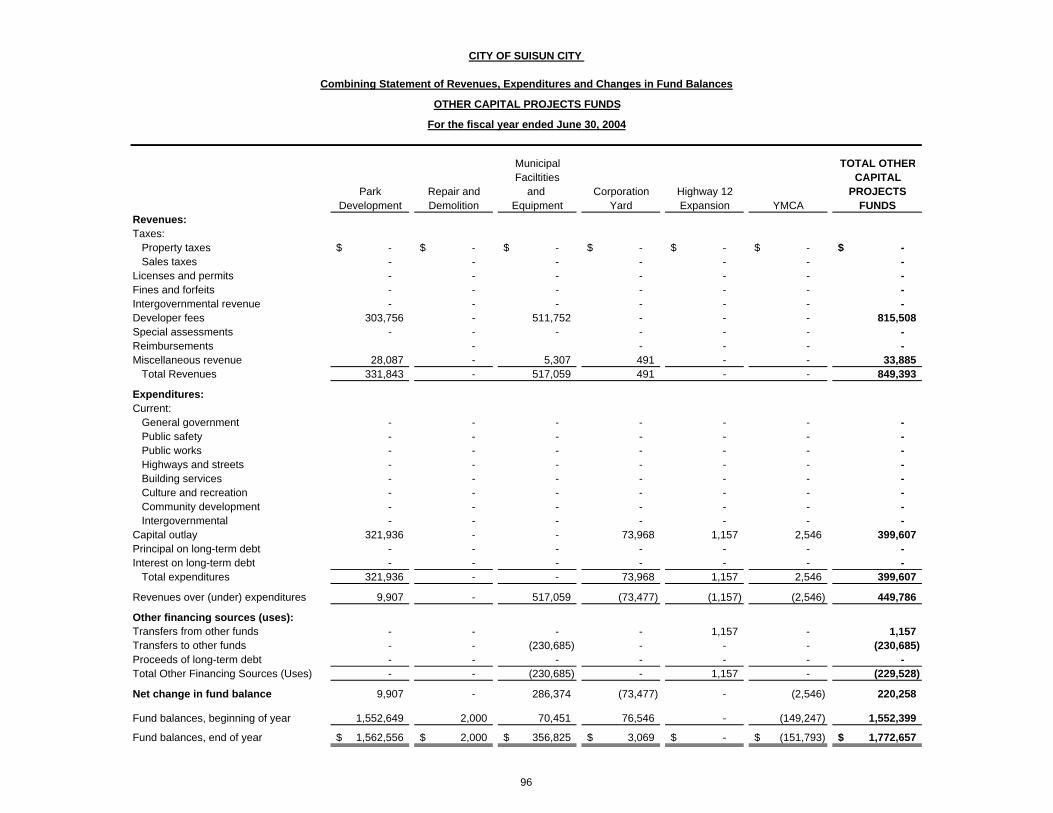
Municipal TOTAL OTHER Faciltities CAPITAL
Park Repair and and Corporation Highway 12 PROJECTSDevelopment Demolition Equipment Yard Expansion YMCA FUNDS
Revenues:Taxes:
Property taxes -$ -$ -$ -$ -$ -$ -$ Sales taxes - - - - - - -
Licenses and permits - - - - - - - Fines and forfeits - - - - - - - Intergovernmental revenue - - - - - - - Developer fees 303,756 - 511,752 - - - 815,508 Special assessments - - - - - - - Reimbursements - - - - - Miscellaneous revenue 28,087 - 5,307 491 - - 33,885
Total Revenues 331,843 - 517,059 491 - - 849,393
Expenditures:Current:
General government - - - - - - - Public safety - - - - - - - Public works - - - - - - - Highways and streets - - - - - - - Building services - - - - - - - Culture and recreation - - - - - - - Community development - - - - - - - Intergovernmental - - - - - - -
Capital outlay 321,936 - - 73,968 1,157 2,546 399,607 Principal on long-term debt - - - - - - - Interest on long-term debt - - - - - - -
Total expenditures 321,936 - - 73,968 1,157 2,546 399,607 Revenues over (under) expenditures 9,907 - 517,059 (73,477) (1,157) (2,546) 449,786
Other financing sources (uses):Transfers from other funds - - - - 1,157 - 1,157 Transfers to other funds - - (230,685) - - - (230,685) Proceeds of long-term debt - - - - - - - Total Other Financing Sources (Uses) - - (230,685) - 1,157 - (229,528) Net change in fund balance 9,907 - 286,374 (73,477) - (2,546) 220,258
Fund balances, beginning of year 1,552,649 2,000 70,451 76,546 - (149,247) 1,552,399 Fund balances, end of year 1,562,556$ 2,000$ 356,825$ 3,069$ -$ (151,793)$ 1,772,657$
CITY OF SUISUN CITY
Combining Statement of Revenues, Expenditures and Changes in Fund Balances
OTHER CAPITAL PROJECTS FUNDS
For the fiscal year ended June 30, 2004
96
I C i t y o f S u i s u n C i t y California
Other Debt Service Funds
Debt senice funds are used to account for the accumulation of resources and payment of principal and interest on general obligation bonds, Loans, notes and othw general 0bligad011~ of the City where sueh resources are accumulated from the City's other general governmental funds. The City has the following debt service funds:
I. Highway 12 Expansion Fmd to account for the debt service ofthe City's general obligation bonds issued for the W w a y 12 Expansion Project.
2* North Bay Aqueduct Fund for the debt senice of the City's obligtion for its share of the construction of Solano County water line.
3. Victorian Harbor Fund to account for the debt service of the City's obligation for the special assessment bonds Lsned for the construction of the Harbor subdivision.
4. Civic Center Fund for the debt service on the Certificates of Participation ismed for the construction of the Civic Center building.
5. YMCA Fund for the debt service on the City's loan for the construction of the YMCA facility.
6. Vehicle Lease Fund to account for the City's debt service for vehicles.
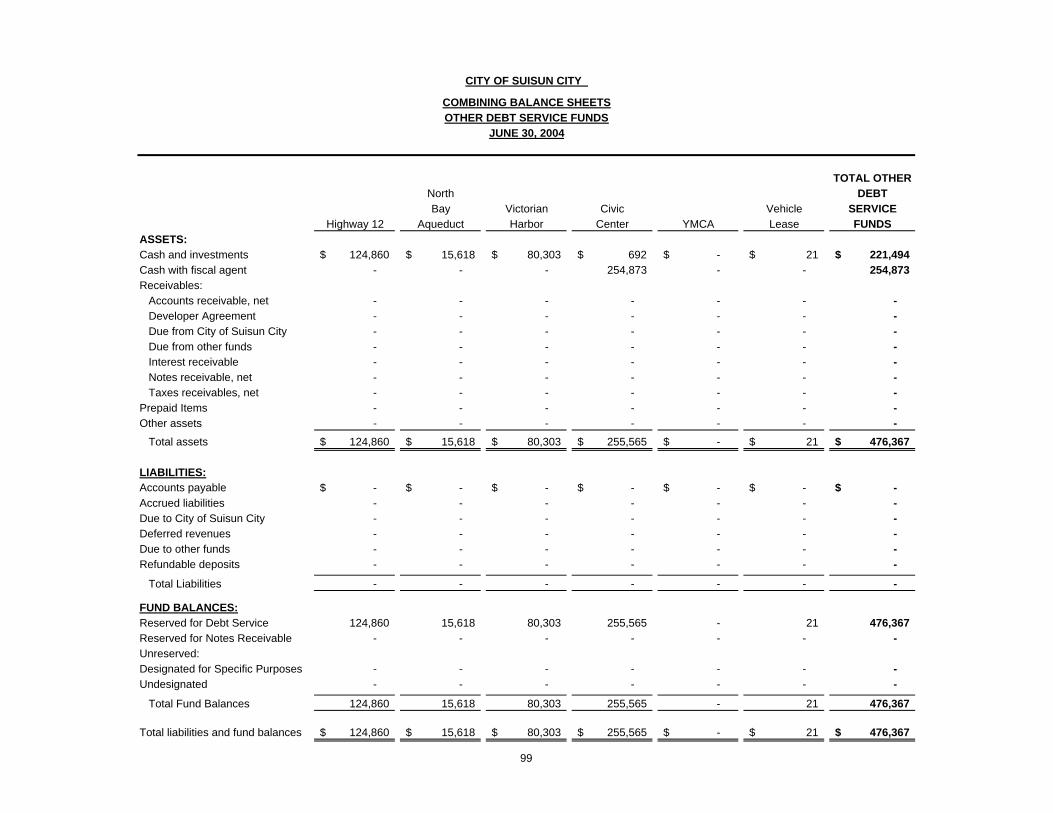
TOTAL OTHERNorth DEBT
Bay Victorian Civic Vehicle SERVICEHighway 12 Aqueduct Harbor Center YMCA Lease FUNDS
ASSETS: Cash and investments 124,860$ 15,618$ 80,303$ 692$ -$ 21$ 221,494$ Cash with fiscal agent - - - 254,873 - - 254,873 Receivables:
Accounts receivable, net - - - - - - - Developer Agreement - - - - - - - Due from City of Suisun City - - - - - - - Due from other funds - - - - - - - Interest receivable - - - - - - - Notes receivable, net - - - - - - - Taxes receivables, net - - - - - - -
Prepaid Items - - - - - - - Other assets - - - - - - -
Total assets 124,860$ 15,618$ 80,303$ 255,565$ -$ 21$ 476,367$
LIABILITIES:Accounts payable -$ -$ -$ -$ -$ -$ -$ Accrued liabilities - - - - - - - Due to City of Suisun City - - - - - - - Deferred revenues - - - - - - - Due to other funds - - - - - - - Refundable deposits - - - - - - -
Total Liabilities - - - - - - -
FUND BALANCES:Reserved for Debt Service 124,860 15,618 80,303 255,565 - 21 476,367 Reserved for Notes Receivable - - - - - - - Unreserved:Designated for Specific Purposes - - - - - - - Undesignated - - - - - - -
Total Fund Balances 124,860 15,618 80,303 255,565 - 21 476,367
Total liabilities and fund balances 124,860$ 15,618$ 80,303$ 255,565$ -$ 21$ 476,367$
CITY OF SUISUN CITY
COMBINING BALANCE SHEETSOTHER DEBT SERVICE FUNDS
JUNE 30, 2004
99
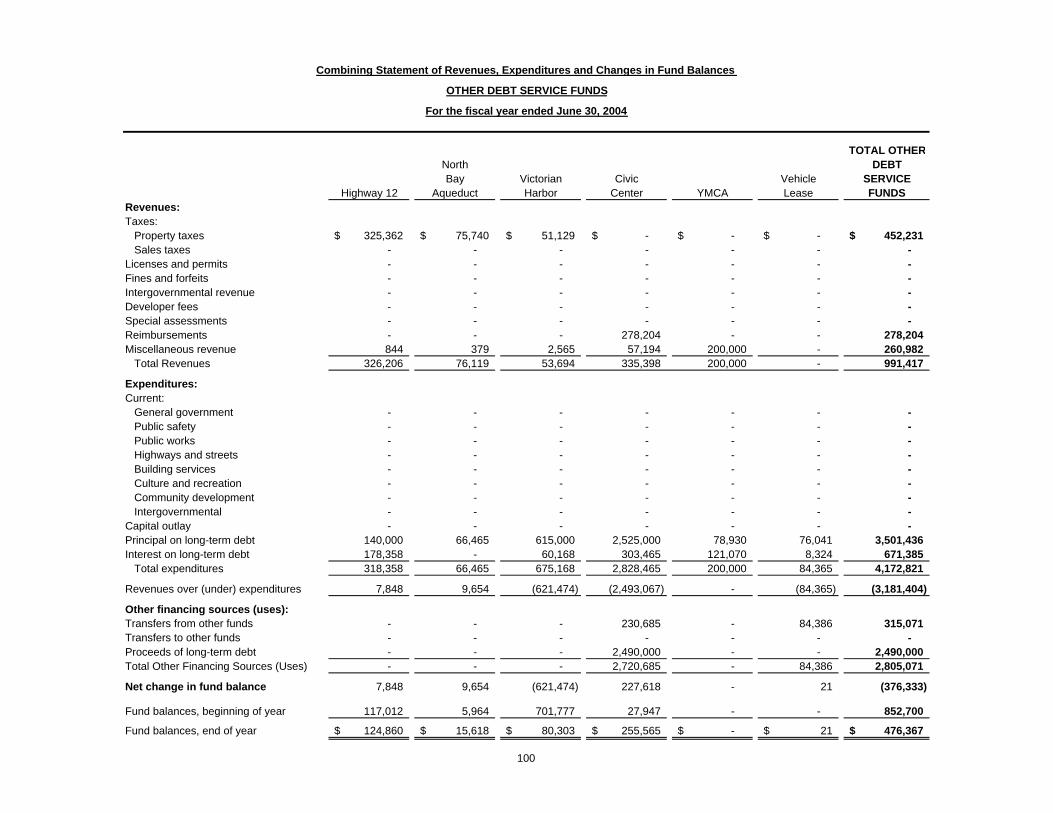
TOTAL OTHERNorth DEBT
Bay Victorian Civic Vehicle SERVICEHighway 12 Aqueduct Harbor Center YMCA Lease FUNDS
Revenues:Taxes:
Property taxes 325,362$ 75,740$ 51,129$ -$ -$ -$ 452,231$ Sales taxes - - - - - - -
Licenses and permits - - - - - - - Fines and forfeits - - - - - - - Intergovernmental revenue - - - - - - - Developer fees - - - - - - - Special assessments - - - - - - - Reimbursements - - - 278,204 - - 278,204 Miscellaneous revenue 844 379 2,565 57,194 200,000 - 260,982
Total Revenues 326,206 76,119 53,694 335,398 200,000 - 991,417
Expenditures:Current:
General government - - - - - - - Public safety - - - - - - - Public works - - - - - - - Highways and streets - - - - - - - Building services - - - - - - - Culture and recreation - - - - - - - Community development - - - - - - - Intergovernmental - - - - - - -
Capital outlay - - - - - - - Principal on long-term debt 140,000 66,465 615,000 2,525,000 78,930 76,041 3,501,436 Interest on long-term debt 178,358 - 60,168 303,465 121,070 8,324 671,385
Total expenditures 318,358 66,465 675,168 2,828,465 200,000 84,365 4,172,821 Revenues over (under) expenditures 7,848 9,654 (621,474) (2,493,067) - (84,365) (3,181,404)
Other financing sources (uses):Transfers from other funds - - - 230,685 - 84,386 315,071 Transfers to other funds - - - - - - - Proceeds of long-term debt - - - 2,490,000 - - 2,490,000 Total Other Financing Sources (Uses) - - - 2,720,685 - 84,386 2,805,071 Net change in fund balance 7,848 9,654 (621,474) 227,618 - 21 (376,333)
Fund balances, beginning of year 117,012 5,964 701,777 27,947 - - 852,700 Fund balances, end of year 124,860$ 15,618$ 80,303$ 255,565$ -$ 21$ 476,367$
Combining Statement of Revenues, Expenditures and Changes in Fund Balances
OTHER DEBT SERVICE FUNDS
For the fiscal year ended June 30, 2004
100
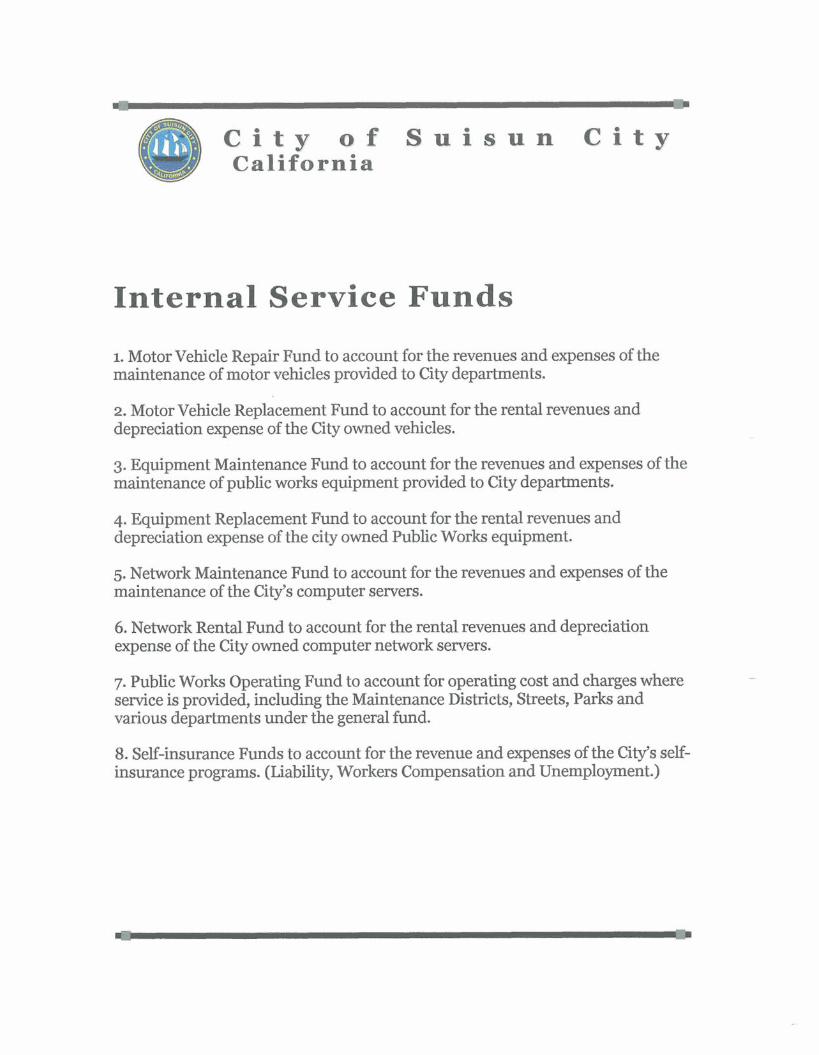
C i t y o f S u i s u n C i t y California
Internal Service Funds
1. Motor Vehicle Repair Fund to account for the revenues and expenses of the maintenance of motor vehicles provided to City departments.
2 Motor Vehicle Replacement Fund to account for the rental revenues and depreciation expense of the City owned vehicles.
3. Equipment Maintenance Fund to account for the revenues and expenses of the maintenance of public works equipment provided to City departments.
4. Equipment Replacement Fund to account for the rental revenues and depreciation expense of the city owned Public Works equipment.
5. Network Maintenance Fund to account for the revenues and expenses of the maintenance of the City's computer sewers.
6. Network Rental Fund to account for the rental revenues and depreciation expense of the City owned computer network sewers.
7. PubIic Works Operating Fund to account for operating cost and charges where s d c e is provided, including the Maintenance DisMcts, Streeb, Parks and various departments under the general fund.
8. Self-hswance Funds to account for the revenue and expenses of the City% self- insurance programs. (Liability, Workers Compensation and Unemployment.)
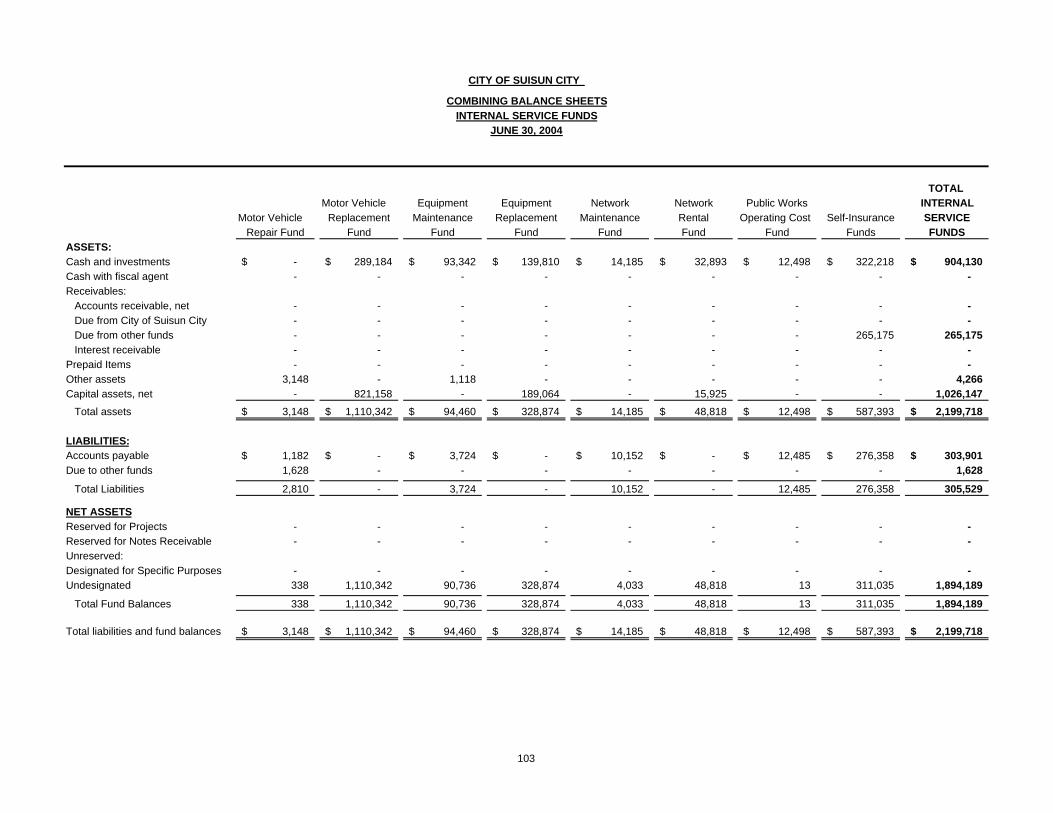
TOTAL Motor Vehicle Equipment Equipment Network Network Public Works INTERNAL
Motor Vehicle Replacement Maintenance Replacement Maintenance Rental Operating Cost Self-Insurance SERVICERepair Fund Fund Fund Fund Fund Fund Fund Funds FUNDS
ASSETS: Cash and investments -$ 289,184$ 93,342$ 139,810$ 14,185$ 32,893$ 12,498$ 322,218$ 904,130$ Cash with fiscal agent - - - - - - - - - Receivables:
Accounts receivable, net - - - - - - - - - Due from City of Suisun City - - - - - - - - - Due from other funds - - - - - - - 265,175 265,175 Interest receivable - - - - - - - - -
Prepaid Items - - - - - - - - - Other assets 3,148 - 1,118 - - - - - 4,266 Capital assets, net - 821,158 - 189,064 - 15,925 - - 1,026,147
Total assets 3,148$ 1,110,342$ 94,460$ 328,874$ 14,185$ 48,818$ 12,498$ 587,393$ 2,199,718$
LIABILITIES:Accounts payable 1,182$ -$ 3,724$ -$ 10,152$ -$ 12,485$ 276,358$ 303,901$ Due to other funds 1,628 - - - - - - - 1,628
Total Liabilities 2,810 - 3,724 - 10,152 - 12,485 276,358 305,529
NET ASSETSReserved for Projects - - - - - - - - - Reserved for Notes Receivable - - - - - - - - - Unreserved:Designated for Specific Purposes - - - - - - - - - Undesignated 338 1,110,342 90,736 328,874 4,033 48,818 13 311,035 1,894,189
Total Fund Balances 338 1,110,342 90,736 328,874 4,033 48,818 13 311,035 1,894,189
Total liabilities and fund balances 3,148$ 1,110,342$ 94,460$ 328,874$ 14,185$ 48,818$ 12,498$ 587,393$ 2,199,718$
CITY OF SUISUN CITY
COMBINING BALANCE SHEETSINTERNAL SERVICE FUNDS
JUNE 30, 2004
103
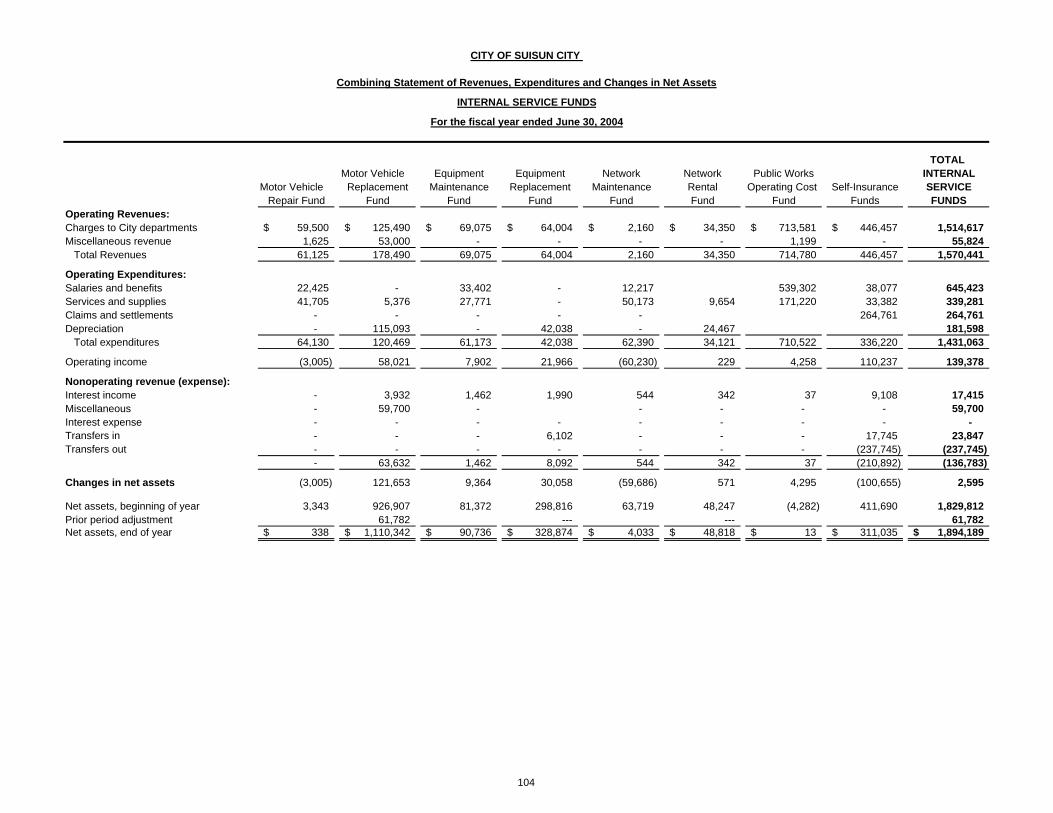
TOTAL Motor Vehicle Equipment Equipment Network Network Public Works INTERNAL
Motor Vehicle Replacement Maintenance Replacement Maintenance Rental Operating Cost Self-Insurance SERVICERepair Fund Fund Fund Fund Fund Fund Fund Funds FUNDS
Operating Revenues:Charges to City departments 59,500$ 125,490$ 69,075$ 64,004$ 2,160$ 34,350$ 713,581$ 446,457$ 1,514,617 Miscellaneous revenue 1,625 53,000 - - - - 1,199 - 55,824
Total Revenues 61,125 178,490 69,075 64,004 2,160 34,350 714,780 446,457 1,570,441
Operating Expenditures:Salaries and benefits 22,425 - 33,402 - 12,217 539,302 38,077 645,423 Services and supplies 41,705 5,376 27,771 - 50,173 9,654 171,220 33,382 339,281 Claims and settlements - - - - - 264,761 264,761 Depreciation - 115,093 - 42,038 - 24,467 181,598
Total expenditures 64,130 120,469 61,173 42,038 62,390 34,121 710,522 336,220 1,431,063 Operating income (3,005) 58,021 7,902 21,966 (60,230) 229 4,258 110,237 139,378
Nonoperating revenue (expense):Interest income - 3,932 1,462 1,990 544 342 37 9,108 17,415 Miscellaneous - 59,700 - - - - - 59,700 Interest expense - - - - - - - - - Transfers in - - - 6,102 - - - 17,745 23,847 Transfers out - - - - - - - (237,745) (237,745) - 63,632 1,462 8,092 544 342 37 (210,892) (136,783) Changes in net assets (3,005) 121,653 9,364 30,058 (59,686) 571 4,295 (100,655) 2,595
Net assets, beginning of year 3,343 926,907 81,372 298,816 63,719 48,247 (4,282) 411,690 1,829,812 Prior period adjustment 61,782 --- --- 61,782 Net assets, end of year 338$ 1,110,342$ 90,736$ 328,874$ 4,033$ 48,818$ 13$ 311,035$ 1,894,189$
CITY OF SUISUN CITY
Combining Statement of Revenues, Expenditures and Changes in Net Assets
INTERNAL SERVICE FUNDS
For the fiscal year ended June 30, 2004
104
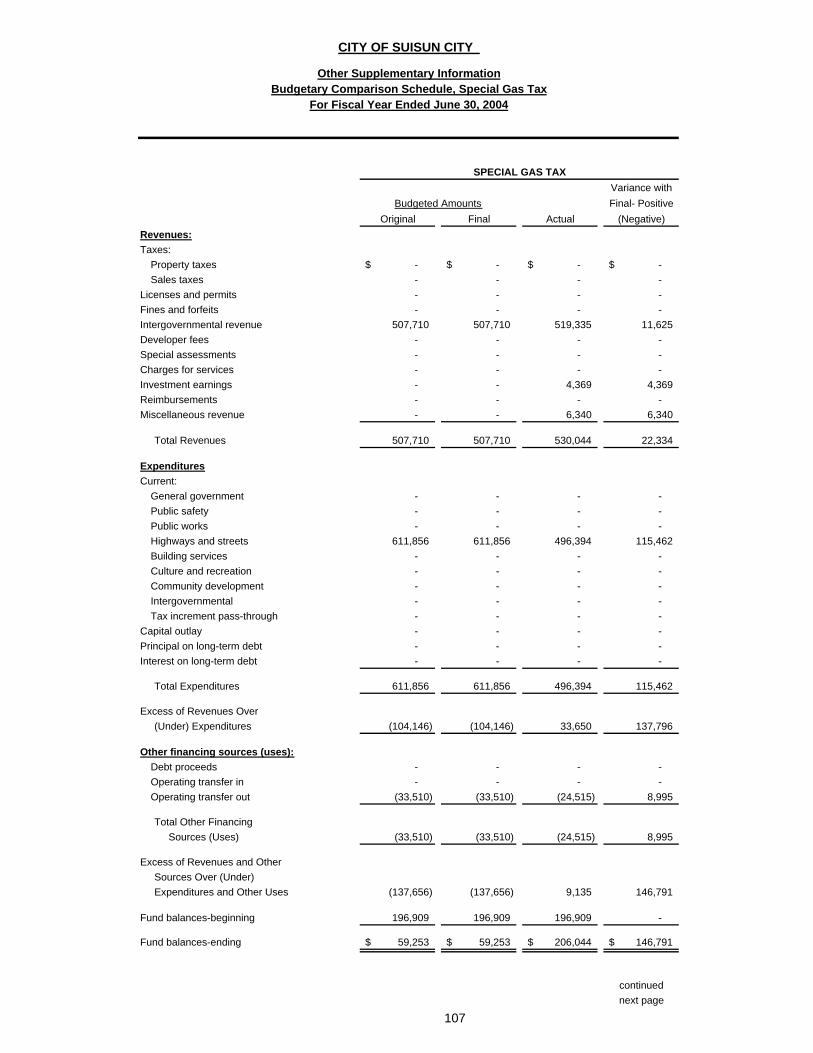
Variance withFinal- Positive
Original Final Actual (Negative)Revenues:Taxes:
Property taxes -$ -$ -$ -$ Sales taxes - - - -
Licenses and permits - - - - Fines and forfeits - - - - Intergovernmental revenue 507,710 507,710 519,335 11,625 Developer fees - - - - Special assessments - - - - Charges for services - - - - Investment earnings - - 4,369 4,369 Reimbursements - - - - Miscellaneous revenue - - 6,340 6,340
Total Revenues 507,710 507,710 530,044 22,334
ExpendituresCurrent:
General government - - - - Public safety - - - - Public works - - - - Highways and streets 611,856 611,856 496,394 115,462 Building services - - - - Culture and recreation - - - - Community development - - - - Intergovernmental - - - - Tax increment pass-through - - - -
Capital outlay - - - - Principal on long-term debt - - - - Interest on long-term debt - - - -
Total Expenditures 611,856 611,856 496,394 115,462
Excess of Revenues Over (Under) Expenditures (104,146) (104,146) 33,650 137,796
Other financing sources (uses):Debt proceeds - - - - Operating transfer in - - - - Operating transfer out (33,510) (33,510) (24,515) 8,995
Total Other Financing Sources (Uses) (33,510) (33,510) (24,515) 8,995
Excess of Revenues and Other Sources Over (Under) Expenditures and Other Uses (137,656) (137,656) 9,135 146,791
Fund balances-beginning 196,909 196,909 196,909 -
Fund balances-ending 59,253$ 59,253$ 206,044$ 146,791$
continuednext page
CITY OF SUISUN CITY
Other Supplementary InformationBudgetary Comparison Schedule, Special Gas Tax
107
For Fiscal Year Ended June 30, 2004
SPECIAL GAS TAX
Budgeted Amounts
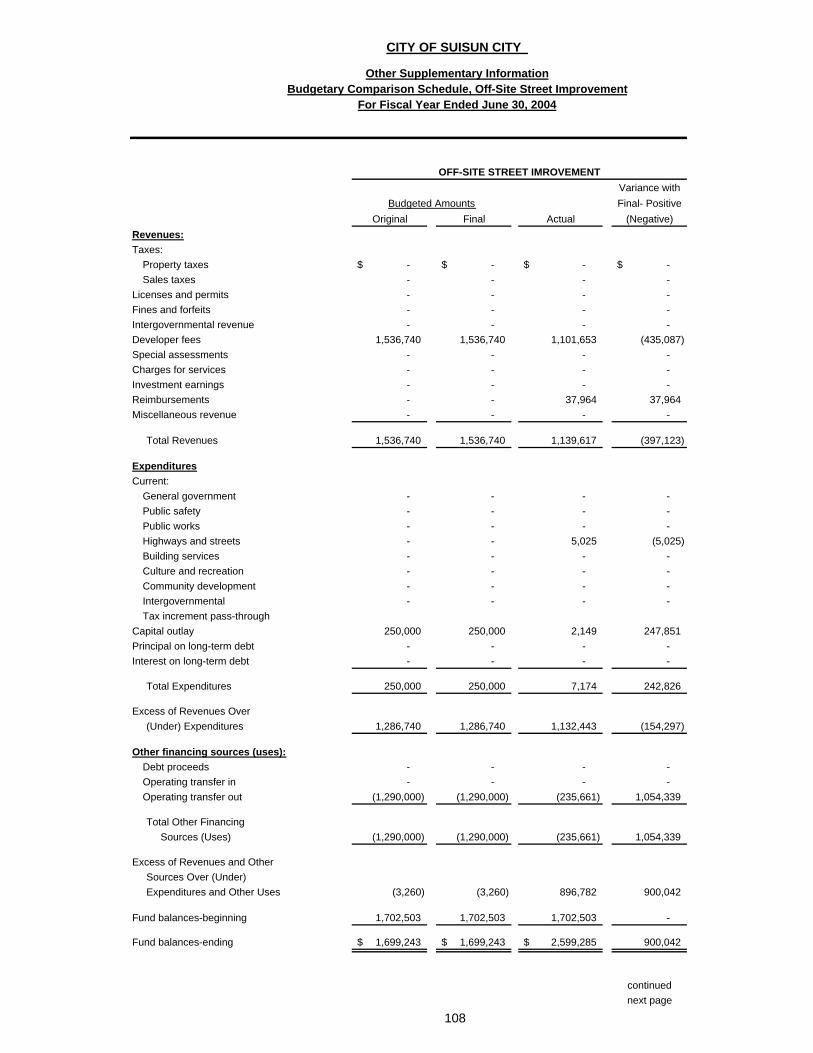
Variance withFinal- Positive
Original Final Actual (Negative)Revenues:Taxes:
Property taxes -$ -$ -$ -$ Sales taxes - - - -
Licenses and permits - - - - Fines and forfeits - - - - Intergovernmental revenue - - - - Developer fees 1,536,740 1,536,740 1,101,653 (435,087) Special assessments - - - - Charges for services - - - - Investment earnings - - - - Reimbursements - - 37,964 37,964 Miscellaneous revenue - - - -
Total Revenues 1,536,740 1,536,740 1,139,617 (397,123)
ExpendituresCurrent:
General government - - - - Public safety - - - - Public works - - - - Highways and streets - - 5,025 (5,025) Building services - - - - Culture and recreation - - - - Community development - - - - Intergovernmental - - - - Tax increment pass-through
Capital outlay 250,000 250,000 2,149 247,851 Principal on long-term debt - - - - Interest on long-term debt - - - -
Total Expenditures 250,000 250,000 7,174 242,826
Excess of Revenues Over (Under) Expenditures 1,286,740 1,286,740 1,132,443 (154,297)
Other financing sources (uses):Debt proceeds - - - - Operating transfer in - - - - Operating transfer out (1,290,000) (1,290,000) (235,661) 1,054,339
Total Other Financing Sources (Uses) (1,290,000) (1,290,000) (235,661) 1,054,339
Excess of Revenues and Other Sources Over (Under) Expenditures and Other Uses (3,260) (3,260) 896,782 900,042
Fund balances-beginning 1,702,503 1,702,503 1,702,503 -
Fund balances-ending 1,699,243$ 1,699,243$ 2,599,285$ 900,042
continuednext page
CITY OF SUISUN CITY
Other Supplementary InformationBudgetary Comparison Schedule, Off-Site Street Improvement
108
OFF-SITE STREET IMROVEMENT
Budgeted Amounts
For Fiscal Year Ended June 30, 2004

Variance withFinal- Positive
Original Final Actual (Negative)Revenues:Taxes:
Property taxes -$ -$ -$ -$ Sales taxes - - - -
Licenses and permits - - - - Fines and forfeits - - - - Intergovernmental revenue 30,440 30,440 33,745 3,305 Developer fees - - - - Special assessments - - - - Charges for services - - - - Investment earnings - - 1,511 1,511 Reimbursements - - - - Miscellaneous revenue - - - -
Total Revenues 30,440 30,440 35,256 4,816
ExpendituresCurrent:
General government - - - - Public safety - - - - Public works - - - - Highways and streets - - - - Building services - - - - Culture and recreation - - - - Community development 42,420 42,420 34,033 8,387 Intergovernmental - - - - Tax increment pass-through - -
Capital outlay - - - - Principal on long-term debt - - - - Interest on long-term debt - - - -
Total Expenditures 42,420 42,420 34,033 8,387
Excess of Revenues Over (Under) Expenditures (11,980) (11,980) 1,223 13,203
Other financing sources (uses):Debt proceeds - - - - Operating transfer in - - - - Operating transfer out - - - -
Total Other Financing Sources (Uses) - - - -
Excess of Revenues and Other Sources Over (Under) Expenditures and Other Uses (11,980) (11,980) 1,223 13,203
Fund balances-beginning 88,505 88,505 88,505 -
Fund balances-ending 76,525$ 76,525$ 89,728$ 13,203$
CITY OF SUISUN CITY
Other Supplementary InformationBudgetary Comparison Schedule, AB939
For Fiscal Year Ended June 30, 2004
AB 939
Budgeted Amounts
109

Variance withFinal- Positive
Original Final Actual (Negative)Revenues:Taxes:
Property taxes -$ -$ -$ -$ Sales taxes - - - -
Licenses and permits - - - - Fines and forfeits - - - - Intergovernmental revenue - - - - Developer fees - - - - Special assessments - - - - Charges for services - - - - Investment earnings - - 733 733 Reimbursements - - - - Miscellaneous revenue - - - -
Total Revenues - - 733 733
ExpendituresCurrent:
General government - - - - Public safety - - - - Public works - - - - Highways and streets - - - - Building services - - - - Culture and recreation - - - - Community development 6,250 6,250 - 6,250 Intergovernmental - - - - Tax increment pass-through - - - -
Capital outlay - - - - Principal on long-term debt - - - - Interest on long-term debt - - - -
Total Expenditures 6,250 6,250 - 6,250
Excess of Revenues Over (Under) Expenditures (6,250) (6,250) 733 6,983
Other financing sources (uses):Debt proceeds - - - - Operating transfer in - - - - Operating transfer out - - - -
Total Other Financing Sources (Uses) - - - -
Excess of Revenues and Other Sources Over (Under) Expenditures and Other Uses (6,250) (6,250) 733 6,983
Fund balances-beginning 44,422 44,422 44,422 -
Fund balances-ending 38,172$ 38,172$ 45,155$ 6,983$
Budgeted Amounts
110
CITY OF SUISUN CITY
Other Supplementary InformationBudgetary Comparison Schedule, Housing Authority Non-HUD
For Fiscal Year Ended June 30, 2004
HOUSING AUTHORITY NON-HUD

Variance withFinal- Positive
Original Final Actual (Negative)Revenues:Taxes:
Property taxes -$ -$ -$ -$ Sales taxes - - - -
Licenses and permits - - - - Fines and forfeits - - - - Intergovernmental revenue - - 55,357 55,357 Developer fees - - - - Special assessments - - - - Charges for services - - - - Investment earnings - - - - Reimbursements - - - - Miscellaneous revenue - - - -
Total Revenues - - 55,357 55,357
ExpendituresCurrent:
General government - - - - Public safety - - 52,230 (52,230) Public works - - - - Highways and streets - - - - Building services - - - - Culture and recreation - - - - Community development - - - - Intergovernmental - - - - Tax increment pass-through - -
Capital outlay - - - - Principal on long-term debt - - - - Interest on long-term debt - - - -
Total Expenditures - - 52,230 (52,230)
Excess of Revenues Over (Under) Expenditures - - 3,127 3,127
Other financing sources (uses):Debt proceeds - - - - Operating transfer in - - - - Operating transfer out - - - -
Total Other Financing Sources (Uses) - - - -
Excess of Revenues and Other Sources Over (Under) Expenditures and Other Uses - - 3,127 3,127
Fund balances-beginning 2,400 2,400 2,400 -
Fund balances-ending 2,400$ 2,400$ 5,527$ 3,127$
ATOD GRANT
Budgeted Amounts
111
CITY OF SUISUN CITY
Other Supplementary InformationBudgetary Comparison Schedule, ATOD GRANT
For Fiscal Year Ended June 30, 2004

Variance withBudgeted Amounts Final- Positive
Original Final Actual (Negative)Revenues:Taxes:
Property taxes -$ -$ -$ -$ Sales taxes - - - -
Licenses and permits - - - - Fines and forfeits - - - - Intergovernmental revenue 234,400 234,400 254,226 19,826 Developer fees - - - - Special assessments - - - - Charges for services - - - - Investment earnings - - 8,602 8,602 Reimbursements - - - - Miscellaneous revenue - - - -
Total Revenues 234,400 234,400 262,828 28,428
ExpendituresCurrent:
General government - - - - Public safety - - - - Public works 208,180 208,180 155,246 52,934 Highways and streets - - - - Building services - - - - Culture and recreation - - - - Community development - - - - Intergovernmental - - - - Tax increment pass-through - -
Capital outlay - - - - Principal on long-term debt - - - - Interest on long-term debt - - - -
Total Expenditures 208,180 208,180 155,246 52,934
Excess of Revenues Over (Under) Expenditures 26,220 26,220 107,582 81,362
Other financing sources (uses):Debt proceeds - - - - Operating transfer in - - - - Operating transfer out (1,190) (1,190) (1,190) -
Total Other Financing Sources (Uses) (1,190) (1,190) (1,190) -
Excess of Revenues and Other Sources Over (Under) Expenditures and Other Uses 25,030 25,030 106,392 81,362
Fund balances-beginning 454,020 454,020 454,020 -
Fund balances-ending 479,050$ 479,050$ 560,412$ 81,362$
CITY OF SUISUN CITY
Other Supplementary InformationBudgetary Comparison Schedule, Sewer Maintenance
For Fiscal Year Ended June 30, 2004
SEWER MAINTENANCE
112
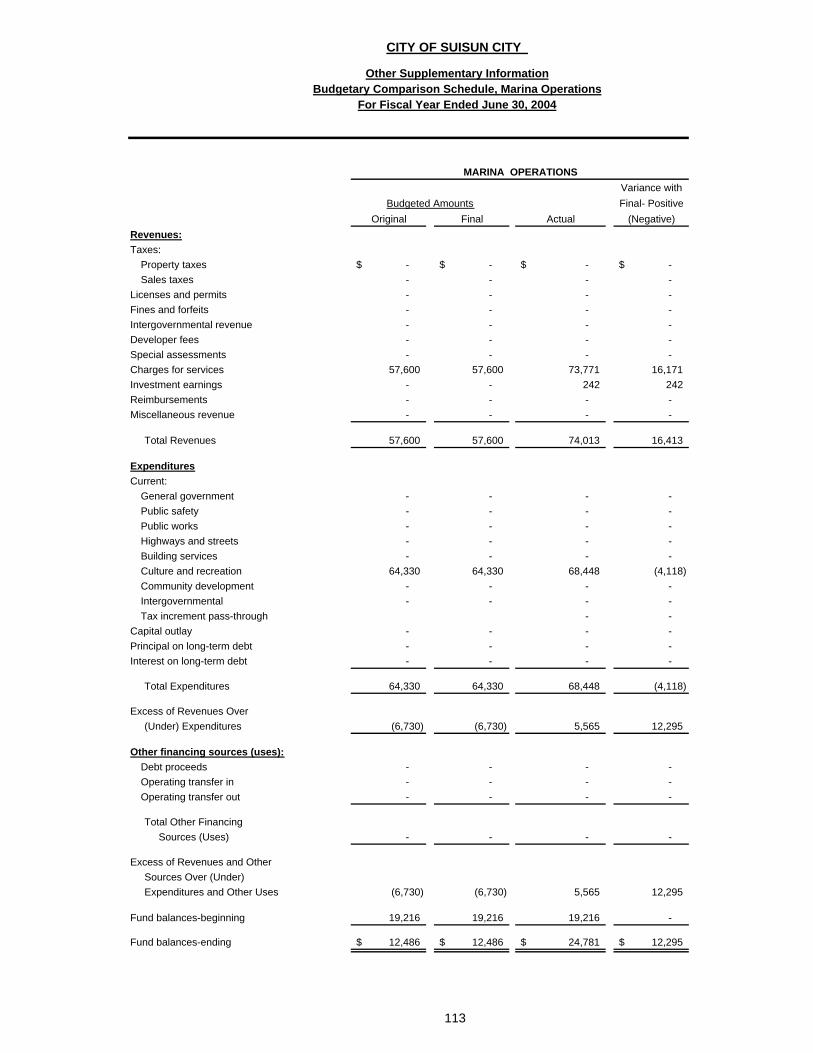
Variance withFinal- Positive
Original Final Actual (Negative)Revenues:Taxes:
Property taxes -$ -$ -$ -$ Sales taxes - - - -
Licenses and permits - - - - Fines and forfeits - - - - Intergovernmental revenue - - - - Developer fees - - - - Special assessments - - - - Charges for services 57,600 57,600 73,771 16,171 Investment earnings - - 242 242 Reimbursements - - - - Miscellaneous revenue - - - -
Total Revenues 57,600 57,600 74,013 16,413
ExpendituresCurrent:
General government - - - - Public safety - - - - Public works - - - - Highways and streets - - - - Building services - - - - Culture and recreation 64,330 64,330 68,448 (4,118) Community development - - - - Intergovernmental - - - - Tax increment pass-through - -
Capital outlay - - - - Principal on long-term debt - - - - Interest on long-term debt - - - -
Total Expenditures 64,330 64,330 68,448 (4,118)
Excess of Revenues Over (Under) Expenditures (6,730) (6,730) 5,565 12,295
Other financing sources (uses):Debt proceeds - - - - Operating transfer in - - - - Operating transfer out - - - -
Total Other Financing Sources (Uses) - - - -
Excess of Revenues and Other Sources Over (Under) Expenditures and Other Uses (6,730) (6,730) 5,565 12,295
Fund balances-beginning 19,216 19,216 19,216 -
Fund balances-ending 12,486$ 12,486$ 24,781$ 12,295$
CITY OF SUISUN CITY
Other Supplementary InformationBudgetary Comparison Schedule, Marina Operations
For Fiscal Year Ended June 30, 2004
Budgeted Amounts
113
MARINA OPERATIONS

Variance withFinal- Positive
Original Final Actual (Negative)Revenues:Taxes:
Property taxes -$ -$ -$ -$ Sales taxes - - - -
Licenses and permits - - - - Fines and forfeits - - - - Intergovernmental revenue - - - - Developer fees - - - - Special assessments - - - - Charges for services - - - - Investment earnings - - - - Reimbursements - - - - Miscellaneous revenue - - - -
Total Revenues - - - -
ExpendituresCurrent:
General government - - - - Public safety - - - - Public works - - - - Highways and streets 68,974 68,974 68,974 - Building services - - - - Culture and recreation - - - - Community development - - - - Intergovernmental - - - - Tax increment pass-through - -
Capital outlay - - - - Principal on long-term debt - - - - Interest on long-term debt - - - -
Total Expenditures 68,974 68,974 68,974 -
Excess of Revenues Over (Under) Expenditures (68,974) (68,974) (68,974) -
Other financing sources (uses):Debt proceeds - - - - Operating transfer in - - - - Operating transfer out - - - -
Total Other Financing Sources (Uses) - - - -
Excess of Revenues and Other Sources Over (Under) Expenditures and Other Uses (68,974) (68,974) (68,974) -
Fund balances-beginning 68,974 68,974 68,974 -
Fund balances-ending -$ -$ -$ -$
Traffic Congestion Relief
Budgeted Amounts
114
CITY OF SUISUN CITY
Other Supplementary InformationBudgetary Comparison Schedule, Traffic Congestion Relief
For Fiscal Year Ended June 30, 2004

Variance withFinal- Positive
Original Final Actual (Negative)Revenues:Taxes:
Property taxes 3,820$ 3,820$ 4,253$ 433$ Sales taxes - - - -
Licenses and permits - - - - Fines and forfeits - - - - Intergovernmental revenue 39,480 39,480 30,354 (9,126) Developer fees - - - - Special assessments - - - - Charges for services - - - - Investment earnings - - - - Reimbursements - - - - Miscellaneous revenue - - - -
Total Revenues 43,300 43,300 34,607 (8,693)
ExpendituresCurrent:
General government - - - - Public safety 43,300 43,300 34,607 8,693 Public works - - - - Highways and streets - - - - Building services - - - - Culture and recreation - - - - Community development - - - - Intergovernmental - - - - Tax increment pass-through - -
Capital outlay - - - - Principal on long-term debt - - - - Interest on long-term debt - - - -
Total Expenditures 43,300 43,300 34,607 8,693
Excess of Revenues Over (Under) Expenditures - - - -
Other financing sources (uses):Debt proceeds - - - - Operating transfer in - - - - Operating transfer out - - - -
Total Other Financing Sources (Uses) - - - -
Excess of Revenues and Other Sources Over (Under) Expenditures and Other Uses - - - -
Fund balances-beginning - - - -
Fund balances-ending -$ -$ -$ -$
CITY OF SUISUN CITY
Other Supplementary InformationBudgetary Comparison Schedule, Boating Safety Grant
For Fiscal Year Ended June 30, 2004
BOATING SAFETY GRANT
Budgeted Amounts
115

Variance withFinal- Positive
Original Final Actual (Negative)Revenues:Taxes:
Property taxes -$ -$ -$ -$ Sales taxes - - - -
Licenses and permits - - - - Fines and forfeits - - - - Intergovernmental revenue - - - - Developer fees - - - - Special assessments - - - - Charges for services - - - - Investment earnings - - 139 139 Reimbursements - - - - Miscellaneous revenue 3,650 3,650 9,029 5,379
Total Revenues 3,650 3,650 9,168 5,518
ExpendituresCurrent:
General government - - - - Public safety - - - - Public works - - - - Highways and streets - - - - Building services - - - - Culture and recreation - - - - Community development - - - - Intergovernmental - - - - Tax increment pass-through - - - -
Capital outlay - - - - Principal on long-term debt - - - - Interest on long-term debt - - - -
Total Expenditures - - - -
Excess of Revenues Over (Under) Expenditures 3,650 3,650 9,168 5,518
Other financing sources (uses):Debt proceeds - - - - Operating transfer in - - - - Operating transfer out - - - -
Total Other Financing Sources (Uses) - - - -
Excess of Revenues and Other Sources Over (Under) Expenditures and Other Uses 3,650 3,650 9,168 5,518
Fund balances-beginning 952 952 952 -
Fund balances-ending 4,602$ 4,602$ 10,120$ 5,518$
ASSET FORFEITURE
Budgeted Amounts
116
CITY OF SUISUN CITY
Other Supplementary InformationBudgetary Comparison Schedule, Asset Forfeiture
For Fiscal Year Ended June 30, 2004

Variance withFinal- Positive
Original Final Actual (Negative)Revenues:Taxes:
Property taxes -$ -$ -$ -$ Sales taxes - - - -
Licenses and permits - - - - Fines and forfeits - - - - Intergovernmental revenue - - - - Developer fees - - - - Special assessments - - - - Charges for services - - - - Investment earnings - - 259 259 Reimbursements - - - - Miscellaneous revenue - - 100 100
Total Revenues - - 359 359
ExpendituresCurrent:
General government - - - - Public safety - - - - Public works - - - - Highways and streets - - - - Building services - - - - Culture and recreation - - - - Community development - - - - Intergovernmental - - - - Tax increment pass-through - -
Capital outlay - - - - Principal on long-term debt - - - - Interest on long-term debt - - - -
Total Expenditures - - - -
Excess of Revenues Over (Under) Expenditures - - 359 359
Other financing sources (uses):Debt proceeds - - - - Operating transfer in - - - - Operating transfer out - - - -
Total Other Financing Sources (Uses) - - - -
Excess of Revenues and Other Sources Over (Under) Expenditures and Other Uses - - 359 359
Fund balances-beginning 15,660 15,660 15,660 -
Fund balances-ending 15,660$ 15,660$ 16,019$ 359$
CITY OF SUISUN CITY
Other Supplementary InformationBudgetary Comparison Schedule, DARE/Donations
For Fiscal Year Ended June 30, 2004
DARE/DONATIONS
Budgeted Amounts
117
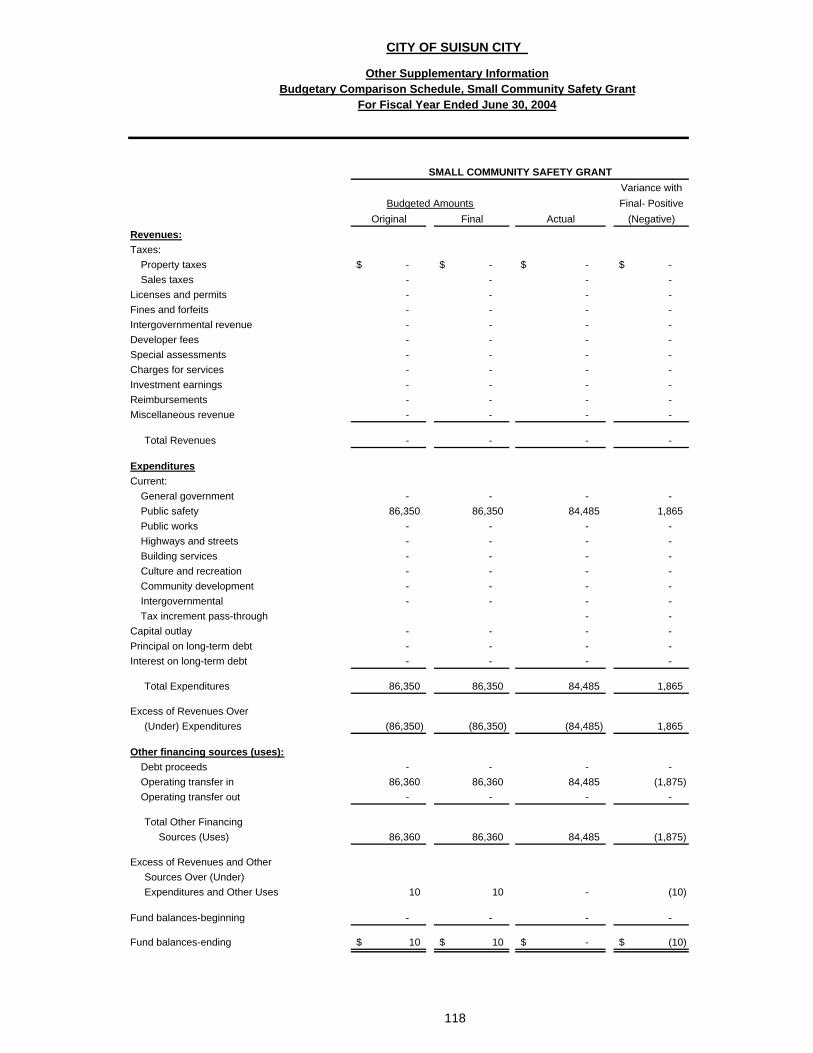
Variance withFinal- Positive
Original Final Actual (Negative)Revenues:Taxes:
Property taxes -$ -$ -$ -$ Sales taxes - - - -
Licenses and permits - - - - Fines and forfeits - - - - Intergovernmental revenue - - - - Developer fees - - - - Special assessments - - - - Charges for services - - - - Investment earnings - - - - Reimbursements - - - - Miscellaneous revenue - - - -
Total Revenues - - - -
ExpendituresCurrent:
General government - - - - Public safety 86,350 86,350 84,485 1,865 Public works - - - - Highways and streets - - - - Building services - - - - Culture and recreation - - - - Community development - - - - Intergovernmental - - - - Tax increment pass-through - -
Capital outlay - - - - Principal on long-term debt - - - - Interest on long-term debt - - - -
Total Expenditures 86,350 86,350 84,485 1,865
Excess of Revenues Over (Under) Expenditures (86,350) (86,350) (84,485) 1,865
Other financing sources (uses):Debt proceeds - - - - Operating transfer in 86,360 86,360 84,485 (1,875) Operating transfer out - - - -
Total Other Financing Sources (Uses) 86,360 86,360 84,485 (1,875)
Excess of Revenues and Other Sources Over (Under) Expenditures and Other Uses 10 10 - (10)
Fund balances-beginning - - - -
Fund balances-ending 10$ 10$ -$ (10)$
SMALL COMMUNITY SAFETY GRANT
Budgeted Amounts
118
CITY OF SUISUN CITY
Other Supplementary InformationBudgetary Comparison Schedule, Small Community Safety Grant
For Fiscal Year Ended June 30, 2004
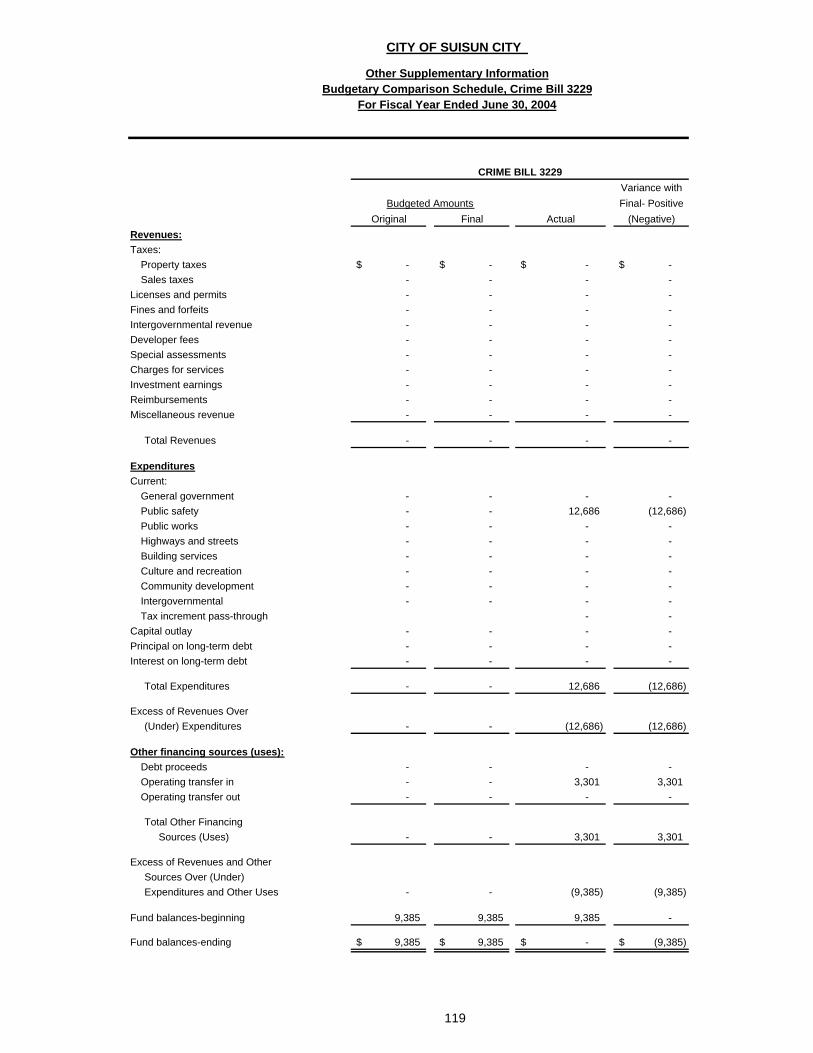
Variance withFinal- Positive
Original Final Actual (Negative)Revenues:Taxes:
Property taxes -$ -$ -$ -$ Sales taxes - - - -
Licenses and permits - - - - Fines and forfeits - - - - Intergovernmental revenue - - - - Developer fees - - - - Special assessments - - - - Charges for services - - - - Investment earnings - - - - Reimbursements - - - - Miscellaneous revenue - - - -
Total Revenues - - - -
ExpendituresCurrent:
General government - - - - Public safety - - 12,686 (12,686) Public works - - - - Highways and streets - - - - Building services - - - - Culture and recreation - - - - Community development - - - - Intergovernmental - - - - Tax increment pass-through - -
Capital outlay - - - - Principal on long-term debt - - - - Interest on long-term debt - - - -
Total Expenditures - - 12,686 (12,686)
Excess of Revenues Over (Under) Expenditures - - (12,686) (12,686)
Other financing sources (uses):Debt proceeds - - - - Operating transfer in - - 3,301 3,301 Operating transfer out - - - -
Total Other Financing Sources (Uses) - - 3,301 3,301
Excess of Revenues and Other Sources Over (Under) Expenditures and Other Uses - - (9,385) (9,385)
Fund balances-beginning 9,385 9,385 9,385 -
Fund balances-ending 9,385$ 9,385$ -$ (9,385)$
CITY OF SUISUN CITY
Other Supplementary InformationBudgetary Comparison Schedule, Crime Bill 3229
For Fiscal Year Ended June 30, 2004
CRIME BILL 3229
Budgeted Amounts
119
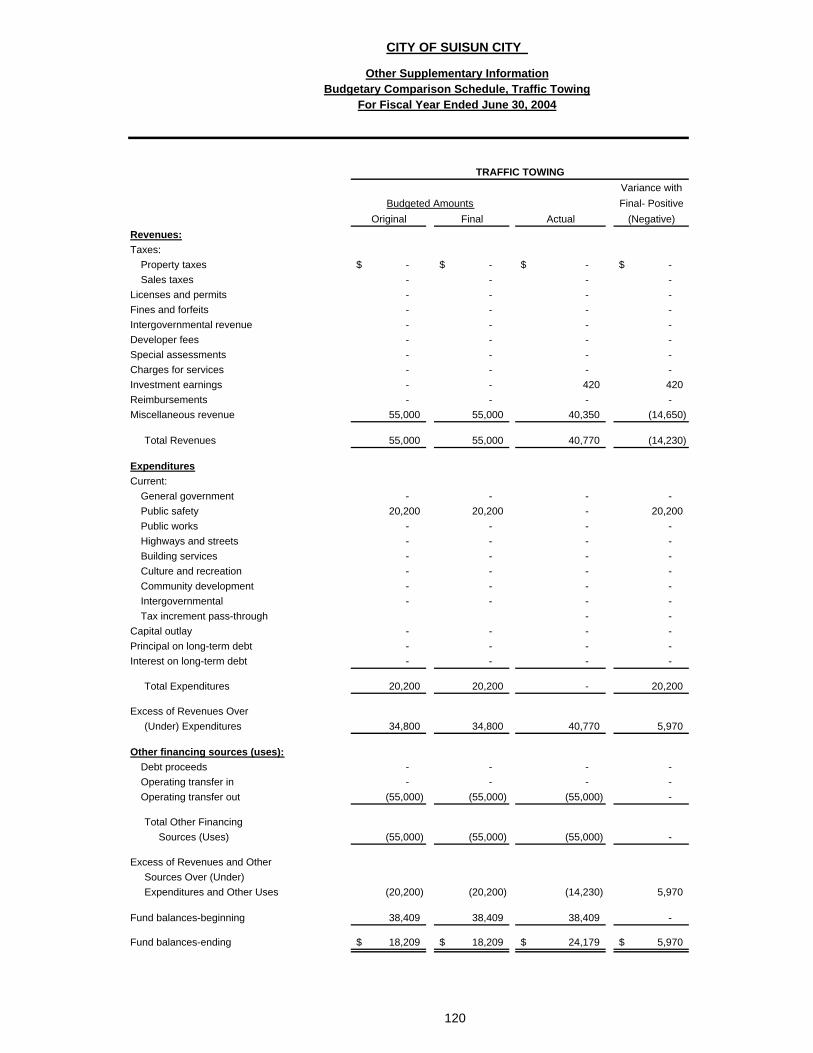
Variance withFinal- Positive
Original Final Actual (Negative)Revenues:Taxes:
Property taxes -$ -$ -$ -$ Sales taxes - - - -
Licenses and permits - - - - Fines and forfeits - - - - Intergovernmental revenue - - - - Developer fees - - - - Special assessments - - - - Charges for services - - - - Investment earnings - - 420 420 Reimbursements - - - - Miscellaneous revenue 55,000 55,000 40,350 (14,650)
Total Revenues 55,000 55,000 40,770 (14,230)
ExpendituresCurrent:
General government - - - - Public safety 20,200 20,200 - 20,200 Public works - - - - Highways and streets - - - - Building services - - - - Culture and recreation - - - - Community development - - - - Intergovernmental - - - - Tax increment pass-through - -
Capital outlay - - - - Principal on long-term debt - - - - Interest on long-term debt - - - -
Total Expenditures 20,200 20,200 - 20,200
Excess of Revenues Over (Under) Expenditures 34,800 34,800 40,770 5,970
Other financing sources (uses):Debt proceeds - - - - Operating transfer in - - - - Operating transfer out (55,000) (55,000) (55,000) -
Total Other Financing Sources (Uses) (55,000) (55,000) (55,000) -
Excess of Revenues and Other Sources Over (Under) Expenditures and Other Uses (20,200) (20,200) (14,230) 5,970
Fund balances-beginning 38,409 38,409 38,409 -
Fund balances-ending 18,209$ 18,209$ 24,179$ 5,970$
TRAFFIC TOWING
Budgeted Amounts
120
CITY OF SUISUN CITY
Other Supplementary InformationBudgetary Comparison Schedule, Traffic Towing
For Fiscal Year Ended June 30, 2004

Variance withFinal- Positive
Original Final Actual (Negative)Revenues:Taxes:
Property taxes -$ -$ -$ -$ Sales taxes - - - -
Licenses and permits - - - - Fines and forfeits - - - - Intergovernmental revenue - - 28,869 28,869 Developer fees - - - - Special assessments - - - - Charges for services - - - - Investment earnings - - - - Reimbursements - - - - Miscellaneous revenue - - - -
Total Revenues - - 28,869 28,869
ExpendituresCurrent:
General government - - - - Public safety - - 26,668 (26,668) Public works - - - - Highways and streets - - - - Building services - - - - Culture and recreation - - - - Community development - - - - Intergovernmental - - - - Tax increment pass-through - -
Capital outlay - - - - Principal on long-term debt - - - - Interest on long-term debt - - - -
Total Expenditures - - 26,668 (26,668)
Excess of Revenues Over (Under) Expenditures - - 2,201 2,201
Other financing sources (uses):Debt proceeds - - - - Operating transfer in - - - - Operating transfer out - - - -
Total Other Financing Sources (Uses) - - - -
Excess of Revenues and Other Sources Over (Under) Expenditures and Other Uses - - 2,201 2,201
Fund balances-beginning - - - -
Fund balances-ending -$ -$ 2,201$ 2,201$
CITY OF SUISUN CITY
Other Supplementary InformationBudgetary Comparison Schedule, Traffic Safety Grant
For Fiscal Year Ended June 30, 2004
TRAFFIC SAFETY GRANT
Budgeted Amounts
121

Variance withFinal- Positive
Original Final Actual (Negative)Revenues:Taxes:
Property taxes -$ -$ -$ -$ Sales taxes - - - -
Licenses and permits - - - - Fines and forfeits - - - - Intergovernmental revenue 5,060 5,060 10,127 5,067 Developer fees - - - - Special assessments - - - - Charges for services - - - - Investment earnings - - 43 43 Reimbursements - - - - Miscellaneous revenue - - - -
Total Revenues 5,060 5,060 10,170 5,110
ExpendituresCurrent:
General government - - - - Public safety 45,310 45,310 44,418 892 Public works - - - - Highways and streets - - - - Building services - - - - Culture and recreation - - - - Community development - - - - Intergovernmental - - - - Tax increment pass-through - -
Capital outlay - - - - Principal on long-term debt - - - - Interest on long-term debt - - - -
Total Expenditures 45,310 45,310 44,418 892
Excess of Revenues Over (Under) Expenditures (40,250) (40,250) (34,248) 6,002
Other financing sources (uses):Debt proceeds - - - - Operating transfer in 40,250 40,250 34,248 (6,002) Operating transfer out - - - -
Total Other Financing Sources (Uses) 40,250 40,250 34,248 (6,002)
Excess of Revenues and Other Sources Over (Under) Expenditures and Other Uses - - - -
Fund balances-beginning - - - -
Fund balances-ending -$ -$ -$ -$
BUREAU OF JUSTICE GRANT
Budgeted Amounts
122
CITY OF SUISUN CITY
Other Supplementary InformationBudgetary Comparison Schedule, Bureau of Justice Grant
For Fiscal Year Ended June 30, 2004

Variance withFinal- Positive
Original Final Actual (Negative)Revenues:Taxes:
Property taxes -$ -$ -$ -$ Sales taxes - - - -
Licenses and permits - - - - Fines and forfeits - - - - Intergovernmental revenue - - - - Developer fees - - - - Special assessments - - - - Charges for services 68,140 68,140 51,230 (16,910) Investment earnings - - - - Reimbursements - - - - Miscellaneous revenue - - 91,217 91,217
Total Revenues 68,140 68,140 142,447 74,307
ExpendituresCurrent:
General government - - - - Public safety - - - - Public works - - - - Highways and streets - - - - Building services - - - - Culture and recreation 81,480 81,480 87,983 (6,503) Community development - - - - Intergovernmental - - - - Tax increment pass-through - -
Capital outlay - - - - Principal on long-term debt - - - - Interest on long-term debt - - - -
Total Expenditures 81,480 81,480 87,983 (6,503)
Excess of Revenues Over (Under) Expenditures (13,340) (13,340) 54,464 67,804
Other financing sources (uses):Debt proceeds - - - - Operating transfer in 37,840 37,840 45,130 7,290 Operating transfer out - - - -
Total Other Financing Sources (Uses) 37,840 37,840 45,130 7,290
Excess of Revenues and Other Sources Over (Under) Expenditures and Other Uses 24,500 24,500 99,594 75,094
Fund balances-beginning - - - -
Fund balances-ending 24,500$ 24,500$ 99,594$ 75,094$
CITY OF SUISUN CITY
Other Supplementary InformationBudgetary Comparison Schedule, Lambrecht Sports Complex
For Fiscal Year Ended June 30, 2004
LAMBRECHT SPORTS COMPLEX
Budgeted Amounts
123
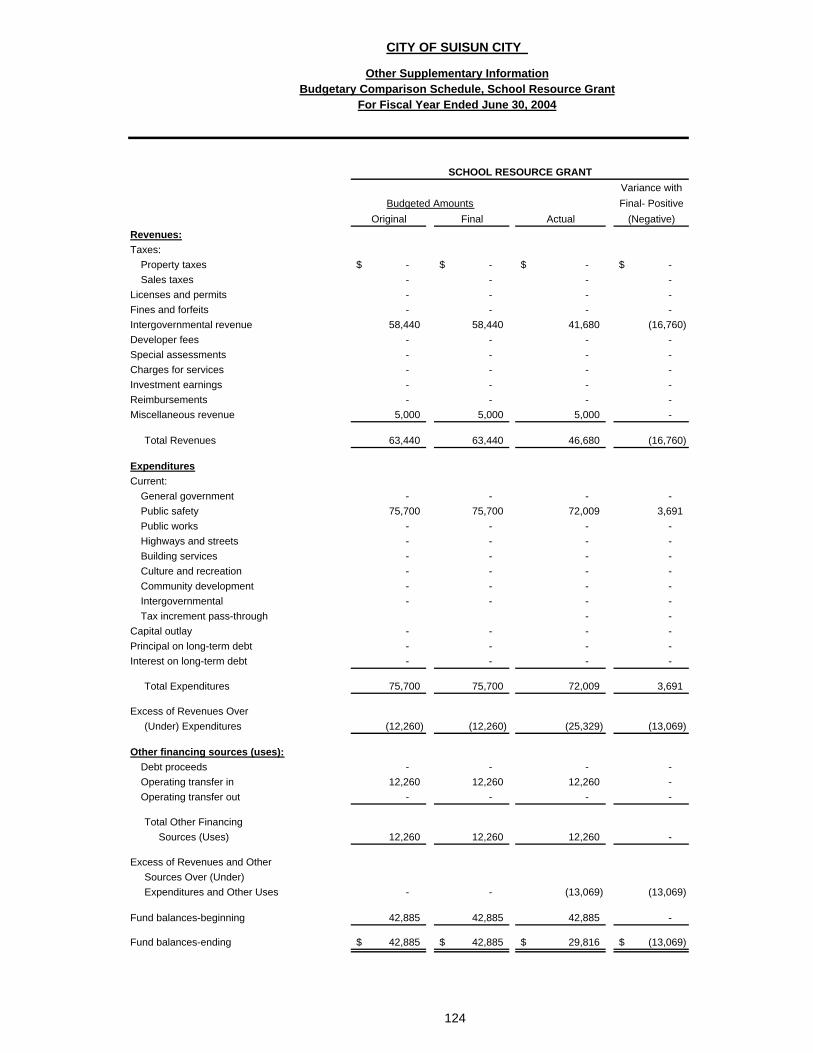
Variance withFinal- Positive
Original Final Actual (Negative)Revenues:Taxes:
Property taxes -$ -$ -$ -$ Sales taxes - - - -
Licenses and permits - - - - Fines and forfeits - - - - Intergovernmental revenue 58,440 58,440 41,680 (16,760) Developer fees - - - - Special assessments - - - - Charges for services - - - - Investment earnings - - - - Reimbursements - - - - Miscellaneous revenue 5,000 5,000 5,000 -
Total Revenues 63,440 63,440 46,680 (16,760)
ExpendituresCurrent:
General government - - - - Public safety 75,700 75,700 72,009 3,691 Public works - - - - Highways and streets - - - - Building services - - - - Culture and recreation - - - - Community development - - - - Intergovernmental - - - - Tax increment pass-through - -
Capital outlay - - - - Principal on long-term debt - - - - Interest on long-term debt - - - -
Total Expenditures 75,700 75,700 72,009 3,691
Excess of Revenues Over (Under) Expenditures (12,260) (12,260) (25,329) (13,069)
Other financing sources (uses):Debt proceeds - - - - Operating transfer in 12,260 12,260 12,260 - Operating transfer out - - - -
Total Other Financing Sources (Uses) 12,260 12,260 12,260 -
Excess of Revenues and Other Sources Over (Under) Expenditures and Other Uses - - (13,069) (13,069)
Fund balances-beginning 42,885 42,885 42,885 -
Fund balances-ending 42,885$ 42,885$ 29,816$ (13,069)$
SCHOOL RESOURCE GRANT
Budgeted Amounts
124
CITY OF SUISUN CITY
Other Supplementary InformationBudgetary Comparison Schedule, School Resource Grant
For Fiscal Year Ended June 30, 2004
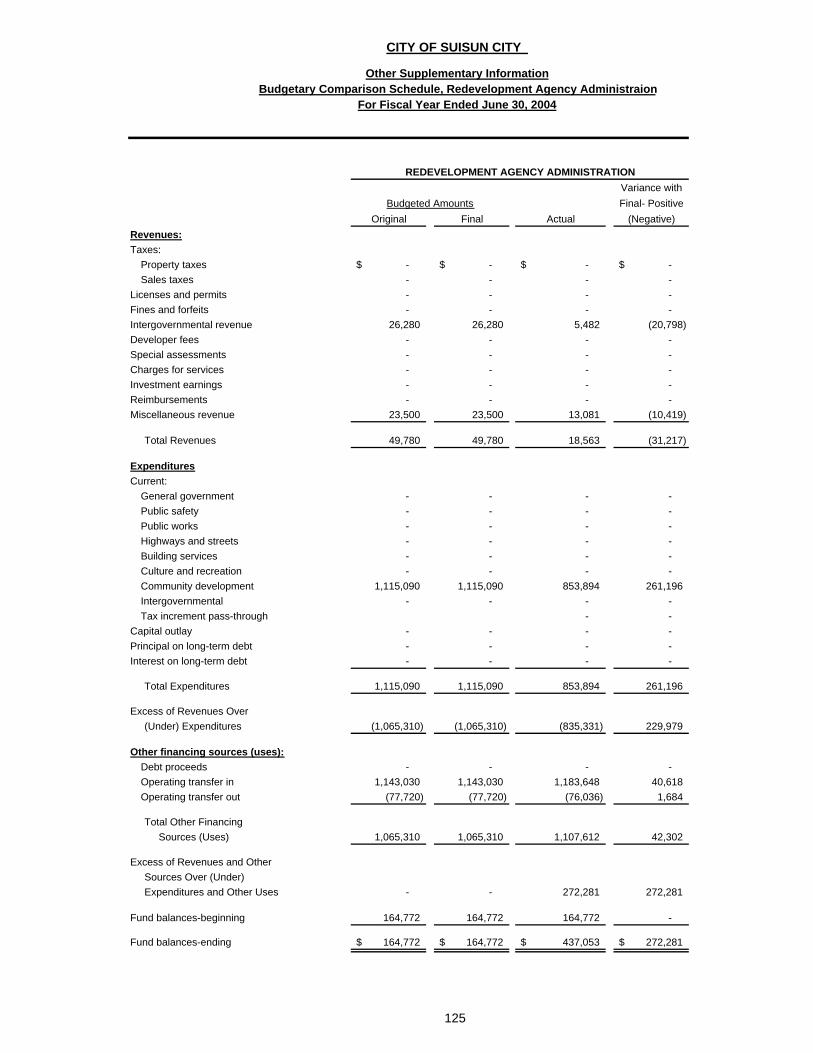
Variance withFinal- Positive
Original Final Actual (Negative)Revenues:Taxes:
Property taxes -$ -$ -$ -$ Sales taxes - - - -
Licenses and permits - - - - Fines and forfeits - - - - Intergovernmental revenue 26,280 26,280 5,482 (20,798) Developer fees - - - - Special assessments - - - - Charges for services - - - - Investment earnings - - - - Reimbursements - - - - Miscellaneous revenue 23,500 23,500 13,081 (10,419)
Total Revenues 49,780 49,780 18,563 (31,217)
ExpendituresCurrent:
General government - - - - Public safety - - - - Public works - - - - Highways and streets - - - - Building services - - - - Culture and recreation - - - - Community development 1,115,090 1,115,090 853,894 261,196 Intergovernmental - - - - Tax increment pass-through - -
Capital outlay - - - - Principal on long-term debt - - - - Interest on long-term debt - - - -
Total Expenditures 1,115,090 1,115,090 853,894 261,196
Excess of Revenues Over (Under) Expenditures (1,065,310) (1,065,310) (835,331) 229,979
Other financing sources (uses):Debt proceeds - - - - Operating transfer in 1,143,030 1,143,030 1,183,648 40,618 Operating transfer out (77,720) (77,720) (76,036) 1,684
Total Other Financing Sources (Uses) 1,065,310 1,065,310 1,107,612 42,302
Excess of Revenues and Other Sources Over (Under) Expenditures and Other Uses - - 272,281 272,281
Fund balances-beginning 164,772 164,772 164,772 -
Fund balances-ending 164,772$ 164,772$ 437,053$ 272,281$
CITY OF SUISUN CITY
Other Supplementary InformationBudgetary Comparison Schedule, Redevelopment Agency Administraion
For Fiscal Year Ended June 30, 2004
REDEVELOPMENT AGENCY ADMINISTRATION
Budgeted Amounts
125

Variance withFinal- Positive
Original Final Actual (Negative)Revenues:Taxes:
Property taxes -$ -$ -$ -$ Sales taxes - - - -
Licenses and permits - - - - Fines and forfeits - - - - Intergovernmental revenue - - - - Developer fees - - - - Special assessments - - - - Charges for services - - - - Investment earnings - - - - Reimbursements - - - - Miscellaneous revenue 80,180 80,180 71,956 (8,224)
Total Revenues 80,180 80,180 71,956 (8,224)
ExpendituresCurrent:
General government - - - - Public safety - - - - Public works - - - - Highways and streets - - - - Building services - - - - Culture and recreation - - - - Community development 132,270 132,270 134,287 (2,017) Intergovernmental - - - - Tax increment pass-through - -
Capital outlay - - - - Principal on long-term debt - - - - Interest on long-term debt - - - -
Total Expenditures 132,270 132,270 134,287 (2,017)
Excess of Revenues Over (Under) Expenditures (52,090) (52,090) (62,331) (10,241)
Other financing sources (uses):Debt proceeds - - - - Operating transfer in 16,570 16,570 16,570 - Operating transfer out - - (1,000) (1,000)
Total Other Financing Sources (Uses) 16,570 16,570 15,570 (1,000)
Excess of Revenues and Other Sources Over (Under) Expenditures and Other Uses (35,520) (35,520) (46,761) (11,241)
Fund balances-beginning 58,442 58,442 58,442 -
Fund balances-ending 22,922$ 22,922$ 11,681$ (11,241)$
PROPERTY MANAGEMENT
Budgeted Amounts
126
CITY OF SUISUN CITY
Other Supplementary InformationBudgetary Comparison Schedule, Property Management
For Fiscal Year Ended June 30, 2004
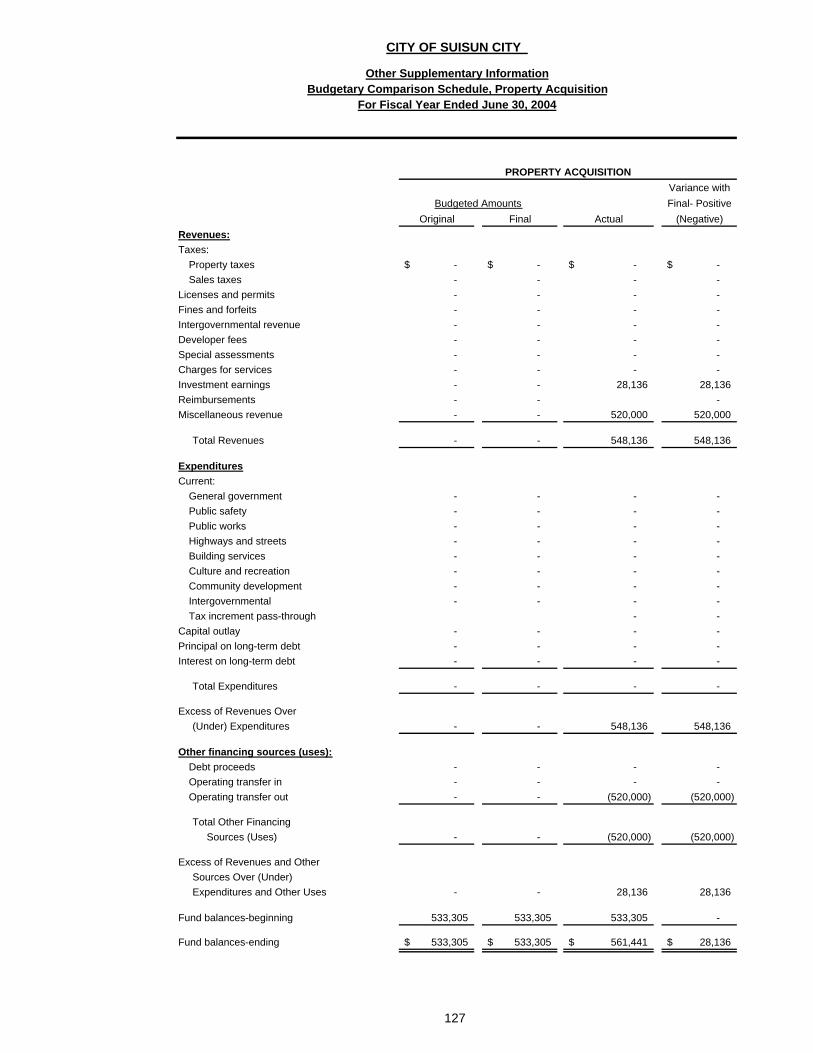
Variance withFinal- Positive
Original Final Actual (Negative)Revenues:Taxes:
Property taxes -$ -$ -$ -$ Sales taxes - - - -
Licenses and permits - - - - Fines and forfeits - - - - Intergovernmental revenue - - - - Developer fees - - - - Special assessments - - - - Charges for services - - - - Investment earnings - - 28,136 28,136 Reimbursements - - - Miscellaneous revenue - - 520,000 520,000
Total Revenues - - 548,136 548,136
ExpendituresCurrent:
General government - - - - Public safety - - - - Public works - - - - Highways and streets - - - - Building services - - - - Culture and recreation - - - - Community development - - - - Intergovernmental - - - - Tax increment pass-through - -
Capital outlay - - - - Principal on long-term debt - - - - Interest on long-term debt - - - -
Total Expenditures - - - -
Excess of Revenues Over (Under) Expenditures - - 548,136 548,136
Other financing sources (uses):Debt proceeds - - - - Operating transfer in - - - - Operating transfer out - - (520,000) (520,000)
Total Other Financing Sources (Uses) - - (520,000) (520,000)
Excess of Revenues and Other Sources Over (Under) Expenditures and Other Uses - - 28,136 28,136
Fund balances-beginning 533,305 533,305 533,305 -
Fund balances-ending 533,305$ 533,305$ 561,441$ 28,136$
CITY OF SUISUN CITY
Other Supplementary InformationBudgetary Comparison Schedule, Property Acquisition
For Fiscal Year Ended June 30, 2004
PROPERTY ACQUISITION
Budgeted Amounts
127
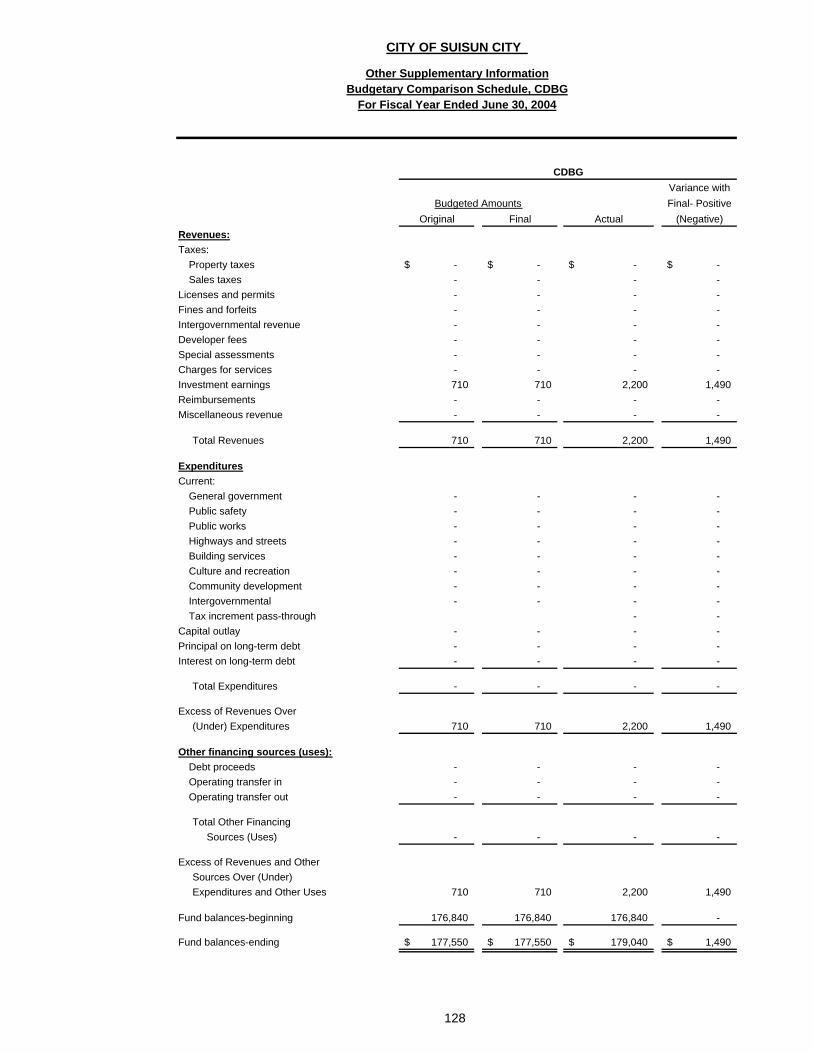
Variance withFinal- Positive
Original Final Actual (Negative)Revenues:Taxes:
Property taxes -$ -$ -$ -$ Sales taxes - - - -
Licenses and permits - - - - Fines and forfeits - - - - Intergovernmental revenue - - - - Developer fees - - - - Special assessments - - - - Charges for services - - - - Investment earnings 710 710 2,200 1,490 Reimbursements - - - - Miscellaneous revenue - - - -
Total Revenues 710 710 2,200 1,490
ExpendituresCurrent:
General government - - - - Public safety - - - - Public works - - - - Highways and streets - - - - Building services - - - - Culture and recreation - - - - Community development - - - - Intergovernmental - - - - Tax increment pass-through - -
Capital outlay - - - - Principal on long-term debt - - - - Interest on long-term debt - - - -
Total Expenditures - - - -
Excess of Revenues Over (Under) Expenditures 710 710 2,200 1,490
Other financing sources (uses):Debt proceeds - - - - Operating transfer in - - - - Operating transfer out - - - -
Total Other Financing Sources (Uses) - - - -
Excess of Revenues and Other Sources Over (Under) Expenditures and Other Uses 710 710 2,200 1,490
Fund balances-beginning 176,840 176,840 176,840 -
Fund balances-ending 177,550$ 177,550$ 179,040$ 1,490$
CDBG
Budgeted Amounts
128
CITY OF SUISUN CITY
Other Supplementary InformationBudgetary Comparison Schedule, CDBG
For Fiscal Year Ended June 30, 2004
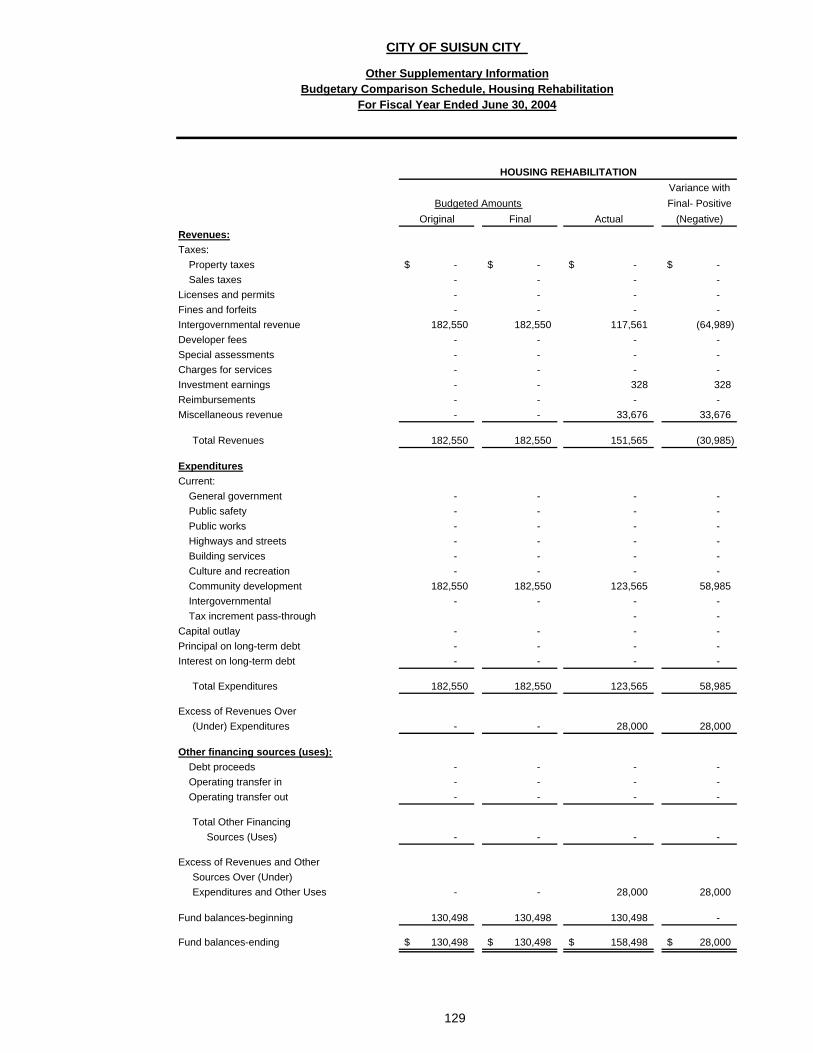
Variance withFinal- Positive
Original Final Actual (Negative)Revenues:Taxes:
Property taxes -$ -$ -$ -$ Sales taxes - - - -
Licenses and permits - - - - Fines and forfeits - - - - Intergovernmental revenue 182,550 182,550 117,561 (64,989) Developer fees - - - - Special assessments - - - - Charges for services - - - - Investment earnings - - 328 328 Reimbursements - - - - Miscellaneous revenue - - 33,676 33,676
Total Revenues 182,550 182,550 151,565 (30,985)
ExpendituresCurrent:
General government - - - - Public safety - - - - Public works - - - - Highways and streets - - - - Building services - - - - Culture and recreation - - - - Community development 182,550 182,550 123,565 58,985 Intergovernmental - - - - Tax increment pass-through - -
Capital outlay - - - - Principal on long-term debt - - - - Interest on long-term debt - - - -
Total Expenditures 182,550 182,550 123,565 58,985
Excess of Revenues Over (Under) Expenditures - - 28,000 28,000
Other financing sources (uses):Debt proceeds - - - - Operating transfer in - - - - Operating transfer out - - - -
Total Other Financing Sources (Uses) - - - -
Excess of Revenues and Other Sources Over (Under) Expenditures and Other Uses - - 28,000 28,000
Fund balances-beginning 130,498 130,498 130,498 -
Fund balances-ending 130,498$ 130,498$ 158,498$ 28,000$
CITY OF SUISUN CITY
Other Supplementary InformationBudgetary Comparison Schedule, Housing Rehabilitation
For Fiscal Year Ended June 30, 2004
HOUSING REHABILITATION
Budgeted Amounts
129
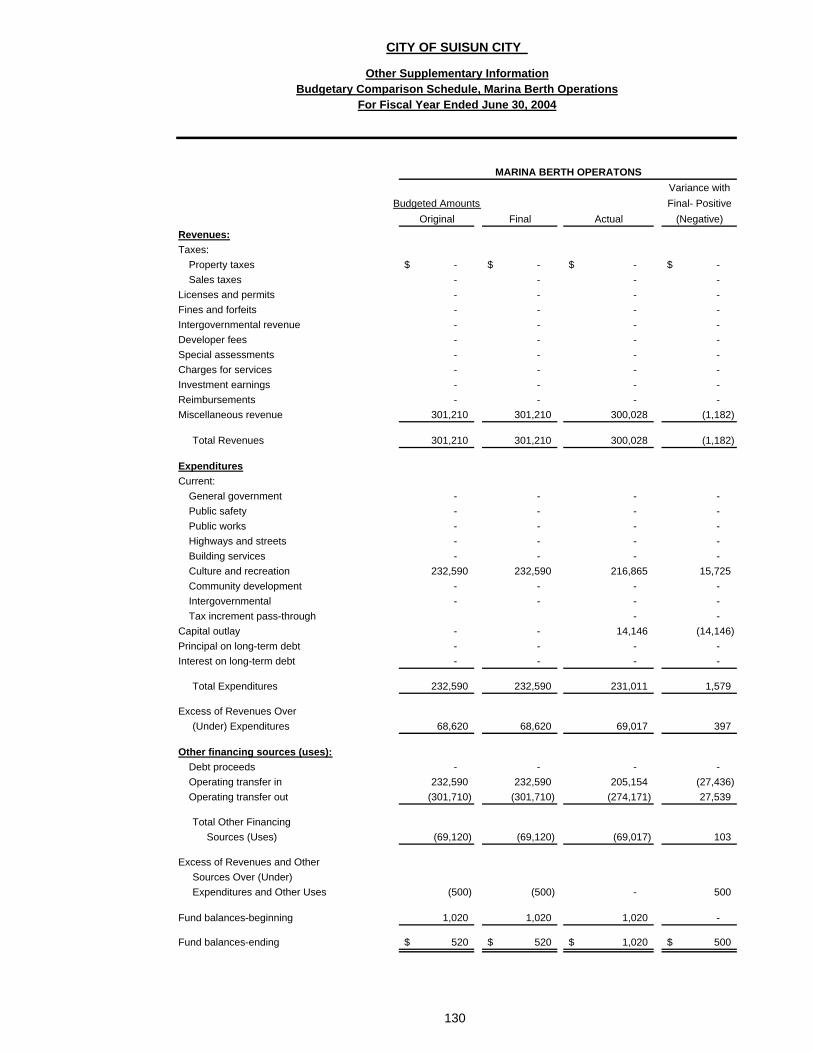
Variance withBudgeted Amounts Final- Positive
Original Final Actual (Negative)Revenues:Taxes:
Property taxes -$ -$ -$ -$ Sales taxes - - - -
Licenses and permits - - - - Fines and forfeits - - - - Intergovernmental revenue - - - - Developer fees - - - - Special assessments - - - - Charges for services - - - - Investment earnings - - - - Reimbursements - - - - Miscellaneous revenue 301,210 301,210 300,028 (1,182)
Total Revenues 301,210 301,210 300,028 (1,182)
ExpendituresCurrent:
General government - - - - Public safety - - - - Public works - - - - Highways and streets - - - - Building services - - - - Culture and recreation 232,590 232,590 216,865 15,725 Community development - - - - Intergovernmental - - - - Tax increment pass-through - -
Capital outlay - - 14,146 (14,146) Principal on long-term debt - - - - Interest on long-term debt - - - -
Total Expenditures 232,590 232,590 231,011 1,579
Excess of Revenues Over (Under) Expenditures 68,620 68,620 69,017 397
Other financing sources (uses):Debt proceeds - - - - Operating transfer in 232,590 232,590 205,154 (27,436) Operating transfer out (301,710) (301,710) (274,171) 27,539
Total Other Financing Sources (Uses) (69,120) (69,120) (69,017) 103
Excess of Revenues and Other Sources Over (Under) Expenditures and Other Uses (500) (500) - 500
Fund balances-beginning 1,020 1,020 1,020 -
Fund balances-ending 520$ 520$ 1,020$ 500$
MARINA BERTH OPERATONS
CITY OF SUISUN CITY
Other Supplementary InformationBudgetary Comparison Schedule, Marina Berth Operations
For Fiscal Year Ended June 30, 2004
130
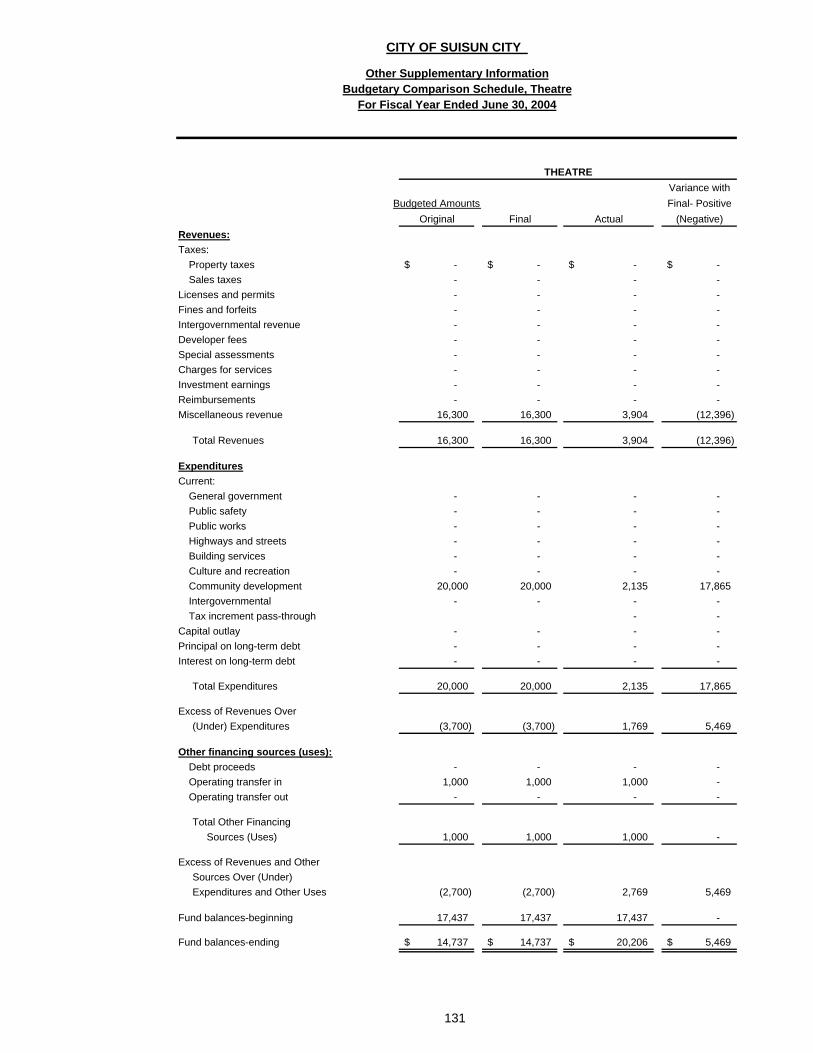
Variance withBudgeted Amounts Final- Positive
Original Final Actual (Negative)Revenues:Taxes:
Property taxes -$ -$ -$ -$ Sales taxes - - - -
Licenses and permits - - - - Fines and forfeits - - - - Intergovernmental revenue - - - - Developer fees - - - - Special assessments - - - - Charges for services - - - - Investment earnings - - - - Reimbursements - - - - Miscellaneous revenue 16,300 16,300 3,904 (12,396)
Total Revenues 16,300 16,300 3,904 (12,396)
ExpendituresCurrent:
General government - - - - Public safety - - - - Public works - - - - Highways and streets - - - - Building services - - - - Culture and recreation - - - - Community development 20,000 20,000 2,135 17,865 Intergovernmental - - - - Tax increment pass-through - -
Capital outlay - - - - Principal on long-term debt - - - - Interest on long-term debt - - - -
Total Expenditures 20,000 20,000 2,135 17,865
Excess of Revenues Over (Under) Expenditures (3,700) (3,700) 1,769 5,469
Other financing sources (uses):Debt proceeds - - - - Operating transfer in 1,000 1,000 1,000 - Operating transfer out - - - -
Total Other Financing Sources (Uses) 1,000 1,000 1,000 -
Excess of Revenues and Other Sources Over (Under) Expenditures and Other Uses (2,700) (2,700) 2,769 5,469
Fund balances-beginning 17,437 17,437 17,437 -
Fund balances-ending 14,737$ 14,737$ 20,206$ 5,469$
CITY OF SUISUN CITY
Other Supplementary InformationBudgetary Comparison Schedule, Theatre
For Fiscal Year Ended June 30, 2004
THEATRE
131
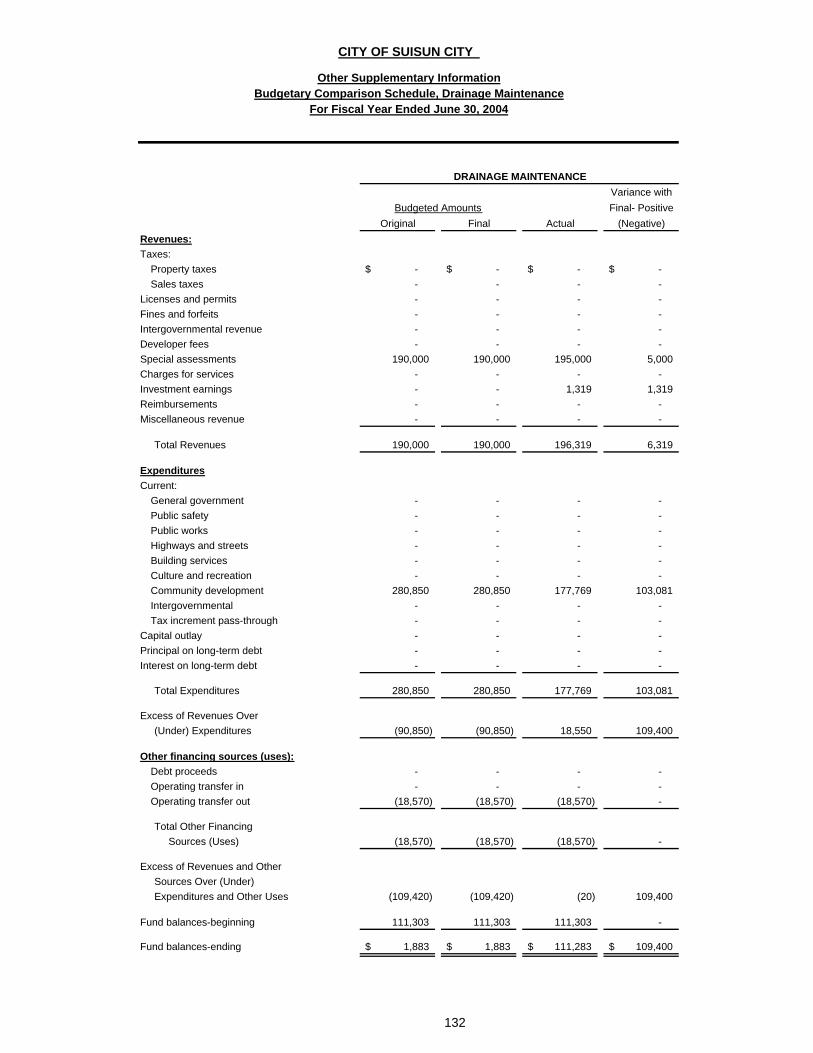
Variance withFinal- Positive
Original Final Actual (Negative)Revenues:Taxes:
Property taxes -$ -$ -$ -$ Sales taxes - - - -
Licenses and permits - - - - Fines and forfeits - - - - Intergovernmental revenue - - - - Developer fees - - - - Special assessments 190,000 190,000 195,000 5,000 Charges for services - - - - Investment earnings - - 1,319 1,319 Reimbursements - - - - Miscellaneous revenue - - - -
Total Revenues 190,000 190,000 196,319 6,319
ExpendituresCurrent:
General government - - - - Public safety - - - - Public works - - - - Highways and streets - - - - Building services - - - - Culture and recreation - - - - Community development 280,850 280,850 177,769 103,081 Intergovernmental - - - - Tax increment pass-through - - - -
Capital outlay - - - - Principal on long-term debt - - - - Interest on long-term debt - - - -
Total Expenditures 280,850 280,850 177,769 103,081
Excess of Revenues Over (Under) Expenditures (90,850) (90,850) 18,550 109,400
Other financing sources (uses):Debt proceeds - - - - Operating transfer in - - - - Operating transfer out (18,570) (18,570) (18,570) -
Total Other Financing Sources (Uses) (18,570) (18,570) (18,570) -
Excess of Revenues and Other Sources Over (Under) Expenditures and Other Uses (109,420) (109,420) (20) 109,400
Fund balances-beginning 111,303 111,303 111,303 -
Fund balances-ending 1,883$ 1,883$ 111,283$ 109,400$
DRAINAGE MAINTENANCE
132
Budgeted Amounts
CITY OF SUISUN CITY
Other Supplementary InformationBudgetary Comparison Schedule, Drainage Maintenance
For Fiscal Year Ended June 30, 2004

Variance withFinal- Positive
Original Final Actual (Negative)Revenues:Taxes:
Property taxes -$ -$ -$ -$ Sales taxes - - - -
Licenses and permits - - - - Fines and forfeits - - - - Intergovernmental revenue - - - - Developer fees - - - - Special assessments 211,490 211,490 211,491 1 Charges for services - - - - Investment earnings - - 2,472 2,472 Reimbursements 1,000 1,000 1,000 - Miscellaneous revenue - - - -
Total Revenues 212,490 212,490 214,963 2,473
ExpendituresCurrent:
General government - - - - Public safety - - - - Public works - - - - Highways and streets - - - - Building services - - - - Culture and recreation - - - - Community development 206,130 206,130 149,889 56,241 Intergovernmental - - - - Tax increment pass-through
Capital outlay - - - - Principal on long-term debt - - - - Interest on long-term debt - - - -
Total Expenditures 206,130 206,130 149,889 56,241
Excess of Revenues Over (Under) Expenditures 6,360 6,360 65,074 58,714
Other financing sources (uses):Debt proceeds - - - - Operating transfer in - - - - Operating transfer out - - - -
Total Other Financing Sources (Uses) - - - -
Excess of Revenues and Other Sources Over (Under) Expenditures and Other Uses 6,360 6,360 65,074 58,714
Fund balances-beginning 138,689 138,689 138,689 -
Fund balances-ending 145,049$ 145,049$ 203,763$ 58,714
LAWLER RANCH DEVELOPMENT
133
Budgeted Amounts
Other Supplementary InformationBudgetary Comparison Schedule, Lawler Ranch Developemnt
For Fiscal Year Ended June 30, 2004
CITY OF SUISUN CITY
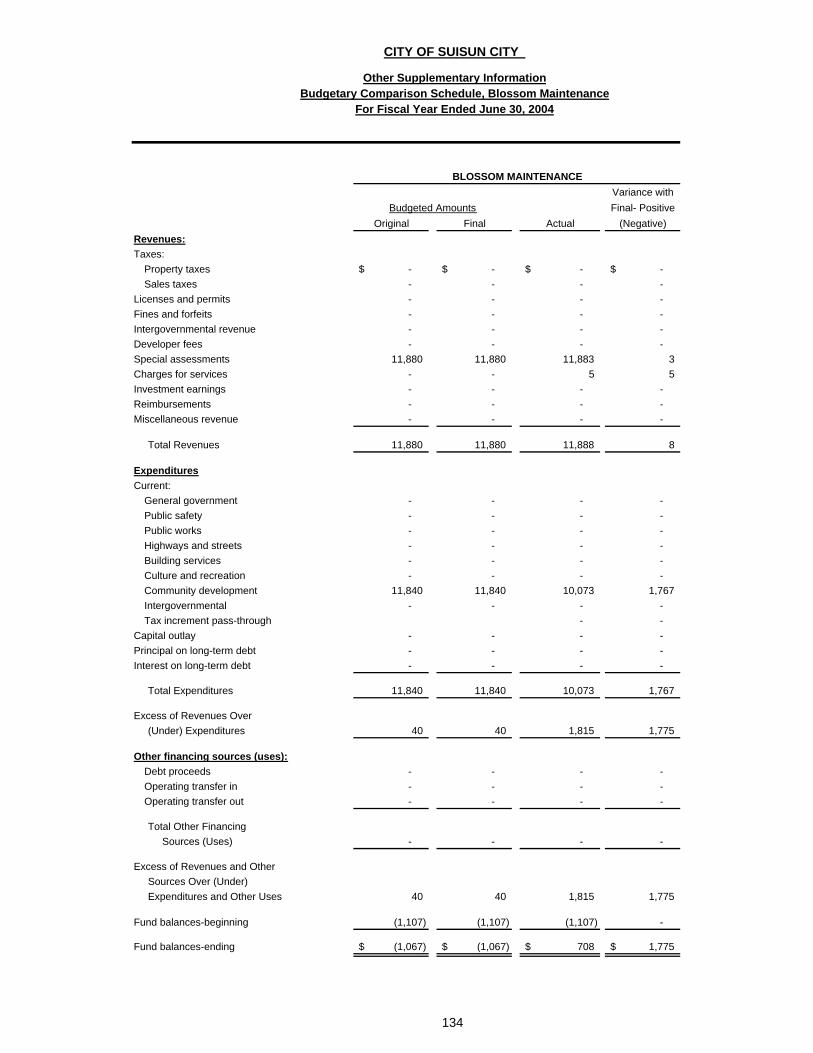
Variance withFinal- Positive
Original Final Actual (Negative)Revenues:Taxes:
Property taxes -$ -$ -$ -$ Sales taxes - - - -
Licenses and permits - - - - Fines and forfeits - - - - Intergovernmental revenue - - - - Developer fees - - - - Special assessments 11,880 11,880 11,883 3 Charges for services - - 5 5 Investment earnings - - - - Reimbursements - - - - Miscellaneous revenue - - - -
Total Revenues 11,880 11,880 11,888 8
ExpendituresCurrent:
General government - - - - Public safety - - - - Public works - - - - Highways and streets - - - - Building services - - - - Culture and recreation - - - - Community development 11,840 11,840 10,073 1,767 Intergovernmental - - - - Tax increment pass-through - -
Capital outlay - - - - Principal on long-term debt - - - - Interest on long-term debt - - - -
Total Expenditures 11,840 11,840 10,073 1,767
Excess of Revenues Over (Under) Expenditures 40 40 1,815 1,775
Other financing sources (uses):Debt proceeds - - - - Operating transfer in - - - - Operating transfer out - - - -
Total Other Financing Sources (Uses) - - - -
Excess of Revenues and Other Sources Over (Under) Expenditures and Other Uses 40 40 1,815 1,775
Fund balances-beginning (1,107) (1,107) (1,107) -
Fund balances-ending (1,067)$ (1,067)$ 708$ 1,775$
134
Budgeted Amounts
CITY OF SUISUN CITY
Other Supplementary InformationBudgetary Comparison Schedule, Blossom Maintenance
For Fiscal Year Ended June 30, 2004
BLOSSOM MAINTENANCE

Variance withFinal- Positive
Original Final Actual (Negative)Revenues:Taxes:
Property taxes -$ -$ -$ -$ Sales taxes - - - -
Licenses and permits - - - - Fines and forfeits - - - - Intergovernmental revenue - - - - Developer fees - - - - Special assessments 146,210 146,210 146,213 3 Charges for services - - - - Investment earnings - - 3,269 3,269 Reimbursements 25,710 25,710 25,710 - Miscellaneous revenue - - - -
Total Revenues 171,920 171,920 175,192 3,272
ExpendituresCurrent:
General government - - - - Public safety - - - - Public works - - - - Highways and streets - - - - Building services - - - - Culture and recreation - - - - Community development 179,790 179,790 152,823 26,967 Intergovernmental - - - - Tax increment pass-through - - - -
Capital outlay - - - - Principal on long-term debt - - - - Interest on long-term debt - - - -
Total Expenditures 179,790 179,790 152,823 26,967
Excess of Revenues Over (Under) Expenditures (7,870) (7,870) 22,369 30,239
Other financing sources (uses):Debt proceeds - - - - Operating transfer in - - - - Operating transfer out - - - -
Total Other Financing Sources (Uses) - - - -
Excess of Revenues and Other Sources Over (Under) Expenditures and Other Uses (7,870) (7,870) 22,369 30,239
Fund balances-beginning 201,386 201,386 201,386 -
Fund balances-ending 193,516$ 193,516$ 223,755$ 30,239$
Budgeted Amounts
135
CITY OF SUISUN CITY
Other Supplementary InformationBudgetary Comparison Schedule, Heritage Maintenance
For Fiscal Year Ended June 30, 2004
HERITAGE MAINTENANCE

Variance withFinal- Positive
Original Final Actual (Negative)Revenues:Taxes:
Property taxes -$ -$ -$ -$ Sales taxes - - - -
Licenses and permits - - - - Fines and forfeits - - - - Intergovernmental revenue - - - - Developer fees - - - - Special assessments 36,450 36,450 36,450 - Charges for services - - - - Investment earnings - - 312 312 Reimbursements 5,450 5,450 5,450 - Miscellaneous revenue - - - -
Total Revenues 41,900 41,900 42,212 312
ExpendituresCurrent:
General government - - - - Public safety - - - - Public works - - - - Highways and streets - - - - Building services - - - - Culture and recreation - - - - Community development 38,020 38,020 45,970 (7,950) Intergovernmental - - - - Tax increment pass-through - -
Capital outlay - - - - Principal on long-term debt - - - - Interest on long-term debt - - - -
Total Expenditures 38,020 38,020 45,970 (7,950)
Excess of Revenues Over (Under) Expenditures 3,880 3,880 (3,758) (7,638)
Other financing sources (uses):Debt proceeds - - - - Operating transfer in - - - - Operating transfer out - - - -
Total Other Financing Sources (Uses) - - - -
Excess of Revenues and Other Sources Over (Under) Expenditures and Other Uses 3,880 3,880 (3,758) (7,638)
Fund balances-beginning 27,101 27,101 27,101 -
Fund balances-ending 30,981$ 30,981$ 23,343$ (7,638)$
Other Supplementary InformationBudgetary Comparison Schedule, Montebello Vista Maintenance
For Fiscal Year Ended June 30, 2004
MONTEBELLO VISTA MAINTENANCE
Budgeted Amounts
136
CITY OF SUISUN CITY

Variance withFinal- Positive
Original Final Actual (Negative)Revenues:Taxes:
Property taxes -$ -$ -$ -$ Sales taxes - - - -
Licenses and permits - - - - Fines and forfeits - - - - Intergovernmental revenue - - - - Developer fees - - - - Special assessments 166,620 166,620 175,057 8,437 Charges for services - - - - Investment earnings - - 1,202 1,202 Reimbursements 50,130 50,130 52,025 1,895 Miscellaneous revenue 7,000 7,000 7,959 959
Total Revenues 223,750 223,750 236,243 12,493
ExpendituresCurrent:
General government - - - - Public safety - - - - Public works - - - - Highways and streets - - - - Building services - - - - Culture and recreation - - - - Community development 177,370 177,370 237,428 (60,058) Intergovernmental - - - - Tax increment pass-through - -
Capital outlay - - - - Principal on long-term debt - - - - Interest on long-term debt - - - -
Total Expenditures 177,370 177,370 237,428 (60,058)
Excess of Revenues Over (Under) Expenditures 46,380 46,380 (1,185) (47,565)
Other financing sources (uses):Debt proceeds - - - - Operating transfer in 55,300 55,300 55,569 269 Operating transfer out (55,300) (55,300) (55,569) (269)
Total Other Financing Sources (Uses) - - - -
Excess of Revenues and Other Sources Over (Under) Expenditures and Other Uses 46,380 46,380 (1,185) (47,565)
Fund balances-beginning (30,394) (30,394) (30,394) -
Fund balances-ending 15,986$ 15,986$ (31,579)$ (47,565)$
CITY OF SUISUN CITY
Other Supplementary InformationBudgetary Comparison Schedule, Victorian Harbor Maintenance
For Fiscal Year Ended June 30, 2004
VICTORIAN HARBOR MAINTENANCE
Budgeted Amounts
137

Variance withFinal- Positive
Original Final Actual (Negative)Revenues:Taxes:
Property taxes -$ -$ -$ -$ Sales taxes - - - -
Licenses and permits - - - - Fines and forfeits - - - - Intergovernmental revenue - - - - Developer fees - - - - Special assessments 4,720 4,720 4,715 (5) Charges for services - - - - Investment earnings - - 16 16 Reimbursements - - - - Miscellaneous revenue - - - -
Total Revenues 4,720 4,720 4,731 11
ExpendituresCurrent:
General government - - - - Public safety - - - - Public works - - - - Highways and streets - - - - Building services - - - - Culture and recreation - - - - Community development 4,900 4,900 4,459 441 Intergovernmental - - - - Tax increment pass-through - -
Capital outlay - - - - Principal on long-term debt - - - - Interest on long-term debt - - - -
Total Expenditures 4,900 4,900 4,459 441
Excess of Revenues Over (Under) Expenditures (180) (180) 272 452
Other financing sources (uses):Debt proceeds - - - - Operating transfer in - - - - Operating transfer out - - - -
Total Other Financing Sources (Uses) - - - -
Excess of Revenues and Other Sources Over (Under) Expenditures and Other Uses (180) (180) 272 452
Fund balances-beginning 986 986 986 -
Fund balances-ending 806$ 806$ 1,258$ 452$
CITY OF SUISUN CITY
Other Supplementary InformationBudgetary Comparison Schedule, Railroad Avenue Maintenance
For Fiscal Year Ended June 30, 2004
RAILROAD AVENUE MAINTENANCE
Budgeted Amounts
138

Variance withFinal- Positive
Original Final Actual (Negative)Revenues:Taxes:
Property taxes -$ -$ -$ -$ Sales taxes - - - -
Licenses and permits - - - - Fines and forfeits - - - - Intergovernmental revenue - - - - Developer fees - - - - Special assessments 52,080 52,080 52,079 (1) Charges for services - - - - Investment earnings - - 4,236 4,236 Reimbursements - - - - Miscellaneous revenue - - - -
Total Revenues 52,080 52,080 56,315 4,235
ExpendituresCurrent:
General government - - - - Public safety - - - - Public works - - - - Highways and streets - - - - Building services - - - - Culture and recreation - - - - Community development 1,960 1,960 1,939 21 Intergovernmental - - - - Tax increment pass-through - -
Capital outlay - - - - Principal on long-term debt - - - - Interest on long-term debt - - - -
Total Expenditures 1,960 1,960 1,939 21
Excess of Revenues Over (Under) Expenditures 50,120 50,120 54,376 4,256
Other financing sources (uses):Debt proceeds - - - - Operating transfer in - - - - Operating transfer out - - - -
Total Other Financing Sources (Uses) - - - -
Excess of Revenues and Other Sources Over (Under) Expenditures and Other Uses 50,120 50,120 54,376 4,256
Fund balances-beginning 187,290 187,290 187,290 -
Fund balances-ending 237,410$ 237,410$ 241,666$ 4,256$
CITY OF SUISUN CITY
Other Supplementary InformationBudgetary Comparison Schedule, Marina Village Maintenance
For Fiscal Year Ended June 30, 2004
MARINA VILLAGE MAINTENANCE
Budgeted Amounts
139
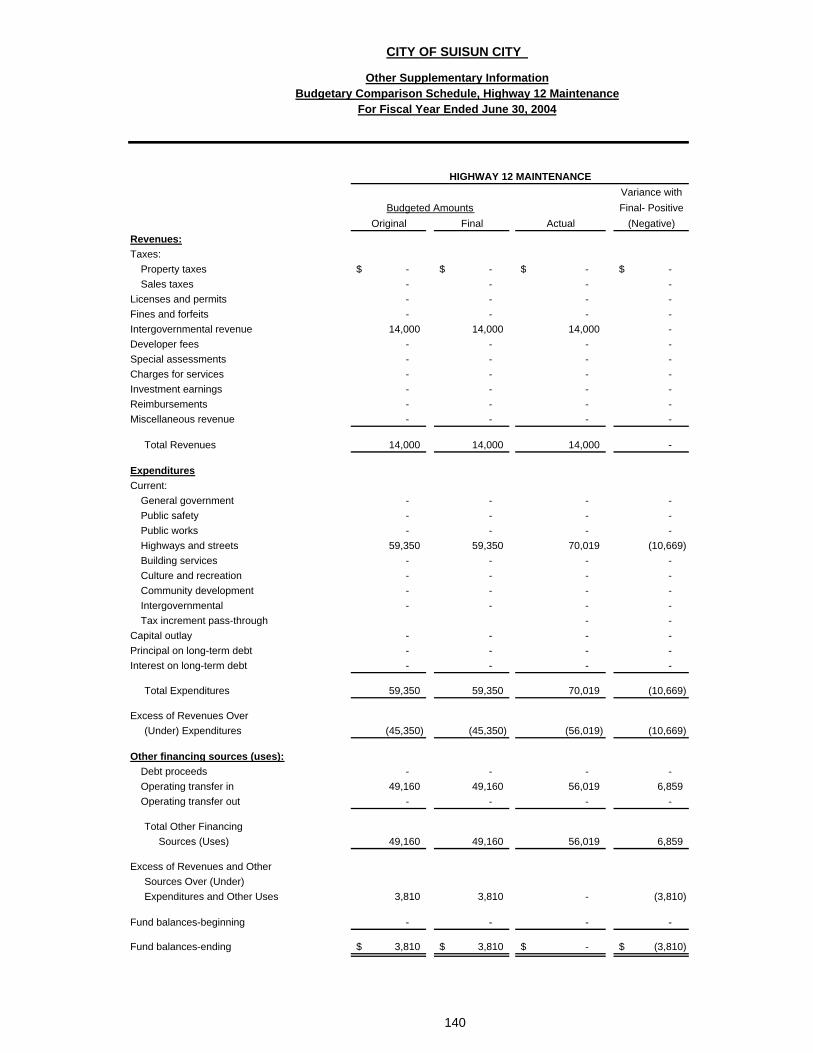
Variance withFinal- Positive
Original Final Actual (Negative)Revenues:Taxes:
Property taxes -$ -$ -$ -$ Sales taxes - - - -
Licenses and permits - - - - Fines and forfeits - - - - Intergovernmental revenue 14,000 14,000 14,000 - Developer fees - - - - Special assessments - - - - Charges for services - - - - Investment earnings - - - - Reimbursements - - - - Miscellaneous revenue - - - -
Total Revenues 14,000 14,000 14,000 -
ExpendituresCurrent:
General government - - - - Public safety - - - - Public works - - - - Highways and streets 59,350 59,350 70,019 (10,669) Building services - - - - Culture and recreation - - - - Community development - - - - Intergovernmental - - - - Tax increment pass-through - -
Capital outlay - - - - Principal on long-term debt - - - - Interest on long-term debt - - - -
Total Expenditures 59,350 59,350 70,019 (10,669)
Excess of Revenues Over (Under) Expenditures (45,350) (45,350) (56,019) (10,669)
Other financing sources (uses):Debt proceeds - - - - Operating transfer in 49,160 49,160 56,019 6,859 Operating transfer out - - - -
Total Other Financing Sources (Uses) 49,160 49,160 56,019 6,859
Excess of Revenues and Other Sources Over (Under) Expenditures and Other Uses 3,810 3,810 - (3,810)
Fund balances-beginning - - - -
Fund balances-ending 3,810$ 3,810$ -$ (3,810)$
CITY OF SUISUN CITY
Other Supplementary InformationBudgetary Comparison Schedule, Highway 12 Maintenance
For Fiscal Year Ended June 30, 2004
HIGHWAY 12 MAINTENANCE
Budgeted Amounts
140

Variance withFinal- Positive
Original Final Actual (Negative)Revenues:Taxes:
Property taxes -$ -$ -$ -$ Sales taxes - - - -
Licenses and permits - - - - Fines and forfeits - - - - Intergovernmental revenue - - - - Developer fees - - - - Special assessments 98,390 98,390 98,390 - Charges for services - - - - Investment earnings - - 1,002 1,002 Reimbursements - - - - Miscellaneous revenue - - - -
Total Revenues 98,390 98,390 99,392 1,002
ExpendituresCurrent:
General government - - - - Public safety - - - - Public works - - - - Highways and streets - - - - Building services - - - - Culture and recreation - - - - Community development 92,270 92,270 38,983 53,287 Intergovernmental - - - - Tax increment pass-through - -
Capital outlay - - - - Principal on long-term debt - - - - Interest on long-term debt - - - -
Total Expenditures 92,270 92,270 38,983 53,287
Excess of Revenues Over (Under) Expenditures 6,120 6,120 60,409 54,289
Other financing sources (uses):Debt proceeds - - - - Operating transfer in - - - - Operating transfer out - - - -
Total Other Financing Sources (Uses) - - - -
Excess of Revenues and Other Sources Over (Under) Expenditures and Other Uses 6,120 6,120 60,409 54,289
Fund balances-beginning 32,167 32,167 32,167 -
Fund balances-ending 38,287$ 38,287$ 92,576$ 54,289$
CITY OF SUISUN CITY
Other Supplementary InformationBudgetary Comparison Schedule, Peterson Ranch Maintenance and Community Facilitiy
For Fiscal Year Ended June 30, 2004
PETERSON RANCH MAINTENANCE AND COMMUNITY FACILITY
Budgeted Amounts
141
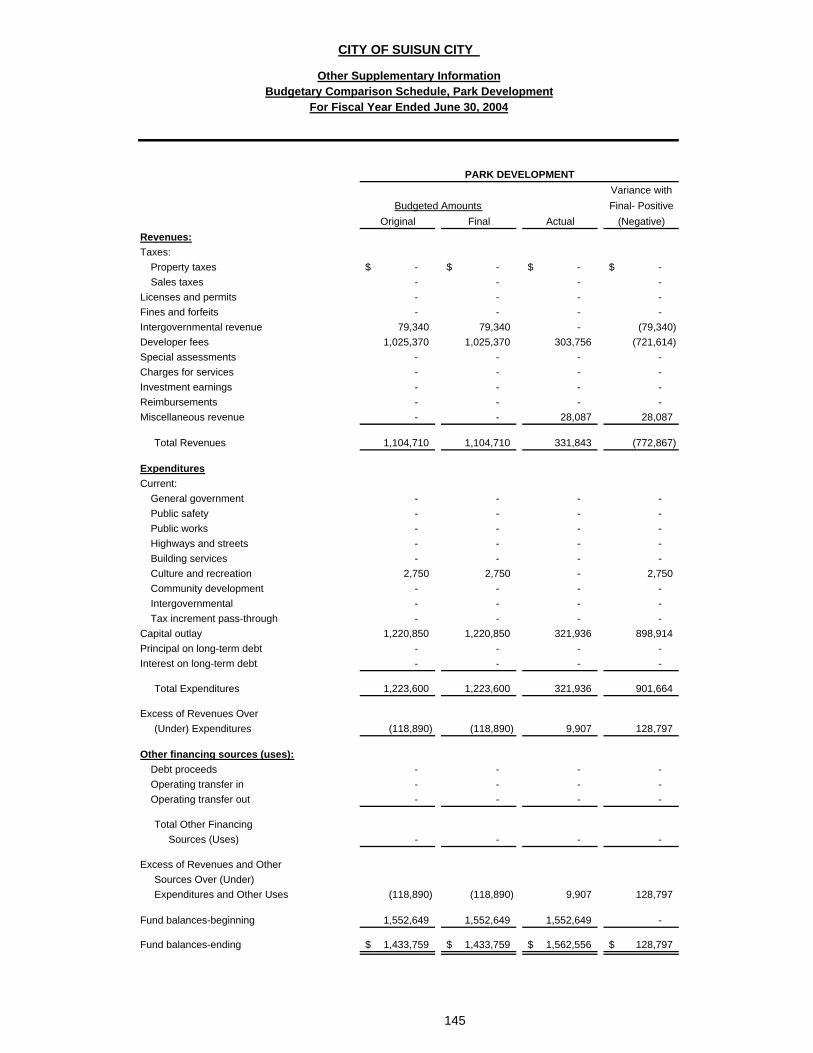
Variance withFinal- Positive
Original Final Actual (Negative)Revenues:Taxes:
Property taxes -$ -$ -$ -$ Sales taxes - - - -
Licenses and permits - - - - Fines and forfeits - - - - Intergovernmental revenue 79,340 79,340 - (79,340) Developer fees 1,025,370 1,025,370 303,756 (721,614) Special assessments - - - - Charges for services - - - - Investment earnings - - - - Reimbursements - - - - Miscellaneous revenue - - 28,087 28,087
Total Revenues 1,104,710 1,104,710 331,843 (772,867)
ExpendituresCurrent:
General government - - - - Public safety - - - - Public works - - - - Highways and streets - - - - Building services - - - - Culture and recreation 2,750 2,750 - 2,750 Community development - - - - Intergovernmental - - - - Tax increment pass-through - - - -
Capital outlay 1,220,850 1,220,850 321,936 898,914 Principal on long-term debt - - - - Interest on long-term debt - - - -
Total Expenditures 1,223,600 1,223,600 321,936 901,664
Excess of Revenues Over (Under) Expenditures (118,890) (118,890) 9,907 128,797
Other financing sources (uses):Debt proceeds - - - - Operating transfer in - - - - Operating transfer out - - - -
Total Other Financing Sources (Uses) - - - -
Excess of Revenues and Other Sources Over (Under) Expenditures and Other Uses (118,890) (118,890) 9,907 128,797
Fund balances-beginning 1,552,649 1,552,649 1,552,649 -
Fund balances-ending 1,433,759$ 1,433,759$ 1,562,556$ 128,797$
145
CITY OF SUISUN CITY
Other Supplementary InformationBudgetary Comparison Schedule, Park Development
For Fiscal Year Ended June 30, 2004
Budgeted Amounts
PARK DEVELOPMENT

Variance withFinal- Positive
Original Final Actual (Negative)Revenues:Taxes:
Property taxes -$ -$ -$ -$ Sales taxes - - - -
Licenses and permits - - - - Fines and forfeits - - - - Intergovernmental revenue - - - - Developer fees - - - - Special assessments - - - - Charges for services - - - - Investment earnings - - - - Reimbursements - - - - Miscellaneous revenue - - - -
Total Revenues - - - -
ExpendituresCurrent:
General government - - - - Public safety - - - - Public works - - - - Highways and streets - - - - Building services - - - - Culture and recreation - - - - Community development - - - - Intergovernmental - - - - Tax increment pass-through
Capital outlay - - - - Principal on long-term debt - - - - Interest on long-term debt - - - -
Total Expenditures - - - -
Excess of Revenues Over (Under) Expenditures - - - -
Other financing sources (uses):Debt proceeds - - - - Operating transfer in - - - - Operating transfer out - - - -
Total Other Financing Sources (Uses) - - - -
Excess of Revenues and Other Sources Over (Under) Expenditures and Other Uses - - - -
Fund balances-beginning 2,000 2,000 2,000 -
Fund balances-ending 2,000$ 2,000$ 2,000$ -
146
CITY OF SUISUN CITY
Other Supplementary InformationBudgetary Comparison Schedule, Repair and Demolition
For Fiscal Year Ended June 30, 2004
Budgeted Amounts
REPAIR AND DEMOLITION
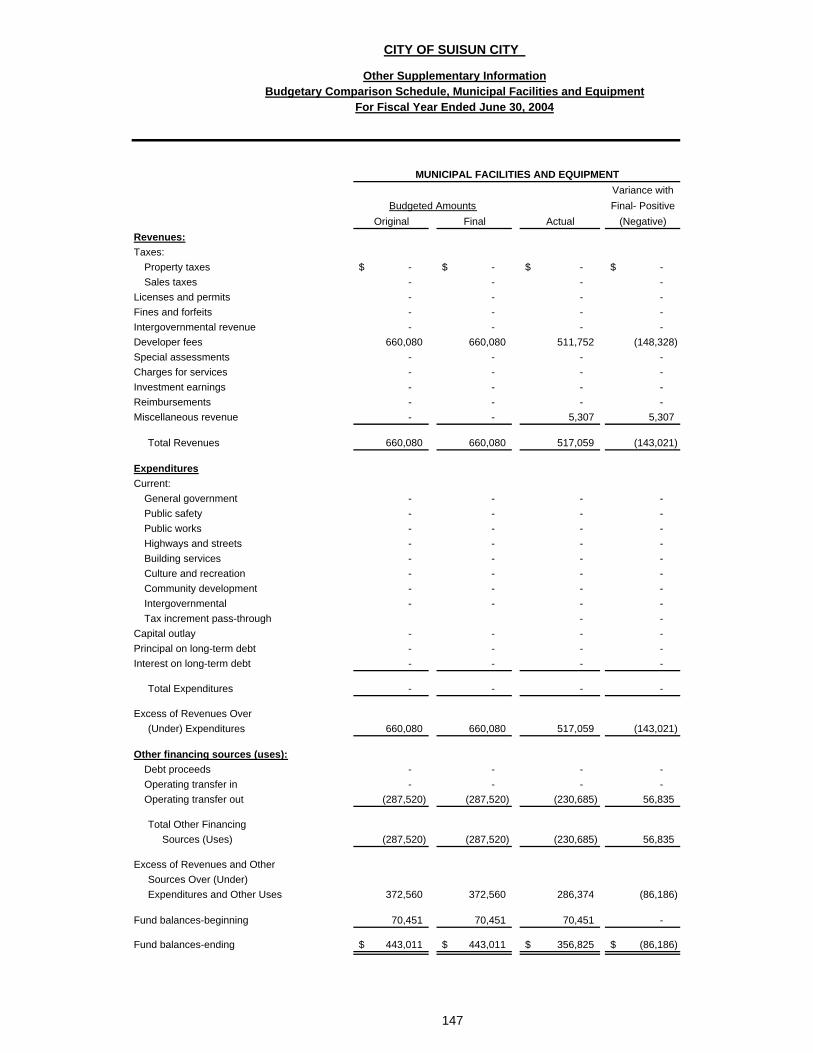
Variance withFinal- Positive
Original Final Actual (Negative)Revenues:Taxes:
Property taxes -$ -$ -$ -$ Sales taxes - - - -
Licenses and permits - - - - Fines and forfeits - - - - Intergovernmental revenue - - - - Developer fees 660,080 660,080 511,752 (148,328) Special assessments - - - - Charges for services - - - - Investment earnings - - - - Reimbursements - - - - Miscellaneous revenue - - 5,307 5,307
Total Revenues 660,080 660,080 517,059 (143,021)
ExpendituresCurrent:
General government - - - - Public safety - - - - Public works - - - - Highways and streets - - - - Building services - - - - Culture and recreation - - - - Community development - - - - Intergovernmental - - - - Tax increment pass-through - -
Capital outlay - - - - Principal on long-term debt - - - - Interest on long-term debt - - - -
Total Expenditures - - - -
Excess of Revenues Over (Under) Expenditures 660,080 660,080 517,059 (143,021)
Other financing sources (uses):Debt proceeds - - - - Operating transfer in - - - - Operating transfer out (287,520) (287,520) (230,685) 56,835
Total Other Financing Sources (Uses) (287,520) (287,520) (230,685) 56,835
Excess of Revenues and Other Sources Over (Under) Expenditures and Other Uses 372,560 372,560 286,374 (86,186)
Fund balances-beginning 70,451 70,451 70,451 -
Fund balances-ending 443,011$ 443,011$ 356,825$ (86,186)$
147
CITY OF SUISUN CITY
Other Supplementary InformationBudgetary Comparison Schedule, Municipal Facilities and Equipment
For Fiscal Year Ended June 30, 2004
MUNICIPAL FACILITIES AND EQUIPMENT
Budgeted Amounts

Variance withFinal- Positive
Original Final Actual (Negative)Revenues:Taxes:
Property taxes -$ -$ -$ -$ Sales taxes - - - -
Licenses and permits - - - - Fines and forfeits - - - - Intergovernmental revenue - - - - Developer fees - - - - Special assessments - - - - Charges for services - - - - Investment earnings - - - - Reimbursements - - - - Miscellaneous revenue - - 491 491
Total Revenues - - 491 491
ExpendituresCurrent:
General government - - - - Public safety - - - - Public works - - - - Highways and streets - - - - Building services - - - - Culture and recreation - - - - Community development - - - - Intergovernmental - - - - Tax increment pass-through - - - -
Capital outlay 77,440 77,440 73,968 3,472 Principal on long-term debt - - - - Interest on long-term debt - - - -
Total Expenditures 77,440 77,440 73,968 3,472
Excess of Revenues Over (Under) Expenditures (77,440) (77,440) (73,477) 3,963
Other financing sources (uses):Debt proceeds - - - - Operating transfer in - - - - Operating transfer out - - - -
Total Other Financing Sources (Uses) - - - -
Excess of Revenues and Other Sources Over (Under) Expenditures and Other Uses (77,440) (77,440) (73,477) 3,963
Fund balances-beginning 76,546 76,546 76,546 -
Fund balances-ending (894)$ (894)$ 3,069$ 3,963$
148
CITY OF SUISUN CITY
Other Supplementary InformationBudgetary Comparison Schedule, Corporation Yard
For Fiscal Year Ended June 30, 2004
CORPORATION YARD
Budgeted Amounts

Variance withFinal- Positive
Original Final Actual (Negative)Revenues:Taxes:
Property taxes -$ -$ -$ -$ Sales taxes - - - -
Licenses and permits - - - - Fines and forfeits - - - - Intergovernmental revenue - - - - Developer fees - - - - Special assessments - - - - Charges for services - - - - Investment earnings - - - - Reimbursements - - - - Miscellaneous revenue - - - -
Total Revenues - - - -
ExpendituresCurrent:
General government - - - - Public safety - - - - Public works - - - - Highways and streets - - - - Building services - - - - Culture and recreation - - - - Community development - - - - Intergovernmental - - - - Tax increment pass-through - -
Capital outlay 60,000 60,000 1,157 58,843 Principal on long-term debt - - - - Interest on long-term debt - - - -
Total Expenditures 60,000 60,000 1,157 58,843
Excess of Revenues Over (Under) Expenditures (60,000) (60,000) (1,157) 58,843
Other financing sources (uses):Debt proceeds - - - - Operating transfer in 60,000 60,000 1,157 (58,843) Operating transfer out - - - -
Total Other Financing Sources (Uses) 60,000 60,000 1,157 (58,843)
Excess of Revenues and Other Sources Over (Under) Expenditures and Other Uses - - - -
Fund balances-beginning - - - -
Fund balances-ending -$ -$ -$ -$
Budgetary Comparison Schedule, Highway 12 ExpansionFor Fiscal Year Ended June 30, 2004
HIGHWAY 12 EXPANSION
Budgeted Amounts
149
CITY OF SUISUN CITY
Other Supplementary Information
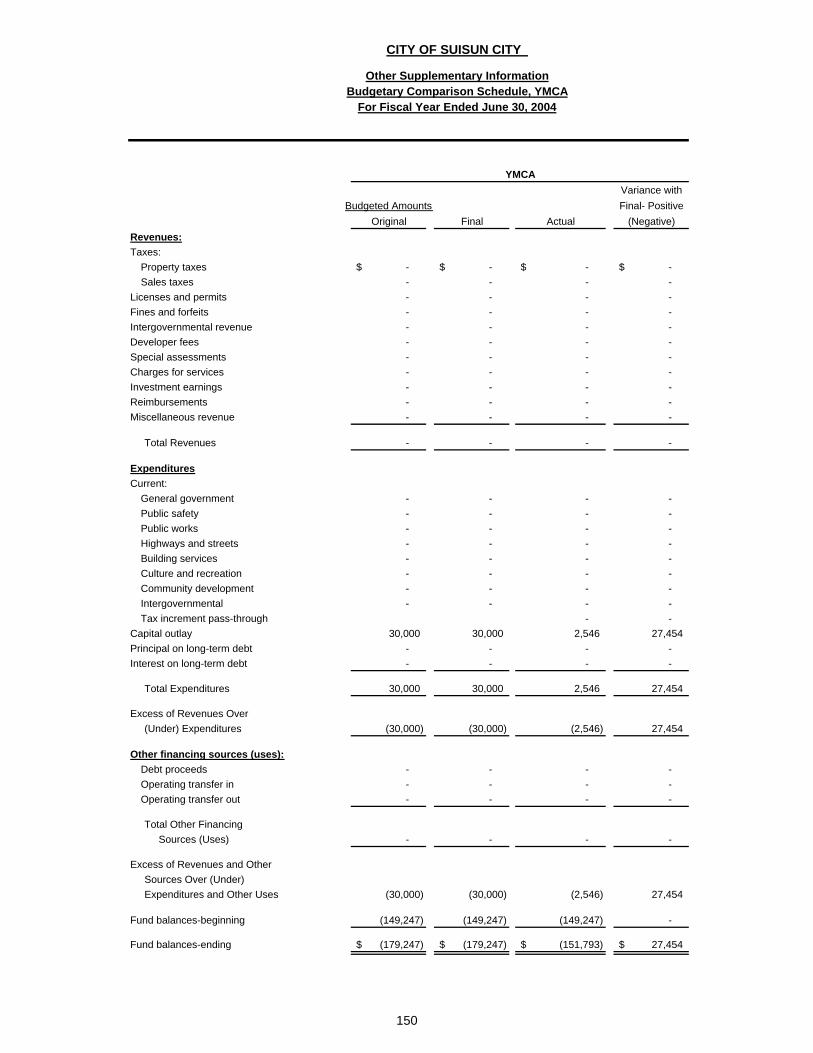
Variance withBudgeted Amounts Final- Positive
Original Final Actual (Negative)Revenues:Taxes:
Property taxes -$ -$ -$ -$ Sales taxes - - - -
Licenses and permits - - - - Fines and forfeits - - - - Intergovernmental revenue - - - - Developer fees - - - - Special assessments - - - - Charges for services - - - - Investment earnings - - - - Reimbursements - - - - Miscellaneous revenue - - - -
Total Revenues - - - -
ExpendituresCurrent:
General government - - - - Public safety - - - - Public works - - - - Highways and streets - - - - Building services - - - - Culture and recreation - - - - Community development - - - - Intergovernmental - - - - Tax increment pass-through - -
Capital outlay 30,000 30,000 2,546 27,454 Principal on long-term debt - - - - Interest on long-term debt - - - -
Total Expenditures 30,000 30,000 2,546 27,454
Excess of Revenues Over (Under) Expenditures (30,000) (30,000) (2,546) 27,454
Other financing sources (uses):Debt proceeds - - - - Operating transfer in - - - - Operating transfer out - - - -
Total Other Financing Sources (Uses) - - - -
Excess of Revenues and Other Sources Over (Under) Expenditures and Other Uses (30,000) (30,000) (2,546) 27,454
Fund balances-beginning (149,247) (149,247) (149,247) -
Fund balances-ending (179,247)$ (179,247)$ (151,793)$ 27,454$
150
CITY OF SUISUN CITY
Other Supplementary InformationBudgetary Comparison Schedule, YMCA
For Fiscal Year Ended June 30, 2004
YMCA
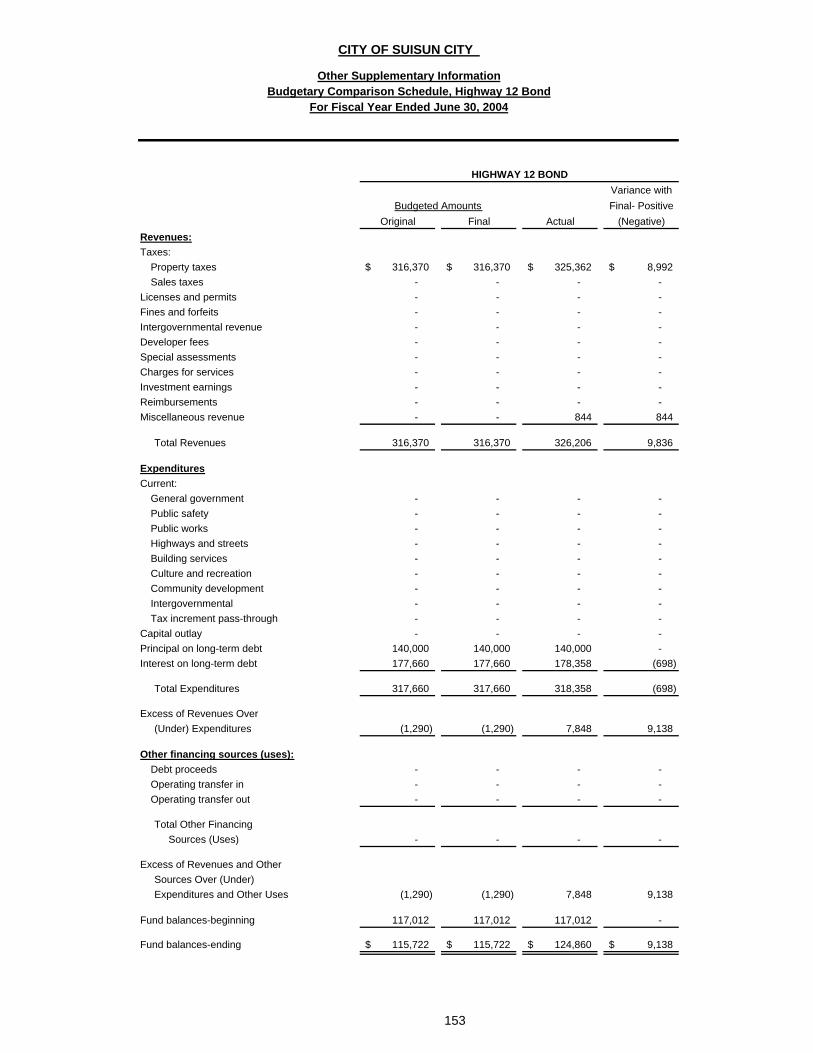
Variance withFinal- Positive
Original Final Actual (Negative)Revenues:Taxes:
Property taxes 316,370$ 316,370$ 325,362$ 8,992$ Sales taxes - - - -
Licenses and permits - - - - Fines and forfeits - - - - Intergovernmental revenue - - - - Developer fees - - - - Special assessments - - - - Charges for services - - - - Investment earnings - - - - Reimbursements - - - - Miscellaneous revenue - - 844 844
Total Revenues 316,370 316,370 326,206 9,836
ExpendituresCurrent:
General government - - - - Public safety - - - - Public works - - - - Highways and streets - - - - Building services - - - - Culture and recreation - - - - Community development - - - - Intergovernmental - - - - Tax increment pass-through - - - -
Capital outlay - - - - Principal on long-term debt 140,000 140,000 140,000 - Interest on long-term debt 177,660 177,660 178,358 (698)
Total Expenditures 317,660 317,660 318,358 (698)
Excess of Revenues Over (Under) Expenditures (1,290) (1,290) 7,848 9,138
Other financing sources (uses):Debt proceeds - - - - Operating transfer in - - - - Operating transfer out - - - -
Total Other Financing Sources (Uses) - - - -
Excess of Revenues and Other Sources Over (Under) Expenditures and Other Uses (1,290) (1,290) 7,848 9,138
Fund balances-beginning 117,012 117,012 117,012 -
Fund balances-ending 115,722$ 115,722$ 124,860$ 9,138$
CITY OF SUISUN CITY
Other Supplementary InformationBudgetary Comparison Schedule, Highway 12 Bond
For Fiscal Year Ended June 30, 2004
HIGHWAY 12 BOND
153
Budgeted Amounts
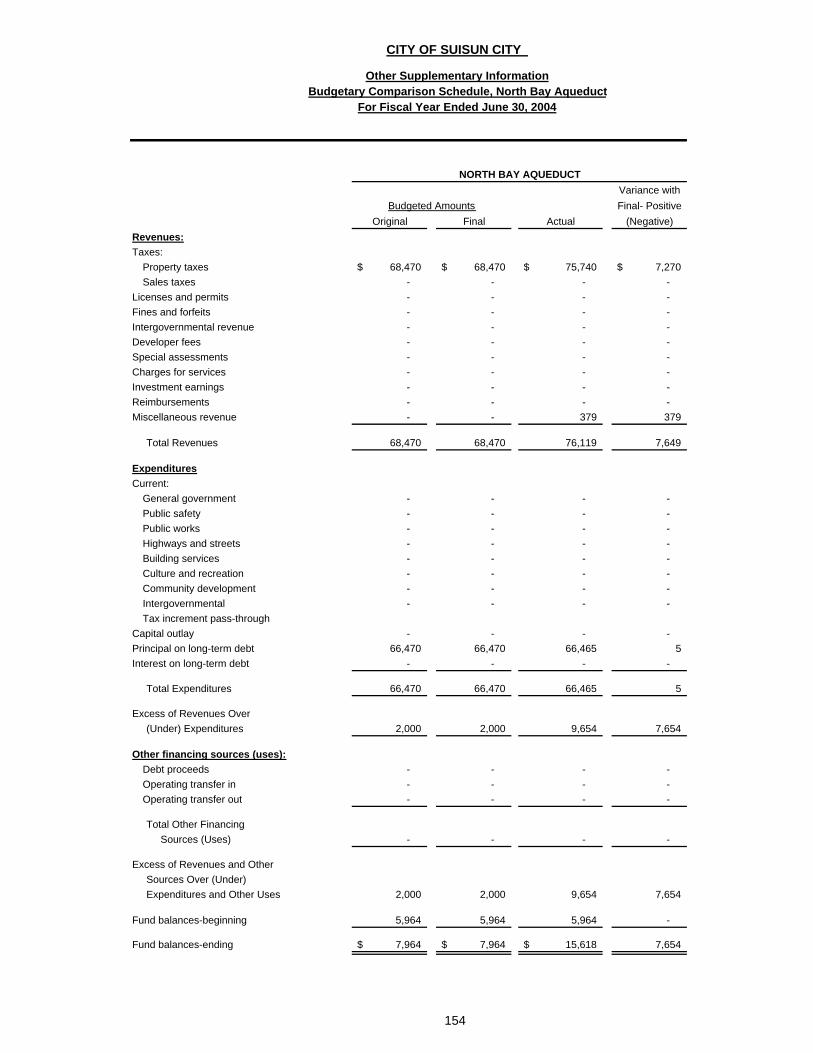
Variance withFinal- Positive
Original Final Actual (Negative)Revenues:Taxes:
Property taxes 68,470$ 68,470$ 75,740$ 7,270$ Sales taxes - - - -
Licenses and permits - - - - Fines and forfeits - - - - Intergovernmental revenue - - - - Developer fees - - - - Special assessments - - - - Charges for services - - - - Investment earnings - - - - Reimbursements - - - - Miscellaneous revenue - - 379 379
Total Revenues 68,470 68,470 76,119 7,649
ExpendituresCurrent:
General government - - - - Public safety - - - - Public works - - - - Highways and streets - - - - Building services - - - - Culture and recreation - - - - Community development - - - - Intergovernmental - - - - Tax increment pass-through
Capital outlay - - - - Principal on long-term debt 66,470 66,470 66,465 5 Interest on long-term debt - - - -
Total Expenditures 66,470 66,470 66,465 5
Excess of Revenues Over (Under) Expenditures 2,000 2,000 9,654 7,654
Other financing sources (uses):Debt proceeds - - - - Operating transfer in - - - - Operating transfer out - - - -
Total Other Financing Sources (Uses) - - - -
Excess of Revenues and Other Sources Over (Under) Expenditures and Other Uses 2,000 2,000 9,654 7,654
Fund balances-beginning 5,964 5,964 5,964 -
Fund balances-ending 7,964$ 7,964$ 15,618$ 7,654
CITY OF SUISUN CITY
Other Supplementary InformationBudgetary Comparison Schedule, North Bay Aqueduct
NORTH BAY AQUEDUCT
154
Budgeted Amounts
For Fiscal Year Ended June 30, 2004
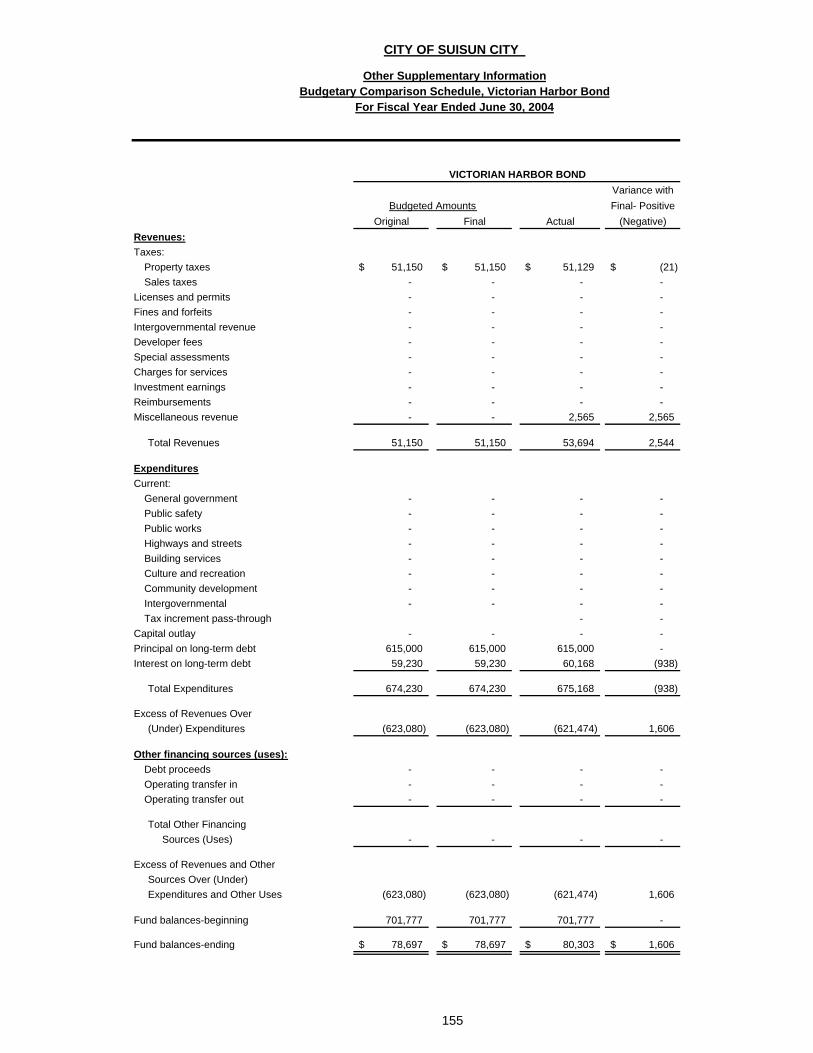
Variance withFinal- Positive
Original Final Actual (Negative)Revenues:Taxes:
Property taxes 51,150$ 51,150$ 51,129$ (21)$ Sales taxes - - - -
Licenses and permits - - - - Fines and forfeits - - - - Intergovernmental revenue - - - - Developer fees - - - - Special assessments - - - - Charges for services - - - - Investment earnings - - - - Reimbursements - - - - Miscellaneous revenue - - 2,565 2,565
Total Revenues 51,150 51,150 53,694 2,544
ExpendituresCurrent:
General government - - - - Public safety - - - - Public works - - - - Highways and streets - - - - Building services - - - - Culture and recreation - - - - Community development - - - - Intergovernmental - - - - Tax increment pass-through - -
Capital outlay - - - - Principal on long-term debt 615,000 615,000 615,000 - Interest on long-term debt 59,230 59,230 60,168 (938)
Total Expenditures 674,230 674,230 675,168 (938)
Excess of Revenues Over (Under) Expenditures (623,080) (623,080) (621,474) 1,606
Other financing sources (uses):Debt proceeds - - - - Operating transfer in - - - - Operating transfer out - - - -
Total Other Financing Sources (Uses) - - - -
Excess of Revenues and Other Sources Over (Under) Expenditures and Other Uses (623,080) (623,080) (621,474) 1,606
Fund balances-beginning 701,777 701,777 701,777 -
Fund balances-ending 78,697$ 78,697$ 80,303$ 1,606$
CITY OF SUISUN CITY
Other Supplementary InformationBudgetary Comparison Schedule, Victorian Harbor Bond
For Fiscal Year Ended June 30, 2004
155
Budgeted Amounts
VICTORIAN HARBOR BOND

Variance withFinal- Positive
Original Final Actual (Negative)Revenues:Taxes:
Property taxes -$ -$ -$ -$ Sales taxes - - - -
Licenses and permits - - - - Fines and forfeits - - - - Intergovernmental revenue - - - - Developer fees - - - - Special assessments - - - - Charges for services - - - - Investment earnings - - - - Reimbursements 287,520 287,520 278,204 (9,316) Miscellaneous revenue 66,870 66,870 57,194 (9,676)
Total Revenues 354,390 354,390 335,398 (18,992)
ExpendituresCurrent:
General government - - - - Public safety - - - - Public works - - - - Highways and streets - - - - Building services - - - - Culture and recreation - - - - Community development - - - - Intergovernmental - - - - Tax increment pass-through - - - -
Capital outlay - - - - Principal on long-term debt 130,000 130,000 2,525,000 (2,395,000) Interest on long-term debt 160,770 160,770 303,465 (142,695)
Total Expenditures 290,770 290,770 2,828,465 (2,537,695)
Excess of Revenues Over (Under) Expenditures 63,620 63,620 (2,493,067) (2,556,687)
Other financing sources (uses):Debt proceeds - - 2,490,000 2,490,000 Operating transfer in - - 230,685 230,685 Operating transfer out - - - -
Total Other Financing Sources (Uses) - - 2,720,685 2,720,685
Excess of Revenues and Other Sources Over (Under) Expenditures and Other Uses 63,620 63,620 227,618 163,998
Fund balances-beginning 27,947 27,947 27,947 -
Fund balances-ending 91,567$ 91,567$ 255,565$ 163,998$
CITY OF SUISUN CITY
Other Supplementary InformationBudgetary Comparison Schedule, Civic Center COP
For Fiscal Year Ended June 30, 2004
156
Budgeted Amounts
CIVIC CENTER COP
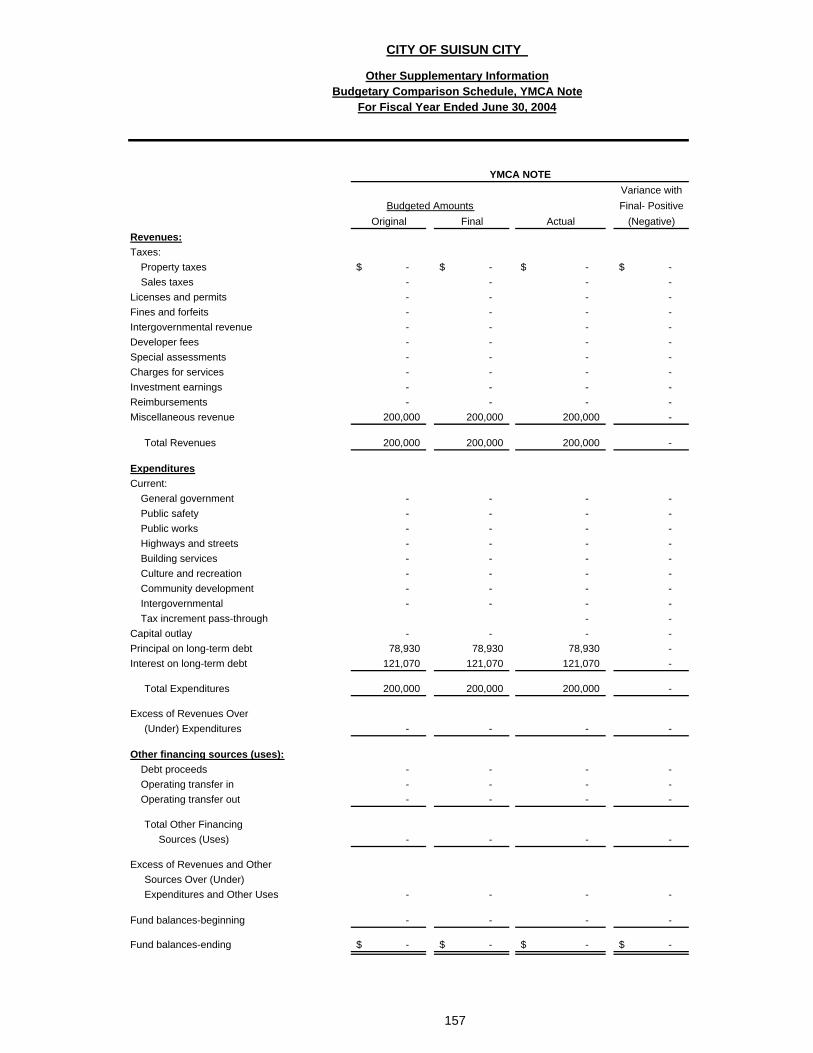
Variance withFinal- Positive
Original Final Actual (Negative)Revenues:Taxes:
Property taxes -$ -$ -$ -$ Sales taxes - - - -
Licenses and permits - - - - Fines and forfeits - - - - Intergovernmental revenue - - - - Developer fees - - - - Special assessments - - - - Charges for services - - - - Investment earnings - - - - Reimbursements - - - - Miscellaneous revenue 200,000 200,000 200,000 -
Total Revenues 200,000 200,000 200,000 -
ExpendituresCurrent:
General government - - - - Public safety - - - - Public works - - - - Highways and streets - - - - Building services - - - - Culture and recreation - - - - Community development - - - - Intergovernmental - - - - Tax increment pass-through - -
Capital outlay - - - - Principal on long-term debt 78,930 78,930 78,930 - Interest on long-term debt 121,070 121,070 121,070 -
Total Expenditures 200,000 200,000 200,000 -
Excess of Revenues Over (Under) Expenditures - - - -
Other financing sources (uses):Debt proceeds - - - - Operating transfer in - - - - Operating transfer out - - - -
Total Other Financing Sources (Uses) - - - -
Excess of Revenues and Other Sources Over (Under) Expenditures and Other Uses - - - -
Fund balances-beginning - - - -
Fund balances-ending -$ -$ -$ -$
CITY OF SUISUN CITY
Other Supplementary InformationBudgetary Comparison Schedule, YMCA Note
157
Budgeted Amounts
For Fiscal Year Ended June 30, 2004
YMCA NOTE
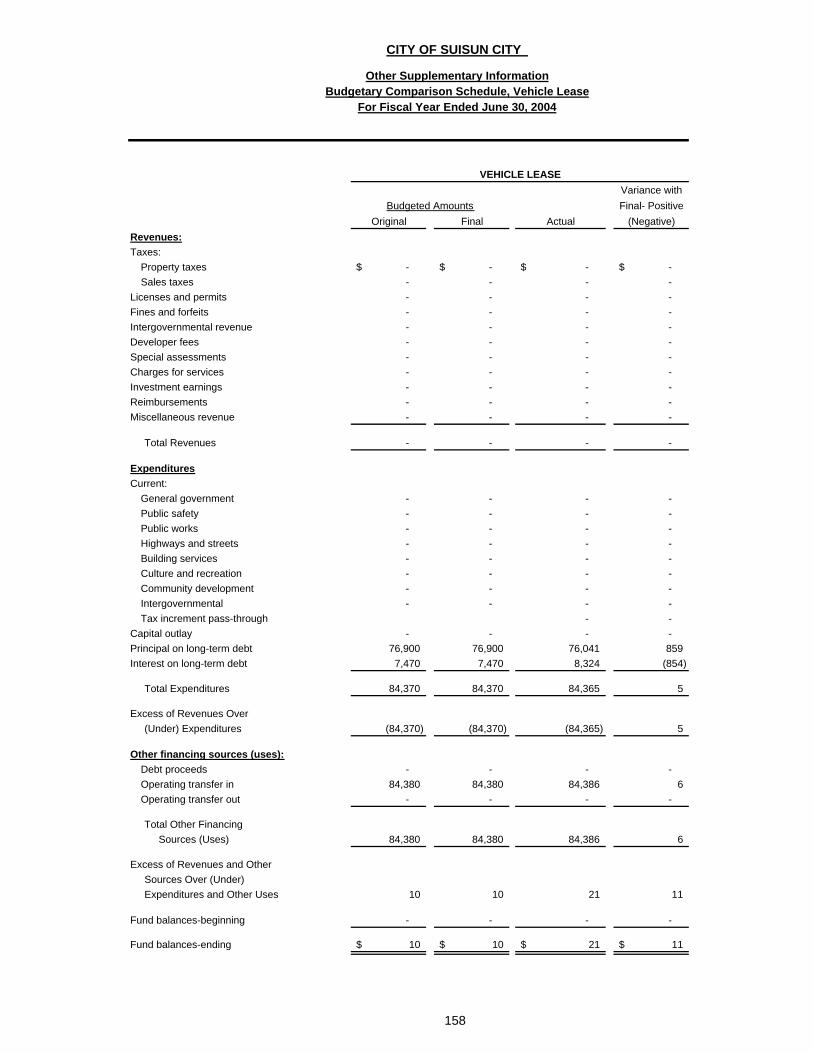
Variance withFinal- Positive
Original Final Actual (Negative)Revenues:Taxes:
Property taxes -$ -$ -$ -$ Sales taxes - - - -
Licenses and permits - - - - Fines and forfeits - - - - Intergovernmental revenue - - - - Developer fees - - - - Special assessments - - - - Charges for services - - - - Investment earnings - - - - Reimbursements - - - - Miscellaneous revenue - - - -
Total Revenues - - - -
ExpendituresCurrent:
General government - - - - Public safety - - - - Public works - - - - Highways and streets - - - - Building services - - - - Culture and recreation - - - - Community development - - - - Intergovernmental - - - - Tax increment pass-through - -
Capital outlay - - - - Principal on long-term debt 76,900 76,900 76,041 859 Interest on long-term debt 7,470 7,470 8,324 (854)
Total Expenditures 84,370 84,370 84,365 5
Excess of Revenues Over (Under) Expenditures (84,370) (84,370) (84,365) 5
Other financing sources (uses):Debt proceeds - - - - Operating transfer in 84,380 84,380 84,386 6 Operating transfer out - - - -
Total Other Financing Sources (Uses) 84,380 84,380 84,386 6
Excess of Revenues and Other Sources Over (Under) Expenditures and Other Uses 10 10 21 11
Fund balances-beginning - - - -
Fund balances-ending 10$ 10$ 21$ 11$
VEHICLE LEASE
Budgeted Amounts
CITY OF SUISUN CITY
Other Supplementary InformationBudgetary Comparison Schedule, Vehicle Lease
For Fiscal Year Ended June 30, 2004
158
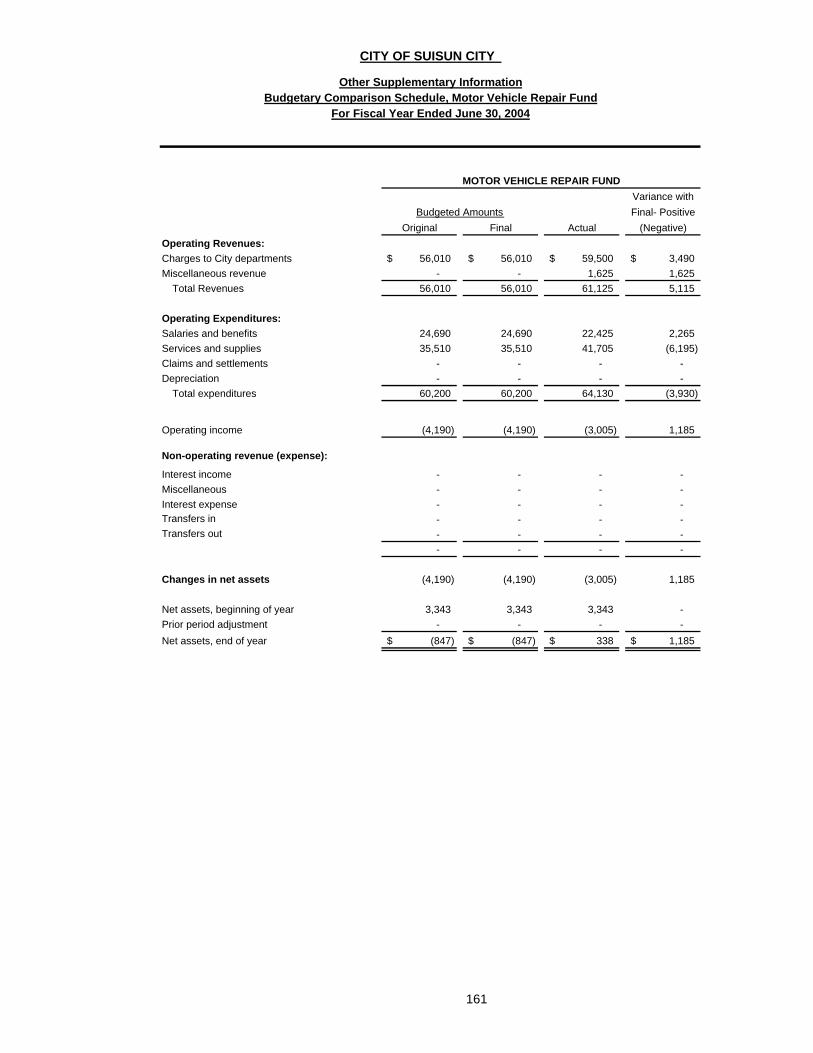
Variance withFinal- Positive
Original Final Actual (Negative)Operating Revenues:Charges to City departments 56,010$ 56,010$ 59,500$ 3,490$ Miscellaneous revenue - - 1,625 1,625
Total Revenues 56,010 56,010 61,125 5,115
Operating Expenditures:Salaries and benefits 24,690 24,690 22,425 2,265 Services and supplies 35,510 35,510 41,705 (6,195) Claims and settlements - - - - Depreciation - - - -
Total expenditures 60,200 60,200 64,130 (3,930)
Operating income (4,190) (4,190) (3,005) 1,185
Non-operating revenue (expense):
Interest income - - - - Miscellaneous - - - - Interest expense - - - - Transfers in - - - - Transfers out - - - - - - - - Changes in net assets (4,190) (4,190) (3,005) 1,185
Net assets, beginning of year 3,343 3,343 3,343 - Prior period adjustment - - - - Net assets, end of year (847)$ (847)$ 338$ 1,185$
CITY OF SUISUN CITY
Other Supplementary InformationBudgetary Comparison Schedule, Motor Vehicle Repair Fund
For Fiscal Year Ended June 30, 2004
161
Budgeted Amounts
MOTOR VEHICLE REPAIR FUND
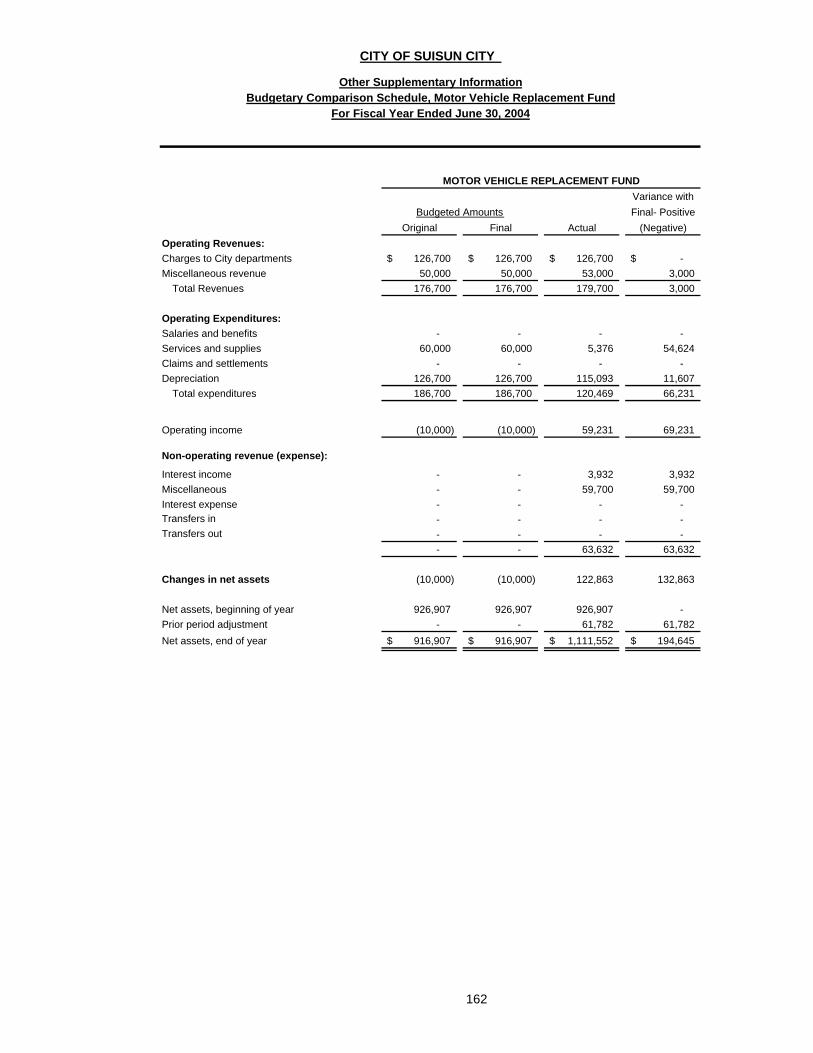
Variance withFinal- Positive
Original Final Actual (Negative)Operating Revenues:Charges to City departments 126,700$ 126,700$ 126,700$ -$ Miscellaneous revenue 50,000 50,000 53,000 3,000
Total Revenues 176,700 176,700 179,700 3,000
Operating Expenditures:Salaries and benefits - - - - Services and supplies 60,000 60,000 5,376 54,624 Claims and settlements - - - - Depreciation 126,700 126,700 115,093 11,607
Total expenditures 186,700 186,700 120,469 66,231
Operating income (10,000) (10,000) 59,231 69,231
Non-operating revenue (expense):
Interest income - - 3,932 3,932 Miscellaneous - - 59,700 59,700 Interest expense - - - - Transfers in - - - - Transfers out - - - - - - 63,632 63,632
Changes in net assets (10,000) (10,000) 122,863 132,863
Net assets, beginning of year 926,907 926,907 926,907 - Prior period adjustment - - 61,782 61,782 Net assets, end of year 916,907$ 916,907$ 1,111,552$ 194,645$
Other Supplementary Information
Budgeted Amounts
MOTOR VEHICLE REPLACEMENT FUND
CITY OF SUISUN CITY
Budgetary Comparison Schedule, Motor Vehicle Replacement FundFor Fiscal Year Ended June 30, 2004
162

Variance withFinal- Positive
Original Final Actual (Negative)Operating Revenues:Charges to City departments 69,070$ 69,070$ 69,075$ 5$ Miscellaneous revenue - - - -
Total Revenues 69,070 69,070 69,075 5
Operating Expenditures:Salaries and benefits 33,500 33,500 33,402 98 Services and supplies 26,760 26,760 27,771 (1,011) Claims and settlements - - - - Depreciation - - - -
Total expenditures 60,260 60,260 61,173 913
Operating income 8,810 8,810 7,902 (908)
Non-operating revenue (expense):
Interest income - - 1,462 1,462 Miscellaneous - - - - Interest expense - - - - Transfers in - - - - Transfers out - - - - - - 1,462 1,462
Changes in net assets 8,810 8,810 9,364 554
Net assets, beginning of year 81,372 81,372 81,372 - Prior period adjustment - - - - Net assets, end of year 90,182$ 90,182$ 90,736$ 554$
Budgetary Comparison Schedule, Equipment Maintenance FundFor Fiscal Year Ended June 30, 2004
CITY OF SUISUN CITY
Budgeted Amounts
Other Supplementary Information
163
EQUIPMENT MAINTENANCE FUND

Variance withFinal- Positive
Original Final Actual (Negative)Operating Revenues:Charges to City departments 60,100$ 60,100$ 64,004$ 3,904$ Miscellaneous revenue - - - -
Total Revenues 60,100 60,100 64,004 3,904
Operating Expenditures:Salaries and benefits - - - - Services and supplies - - - - Claims and settlements - - - - Depreciation 60,100 60,100 42,038 18,062
Total expenditures 60,100 60,100 42,038 18,062
Operating income - - 21,966 21,966
Non-operating revenue (expense):
Interest income - - 1,990 1,990 Miscellaneous - - - - Interest expense - - - - Transfers in - - 6,102 6,102 Transfers out - - - - - - 8,092 8,092
Changes in net assets - - 30,058 30,058
Net assets, beginning of year 298,816 298,816 298,816 - Prior period adjustment - - - - Net assets, end of year 298,816$ 298,816$ 328,874$ 30,058$
Other Supplementary InformationBudgetary Comparison Schedule, Equipment Replacement Fund
CITY OF SUISUN CITY
164
For Fiscal Year Ended June 30, 2004
EQUIPMENT REPLACEMENT FUND
Budgeted Amounts
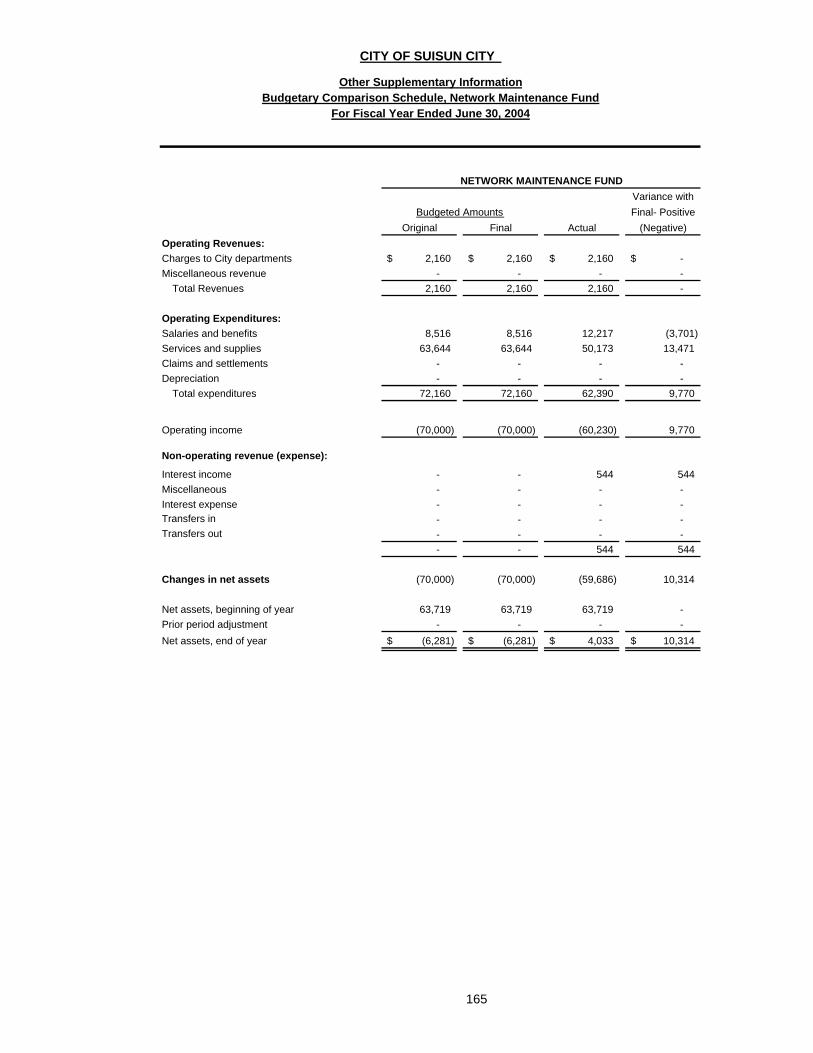
Variance withFinal- Positive
Original Final Actual (Negative)Operating Revenues:Charges to City departments 2,160$ 2,160$ 2,160$ -$ Miscellaneous revenue - - - -
Total Revenues 2,160 2,160 2,160 -
Operating Expenditures:Salaries and benefits 8,516 8,516 12,217 (3,701) Services and supplies 63,644 63,644 50,173 13,471 Claims and settlements - - - - Depreciation - - - -
Total expenditures 72,160 72,160 62,390 9,770
Operating income (70,000) (70,000) (60,230) 9,770
Non-operating revenue (expense):
Interest income - - 544 544 Miscellaneous - - - - Interest expense - - - - Transfers in - - - - Transfers out - - - - - - 544 544
Changes in net assets (70,000) (70,000) (59,686) 10,314
Net assets, beginning of year 63,719 63,719 63,719 - Prior period adjustment - - - - Net assets, end of year (6,281)$ (6,281)$ 4,033$ 10,314$
NETWORK MAINTENANCE FUND
Budgeted Amounts
Other Supplementary Information
CITY OF SUISUN CITY
Budgetary Comparison Schedule, Network Maintenance FundFor Fiscal Year Ended June 30, 2004
165
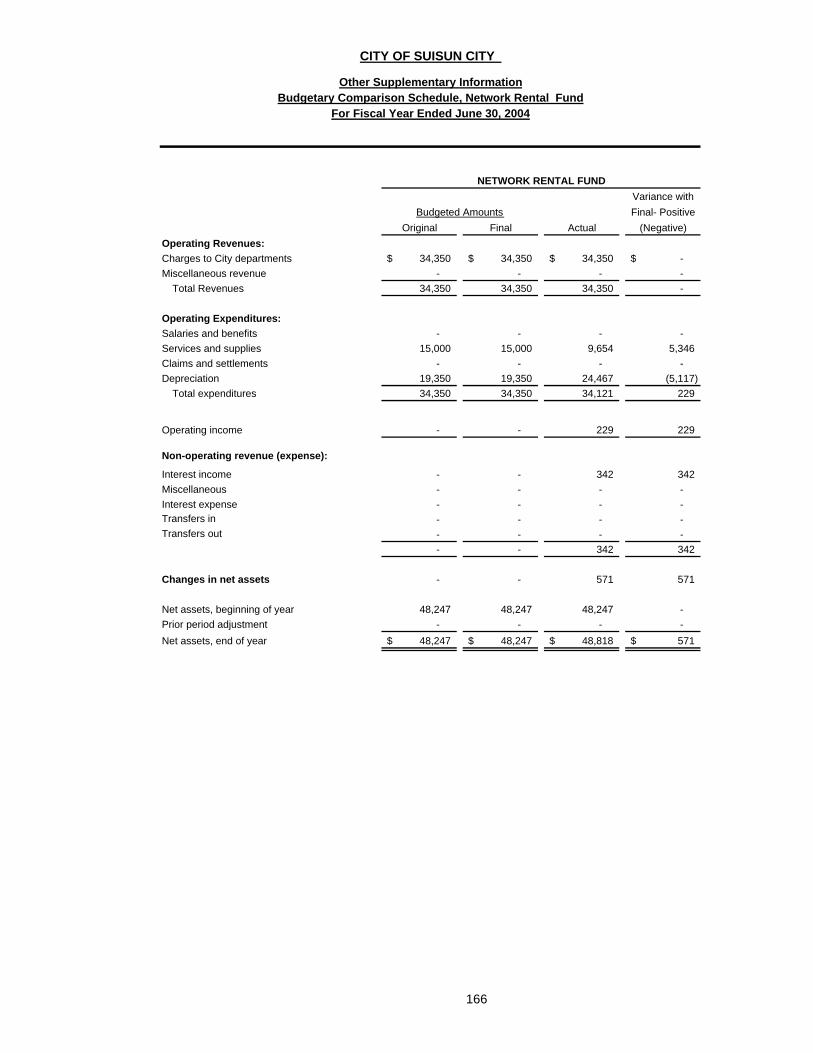
Variance withFinal- Positive
Original Final Actual (Negative)Operating Revenues:Charges to City departments 34,350$ 34,350$ 34,350$ -$ Miscellaneous revenue - - - -
Total Revenues 34,350 34,350 34,350 -
Operating Expenditures:Salaries and benefits - - - - Services and supplies 15,000 15,000 9,654 5,346 Claims and settlements - - - - Depreciation 19,350 19,350 24,467 (5,117)
Total expenditures 34,350 34,350 34,121 229
Operating income - - 229 229
Non-operating revenue (expense):
Interest income - - 342 342 Miscellaneous - - - - Interest expense - - - - Transfers in - - - - Transfers out - - - - - - 342 342
Changes in net assets - - 571 571
Net assets, beginning of year 48,247 48,247 48,247 - Prior period adjustment - - - - Net assets, end of year 48,247$ 48,247$ 48,818$ 571$
NETWORK RENTAL FUND
Budgeted Amounts
Other Supplementary Information
For Fiscal Year Ended June 30, 2004
CITY OF SUISUN CITY
Budgetary Comparison Schedule, Network Rental Fund
166
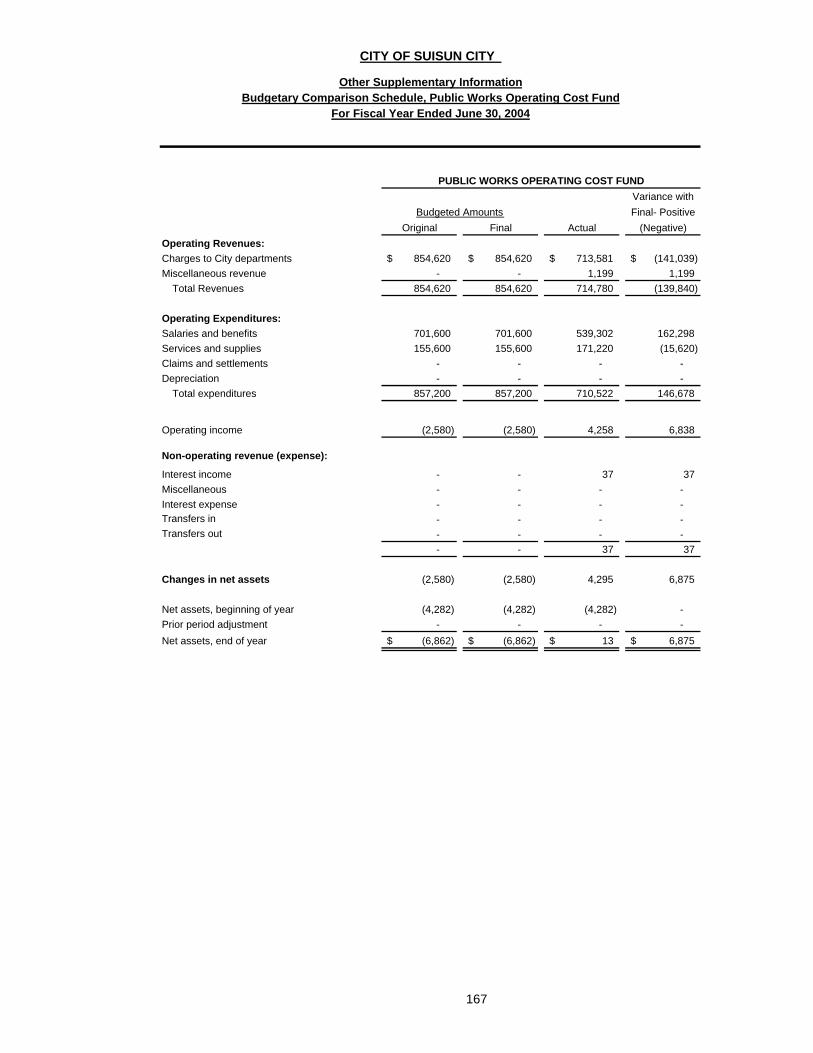
Variance withFinal- Positive
Original Final Actual (Negative)Operating Revenues:Charges to City departments 854,620$ 854,620$ 713,581$ (141,039)$ Miscellaneous revenue - - 1,199 1,199
Total Revenues 854,620 854,620 714,780 (139,840)
Operating Expenditures:Salaries and benefits 701,600 701,600 539,302 162,298 Services and supplies 155,600 155,600 171,220 (15,620) Claims and settlements - - - - Depreciation - - - -
Total expenditures 857,200 857,200 710,522 146,678
Operating income (2,580) (2,580) 4,258 6,838
Non-operating revenue (expense):
Interest income - - 37 37 Miscellaneous - - - - Interest expense - - - - Transfers in - - - - Transfers out - - - - - - 37 37
Changes in net assets (2,580) (2,580) 4,295 6,875
Net assets, beginning of year (4,282) (4,282) (4,282) - Prior period adjustment - - - - Net assets, end of year (6,862)$ (6,862)$ 13$ 6,875$
Budgetary Comparison Schedule, Public Works Operating Cost FundFor Fiscal Year Ended June 30, 2004
PUBLIC WORKS OPERATING COST FUND
Budgeted Amounts
CITY OF SUISUN CITY
Other Supplementary Information
167
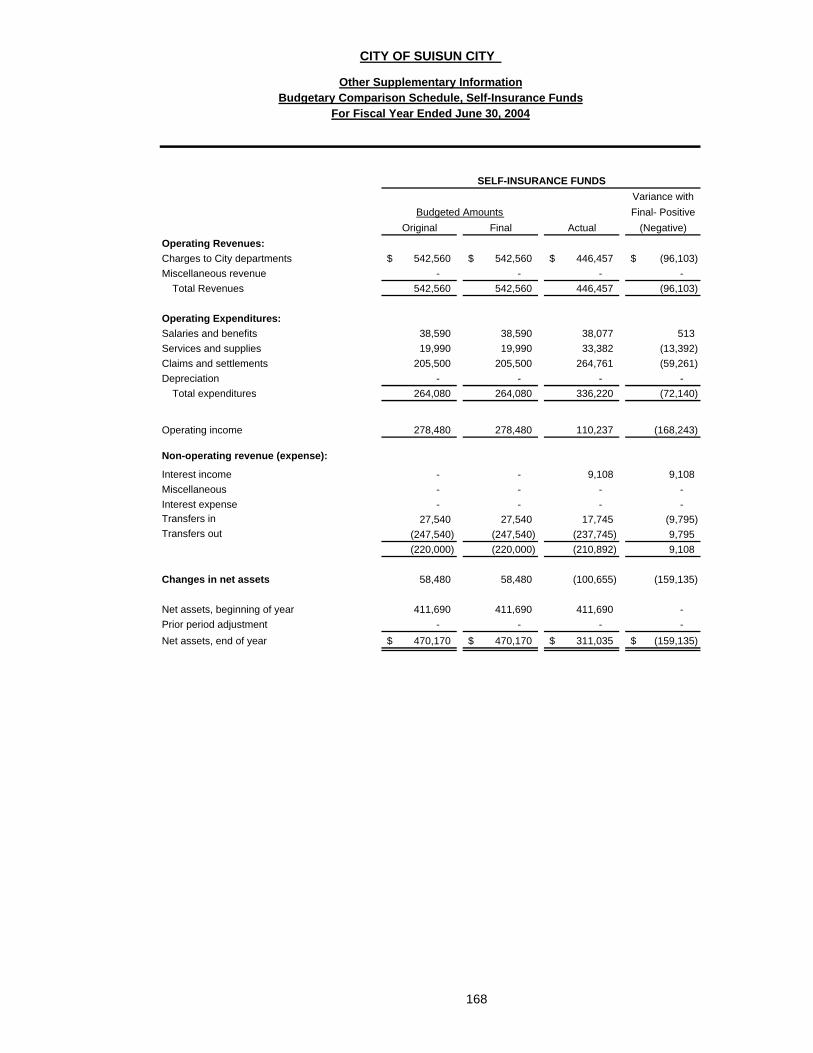
Variance withFinal- Positive
Original Final Actual (Negative)Operating Revenues:Charges to City departments 542,560$ 542,560$ 446,457$ (96,103)$ Miscellaneous revenue - - - -
Total Revenues 542,560 542,560 446,457 (96,103)
Operating Expenditures:Salaries and benefits 38,590 38,590 38,077 513 Services and supplies 19,990 19,990 33,382 (13,392) Claims and settlements 205,500 205,500 264,761 (59,261) Depreciation - - - -
Total expenditures 264,080 264,080 336,220 (72,140)
Operating income 278,480 278,480 110,237 (168,243)
Non-operating revenue (expense):
Interest income - - 9,108 9,108 Miscellaneous - - - - Interest expense - - - - Transfers in 27,540 27,540 17,745 (9,795) Transfers out (247,540) (247,540) (237,745) 9,795 (220,000) (220,000) (210,892) 9,108
Changes in net assets 58,480 58,480 (100,655) (159,135)
Net assets, beginning of year 411,690 411,690 411,690 - Prior period adjustment - - - - Net assets, end of year 470,170$ 470,170$ 311,035$ (159,135)$
Budgetary Comparison Schedule, Self-Insurance FundsFor Fiscal Year Ended June 30, 2004
SELF-INSURANCE FUNDS
Budgeted Amounts
CITY OF SUISUN CITY
Other Supplementary Information
168
A
I C i t y o f S u i s u n C i t y California
Statistical Section
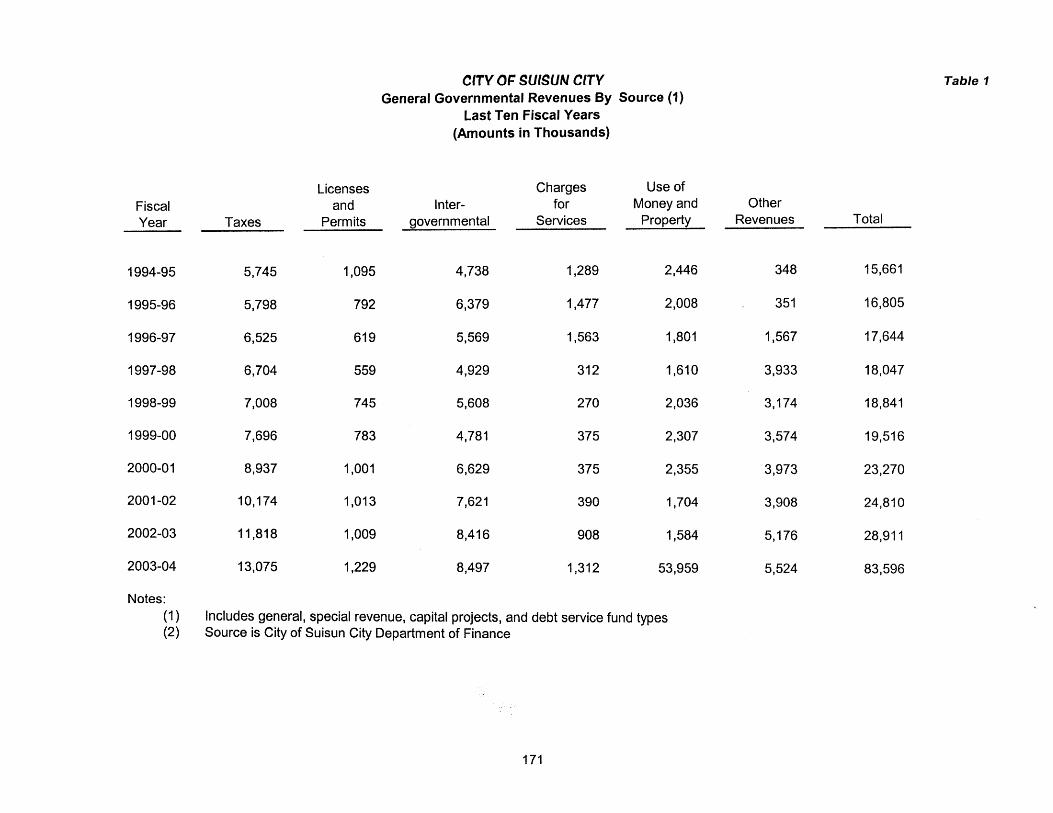
Fiscal
CfTV OF SUfSUN CITY General Governmental Revenues By Source (I)
Last Ten Fiscal Years (Amounts in Thousands)
Licenses Charges Use of and Inter- for Money and Other
Year Taxes Permits governmental Services Property Revenues Total
Table f
Notes: (1) Includes general, special revenue, capital projects, and debt service fund types (2) Source is City of Suisun City Department of Finance
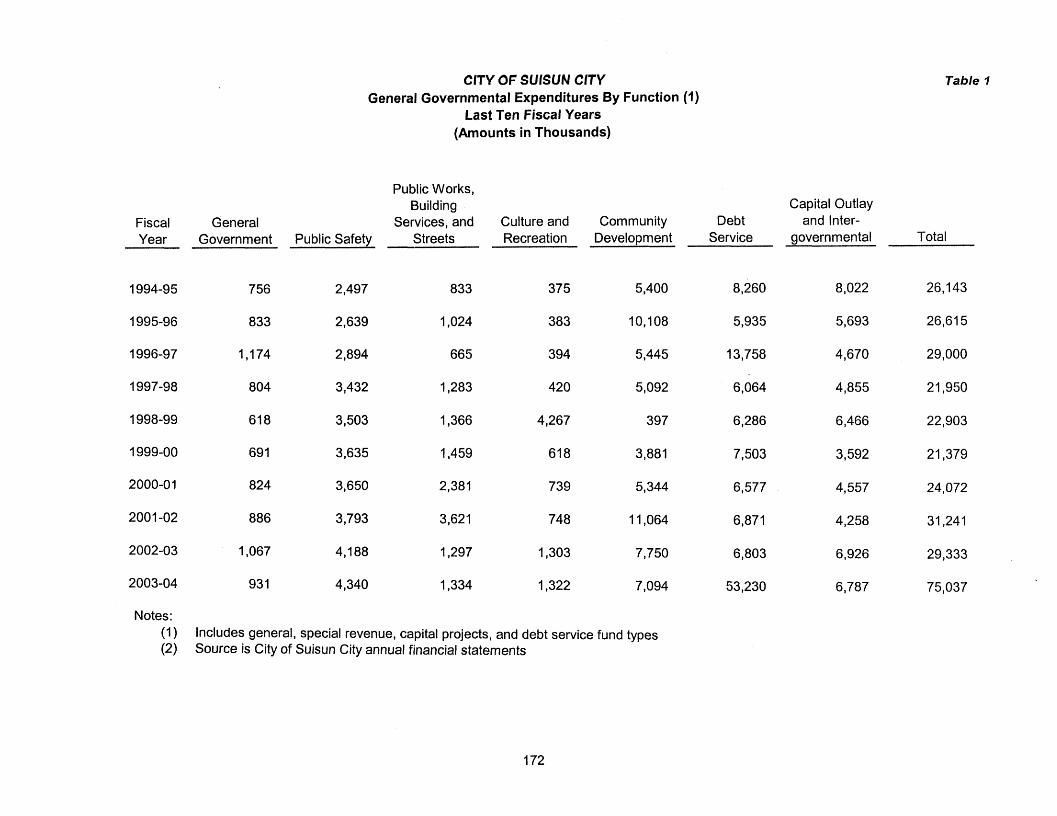
CITY OF SUISUN CITY General Governmental Expenditures By Function (1)
Last Ten Fiscal Years (Amounts in Thousands)
Table 1
Public Works, Building Capital Outlay
Fiscal General Services, and Culture and Community Debt and Inter- Year Government Public Safety Streets Recreation Development Service governmental Total
Notes: (1) Includes general, special revenue, capital projects, and debt service fund types (2) Source is City of Suisun City annual financial statements
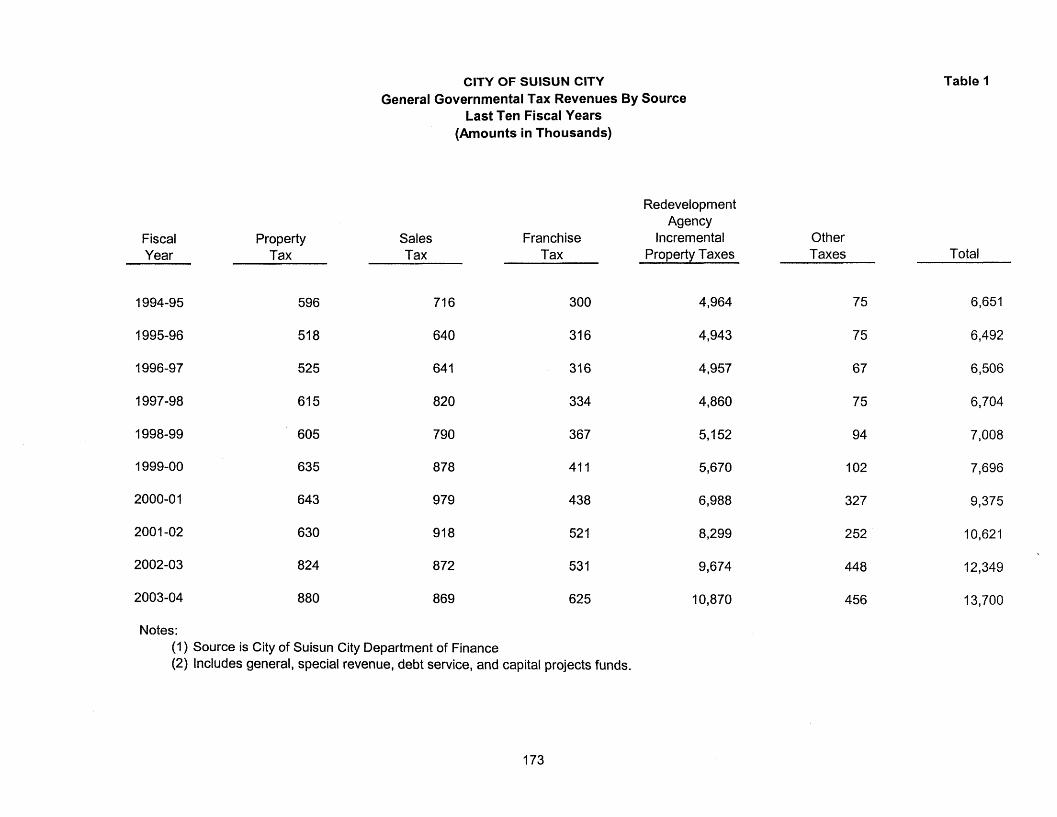
ClTY OF SUlSUN ClTY General Governmental Tax Revenues By Source
Last Ten Fiscal Years (Amounts in Thousands)
Redevelopment Agency
Fiscal Property Sales Franchise Incremental Year Tax Tax Tax Property Taxes
Other Taxes
Table I
Total
Notes: ( I ) Source is City of Suisun City Department of Finance (2) Includes general, special revenue, debt service, and capital projects funds.
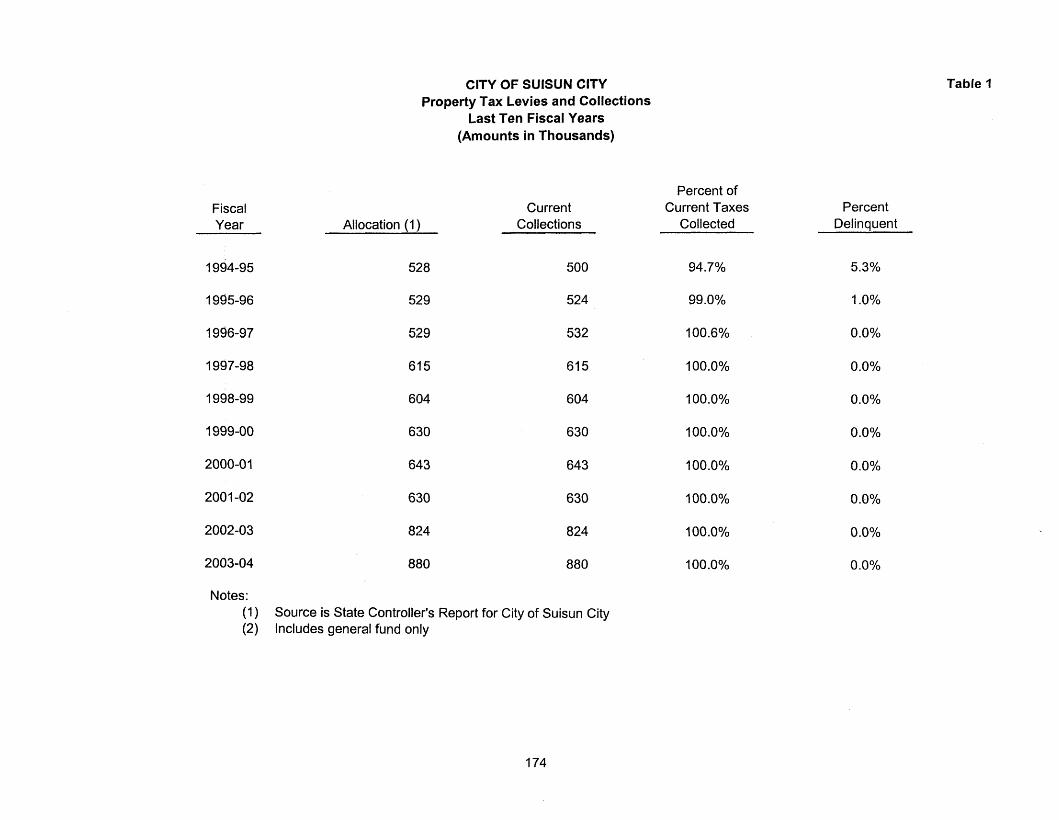
Fiscal Year
ClTY OF SUlSUN ClTY Property Tax Levies and Collections
Last Ten Fiscal Years (Amounts in Thousands)
Allocation (1 )
528
529
529
615
664
630
643
630
824
Current Collections
Percent of Current Taxes
Collected
Table 1
Percent Delinquent
Notes: (1) Source is State Controller's Report for City of Suisun City (2) Includes general fund only
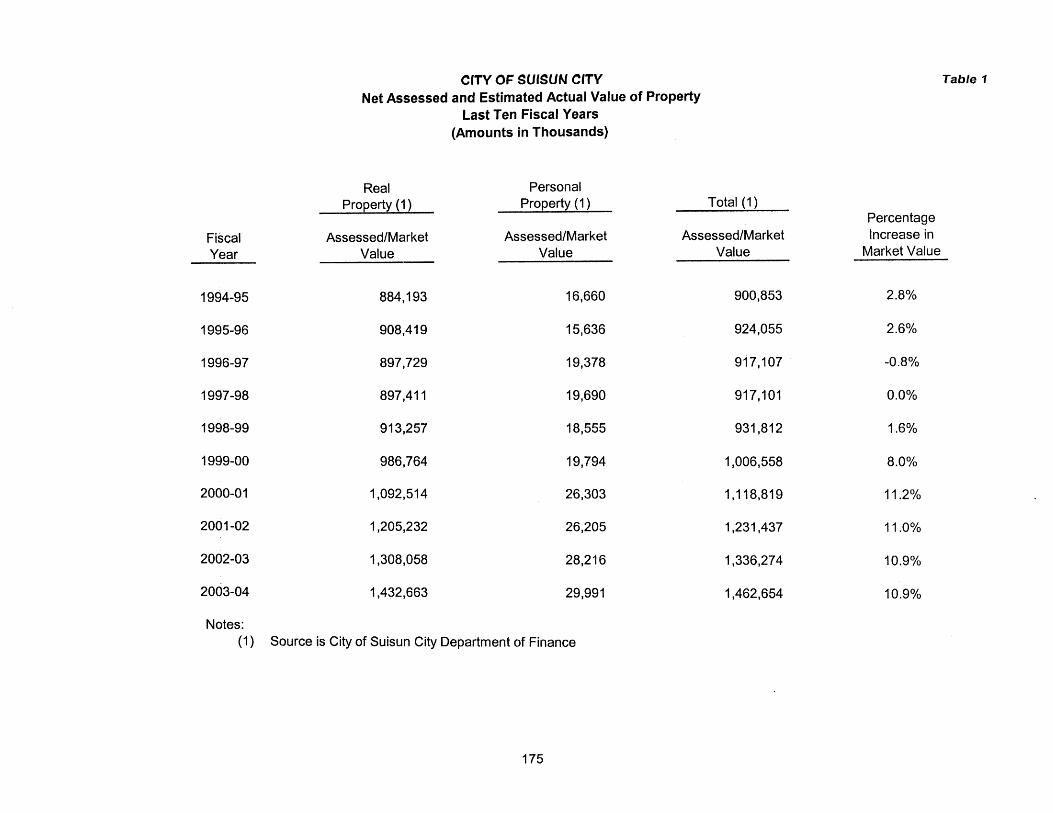
CITY OF SUISUN CITY Net Assessed and Estimated Actual Value of Property
Last Ten Fiscal Years (Amounts in Thousands)
Real Personal Property (1 ) Property (1 ) Total (1)
Fiscal AssessedlMarket AssessedlMarket AssessedlMarket Year Value Value Value
Table 1
Percentage Increase in
Market Value
Notes: (1) Source is City of Suisun City Department of Finance
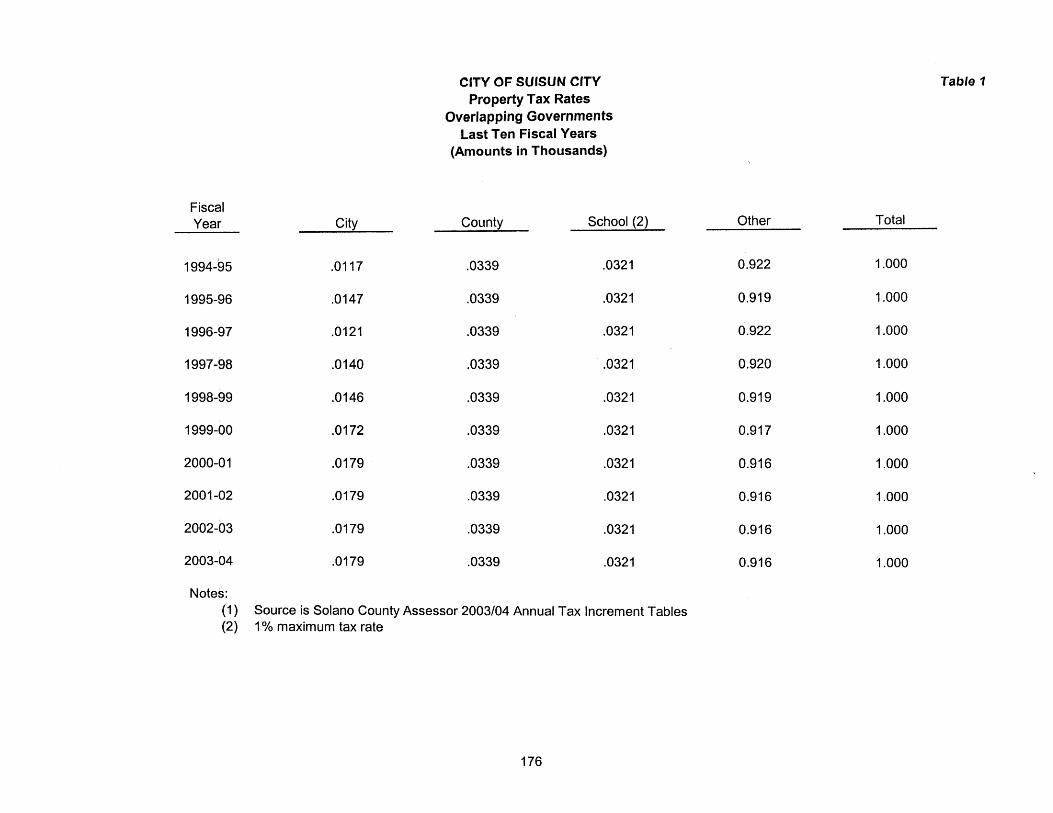
Fiscal Year Citv
1 994-95
1995-96
1996-97
1997-98
1998-99
1999-00
2000-0 1
2001 -02
2002-03
2003-04
Notes:
CITY OF SUISUN CITY Property Tax Rates
Overlapping Governments Last Ten Fiscal Years
(Amounts in Thousands)
County
,0339
.0339
,0339
.0339
.0339
,0339
.0339
.0339
.0339
.0339
School (2) Other
0.922
0.91 9
0.922
0.920
0.91 9
0.91 7
0.91 6
0.91 6
0.91 6
0.91 6
Table 7
Total
(1) Source is Solano County Assessor 2003104 Annual Tax Increment Tables (2) 1% maximum tax rate
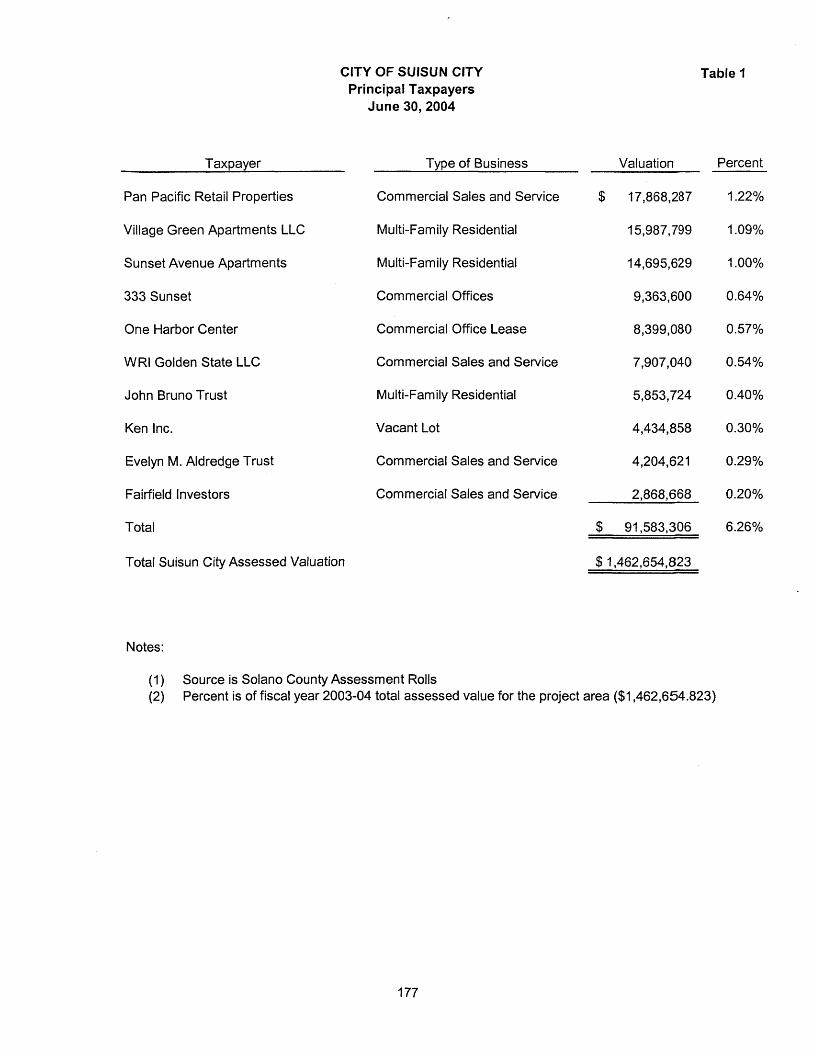
CITY OF SUISUN CITY Principal Taxpayers
Table 1
Taxpayer
Pan Pacific Retail Properties
Village Green Apartments LLC
Sunset Avenue Apartments
333 Sunset
One Harbor Center
WRI Golden State LLC
John Bruno Trust
Ken Inc.
Evelyn M. Aldredge Trust
Fairfield Investors
Total
Total Suisun City Assessed Valuation
Notes:
June 30,2004
T v ~ e of Business Valuation
Commercial Sales and Service
Multi-Family Residential
Multi-Family Residential
Commercial Offices
Commercial Office Lease
Commercial Sales and Service
Multi-Family Residential
Vacant Lot
Commercial Sales and Service
Commercial Sales and Service
Percent
( 1 Source is Solano County Assessment Rolls
(2) Percent is of fiscal year 2003-04 total assessed value for the project area ($1,462,654.823)
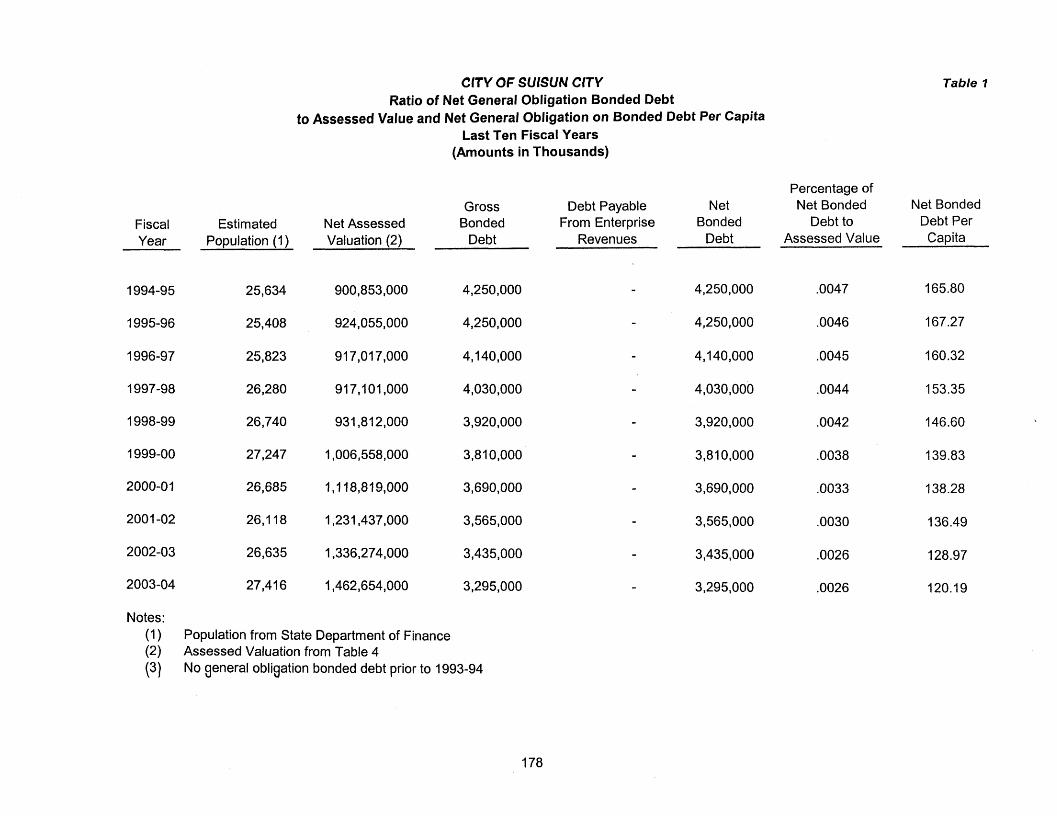
CITY OF SUISUN CITY Ratio of Net General Obligation Bonded Debt
to Assessed Value and Net General Obligation on Bonded Debt Per Capita Last Ten Fiscal Years
(Amounts in Thousands)
Gross Fiscal Estimated Net Assessed Bonded Year Population ( I ) Valuation (2) Debt
1994-95
1995-96
1996-97
1997-98
1998-99
1999-00
2000-0 I
2001 -02
2002-03
2003-04
Notes: (1) (2) (3)
Population from State Department of Finance Assessed Valuation from Table 4 No general obligation bonded debt prior to 1993-94
Debt Payable Net From Enterprise Bonded
Revenues Debt
4,250,000
4,250,000
4,140,000
4,030,000
3,920,000
3,810,000
3,690,000
- 3,565,000
3,435,000
3,295,000
Table ?
Percentage of Net Bonded Net Bonded
Debt to Debt Per Assessed Value Capita
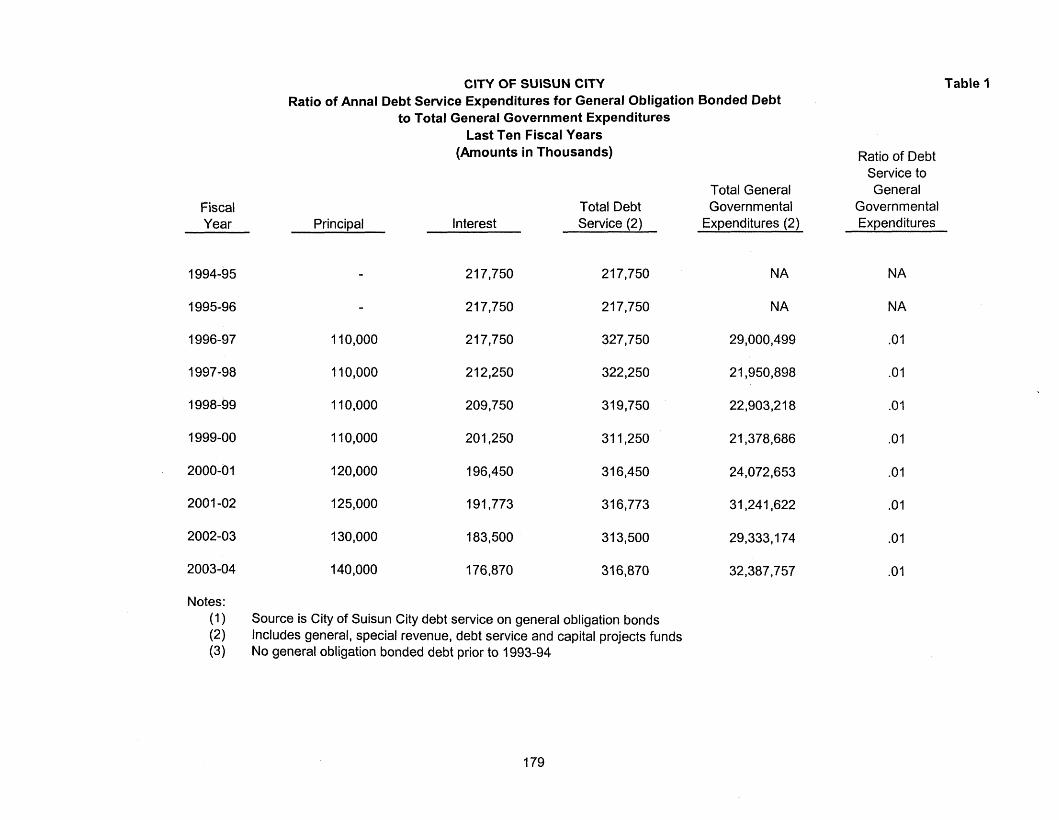
CITY OF SUISUN CITY Ratio of Annal Debt Service Expenditures for General Obligation Bonded Debt
Fiscal Year Principal
1994-95
1 995-96
1996-97
1997-98
1998-99
1999-00
2000-0 1
200 I -02
2002-03
2003-04
Notes: (1) (2) (3)
to Total General Government Expenditures Last Ten Fiscal Years
(Amounts in Thousands)
Interest Total Debt Service (2)
Source is City of Suisun City debt service on general obligation bonds Includes general, special revenue, debt service and capital projects funds No general obligation bonded debt prior to 1993-94
Total General Governmental
Expenditures (2)
Table 1
Ratio of Debt Service to General
Governmental Expenditures
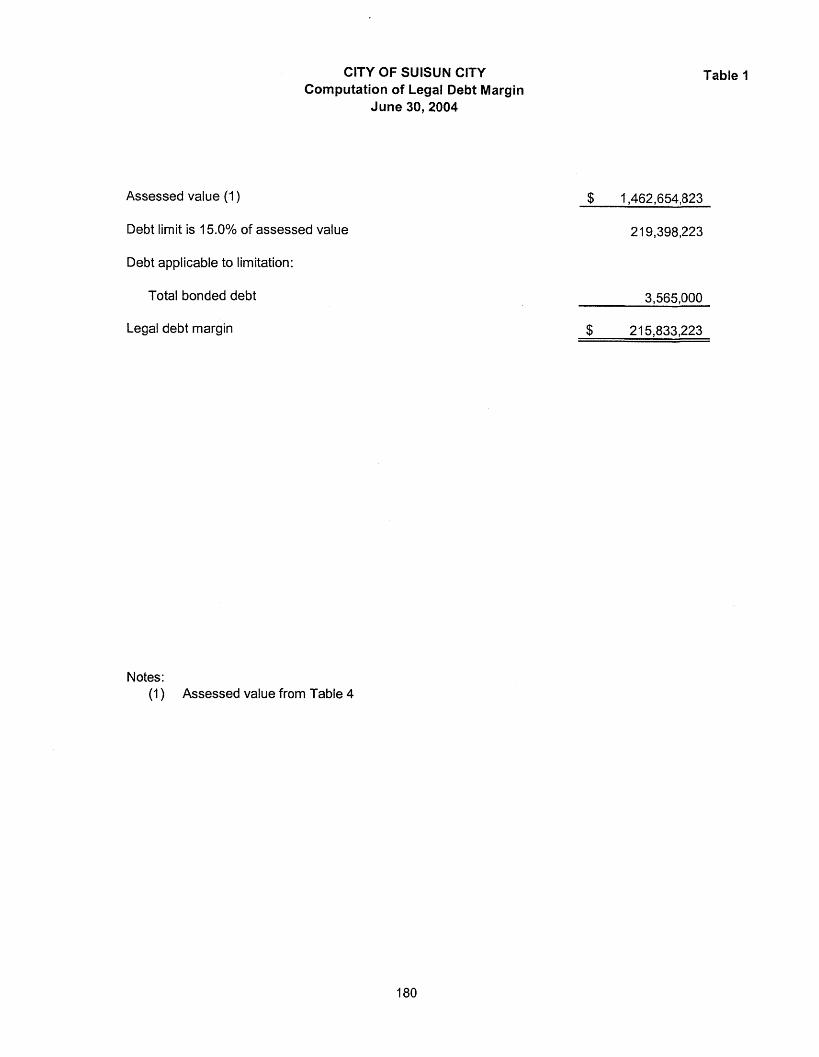
CITY OF SUlSUN CITY Computation of Legal Debt Margin
June 30,2004
Assessed value (I )
Debt limit is 15.0% of assessed value
Debt applicable to limitation:
Total bonded debt
Legal debt margin
Table 1
Notes: (1 ) Assessed value from Table 4
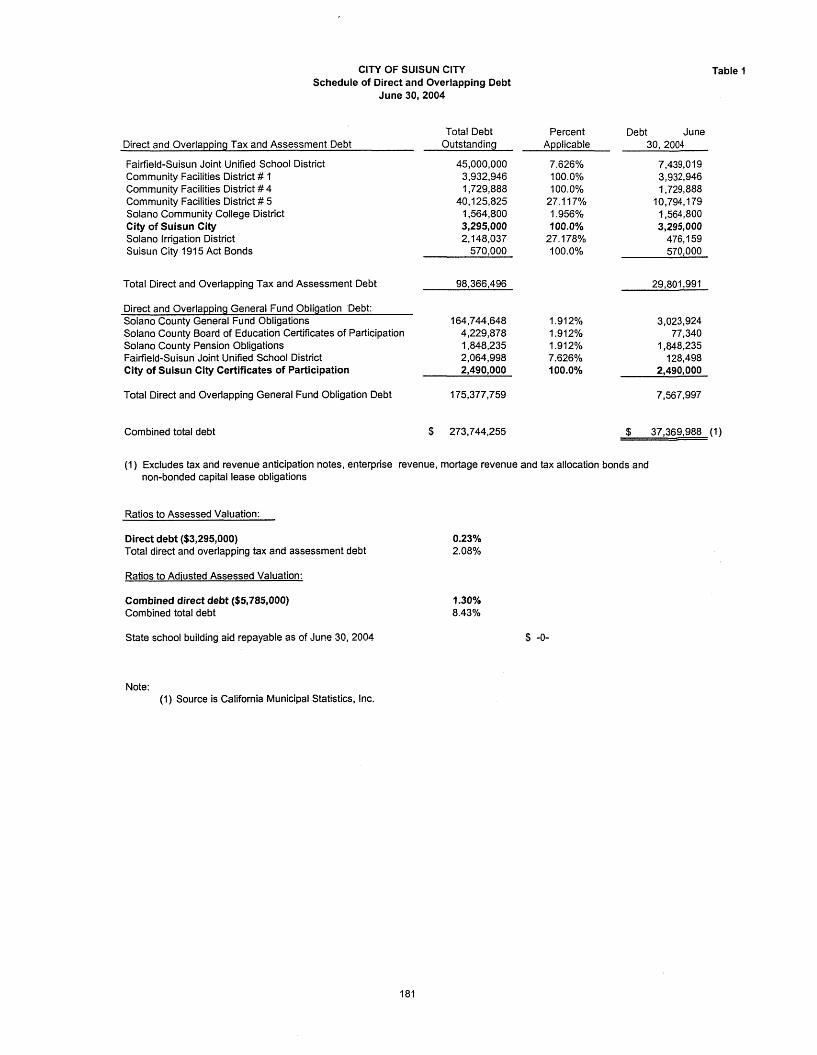
CITY OF SUlSUN CITY Schedule of Direct and Overlapping Debt
June 30,2004
Direct and Overlapping Tax and Assessment Debt
Fairfield-Suisun Joint Unified School District Community Facilities District # I Community Facilities District # 4 Community Facilities District # 5 Solano Community College District City of Suisun City Solano Irrigation District Suisun City 191 5 Act Bonds
Total Debt Outstanding
45,000,000 3,932,946 1,729,888
40,125,825 1,564,800 3,295,000 2,148,037
570,000
Percent Applicable
7.626% 100.0% 100.0%
27.1 17% 1.956% 100.0%
27.178% 100.0%
Table 1
Debt June 30,2004
Total Direct and Overlapping Tax and Assessment Debt 98,366,496 29,801,991
Direct and Overlapping General Fund Obligation Debt: Solano County General Fund Obligations 164,744,648 1.91 2% 3,023,924 Solano county Board of ducati ion Certificates of Participation 4,229,878 1.912% 77,340 Solano County Pension Obligations 1,848,235 1 .912% 1,848,235 Fairfield-Suisun Joint Unified School District 2,064,998 7.626% 128,498 City of Suisun City Certificates of Participation 2,490,000 100.0% 2,490,000
Total Direct and Overlapping General Fund Obligation Debt 175,377,759 7,567,997
Combined total debt
(1) Excludes tax and revenue anticipation notes, enterprise revenue, mortage revenue and tax allocation bonds and non-bonded capital lease obligations
Ratios to Assessed Valuation:
Direct debt ($3,295,000) Total direct and overlapping tax and assessment debt
Ratios to Adiusted Assessed Valuation:
Combined direct debt ($5,785,000) Combined total debt
Stzte schoc! building aid repayable as nf June 30, 2004
Note: ( I ) Source is California Municipal Statistics, Inc.
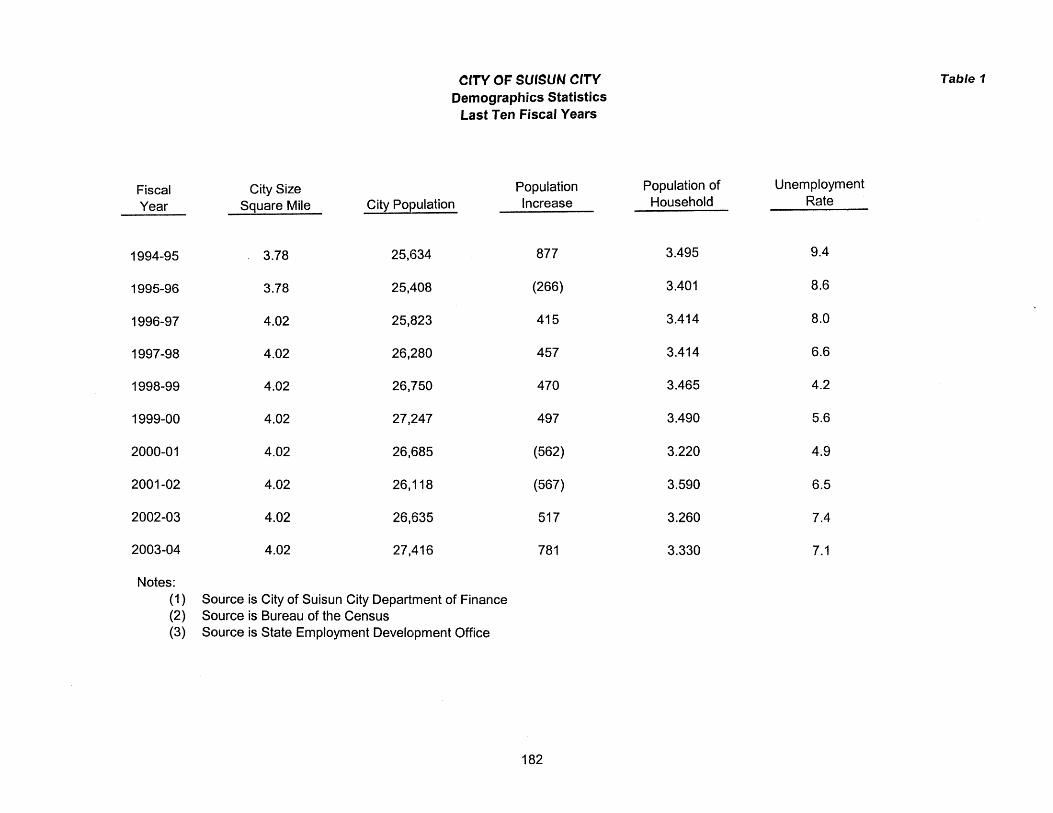
Fiscal Year
1994-95
1995-96
1996-97
1997-98
1998-99
1 999-00
2000-0 1
200 1 -02
2002-03
2003-04
Notes: (1) (2) (3)
City Size Square Mile
, 3.78
3.78
4.02
4.02
4.02
4.02
4.02
4.02
4.02
4.02
City Population
25,634
25,408
25,823
26,280
26,750
27,247
26,685
26,l I 8
26,635
27,416
CITY OF SUISUN CITY Demographics Statistics
Last Ten Fiscal Years
Population Increase
Source is City of Suisun City Department of Finance Source is Bureau of the Census Source is State Employment Development Office
Population of Household
3.495
3.40 1
3.414
3.414
3.465
3.490
3.220
3.590
3.260
3.330
Table 7
Unemployment Rate
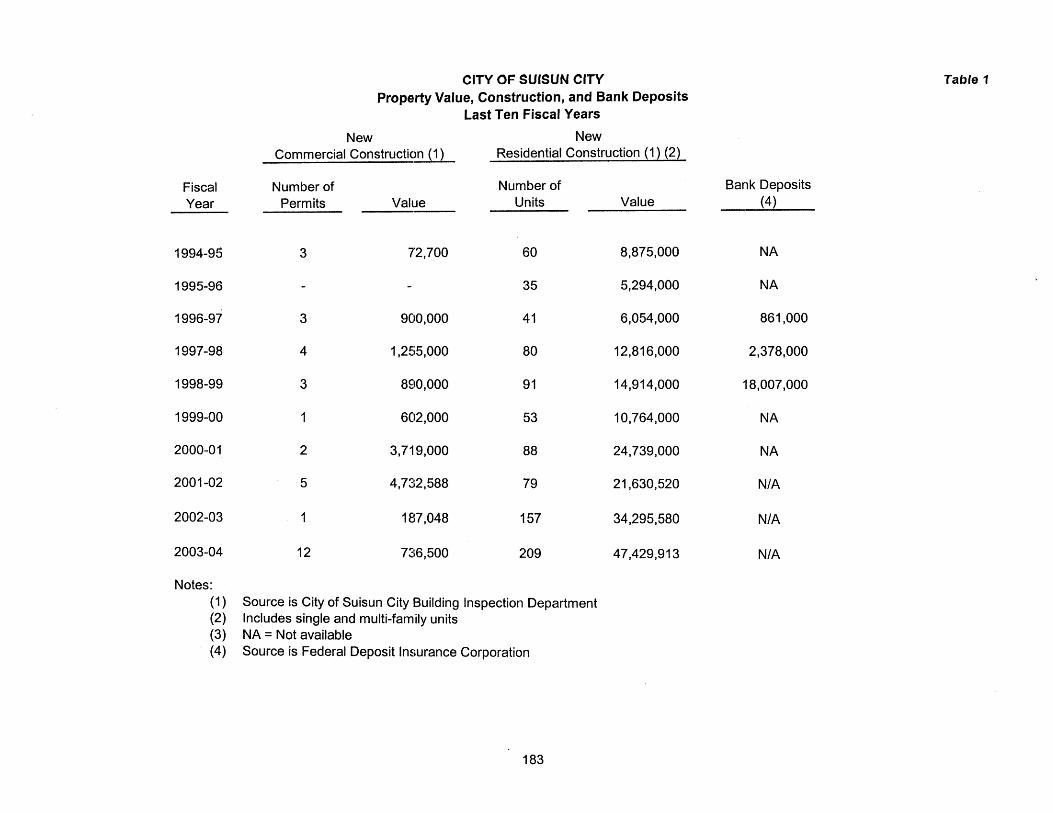
Fiscal Year
1994-95
1995-96
1996-97
1997-98
1998-99
1999-00
2000-01
200 1 -02
2002-03
2003-04
Notes: (1) (2) (3) (4)
CITY OF SUlSUN CITY Property Value, Construction, and Bank Deposits
Last Ten Fiscal Years
New Commercial Construction ( I )
Number of Permits Value
New Residential Construction (1 ) (2)
Number of Units Value
60 8,875,000
35 5,294,000
41 6,054,000
80 12,816,000
91 14,914,000
53 10,764,000
88 24,739,000
79 21,630,520
157 34,295,580
209 47,429,913
Source is City of Suisun City Building Inspection Department Includes single and multi-family units NA = Not available Source is Federal Deposit Insurance Corporation
Table 7
Bank Deposits (4)
NA
NA
861,000
2,378,000
l88,O7,OOO
NA
NA
NIA
NIA
NIA
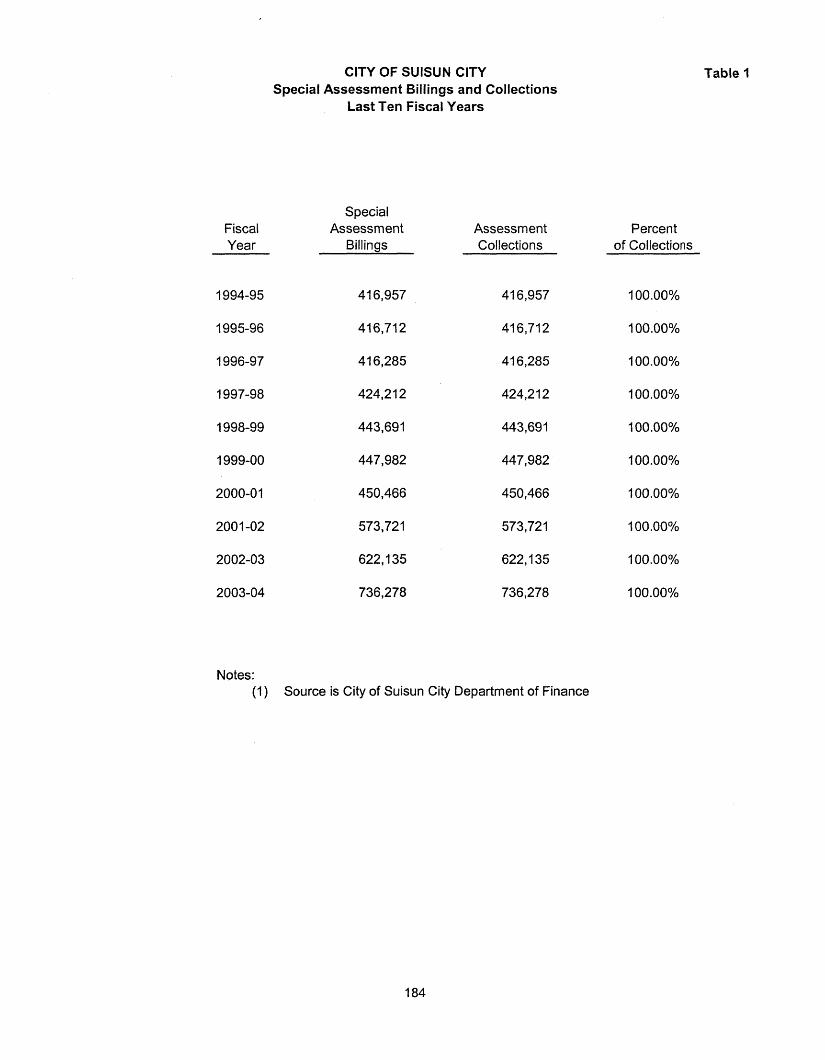
Fiscal Year
1994-95
1995-96
1996-97
1997-98
1998-99
1999-00
2000-0 1
2001 -02
2002-03
2003-04
Notes:
CITY OF SUlSUN CITY Special Assessment Billings and Collections
Last Ten Fiscal Years
Special Assessment
Billings Assessment Collections
Source is Citv of Suisun Citv De~artment of Finance
Table I
Percent of Collections
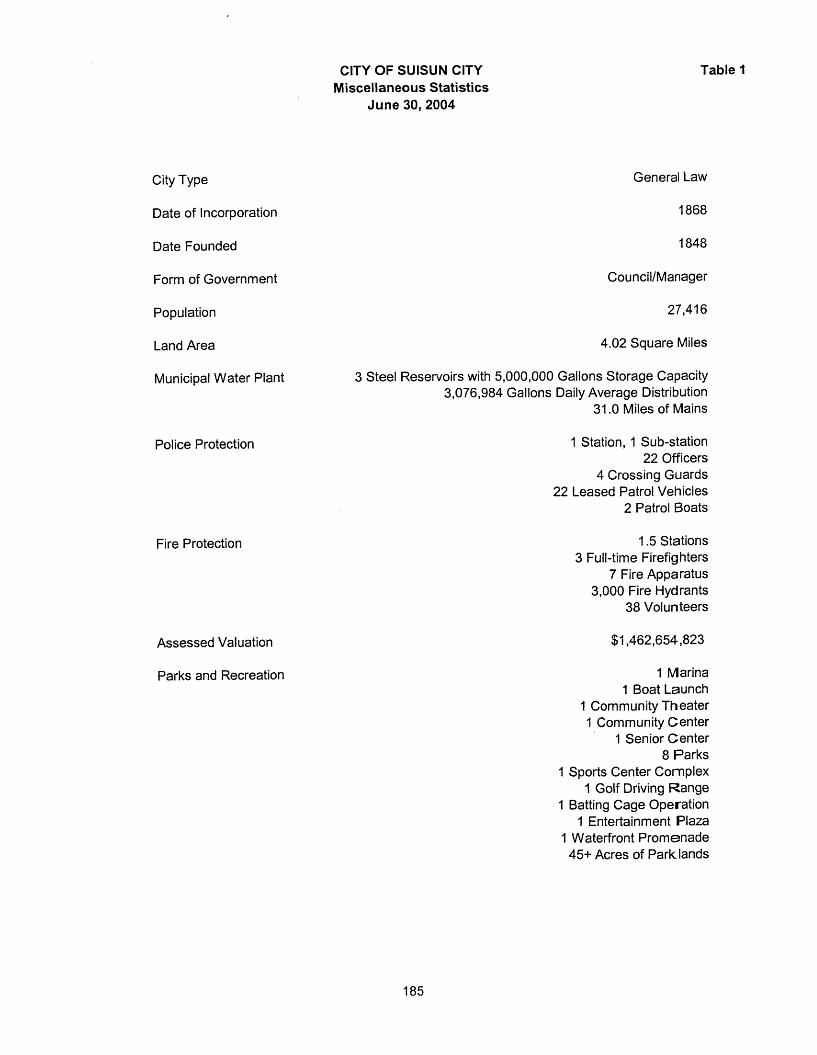
City Type
Date of Incorporation
Date Founded
Form of Government
Population
Land Area
Municipal Water Plant
Police Protection
Fire Protection
Assessed vaiuation
Parks and Recreation
CITY OF SUISUN CITY Miscellaneous Statistics
June 30,2004
Table 1
General Law
4.02 Square Miles
3 Steel Reservoirs with 5,000,000 Gallons Storage Capacity 3,076,984 Gallons Daily Average Distribution
31.0 ~ j l e s of Mains
I Station, 1 Sub-station 22 Officers
4 Crossing Guards 22 Leased Patrol Vehicles
2 Patrol Boats
1.5 Stations 3 Full-time Firefighters
7 Fire Apparatus 3,000 Fire Hydrants
38 Volunteers
1 Marina 1 Boat Launch
I Community Theater I Community Center
1 Senior Center 8 Parks
1 Sports Center Complex 1 Golf Driving Range
1 Batting Cage Operation 1 Entertainment Plaza
I Waterfront Promenade 45+ Acres of Park lands