caesars entertainment (ranalli)
DESCRIPTION
My short thesis on Caesars Entertainment (Sept. 2012).TRANSCRIPT
1
Caesars Entertainment (CZR – NYSE) - An LBO Gone Terribly Wrong!
Closing Price: $7.22 (September 7th 2012) Target Price - $2 Author: Michael Ranalli Potential Shorting Upside: 72% Market Capitalization: $905 million Cash: 985 million Long Term Debt: $22.7 billion Enterprise Value: $22.74 billion
Introduction:
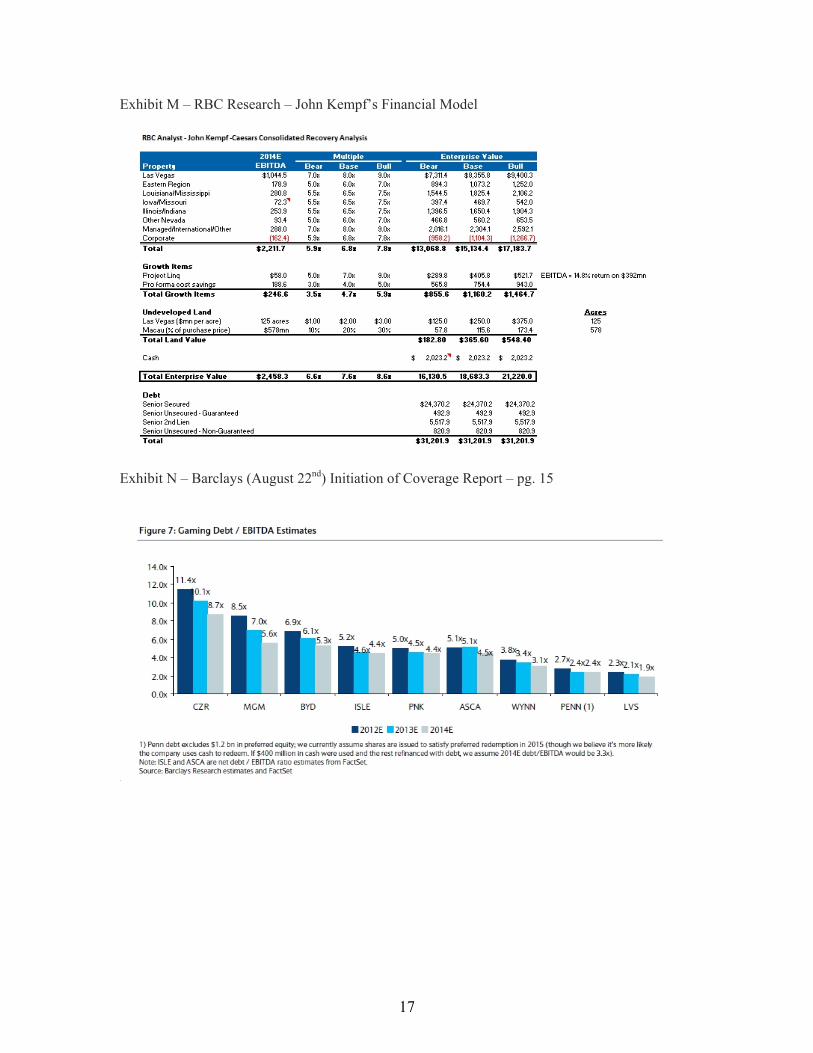
Would you buy equity in a business that has an annual cash interest expense of $1.6 billion and $22.7 billion in debt (face value), has experienced an 18% top line revenue decline and adjusted EBITDA decline of 30.6% from FY 2007 to FY 2011? Would you buy equity in a business that is capital intensive, has more profitable and better capitalized competitors in its most important region (Las Vegas), has plenty of regional competitors with less leveraged balance sheets, and has zero gaming exposure to the rapidly growing Asian gaming markets (Macau and Singapore)? Would you buy equity in a business that derives most of its revenue from discretionary consumers spending, that trades at a premium to its peers (EV/EBITDA) (see exhibit N), and that has a balance sheet acutely sensitive to the debt markets (covenants restrictions and $7.9 billion in debt maturities due in FY 2015)?
Short Thesis:
1) The center of the gaming universe shifted to the eastern hemisphere, to Macau, in early 2000’s. In 2011, Macau’s gaming revenues were $33.5 billion vs. $6.1 billion on the Las Vegas Strip. Private equity firms TPG and Apollo, high on hubris and intoxicated by rear view mirror growth rates, paid a dopey 11.2X 2007 EBITDA. Not only did they lack the foresight to recognize these were peak earnings; they should have been investing in Macau not United States gaming.
2) Caesars’ balance sheet is broken, restricting its financial maneuvering room, with $1.6 billion in annual cash interest expense. This cash interest expense is a blended average cost of debt of 7.03% (as of 6/30/12). On August 20th, CZR’s 6.5% 6/1/2016 Senior Unsecured notes (cusip: 413627AX8) were yielding north of 25%.
3) Caesars’ operating performance is deteriorating, highlighted by its August 5th Q2 2012 results, generating EBITDA of $477 million, well short of consensus EBITDA of $530 million. Consensus EBTIDA estimates for second half 2012 and FY 2013 look vulnerable.
Short Catalyst:
A restructuring is inevitable, resulting in the lowest piece of the capital structure, the equity, either being wiped out entirely, or in a more benign scenario diluted with a secondary offering or perhaps unsecured bond holders will agree to convert their holdings into equity (the terms will be favorable to bond holders). In the three scenarios listed, the equity with be worth far less than September 7th, 2012’s closing price of $7.22.
Risks to Shorting:
1) Full, U.S. federal approval of online poker. CZR owns the Worlds Series of Poker brand, has the most well established domestic Total Reward Program with 40 million members (4.8 million active members), and operates online poker overseas. If online poker were federally approved, this would give Caesars the perception of first mover advantage and would materially impact its EBITDA growth profile.
At present, this is a low probability event. There are two statutes that regulate online gaming- the Federal Wire Act of 1961 and the Unlawful Internet Gambling Enforcement Act of 2006. Besides the poor political optics and significant political horse trading that would need to take place to get
2
this approved at the Federal level; it isn’t in the states best interest to cannibalize physical gaming. Existing physical gaming creates tax revenues directly through gaming revenues, and indirectly through income taxes, hotel taxes, and retail and restaurant taxes. Also, during the initial construction, there are many jobs created, and approval of online gaming would jeopardize this multiplier effect. In terms of politics, Republican Presidential candidate, Mitt Romney has said he is against online gaming and two attempts to introduce a bill in congress have gone nowhere (2010 & 2012). President Obama hasn’t comment on the legislation. 2) A robust and sustainable recovery in gaming revenues in Las Vegas, Atlantic City, and other regional operating jurisdictions within CZR’s property footprint. 3) Short term volatility is fully expected, as TPG and Apollo will try desperately to maintain their investment and reputational capital. A manufactured short squeeze is possible, although as of August 15th, only 4 million shares out of 125 million are short, which at face value is 3.2%. However, the freely traded float, at present, is only 36 million shares. If this artificial squeeze were to occur, this would be an opportunity to short more!
LBO History:
Private equity firms, Apollo and TPG, announced the acquisition of Harrah’s Entertainment in an all cash deal for $90 per share in October 2006. After receiving regulatory approvals, the transaction closed in January 2008. The total purchase price was $30.1 billion including $12.4 billion in debt, $1.2 billion in transaction costs, and was completed at an 11.2X multiple on Harrah’s 2007 EBITDA. Post closing, and after some financial engineering, Caesars Entertainment (then still called Harrah’s), had $23.8 billion in debt.
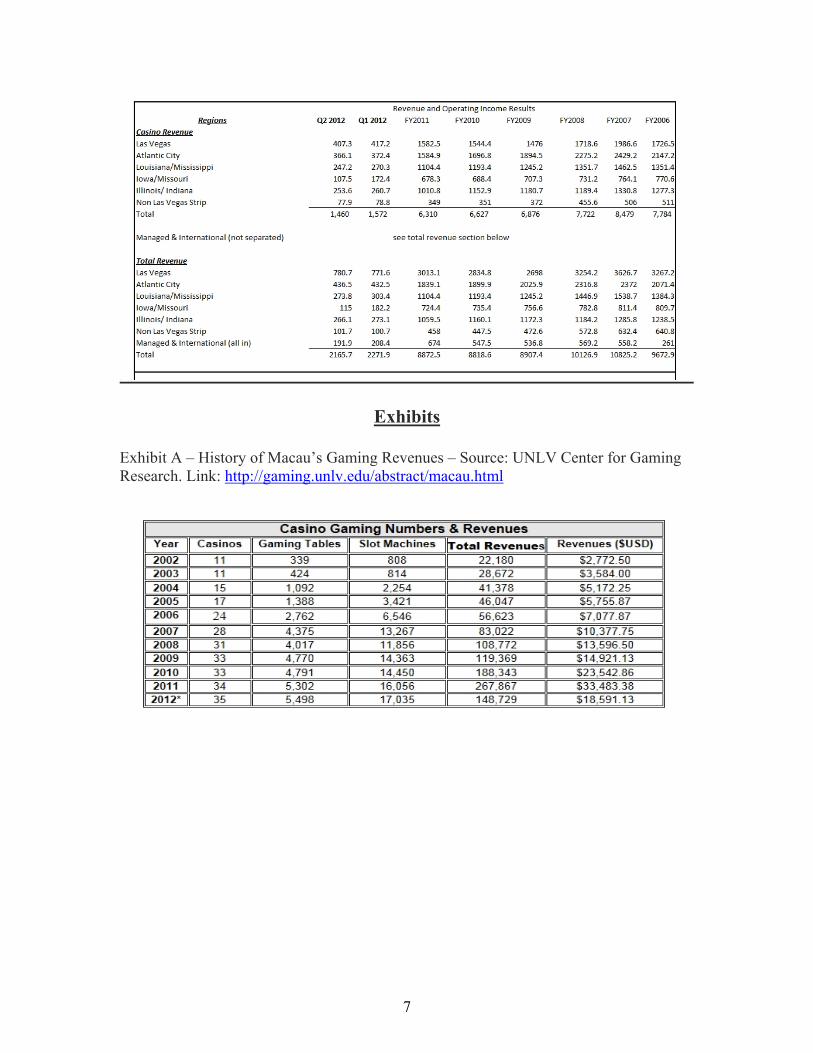
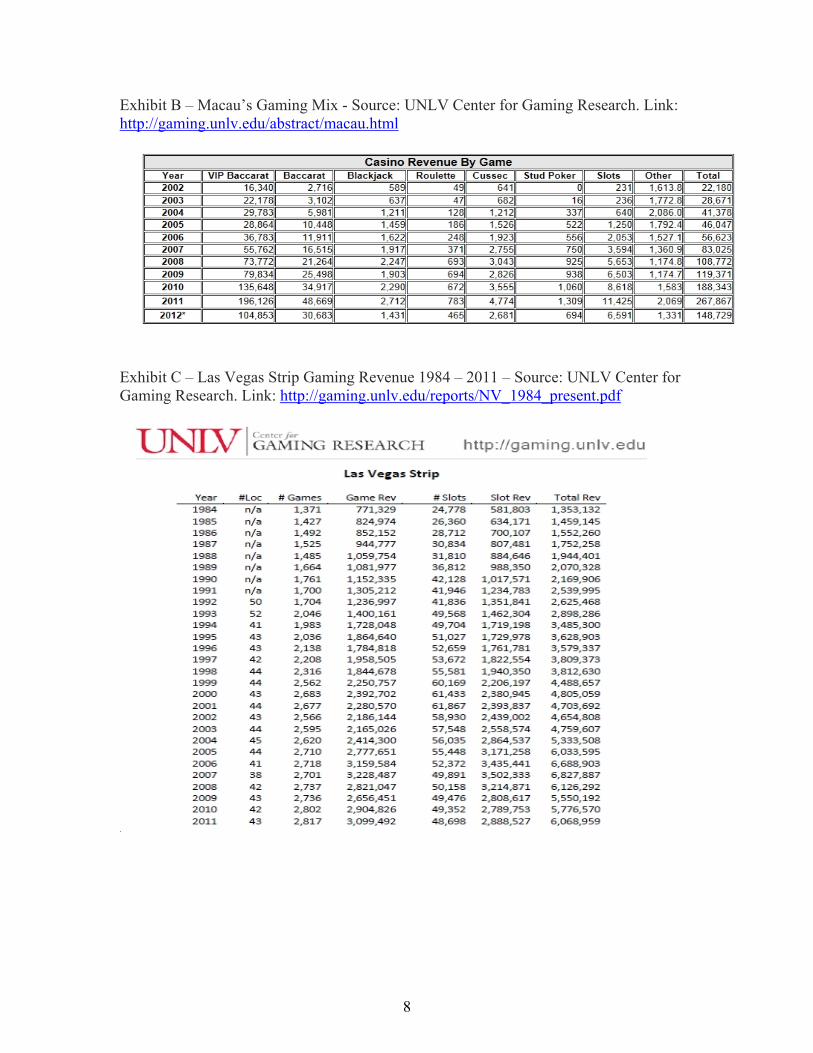
Weak Domestic Gaming Fundamentals: Part A Gaming Today, with 35 casinos, up from 11 in 2002, the center of the gaming universe has shifted to Macau. In 2006, Macau’s gaming revenues passed the Las Vegas Strip (LVS), and haven’t looked back. As of last year, Macau’s gaming revenues were 5.5 times larger than the LVS ($33.5 billion vs. $6.1 billion) (see exhibit A). Perhaps, more impressive is Macau’s growth trajectory, with revenue of $2.2 billion in 2002. In terms of Macau’s gaming mix, VIP Baccarat and Baccarat accounting for an astonishing 73.2% and 18.2%, respectively, of all gaming revenue (see exhibit B).
Examining Las Vegas Strip gaming revenues data from as far back as 1984, its growth was very impressive, with on brief pauses in growth, until its high water mark of $6.8 billion in 2007 (see exhibit C). Since then, LVS gaming revenues hit a trough during the 2009 recession, falling to $5.6 billion and have since rebounded to $6.1 billion last year.
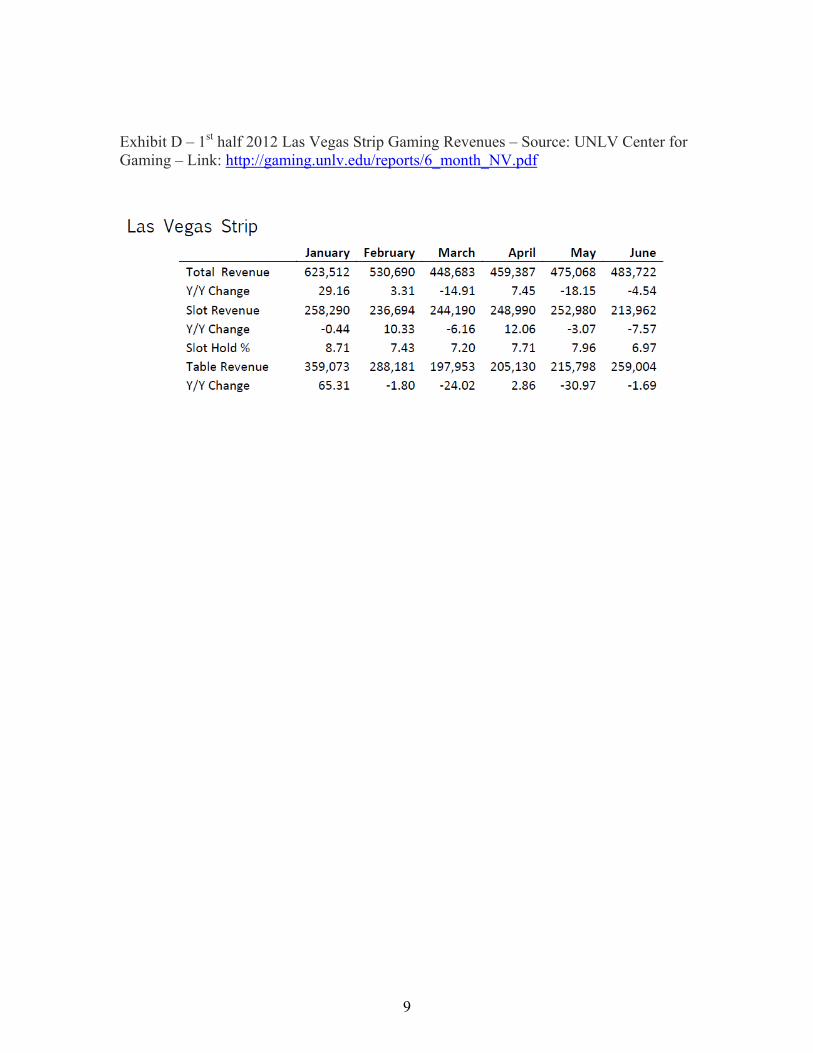
Although revenues have improved since the recession, first half 2012 Las Vegas gaming revenues are relatively flat at $3.02 billion (see exhibit D). Moreover, and perhaps, even more disconcerting for Las Vegas optimists is the fact revenues are very weak despite the completion of new and exciting projects, including the opening of MGM’s $9.2 billion City Center on December 16th 2009 (Aria), as well as the posh Cosmopolitan Hotel and Casino (opened December 2010). The numbers speak for themselves. Macau is siphoning demand from Las Vegas, and at the margin, regional United States gaming competition is hurting Las Vegas. In a weak U.S. labor market, with unemployment north of 8% for 43 months, and airfares expensive, constrained disposable income has created demand destruction for U.S. gaming.
Hotel Rooms
Hotel rooms, food and beverage revenues, account for 46% of revenue mix vs. 38.2% on the Las Vegas Strip (in 2011). Outside of Las Vegas, these revenues make up a much smaller percentage
3
of the revenue mix. Unfortunately, for all market participants, there is hotel room overcapacity, and an imbalance of supply and demand. This is clearly captured by the declining average daily rates (ADR). According to HVS’s Las Vegas Casino and Hotel Market Outlook 2012 report, ADRs in 2007 were $132.09 with an occupancy rate of 90.4%. More recent data measured (January – November 2011) indicates an ADR of $105.39 with a corresponding occupancy of 84.8%. Please note, during FY 2009 & 2010; ADRs were less than $96 with occupancy rates below 82%.
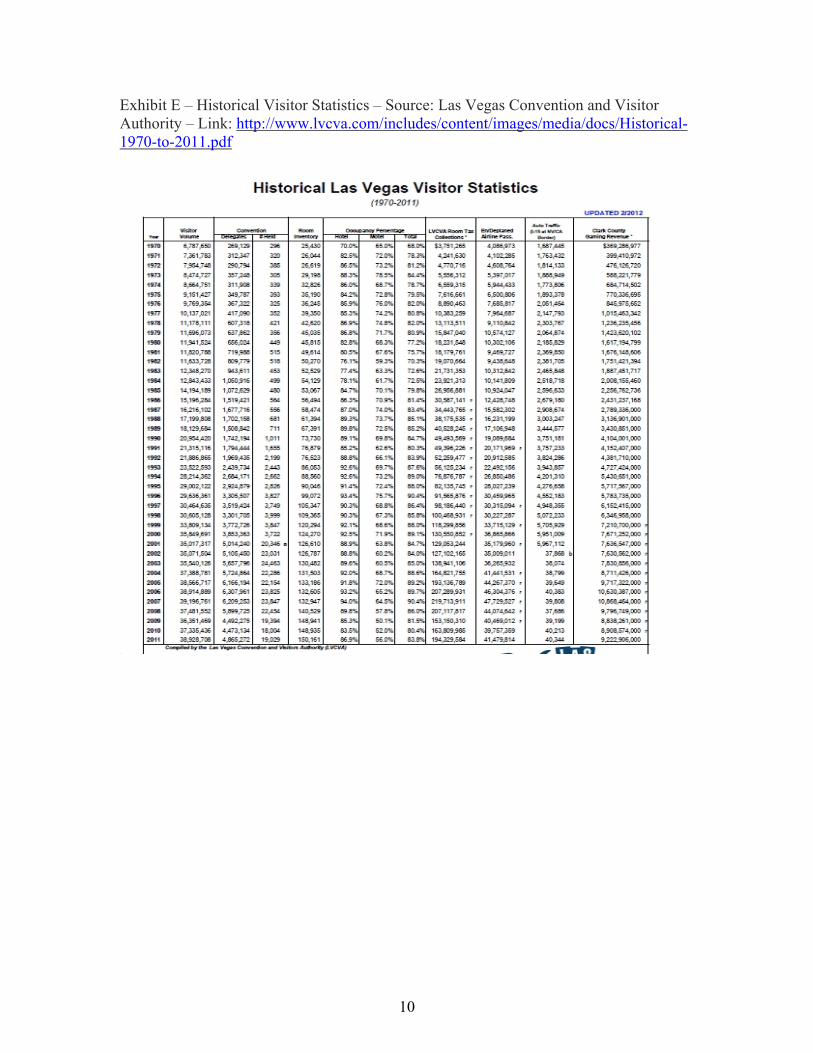
In theory, savvy market participants closely monitor market signals for inflection points, this discipline never occurred in Las Vegas. The decision to launch a new hotel and casino is made a few years before it comes online, as such, once construction commences, it is hard to moth ball a project(half built casinos have diminished value). In 2012, there are 150,161 (see Exhibit E) hotel rooms available in Las Vegas, up from 133,000 in 2007. An additional 2,000 more rooms are waiting in the wings and scheduled to come online in 2013. Had there not been bankruptcies, like the Foutainbleau, there would be more of a supply overhang. The specific problem for Caesars Entertainment is that with the exception of its crown jewel property, Caesars Palace, its other properties are low to mid tier and can’t compete with the likes of MGM’s (Aria, Bellagio, and Mandalay Bay). Nor can it compete with Las Vegas Sands’ (Venetian or Palazzo), as well as Wynn’s Wynn Las Vegas or Encore. These competitors are all competing for the only growing table game, baccarat, as well as convention business. Moreover, with the gaming revenues stagnate and too many hotel rooms, operators are forced to discount them to maintain occupancy levels, notwithstanding special events and holidays.
Drivers of Demand: Annual Visitors and Convention Attendance
Careful analysis of annual visitor trends and convention attendance help explain the weak Las Vegas fundamentals. After 35 years of robust visitor growth, the 2007 high water mark of 39.2 million visitors (see Exhibit E) has yet to be surpassed, with 38.9 million visiting Las Vegas in 2011. More alarming, is that conference attendance of 4.85 million in 2011, is 23% lower than in 2006 when Las Vegas welcomed 6.3 million conference attendees. Conference visitors are very accretive to casinos, filling rooms during the lower occupancy mid week time periods, as well as generating incremental revenues.
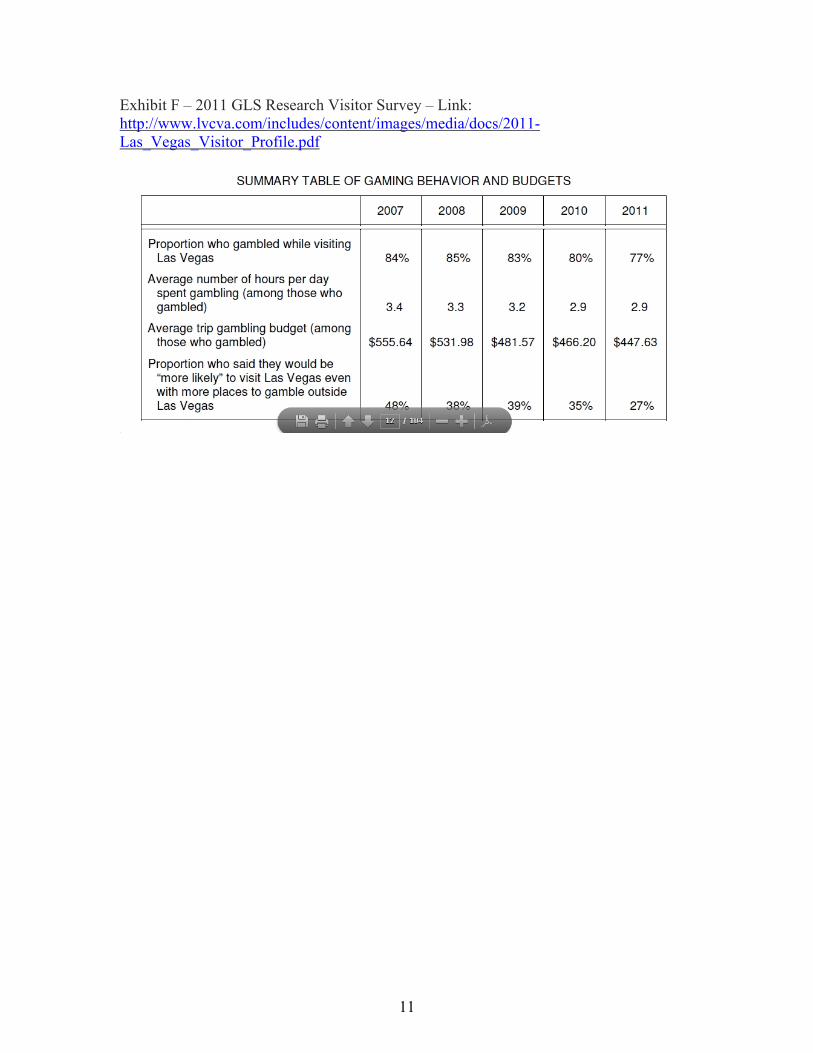
According to GLS research’s 2011 Annual Visitor profile, there are some less favorable visitor behavior shifts and spending trends well underway. Since 2007, there has been a steady decline in percentage of visitors in Las Vegas to gamble (84% to 77%). The response to this statement might be the proverbial canary in the coal mine: The portion of people “more likely” to visit Las Vegas to gamble with the increase of gaming in more jurisdictions declined sharply from 48% to 27% from 2007 to 2011 (see Exhibit F)!
Caesars’ Other Important Regional Markets
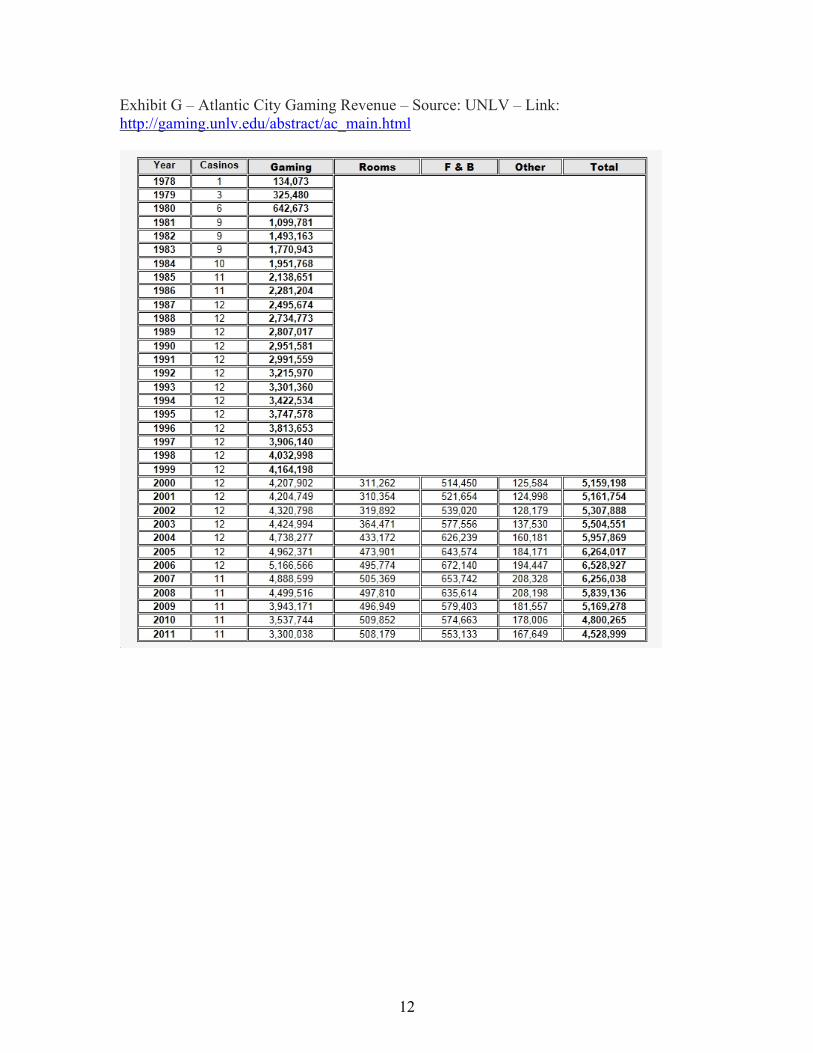
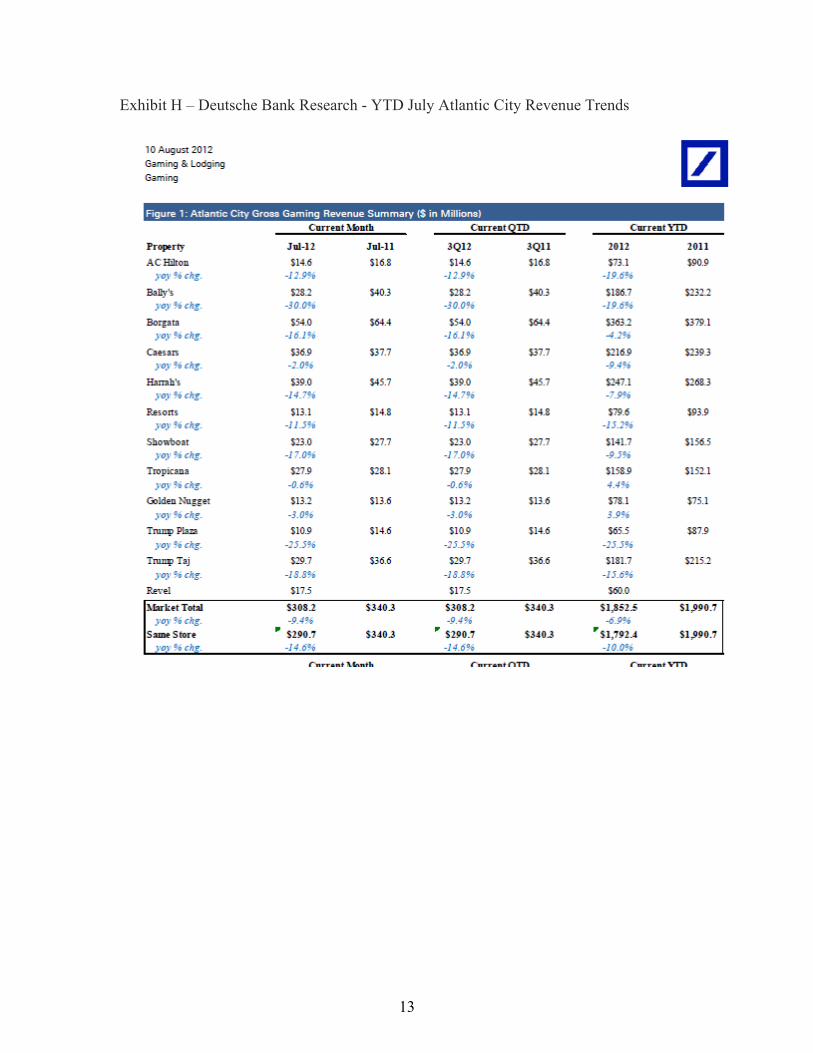
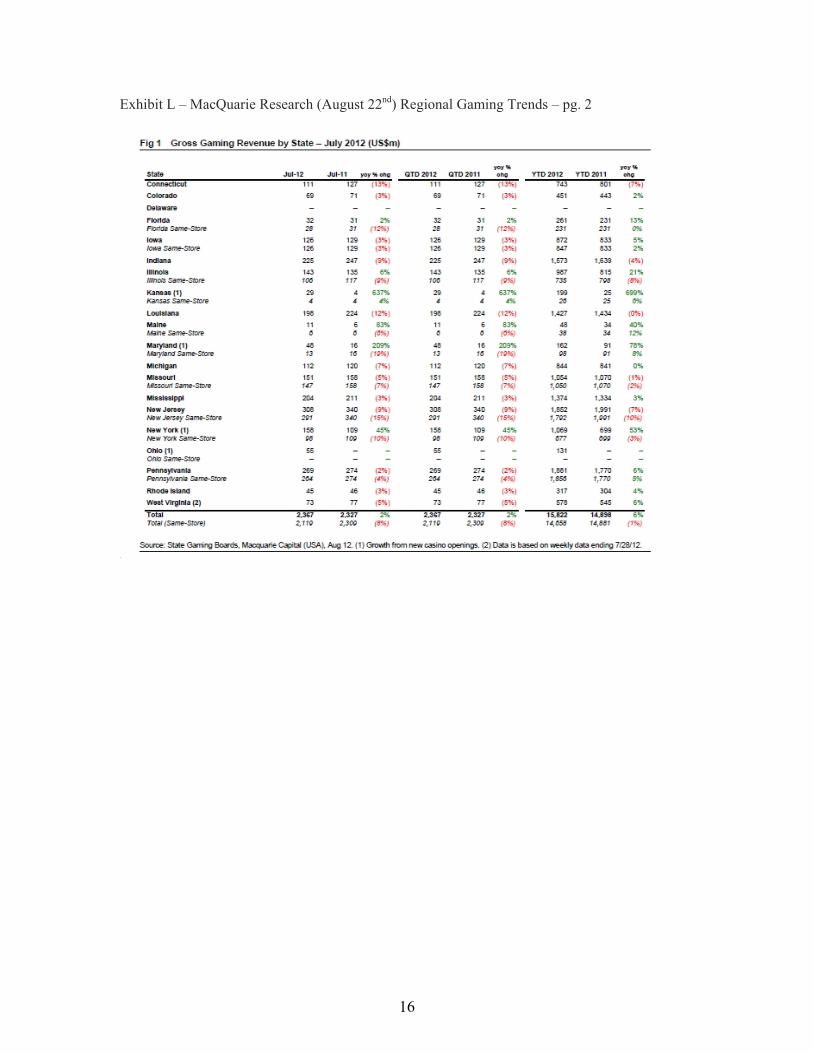
Caesars’ second largest revenue region, Atlantic City, has experienced a steep decline in gaming revenues. In 2006, there were twelve casinos in Atlantic City that generated total net gaming revenue of $5.2 billion, fast forward to 2011, and gaming revenues were $3.3 billion (see exhibit G). Worst yet, the Revel Casino, a competitor to CZR opened in 2012. The weakness in Atlantic City persists through July 2012, with YTD 2012 same store sales down a whopping 10% (see exhibit H). The broad regional picture in 2012 is weak too, with same store regional sales down 1% YTD July (see exhibit L).
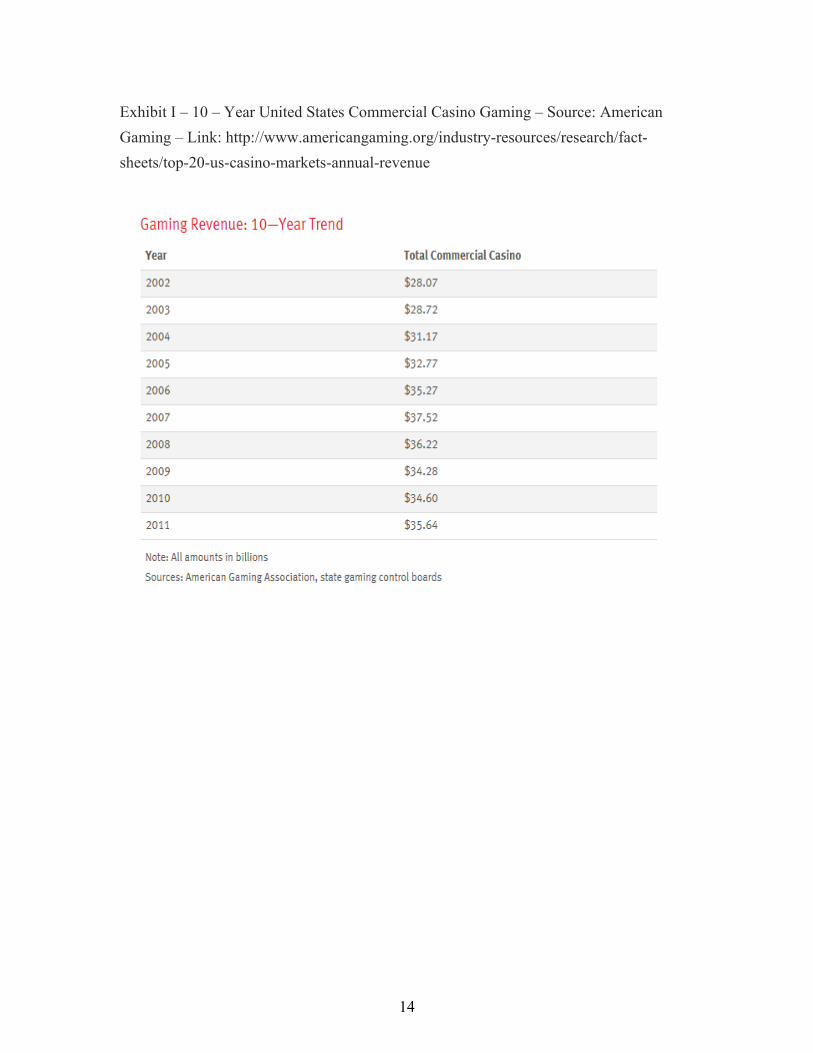
Looking at a ten year view of gaming revenues, paints the same picture, gaming revenues are stagnate since the peak of 2007 (see exhibit I), despite more new casinos openings. Some states with challenged revenue streams are more receptive to licensing gaming to generate tax revenues to close fiscal budget gaps. This translates into additional capacity and lower normalized margins,
4
as attractive EBITDA results attracts competitors and eventually new casino units in the pursuit of market share. States and casino profits are related, but not necessarily aligned, as building new casinos creates construction jobs and incremental revenue. In other words, in most jurisdictions, there is limited incentive for licensing bodies to limit the supply of gaming licenses, as this would choke off incremental revenues.
Another nuance, often missed (or at least not emphasized) by Wall Street is that depreciation and amortization is real, albeit lumpy. In the short term, the value of a new casino doesn’t depreciate in a straight line accounting fashion, but over time, as new competitors launch new ventures, the economic value of an older property can decline rapidly. This decline can only be arrested by consistently investing in maintenance capital expenditures (capex). Having visited virtually all of the casinos on the Las Vegas strip (then open during my visit in May 2009), it was easy to spot the legacy units that had been starved of maintenance capex. In others words, simply put, longer term profitability of a casinos is the discounted net present value of all future free cash flows measured against the cost of construction, financing, debt service, and all maintenance capex. The fancy EBITDA perceived by Wall Street analysts and casinos management executives are not nearly as good as advertised measured over the life of a cycle where overall gaming spend is stagnate!
Suspect Balance Sheet and Deteriorating Operating Performance: Parts B & C
Caesars’ broken balance sheet was made possible by the foolishness of debt investors willing to finance $23.8 billion in debt. Caesars’ management team rode a lucky streak with debt investors on two occasions. The first time was during 2007 and 2008 when they tapped the highly receptive bond markets, and the second occasion, was in 2009 & 2010, when they opportunistically took advantage of the Federal Reserve’s unprecedented policies, a bond market panic, and dazed creditors agreed to extend, pretend, and rollover most of its then near term debt maturities until 2015.
I spent five year working on the bond trading desk of an investment grade fixed income group that managed $50 billion in fixed income investments, so I had a front row seat to the panic in the bond markets in late 2008 and in the first half of 2009. To provide a vivid example of how much fear existed, two of the bluest of blue chips, IBM and Pepsico had to pay over 8% to issue 10 year paper (with favorable call protection features for investors). So, during the panic, market participants had little faith that a highly leveraged domestic casino operator, Caesars Entertainment, would be able to make its debt payments. Therefore, near dated CZR bond issues traded as if bankruptcy was imminent.
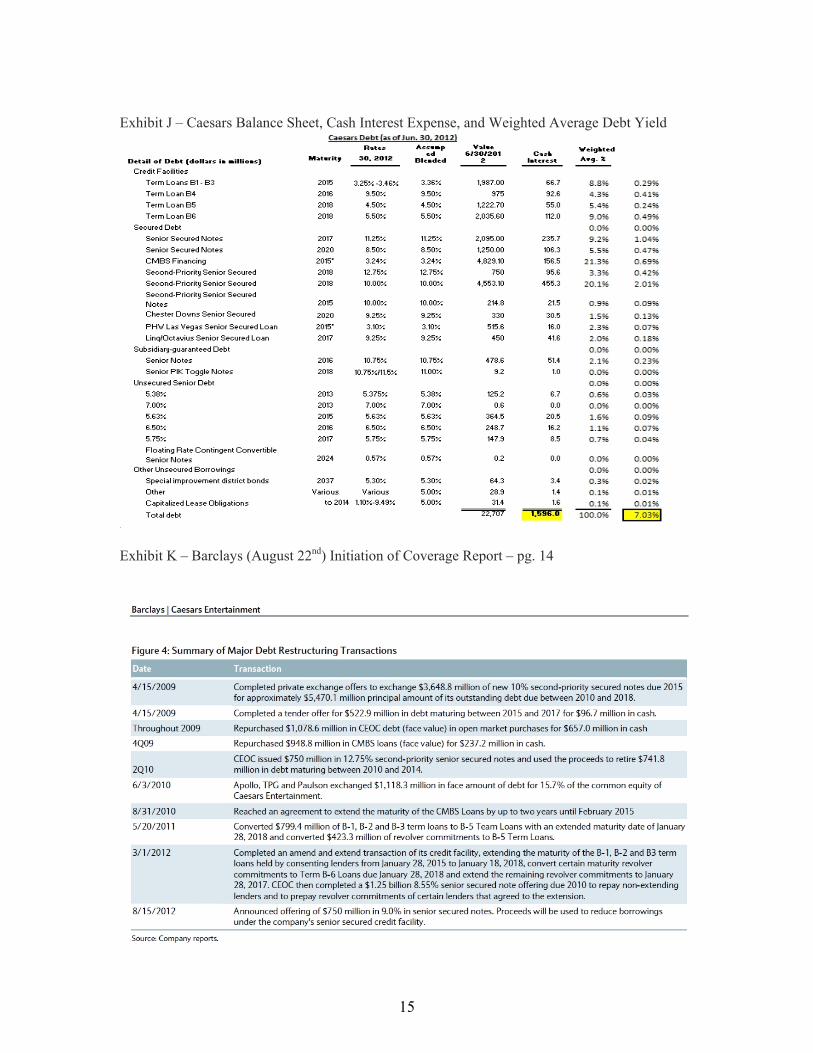
From April 2009 to 2011, TPG and Apollo, cleverly, restructured its near term debt maturities. Equally as important, they extinguished a sizable amount of face value debt. By my calculation, and not inclusive of the saved cash interest expenses, Caesars bought back their own debt on the open market, tendered their own debt, and convinced John Paulson to convert $1.138 billion in face value debt to equity. In the process, Caesars Entertainment extinguished at least $4.5 billion in debt (see Exhibit K). However, this was only made possible by a complete market meltdown and ensuing panic, which forced the Federal Reserve to embark on unprecedented actions: more than $1.5 trillion in balance sheet expansion, quantitative easing/ 25 bps fed funds rate, suspension of market to market accounting, all deliberately designed with a laser focus on unfreezing the credit markets. Those confluences of events will not be repeated and debt investors will demand far better terms than they did in 2009 and 2010, leaving the equity vulnerable to dilution or devaluation.
As of June 30, 2012, Caesars’ annual cash interest expense was $1.598 billion, and corresponds to a blended weighted average yield of approximately 7.03% (see exhibit J). Caesars
5
Entertainment, the parent company, has an organizational structure where all of the company’s debt is held in the operating subsidiaries. Caesars Entertainment owns the four subsidiaries, CMBS properties, Caesars Entertainment Operating Company (CEOC), Harrah’s Bond Company, and Caesars Interactive Entertainment. Most of the debt is held in the CMBS ($4.8 billion) and CEOC ($17.8 billion) operating subsidiaries. However, debt holders have wisely put covenants on CEOC’s debt to ensure any asset sale proceeds are earmarked to pay down debt or are reinvested CEOC’s properties in the form of capital expenditures. Earlier, in the year, CZR agreed to sell its Harrah’s St. Louis to regional competitor, Penn National for $610 million at an attractive 7.75X EBITDA. However, the price was inflated because for tax purposes it was classified as a tax sale (CZR has operating losses to offset the “gain on sale” taxes and Penn was able to put it on its book at the $610 million to generate high D&A expenses). Furthermore, Caesars’ current EV/EBITDA is approximately 11X, so this transaction wasn’t accretive to shareholder wealth creation. The transaction seems to have originated for two purposes: a) to free up capital to help finance the 2013 Linq expansion, and b) to exit a competitive St. Louis market where Caesars held the #3 market share position.
In terms of timing, it is unlikely that Caesars will miss an interest rate payment this quarter or even next quarter, rather my thesis rest on the fact that United States Gaming revenues at best, will be a low single digits growth business. Moreover, it will be increasingly more expensive to grow revenue and EBITDA, as new projects and fierce competitors are targeting the same revenue streams. Given this new reality, the sum of parts valuation multiple placed on 2014 EBITDA estimates is far lower than the outstanding debt and future cash interest expense (see Exhibit M).
Lastly, given the slower trajectory of revenue and EBITDA growth in Caesars’ foot print, CZR will have limited ability to generate free cash flow. Therefore, in less than three years, $8 billion in debt comes due, and Caesars’ balance sheet will still be very constrained. Discerning fixed income investors are aware of these circumstances, and as a result, signs of cracks are clearly visible to astute observers. Caesars’ 6.5% 2016 Senior Unsecured Notes are trading at $0.56 cents on the dollar and yielding 25%. Equity investors haven’t gotten the memo, and despite the opening of Octavian Tower (662 high end rooms opened this year at Caesars Palace), new opening in Ohio (Cincinnati and Cleveland), and the Linq project slated for a mid 2013 opening, CZR’s EBITDA isn’t robust enough to ultimately support its equity holders.
6
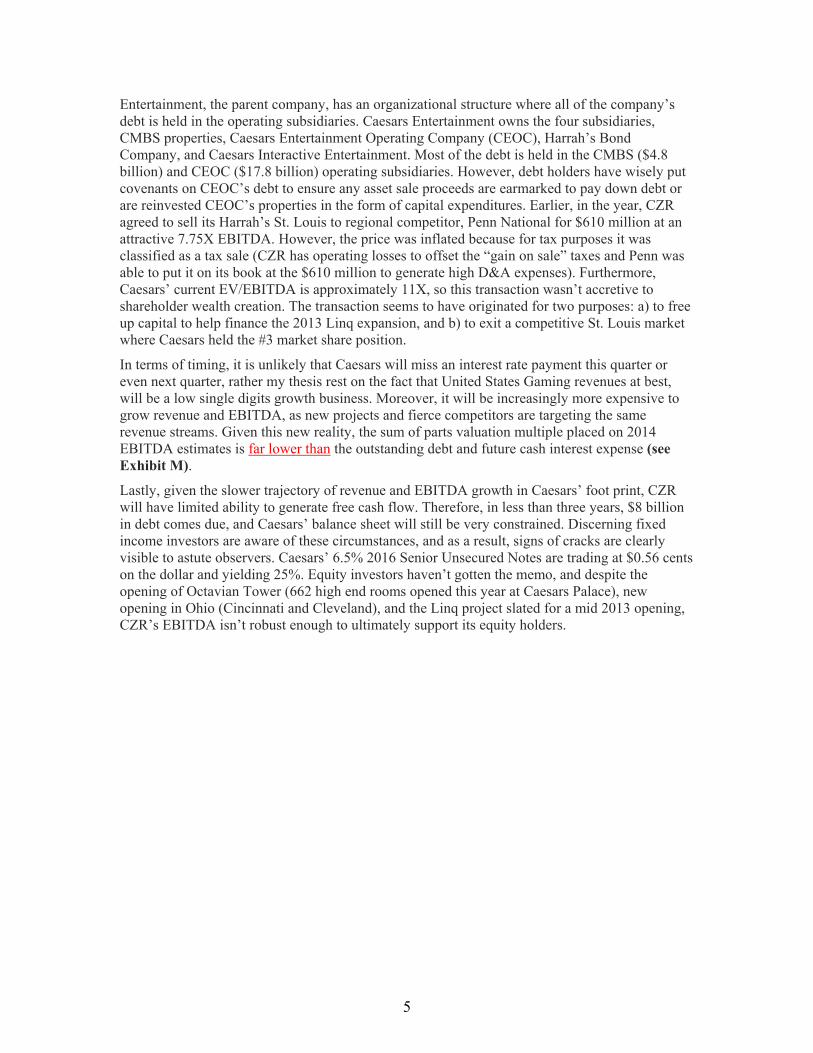
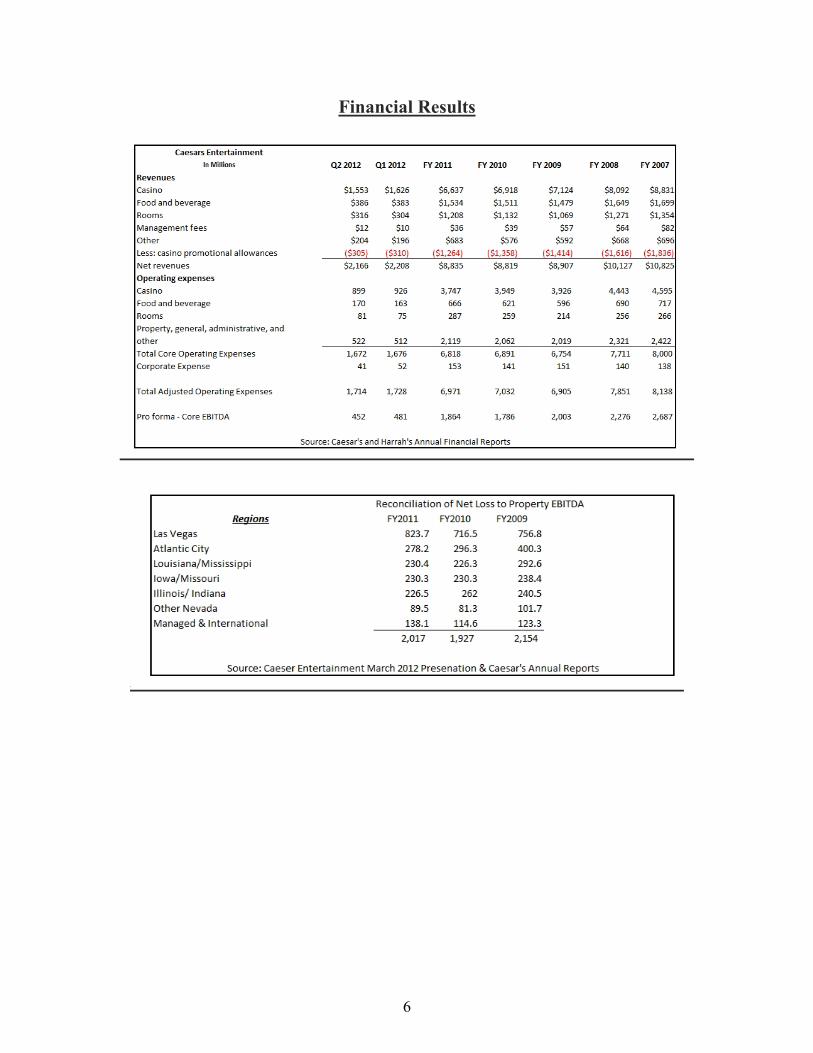
Financial Results
7
Exhibits Exhibit A – History of Macau’s Gaming Revenues – Source: UNLV Center for Gaming Research. Link: http://gaming.unlv.edu/abstract/macau.html
8
Exhibit B – Macau’s Gaming Mix - Source: UNLV Center for Gaming Research. Link: http://gaming.unlv.edu/abstract/macau.html
Exhibit C – Las Vegas Strip Gaming Revenue 1984 – 2011 – Source: UNLV Center for Gaming Research. Link: http://gaming.unlv.edu/reports/NV_1984_present.pdf
9
Exhibit D – 1st half 2012 Las Vegas Strip Gaming Revenues – Source: UNLV Center for Gaming – Link: http://gaming.unlv.edu/reports/6_month_NV.pdf
10
Exhibit E – Historical Visitor Statistics – Source: Las Vegas Convention and Visitor Authority – Link: http://www.lvcva.com/includes/content/images/media/docs/Historical-1970-to-2011.pdf
11
Exhibit F – 2011 GLS Research Visitor Survey – Link: http://www.lvcva.com/includes/content/images/media/docs/2011-Las_Vegas_Visitor_Profile.pdf
12
Exhibit G – Atlantic City Gaming Revenue – Source: UNLV – Link: http://gaming.unlv.edu/abstract/ac_main.html
13
Exhibit H – Deutsche Bank Research - YTD July Atlantic City Revenue Trends
14
Exhibit I – 10 – Year United States Commercial Casino Gaming – Source: American Gaming – Link: http://www.americangaming.org/industry-resources/research/fact-sheets/top-20-us-casino-markets-annual-revenue
15
Exhibit J – Caesars Balance Sheet, Cash Interest Expense, and Weighted Average Debt Yield
Exhibit K – Barclays (August 22nd) Initiation of Coverage Report – pg. 14
16
Exhibit L – MacQuarie Research (August 22nd) Regional Gaming Trends – pg. 2
17
Exhibit M – RBC Research – John Kempf’s Financial Model
Exhibit N – Barclays (August 22nd) Initiation of Coverage Report – pg. 15