caepr indigenous population project 2011 census papers
TRANSCRIPT

CAEPR Indigenous Population Project2011 Census Papers
Paper 5Population and Age Structure
Dr Nicholas [email protected]


0 5 P O PU L AT I O N A N D AG E ST R U CT U R E I
http://caepr.anu.edu.au/population/censuspapers.php
The 2011 Census Paper Series
In July 2012, the Australian Bureau of Statistics (ABS) began releasing data from the 2011 Census of Population and Housing. One of the more important results contained in the release was the fact that the number of people who identified as being Aboriginal and/or Torres Strait Islander (Indigenous) had increased by 20.5 per cent since the 2006 Census. There were also significant changes in the characteristics of the Indigenous population across a number of key variables like language spoken at home, housing, education and other socioeconomic variables. In this series, authors from the Centre for Aboriginal Economic Policy Research (CAEPR) document the changing composition and distribution of a range of Indigenous outcomes. The analysis in the series was funded by the Commonwealth Department of Families, Housing, Community Services and Indigenous Affairs (FaHCSIA) through the Strategic Research Project as well as FaHCSIA and State/Territory governments through the Indigenous Populations Project.
The opinions expressed in the papers in this series are those of the authors alone and should not be attributed to CAEPR, FaHCSIA or any other government departments.
CAEPR Indigenous Population Project
2011 Census Papers
No. 5/2012
Contents
Abstract ii
Acknowledgements ii
List of acronyms ii
1. Introduction and overview: The importance of measuring the Indigenous population 1
2. Data and geography 2
The 2011 Census and the estimated Indigenous population 2
The 2011 Australian Indigenous Geographic Classification 3
Dwelling and population counts 4
3. Age structure 5
4. Population change 8
5. Structural ageing 11
6. Mobility 12
7. Geography 14
8. Urbanisation 15
9. Summary and discussion of policy implications 18
Relative versus absolute need 19
Current and future age structure and Indigenous service provision 19
Demographic dividend or disaster 19
Indigenous urbanisation and the maintenance of Indigenous languages 21
References 22

I I CA E PR I N D I G E N O U S P O PU L AT I O N PR O J E C T: 2011 C EN SU S PA PER S
Abstract
The aim of this paper is to provide a contemporary overview of the changing size and composition of the Indigenous population. The paper is structured around six key demographic and geographic features of the Indigenous population:
• Age structure—The Indigenous population is relatively young;
• Population change—The Indigenous population is increasing at a much faster rate than the non-Indigenous population;
• Structural ageing—The Indigenous population is ageing and projected to age even faster over the next few decades;
• Mobility—Indigenous Australians are more likely to be away from their place of usual residence at a given point in time and more likely to change their place of usual residence over a given time period;
• Geography—The Indigenous population is much more likely to live in remote and very remote Australia relative to the non-Indigenous population but, in absolute terms, most Indigenous Australians live in urban or regional parts of the country; and
• Urbanisation—The Indigenous population is becoming more urban and this pattern is likely to continue over the next few decades.
In the final section of the paper, I discuss some of the demographic, policy and socioeconomic impacts of the changing Indigenous population.
Acknowledgements
A number of comments on this paper were received from and/or collated by members of the Steering Committee of the CAEPR Indigenous Population Project, and were much appreciated. Additional comments were received from the Australian Bureau of Statistics. An earlier version of this paper was presented as part of the Australian Demographic and Social Research Institute seminar series and the author would like to thank the organisers and attendees of this seminar for the opportunity to discuss the findings. Finally, this paper was edited and formatted by Gillian Cosgrove from CAEPR for which the author is, as always, very grateful.
List of acronyms
ABS Australian Bureau of Statistics
AIGC Australian Indigenous Geographic Classification
ANU Australian National University
CAEPR Centre for Aboriginal Economic Policy Research
FaHCSIA Commonwealth Department of Families, Housing, Community Services and Indigenous Affairs
NDIS National Disability Insurance Scheme
SLCD Statistical Longitudinal Census Database

0 5 P O PU L AT I O N A N D AG E ST R U CT U R E 1
1. Introduction and overview: The importance of measuring the Indigenous population
Australia’s First people comprise two distinct Indigenous cultures—Aboriginal peoples who trace ancestry back to the original occupants of the continent, and Torres Strait Islander peoples, whose Melanesian roots are traced to the archipelago between the Australian mainland and Papua New Guinea.
For the last three decades, someone is defined as being Indigenous by governments if they meet the following three criteria:
1. They are of Aboriginal or Torres Strait Islander descent;
2. They identify as an Aboriginal or Torres Strait Islander; and
3. They are accepted as an Aboriginal or a Torres Strait Islander by the community in which they live (Department of Aboriginal Affairs 1981).
There is no national registry of the Indigenous Australian population and the main way in which the size of the population is estimated is through the five-yearly Census of Population and Housing. The question used in the census to identify whether a person is Indigenous or not has stayed consistent over the last few decades. In 2011, those filling out the household form were asked the following about each individual in the household—‘Is the person of Aboriginal or Torres Strait Islander origin?’ Three options were given for the response: ‘No’; ‘Yes, Aboriginal’; or ‘Yes, Torres Strait Islander’. Instructions on the form also indicated that ‘For persons of both Aboriginal and Torres Strait Islander origin, mark both “Yes” boxes’.
It can be argued that the Indigenous population revealed by the census only conforms with the second of the three criteria mentioned above, but only to the extent that a collection of individuals tick the appropriate box on the census form. The first criteria is strictly only verifiable with genealogical evidence (though it is implied by the second), while the third criteria is only rarely tested (for example in accessing certain special programs), and is certainly not applied in the census or in most survey and administrative applications of the standard Indigenous status question.
While the question on the census may have stayed reasonably consistent across time, people’s response to it may differ across collections. This is not exclusive to the 2011 Census and is likely to occur across an individual’s lifecourse anyhow, as they begin to fill out census forms
on their own behalf (as opposed to appearing as a child on a household form) and get a better sense of their own identity. One-off events may also have an impact though, with some suggesting that the Apology to Australia’s Indigenous Peoples made by the former Prime Minister Kevin Rudd made some Indigenous Australians who did not identify as such more comfortable in doing so in the most recent census. However such suggestions are difficult—if not impossible—to test empirically and retrospectively.
There are further challenges to the enumeration process that can cloud the accuracy of the Indigenous population count. In order to answer the census question, a person (Indigenous or otherwise) needs to have been contacted by a census collector or to have made contact with one themselves. They also need to have made the decision to fill out the census form, either online or using a hard copy. Furthermore, there have been significant changes to the Indigenous Enumeration Strategy between 2006 and 2011, with an increased focus on urban areas and a greater level of ongoing engagement with Indigenous communities in remote areas between censuses.
All of the above issues lead to uncertainty around the size and composition of the Indigenous population. According to the 2011 Census, there were 548,370 Indigenous Australians counted, making up 2.7 per cent of the Australian population who answered the Indigenous status question. After taking into account the undercount of the Indigenous population (discussed below), preliminary estimates of the population by the ABS (2012) give an Indigenous population of 669,736, or 3.0 per cent.
Despite Indigenous Australians making up a small share of the total Australian population, the need to understand the population dynamics of the population far exceeds their population size. This is for the following four reasons: history, socioeconomics, geography and demography.
As descendants of the original inhabitants of the Australian continent and associated territories, Indigenous Australians have certain native title rights not held by other population groups. This alone warrants a special treatment within demographic and population analysis. However, there are other historic events and forces beyond prior occupation of relevance, including significant population decline post-colonisation (Smith 1980), forcible removal of children from their families, legal discrimination in terms of wages (Broome 2010) and separate labour market programs like the Community Development Employment Projects scheme (Sanders 1993).

2 CA E PR I N D I G E N O U S P O PU L AT I O N PR O J E C T: 2011 C EN SU S PA PER S
The historical treatment of Indigenous Australians is arguably one of the major factors that has led to the currently high level of socioeconomic disadvantage. Indigenous Australians are one of—if not the most—disadvantaged population groups within Australia in terms of employment, income, education, housing and health (Steering Committee for the Review of Government Service Provision 2011 and this paper series). This has led to the Council of Australian Governments devoting considerable resources to the policy of ‘Closing the Gap’, which has as its headline target the elimination of the disparity in life expectancy between Indigenous and non-Indigenous Australians within a generation (FaHCSIA 2009).
Geography also plays a strong role in the policy and research focus on the Indigenous population. As will be demonstrated in this paper, although Indigenous Australians make up a small percentage of the overall Australian population, their concentration in relatively remote areas means that in much of Australia the Indigenous population forms a sizeable minority, or even a majority.
A fourth and final reason for a disproportionate focus on the Indigenous population in research and policy is demography. As will also be shown later in this paper, Indigenous Australians are a relatively young population due to high rates of fertility and mortality. This means that Indigenous Australians make up a disproportionate share of certain policy-relevant age groups, including preschoolers, school-age children and young adults, and those entering the workforce and/or their peak child-bearing years. Furthermore, Indigenous Australians are likely to make up a growing share of these population groups into the future as the rest of the Australian population ages.
Taken together, these four factors (history, socioeconomics, geography and demography) mean that a detailed understanding of the size and the composition of the Indigenous population is a vital factor in evidence-based policy formulation in Australia. In order to plan for the future and understand the potential impact of past policies, it is important to know how key demographic characteristics are changing.
The aim of this paper is to provide a contemporary overview of the changing size and composition of the Indigenous population in order to support that evidence base. The paper is structured around six key demographic and geographic features of the Indigenous population:
• Age structure—The Indigenous population is relatively young.
• Population change—The Indigenous population is increasing at a much faster rate than the non-Indigenous population.
• Structural ageing—The Indigenous population is ageing and projected to age even faster over the next few decades.
• Mobility—Indigenous Australians are more likely to be away from their place of usual residence at a given point in time and more likely to change their place of usual residence over a given time period.
• Geography—The Indigenous population is much more likely to live in remote and very remote Australia relative to the non-Indigenous population. However, in absolute terms, most Indigenous Australians live in urban or regional parts of the country.
• Urbanisation—The Indigenous population is becoming more urban and likely to become more urban over the next few decades.
Before looking at these substantive issues though, each of which will be covered in a separate section, I talk briefly about the data and geography used in the paper. This is followed by an examination of each of the above population characteristics in turn. In the final section of the paper, I discuss some of the demographic, policy and socioeconomic impacts of the changing Indigenous population.
2. Data and geography
THE 2011 CENSUS AND THE ESTIMATED
INDIGENOUS POPULATION
The five-yearly population census is the main source of information on race and ethnicity in Australia. However, the 1976 Census was the last one to directly include a question about racial origin. In the 1986 Census, in response to community interests and lobbying, a question was included asking about each person’s ancestry. While the question was discontinued in subsequent censuses, it was reinstated for the 2001, 2006 and 2011 Censuses.
While the Indigenous population can identify themselves as Aboriginal and/or Torres Strait Islander in the census ancestry question, the direct question on Indigenous status provides a more inclusive estimate of the size of the Indigenous population. Only 0.6 per cent of the population identified as Aboriginal or Torres Strait Islander in the 2011 ancestry question compared with 2.5 per cent of the population who responded that they were either Aboriginal

0 5 P O PU L AT I O N A N D AG E ST R U CT U R E 3
and/or Torres Strait Islander in the direct question on Indigenous status.
It should be noted though, that 1,058,583 people or around 4.9 per cent of the population did not respond to the Indigenous status question at all in 2011. That is, there are almost twice as many people in the census for whom we do not know their Indigenous status as there are who identify as being Indigenous. While this is high, it represents a decline in absolute terms from 2006 (down from 1,133,449 people) and in percentage terms (down from 5.7%). For whatever reason, people appear to have become more inclined to answer the Indigenous status question in the census than was previously the case.
This is a positive development as, while the ABS uses a post-enumeration survey to estimate census net undercount and distributes non-response to Indigenous status in developing post-censal estimates of the Indigenous population, census error remains an issue that hampers Indigenous population analysis in Australia (Kinfu & Taylor 2005; Taylor & Biddle 2010). Furthermore, while adjustments can be made to the size of the Indigenous population to take into account those who do not state their Indigenous status, this is substantially more difficult when it comes to understanding the composition of the population.
A second reason for why Indigenous Australians may be missed from the census count is if they neither fill out a census form or have a form filled out on their behalf. One set of Australians missed from the census are those who were overseas at the time. These are added back to population estimates based on estimates from incoming and outgoing passenger cards. However, there is no information on Indigenous status on these passenger cards, nor is there any information on things like education, income or employment. There are also those who were in Australia, and hence who should be within the scope of the census, who are missed from the count. In some cases this may be through choice. In other cases though, this may be because the individual was not able to be contacted by census collectors.
Taken together, there are a number of ways in which the Indigenous population count understates the size of the Indigenous population in both absolute and relative terms. It is also true that the same person may be counted more than once in the census. However, in general, there tends to be a net undercount rather than a net overcount of the population. This was the case for the Indigenous population in the 2011 Census, with estimates from the 2011 post-enumeration survey of a 17.2 per cent net undercount.
After applying this undercount adjustment to the population count, the ABS (2012) estimates that there were 669,736 Indigenous Australians as of 30 June 2011. As the net undercount for the total Australian population was much smaller (1.7%), the adjusted estimate of the percentage of the population identified as being Indigenous (3.0%) was considerably higher than the share of the raw population count who answered the Indigenous status question (2.7%).
THE 2011 AUSTRALIAN INDIGENOUS GEOGRAPHIC
CLASSIFICATION
A large proportion of Indigenous research and evaluation occurs at the jurisdictional level. This makes sense to a certain extent because, in a federal system, State and Territory governments need to be accountable for what is happening to their populations (even if many of the changes are beyond their control). However, while trends identified at the jurisdictional level are important for broad policy settings, the reality is that many Indigenous policies are delivered locally to individual regions or communities. There is also significant variation in a number of outcomes within jurisdictions and even within smaller regional classifications. For example, in an analysis of 2006 Census data, Biddle (2009a) showed that there were a number of suburbs within Sydney that had socioeconomic outcomes that were as disadvantaged as a number of remote or regional towns. For this reason, it is important to look at changes in outcomes at the regional and community level.
To undertake analysis at the regional and local level, this paper utilises the Australian Indigenous Geographic Classification (AIGC). The AIGC is a four-level structure that builds up from the Statistical Area Level 1 which is common to both the AIGC and the Australian Statistical Geography Standard. The next level above the Statistical Area Level 1 in the AIGC is Indigenous Locations, of which there were 1,116. The next level above Indigenous Locations are Indigenous Areas, of which there were 429. Of these, 411 substantive areas remained after excluding administrative codes representing those in a particular State or Territory who did not give any additional detail on their place of usual residence, or who were migratory on the night of the census.
The most aggregated level of geography in the AIGC is the Indigenous Region. There were 57 Indigenous Regions in the 2011 version of the AIGC. After excluding administrative regions and the Christmas–Cocos (Keeling) Island Region (which has very few Indigenous Australians), this leaves 38 Indigenous Regions used in the analysis for this series. Figure 1 gives the name and location of each of these regions.

4 CA E PR I N D I G E N O U S P O PU L AT I O N PR O J E C T: 2011 C EN SU S PA PER S
DWELLING AND POPULATION COUNTS
It is often overlooked that the full name of the census is the Census of Population and Housing, and that the aim is not only to count the number of people in Australia at a particular point in time, but also the number of dwellings and households. These dwellings are classified into two broad types—private and non-private. Non-private dwellings include hotels or motels, boarding schools, hospitals and corrective institutions.1 According to the 2011 Census, 26,124 Indigenous Australians or 4.8 per cent of the Indigenous population were counted in non-private dwellings. This is somewhat higher than the 3.0 per cent of the non-Indigenous population who live in such dwellings.
Not only are there differences by Indigenous status in the proportion of the population in non-private dwellings, there are also differences in the age distribution. For both populations, the proportion of the population aged 0–14
1. See <http://www.abs.gov.au/ausstats/[email protected]/Lookup/2901.0Chapter7402011>.
years in non-private dwellings is quite low—1.6 per cent for the Indigenous population and 0.7 per cent for the non-Indigenous population. However, while the proportion for the non-Indigenous population increases consistently across the lifecourse, reaching a peak of 5.3 per cent for those aged 55 years and over, the highest proportion for the Indigenous population is amongst those aged 25–54 years (6.7%). Although there is only a small decline into the age group of 55 years and over (6.4%), the different age distribution highlights the different reasons for living in a non-private dwelling. For the Indigenous population, boarding schools and corrective institutions take on much greater importance when compared to the non-Indigenous population, while for the non-Indigenous population, aged care facilities are of greater importance.
The ABS classifies private dwellings into those that have at least one usual resident who identifies as being Indigenous (identified in this paper as being an ‘Indigenous household’), and those without any Indigenous usual residents (‘other households’). The 522,247 Indigenous Australians in a private dwelling at the time of the
FIGURE 1. 2011 Indigenous Region names and boundaries
South-Western WA
Broome
West Kimberley
Kununurra
Darwin
Jabiru−Tiwi Nhulunbuy
Katherine(1.6%)
MountIsaApatula (1.5%)
Toowoomba−Roma Brisbane
NSW Central & North Coast
North-Eastern NSW
Dubbo
Jervis Bay
Sydney−Wollongong
ACT
South-Eastern NSW
Tasmania
Melbourne
Victoria excl.Melbourne
Riverina−Orange
Adelaide
Port Lincoln−Ceduna
North-Western
NSW
Rockhampton
Townsville−Mackay
Cairns−Atherton
Cape York
Torres Strait
PortAugusta
Alice Springs
TennantCreek
Perth
Kalgoorlie
Geraldton
South Hedland

0 5 P O PU L AT I O N A N D AG E ST R U CT U R E 5
14.1 per cent of the total non-Indigenous population is aged 65 years and over compared to 3.4 per cent of the Indigenous population.
There are some differences by gender. For example, 1.9 per cent of the total Indigenous population are female and aged 65 years and over compared to 1.5 per cent of the Indigenous population who are male and of that age. This is driven mainly by the relatively high rates of age-specific mortality experienced by Indigenous males.
This relatively young Indigenous population is driven by three factors. First, Indigenous females have a relatively high fertility rate. The total fertility rate for Indigenous females in 2008 was estimated at 2.52 compared to 1.97 for the total population (ABS 2009a). Most of this difference is driven by the high fertility rates of young Indigenous females, as demonstrated in Figure 3, which summarises age-specific fertility rates for Indigenous and non-Indigenous females.
The results presented in Figure 3 show the clear disparity in the age distribution of fertility rates between Indigenous and non-Indigenous females. With a median age of 24.7 years, Indigenous mothers are substantially younger than the average mother in Australia (30.7 years). There are
2011 Census were spread across 209,050 Indigenous households, with the remaining 7,551,275 households having no Indigenous usual residents.
3. Age structure
Indigenous Australians are a young population. According to the most recent (2011) Census counts, the median age of the Indigenous population is 21 years, compared to 38 years for the non-Indigenous population.
A full picture of the differences in age structure between Indigenous and non-Indigenous Australians can be seen in the age pyramid shown in Figure 2. It gives the percentage of the total Indigenous population who are in a given five-year age group by sex (in grey) as well as the corresponding percentage of the non-Indigenous population in that age/sex category (hollow bars).
This figure shows that a very large proportion of the Indigenous population is in the first five age groups (aged 0–24 years). Across males and females, these age groups represent 55.8 per cent of the total Indigenous population compared to 31.9 per cent of the total non-Indigenous population. At the other end of the age distribution,
FIGURE 2 . Age distribution of the Indigenous and non-Indigenous population, 2011
10 5 0 5 10
0−45−9
10−1415−1920−24
Ag
e g
rou
p (
yea
rs)
Per cent of population
MALES FEMALES
25−2930−3435−3940−4445−4950−5455−5960−6465−6970−7475−7980−84
85+
Indigenous Non-Indigenous
Source: ABS 2012.

6 CA E PR I N D I G E N O U S P O PU L AT I O N PR O J E C T: 2011 C EN SU S PA PER S
FIGURE 3 . Age-specific fertility rates for Indigenous females and all Australian females, 2008
0
20
40
60
80
100
120
140
160
15−19 20−24 25−29 30−34 35−39 40−44 45−49
Nu
mb
er
of
bir
ths
pe
r 10
00
wo
me
n
Age group
Indigenous births to Indigenous mothers
All births to all mothers
Source: ABS 2009a.
more than four times as many births per 1,000 Indigenous females aged 15–19 years compared to all Australian females of the same age, and 2.5 times as many births per 1,000 Indigenous females aged 20–24 years. Figure 3 also shows that fertility rates for non-Indigenous females aged 30 years and over are in fact higher than Indigenous females of the same age. However, while non-Indigenous females are clearly more likely to delay childbirth into their thirties, this is never at a high enough rate to ‘catch up’ with Indigenous females. Biddle and Yap (2010) show that for all age groups, the ‘number of children ever born’ is higher for Indigenous compared to non-Indigenous females (even after controlling for socioeconomic characteristics).
While the high rates of Indigenous fertility clearly contribute to the proportionally large number of Indigenous births per year, a second contributing factor is high rates of exogamy and births of Indigenous children to non-Indigenous mothers. The ABS (2009a) estimates that in 2008, 27.1 per cent of births that were identified as being Indigenous were born to a non-Indigenous mother (presumably with an Indigenous father). This proportion varies substantially by geography. In New South Wales, the state with the biggest Indigenous and non-Indigenous population, 35.2 per cent of births of Indigenous children were to non-Indigenous mothers. On the other hand, in the Northern Territory, a jurisdiction with a relatively small non-Indigenous population, only 8.3 per cent of Indigenous births were to non-Indigenous mothers.
The third reason for the relatively young Indigenous population is excess Indigenous mortality, demonstrated in Figures 4 and 5. Both give the percentage of Indigenous and non-Indigenous males and females who are estimated to die between the ages of 0–1, between the ages of 1–5 and over subsequent five-year age periods up until 80–85. Given the increase in mortality rates over the lifecourse, Figure 4 focuses on the first nine age cohorts (covering the ages of 0–40), whereas Figure 5 uses a different scale and focuses on the remaining eight cohorts (covering the ages of 40–85).
Results presented in these two figures show consistently higher rates of age-specific mortality for Indigenous males and females compared to their non-Indigenous counterparts. Indigenous males and females are generally at least twice as likely to die over a five-year period than their non-Indigenous counterparts, with the difference greatest between the ages of 20 and 60.

0 5 P O PU L AT I O N A N D AG E ST R U CT U R E 7
FIGURE 4 . Percentage of the population predicted to die at the end of each age cohort, Indigenous and non-Indigenous
males aged 0–40, 2005–07
Indigenous male
Indigenous female
Non-Indigenous male
Non-Indigenous female
0
0.5
1
1.5
2
2.5
3
3.5
Pe
r c
en
t o
f p
op
ula
tio
n w
ho
die
ove
r th
e ag
e co
ho
rt
Age cohort (years)
0−1 1−5 5−10 10−15 15−20 20−25 25−30 30−35 35−40
Source: ABS 2009b.
FIGURE 5 . Percentage of the population predicted to die at the end of each age cohort, Indigenous and non-Indigenous
males aged 40–85, 2005–07
Pe
r c
en
t o
f p
op
ula
tio
n w
ho
die
ove
r th
e ag
e co
ho
rt
Age cohort (years)
40−45 45−50 50−55 55−60 60−65 65−70 70−75 75−80 80−85
Indigenous male
Indigenous female
Non-Indigenous male
Non-Indigenous female
0
5
10
15
20
25
30
35
40
45
50
Source: ABS 2009b.

8 CA E PR I N D I G E N O U S P O PU L AT I O N PR O J E C T: 2011 C EN SU S PA PER S
4. Population change
High rates of fertility and mortality have the potential to cancel each other out. However, the estimated Indigenous population grew by 29.5 per cent between 2006 and 2011. This would suggest that not only did the combined effect of high fertility and Indigenous births to non-Indigenous mothers outweigh the effect of high mortality, but that there were other non-demographic factors driving the change.
Figure 6 shows that this more rapid than expected population increase was not consistent across the age distribution. Specifically, Figure 6 shows the 2006 Indigenous population estimate by age cohort (with those 65 years and over grouped together) alongside the age-specific 2011 population estimate. The final two bars in the table give the (Series A) population projection in Biddle and Taylor (2009) and ABS (2009c).
A comparison of the 2006 population estimates and the 2011 population projections are a good indication of natural population increase. This is because they are based on cohort-component methodologies that apply known demographic parameters to the base Indigenous population. Comparing the 2006 population estimate and the 2011 ABS Series A projections, we can see that the most rapid natural population increase was projected to have occurred in the last three population groupings. Specifically, the population aged 55 years and over was projected to be 30.0 per cent higher in 2011 than it was in 2006.
When we look at the 2011 population estimates, however, it is clear that there was a higher than projected population increase for the Indigenous population between 2006 and 2011. Specifically, the 2011 population estimates were 16.5 per cent higher than the ABS Series A projections. While there were greater than projected increases in all age categories, the biggest difference was in the first four age cohorts. Around half (50.3%) of the higher than projected increase in the Indigenous population (that is, the difference between the ABS Series A projection and eventual estimate) was estimated to have occurred amongst those aged 0–19 years.
This faster than expected population increase is demonstrated in Figure 7. Here, rather than presenting population estimates and projections for the current age of the individual, results are given for the age of the particular cohort in 2006. So, for example, those who were aged 5–9
in 2011 are presented alongside those who were aged 0–4 in 2006.2
Given the way that the 2011 population projections for each age cohort are constructed, it is not surprising that they are always below those of the population estimates. This is an artefact of the cohort-component methodology and represents the assumptions about mortality rates for that cohort. However, a comparison of the 2006 and 2011 estimates show that all cohorts actually experienced an increase in the Indigenous population over the period.
There were reasonably large differences across the age distribution up until the population aged 65 and over. However, the biggest difference (in both absolute and relative terms) was in the first two age cohorts. There were estimated to be 21.9 per cent more Indigenous Australians aged 5–9 years in 2011 than there were Indigenous Australians aged 0–4 years in 2006. Furthermore, there was a 19.6 per cent increase in the cohort aged 5–9 years over the same period.
One of the potential reasons for this unexplained increase is that some of those Indigenous Australians who would otherwise have identified as such were not collected at all in the 2006 Census but were in the 2011 Census. This is a plausible explanation for at least some of the change, given the increased investments in the Indigenous Enumeration Strategy. This could be investigated further by the ABS by comparing the population growth rate in areas in which the Indigenous Enumeration Strategy had a stronger presence in 2011 than in 2006 with the growth rate in other areas.
Another potential source of unexplained increase in the Indigenous population is the decrease in the number of people who did not state their Indigenous status. As mentioned previously, 4.9 per cent of the population did not respond to the Indigenous status question at all in 2011, down from 5.7 per cent in 2006. Figure 8 plots the change in the size of the Indigenous cohort (on the vertical axis) against the change in the size of the population who did not state their Indigenous status (on the horizontal axis). The line represents the estimated linear relationship between the two.
2. Unfortunately, due to 2011 population projections only being available for the population aged 65 years and over in a single group, it is not possible to give the projected size of the population who were aged 60–64 in 2006.

0 5 P O PU L AT I O N A N D AG E ST R U CT U R E 9
FIGURE 6 . Estimated and projected Indigenous population by current age
Ind
ige
no
us
po
pu
lati
on
esti
mat
e/p
roje
cti
on
Age group (years)
0−40
10,000
20,000
30,000
40,000
50,000
60,000
70,000
80,000
90,000
5−9 15−1910−14 20−24 25−29 35−3930−34 40−44 45−49 55−5950−54 60−64 65+
2011 Biddle & Taylor projection
2011 ABS Series A projection
2006 estimate 2011 estimate
Source: ABS 2008, 2009c, 2012; Biddle & Taylor 2009.
FIGURE 7. Estimated and projected Indigenous population, by age cohort
Ind
ige
no
us
po
pu
lati
on
esti
mat
e/p
roje
cti
on
Age group (years)
0−40
10,000
20,000
30,000
40,000
50,000
60,000
70,000
80,000
90,000
5−9 15−1910−14 20−24 25−29 35−3930−34 40−44 45−49 55−5950−54 60−64
2011 Biddle & Taylor projection
2011 ABS Series A projection
2006 estimate 2011 estimate
Source: ABS 2008, 2009, 2012; Biddle & Taylor 2009.

10 CA E PR I N D I G E N O U S P O PU L AT I O N PR O J E C T: 2011 C EN SU S PA PER S
While there is significant variation around it, the straight line in Figure 8 (and the negative correlation of –0.179) shows that those cohorts who experienced the greatest decline in the number of people who did not state their Indigenous status were somewhat more likely to experience a larger increase in the number of Indigenous people in the cohort. Although a proportion of those who did not state their Indigenous status would have been added to the 2006 and 2011 population estimates, the results presented in Figure 8 suggest that this allocation may have been too low in 2006.
A final possible reason for faster than projected population increase between 2006 and 2011 is people being identified as non-Indigenous in 2006 but having identified as Indigenous in 2011. This so-called ethnic mobility has been suspected to have occurred in previous censuses and in different countries. However, there was very little evidence of it occurring between 2001 and 2006 and was therefore not incorporated in the main official and academic models for post-2006 projections.
Unlike previous years, however, there is now the potential to test for the existence, as well as the size and characteristics of this ethnic mobility. This opportunity arises because of the proposed 5 per cent Statistical Longitudinal Census Database (SLCD). According to the
ABS, this database will be formed by ‘bringing together data from the 2006 Census with data from the 2011 Census and future Censuses’. Specifically:
Wave 1 of the SLCD was created from the 2006 Census dataset by selecting a random sample of 5% of persons in the 2006 Census of Population and Housing. Wave 2 of the SLCD will endeavour to bring together the Wave 1 records with their corresponding records in the 2011 Census (ABS 2010).
Unlike in standard longitudinal databases, there will be no unique identifier with which to match individuals across the census. Furthermore, although a non-identifiable code based on the first letter of the individual’s first and last names will be used for linking Wave 2 and Wave 3 data (from the 2016 Census), this will not be available for the Wave 1 to Wave 2 linkage. Instead, the probabilistic linkage methods used will be based on what the ABS labels as ‘characteristics common to both datasets’. That is, information that is time invariant (like sex or country of birth); changes in a consistent way (age); or which is recorded in both datasets (for example place of usual residence on the night of the census in 2006 and place of usual residence five years ago in 2011).
FIGURE 8 . Change in the Indigenous population between 2006 and 2011 by change in the number of people who didn’t state
their Indigenous status, 2006 age cohorts
0
5
10
15
20
25
−20 −15 −10 −5 0 5 10 15 20
Ch
an
ge
in n
um
be
r o
f In
dig
en
ou
s p
eop
le in
co
ho
rt
Change in number of people in cohort who did not state their Indigenous status
Source: Customised calculations based on ABS (2012) as well as the 2006 and 2011 Censuses.

0 5 P O PU L AT I O N A N D AG E ST R U CT U R E 11
It might be tempting for the ABS to include Indigenous status as one of the time-invariant characteristics under the assumption that if a person is Indigenous (or non-Indigenous) at a particular point in time, then this will remain the case into the future. However, this only holds for the first criterion on Indigenous status introduced in the first section of this paper (they are of Aboriginal or Torres Strait Islander descent). Even then, a proportion of people may learn of their descent in between censuses, and there is every chance that even without additional information the way in which a person identifies, or whether or not they are accepted by the community, may change.
If Indigenous status is used as a linking variable, there is every chance that an individual in the 2006 sample may be incorrectly linked with a separate person in 2011. Perhaps more important though (at least from the point of view of this paper), not using Indigenous status as a linking variable opens up the potential of comparing the person’s response to it in 2011 with their response in 2006. By comparing the demographic, geographic and socioeconomic characteristics of those who do change their response between censuses with those who are Indigenous throughout (or non-Indigenous throughout) will give significant and policy-relevant insight into the unexplained increase in the Indigenous population over the last intercensal period.
5. Structural ageing
While the current Indigenous population is relatively young, it is likely that it will age noticeably into the future. There is evidence of this already being underway. As discussed in the previous section of this paper, although there was an increase in all age categories over the last intercensal period, the greatest increase was amongst those aged 55 years and over.
This structural ageing is demonstrated in Figure 9, which shows the age pyramid for the 2011 Indigenous population (grey bars) alongside the age distribution of the Indigenous population in 2006 (hollow bars).
In the absence of significant external shocks, changes in the age structure of a population are likely to be slow and gradual. However, there is clear evidence of this over the last intercensal period. In 2006, 37.6 per cent of the Indigenous population were estimated to be aged 0–14 years. By 2011, this had declined to 35.8 per cent. At the other end of the age distribution, the proportion of Indigenous Australians aged 55 years and over increased from 7.7 per cent in 2006 to 8.9 per cent in 2011.
There also appears to have been a small increase in the population at the age associated with undertaking post-secondary education and entering the labour force.
FIGURE 9. Indigenous age distribution, 2006 and 2011
10 5 0 5 10
0−45−9
10−1415−1920−24
Ag
e g
rou
p (
yea
rs)
Per cent of population
MALES FEMALES
25−2930−3435−3940−4445−4950−5455−5960−6465−6970−7475−7980−84
85+
2011 2006
Source: ABS 2008, 2012.

12 CA E PR I N D I G E N O U S P O PU L AT I O N PR O J E C T: 2011 C EN SU S PA PER S
In 2006, 26.4 per cent of the population were estimated to be aged 15–29 years, compared to 27.6 per cent in 2011.
Some of this ageing may have been driven by changes in patterns of enumeration and identification. However, at least some of it is driven by changes in demographic characteristics. While there is still a large gap in life expectancy between Indigenous and non-Indigenous Australians, age-specific mortality rates of the Indigenous population itself appear to be falling. Furthermore, although fertility rates remain substantially higher for Indigenous females than for non-Indigenous females, these too appear to be declining for Indigenous Australians.
A final point to note is that there is a strong possibility that government policy may accelerate this ageing process. One of the headline targets of government is to ‘Close the Gap’ in life expectancy between Indigenous and non-Indigenous Australians within a generation. While this is a very ambitious target, any progress on improvements in life expectancy will have the effect of increasing the Indigenous population living into and beyond retirement age. Furthermore, if the Commonwealth, State and Territory governments are able to meet—or at least come close—to meeting their other Closing the Gap targets related to education and employment, then it is likely that fertility rates amongst Indigenous females will also decline, leading to a reduction in the number of Indigenous children being born.
6. Mobility
Traditionally, population estimates have been constructed based on the address respondents identify as being their place of ‘usual residence’. However, we also know from the census that approximately one in 20 respondents—or around one million Australians—are away from their place of usual residence on the night of the census.
While it makes sense to provide schools, roads, hospitals and other services where people live, visitors to an area also place significant demands on local infrastructure. Recognition of these pressures has led to the development and analysis of the concept of service population (Cook 1996). A service population includes any and all individuals who may be expected to access a particular service. The service population is therefore larger than the resident population of a particular locale (Prout 2008). It is a particularly useful concept in relation to highly mobile populations where the distinction between ‘visitor’ and ‘resident’ can be problematic.
Analysis of temporary mobility using the census involves comparing the snapshot picture of where people happened to be on the night of the census (their place of enumeration) with where they identify as their place of usual residence. As Bell (2004) notes, such analyses cannot capture the duration, frequency, periodicity or seasonality of temporary movements. However, to varying degrees, they are able to capture the intensity, distance, direction and spatial patterns of such movements (Bell 2004).
One of the defining features of temporary mobility in Australia is that rates are substantially higher for the Indigenous population than the non-Indigenous population. At the time of the 2011 Census, 6.9 per cent of Indigenous Australians were away from their place of usual residence, substantially higher than the 4.4 per cent of non-Indigenous Australians. As Figure 10 shows, however, there is almost as much variation across the Indigenous population by age and sex in terms of rates of temporary mobility as there is between Indigenous and non-Indigenous Australians.
There are three points to note from Figure 10. First, there is a distinct lifecycle pattern to temporary mobility. For all four population groups, rates start off low for the population aged 0–4 years, then decline even further during the compulsory school years (those aged 5–14). Rates of temporary mobility then increase substantially, reaching a peak during the early to mid-20s. Amongst the Indigenous population, for example, 9.5 per cent of males and females (combined) were away from their place of usual residence on the night of the census.
Beyond the mid-20s, the second key finding from Figure 10 becomes apparent—divergence by gender. While rates of temporary mobility stay reasonably high for Indigenous males (and to a lesser extent, non-Indigenous males), there is a substantial decline in temporary mobility for Indigenous and non-Indigenous females. By the 35–39-year age group, only 5.9 per cent of Indigenous females were away from their place of usual residence. For non-Indigenous females, a low of 2.6 per cent is reached in the 40–44-year age group. Given that the census is carried out on a Tuesday during school term, the two most obvious reasons for this gender-specific decline are that females are less likely to be employed than males (and hence away from home for work) and are more likely to have caring responsibilities for children (Yap & Biddle 2012).
Figure 10 also demonstrates that at every point on the age distribution, Indigenous males and females are more likely to be away from their place of usual residence than their non-Indigenous counterparts. This result holds even when using more detailed econometric analysis

0 5 P O PU L AT I O N A N D AG E ST R U CT U R E 13
FIGURE 11. Percentage of population who changed their place of usual residence between 2010 and 2011,
by Indigenous status
Age group (years)
0−4 5−9 15−1910−14 20−24 25−29 35−3930−34 40−44 45−49 55−5950−54 60−64 65+0
5
10
15
20
25
30
35
40
Pe
r c
en
t o
f p
op
ula
tio
n w
ho
ch
an
ge
d u
sua
l res
ide
nc
eb
etw
ee
n 20
10 a
nd
201
1
Indigenous maleIndigenous femaleNon-Indigenous maleNon-Indigenous female
Source: Customised calculations based on the 2011 Census.
FIGURE 10. Percentage of population away from their place of usual residence on the night of the census,
by Indigenous status and sex, 2011
Age group (years)
0−4 5−9 15−1910−14 20−24 25−29 35−3930−34 40−44 45−49 55−5950−54 60−64 65+0
2
4
6
8
10
12
Pe
r c
en
t o
f p
op
ula
tio
n aw
ay f
rom
th
eir
pla
ce
of
usu
al r
esid
en
ce
Indigenous maleIndigenous femaleNon-Indigenous maleNon-Indigenous female
Source: Customised calculations based on the 2011 Census.

14 CA E PR I N D I G E N O U S P O PU L AT I O N PR O J E C T: 2011 C EN SU S PA PER S
of individual-level data (Biddle & Yap 2010), highlighting the fact that temporary mobility is a key feature of Indigenous demography.
Not only are Indigenous Australians more likely to be away from their place of usual residence on the night of the census, they are also more likely to change where they live over a given time period (permanent migration). According to the most recent census, 20.3 per cent of the Indigenous population reported a different usual residence in 2011 than in 2010. This is substantially higher than the 14.4 per cent of the non-Indigenous population who moved over the same period. Once again though, these Australian averages mask considerable variation by age and sex. This is demonstrated in Figure 11.
All four population subgroups follow a similar pattern across the lifecourse. Migration rates start off high in the age group of 1–4 years and then decline through the compulsory school years. Rates then increase, reaching a peak in the age groups of 20–24 and 25–29 years. There is then a gradual decline with migration rates for all four groups, falling below 10 per cent for those 65 years and over.
While the patterns are similar, there are differences in levels by Indigenous status and by sex. In terms of Indigenous status, the Indigenous population has much higher rates of migration for those younger than 20 and older than 35. During the peak migration ages, however, rates are quite similar for the Indigenous and non-Indigenous populations. By sex, there are very similar rates of migration for those aged 14 years and under and for those aged 25 years and over. During the peak migration years, however, both Indigenous and non-Indigenous females have higher rates of migration than their male counterparts. This higher rate of mobility for females was also found in previous censuses (Biddle & Yap 2010).
7. Geography
There are two key aspects of the geographic distribution of the Indigenous population that are of relevance for service delivery and broader policy settings. First, Indigenous Australians are relatively more likely to live in remote parts of the country than the non-Indigenous population. Although estimates aren’t currently available for the 2011 Census, in 2006 around 1.2 per cent of the total population in major cities were estimated to be Indigenous. This is compared to 15.2 and 47.5 per cent of remote and very remote Australia respectively. In absolute terms, however, the Indigenous population is still quite urbanised. Using the same geographic hierarchy, 75.4 per cent of the total Indigenous population in 2006 lived in a major city or regional area.
Figure 12 demonstrates this difference in the absolute and relative distribution of the Indigenous population using a much finer level of geography, the Indigenous Region. The shading refers to the percentage of the population in the region who were estimated to be Indigenous, ranging from less than the national average (3.0%) in the lightest shading to more than half of the population (the darkest shading). The numbers after the Indigenous Region name refer to the percentage of the total Indigenous population count that identified the region as their place of usual residence on the night of the census.
There are two key points that emerge from Figure 12. First, it is in relatively remote regions (predominantly in the Northern Territory, Western Australia and Queensland) that the share of the population who identify as being Indigenous is highest. There are 10 regions where more than half of the population counted in the 2011 Census identified as being Indigenous, with the Torres Strait (84.8%), Apatula (80.5%) and Jabiru–Tiwi (79.3%) all having more than three out of every four usual residents being Indigenous.
While it is remote regions in north, central and western parts of the country that have the highest percentage of the population being Indigenous, the regions with the greatest absolute number of Indigenous Australians are in the south and the east of the country. The Brisbane, New South Wales Central and North Coast, and Sydney–Wollongong regions all have an Indigenous population estimate of 60,000 or more, whereas most of the remote regions have populations of around 10,000 Indigenous Australians or less. In essence, the Indigenous population in 2011 was estimated to be relatively remote (in comparison to the non-Indigenous population), but in absolute terms quite urban.

0 5 P O PU L AT I O N A N D AG E ST R U CT U R E 15
8. Urbanisation
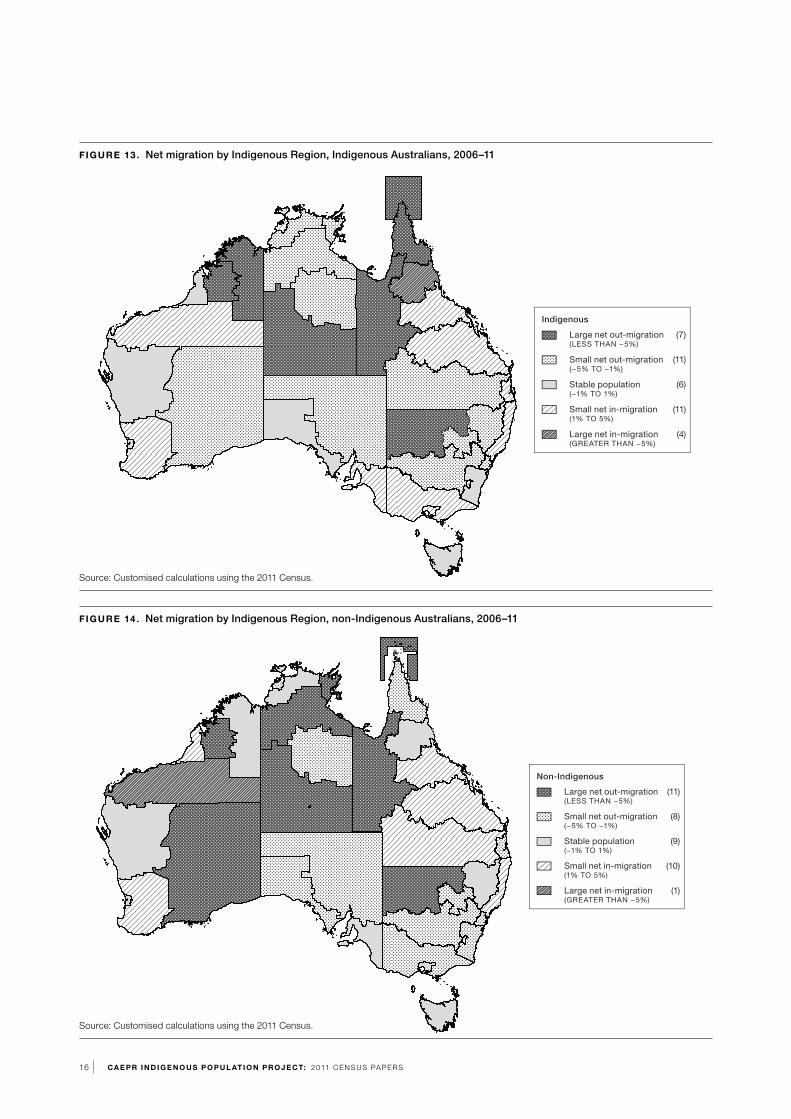
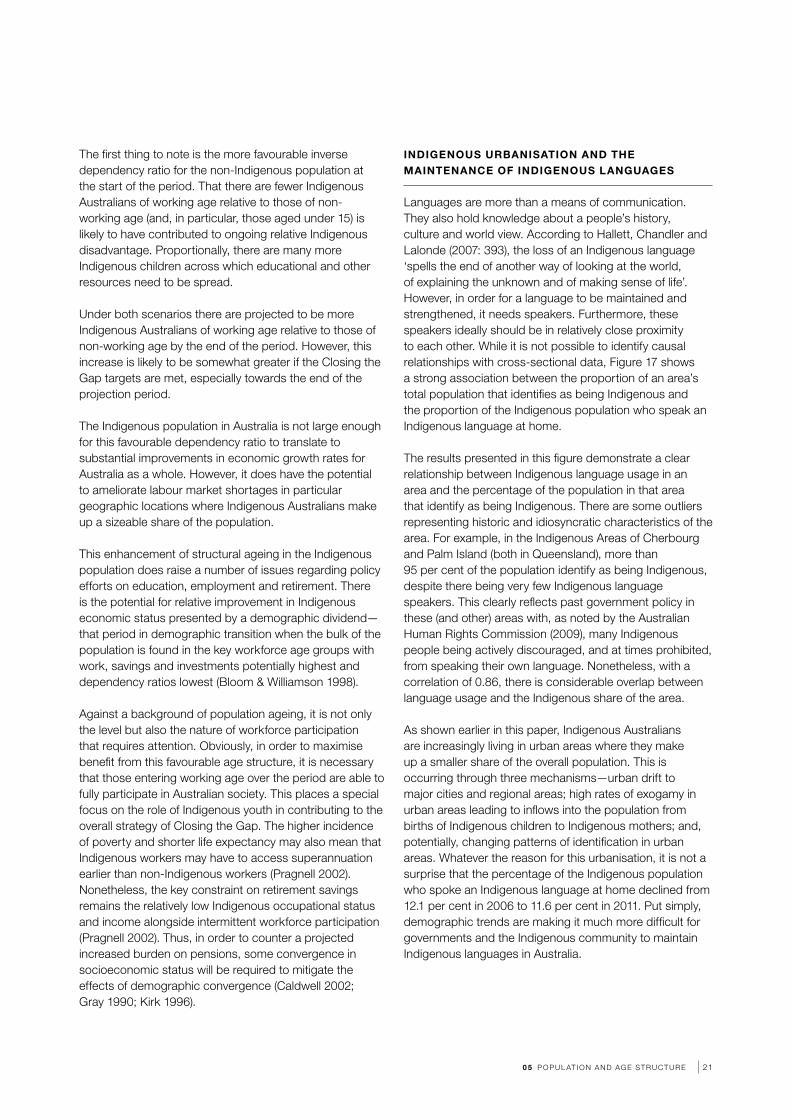
Just as the Indigenous population is likely to experience a process of structural ageing over the next few decades, the population is also likely to become more urbanised. This is driven by two factors. First, there appears to be a steady out-migration of the Indigenous population from remote areas to regional centres and major cities. This was found between 2001 and 2006 (Biddle 2009b), as well as over the most recent intercensal period. This is shown in Figures 13 and 14 which show the net migration rates for Indigenous regions between 2006 and 2011 for the Indigenous and non-Indigenous populations respectively. These rates are calculated as the difference in the number of people who moved into the region and those who moved out of the region over the last intercensal period, expressed as a percentage of the base population.
As the base period is 2006, rates are calculated for those born prior to the 2006 Census. That is, those aged five years and over in 2011. Also excluded from the base population are those who did not state their place of usual residence in 2011, as well as those who in the 2011 Census did not state their place of usual residence five years earlier (that is, in 2006).
FIGURE 12 . Percentage of Indigenous Region who were estimated to be Indigenous (shading) and percentage of total count
of Indigenous Australians (text), 2011
South-Western WA(2.0%)
Broome (0.8%)
West Kimberley(0.8%)
Kununurra(1.0%)
Darwin (2.1%)
Jabiru–Tiwi(1.9%)
Nhulunbuy(1.7%)
Katherine(1.6%)
TennantCreek(0.7%)
MountIsa
(1.3%)Apatula (1.5%)
Alice Springs (0.9%)
Toowoomba–Roma(2.8%)
Brisbane (9.7%)
NSW Central & North Coast (9.5%)
North-Eastern NSW (3.1%)
Dubbo (2.1%)
Jervis Bay (0.0%)
Sydney–Wollongong (9.5%)
ACT (0.9%)
South-Eastern NSW (2.0%)
Tasmania (3.6%)
Melbourne(3.3%)
Victoria excl.Melbourne (3.8%)
Riverina −Orange(3.7%)
Adelaide(3.8%)
Port Lincoln −Ceduna(0.4%)
North-Western
NSW (1.4%)
Rockhampton(3.4%)
Townsville – Mackay(4.1%)
Cairns – Atherton (4.3%)
Cape York (1.6%)
Torres Strait (1.1%)
Port Augusta(1.3%)
Perth (4.9%)
Kalgoorlie(1.1%)
Geraldton1.2%
South Hedland (1.4%)
Less than 3% (7)
3−10% (10)
10−50% (11)
50% or more (10)
Source: Customised calculations using the 2011 Census.
16 CA E PR I N D I G E N O U S P O PU L AT I O N PR O J E C T: 2011 C EN SU S PA PER S
FIGURE 14 . Net migration by Indigenous Region, non-Indigenous Australians, 2006–11
Stable population (9)(−1% TO 1%)
Small net out-migration (8)(−5% TO −1%)
Small net in-migration (10)(1% TO 5%)
Large net out-migration (11)(LESS THAN −5%)
Large net in-migration (1)(GREATER THAN −5%)
Non-Indigenous
Source: Customised calculations using the 2011 Census.
FIGURE 13 . Net migration by Indigenous Region, Indigenous Australians, 2006–11
Source: Customised calculations using the 2011 Census.
Stable population (6)(−1% TO 1%)
Small net out-migration (11)(−5% TO −1%)
Small net in-migration (11)(1% TO 5%)
Large net out-migration (7)(LESS THAN −5%)
Large net in-migration (4)(GREATER THAN −5%)
Indigenous

0 5 P O PU L AT I O N A N D AG E ST R U CT U R E 17
Figure 13 shows that those regions which experienced large rates of outward migration of the Indigenous population tended to be in remote parts of New South Wales or across the far north and centre of the country. Between 2006 and 2011, around 13.8 per cent (in net terms) of the Indigenous population of the Torres Strait Indigenous Region left for other parts of the country. The next highest rate of outward migration was Mount Isa with a rate of –7.9 per cent, followed by North-Western New South Wales (–6.5%), Kununurra (–6.2%), Cape York (–5.6%), Apatula (–5.5%) and West Kimberley (–5.1%).
For both the Indigenous and non-Indigenous populations, those areas with high rates of net inward migration tended to be in less remote parts of the country. For the Indigenous population, however, the most urbanised regions did not have the highest net inward migration. In net terms, there was an inflow of the Indigenous population into Alice Springs equal to 6.5 per cent of the 2006 population. Cairns–Atherton also experienced a relatively large net inflow, equal to 5.7 per cent of the 2006 population.
A second reason for higher increases in urban areas relates to exogamy. Specifically, while Indigenous female fertility rates tend to be evenly spread across the country, most of the births of Indigenous children to non-Indigenous mothers occur in urban parts of the country. This is due mainly to the relatively high rates of intermarriage in these areas, as documented by Heard, Birrell and Khoo (2009).
Taken together, projections in Biddle and Taylor (2009) suggest that the Indigenous population in major cities will increase by 34.0 per cent between 2006 and 2016 compared to 8.8 per cent for the Indigenous population in very remote areas. Early results from the 2011 Census suggest that, if anything, these spatial patterns are intensifying. This is demonstrated in Figure 15, which shows the change in the number of Indigenous Australians who were identified as being Indigenous between 2006 and 2011 for each Indigenous Region. Dark hatched regions are those which grew by 30 per cent or more over the period (that is, faster than for Australia as a whole). Lighter hatched regions are those which grew over the period, but did so at a slower rate (between 10 and 30%). Regions in light grey are those that were relatively stable over the period (that is, there was a 0–10% increase), with
FIGURE 15 . Change in the Indigenous population count by Indigenous Region, 2006–11
Population decline (1)
Negligible increase (6)(LESS THAN 10%)
Large increase (14)(30% OR MORE)
Legend
Small increase (17)(10–30%)
Source: Customised calculations based on the 2006 and 2011 Censuses.

18 CA E PR I N D I G E N O U S P O PU L AT I O N PR O J E C T: 2011 C EN SU S PA PER S
the dotted regions those that decline in terms of their Indigenous population estimate.3
Figure 15 demonstrates that the regions that experienced an Indigenous population decline or negligible increase were in relatively remote parts of the country, and those that experienced a rapid increase tended to be in urban parts of the country. The results tend to support a process of urbanisation of the Indigenous population over the last intercensal period.
Comparing Figures 13 and 15, we can see that there is a strong relationship between migration and population change. This is what one would expect—in a closed population, at the regional level population changes are mainly driven by the movement of people. However, with a correlation of 0.49 for the Indigenous population, this relationship is far from perfect.
Two good examples of the inconsistent relationship between migration and population change are Alice Springs and Darwin. Both of these regions had positive net inward migration but only a small population increase. At the other extreme, Dubbo had net outward migration but a very large population increase. Clearly, although migration is important in explaining population change, there are a number of other important determinants with a large amount of further research necessary.
3. It should be noted that changes in the Indigenous Region boundaries have been taken into account by using a quasi-population concordance that converts 2006 Indigenous Areas into 2011 Indigenous Regions.
9. Summary and discussion of policy implications
This paper identified six key aspects of current Indigenous demography and geography. A summary of these issues are given below:
• Age structure—The Indigenous population is relatively young. According to the most recent (2011) Census counts, the median age of the Indigenous population is 21 years compared to 38 years for the non-Indigenous population.
• Population change—The Indigenous population is increasing at a much faster rate than the non-Indigenous population. The Indigenous population count increased by 20.5 per cent over the last intercensal period, with an even greater increase in the estimated resident population.
• Structural ageing—The Indigenous population is ageing and projected to age even faster over the next few decades. The proportion of Indigenous Australians aged 55 years and over increased from 7.7 per cent in 2006 to 9.5 per cent in 2011.
• Mobility—Indigenous Australians are more likely to be away from their place of usual residence at a given point in time and also more likely to make permanent moves. Around 6.9 per cent of all Indigenous Australians were away from home on the night of the census compared to 4.4 per cent of non-Indigenous Australians. Around 20.3 per cent of the Indigenous population reported a different usual residence in 2011 than in 2010, substantially higher than the 14.4 per cent of the non-Indigenous population who moved over the same period.
• Geography—The Indigenous population is much more likely to live in remote and very remote Australia relative to the non-Indigenous population. In absolute terms though, the Indigenous population is quite urbanised, with 28.8 per cent of the total Indigenous population in 2011 estimated to be living in the small coastal band between Sydney and Brisbane.
• Urbanisation—The greatest increase over the last intercensal period occurred in relatively urbanised regions and the Indigenous population is likely to become more urban over the next few decades.

0 5 P O PU L AT I O N A N D AG E ST R U CT U R E 19
These demographic and geographic characteristics and trends have clear relevance beyond academic debate. This includes not only policy formulation and evaluation, but also the understanding that Indigenous Australians themselves have about their own population dynamics. In the remainder of this section, I discuss some of these implications through examples across the policy areas of housing, disability, education and Indigenous languages.
RELATIVE VERSUS ABSOLUTE NEED
Published research from analysis of 2006 Census data (Biddle 2009a; Steering Committee for the Review of Government Service Provision 2011) show that Indigenous Australians in relatively remote parts of the country tend to have worse socioeconomic outcomes than those in regional or urban parts of the country. Although there may have been some change over the last intercensal period, initial analysis of socioeconomic data from the 2011 Census suggests that the broad patterns remain. There are exceptions—for example, Biddle (2009a) showed that there were a number of suburbs in Australia’s large capital cities where Indigenous socioeconomic outcomes were comparable to those in remote towns and outstations. Furthermore, research presented in Biddle (2011) showed that some measures of subjective wellbeing were in fact higher in remote than non-remote areas.
In order for the government to meet its Closing the Gap targets (which focus on life expectancy, education and employment), the gap in outcomes tends to be largest in remote parts of the country. However, results presented in this paper reinforced the fact that most Indigenous Australians live in urban and regional parts of the country. Because of this population distribution, most Indigenous Australians for whom outcomes need to be improve will be in urban areas. A good example of this policy trade-off relates to housing and overcrowding. Specifically, although the highest rates of overcrowding were found in remote regions (Biddle 2012a), the regions with the highest absolute number of Indigenous households needing additional bedrooms were in the east and south-east of the country. Together, 27.0 per cent of all Indigenous households that were deemed to need an additional bedroom were in the three regions running from Sydney–Wollongong, to North-Eastern New South Wales and up to Brisbane. That is about 1.65 times as many households needing additional bedrooms in the whole of the Northern Territory, and 0.8 times as many as the whole of the Northern Territory, South Australia and Western Australia combined.
CURRENT AND FUTURE AGE STRUCTURE AND
INDIGENOUS SERVICE PROVISION
A number of government services and policy areas are age-specific. This might be because these services are only demanded at particular points across the lifecourse (for example preschool) or because age cut-offs are used to decide whether a person will be eligible for one particular service or another. A good example of the latter is the proposed National Disability Insurance Scheme (NDIS). The scheme, as it is currently proposed by the Productivity Commission (2011), will provide individualised packages of support and care for individuals with significant care and support needs from a disability that is permanent (even if it is episodic as opposed to chronic). The NDIS proposed by the Productivity Commission will cut off at the age of 65.
A first point to note is that, as levels of disability tend to increase with age, the current age structure of the Indigenous population will be having a moderating effect on the extent to which the Indigenous population will be directly affected by the scheme. The second point though is that the younger disability profile of the Indigenous population means that those Indigenous Australians with a disability will be more likely to use the NDIS rather than the aged care system relative to the non-Indigenous population with a disability.
A final point to note with regards to the NDIS though is that, given the structural ageing of the Indigenous population already underway and likely to increase into the future, there is likely to be a greater proportion of Indigenous Australians at the upper end of the age distribution covered by the NDIS (that is, those aged 50–64 years), thereby increasing the number of Indigenous Australians in scope of the scheme, especially in the next 15 to 20 years.
DEMOGRAPHIC DIVIDEND OR DISASTER
The timing of the structural ageing of the Indigenous population has implications beyond a single policy area. Specifically, before reaching old age there are likely to be enhanced rates of growth in the populations of prime working age and reduced growth in the infant and school-age groups. To demonstrate this, the number of people aged 15–64 years relative to those under 15 or 65 years and over (the inverse dependency ratio) from a set of projections in Biddle and Taylor (2009) is shown in Figure 16. This is done for two projection scenarios: current Indigenous rates of mortality and fertility holding throughout the period; and a convergence in these rates to non-Indigenous rates by the end of the period. For comparison, the current and projected ratio for the non-Indigenous population is also indicated.

20 CA E PR I N D I G E N O U S P O PU L AT I O N PR O J E C T: 2011 C EN SU S PA PER S
FIGURE 16 . Indigenous and non-Indigenous inverse dependency ratios, 2006–31
FIGURE 17 Indigenous language usage by Indigenous share of the Indigenous Area, 2011
Year
2006 2011 20212016 2026 20310
0.5
1.0
1.5
2.0
2.5
Inve
rse
de
pe
nd
en
cy r
atio
Convergence in rates
Non-Indigenous comparison
Indigenous rates throughout
0
10
20
30
40
50
60
70
80
90
100
0 20 40 60 80 100
Pe
rce
nta
ge
of
Ind
ige
no
us
po
pu
lati
on
wh
o s
pea
ka
n In
dig
en
ou
s la
ng
uag
e at
ho
me
Percentage of Indigenous Area population who identify as being Indigenous
Source: Biddle and Taylor 2012.
Source: Biddle 2012b.
0 5 P O PU L AT I O N A N D AG E ST R U CT U R E 21
The first thing to note is the more favourable inverse dependency ratio for the non-Indigenous population at the start of the period. That there are fewer Indigenous Australians of working age relative to those of non-working age (and, in particular, those aged under 15) is likely to have contributed to ongoing relative Indigenous disadvantage. Proportionally, there are many more Indigenous children across which educational and other resources need to be spread.
Under both scenarios there are projected to be more Indigenous Australians of working age relative to those of non-working age by the end of the period. However, this increase is likely to be somewhat greater if the Closing the Gap targets are met, especially towards the end of the projection period.
The Indigenous population in Australia is not large enough for this favourable dependency ratio to translate to substantial improvements in economic growth rates for Australia as a whole. However, it does have the potential to ameliorate labour market shortages in particular geographic locations where Indigenous Australians make up a sizeable share of the population.
This enhancement of structural ageing in the Indigenous population does raise a number of issues regarding policy efforts on education, employment and retirement. There is the potential for relative improvement in Indigenous economic status presented by a demographic dividend—that period in demographic transition when the bulk of the population is found in the key workforce age groups with work, savings and investments potentially highest and dependency ratios lowest (Bloom & Williamson 1998).
Against a background of population ageing, it is not only the level but also the nature of workforce participation that requires attention. Obviously, in order to maximise benefit from this favourable age structure, it is necessary that those entering working age over the period are able to fully participate in Australian society. This places a special focus on the role of Indigenous youth in contributing to the overall strategy of Closing the Gap. The higher incidence of poverty and shorter life expectancy may also mean that Indigenous workers may have to access superannuation earlier than non-Indigenous workers (Pragnell 2002). Nonetheless, the key constraint on retirement savings remains the relatively low Indigenous occupational status and income alongside intermittent workforce participation (Pragnell 2002). Thus, in order to counter a projected increased burden on pensions, some convergence in socioeconomic status will be required to mitigate the effects of demographic convergence (Caldwell 2002; Gray 1990; Kirk 1996).
INDIGENOUS URBANISATION AND THE
MAINTENANCE OF INDIGENOUS LANGUAGES
Languages are more than a means of communication. They also hold knowledge about a people’s history, culture and world view. According to Hallett, Chandler and Lalonde (2007: 393), the loss of an Indigenous language ‘spells the end of another way of looking at the world, of explaining the unknown and of making sense of life’. However, in order for a language to be maintained and strengthened, it needs speakers. Furthermore, these speakers ideally should be in relatively close proximity to each other. While it is not possible to identify causal relationships with cross-sectional data, Figure 17 shows a strong association between the proportion of an area’s total population that identifies as being Indigenous and the proportion of the Indigenous population who speak an Indigenous language at home.
The results presented in this figure demonstrate a clear relationship between Indigenous language usage in an area and the percentage of the population in that area that identify as being Indigenous. There are some outliers representing historic and idiosyncratic characteristics of the area. For example, in the Indigenous Areas of Cherbourg and Palm Island (both in Queensland), more than 95 per cent of the population identify as being Indigenous, despite there being very few Indigenous language speakers. This clearly reflects past government policy in these (and other) areas with, as noted by the Australian Human Rights Commission (2009), many Indigenous people being actively discouraged, and at times prohibited, from speaking their own language. Nonetheless, with a correlation of 0.86, there is considerable overlap between language usage and the Indigenous share of the area.
As shown earlier in this paper, Indigenous Australians are increasingly living in urban areas where they make up a smaller share of the overall population. This is occurring through three mechanisms—urban drift to major cities and regional areas; high rates of exogamy in urban areas leading to inflows into the population from births of Indigenous children to Indigenous mothers; and, potentially, changing patterns of identification in urban areas. Whatever the reason for this urbanisation, it is not a surprise that the percentage of the Indigenous population who spoke an Indigenous language at home declined from 12.1 per cent in 2006 to 11.6 per cent in 2011. Put simply, demographic trends are making it much more difficult for governments and the Indigenous community to maintain Indigenous languages in Australia.

22 CA E PR I N D I G E N O U S P O PU L AT I O N PR O J E C T: 2011 C EN SU S PA PER S
References
Australian Bureau of Statistics (ABS) 2008. Population Characteristics: Aboriginal and Torres Strait Islander Australians, 2006, cat. no. 4713.0, ABS, Canberra.
—— 2009a. Births, Australia, 2008, cat. no. 3301.0, ABS, Canberra.
—— 2009b. Experimental Life Tables for Aboriginal and Torres Strait Islander Australians, 2005–2007, cat. no. 3302.0.55.003, ABS, Canberra.
—— 2009c. Experimental Estimates and Projections, Aboriginal and Torres Strait Islander Australians, cat. no. 3238.0, ABS, Canberra.
—— 2010 Census Data Enhancement Project: An Update, Oct 2010 cat. no. 2062.0
—— 2012. Australian Demographic Statistics, Mar 2012 ABS cat. no. 3101.0_001_201203
Australian Human Rights Commission 2009. Social Justice Report 2009, Aboriginal and Torres Strait Islander Social Justice Commissioner, viewed 6 September 2012, <http://www.humanrights.gov.au/social_justice/sj_report/sjreport09/>.
Bell, M. 2004. Measuring Temporary Mobility: Dimensions and Issues, Discussion Paper 2004/01, Queensland Centre for Population Research, School of Geography, Planning and Architecture, The University of Queensland.
Biddle 2009a. ‘Ranking regions: Revisiting an index of relative socioeconomic outcomes’, Australasian Journal of Regional Studies, 15 (3): 329–353.
—— 2009b. ‘The geography and demography of Indigenous migration: Insights for policy and planning’, CAEPR Working Paper No. 58, CAEPR, ANU, Canberra.
—— 2011 . ‘Measuring and analysing wellbeing’, Lecture 2, Measures of Indigenous Wellbeing and Their Determinants Across the Lifecourse, 2011 CAEPR Lecture Series, CAEPR, ANU, Canberra.
—— 2012a. ‘Indigenous Housing Need’, Paper 3, CAEPR Indigenous Population Project 2011 Census Papers, CAEPR, ANU, Canberra.
—— 2012b. ‘Indigenous Language Usage’, Paper 1, CAEPR Indigenous Population Project 2011 Census Papers, CAEPR, ANU, Canberra.
—— and Taylor, J. 2009. ‘Indigenous population projections, 2006–31: Planning for growth’, CAEPR Working Paper No. 56, CAEPR, ANU, Canberra.
—— and Taylor, J. 2012. ‘Demographic Consequences of the “Closing the Gap” Indigenous Policy in Australia’, Population Research and Policy Review, 31 (4): 571–85.
Biddle, N. and Yap, M. 2010. Demographic and Socioeconomic Outcomes across the Indigenous Lifecourse: Evidence from the 2006 Census, CAEPR Research Monograph No. 31, ANU E Press, Canberra.
Bloom, D.E. and Williamson, J.G. 1998. ‘Demographic transitions and economic miracles in emerging Asia’, World Bank Economic Review, 12: 419–465.
Broome, R. 2010. Aboriginal Australians: A History since 1788, Allen and Unwin, Sydney.
Caldwell, J.C. 2002. ‘Aboriginal society and the global demographic transition’ in G. Briscoe and L. Smith (eds), The Aboriginal Population Revisited: 70,000 Years to the Present, Aboriginal History Monograph No. 10, Aboriginal History Inc., Canberra.
Cook, T. 1996. ‘When ERPs aren’t enough – A discussion of issues associated with service population estimation’, Demography Working Paper 96/4, cat. no. 3112.0, ABS, Canberra.
Department of Aboriginal Affairs (DAA) (1981), Report on a Review of the Administration of the Working Definition of Aboriginal and Torres Strait Islanders, Commonwealth of Australia, Canberra, cited in J. Gardiner-Garden, The Definition of Aboriginality: Research Note 18, 2000–01 (2000) Parliament of Australia, 2.
Department of Families, Housing, Community Services and Indigenous Affairs (FaHCSIA) 2009. Closing the Gap on Indigenous Disadvantage: The Challenge for Australia, FaHCSIA, Canberra.

0 5 P O PU L AT I O N A N D AG E ST R U CT U R E 23
Gray, A. 1990. ‘Aboriginal fertility: Trends and prospects’, Journal of the Australian Population Association, 7 (1): 57–77.
Hallett, D., Chandler, M.J. and Lalonde, C.E. 2007. ‘Aboriginal language knowledge and youth suicide’, Cognitive Development, 22 (3): 392–399.
Heard, G., Birrell, B. and Khoo, S-E. 2009. ‘Intermarriage between Indigenous and non-Indigenous Australians’, People and Place, 17 (1): 15–28.
Kinfu, Y. and Taylor, J. 2005. ‘On the components of Indigenous population change’, Australian Geographer, 36 (2): 233–55.
Kirk, D. 1996. ‘Demographic transition theory’, Population Studies, 50 (3): 361–387.
Pragnell, B. 2002. ‘Superannuation policy issues for Indigenous Australians: Scope for reform’, Australian Universities Review, 45 (1): 33–36.
Productivity Commission 2011. Disability Care and Support, Report No. 54, Productivity Commission, Canberra.
Prout, S. 2008. ‘On the move? Indigenous temporary mobility practices in Australia’, CAEPR Working Paper No. 48, CAEPR, ANU, Canberra.
Sanders, W. 1993. ‘The rise and rise of the CDEP scheme: An Aboriginal ‘workfare’ program in times of persistent unemployment’, CAEPR Discussion Paper No. 54, CAEPR, ANU, Canberra.
Steering Committee for the Review of Government Service Provision (SCRGSP) 2011. Overcoming Indigenous Disadvantage: Key Indicators 2009, Productivity Commission, Canberra.
Smith, L.R. 1980. The Aboriginal Population of Australia, ANU Press, Canberra.
Taylor, J. and Biddle, N. 2010. ‘Estimating the accuracy of geographic variation in Indigenous population counts’, Australian Geographer, 41 (4): 469–484.
Yap, M. and Biddle, N. 2012. ‘Indigenous Fertility and Family Formation’, CAEPR Indigenous Population Project 2011 Census Paper No. 2, CAEPR, ANU, Canberra.

Centre for Aboriginal Economic Policy ResearchThe Australian National UniversityActon ACT 0200 AustraliaT 61 2 6125 8206F 61 2 6125 9730http://caepr.anu.edu.au/population/censuspapers.php