cadmium accumulation in chicory and ryegrass with ...flrc/workshops/18/... · chicory. together...
TRANSCRIPT
Stafford, A., Jeyakumar, P., Hedley, M., Anderson, C., 2018. Cadmium accumulation in chicory and ryegrass with modification of soil pH. In: Farm environmental planning – Science, policy and practice. (Eds L. D. Currie and C. L. Christensen).
http://flrc.massey.ac.nz/publications.html. Occasional Report No. 31. Fertilizer and Lime Research Centre, Massey University, Palmerston
North, New Zealand. 15 pages.
1
CADMIUM ACCUMULATION IN CHICORY AND RYEGRASS WITH
MODIFICATION OF SOIL pH
Aaron Stafford1, Paramsothy Jeyakumar2, Mike Hedley2 and Chris Anderson2
1Ballance Agri-Nutrients, Private Bag 12503, Tauranga 3143, New Zealand
2School of Agriculture & Environment, Massey University,
Private Bag 11 222, Palmerston North 4442, New Zealand
Email: [email protected]
Abstract
Field trials were established in two contrasting soils (Kereone [total Cd 1.12 mg kg-1, pH
6.1]; and Topehaehae [total Cd 0.67 mg kg-1, pH 6.1]) to evaluate the effect of soil pH
modification on soil Cd phytoavailability and Cd accumulation in chicory (Cichorium
intybus) and perennial ryegrass (Lolium perenne). Mean tissue Cd concentrations for chicory
in both the Kereone and Topehaehae soils (2.265 and 2.701 mg kg-1 DM, respectively) were
significantly (P < 0.001) greater than those for ryegrass (0.142 and 0.113 mg kg-1 DM,
respectively). Ultra-fine elemental sulphur and hydrated lime treatments were effective in
producing a wide range in soil pH (approximately 5.0-6.5) in both soils. There was a strong
negative (linear) correlation between 0.05 M CaCl2 soil extractable Cd concentration and pH
in both soils (R2 = 0.82 and 0.64 for the Kereone and Topehaehae soils, respectively).
Correspondingly, plant tissue Cd concentrations were negatively correlated to soil pH
(chicory R2 = 0.52 and 0.35, and ryegrass R2 = 0.42 and 0.19, for the Kereone and
Topehaehae soils, respectively). However, the correlation between plant tissue Cd
concentration and soil extractable Cd concentration was weak (R2 = 0.11 and 0.28 for chicory
and ryegrass, respectively), indicating that 0.05 M CaCl2 soil extractable Cd is a poor
predictor of soil Cd phytoavailability across different soil types. As ryegrass tissue Cd
concentrations remained low (<0.3 mg kg-1) across the entire pH range imposed, there
appears little risk of increased animal dietary Cd exposure when grazing this plant species,
even in Cd-enriched soils at low pH. In contrast, this trial indicates that soil pH should be
increased to a minimum pH of 6.5 to decrease animal dietary Cd exposure risk when grazing
chicory.
Introduction
Soil pH is generally considered to be the dominating factor influencing metal sorption and
solubility in soils (Bolan et al., 1999; Christensen and Haung, 1999; Gray et al., 1999c;
Loganathan et al., 2012; Young, 2012). Many researchers have shown increased heavy metal
sorption and decreased solubility with increasing soil pH (Tiller et al., 1984; Boekhold et al.,
1993; Naidu et al., 1994; Gray et al., 1998, 1999b, c; Srivastava et al., 2005; Vasconcelos et
al., 2008). In particular, this is the case for soils dominated by variable charge clays and/or
high organic matter content, since the specific sorption capacity of these soils will be more
sensitive to change in pH (Bolan et al., 2003; Loganathan et al., 2012). Liming of acid soils is
therefore considered one of the most practical and cost-effective means of decreasing plant
tissue Cd accumulation (Bolan, 1996; Grant et al., 1999; Young, 2012).

2
Despite the mechanisms between soil pH and Cd phytoavailability being proven under
controlled glasshouse conditions (Maier et al., 1997; Gray et al., 1999b; Maier et al., 2002)
the effect of liming on plant Cd accumulation has often been inconsistent when tested in the
field (Andersson and Siman, 1991; Sparrow et al., 1993; Li et al., 1996; Oliver et al., 1996;
Maier et al., 1997; Maier et al., 2002). This inconsistency may be explained by the time-
delay for lime to reach its maximum effect on soil pH and Cd phytoavailability, or through
differences in the depth / distribution of lime relative to Cd in the soil profile (Sparrow et al.,
1993; Sparrow and Salardini, 1997). Alternatively, as plant tissue Cd concentrations have
been reported to be inversely related to plant growth rate / yield (Mortvedt et al., 1981;
Loganathan et al., 1997; Roberts and Longhurst, 2002) it is possible that yield penalties from
agronomically-undesirable increases in soil pH may override the concurrent decrease in soil
Cd phytoavailability (Gray et al., 1999b). Lastly, increases in soil solution calcium (Ca2+)
concentration following application of agricultural lime may increase competition between
Ca2+ and Cd2+ for sorption sites, temporarily decreasing Cd2+ sorption and increasing its
phytoavailability (Boekhold et al., 1993; Bolan et al., 2003).
New Zealand agricultural soils are weakly acidic, with soil pH typically falling within the
range of 5.2-6.0 (Edmeades et al., 1985; Morton et al., 2005; Roberts and Morton, 2009). For
this reason, liming to maintain soil pH at the upper end of the crop-specific recommended
soil pH range has been advocated as a key strategy to reduce plant tissue Cd accumulation
(FANZ, 2016). However, no field-based research has been carried out in New Zealand to
evaluate the effectiveness of soil pH modification for controlling plant Cd accumulation
under local conditions.
This information could be particularly important with regard to managing Cd
phytoavailability and plant Cd accumulation for ‘accumulator’ crops such as chicory
(Stafford et al., 2016). Notably, data from a recent survey of plant tissue and soil samples
collected from commercial farming properties across New Zealand (currently unpublished)
revealed that soil pH was a significant (P < 0.01) predictor of tissue Cd concentration in
chicory. Together with soil total Cd and total C, these three variables accounted for
approximately 75% of the variability in chicory tissue Cd concentrations. The field research
trial in this chapter was therefore undertaken to quantify the impact of soil pH modification
on soil Cd phytoavailability and plant tissue Cd accumulation in chicory and ryegrass, under
field conditions.
Methodology
Two trials were established on contrasting soils (Kereone silt loam and Topehaehae sandy
clay loam (Table 1)) within a Waikato dairy farm. Suitable sites within these paddocks (e.g.
uniform topography) were pegged out, with soil samples taken across the entirety of both trial
areas.
Table 1. Description and characteristics of the soils at two trial site locations. Soil type Kereone silt loam Topehaehae sandy clay loam
New Zealand Soil Classification (NZSC) Typic Orthic Allophanic Typic Recent Gley
Total Cd (mg kg-1) 1.12 0.67
Total P (mg kg-1) 1909 924
Total C (%) 6.7 3.3
P retention (%) 87 43
CEC (meq 100g-1) 26 17
pH 6.1 6.1
pH buffer capacity (mmol H+ kg-1 pH-1) 29.4 16.8
Olsen-P (mg L-1) 19 20
3
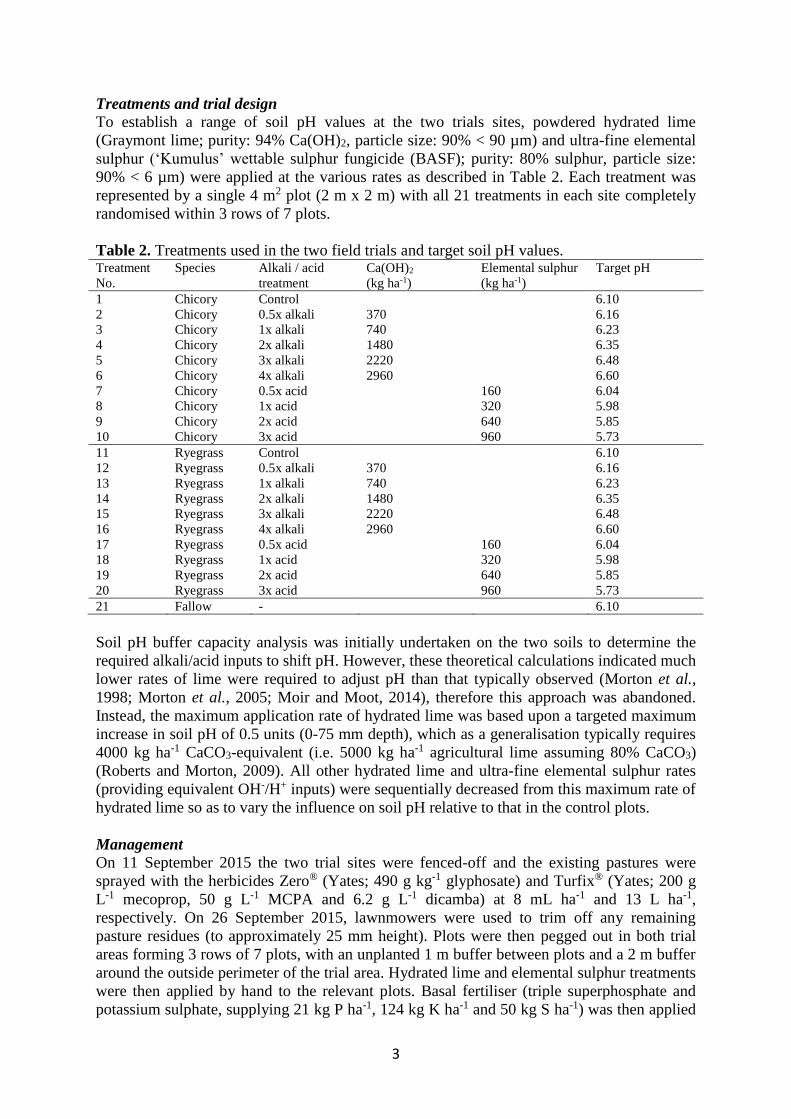
Treatments and trial design
To establish a range of soil pH values at the two trials sites, powdered hydrated lime
(Graymont lime; purity: 94% Ca(OH)2, particle size: 90% < 90 µm) and ultra-fine elemental
sulphur (‘Kumulus’ wettable sulphur fungicide (BASF); purity: 80% sulphur, particle size:
90% < 6 µm) were applied at the various rates as described in Table 2. Each treatment was
represented by a single 4 m2 plot (2 m x 2 m) with all 21 treatments in each site completely
randomised within 3 rows of 7 plots.
Table 2. Treatments used in the two field trials and target soil pH values. Treatment
No.
Species Alkali / acid
treatment
Ca(OH)2
(kg ha-1)
Elemental sulphur
(kg ha-1)
Target pH
1 Chicory Control 6.10
2 Chicory 0.5x alkali 370
6.16
3 Chicory 1x alkali 740
6.23
4 Chicory 2x alkali 1480
6.35
5 Chicory 3x alkali 2220
6.48
6 Chicory 4x alkali 2960
6.60
7 Chicory 0.5x acid
160 6.04
8 Chicory 1x acid
320 5.98
9 Chicory 2x acid
640 5.85
10 Chicory 3x acid
960 5.73
11 Ryegrass Control 6.10
12 Ryegrass 0.5x alkali 370
6.16
13 Ryegrass 1x alkali 740
6.23
14 Ryegrass 2x alkali 1480
6.35
15 Ryegrass 3x alkali 2220
6.48
16 Ryegrass 4x alkali 2960
6.60
17 Ryegrass 0.5x acid
160 6.04
18 Ryegrass 1x acid
320 5.98
19 Ryegrass 2x acid
640 5.85
20 Ryegrass 3x acid 960 5.73
21 Fallow - 6.10
Soil pH buffer capacity analysis was initially undertaken on the two soils to determine the
required alkali/acid inputs to shift pH. However, these theoretical calculations indicated much
lower rates of lime were required to adjust pH than that typically observed (Morton et al.,
1998; Morton et al., 2005; Moir and Moot, 2014), therefore this approach was abandoned.
Instead, the maximum application rate of hydrated lime was based upon a targeted maximum
increase in soil pH of 0.5 units (0-75 mm depth), which as a generalisation typically requires
4000 kg ha-1 CaCO3-equivalent (i.e. 5000 kg ha-1 agricultural lime assuming 80% CaCO3)
(Roberts and Morton, 2009). All other hydrated lime and ultra-fine elemental sulphur rates
(providing equivalent OH-/H+ inputs) were sequentially decreased from this maximum rate of
hydrated lime so as to vary the influence on soil pH relative to that in the control plots.
Management
On 11 September 2015 the two trial sites were fenced-off and the existing pastures were
sprayed with the herbicides Zero® (Yates; 490 g kg-1 glyphosate) and Turfix® (Yates; 200 g
L-1 mecoprop, 50 g L-1 MCPA and 6.2 g L-1 dicamba) at 8 mL ha-1 and 13 L ha-1,
respectively. On 26 September 2015, lawnmowers were used to trim off any remaining
pasture residues (to approximately 25 mm height). Plots were then pegged out in both trial
areas forming 3 rows of 7 plots, with an unplanted 1 m buffer between plots and a 2 m buffer
around the outside perimeter of the trial area. Hydrated lime and elemental sulphur treatments
were then applied by hand to the relevant plots. Basal fertiliser (triple superphosphate and
potassium sulphate, supplying 21 kg P ha-1, 124 kg K ha-1 and 50 kg S ha-1) was then applied
4
to each plot to encourage plant establishment and support growth over the duration of the
trial. No nitrogen fertiliser was applied; this was deemed unnecessary given soils cultivated
out of ryegrass-white clover pasture typically have high N-mineralisation capacity (Francis et
al., 1992).
All plots were then cultivated to approximately 75 mm depth using a self-driven rotary hoe
(with the exception of one plot in each site that was retained as an unplanted fallow
treatment). Diploid perennial ryegrass (Excess® (PGG Wrightson seeds) with AR 37®
endophyte and Superstrike® insecticide coating) and chicory (Choice® (Grasslands seeds)
with Superstrike® insecticide coating) seeds were then mixed with soil (to act as a carrier and
aid dispersal) and then applied by hand to appropriate plots, at 20 and 6 kg ha-1, respectively.
All plots were then raked to work the applied seed into the soil, and then plots were pressed
to improve seed-to-soil contact using a hand roller. Finally, Blitzem® slugbait (Yates; 15 g
kg-1 metaldehyde) was applied at 10 kg ha-1 to avoid slug damage to emerging seedlings.
Plots were inspected on 10 October 2015, with emergence of both plant species appearing
relatively uniform. Seed was applied by hand to small areas of some plots to bolster plant
populations where initial establishment was poor. On the 26 October, plots containing chicory
were sprayed with Valdo® (Nufarm; 800 g kg-1 flumetsulam) at 65 g ha-1 and Sequence®
(Nufarm; 240 g L-1 clethodim) at 500 mL ha-1 to control broadleaf and grass weeds,
respectively. Plots containing ryegrass seedlings received the herbicide Tribal Gold®
(Nufarm; 300 g L-1 MCPB, 20 g L-1 MCPA and 10 g L-1 flumetsulam) at 5 L ha-1 to control
broadleaf weeds. All herbicides were tank-mixed with Bonza® surfactant (Nufarm; 471 g L-1
heavy paraffinic petroleum distillate) at 5 mL L-1 water, and then applied at 150 L ha-1 using
a hand-held boom sprayer fitted with flat fan nozzles. Throughout the duration of the trial,
non-vegetated buffer zones between plots and surrounding the entire trial area were
maintained using the herbicides Zero® (Yates; 490 g kg-1 glyphosate) and Turfix® (Yates; 200
g L-1 mecoprop, 50 g L-1 MCPA and 6.2 g L-1 dicamba) at 8 mL ha-1 and 13 L ha-1,
respectively.
Plant tissue harvests
Three plant tissue harvests took place through the trial duration, occurring on 18 November,
11 December and 28 December 2015. At each harvest, each treatment plot was split into four
1 m x 1 m sub-plot areas, allowing four plant tissue replicates to be collected for Cd
concentration analysis per treatment. Chicory replicates consisted of ten entire plants
(typically 100-300 g fresh weight (FW)) harvested at 30 mm height from five sub-sampling
points within the 1 m2 sub-plot area (i.e. 2 plants per sub-sampling point). Ryegrass replicates
(typically 50-150 g FW) were harvested with hand shears, collecting the leaf and stem tissue
from two parallel strips approximately 500 mm in length (harvested to 30 mm height) within
each sub-plot area, which were then bulked into a single sample per replicate.
Soil sampling
At the completion of the third (final) plant tissue harvest, the effect of each alkali/acid
treatment on soil pH and extractable Cd concentration was assessed. Five soil cores (0-150
mm depth) were collected and combined within each 1 m2 sub-plot area, providing four
replicates per treatment. These samples were also immediately couriered to Massey
University for extractable Cd concentration and pH analysis.

5
Results and Discussion
Main effect of soil type and plant species
Using data from control plots only, the mean soil extractable Cd concentration was shown to
be significantly (P = 0.002) greater for the Kereone than the Topehaehae soil, despite there
being no significant difference (P = 0.057) in soil pH (Table 3). The greater soil extractable
Cd concentration of the Kereone soil is consistent with its much greater soil total Cd
concentration (Table 1).
Table 3. Comparison between soil types (‘control’ replicates only) of mean soil pH and
extractable Cd concentration (assessed at final harvest) and mean tissue Cd concentrations for
ryegrass and chicory (assessed using data from all 3 harvests).
Variable Soil type
P value Kereone Topehaehae
Mean soil pH 6.07 5.94 0.057
Mean extractable Cd conc. (mg kg -1) 0.105 0.063 0.002
Mean ryegrass Cd conc. (mg kg -1 DM) 0.111 0.062 0.036
Mean chicory Cd conc. (mg kg -1 DM) 1.643 2.413 0.217
P value (chicory vs ryegrass) <0.001 <0.001
Mean tissue Cd concentrations in control plots were much greater (P < 0.001) for chicory
(1.643-2.413 mg kg-1 DM) than ryegrass (0.062-0.111 mg kg-1 DM) (Table 3). Ryegrass
mean tissue Cd concentration was significantly (P = 0.036) greater in the Kereone than the
Topehaehae soil, consistent with the greater soil extractable Cd concentration of the Kereone
soil. Mean chicory tissue Cd concentration was not significantly different (P = 0.217)
between the two soil types.
Effect of soil amendments on soil pH
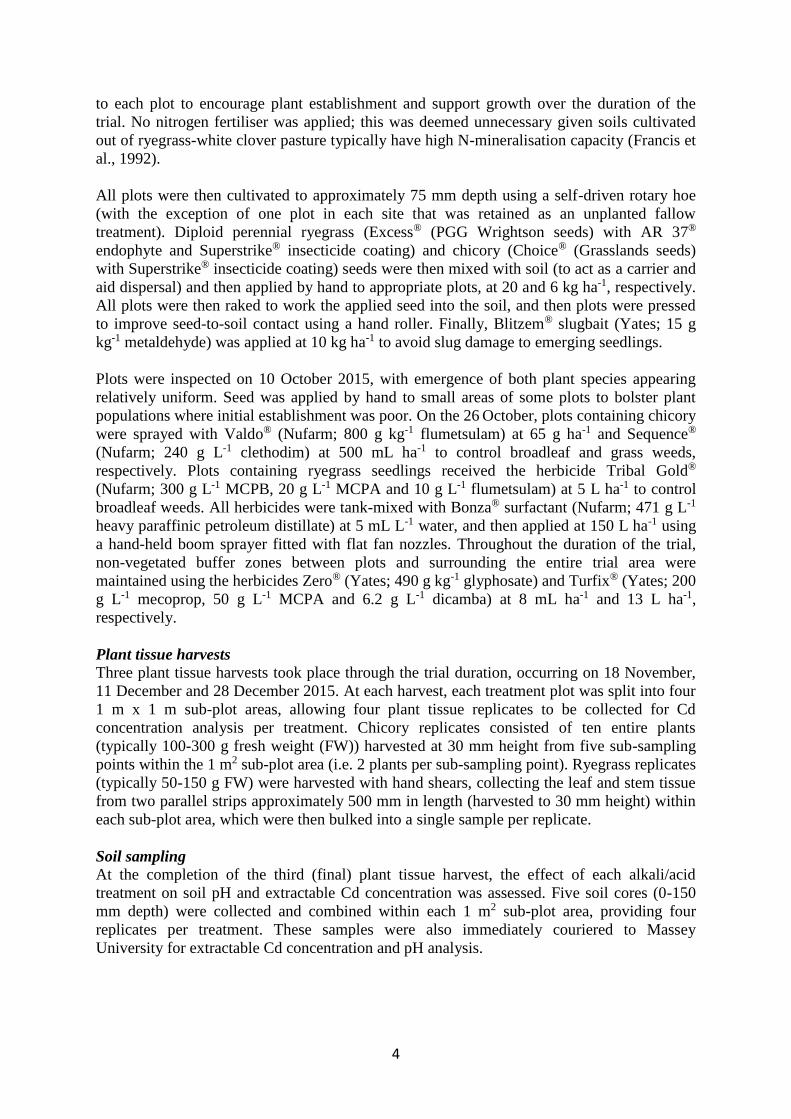
Relative to the control plots, elemental sulphur treatments drove significant (P < 0.05)
reductions in soil pH for both soil types (Figure 1). In contrast however, hydrated lime
treatments had little impact on increasing soil pH, with only the highest rate of hydrated lime
(‘4x lime’) in the Topehaehae soil driving a significant (P < 0.05) increase in soil pH relative
to the control pH (Figure 1.b). Overall, fewer treatments generated significant (P < 0.05)
changes in pH within the Kereone soil (Figure 1.a) than the Topehaehae soil (Figure 1.b),
reflecting the stronger pH buffering capacity of the Kereone soil (Table 1).
The overall lack of a significant effect on soil pH from the hydrated lime treatments was
unexpected. Hydrated lime has been successfully used by previous authors (Chaney et al.,
1977; Gray et al., 1999b; Bolan et al., 2003) to overcome the low solubility of agricultural
limestone (CaCO3) and its consequent lag-effect on Cd phytoavailability within the year of
application (Sparrow et al., 1993; Sparrow and Salardini, 1997). The maximum hydrated lime
application rate used (4000 kg ha-1 CaCO3-equivalent) was much greater than the theoretical
CaCO3-equivalent requirement to shift pH by 0.5 unit that was derived for the Kereone soil
(849 kg ha-1) and the Topehaehae soil (568 kg ha-1) from the pH buffer capacity analysis. The
lack of impact on soil pH from hydrated lime relative to that from elemental sulphur may be
the consequence of ongoing soil acidification effects related to enhanced soil organic matter
mineralisation, nitrification and nitrate leaching processes following cultivation (Ridley et al.,
1990; Bolan et al., 1991; McLaren and Cameron, 1996).
6
Figure 1. Mean change in soil pH for each acid/alkali treatment replicate relative to the mean
pH of control, assessed across plant species within each site (n = 8 for each treatment). a)
Kereone soil, and b) Topehaehae soil. Error bars represent the standard deviation. Means
with the same letter indicate differences are not significant (P < 0.05).
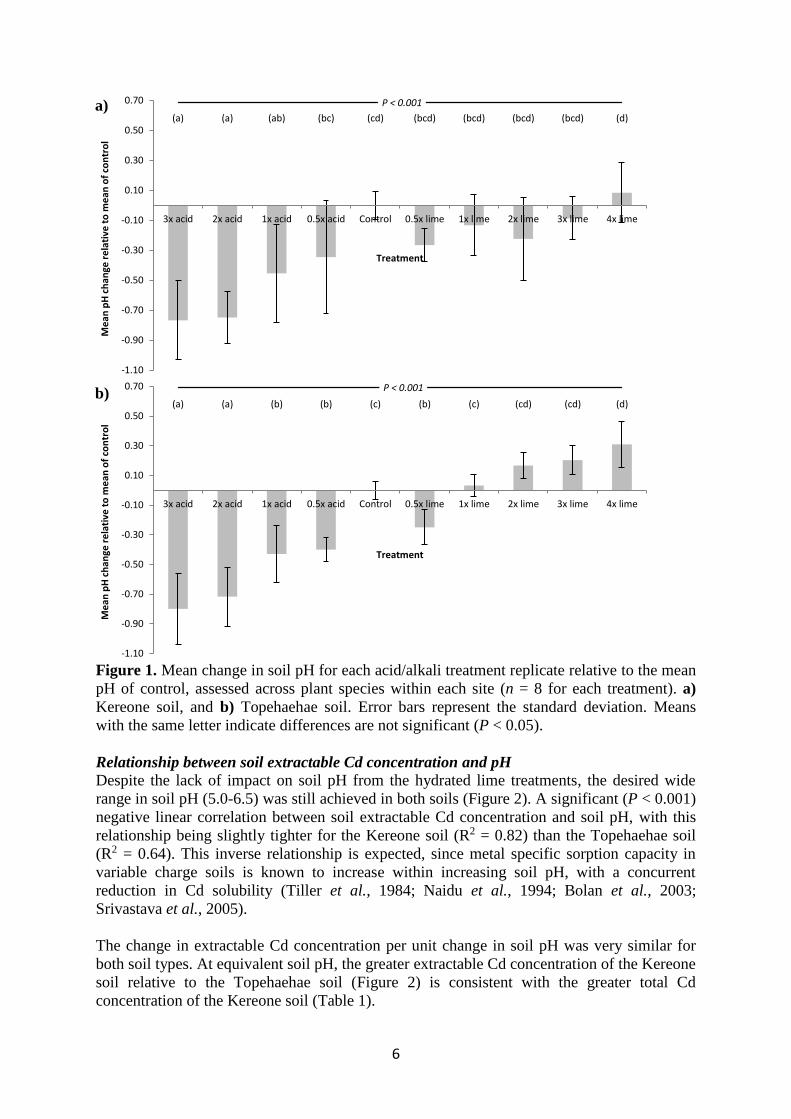
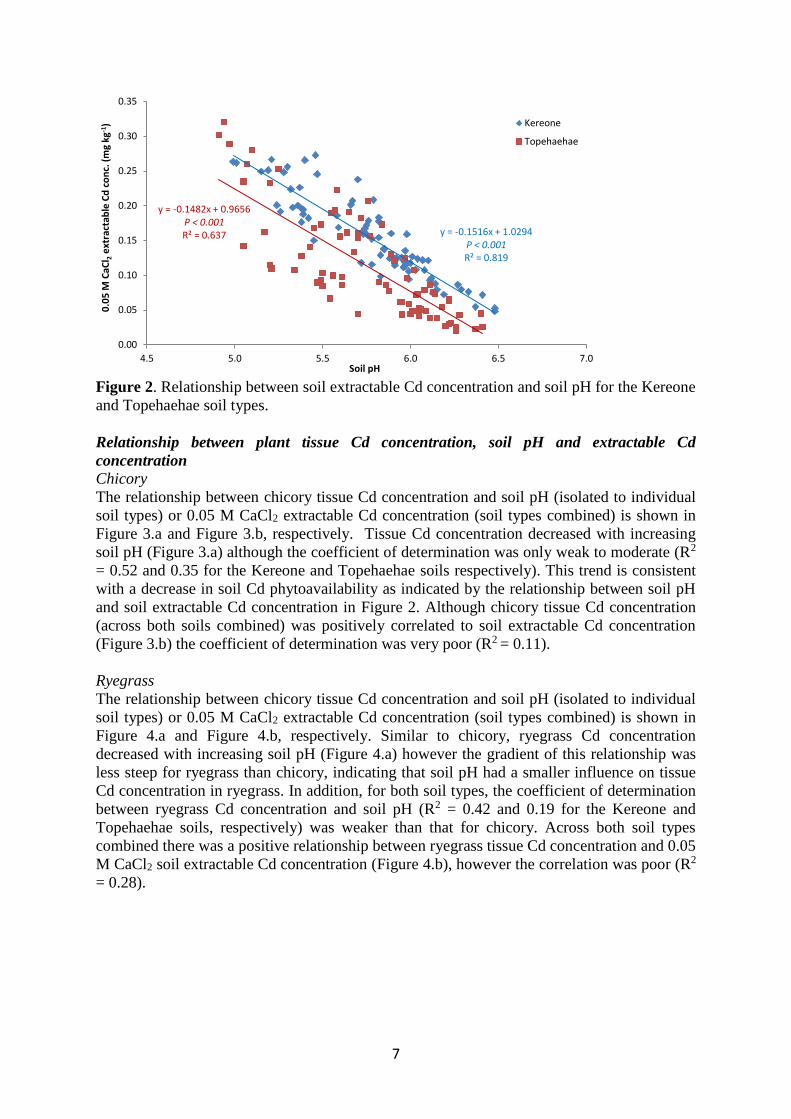
Relationship between soil extractable Cd concentration and pH
Despite the lack of impact on soil pH from the hydrated lime treatments, the desired wide
range in soil pH (5.0-6.5) was still achieved in both soils (Figure 2). A significant (P < 0.001)
negative linear correlation between soil extractable Cd concentration and soil pH, with this
relationship being slightly tighter for the Kereone soil (R2 = 0.82) than the Topehaehae soil
(R2 = 0.64). This inverse relationship is expected, since metal specific sorption capacity in
variable charge soils is known to increase within increasing soil pH, with a concurrent
reduction in Cd solubility (Tiller et al., 1984; Naidu et al., 1994; Bolan et al., 2003;
Srivastava et al., 2005).
The change in extractable Cd concentration per unit change in soil pH was very similar for
both soil types. At equivalent soil pH, the greater extractable Cd concentration of the Kereone
soil relative to the Topehaehae soil (Figure 2) is consistent with the greater total Cd
concentration of the Kereone soil (Table 1).
P < 0.001
(a) (a) (ab) (bc) (cd) (bcd) (bcd) (bcd) (bcd) (d)
-1.10
-0.90
-0.70
-0.50
-0.30
-0.10
0.10
0.30
0.50
0.70
3x acid 2x acid 1x acid 0.5x acid Control 0.5x lime 1x lime 2x lime 3x lime 4x lime
Me
an p
H c
han
ge r
ela
tive
to
me
an o
f co
ntr
ol
Treatment
P < 0.001
(a) (a) (b) (b) (c) (b) (c) (cd) (cd) (d)
-1.10
-0.90
-0.70
-0.50
-0.30
-0.10
0.10
0.30
0.50
0.70
3x acid 2x acid 1x acid 0.5x acid Control 0.5x lime 1x lime 2x lime 3x lime 4x lime
Me
an p
H c
han
ge r
ela
tive
to
me
an o
f co
ntr
ol
Treatment
a)
b)
7
Figure 2. Relationship between soil extractable Cd concentration and soil pH for the Kereone
and Topehaehae soil types.
Relationship between plant tissue Cd concentration, soil pH and extractable Cd
concentration
Chicory
The relationship between chicory tissue Cd concentration and soil pH (isolated to individual
soil types) or 0.05 M CaCl2 extractable Cd concentration (soil types combined) is shown in
Figure 3.a and Figure 3.b, respectively. Tissue Cd concentration decreased with increasing
soil pH (Figure 3.a) although the coefficient of determination was only weak to moderate (R2
= 0.52 and 0.35 for the Kereone and Topehaehae soils respectively). This trend is consistent
with a decrease in soil Cd phytoavailability as indicated by the relationship between soil pH
and soil extractable Cd concentration in Figure 2. Although chicory tissue Cd concentration
(across both soils combined) was positively correlated to soil extractable Cd concentration
(Figure 3.b) the coefficient of determination was very poor (R2 = 0.11).
Ryegrass
The relationship between chicory tissue Cd concentration and soil pH (isolated to individual
soil types) or 0.05 M CaCl2 extractable Cd concentration (soil types combined) is shown in
Figure 4.a and Figure 4.b, respectively. Similar to chicory, ryegrass Cd concentration
decreased with increasing soil pH (Figure 4.a) however the gradient of this relationship was
less steep for ryegrass than chicory, indicating that soil pH had a smaller influence on tissue
Cd concentration in ryegrass. In addition, for both soil types, the coefficient of determination
between ryegrass Cd concentration and soil pH (R2 = 0.42 and 0.19 for the Kereone and
Topehaehae soils, respectively) was weaker than that for chicory. Across both soil types
combined there was a positive relationship between ryegrass tissue Cd concentration and 0.05
M CaCl2 soil extractable Cd concentration (Figure 4.b), however the correlation was poor (R2
= 0.28).
y = -0.1516x + 1.0294P < 0.001R² = 0.819
y = -0.1482x + 0.9656P < 0.001R² = 0.637
0.00
0.05
0.10
0.15
0.20
0.25
0.30
0.35
4.5 5.0 5.5 6.0 6.5 7.0
0.0
5 M
CaC
l 2e
xtra
ctab
le C
d c
on
c. (
mg
kg-1
)
Soil pH
Kereone
Topehaehae

8
Figure 3. Relationship between chicory tissue Cd concentration and a) soil pH for the
Kereone and Topehaehae soils independently, and b) soil extractable Cd concentration across
the Kereone and Topehaehae soils combined.
The relationship between plant tissue Cd concentration and soil pH or soil extractable Cd
concentration (Figure 3 and Figure 4) is considerably weaker than that between soil
extractable Cd concentration and soil pH. In part, this may be related to greater natural
‘biological’ variability when analysing plant tissue, for example dilution effects due to
differences in growth rate (Mortvedt et al., 1981; Mortvedt, 1987) and/or variation in Cd
uptake and internal translocation efficiency (Welch and Norvell, 1999) between plant
samples analysed. In addition, an important factor is that the plant root network exploits a
much greater area of soil than that represented by soil sample ‘point-analysis’. With varying
rainfall and soil moisture, plant metal uptake may also vary based on relative Cd
concentration in soil zones from where plant roots are actively drawing moisture and other
nutrients (Williams and David, 1977; Manschadi et al., 2013).
y = -1.8539x + 12.886P < 0.001R² = 0.520
y = -1.4848x + 11.198P < 0.001R² = 0.352
0.0
0.5
1.0
1.5
2.0
2.5
3.0
3.5
4.0
4.5
5.0
4.5 5.0 5.5 6.0 6.5 7.0
Ch
ico
ry t
issu
e C
d c
on
cen
trat
ion
(m
g kg
-1D
M)
Soil pH
Kereone
Topehaehae
y = 4.8509x + 1.8286P < 0.003R² = 0.107
0.0
0.5
1.0
1.5
2.0
2.5
3.0
3.5
4.0
4.5
5.0
0.00 0.05 0.10 0.15 0.20 0.25 0.30 0.35
Ch
ico
ry t
issu
e C
d c
on
cen
trat
ion
(m
g kg
-1 D
M)
0.05 M CaCl2 soil extractable Cd concentration (mg kg-1)
Kereone
Topehaehae
a)
b)

9
Figure 4. Relationship between ryegrass tissue Cd concentration and a) soil pH for the
Kereone and Topehaehae soils independently, and b) soil extractable Cd concentration across
the Kereone and Topehaehae soils combined.
The poor correlation between 0.05 M CaCl2 extractable soil Cd and plant tissue Cd
concentrations overall (Figure 3.b and Figure 4.b) indicates 0.05 M CaCl2 extractable soil Cd
is an unreliable predictor of soil Cd phytoavailability and plant tissue Cd accumulation, for
either ryegrass or chicory. Although previous research has reported this extractant to be
strongly correlated with ryegrass Cd concentration (Andrewes et al., 1996; Gray et al., 1999a,
b; Roberts and Longhurst, 2002) most of this research has been undertaken under controlled
laboratory conditions, using a wide range of soils with contrasting characteristics (clay
mineralogy, pH, organic matter and total Cd concentration) that influence Cd
phytoavailability (Andrewes et al., 1996; Gray et al., 1999a, b). Drawing a robust
relationship between plant tissue Cd concentration and soil extractable Cd concentration is
likely to be more challenging under field conditions, where there is greater background
variation than in pot trials. For example, Roberts et al. (1995) reported poor correlation
between 0.05 M CaCl2 soil extractable Cd concentration and tissue Cd concentrations in
market garden crops (R2 = 0.17) and wheat grain (R2 = 0.04), although the authors did not
attempt to correct for variation that is likely to exist between species or cultivars (Adriano,
y = -0.0981x + 0.7134P < 0.001R² = 0.420
y = -0.0402x + 0.3445P = 0.004R² = 0.195
0.00
0.05
0.10
0.15
0.20
0.25
0.30
0.35
4.5 5.0 5.5 6.0 6.5 7.0
Rye
gras
s ti
ssu
e C
d c
on
cen
trat
ion
(m
g kg
-1D
M)
Soil pH
Kereone
Topehaehae
y = 0.3495x + 0.0805P < 0.001R² = 0.278
0.00
0.05
0.10
0.15
0.20
0.25
0.30
0.35
0.00 0.05 0.10 0.15 0.20 0.25 0.30 0.35
Rye
gras
s ti
ssu
e C
d c
on
cen
trat
ion
(m
g kg
-1 D
M)
0.05 M CaCl2 soil extractable Cd concentration (mg kg-1)
Kereone
Topehaehae
a)
b)
10
1986; McLaughlin et al., 1994; Gray et al., 1999b). Although Roberts and Longhurst (2002)
reported 0.05 M CaCl2 extractable soil Cd to account for 94% of the variability in pasture Cd
concentrations in their field study, different coefficients were needed for different slope
classes. Similar challenges have been found for other extractants. For example, 0.05 M
Ca(NO3)2 has shown to be a good predictor of Cd phytoavailability in controlled pot trials
(Gray et al., 1999a, b), however Reiser et al. (2014) reported that it was relatively weakly
correlated (Spearmans rho = 0.41) to pasture Cd concentration across a range of field survey
sites.
Previous research into various soil Cd extractants (including 0.05 M CaCl2) has also reported
wide variation in the correlation with tissue Cd concentration when the extractants were
assessed across different plant species (Gray et al., 1999a, b). This could explain the poor
correlation with chicory tissue Cd concentrations observed in this trial, since this plant
species has not been previously tested. Justification for the use of 0.05 M CaCl2 for soil
extractable Cd assessment in this study was based on its previous usage, and reported strong
correlation with ryegrass Cd concentration (Andrewes et al., 1996; Gray et al., 1999a, b;
Roberts and Longhurst, 2002). In addition, it is a relatively weak extractant with low pH
buffering capacity, characteristics that are considered favourable for prediction of Cd
phytoavailability, since the extractant is likely to be more sensitive to change in soil pH (Gray
et al., 1999a, b). Given the focus on manipulation of soil pH on soil Cd phytoavailability in
this study, this was considered a critical characteristic.
Implications for agricultural management
The significantly (P < 0.001) greater mean tissue Cd concentration for chicory than ryegrass
determined in this trial is consistent with, and further validates, data from an earlier
glasshouse trial (Stafford et al., 2016). In addition, the ryegrass Cd concentration ranges
determined in this trial (typically less than 0.3 mg kg-1 DM) are consistent with the literature
(Roberts et al., 1994; Loganathan et al., 1995; Loganathan et al., 1997; Roberts and
Longhurst, 2002; Gray and McLaren, 2005; Reiser et al., 2014).
As Cd accumulation in the liver and kidney of grazing livestock is dependent on dietary Cd
intake (Lee et al., 1994; Lee et al., 1996), the much greater tissue Cd concentration of chicory
has the potential to increase the rate of Cd accumulation in the liver and kidney of grazing
livestock (Stafford et al., 2016) potentially resulting in greater exceedance of food standard
MLs for these animal tissues.
As sorption of Cd is expected to increase in variable charge soils with increasing pH (Tiller et
al., 1984; Naidu et al., 1994; Srivastava et al., 2005) liming is traditionally viewed as one of
the most practical means for reducing soil Cd phytoavailability (Young, 2012). The linear
decrease in soil extractable Cd concentration with increasing soil pH demonstrated in this
field trial (Figure 2) is consistent with previous research showing Cd solubility / extractable
Cd concentration to be negatively correlated to soil pH (He and Singh, 1993; McBride et al.,
1997; Gray et al., 1998, 1999c). However, while tissue Cd concentrations for both chicory
(Figure 3) and ryegrass (Figure 4) also correspondingly decreased with increasing pH, this
relationship was comparatively much weaker (R2 = 0.19-0.52) than that between soil
extractable Cd concentration and soil pH (R2 = 0.64-0.82).
Within this field trial, ryegrass had low (<0.3 mg kg-1 DM) tissue Cd concentrations even at a
pH of 5.0. Consistent with this, analysis of data from the previous field survey carried out
within this thesis did not find pH to be a significant predictor of ryegrass tissue Cd

11
concentration. As most New Zealand pastures are typically managed within a pH range of
5.2-6.0 (Edmeades et al., 1985; Morton et al., 2005; Roberts and Morton, 2009) this supports
previous research that suggested animal Cd accumulation risk is relatively low for livestock
grazing ryegrass / white clover pastures (Loganathan et al., 1999; Reiser et al., 2014). It also
suggests that pH manipulation is not likely to greatly influence animal Cd accumulation when
grazing ryegrass-based pasture.
Manipulation of soil pH had a stronger effect on tissue Cd concentrations in chicory in this
trial, consistent with data from the previous field crop survey that indicated that tissue Cd
concentrations in chicory were significantly (P < 0.01) influenced by soil pH (as well as total
C and Cd concentrations). Regression data from the current field trial shows that chicory
tissue Cd concentrations changed by approximately 1.5-1.9 mg kg-1 DM (depending on soil
type) for every 1.0 unit change in soil pH (Figure 3.a). This illustrates the risk of greater
livestock dietary Cd exposure for this plant species that could be brought about by an
unintentional decline in soil pH over time. This could arise through under-application of lime
at/prior to sowing, in combination with enhanced organic matter mineralisation post-
cultivation, and increased nitrification and nitrate leaching driven by N-fertiliser and
concentrated stock urine deposition (Ridley et al., 1990; Bolan et al., 1991; McLaren and
Cameron, 1996).
Alternatively, it also indicates the potential to manage Cd accumulation in chicory by
increasing soil pH. Although it would not be normal agricultural practice to increase soil pH
beyond 6.0 since yield responses to further lime inputs are seldom economic (Edmeades et
al., 1985), the exception to this could be for the specific purpose of reducing tissue Cd
accumulation in Cd-sensitive species such as chicory. For example, based on the relationships
in Figure 3.a and an agronomically-realistic increase in soil pH from 5.5 to 6.5, chicory tissue
Cd concentration would be decreased by 49-69%. This is comparable to the mean 60%
reduction in tissue Cd concentration (across 5 plant species and 3 soil types) in glasshouse-
based research reported by Gray et al. (1999b) as a consequence of increasing soil pH from
5.5 to 7.0. Field trials have generally shown smaller and or more variable effects on plant
tissue Cd accumulation from manipulation of soil pH than glasshouse pot-trial research (Li et
al., 1996; Oliver et al., 1996; Maier et al., 1997; Maier et al., 2002). However, Sparrow and
Salardini (1997) indicated a 24% decrease in mean potato tuber Cd concentrations per 1.0
unit increase in soil pH. In addition, Guttormsen et al. (1995) reported mean tissue Cd
concentrations for Chinese cabbage and carrots to be 23% and 46% greater (respectively) at a
soil pH of 5.5 relative to 6.5, while He and Singh (1993) reported an approximate 40%
reduction in Cd concentration in mixed-grass samples at pH of 6.5 compared to 5.5.
Ultimately, an indicator of soil Cd phytoavailability is required for Cd sensitive crops, to
allow for simple and direct risk-analysis across different soil types that have differing Cd
sorption / solubility characteristics. Unfortunately, 0.05 M CaCl2 soil extractable Cd
concentration assessed to 150 mm soil depth did not provide a reliable relationship with
chicory tissue Cd concentration across the soil types in this study.
Conclusions
The significant (P < 0.001, R2 = 0.64-0.82) negative correlation between soil pH and 0.05 M
CaCl2 soil extractable Cd concentration in this trial reinforces that soil pH is an important
factor influencing soil Cd phytoavailability. Correspondingly, plant tissue Cd concentrations
were negatively correlated to soil pH (chicory R2 = 0.52 and 0.35, and ryegrass R2 = 0.42 and
0.19, for the Kereone and Topehaehae soils, respectively). However, soil extractable Cd

12
concentration was unable to explain much of the variability in chicory or ryegrass tissue Cd
concentrations (R2 = 0.11 and 0.28, respectively), indicating that 0.05 M CaCl2 soil
extractable Cd is a poor predictor of soil Cd phytoavailability across different soil types.
Ryegrass tissue Cd concentrations were significantly (P < 0.001) lower than those of chicory,
and remained low (generally <0.3 mg kg-1 DM) even in the Cd-enriched Kereone soil (1.12
mg kg-1 DW) at low pH (<5.5). This suggests animal Cd accumulation risk is very low when
grazing ryegrass dominant pasture, particularly since Cd-enriched soils primarily occur in
lowland, intensive agricultural soils where lime is regularly applied to maintain soil pH at
around 6.0. In contrast, chicory tissue Cd concentrations were sensitive to soil pH, with
regression analysis indicating a mean decrease in tissue Cd concentration of approximately
1.5-1.9 mg kg-1 DM per unit pH increase. Increasing soil pH to a minimum of 6.5 is a
practical and simple management practice to reduce livestock dietary Cd exposure risk when
grazing chicory.
References
Adriano, D.C., 1986. Trace elements in the terrestrial environment. Springer-Verlag, New
York, USA. 533 p.
Andersson, A., Siman, G., 1991. Levels of cadmium and some other trace elements in soils
and crops as influenced by lime and fertiliser level. Acta Agriculturae Scandinavica 41, 3-
11.
Andrewes, P., Town, R.M., Hedley, M.J., Loganathan, P., 1996. Measurement of plant-
available cadmium in New Zealand soils. Australian Journal of Soil Research 34, 441-
452.
Boekhold, A.E., Temminghoff, E.J.M., Van der Zee, S.E.A.T.M., 1993. Influence of
electrolyte composition and pH on cadmium sorption by an acid sandy soil. Journal of
Soil Science 44, 85-96.
Bolan, N.S., 1996. Cadmium accumulation in New Zealand pasture soils. Chemistry in New
Zealand 60, 33-39.
Bolan, N.S., Adriano, D.C., Mani, P.A., Duraisamy, A., 2003. Immobilization and
phytoavailability of cadmium in variable charge soils. II. Effect of lime addition. Plant &
Soil 251, 187-198.
Bolan, N.S., Hedley, M.J., White, R.E., 1991. Processes of soil acidification during nitrogen
cycling with emphasis on legume based pastures. Plant and Soil 134, 53-63.
Bolan, N.S., Naidu, R., Syers, J.K., Tillman, R.W., 1999. Surface charge and solute
interactions in soils. Advances in Agronomy 67, 88-141.
Chaney, W.R., Strickland, R.C., Lamoreaux, R.J., 1977. Phytotoxicity of cadmium inhibited
by lime. Plant and Soil 47, 275-278.
Christensen, T.H., Haung, P.M., 1999. Solid phase cadmium and the reactions of aqueous
cadmium with soil surfaces. In: McLaughlin, M.J., Singh, B.R. (Eds.), Cadmium in soils
and plants. Kluwer Academic Publishers, Dordrecht, The Netherlands, pp. 65-96.
Edmeades, D.C., Pringle, R.M., Mansell, G.P., Shannon, P.W., Ritchie, J., Stewart, K.M.,
1985. Effects of lime on pasture production on soils in the North Island of New Zealand.
5. Description of a lime recommendation scheme. New Zealand Journal of Experimental
Agriculture 13, 47-58.
FANZ, 2016. Tiered Fertiliser Management System for the management of soil cadmium
accumulation from phosphate fertiliser applications. Version 2, June 2016. Fertiliser
Association of New Zealand. Wellington, New Zealand. 12 p.
http://www.fertiliser.org.nz/Site/resource_center/Tech_Papers.aspx.

13
Francis, G.S., Haynes, R.J., Sparling, G.P., Ross, D.J., Williams, P.H., 1992. Nitrogen
mineralization, nitrate leaching and crop growth following cultivation of a temporary
leguminous pasture in autumn and winter. Fertilizer Research 33, 59-70.
Grant, C.A., Bailey, L.D., McLaughlin, M.J., Singh, B.R., 1999. Management factors which
influence cadmium concentration in crops. In: McLaughlin, M.J., Singh, B.R. (Eds.),
Cadmium in soils and plants. Kluwer Academic Publishers, Dordrecht, The Netherlands,
pp. 151-198.
Gray, C.W., McLaren, R.G., 2005. The effect of ryegrass variety on trace metal uptake. New
Zealand Journal of Agricultural Research 48, 285-292.
Gray, C.W., McLaren, R.G., Roberts, A.H.C., Condron, L.M., 1998. Sorption and desorption
of cadmium from some New Zealand soils: effect of pH and contact time. Australian
Journal of Soil Research 36, 199-216.
Gray, C.W., McLaren, R.G., Roberts, A.H.C., Condron, L.M., 1999a. Cadmium
phytoavailability in some New Zealand soils. Australian Journal of Soil Research 37,
461-477.
Gray, C.W., McLaren, R.G., Roberts, A.H.C., Condron, L.M., 1999b. Effect of soil pH on
cadmium phytoavailability in some New Zealand soils. New Zealand Journal of Crop and
Horticultural Science 27, 169-179.
Gray, C.W., McLaren, R.G., Roberts, A.H.C., Condron, L.M., 1999c. Solubility, sorption and
desorption of native and added cadmium in relation to properties of soils in New Zealand.
European Journal of Soil Science 50, 127-137.
Guttormsen, G., Singh, B.R., Jeng, A.S., 1995. Cadmium concentration in vegetable crops
grown in a sandy soil as affected by Cd levels in fertilizer and soil pH. Fertilizer Research
41, 27-32.
He, Q.B., Singh, B.R., 1993. Plant availability of cadmium in soils: II. Factors related to the
extractability and plant uptake of cadmium in cultivated soils. Acta Agriculturae
Scandinavica Section B: Soil and Plant Science 43, 142-150.
Lee, J., Grace, N.D., Rounce, J.R., 1994. Cadmium accumulation in liver and kidney of sheep
grazing ryegrass/white clover pastures. Proceedings of the New Zealand Society of
Animal Production 54, 31-34.
Lee, J., Rounce, J.R., Mackay, A.D., Grace, N.D., 1996. Accumulation of cadmium with time
in Romney sheep grazing ryegrass-white clover pasture: effect of cadmium from pasture
and soil intake. Australian Journal of Agricultural Research 47, 877-894.
Li, Y.M., Chaney, R.L., Schneiter, A.A., Johnston, B.L., 1996. Effect of field limestone
applications on cadmium content of sunflower (Helianthus annuus L.) leaves and kernels.
Plant and Soil 180, 297-302.
Loganathan, P., Hedley, M.J., Gregg, P.E.H., Currie, L.D., 1997. Effect of phosphate
fertiliser type on the accumulation and plant availability of cadmium in grassland soils.
Nutrient Cycling in Agroecosystems 47, 169-178.
Loganathan, P., Louie, K., Lee, J., Hedley, M.J., Roberts, A.H.C., Longhurst, R.D., 1999. A
model to predict kidney and liver cadmium concentrations in grazing animals. New
Zealand Journal of Agricultural Research 42, 423-432.
Loganathan, P., Mackay, A.D., Lee, J., Hedley, M.J., 1995. Cadmium distribution in hill
pastures as influenced by 20 years of phosphate fertilizer application and sheep grazing.
Australian Journal of Soil Research 33, 859-871.
Loganathan, P., Vigneswaran, S., Kandasamy, J., Naidu, R., 2012. Cadmium Sorption and
Desorption in Soils: A Review. Critical Reviews in Environmental Science and
Technology 42, 489-533.

14
Maier, N.A., McLaughlin, M.J., Heap, M., Butt, M., Smart, M.K., 2002. Effect of current-
season application of calcitic lime and phosphorus fertilization on soil pH, potato growth,
yield, dry matter content, and cadmium concentration. Communications in Soil Science &
Plant Analysis 33, 2145-2165.
Maier, N.A., McLaughlin, M.J., Heap, M., Butt, M., Smart, M.K., Williams, C.M.J., 1997.
Effect of current-season application of calcitic lime on soil pH, yield and cadmium
concentration in potato (Solanum tuberosum L.) tubers. Nutrient Cycling in
Agroecosystems 47, 29-40.
Manschadi, A.M., Manske, G.G.B., Vlek, P.L.G., 2013. Root architecture and resource
acquisition: wheat as a model plant. In: Eshel, A., Beeckman, T. (Eds.), Plant roots : the
hidden half (4th Edition). CRC Press, Boca Raton, Florida, pp. 1-18.
McBride, M., Sauve, S., Hendershot, W., 1997. Solubility control of Cu, Zn, Cd and Pb in
contaminated soils. European Journal of Soil Science 48, 337-346.
McLaren, R.G., Cameron, K.C., 1996. Soil science : sustainable production and
environmental protection. Oxford University Press, Auckland, New Zealand. 304 p.
McLaughlin, M.J., Williams, C.M.J., McKay, A., Kirkham, R., Gunton, J., Jackson, K.J.,
Thompson, R., Dowling, B., Partington, D., Smart, M.K., Tiller, K.G., 1994. Effect of
cultivar on uptake of cadmium by potato tubers. Australian Journal of Agricultural
Research 45, 1483-1495.
Moir, J.L., Moot, D.J., 2014. Medium-term soil pH and exchangeable aluminium response to
liming at three high country locations. Proceedings of the New Zealand Grasslands
Association 76, Alexandra, New Zealand, pp. 41-46.
Morton, J.D., Gray, M.H., Gillingham, A.G., 2005. Soil and pasture responses to lime on dry
hill country in central Hawke's Bay, New Zealand. New Zealand Journal of Agricultural
Research 48, 143-150.
Morton, J.D., Wheeler, D.M., Smith, N.S., 1998. Effect of lime and form of superphosphate
on productivity of dryland pastures. New Zealand Journal of Agricultural Research 41,
65-74.
Mortvedt, J.J., 1987. Cadmium levels in soils and plants from some long-term soil fertility
experiments in the United States of America. Journal of Environmental Quality 16, 137-
142
Mortvedt, J.J., Mays, D.A., Osborn, G., 1981. Uptake by wheat of cadmium and other heavy
metal contaminants in phosphate fertilizers. Journal of Environmental Quality 10, 193-
197.
Naidu, R., Bolan, N.S., Kookana, R.S., Tiller, K.G., 1994. Ionic-strength and pH effects on
the sorption of cadmium and the surface charge of soils. European Journal of Soil Science
45, 419-429.
Oliver, D.P., Tiller, K.G., Conyers, M.K., Slattery, W.J., Alston, A.M., Merry, R.H., 1996.
Effectiveness of liming to minimise uptake of cadmium by wheat and barley grain grown
in the field. Australian Journal of Agricultural Research 47, 1181-1193.
Reiser, R., Simmler, M., Portmann, D., Clucas, L., Schulin, R., Robinson, B., 2014.
Cadmium concentrations in New Zealand pastures: relationships to soil and climate
variables. Journal of Environmental Quality 43, 917-925.
Ridley, A.M., Slattery, W.J., Helyar, K.R., Cowling, A., 1990. Acidification under grazed
annual and perennial grass based pastures. Australian Journal of Experimental
Agriculture 30, 539-544.
Roberts, A.H.C., Longhurst, R.D., 2002. Cadmium cycling in sheep‐grazed hill‐country
pastures. New Zealand Journal of Agricultural Research 45, 103-112.

15
Roberts, A.H.C., Longhurst, R.D., Brown, M.W., 1994. Cadmium status of soils, plants, and
grazing animals in New Zealand. New Zealand Journal of Agricultural Research 37, 119-
129.
Roberts, A.H.C., Longhurst, R.D., Brown, M.W., 1995. Cadmium survey of South Auckland
market gardens and Mid Canterbury wheat farms. Unpublished report prepared for the
New Zealand Fertiliser Manufacturer’s Research Association. AgResearch. Hamilton.
Roberts, A.H.C., Morton, J.D., 2009. Fertiliser use on New Zealand dairy farms. New
Zealand Fertiliser Manufacturers’ Research Association, Auckland, New Zealand. 52 p.
Sparrow, L.A., Salardini, A.A., 1997. Effects of residues of lime and phosphorus fertilizer on
cadmium uptake and yield of potatoes and carrots. Journal of Plant Nutrition 20, 1333-
1349.
Sparrow, L.A., Salardini, A.A., Bishop, A.C., 1993. Field studies of cadmium in potatoes
(Solanum tuberosum L.). I. Effects of lime and phosphorus on cv. Russet Burbank.
Australian Journal of Agricultural Research 44, 845-853.
Srivastava, P., Singh, B., Angove, M., 2005. Competition adsorption behaviour of heavy
metals on kaolinite. Journal of Colloid and Interface Science 290, 28-38
Stafford, A.D., Anderson, C.W.N., Hedley, M.J., McDowell, R.W., 2016. Cadmium
accumulation by forage species used in New Zealand livestock grazing systems.
Geoderma Regional 7, 11-18.
Tiller, K.G., Gerth, J., Brummer, G., 1984. The relative affinities of Cd, Ni and Zn for
different soil clay fractions and goethite. Geoderma 34, 17-35.
Vasconcelos, I.F., Haack, E.A., Maurice, P.A., Bunker, B.A., 2008. EXAFS analysis of
cadmium(II) adsorption to kaolinite. Chemical Geology 249, 237-249.
Welch, R.M., Norvell, W.A., 1999. Mechanisms of cadmium uptake, translocation and
deposition in plants. In: McLaughlin, M.J., Singh, B.R. (Eds.), Cadmium in soils and
plants. Kluwer Academic Publishers Dordrecht, The Netherlands, pp. 125-150.
Williams, C.H., David, D.J., 1977. Some effects of the distribution of cadmium and
phosphate in the root zone on the cadmium content of plants. Australian Journal of Soil
Research 15, 59-68.
Young, S.D., 2012. Chemistry of heavy metals and metalloids in soils. In: Alloway, B.J.
(Ed.), Heavy metals in soils: trace metals and metalloids in soils and their bioavailability.
Springer, Dordrecht, The Netherlands, pp. 51-95.