cacao agroforestry under ambient and reduced throughfall
TRANSCRIPT

CACAO AGROFORESTRY UNDER AMBIENT AND REDUCED THROUGHFALL: TREE WA-TER USE CHARACTERISTICS AND STAND WATER BUDGETING
Dissertation zur Erlangung des akademischen Grades Doctor of Philosophy (PhD) der Fakultät für Forstwissenschaften und Waldökologie der Georg-August-Universität Göttingen vorgelegt von Michael Köhler geboren in Schmölln Göttingen, 2010

1. Gutachter: Prof. Dr. Dirk Hölscher 2. Gutachter: Prof. Dr. Edzo Veldkamp Tag der mündlichen Prüfung: 05.05.2010
(Datum)


Picture source: http://commons.wikimedia.org

TABLE OF CONTENT
Summary I
Zusammenfassung V
Overview publications XI
1 Introduction 1
2 Methodology 11
2.1 Overview 13 2.2 Study sites and species selection 14 2.3 Experimental design of throughfall reduction 17 2.4 Field set up and instrumentation 19 2.4.1 Micrometeorological measurements 19 2.4.2 Sap flux, tree water use, tree- and stand transpiration 20 2.4.3 Soil water content 24 2.5 Sap flux density model 26 2.6 Soil water transport model 27 2.6.1 Theory 27 2.6.2 Model parameterization 28 2.6.3 Adjustment of soil hydraulic parameters 31
3 Water use characteristics of cacao and Gliricidia trees 35 in an agroforest in Central Sulawesi, Indonesia
4 Comparison of tree water use characteristics in 57 reforestation and agroforestry stands across the tropics
5 Throughfall reduction in a cacao agroforest: 73 tree water use and soil water budgeting
6 Conclusions 103
Acknowledgments 109
Supporting documents 111


SUMMARY
CACAO AGROFORESTRY UNDER AMBIENT AND REDUCED THROUGHFALL: TREE WATER USE CHARACTERISTICS AND STAND WATER BUDG-ETING
The world’s tropical regions have faced dramatic losses in forest cover during recent decades.
Although high rates of rainforest conversion continue today, reforestation is becoming more
common. A variety of reforestation types exists, including reforestations with native trees, mixed
reforestations with exotic trees, commercial monocultures or agroforests, which are combina-
tions of trees and shrubs with crops and/or livestock. The reasons for reforestation are mani-
fold: tree plantations and agroforestry provide means of income for farmers and thus ensure
food security for the local population. Reforestation can also restore degraded land. Reforested
areas often function as connectors between protected areas and areas under human occupation,
and they have the capacity to capture and store carbon dioxide, helping mitigate climate change.
Additionally, reforestation can aid in controlling erosion, help protect soil and water resources
and may also facilitate the conservation of biodiversity.
However, reforestations are under critical debate because they may decrease stream water
flow and groundwater recharge if their level of evapotranspiration is higher than that of previous
vegetation. This could be especially problematic in areas where water resources are already under
pressure due to water use for irrigation or other human needs. It is also important to note that
evidence indicates global warming may lead to increasing frequency and severity of droughts in
the (sub-) tropics, further aggravating problems of water scarcity. Therefore, species selection in
terms of water use, competitiveness and drought resistance might be of great importance in the
future management of agroforests or tree plantations. Unfortunately, few studies have been con-
ducted on single tree water use rates of tropical species, even if such trees are commonly used in
reforestations. In addition, limited information has been gathered on the capacity of tropical spe-
cies or ecosystems to cope with abnormal water scarcity. Even more problematic, recent studies
in old growth forests showed that species-independent relationships exist between water use and
tree size, which would leave little space for species selection as a management option. Little is
known about the environmental and arboreal structural components that drive water use pat-
terns in tropical trees used for reforestations or agroforests.
In this dissertation these fields of study were addressed by conducting a large scale field ex-
periment in a cacao/Gliricidia agroforest in Central Sulawesi. To begin this experiment, sap flux
I
SUMMARY
characteristics and tree water use were studied under ambient conditions and compared to other
stands across the tropics in a second step. Further, a replicated throughfall reduction experiment
was conducted within this agroforest thereafter, where net precipitation was reduced by 71% of
the control for 13 months. After beginning the throughfall reduction experiment, sap flux re-
sponse to declining soil moisture was described, and the soil water budget of the throughfall re-
duction scenario was compared to a control.
The main questions I addressed in this dissertation were:
1) How are tree sap flux and water use of trees in agroforests and reforestations controlled
by species identity, tree structural components, environmental conditions and shade effects?
2) Do universal rules relating tree size to water use in old-growth forests also apply to refor-
estation and agroforestry stands in the tropics?
3) How are tree sap flux, water use, and the stand water budget of an agroforest influenced
by artificially reduced canopy throughfall?
This research was conducted in the framework of the ‘Stability of Rainforest Margins in In-
donesia’ (STORMA) project but is also based in part on data provided by other members of the
‘Tropical Silviculture and Forest Ecology’ working group (respective contributions are indicated
in the Chapter “Overview Publications”). The dissertation compiles three publications (Chapters
3-5): The first addresses the environmental and arboreal structural components driving sap flux
characteristics and tree water use of the cacao/Gliricidia agroforest in Central Sulawesi, Indonesia
under ambient soil moisture conditions. Granier heat dissipation sap flux gauges were employed
to measure sap flux densities in up to 18 individuals per species. Tree sap flux response to global
radiation and vapor pressure deficit were measured and described using a Jarvis-Type sap flux
model. The resulting model parameters and cumulative sap flux densities were then analyzed in
relation to species identity and tree structure.
A second publication evolved from the compilation of the modeling results from the Indo-
nesian agroforest with results from a separate study done on mixed reforestation stands in the
Philippines and another done on mono-specific reforestation stands in Panama, resulting in a
cross continental comparison of sap flux characteristics of more than 100 individual trees be-
longing to 17 species of similar size, age and management regimes. The aim here was to test for
universal relationships between tree structure and water use within similar tropical land use sys-
tems and to see if different species would exhibit detectable differences in water use and sap flux
response to environmental parameters.
II

SUMMARY
After the sap flux of cacao and Gliricidia trees in the Indonesian agroforest was assessed un-
der ambient soil water conditions, the stand was subdivided into six plots, three of which (‘roof
plots’) were covered with a sub-canopy roof made of bamboo frames and clear PVC foil to arti-
ficially reduce net precipitation. The third study discusses the effects of reduced throughfall on
tree sap flux of both tree species. Data on stand transpiration, incoming throughfall, and meas-
ured soil water content are further brought together to parameterize a one dimensional soil water
model, which describes the effects of reduced throughfall on the soil water budget in both the
ambient and the reduced throughfall scenarios.
The main results of the study were the following:
1) The application of a Jarvis-type model to sap flux data from 18 trees per species in the
cacao/Gliricidia agroforest showed that water use characteristics differed substantially between
species despite comparable cumulated daily sap flux densities. Model parameters suggested a
49% higher maximum sap flux density of cacao as compared to Gliricidia. Differences in the re-
sponse to environmental variables were also observed and are probably related to the greater ex-
posure of Gliricidia trees. We found linearly increasing water use rates with increasing tree diame-
ter in both species. However, due to a much shallower sap wood depth at a given diameter of
Gliricidia trees, the rate of increase in water use with increasing tree diameter was lower in Gliri-
cidia than in cacao. The average stand transpiration amounted to 1.5 mm d-1, and 70% of this to-
tal was attributed to cacao. Against expectations, increasing shade intensity led to increased water
use rates in cacao trees, an effect probably linked to enhanced vegetative growth under shade.
This suggests that in addition to exhibiting elevated stand transpiration due to the quantities of
water used by shade trees, the transpiration of shaded cacao stands may also be increased by the
impact of shade on the transpiration of cacao trees themselves.
2) When the same sap flux model was applied to sap flux data from more than 100 trees of
17 species from three study areas - Panamanian mono-specific reforestations, the Indonesian
agroforest and Philippine mixed reforestations - up to threefold differences were detected in the
maximum sap flux densities of different species. Significant differences were also found between
different species within the same respective stands. The declining, species-independent relation-
ship between sap flux density and tree diameter suggested in the literature could not be con-
firmed by this dataset. Nonetheless, a strong linear relationship was found between water use
rates and tree diameter (R2adj = 0.65). However, water use rates of different species at a given tree
diameter differed up to twofold, and some species clearly followed distinct trajectories.
III
SUMMARY
IV
3) In the cacao/Gliricidia agroforest different responses to declining soil moisture were
found in both of the species studied. In the roof plots Gliricidia sap flux density already declined
at higher soil water contents than cacao, and Gliricidia showed lower sap flux in the roof plots
than in the control at all levels of vapor pressure deficit (VPD). In contrast, cacao sap flux re-
mained similar to the control at low levels of VPD when atmospheric demand was low and was
reduced only when evaporative demand was high. In the roof plots, the average monthly sap flux
densities of both species decreased linearly with decreasing soil water content, reaching maxi-
mum reductions of 21% (cacao) and 29% (Gliricidia) as compared to the control. A few possible
explanations for the differing sap flux responses are: water uptake partitioning such that cacao
withdrew water mostly from the topsoil where small amounts of throughfall entering the gaps in
the roof frequently rewetted the soil, potentially higher humidity near the cacao crowns than near
taller Gliricidia crowns, uncoupling of cacao leafs from the atmosphere, and the potential acclima-
tion of cacao roots to dry conditions. Both species’ sap flux recovered after the experiment. Be-
cause net precipitation exceeded stand transpiration during most months of the throughfall re-
duction experiment while soil moisture was decreasing, Drainage was a main driver of changes in
soil water content. After linking drainage and sap flux data it became clear that both species
maintained high transpiration only where surplus water was available, as indicated by high drain-
age rates.
In summary, it can be said that plant sap flux and water use characteristics clearly differed be-
tween tree species in forest stands in Indonesia, Panama and the Philippines, but structural stand
components such as shading regimes and tree exposure also influenced tree water use. The data
further suggests that shade trees may increase and enhance stand transpiration both through
their own water use and by increasing water use rates of associated cacao trees. This suggests that
in addition to species selection, management practices are also valuable tools to manage stand
water use in reforestations or agroforestry stands.
The throughfall reduction study showed that competition between cacao and Gliricidia for
water resources during long periods with limited precipitation might be either minimal or slightly
in favor of cacao. Water uptake partitioning and low stand transpiration rates may have reduced
competition for available water resources and may have contributed to the relatively high toler-
ance of this agroforest to reduced throughfall.
ZUSAMMENFASSUNG
KAKAO-AGROFORST UNTER NORMALEM UND REDUZIERTEM BESTANDESNIEDERSCHLAG: BAUMWASSERNUTZUNGSCHARAKTERISTIKEN UND BESTANDESWASSERBILANZ
Die Waldflächen in vielen tropischen Regionen der Welt haben in den vergangenen Jahr-
zehnten drastisch abgenommen, und ein Ende dieses Trends ist bis heute nicht abzusehen. Den-
noch gibt es auch Bestrebungen zur Wiederaufforstung ehemaliger Regenwaldflächen mit ein-
heimischen oder exotischen Arten in Mischbeständen, kommerziellen Plantagen oder Agro-
forstsystemen, die eine Kombination von Bäumen und Sträuchern mit landwirtschaftlichen Kul-
turen und/oder Nutztieren darstellen. Wiederaufforstungen sind in vielerlei Hinsicht von gro-
ßem Nutzen: Sie können in Form von kommerziellen Plantagen oder Agroforstsystemen zur
Einkommenssicherung der lokalen Bevölkerung beitragen, dienen aber auch als Bindeglied zwi-
schen Nationalparks und Kulturlandschaften und sind geeignet zur Erosionskontrolle sowie zum
Rekultivieren degradierten Landes. Neben ihrem Nutzen zur Erhaltung der Biodiversität verfü-
gen sie auch über ein großes CO2-Speicherpotential, was sie besonders aus der Sicht des Klima-
schutzes interessant macht.
Trotz dieser Vorteile geraten Bestrebungen zur Wiederaufforstung aber auch häufig in die
Kritik, weil sie durch hohe Evapotranspirationsraten im Vergleich zur vorhergehenden Vegetati-
on die Grundwasserneubildung sowie den Oberflächenwasserabfluss verringern können. Das ist
besonders problematisch in Gebieten, wo die Wasserressourcen ohnehin schon stark vom Men-
schen genutzt werden. Angesichts des Klimawandels könnte sich dieser Konflikt noch verschär-
fen, weil ein Anstieg von Häufigkeit und Stärke von Trockenzeiten in den (Sub-) Tropen erwar-
tet wird. Um den Wasserverbrauch von Wiederaufforstungen zu verringern und um zukünftige
Bestände gut an Dürreereignisse anzupassen, ist neben der Bestandesführung auch eine geschick-
te Wahl der Baumarten von essentieller Bedeutung. Leider gibt es bisher nur wenige Studien, die
sich mit der Wassernutzung einzelner tropischer Bäume beschäftigen, auch wenn diese vielfach
für Pflanzungen zum Einsatz kommen. Ebenso gibt es nur wenige Erkenntnisse über die Reakti-
on tropischer Baumarten oder ganzer Ökosysteme auf ungewöhnliche Trockenereignisse. Es
bleibt aber generell fraglich, ob die Artwahl überhaupt großen Einfluss auf den Wasserverbrauch
von Bäumen in ähnlichen Ökosystemen hat. Aktuelle Forschungsergebnisse aus tropischen Re-
genwäldern haben gezeigt, dass unter gegebenen klimatischen Bedingungen artunabhängige Be-
ziehungen zwischen Baumdurchmesser und Wassernutzung bestehen. Allerdings gibt es bisher
V
ZUSAMMENFASSUNG
keine gleichartigen Studien, die ähnliche Abhängigkeiten in Wiederaufforstungen oder Agro-
forstsystemen belegen könnten.
Die vorgelegte Dissertation setzt sich anhand eines Feldexperiments in einem Kakao-
/Gliricidia-Agroforstsystem mit diesen offenen Fragestellungen auseinander. Saftflusscharakteris-
tiken und Wassernutzungsraten wurden bestimmt und zwischen den Arten im Bestand sowie mit
Arten aus anderen Beständen (Monokulturplantagen in Panama und Wiederaufforstungen in den
Philippinen) verglichen. In einem zweiten Schritt wurde der Bestandesniederschlag für eine Zeit
von 13 Monaten in drei Flächen der Kakaoplantage mit Hilfe von Plastikdächern um 71 % im
Vergleich zu drei Kontrollflächen verringert. Dabei wurden Veränderungen des Saftflusses der
Bäume, der Bestandestranspiration sowie des Bodenwasserhaushalts, die sich aus dem reduzier-
ten Niederschlag ergaben, mit einer Kontrolle unter normalen Niederschlagsbedingungen vergli-
chen.
Die Fragestellungen der Arbeit waren:
1) Wie beeinflussen Baumstruktur, Baumart, Umweltbedingungen und Beschattung den
Saftfluss und die Wassernutzung von Bäumen in Agroforstsystemen oder Wiederaufforstungen?
2) Gelten artunabhängige Beziehungen zwischen Baumdurchmesser und Wassernutzung,
die in Naturwäldern nachgewiesen wurden, auch für Agroforstsysteme und Wiederaufforstungen
in tropischen Regionen?
3) Wie werden Baumsaftfluss, Wassernutzung und Wasserbilanz des indonesischen Agro-
forstsystems durch künstlich reduzierten Bestandesniederschlag beeinflusst?
Die Feldarbeit zur Dissertation wurde im Rahmen des DFG-Projektes ‘Stability of Rainfo-
rest Margins in Indonesia’ (STORMA) durchgeführt. Daten für den Vergleich von Arten aus
mehreren tropischen Beständen wurden von Kollegen der Arbeitsgruppe am Institut ‘Tropical
Silviculture and Forest Ecology’ zur Verfügung gestellt. Die jeweiligen Beiträge einzelner Auto-
ren werden im folgenden Kapitel (Overview publications) dargestellt. Die Arbeit besteht aus drei
Publikationen (Kapitel 3-5):
In der ersten Veröffentlichung werden Einflüsse von Baumstruktur, Baumart und Umwelt-
bedingungen wie Beschattung auf Saftfluss und Wassernutzung eines Kakao-/Gliricidia-
Agroforstsystems in Zentralsulawesi/Indonesien beschrieben. Die Saftflussdichte von 18 Bäu-
men pro Art wurde mit Granier-Xylem-Saftflusssensoren bei normalem Bestandesniederschlag
bestimmt. Parallel wurden Wetterdaten und Daten zur Bodenfeuchte erhoben. Zur Auswertung
der Daten wurde ein einfaches Jarvis-Modell benutzt, dass den Saftfluss in Beziehung zum Was-
VI

ZUSAMMENFASSUNG
serdampfdruckdefizit der Luft und zur Globalstrahlung setzt. Die daraus resultierenden Modell-
parameter sowie kumulierten Saftflüsse wurden dann analysiert und in Beziehung zu Baumart
und -struktur gesetzt.
In einer zweiten Publikation werden Saftflussdaten aus der Studie des indonesischen Agro-
forsts mit Daten aus einer Plantage in Panama (Bäume in Monokultur) und einer Wiederauffors-
tung in den Philippinen (Mischbestand) zusammengebracht. Anhand von 100 Bäumen aus 17
Arten wurde geprüft, ob generelle Zusammenhänge zwischen Baumstruktur und Wassernutzung
für ähnliche Nutzungssysteme in verschiedenen tropischen Regionen bestehen, oder ob es Art-
unterschiede in der Wassernutzung und der Reaktion des Saftflusses auf Umweltparameter gibt.
Nach der Untersuchung des Saftflusses und der Wassernutzung von Kakao- und Gliricidia-
Bäumen in dem indonesischen Agroforstsystem unter normalen Niederschlagsbedingungen
wurde der Bestand in sechs Teilflächen untergliedert, von denen drei für einen Zeitraum von 13
Monaten mit Dachkonstruktionen bestückt wurden. Die Dächer aus Bambusstangen und durch-
sichtiger Folie verringerten den Bestandesniederschlag im Vergleich zu den verbleibenden drei
Kontrollflächen um 71 %. In einer dritten Studie werden dann die Auswirkungen des reduzierten
Bestandesniederschlags auf Saftfluss und Wassernutzung der beiden Arten bzw. auf die Interak-
tionen zwischen den Arten beschrieben. Weiterhin wurde ein Bodenwasserhaushaltsmodell zur
Beschreibung von Auswirkungen des reduzierten Bestandesniederschlags auf die Wasserbilanzen
von normalem und reduziertem Bestandesniederschlagsszenario angewendet.
Die Hauptergebnisse waren:
1) Fundamentale Unterschiede zwischen den Saftflusscharakteristiken der beiden Spezies
wurden bei der Anwendung des Jarvis-Saftflussmodells gefunden, obwohl die kumulierten tägli-
chen Saftflüsse der Arten vergleichbar waren. Die Modellparameter ergaben, dass Kakao eine um
49 % höhere maximale Saftflussgeschwindigkeit erreichte als Gliricidia. Ebenfalls waren Unter-
schiede des Saftflusses in Bezug auf Umweltparameter wie Strahlung und Wasserdampfdruckde-
fizit erkennbar, was offensichtlich der besseren Exposition der Gliricidia-Kronen geschuldet ist.
Die Wassernutzungsraten beider Arten stiegen linear mit zunehmendem Durchmesser an, aber
der Anstieg der Gliricidia-Wassernutzungsrate war im Vergleich zum Kakao weniger stark, was
mit einer geringeren Saftholztiefe von Gliricidia erklärt wird. Die Bestandestranspiration lag im
Mittel der 13 Monate bei 1.5 mm Tag-1. 70 % der Transpirationsleistung wurden dabei von Ka-
kaobäumen erbracht. Entgegen den ursprünglichen Erwartungen vergrößerte sich der Wasser-
verbrauch der Kakaobäume mit zunehmender Beschattung, was offensichtlich mit gesteigertem
vegetativem Wachstum in der Nähe von Schattenbäumen zu erklären ist. Dieses Ergebnis deutet
VII

ZUSAMMENFASSUNG
darauf hin, dass die Bestandestranspiration von beschattetem Kakao im Vergleich zu Kakao in
Reinkultur nicht nur wegen der Wassernutzung der Schattenbäume, sondern durch die Verstär-
kung des Wasserverbrauchs der Kakaobäume erhöht ist.
2) Aus der vergleichenden Analyse der Saftflussdaten von 100 Bäumen aus 17 Arten der
Wiederaufforstungen in Panama und den Philippinen sowie des Agroforsts in Indonesien ergab
sich eine Variation der maximalen Saftflussgeschwindigkeiten zwischen den Arten um den Fak-
tor 3. Ebenfalls ergaben sich signifikante Saftflussdifferenzen zwischen den Arten innerhalb der
jeweiligen Standorte. Die in der Literatur für Naturwälder beschriebene artunabhängige Bezie-
hung zwischen Saftflussgeschwindigkeit und Baumdurchmesser konnte damit für tropische Wie-
deraufforstungen nicht bestätigt werden. Nachgewiesen wurde aber eine signifikante lineare Be-
ziehung zwischen Baumdurchmesser und Wassernutzungsrate (R2adj = 0.65). Allerdings wurden
dabei bei gleichem Durchmesser deutliche Unterschiede in der Wassernutzung zwischen den Ar-
ten (um den Faktor 2) festgestellt, was auch darauf zurückzuführen ist, dass die Beziehung für
einige Arten deutlich verschiedene Verläufe aufwies.
3) Die beiden Arten Kakao und Gliricidia reagierten unterschiedlich auf abnehmenden Bo-
denwassergehalt. Die Saftflussgeschwindigkeiten von Gliricidia Bäumen in den Dachflächen ver-
ringerten sich im Vergleich zu Kakao schon bei deutlich höheren Wassergehalten, und diese Saft-
flussreduktion war über den gesamten Bereich des gemessenen Wasserdampfdruckdefizits fest-
stellbar. Im Gegensatz dazu zeigte sich eine Abnahme der Saftflussgeschwindigkeiten von Ka-
kaobäumen in den Dachflächen nur bei hohem Wasserdampfdruckdefizit, während die Saftfluss-
geschwindigkeiten von Bäumen in Dach- und Kontrollflächen bei niedrigem Wasserdampf-
druckdefizit ähnlich waren. Die Monatsmittel der Saftflussgeschwindigkeiten beider Arten nah-
men linear mit sinkendem Bodenwassergehalt ab und waren dabei im Vergleich zur Kontrolle
maximal 21% (Kakao) bzw. 29% (Gliricidia) reduziert. Mögliche Erklärungen für diese Unter-
schiede wurden in der vertikalen Aufteilung der Wasseraufnahme zwischen den Arten gesehen,
wobei Kakao Wasser eher aus dem Oberboden entzog, der häufig durch kleinere Regenmengen,
die durch Öffnungen im Dach fielen, befeuchtet wurde. Weiterhin war anzunehmen, dass die
Luftfeuchte in der direkten Umgebung der Kakaokronen viel höher war als im oberen Teil des
Bestandes, in dem sich die Kronen der Gliricidia entfalten. Zusätzlich adaptieren sich die Kakao-
wurzeln im Gegensatz zu Gliricidia durch osmotische Anpassung an den sinkenden Wassergehalt.
Der Saftfluss beider Arten erholte sich nach Beendigung des Dachexperiments. Es konnte weiter
gefolgert werden, dass die Drainage einen sehr großen Einfluss auf das Absinken des Bodenwas-
servorrats in den Dachflächen hatte, denn der Nettoniederschlag überstieg die Bestandestranspi-
ration während der meisten Monate des Experiments. Hohe Transpirationsleistungen schienen
VIII

ZUSAMMENFASSUNG
IX
bei beiden Arten an einen Überschuss an Bodenwasser gekoppelt zu sein, denn sie wurden nur
bei hohen Drainageraten festgestellt.
Zusammenfassend ergab sich, dass ein klarer Arteinfluss auf die Wassernutzung von Bäumen
in Wiederaufforstungen und Agroforstsystemen in Indonesien, Panama und den Philippinen
nachgewiesen werden konnte. Die Wassernutzung wurde aber auch von der Bestandesstruktur
(Beschattung, Exposition der Bäume) beeinflusst. Schattenbäume in Agroforstsystemen wirken
sich in zweierlei Hinsicht auf den Wasserverbrauch aus. Einerseits erhöhen Schattenbäume die
Bestandestranspiration um die eigene Transpirationsleistung, andererseits können sie auch den
Wasserverbrauch der beschatteten Bäume erhöhen. Daher sind eine geschickte Artwahl und ein
gute Bestandesführung (Beschattungsmanagement) geeignete Maßnahmen, um den Wasser-
verbrauch von Wiederaufforstungen und Agroforstsystemen zu steuern.
Die Studie zur künstlichen Reduktion des Bestandesniederschlags in einem Kakao/Gliricidia-
Agroforstsystem ergab, dass Kakao bei längeren Trockenperioden im Vergleich zu Gliricidia ei-
nen Vorteil in der Konkurrenz um Wasser hat, bzw. die Konkurrenz weniger stark ausgeprägt
war. Mögliche Gründe für die relativ hohe Trockenheitstoleranz des Ökosystems sind die niedri-
ge Bestandestranspiration, aber auch die offenbar getrennte Wasseraufnahme der Arten aus ver-
schiedenen Bodenschichten.

X

OVERVIEW PUBLICATIONS
OVERVIEW PUBLICATIONS
1. Publications given as chapters of this thesis
Water use characteristics of cacao and Gliricidia trees in an agroforest in Central Su-lawesi, Indonesia (Chapter 3)
Michael Köhler, Diego Dierick, Luitgard Schwendenmann & Dirk Hölscher (2009)
Ecohydrology 2, 520 - 529
The study was developed by Dirk Hölscher and Luitgard Schwendenmann and carried out
within the framework of the joint research project “Stability of Rainforest Margins in Indonesia”.
The field set up and data collection was realised by the author. Data analysis was done jointly by
the author and Diego Dierick who supported the author during his parental leave. Manuscript
writing and preparation was done by the author and Diego Dierick with the assistance of Luit-
gard Schwendenmann and Dirk Hölscher.
Comparison of tree water use characteristics in reforestation and agroforestry stands across the tropics (Chapter 4)
Diego Dierick, Norbert Kunert, Michael Köhler, Luitgard Schwendenmann & Dirk Hölscher (2010)
In: T. Tscharntke, C. Leuschner, E. Veldkamp, H. Faust, E. Guhardja, A. Bidin (Eds.), Tropical Rainforests and Agroforests under Global Change, Springer, Berlin, 293 - 308
This publication compares water use characteristics assessed in the cacao/Gliricidia agroforest
in Indonesia with data from field studies in mixed reforestations in the Philippines and mono-
specific reforestations in Panama. The study was supervised by Dirk Hölscher, field work and
data analyses were conducted by Diego Dierick (Philippines), Norbert Kunert (Panama) and the
author (Indonesia). Diego Dierick was responsible for the manuscript with the help of all co-
authors.
XI

OVERVIEW PUBLICATIONS
Throughfall reduction in a cacao agroforest: tree water use and soil water budgeting (Chapter 5)
Michael Köhler, Luitgard Schwendenmann & Dirk Hölscher
Agricultural and Forest Meteorology (in press)
Within this paper, sap flux and tree water use in the Indonesian agroforest under reduced
throughfall are described in relation to declining soil moisture. Effects of reduced throughfall on
stand water budget were assessed with a soil water budget model. Data analysis, modelling and
manuscript writing was carried out by the author. Both co-authors commented on the manu-
script.
XII

OVERVIEW PUBLICATIONS
XIII
2. Further publications originating from work conducted in the framework of this dissertation
Three additional publications, to which the author of this dissertation substantially contrib-
uted, arose from work conducted for this PhD thesis in the framework of the interdisciplinary
research project “STORMA”. These publications, however, are not incorporated as separate
chapters because their respective scope and the questions addressed differ from the overall ob-
jectives of this thesis. The abstracts of these publications are given for further reading and the
author’s contributions are described below.
Can deuterium tracing be used for reliably estimating water use of tropical trees and bamboo?
Schwendenmann, L., Dierick, D., Köhler, M., Hölscher, D.
Tree Physiology (in press)
Abstract: Reliable estimates of water use by trees and other woody plants are crucial for an improved understanding of plant physiology and for water resource management. Since the 1980s the thermal dissipation method (TDP) has been widely applied in trees, proved to be fairly accurate but is challenging in remote areas. Also in the 1980s the deuterium (D2O or deuterium ox-ide) tracing method was proposed, which so far has less often been applied. However, deuterium tracing requires less sophisti-cated equipment in the field and new analytical methods reduce costs and increase sample throughput. The objectives of this study were (1) to compare plant water use estimates of the TDP and D2O method, and (2) to determine whether the D2O method is appropriate for assessing absolute magnitudes of plant water use. The two methods were employed on five tropical tree species and a bamboo species growing in a reforestation stand in the Philippines and an agroforestry system in Indonesia. For bamboo, an increase of D2O values in neighboring, non-labeled culms suggests that D2O injected was partly redistributed among culms, which would seriously limit the accurate estimation of water use for the target culm. For trees, water use estimates resulting from the D2O tracing method were proportional to TDP results (r2 = 0.85, p <0.001), but absolute values were on average about 7 times higher. This overestimation may be due to the assumptions underlying the D2O tracing method, such as the conservation of tracer mass, not being met. Further, it cannot be excluded that underestimation of water use by the TDP method contributed partly to the observed difference. However, when considering known sources of error, a large part of the observed difference remains unexplained. Based on our results, the use of the D2O tracing method cannot be recommended without further experimental testing if absolute values of whole-plant water use are a major goal. However, the D2O tracing method appears suitable for answering other questions, such as relative differences in water use among trees, water redistribution among neighbors, and internal water transport and storage processes in plants.
The author conducted fieldwork in Indonesia that was used in this study, including the assess-
ment of tree sap flux and deuterium labeling. Sap flux calculations were also contributed, and
commentary was given on the manuscript.

OVERVIEW PUBLICATIONS
Effects of an experimental drought on the functioning of a cacao agroforestry system, Sulawesi, Indonesia.
Schwendenmann, L., Veldkamp, E., Moser, G., Hölscher, D., Köhler, M., Clough,Y., Anas, I., Dja-jakirana, G., E-rasmi, S., Hertel, D., Leitner, D., Leuschner, C., Michalzik, B., Propastin, P., Tjoa, A., Tscharntke, T., van Straaten, O. (2010)
Global Change Biology 16, 1515–1530
Abstract: Agroforestry systems may play a critical role in reducing the vulnerability of farmers’ livelihood to droughts as tree-based systems provide several mechanisms that can mitigate the impacts from extreme weather events. Here, we use a replicated throughfall reduction experiment to study the drought response of a cacao/Gliricidia stand over a 13-month period. Soil water content was successfully reduced down to a soil depth of at least 2.5 m. Contrary to our expectations we measured only relatively small nonsignificant changes in cacao (11%) and Gliricidia (12%) sap flux densities, cacao leaf litterfall (18%), Gliricidia leaf litter-fall (2%), soil carbon dioxide efflux (14%), and cacao yield (10%) during roof closure. However, cacao bean yield in roof plots was substantially lower (45%) compared with control plots during the main harvest following the period when soil water content was owest. This indicates that cacao bean yield was more sensitive to drought than other ecosystem functions. We found evi-dence in this agroforest that there is complementary use of soil water resources through vertical partitioning of water uptake between cacao and Gliricidia . This, in combination with acclimation may have helped cacao trees to cope with the induced drought. Cacao agroforests may thus play an important role as a drought-tolerant land use in those (sub-) tropical regions where the frequency and severity of droughts is projected to increase.
The author provided and analyzed data on climate, soil water content, soil water storage, and sap
flux characteristics, all of which were gathered in the agroforest in Indonesia. Help was also
given in the preparation of the manuscript.
XIV

OVERVIEW PUBLICATIONS
XV
Spatial and temporal effects of drought on soil CO2 efflux in a cacao agroforestry system in Sulawesi, Indonesia
van Straaten, O., Veldkamp, E., Köhler, M., Anas, I.,
Biogeosciences 7, 1223–1235
Abstract: Climate change induced droughts pose a serious threat to ecosystems across the tropics and sub-tropics, particularly to those areas not adapted to natural dry periods. In order to study the vulnerability of cacao (Theobroma cacao) - Gliricidia sepium agro-forestry plantations to droughts a large scale throughfall displacement roof was built in Central Sulawesi, Indonesia. In this 19-month experiment, we compared soil surface CO2 efflux (soil respiration) from three roof plots with three adjacent control plots. Soil respiration rates peaked at intermediate soil moisture conditions and decreased under increasingly dry conditions (drought induced), or increasingly wet conditions (as evidenced in control plots). The roof plots exhibited a slight decrease in soil respira-tion compared to the control plots (average 13 % decrease). The strength of the drought effect was spatially variable – while some measurement chamber sites reacted strongly (responsive) to the decrease in soil water content (up to R2 = 0.70) (n = 11), others did not react at all (non-responsive) (n = 7). A significant correlation was measured between ‘responsive’ soil respiration chamber sites and sap flux density ratios of cacao (R = 0.61) and Gliricidia (R = 0.65). Leaf litter CO2 respiration decreased as conditions became drier. The litter layer contributed approximately 3 - 4 % of the total CO2 efflux during dry periods and up to 40 % during wet periods. Within days of roof opening soil CO2 efflux rose to control plot levels. Thereafter, CO2 efflux re-mained comparable between roof and control plots. The cumulative effect on soil CO2 emissions over the duration of the ex-periment was not significantly different: the control plots respired 11.1 ± 0.5 Mg C ha-1 yr-1, while roof plots respired 10.5 ± 0.5 Mg C ha-1 yr-1. The relatively mild decrease measured in soil CO2 efflux indicates that this agroforestry ecosystem is capable of mitigating droughts with only minor stress symptoms.
The author provided data on soil water content and sap flux density, modeled soil water drainage
data, and provided feedback on the manuscript.

XVI

CHAPTER 1 INTRODUCTION
CHAPTER 1 INTRODUCTION
1

2

CHAPTER 1 INTRODUCTION
The tropical regions of the world have faced dramatic losses in forest cover and are still sub-
ject to high rates of rainforest conversion today. Since 1980, 288 million hectares of tropical rain-
forests (21% of the global cover) have been deforested (Bawah et al., 2004). But alongside defor-
estation, there are also growing efforts to re-establish forest on formerly deforested lands with
the goal of mitigating problems such as loss of biodiversity, soil degradation, erosion, flooding
and salinization which often occur in deforested areas. Reforestation in tropical regions also pre-
sents an opportunity to increase global carbon sequestration (Canadell and Raupach, 2008). Al-
though considerable credit is given to the natural regrowth potential of cleared forest areas, espe-
cially adjacent to remnant forest (Uhl et al, 1988; Woodford, 2000), the active planting of trees is
the most common reforestation method (Catterall at al., 2004). The FAO recently reported that
the rate of rainforest conversion has slowed due to both increased reforestation and regeneration
(FAO, 2005). A wide range of reforestation methods exist, spanning from attempts to restore
rainforest-like vegetation (e.g. Freebody and Vize, 1999) to the installation of commercial tree
monocultures. Much attention is given to mixed reforestation stands which are comprised mainly
of native species but also often include exotic species. Such stands can strike a balance between
the ecological benefits of natural rainforest-like vegetation and the productive efficiency of tree
monocultures. Mixed stands can be adapted to specific sites, growing conditions, and end uses
through the choice of species used (Butterfield, 1995; Hartley, 2002; Piotto et al., 2004). There is
evidence that mixed stands may be more productive than monocultures (Erskine et al., 2006;
Piotto, 2008) and can potentially harbor high levels of biodiversity (Leakey, 1999; Hartley, 2002).
Nonetheless, the need for income generation and/or food security for the local population is a
crucial consideration if reforestation is to be successful.
Agroforests, which are combinations of shade trees and crops, present great potential for
combining the conservation of tropical biodiversity with economically beneficial production
(Schroth et al., 2004). Among other agroforestry systems, the traditional production of cacao and
coffee offer a “glimpse of hope” to conservationists because both can be grown in “natural for-
est like” conditions under a variety of shade trees. Furthermore, these crops are also of high eco-
nomic importance and therefore provide a valuable compromise between conservation of tropi-
cal forest biodiversity and income security for the local population (Rice and Greenberg 2000;
Clough et al., 2009). Ironically, the extension of cacao production is a driver of deforestation in
West Africa and Indonesia. However, with political will and good institutional measures, cacao
agroforestry could provide a means to establish buffer zones around natural reserves or to pro-
mote reforestation on deforested land (Rice and Greenberg, 2000). Another benefit is discussed
by Verchot et al. (2007), who emphasizes that agroforestry can provide a means for tropical agri-
3

CHAPTER 1 INTRODUCTION
cultural production to adapt to climate change and thereby decrease the vulnerability of local
populations. The potential of agroforests to adapt to reduced precipitation is of particular impor-
tance since it is predicted that global warming will increase the frequency and/or severity of
droughts in the (sub-) tropics (Sheffield and Wood, 2008). Agroforests’ improved resiliency to
drought is seen mainly in trees’ capacity to draw water from deeper soil layers and in the provi-
sion of shade to main crops (Verchot et al., 2007). It is well known that deep rooting systems
enable trees to maintain high transpiration rates throughout dry spells by allowing access to deep
soil water storage (Jipp et al., 1998; Klinge et al., 2001; Sommer et al., 2003). Additionally, the
passive transport of water via tree roots from wet to dry soil, a process also referred to as “hy-
draulic redistribution” (Caldwell and Richards, 1989; Dawsen, 1993; Burgess at al., 1998), might
help associated crops to withstand drought events. However, the specific nature of interaction
between species (complementary water use or competition for water) in agroforestry is heavily
dependent on species selection, tree spacing, and other management practices (Schroth, 1999). A
method commonly used to study the ecosystem scale effects of water limitation in forested areas
is the artificial reduction or exclusion of canopy throughfall by means of plastic roofs installed
below the tree crowns. In tropical regions, such experiments have, up to this point in time, only
been conducted in natural rain forests (Nepstad et al., 2002; Belk et al., 2007; Fisher et al., 2007).
The way in which other vegetation types react to water limitation cannot be generalized from
these experiments, especially because hydrological regimes are expected to undergo large changes
following rainforest conversion (Bruijnzeel, 1996). These effects may be attributed to specific
interception characteristics of the planted vegetation (see Zhang et al., 1999), to differences of
water use characteristics of planted exotic trees compared to native species, but also to the spe-
cific stand structure of planted forests like the limited diameter range of trees and the homoge-
nous layout of the stands. In particular, the role of agroforests in buffering against impacts of
climate change, such as increased droughts, is still poorly understood (Verchot et al., 2007).
It is, however, quite certain that the characteristics of agroforests and reforestations de-
scribed above are contributing to a heated debate. While on the one hand these land use systems
allow for better use of stored soil water and mitigate drought effects, on the other hand, there is
also evidence that reforestation of grassland, agricultural fields or other land use types into tree
based land use may decrease stream water flow and groundwater recharge (Bruijnzeel, 2004;
Jackson et al., 2005; van Dijk and Keenan, 2007). A global synthesis of relevant studies con-
cluded that annual runoff was on average reduced by 44% and by 31% when reforesting grass-
and shrubland, respectively (Farley et al., 2005). In addition to hydraulic redistribution and deep
rooting systems, a series of other mechanisms are responsible for the different hydrological be-
4

CHAPTER 1 INTRODUCTION
havior of forest (-like) vegetation as compared to other vegetation types. Most importantly, for-
ests generally exhibit higher evapotranspiration rates than grass or crop dominated vegetation, an
effect due to strong coupling to the atmosphere, low albedo and high leaf area (Zhang et al.,
1999). The rough and dense canopy of forested areas causes high interception rates and fosters
evapotranspiration. A compilation of 250 water balance studies from catchments around the
world with varying types of vegetative cover reveals the strong influence of vegetation on
evapotranspiration, especially in tropical areas with high rainfall (Figure 1, Zhang et al., 1999).
Figure 1: Relationship between annual evapotranspiration and rainfall for different vegetation types (Adapted from Zhang et al., 1999)
Vegetation characteristics and species mixture also exert strong influence on forest hydrology
and water use itself (Zhang et al., 1999; Bigelow, 2001; Bruijnzeel, 2004; van Dijk and Keenan,
2007; Malmer et al., 2010). This may explain the considerable scatter around the upper curve in
Figure 1. Unfortunately, the appropriate species selection to balance both production goals and
water consumption is difficult to determine due to limited knowledge about the water use char-
acteristics of trees, even species commonly used for reforestation or agroforestry (Bruijnzeel,
2004). For example, in the case of cacao, one of the most important cash crops throughout the
tropics, this author’s search revealed only a single study (Colas et al., 1999) assessing the water
use of individual trees in relation to environmental components and stand characteristics. Fur-
ther, only one such study could be found for Gliricidia sepium, a leguminous shade tree widely
used in agroforestry (Tournebize and Boistard, 1998).
Even more problematic is that recent studies in old-growth forests suggest that water use
rates of different trees species share a joint relationship with physical characteristics such as sap-
5

CHAPTER 1 INTRODUCTION
wood area and stem diameter or tree biomass (Meinzer et al., 2001; Meinzer et al., 2005; McJan-
net et al., 2007). Meinzer et al. (2001) found strong positive correlations between tree diameter
and active sapwood area, as well as strong negative correlations between tree diameter and
maximum or total daily sap flux density for 24 tree species in an old growth tropical rainforest in
Panama. Since tree water use is calculated from sap flux density and active sapwood area, these
findings would imply that species selection has no influence on tree water use rates. Two other
studies confirmed this finding for Australian rainforests (McJannet et al., 2007) and for 23 tropi-
cal and temperate tree species in a cross continental comparison (Meinzer et al., 2005), although
the latter study also suggested that different relations exist for particular functional groups. These
findings do support the hypothesis that plants exposed to similar environmental conditions
might develop similar physiological adaptations (Meinzer, 2003).
However, other studies have found that sap flux density increases with tree size (Granier et
al., 1996; Oren et al., 1999), which is directly contradictory to findings of Meinzer et al. (2001),
while other studies found no relation at all (Phillips et al., 1999). In addition, since the studies of
Meinzer et al. (2001), Meinzer et al. (2005), and McJannet et al. (2007) were conducted studies in
old growth forests, it is questionable whether these results can be applied to reforestations or
agroforests where tree diameters are generally smaller. It is also important to consider that tree
distribution, tree height and two dimensional growing spaces in man made vegetation systems
are homogenous, and such conditions might emphasize species differences. Particularly in agro-
forests, shading regimes (van Kanten and Vaast, 2006) and specific complementary effects (Rao
et al., 1997) might also exert considerable influence on tree water use.
The first objective of the research conducted for this dissertation was to contribute to the
still incomplete body of knowledge on water use characteristics of commercially important tree
species. For this purpose, a traditional cacao/Gliricidia agroforestry system in Central Sulawesi,
Indonesia was chosen as the site for an extensive study aimed at identifying the arboreal and en-
vironmental structural factors influencing water use.
Secondly, data was analyzed to find whether species selection could be an appropriate tool to
manage water use rates in reforestations and agroforests, or if universal rules relating tree size to
water use found in old growth forests apply to these forest types as well. This question was ad-
dressed by compiling data from the Indonesian study with results from Panama and the Philip-
pines, resulting in a cross continental comparison of more than 100 trees belonging to 17 species.
The final goal was then to examine how the agroforest ecosystem responds to reduced soil
water availability. To this end, a replicated throughfall reduction experiment was conducted in
6

CHAPTER 1 INTRODUCTION
the cacao/Gliricidia agroforest mentioned above. Net precipitation was reduced by 71 % as com-
pared to a control for 13 months. Trees’ sap flux response to reduced throughfall was compared
to that of the control. To fully understand the hydrological impacts of the reduced throughfall,
we also analyzed the changes in stand level soil water partitioning, measured as changes in tran-
spiration, as well as drainage and soil moisture storage, which we incorporated through the use of
a simple soil water transport model.
References Bawa, K.S., Kress, W.J., Nadkarni, N.M., 2004. Tropical ecosystems into the 21st century. Science 306, 227–228.
Belk, E. L., Markewitz, D., Rasmussen, T. C., Carvalho, E. J. M., Nepstad, D. C., Davidson, E. A., 2007. Modeling
the effects of throughfall reduction on soil water content in a Brazilian Oxisol under a moist tropical forest. Water
Resour. Res. 43, W08432.
Bigelow, S., 2001. Evapotranspiration modelled from stands of three broad-leaved tropical trees in Costa Rica. Hy-
drological Processes, 15, 2779-2796.
Bruijnzeel, L.A., 1996. Predicting the hydrological impacts of land cover transformation in the humid tropics: the
need for integrated research. In: Gash, J.H.C., Nobre, C.A., Roberts, J.M., Victoria, R.L. (Eds.), Amazonian defor-
estation and climate. John Wiley & Sons, New York, 15–55.
Bruijnzeel, L.A., 2004. Hydrological functions of tropical forests: not seeing the soil for the trees? Agriculture, Eco-
systems and Environment, 104, 185-228.
Burgess, S.S.O., Adams, M.A., Turner, N.C., Ong, C.K., 1998. The redistribution of soil water by tree root systems.
Oecologia 115, 306–311.
Butterfield R.P., 1995. Promoting biodiversity: Advances in evaluating native species for reforestation. Forest Ecol-
ogy and Management, 75 (1-3), 111-121.
Caldwell, M.M., Richards, J.H., 1989. Hydraulic lift: water efflux from upper roots improves effectiveness ofwater
uptake by deep roots. Oecologia 79, 1–5.
Canadell, J.G., Raupach, M.R., 2008. Managing Forests for Climate Change Mitigation. Science 320 no. 5882, 1456 –
1457.
Catterall, C. P., Kanowski, J., Wardell-Johnson, G. W., Proctor, H., Reis, T., Harrison, D., Tucker, N. I. J., 2004.
Quantifying the biodiversity values of reforestation: perspectives, design issues and outcomes in Australian rain-
forest landscapes. In: Lunney, D. (Ed.), Conservation of Australia’s forest fauna, vol. 2. Royal Zoological Society
of New South Wales, Sydney, Australia, 359–393.
Clough, Y., Faust, H., Tscharntke, T., 2009. Cacao boom and bust: Sustainability of agroforests and opportunities
for biodiversity conservation. Conservation Letters 2, 197-205.
Colas, H., Mouchet, S., Rey, H., Kitu, W.T., 1999. Une approche du comportement hybrique du cacaoyer (Theo-
broma cacao L.) par des mesures de flux de sève brute : comparaison entre une culture pure et une culture asso-
ciée sous cocotier (Cocos nucifera L.) In: Efficacité de la production cacaoyère et la qualité du cacao au 21è. Actes.
Lagos : Cocoa Producers' Alliance, 637-644. Conférence internationale sur la recherche cacaoyère. 12, 1996-11-
17/1996-11-23, Salvador de Bahia, Brésil.
7

CHAPTER 1 INTRODUCTION
Dawson, T.E., 1993. Hydraulic lift and water use by plants—implications for water balance, performance and plant-
plant interactions. Oecologia 95, 565–74.
Erskine, P.D., Lamb, D., Bristow, M., 2006. Tree species diversity and ecosystem function: Can tropical multi-
species plantations generate greater productivity? Forest Ecology and Management, 233, 205-210.
FAO, 2005. Global Forest Resources Assessment 2005. FAO Forestry Paper 147. FAO, Rome.
Farley, K.A., Jobbagy, E.G., Jackson, R.B., 2005. Effects of afforestation on water yield: a global synthesis with im-
plications for policy. Global Change Biology 11, 1565-1576.
Fisher, R. A., Williams, M., da Costa, A. L., Malhi, Y., da Costa, R. F., Almeida, S., Meir, P., 2007. The response of
an eastern Amazonian rain forest to drought stress: results and modelling analyses from a through-fall exclusion
experiment. Glob. Change Biol. 13, 2361–2378.
Freebody, K., Vize, S., 1999. Local government’s role in rainforest establishment and management in north Queen-
sland. In: Boyes, B. (Ed.). 1998. Rainforest Recovery for the New Millennium, World Wide Fund for Nature
South-East Queensland Rainforest Recovery Conference, WWF, Sydney, 198-205.
Granier, A., Huc, R., Barigah, S.T., 1996. Transpiration of natural rain forest and its dependence on climatic factors.
Agricultural and Forest Meteorology, 78, 19-29.
Hartley, M. J., 2002. Rationale and methods for conserving biodiversity in plantation forests, Forest Ecology and
Management, 155 (1-3), 81-95.
Jackson, B. J., Jobbagy, E. G., Avissar, R., Roy, S. B., Barrett, D. J., Cook, C. W., Farley, K. A., le Maitre, D. C.,
McCarl, B. A., Murray, B. C., 2005. Trading water for carbon with biological carbon sequestration. Science 310,
1944-1947.
Jipp, P. H., Nepstad, D. C., Cassel, D. K., Reis de Carvalho, C., 1998. Deep soil moisture storage and transpiration
in forests and pastures of seasonally-dry Amazonia. Climatic Change 39, 395-412.
Klinge, R., Schmidt, J., Fölster, H., 2001. Simulation of water drainage from a rain forest and forest conversion plots
using a soil water model. Journal of Hydrology 246, 82-95.
Leakey, R. R. B., 1999. Agroforestry for biodiversity in farming systems. In: Collins, W.W., Qualset, C.O. (Eds.),
Biodiversity in Agroecosystems. CRC Press, Boca Raton, USA, 127-145.
Malmer, A., Murdiyarso, D., Bruijnzeel, L. A., Ilstedt, U., 2010. Carbon sequestration in tropical forests and water: a
critical look at the basis for commonly used generalizations. Global Change Biology, 16, 599–604
McJannet, D., Fitch, P., Disher, M., Wallace, J., 2007. Measurements of transpiration in four tropical rainforest types
of north Queenland, Australia. Hydrological Processes, 21, 3549-3564.
Meinzer, F. C., Goldstein, G., Andrade, J. L., 2001. Regulation of water flux through tropical forest canopy trees: Do
universal rules apply? Tree Physiology, 21, 19-26.
Meinzer, F. C., 2003. Functional convergence in plant responses to the environment. Oecologia, 134, 1-11.
Meinzer, F. C., Bond, B. J., Warren, J. M., Woodruff, D. R., 2005. Does water transport scale universally with tree
size? Functional Ecology, 19, 558-565.
Nepstad D. C., Moutinho P., Dias-Filho M. B., Davidson E., Cardinot G., Markewitz D., Figueiredo R., Vianna N.,
Chambers J., Ray D., Guerreiros J. B., Lefebvre P., Sternberg L., Moreira M., Barros L., Ishida F. Y., Tohlver I.,
8

CHAPTER 1 INTRODUCTION
Belk E., Kalif K., Schwalbe K., 2002. The effects of partial throughfall exclusion on canopy processes, above-
ground production, and biogeochemistry of an Amazon forest. J. Geophys. Res. 107, 53-1 – 53-18.
Oren, R., Phillips, N., Ewers, B. E., Pataki, D. E., Megonigal, J. P., 1999. Sap-flux-scaled transpiration responses to
light, vapor pressure deficit, and leaf area reduction in a flooded Taxodium distichum forest. Tree Physiology, 19,
337-347.
Phillips, N., Oren R., Zimmermann, R., Wright, S.J., 1999. Temporal patterns of water flux in trees and lianas in a
Panamanian moist forest. Trees 14, 116–123.
Piotto, D., Viquez, E., Montagnini, F., Kanninen, M., 2004. Pure and mixed forest plantations with native species of
the dry tropics of Costa Rica: a comparison of growth and productivity. Forest Ecology and Management, 190,
359-372.
Piotto, D., 2008. A meta-analysis comparing tree growth in monocultures and mixed plantations. Forest Ecology
and Management, 255, 781-786.
Rao, M. R., Nair, P. K. R., Ong, C. K., 1997. Biophysical interactions in tropical agroforestry systems. Agroforestry
Systems 38, 3-50.
Rice, R. A., Greenberg R., 2000. Cacao cultivation and the conservation of biological diversity. Ambio 29, 167–173.
Schroth G., 1999. A review of belowground interactions in agroforestry, focusing on mechanisms and management
options.Agroforest Syst 43: 5–34.
Schroth, G., da Fonseca, A. B., Harvey, C. A., Gascon, C., Vasconcelos, H. L., Izac, A. M. N., 2004. Agroforestry
and Biodiversity Conservation in Tropical Landscapes. Island Press, Washington, USA.
Sheffield J., Wood, E. F., 2008. Projected changes in drought occurrence under future global warming from multi-
model, multi-scenario, IPCC AR4 simulations. Clim. Dynamics 31, 79-105.
Sommer, R., Fölster, H., Vielhauer, K., Maklouf Carfvalho, E. J., Vlek, P. L. G., 2003. Deep Soil Water Dynamics
and Depletion by Secondary Vegetation in the Eastern Amazon. Soil Sci. Soc. Am. J. 67, 1672-1686.
Tournebize R., Boistard S., 1998. Comparison of two sap flow methods for the estimation of tree transpiration,
Ann. Sci. For. 55, 707–713.
Uhl, C., Buschbacher, R., Serro, E. A. S., 1988. Abandoned pastures in eastern Amazonia. I. Patterns of plant suc-
cession. Journal of Edology 76, 663 – 881.
van Dijk, A. I. J. M., Keenan, R. J., 2007. Planted forests and water in perspective. Forest Ecology and Management,
251, 1-9.
van Kanten, R., Vaast, P., 2006. Transpiration of arabica coffee and associated shade tree species in sub-optimal,
low-altitude conditions of Costa Rica. Agroforestry Systems 67, 187-202.
Verchot, L. V., van Noordwijk, M., Kandji, S., Tomich, T. P., Ong, C. K., Albrecht, A., Mackensen, J., Bantilan, C.,
Anupama, K. V. Palm, C., 2007. Climate change: linking adaptation and mitigation through agroforestry, Mitig.
Adapt. Strat. Glob. Change 12, 901-918.
Woodford, R., 2000. Converting a dairy farm back to rainforest: the Rocky Creek Dam story. Ecological Manage-
ment and Restoration 1, 83-92.
9
CHAPTER 1 INTRODUCTION
10
Zhang L., Dawes W. R., Walker G. R., 1999. Predicting the Effect of Vegetation Changes on Catchment Average
Water Balance. Cooperative Research Centre for Catchment Hydrology, CSIRO Land and Water, Canberra, ACT,
Australia.

CHAPTER 2 METHODOLOGY
CHAPTER 2 METHODOLOGY
11

12

CHAPTER 2 METHODOLOGY
2.1 Overview
The general goal guiding the research presented in this dissertation was to describe the tree sap
flux patterns, tree water use and overall stand transpiration of tropical woody vegetation and
how these are affected by species type, tree structure, overall stand characteristics, and environ-
mental conditions. To begin, sap flux patterns of cacao and Gliricidia trees were analyzed, em-
ploying data gathered from an agroforest located in Central Sulawesi, Indonesia. This work was
conducted within the ‘Stability of Rainforest Margins in Indonesia’ project (STORMA). The next
step was to compare the results of this study with similar observations made in other stands
across the tropics. Data from the cacao agroforest in Indonesia was combined with data from
additional stands, namely a mono-specific reforestation in Panama and a mixed reforestation
stand in the Philippines (Figure 1), in order to gain a broader perspective of the water use charac-
teristics of planted stands. Field work and data collection within these stands was conducted by
the ‘Tropical Silviculture and Forest Ecology’ working group, namely Diego Dierick (Philippines)
and Norbert Kunert (Panama).
Within the framework of STORMA the author could also seize the chance to broaden the
observations of sap flux response towards environmental factors with an experimental approach
Mono-specific Reforestation
(Panama)
Mixed Reforestation (Philippines)
Cacao Agroforest (Indonesia)
Figure 1: Study sites where data on sap flux was collected (Map adapted from www.mz1000s.de).
13

CHAPTER 2 METHODOLOGY
of whole ecosystem throughfall reduction, where effects of soil water availability on sap flux
could be studied relatively independently of prevailing weather conditions in comparison to a
control. The study could further be completed with the set up of a simple soil water transport
model which gave valuable insight into soil water partitioning into infiltration, soil moisture stor-
age change, root water uptake and drainage as affected by reduced canopy throughfall. The
model was a useful tool to derive an understanding of the drought response of agroforestry
stands on ecosystem scale and will be of future importance in studies of element cycles in the
soil.
The first part of this methodology chapter now provides a description of the three different
stands in which tree sap flux was studied. Information on climate conditions, potential and actual
vegetation as well as on species selection are given. The next part delineates the set up of the
throughfall reduction experiment conducted in Indonesia and continues with a comprehensive
description of the field set up and the instrumentation used for assessing data on micrometeo-
rological conditions, sap flux and soil water content. Herewith also a brief discussion on the the-
ory of operation of sap flux sensors is given and measurement procedures are explained. Nearly
identical set ups were used to collect the data in the Philippines and in Panama and analytical
methods were the same.
The last part of this chapter is dedicated to the description of a sap flux model which is used
as a diagnostic tool for species comparison and a soil water transport model applied to the Indo-
nesian agroforest. For further details the reader should refer to the corresponding Material and
Methods chapters of the publications given in chapters 3 to 5 of this thesis.
2.2 Study sites and species selection
In Indonesia, field work was conducted in a six-year-old cacao/Gliricidia agroforest located in
the margin zone of the Lore Lindu National Park in Central Sulawesi in the vicinity of the village
of Marena (1.552°S, 120.020°E) at 560 m a.s.l. on a slope of 8-12° inclination. Climate data from
a nearby climate station (Gimpu, 5 km south of Marena at 471 m a.s.l.) collected between 2002
and 2006 revealed average annual temperatures of about 25.5°C and an annual precipitation of
2092 mm y-1 (Kreilein, unpublished data). The soil type at the study site was described as a sandy-
loam Cambisol with high rock fragment content (Leitner, unpublished data). The potential vege-
tation of the study site would be submontane tropical rainforest (Dietz, 2007). This forest how-
ever was removed to clear areas for the production of annual crops (Pak Umar, pers. communi-
cation) which were converted to agroforestry later on following the cacao boom in Sulawesi. Ca-
14

CHAPTER 2 METHODOLOGY
cao trees (Theobroma cacao L., 1030 stems ha-1) grew under a cover of Gliricidia sepium (Jacq.) Kunth
ex Steud shade trees (325 stems ha-1, Figure 2).
Figure 2: Cacao/Gliricidia agroforest in Central Sulawesi. Images taken above and below the cacao crowns.
The average tree height was 5.4 and 9.5 m for cacao and Gliricidia, respectively. Throughout the
study period, cacao trees were pruned in July and December of 2007, while Gliricidia trees were
not pruned. A total of 18 trees per species were selected for the study. Gliricidia trees were well
exposed to the atmosphere and provided shade to cacao. The leaf area index of the stand meas-
ured 5.3 m2 m-2 (Propastin and Erasmi, unpublished data). The ground was free of an herbaceous
understory due to low light availability below the canopy and regular weeding. No other agricul-
tural operations but harvesting the cacao pods every two weeks were conducted. Measurements
of micrometeorological conditions, tree sap flux and soil water dynamics under both ambient
and reduced throughfall conditions were conducted here from February 1, 2007 to June 5, 2008.
For the cross species comparison of water use characteristics in planted forests (including
agroforestry) we chose further stands located in Central Panama and in the Philippines. The
Panamanian study site (Figure 3 A) was located near the village of Sardinilla, Central Panama
(9.317°N, 79.633°W, 70 m asl.), about 50 km north of Panama City. Mean annual precipitation
measured at Barro Colorado Island (at 30 km distance) was 2627 mm, with a distinct dry season
(25-50 mm month-1 from January-March). During the rainy season (May to November) monthly
precipitation was 250 mm. The mean annual temperature of the region is 25.9 °C (STRI, 2009).
The original forest vegetation at the Sardinilla site was probably a tropical moist forest, similar to
that of the Barro Colorado National Monument (Leigh et al., 1996). The study site was clear-cut
in the 1950’s, later used for cropping followed by cattle ranging and replanted in an experimental
approach with native tree species in monocultures. At the time of the study, the stands were 6
years old and stem density was about 1100 stems ha-1. Five tree species were studied with four
replicates each during the rainy season between June and September 2007. These species were
15

CHAPTER 2 METHODOLOGY
Anacardium excelsum Beberto & Balb. ex Kunth, Hura crepitans L., Cedrela odorata L., Tabebuia rosea
(Bertol) D. C. and Lueha seemannii Triana & Planch.
The study site on the Philippines (Figure 3 B) was located on Leyte Island in the Eastern
Visayas. At a climate station at the Visayas State University, Visca, about 2-3 km distant from the
two plots in which the study was conducted, annual average temperature measured 27.5 °C and
annual precipitation was 2753 mm y-1 (PAGASA, 2007). The former natural vegetation in the
region was a species rich lowland dipterocarp rainforest (Langenberger, 2006), which was almost
completely removed by human action. Following the so-called “rainforestation” approach, de-
graded areas where reforested with a mixture of mostly native tree species combining fast grow-
ing and shade tolerant species. Two 12-year-old rainforestation sites were chosen for the study.
Figure 3: Mono-specific reforestation in Panama (A) and mixed reforestation in the Philippines (B). Images by Norbert Kunert (A) and Diego Dierick (B).
A B
Sap flux and water use rates were assessed in ten tree species, eight of which were native to
the region. Native species were Shorea contorta S. Vidal, Parashorea malaanonan Merr., Hopea malibato
Foxw. and Hopea plagata S. Vidal, Vitex parviflora A. L. Juss, Myrica javanica Blume., Sandoricum koet-
jape (Burmf.) Merr. and Durio zibethinus Murray. The exotic species Swietenia macrophylla King
(large-leaved mahogany) and Gmelina arborea Roxb. (gmelina or yemane) included in the study are
commonly planted throughout the tropics. Gmelina however, was not present in the studied re-
16
CHAPTER 2 METHODOLOGY
forestations, but grew in an adjacent plot under comparable site conditions in a 12-year-old
stand. Five individuals per species were chosen for the study and care was taken to select only
trees having well exposed crowns. The study in the Philippines was conducted from November
2005 to September 2006 and from November 2006 to September 2007.
2.3 Experimental design of throughfall reduction
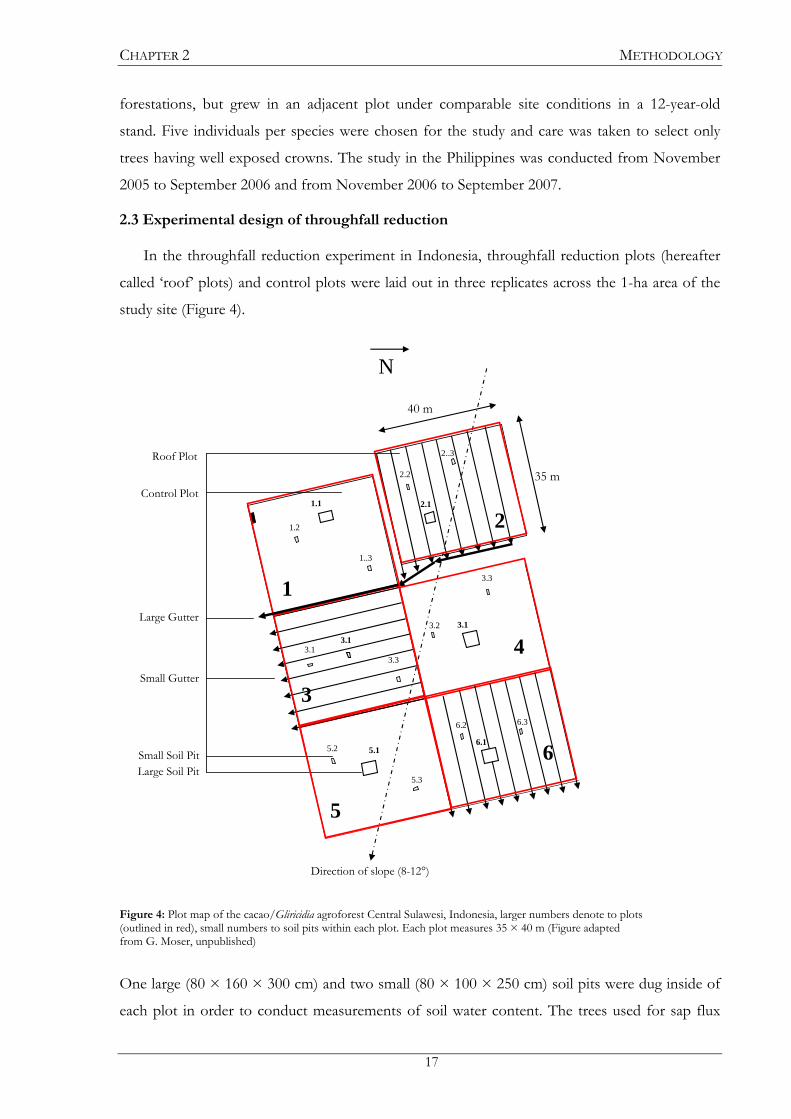
In the throughfall reduction experiment in Indonesia, throughfall reduction plots (hereafter
called ‘roof’ plots) and control plots were laid out in three replicates across the 1-ha area of the
study site (Figure 4).
40 m
1
2
3
4
5
6
N
Direction of slope (8-12°)
1.2
1.1
1..3
3.1 3.1
3.3
5.2 5.1
5.3
3.2 3.1
3.3
6.2
6.1
6.3
2.2
2.1
2..3
Large Gutter
Large Soil Pit Small Soil Pit
Small Gutter
35 m Roof Plot
Control Plot
Figure 4: Plot map of the cacao/Gliricidia agroforest Central Sulawesi, Indonesia, larger numbers denote to plots (outlined in red), small numbers to soil pits within each plot. Each plot measures 35 × 40 m (Figure adapted from G. Moser, unpublished)
One large (80 × 160 × 300 cm) and two small (80 × 100 × 250 cm) soil pits were dug inside of
each plot in order to conduct measurements of soil water content. The trees used for sap flux
17

CHAPTER 2 METHODOLOGY
density measurements were located in proximity to those soil pits. Each of the six plots meas-
ured 40 × 35 m. All measurements were conducted in a central ‘core zone’ (30 × 25 m) to avoid
margin effects. Water intrusion by overland flow to the roof plots was prevented by a 40 cm
deep trench. Since most of the fine roots were located in the upper 40 cm, the trenching also
hindered root water uptake from surrounding plots.
Throughfall was partially excluded using panels made of clear polyethylene foil clamped on
bamboo frames (0.5 × 5 m). The panels were mounted at an average height of about 1.2 m
above ground just below the branching point of cacao trees such that they drained into plastic-
lined, wooden gutters by gravity (Figure 5). The gutters discharged the water from the plots into
an adjacent downhill area. A total of about 80% of the plot area of the roof plots was covered by
bamboo frames and wooden gutters when the roof was finished.
Figure 5: Picture from below and from above the roof installed in the cacao/Gliricidia agroforest in Indonesia.
The throughfall reduction experiment began after the recording of a baseline dataset during
February 2007 on March 1, 2007. Especially during March and April 2007, roof coverage was
lower due to the still ongoing process of setting up the roof (Table 1).
18

CHAPTER 2 METHODOLOGY
Table 1: Average monthly throughfall reduction (%) in roof plots (data from G. Moser, unpub-lished).
Month Throughfall reduction (%)
March 2007 47.5 Apr 58.8 May 78.1 June 83.8 July 79.9 Aug 82.8 Sep 73.1 Oct 79.0 Nov 81.3 Dec 75.0 Jan 2008 81.8 Feb 66.2 March 81.8 Apr 44.6
However, even after full roof coverage was established, small gaps remained around tree
stems and in between the frames. The roof coverage was about 80% until April 10, 2008, where
the roof was opened. The low throughfall reduction percentage given for April 2008 in Table 1 is
a result of averaging throughfall reduction percentages of all days of this month while the roof
was being removed after 10 days.
2.4 Field set up and instrumentation
The most important component of the field set up for all three sites was the installation of
sap flux (Js, g cm-2 h-1) sensors. Additional instrumentation consisted of an automated weather
station installed in a nearby open area to collect global radiation (Rg, J m-2 s-1), relative humidity
(RH, %), air temperature (Tair, °C), and gross precipitation (Pgross, mm), and a soil water monitor-
ing system comprised of up to 72 sensors to measure volumetric soil water content (θ, cm3 cm-3).
In the following section, the author describes the field set up and instrumentation used in Indo-
nesia. Since field set ups were similar for the study sites in Panama and the Philippines, further
details are not given for these studies.
2.4.1 Micrometeorological measurements
Data on air humidity, air temperature (CS215, Campbell Scientific Inc., Logan, UT, USA),
global radiation (CS300, Apogee Instruments Inc., Logan, UT, USA) and rainfall (ARG100, En-
vironmental Measurements Ltd., Sunderland, UK) were gathered at a distance of 30 m from the
study site in an area where shade trees were absent. Measurements were taken at a height of 2 m
above the canopy of cacao trees in order to assess environmental conditions prevalent in the up-
19
CHAPTER 2 METHODOLOGY
per canopy. Data were measured every 5 seconds, and then averaged and logged in 30 min inter-
vals using a CR800 data logger (Campbell Scientific Inc., Logan, UT, USA). Vapor pressure defi-
cit (VPD, kPa) was calculated from air temperature and relative humidity following the precedent
set by FAO (1998).
as ee −=VPD (1)
where es (kPa), the saturation vapor pressure of the air, is calculated as
)3.237()27.17exp(6108.0
air
airs T
Te+
××= (2)
and ea (kPa), the actual vapor pressure, is given by:
100RH×
= sa
ee (3)
Measured global radiation values indicated that the global radiation sensor underestimated
real values from October 2007 onwards due to sensor malfunctioning. To recalibrate the mal-
functioning sensor, reference measurements were conducted with two other sensors in June
2008. A linear regression was derived comparing the daily integrated global radiation measured
by the reference sensors and the measurements taken by the malfunctioning sensor installed at
the climate station. This linear regression was then used to correct the underestimated daily ra-
diation measurements from October 2007 onwards. However, half hourly data could not be re-
produced in this manner, so global radiation data was only used for the description of tree sap
flux if measured prior to October 2007. It was also not possible to account for any gradual shifts
in sensor calibration that might have occurred. This indicates that the accuracy of daily global
radiation data obtained after October 2007 (given as monthly averages) may be questionable.
2.4.2 Sap flux, tree water use, tree- and stand transpiration
At all three study sides, sap flux density was measured using thermal dissipation sensors con-
structed after Granier (1985). Details on sensor construction (see Granier, 1985; Granier, 1987;
Clearwater et al., 1999; James et al., 2002) are described briefly here. Each sensor consisted of a
pair of probes, each probe having a diameter of 1.5 mm and a length of 24 mm. The probes were
inserted in tightly fitting aluminum tubes after receiving an application of heat conductive paste.
The aluminum tubes were then inserted into predrilled holes in the outermost xylem layer of se-
lected trees. The holes were spaced on average 15 cm apart in vertical direction (Figure 6).
20

CHAPTER 2 METHODOLOGY
Figure 6: Configuration of the Granier system for sap flow measurement. Each probe contains a thermocouple. (adapted from Lu et al., 2004)
Tree trunk
Heartw
ood
High Low
Sapwood
Heated probe
Reference probe
Aluminum tubes
Constant current
Thermocouple signal
12 V Power supply
Data Logger
D
irection of Sap flow
The upper (downstream) probe of each sensor was heated by a coil with a constant power of
250 mW, while the lower (upstream) probe remained at the prevailing temperature of the stem.
A copper-constantan junction was located in the center of each probe, and the junctions between
probes were connected to form a thermocouple. When temperature differences between the two
junctions occur, a current proportional to this difference is created and recorded by the data log-
ger. The temperature difference between the sensors was measured every 30 seconds, and aver-
aged and stored every 30 min (CR1000 data logger and AM 16/32 multiplexer, Campbell Scien-
tific Inc., Logan, UT, USA.). The temperature differences measured between the probes are
highly correlated with sap flux densities. With the onset of transpiration after sunrise leading to
sap flux, temperature differences between the probes drop as heat from the downstream probe is
transferred by convection. Temperature differences are of largest magnitude at night time, when
no sap flux occurs. In our study, each tree was equipped with two sensors, usually located on
both the North and South sides of the trunk, because sap flux is subject to circumferential varia-
tions (Lu et al., 2000).
21

CHAPTER 2 METHODOLOGY
The temperature differences recorded were converted to sap flux density (Js, g cm-2 h-1) by
use of an empirically derived equation from Granier (1987):
231.1
ΔΔΔ0119.03600 ⎟
⎠⎞
⎜⎝⎛ −
××=T
TTJ maxs (4)
Where Js is the sap flux density prevalent in the sapwood (g cm-2 h-1); ΔT is the measured
temperature difference (°C); and Tmax is the maximum temperature difference measured at time
of zero flow (°C). The sap flux densities calculated for each of the sensors within one tree were
then averaged.
Granier (1985) recommended recalibration for each tree species. However, the recalibration
procedure is very complex, and since it has been widely reported that the calibration is actually
independent of tree species or wood anatomy (Granier et al., 1990; Lu et al., 2004), we did not
attempt to recalibrate the probes. It was further assumed that nighttime sap flux densities were
negligible because temperature outputs of the thermal dissipation sensors returned to stable val-
ues most nights, suggesting that internal reserves were completely refilled. Moreover, VPD at
night was usually close to zero due to occurrence of rainfall most nights. Insulating boxes made
from Styrofoam shielded the sensors, and for each installation a section of the stem, extending
well above and below the installation point, was covered in reflective foil and plastic foil. These
measures protected sensors against damage, prevented rainwater from entering the set up, and
prevented incident solar radiation from heating the trunk and creating temperature gradients
(Figure 7).
22

CHAPTER 2 METHODOLOGY
Figure 7: Installed sap flux sensor, shielding with Styrofoam, reflective foil and plastic.
In order to accurately calculate daily tree water use (Q, Kg day-1) from sap flux density and
sapwood area, it is necessary to assess active sapwood depth and to account for radial variations
of sap flux density within the active sap wood. Sap flux density usually declines with increasing
xylem depth regardless of wood anatomy (Phillips et al., 1996). Sapwood depth was estimated by
dye application to the whole radius of the tree via drill holes (e.g. Andrade et al., 1998; Meinzer et
al., 2001). On bright days a small reservoir filled with the dye was glued to the stem of a sample
tree. Following this application, a 2 mm wide hole was drilled in radial direction towards the cen-
ter of a sample tree such that the drill was fully submerged in the dye. In this way, air did not en-
ter the drill hole, but dye was taken up by the injured pores and transported in downstream di-
rection. After 2-3 hours, a wood core was taken about 5 cm above the previous drill hole. The
length of the colored section, measured to the nearest mm, was taken as sapwood depth. To as-
sess sapwood activity with increasing depth, profiles of radial sap flux density were measured in
up to 8 trees per species for approximately 10 days. In measuring these profiles, one sensor in-
side of the stem of sample trees remained at the reference depth (0 to 2.4 mm below the cam-
bium), while the other was installed at increasing depth intervals (2.4 to 4.8 cm and 4.8 to 6.2 cm
below the cambium), remaining for at least 3 days at each interval. Daily tree water use was cal-
23

CHAPTER 2 METHODOLOGY
24
culated by summing water flow (flow = flux * area) in the ring-shaped stem cross sections
bounded by the tip and the end of each probe (Edwards et al., 1996):
10001
iisci
ni
ii
AJQwithQQ
×==
=
=
∑ (5)
Where Q (kg d-1) is the water use per tree, Qi the water flow through sapwood ring i, Jsci (g
cm-2 d-1) the cumulative daily sap flux density measured within each sapwood depth, and Ai (cm2)
the ring-shaped area of sapwood bounded by the tip and the end of a probe for a given depth
interval i.
t.
Transpiration rates (Ttree, mm d-1) were derived for individual trees by dividing Q by the
crown projection area of the targeted tree. The stand transpiration rate (Tstand, mm d-1), expressed
per unit ground area, was calculated following Garcia Santos (2007): we derived daily relation-
ships between Q and tree diameters for each species, inserted the known diameters of all other
individuals found in the plot into the respective equations, summed the calculated water use rates
of all trees and divided the result by the area of the plo
2.4.3 Soil water content
Volumetric soil water content was measured in the study site using time domain reflectrome-
try probes (TDR, CS616, Campbell Scientific Inc., Logan, UT) installed at a series of soil depths
in close proximity (~2-5 m) to studied trees. In the one large soil pit in each plot (80 × 160 ×
300 cm), TDR sensors were placed at depths of 10, 20, 40, 75, 150 and 250 cm. Additional sen-
sors were installed at depths of 10, 40 and 75 cm in two smaller soil pits (80 × 100 × 250 m) in
each plot. TDRs were placed at the end of horizontal holes dug into the vertical pit walls. These
holes were then refilled with soil, and the pit walls were covered with plastic foil to prevent
evaporation (Figure 8). It was at times necessary to deviate from the originally proposed field set
up because some of the sensors broke down during the course of the experiment or gave erro-
neous readings. TDR installation was especially hindered by high rock fragment content at
greater depths. For this reason, only two roof plots and two control plots carried TDRs at 150
cm. Additionally, TDRs could only be installed at 250 cm in two control plots and one roof plot.
CHAPTER 2 METHODOLOGY
Figure 8: Soil pit lid (Picture by Oliver van Straaten), view into the pit, TDR installation into the pit walls and plastic covered pit wall. The black wires denote to TDR and the white and green ones to other installations
The probes were calibrated following Veldkamp and O’Brien (2000), using two samples each
from depths of 10, 40 and 70 cm. As there were minimal differences in calibration curves be-
tween depths, one lumped calibration was applied to TDRs at 10, 20, 40 and 75 cm depth. The
calibration equation derived was:
3494.00173.00003.0 2 −+= ττθ (6)
Where θ (m3 m-3) is the volumetric soil water content and τ (µs) is the output period of the
TDR probe. At greater depths, calibration was not possible due to the high content of rock
fragment previously mentioned. Since soil types seemed to be substantially different at all depths
below 75 cm, the manufacturer’s calibration was applied here in substitution of the originally
proposed calibration. Similar calibration procedures were carried out in Panama and the Philip-
pines.
Care was taken to install the TDRs at a distance to rock fragments in order to avoid interfer-
ence with the measurements. However, the prevalence of rock fragments therefore caused an
overestimation of total soil water storage due to the fact that rock fragments have a much lower
water storage capacity than soil. Despite the minimal porosity found in rock fragments (<10%),
25

CHAPTER 2 METHODOLOGY
it was assumed that rock fragments do not hold (plant available) water. To correct for the result-
ing overestimation of soil water storage, all measured volumetric water contents were propor-
tionally reduced to the actual volume of soil that was not occupied by rock fragments.
Following Fiés et al. (2002), measured water content was corrected by:
soilr θVθ ×−= )
1001( (7)
Where θ is the corrected volumetric water content of the mixture of soil and rocks, Vr is the
percentage of total soil volume occupied by rocks and θ soil is the water content originally meas-
ured in distance to rock fragments.
The total volume of rock fragments in the soil was estimated in soil layers of 50 cm depth
down to 250 cm in one pit per plot. Rock fragments were excavated, cleaned, sun-dried and
weighed. Rock volume was calculated from an estimate of rock bulk density derived from the
weight and water displacement of a sub sample of rock fragments. The measured volumetric soil
water contents at 10, 20, 40, 75 cm and 250 cm depth were then corrected using the rock frag-
ment contents from the respective layers. For the water content measured at 150 cm depth the
average rock fraction of the 100-150 and 150-200 cm layers were utilized. The water contents
given in Chapter 3 (Köhler et al., 2009) could not be corrected in this manner since data on rock
fragment bulk density was not available by the time the paper was finished. However, no calcula-
tions of soil water storage, that would be substantially influenced by the absolute magnitude of
soil water content, were carried out in the framework of this publication.
2.5 Sap flux density model
A sap flux density model was employed as a diagnostic tool to analyze the sap flux data sets
from the study sites in Indonesia, Panama, and the Philippines. This allowed the huge datasets to
be scaled down to a few easily comparable variables representing species specific sap flux pat-
terns and sap flux response to environmental conditions. The model’s form originates from a
description of canopy conductance by Jarvis (1976), but it has been widely modified and adapted
to describe stand transpiration or sap flux (e.G. Granier et al., 2000; Cienciala et al., 2000; Oren
and Pataki, 2001; Harris et al., 2004; Whitley et al., 2008). The specific model used in the context
of this work originates from Dierick and Hölscher (2009), whose model is a modification of that
used by O'Brien et al. (2004). In this model, a constant factor a, corresponding to maximal sap
flux density of a specific tree, is multiplied by two non linear response functions, each depending
on a single environmental parameter. This allows the influence of each environmental parameter
to be interpreted separately. Both response functions can take values between zero and one. For
26

CHAPTER 2 METHODOLOGY
example, during the night when global radiation (Rg) is zero, modeled sap flux is forced to be
zero. Rg and VPD were chosen as explanatory variables because analyses revealed that these pa-
rameters where highly correlated with sap flux densities. Soil water content exerted no influence
on Js for trees in the experiments in Panama, the Philippines and Indonesia (before the onset of
the throughfall reduction experiment). However, in the case of Indonesia, the model could also
not be applied in the course of the throughfall reduction experiment because data on global ra-
diation was lacking when soil water content became influential. The final form of the model was:
dc
g
gmodels
exp1
1Rb
RaJ VPD -
+×
+= (8)
Modelled sap flux density Js model reaches a maximum value a (g cm-2 h-1) when all environ-
mental conditions are optimal. Parameter b (J m-2 s-1, or W m-2, note: 1 W = 1 J s-1) can be inter-
preted as a measure of the light saturation level. Assuming VPD is non-limiting, sap flux density
reaches just over 90% of the maximum sap flux density a if radiation levels equal ten times pa-
rameter b. Parameter c (kPa) equals the VPD for which Js model rises to half of the maximum value
(Rg non-limiting), whereby d (kPa) is related to the slope – i.e. the increase in Js model for a given
increase in VPD. Model parameters a, b, c and d in the response functions were estimated by
minimizing the residual sum of squares using a Gauss-Newton algorithm.
2.6 Soil water transport model 2.6.1 Theory
In order to better understand the governing processes of soil water movement in the Indo-
nesian throughfall reduction experiment and to assess differences in the soil water budget meas-
ured as differences in infiltration, drainage, soil moisture storage and root water uptake (transpi-
ration) between roof plots and control plots, we applied the soil water transport model HY-
DRUS-1D (Šimůnek et al., 2008) which numerically solves the Richards equation (Richards,
1931) for variably-saturated water flow. The Richards equation is given by:
Sαxh
Kxt
θ−
⎥⎥⎦
⎤
⎢⎢⎣
⎡⎟⎟⎠
⎞⎜⎜⎝
⎛+= cos
∂
∂
∂
∂
∂
∂ (9)
Where h is the hydraulic head (cm), θ is the volumetric water content (cm3cm-3), t is time
(days), x is the spatial coordinate (cm, positive upward), S is the sink term (cm3cm-3day-1) ac-
counting for root water uptake by plants, and α is the angle between the flow direction and the
vertical axis. In our case α = 0 because we deal only with vertical water flow here. K is the un-
saturated hydraulic conductivity function (cm day-1). The soil water retention, θ(h), and hydraulic
27

CHAPTER 2 METHODOLOGY
28
conductivity, K(h), functions are highly nonlinear functions of the hydraulic head (Šimůnek et al.,
2008). HYDRUS-1D allows for the selection of five different analytical models to describe these
functions. For this study the commonly used soil water retention function given by van Genuch-
ten (1980) was selected:
( ) [ mn
rs
re hα
θθθhθhS -)(1)( +=
−−
= ]
]
(10)
Where Se (cm3 cm-3) is the effective saturation, θ(h) (cm3 cm-3) is the volumetric soil water
content at hydraulic head h (cm), θ s and θr are saturated and residual water content (cm3 cm-3), a
(cm-1) is the inverse of the air entry head, and m and n are dimensionless curve shape parameters
(m = 1 - n-1, (-)). The unsaturated hydraulic conductivity of the soil was described by Mualems’
pore-size distribution model (Mualem, 1976):
[2
)1(1)( mme
λesate SSKSK 1/−−= (11)
Where K(Se) and Ksat are the unsaturated and saturated hydraulic conductivities (cm day-1), and
λ (-) is the tortuosity parameter.
2.6.2 Model parameterization
Vertical soil heterogeneity was modeled using five soil layers (of different materials) in a pro-
file 250 cm deep (251 nodes) such that two layers adjoined at the mean distance between two
TDRs. Lacking sufficient replications of soil water content measurements at 250 cm depth, we
did not parameterize a sixth soil layer but rather extended the fifth layer toward 250 cm. Obser-
vation nodes were set at the respective position of each TDR. Upper boundary conditions were
set to ‘atmospheric with surface run off,’ meaning that water can infiltrate into the soil depending
on the prevailing moisture conditions near the surface (Šimůnek et al., 2008). Any excess water
will create surface run off. ‘Free drainage’ was used as lower boundary such that there is a flux
out of the flow domain equal to the soils’ hydraulic conductivity for a given pressure head at
given time due to gravity. The solution of the Richards’ equation requires knowledge of the ini-
tial water content prevalent at each node. These ‘initial conditions’ were provided by measured
water contents. Time variable boundaries (input variables) were net precipitation (Pnet, (mm)) and
measured stand transpiration. Evaporation from the bare soil was considered negligible because
the soil was well covered with leaf-litter and little radiation reached the ground. Daily throughfall
was calculated by applying a linear regression from weekly gross precipitation (Pgross) and weekly
measured throughfall (Moser, unpublished data) to daily precipitation data (Figure 9).

CHAPTER 2 METHODOLOGY
Figure 9: Weekly throughfall (mm) as function of weekly Gross Precipitation (mm), data from Moser (unpub-lished)
The fine root biomass of each species was measured in layers of 20 cm depth at approxi-
mately 1 m horizontal distance from the nearest tree (data from Moser et al., in press). Rooting
patterns did not change significantly during the course of the experiment (Moser et al., in press).
Fine root biomass declined exponentially with depth: 67% of the total biomass was located in the
top 40 cm and zero was found at 240 cm (Schwendenmann et al., 2010). HYDRUS-1D only al-
lows for input transpiration to be withdrawn from one root system. Therefore fine root biomass
of both species was added together for each depth. The program then derived a normalized root
biomass at each node by linear interpolation between depths. Figure 10 shows the normalized
root distribution alongside the five different soil layers.
29
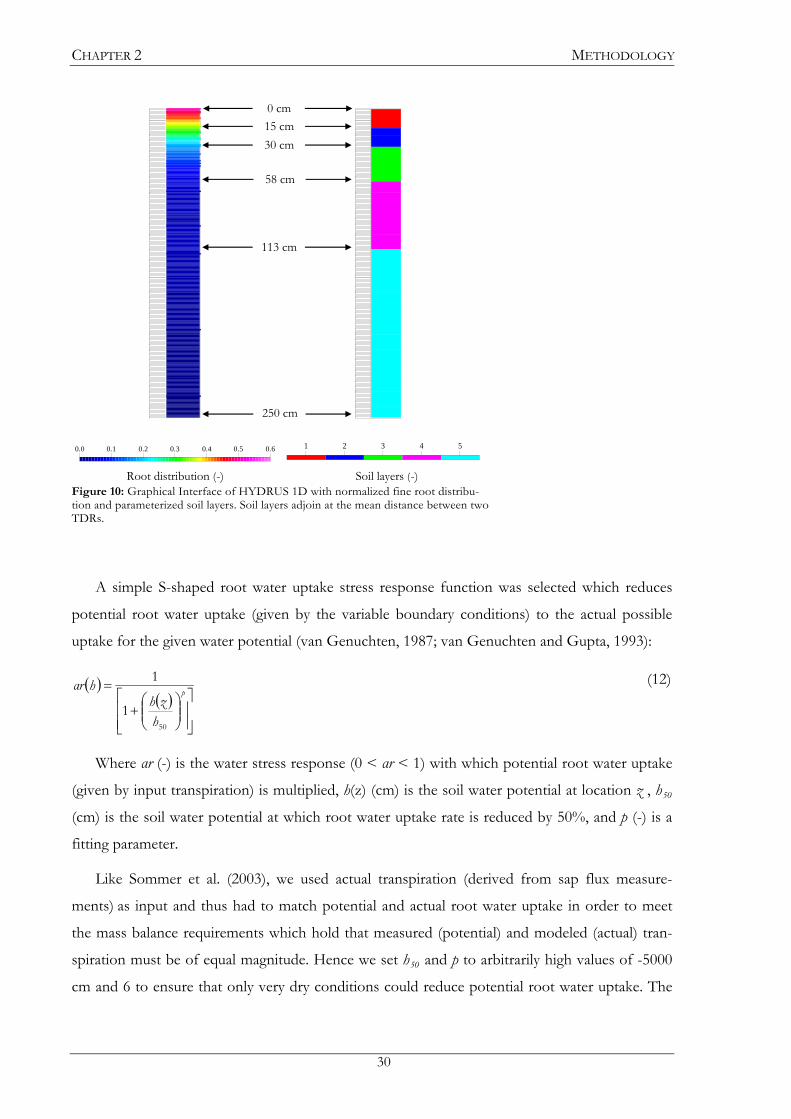
CHAPTER 2 METHODOLOGY
0.0 0.60.1 0.2 0.3 0.4 0.5 1 2 3 4 5
Root distribution (-) Soil layers (-)
15 cm 30 cm
58 cm
113 cm
0 cm
250 cm
Figure 10: Graphical Interface of HYDRUS 1D with normalized fine root distribu-tion and parameterized soil layers. Soil layers adjoin at the mean distance between two TDRs.
A simple S-shaped root water uptake stress response function was selected which reduces
potential root water uptake (given by the variable boundary conditions) to the actual possible
uptake for the given water potential (van Genuchten, 1987; van Genuchten and Gupta, 1993):
( )( )
⎥⎥⎦
⎤
⎢⎢⎣
⎡⎟⎟⎠
⎞⎜⎜⎝
⎛+
=p
hzh
hrα
50
1
1 (12)
Where αr (-) is the water stress response (0 < αr < 1) with which potential root water uptake
(given by input transpiration) is multiplied, h(z) (cm) is the soil water potential at location z , h50
(cm) is the soil water potential at which root water uptake rate is reduced by 50%, and p (-) is a
fitting parameter.
Like Sommer et al. (2003), we used actual transpiration (derived from sap flux measure-
ments) as input and thus had to match potential and actual root water uptake in order to meet
the mass balance requirements which hold that measured (potential) and modeled (actual) tran-
spiration must be of equal magnitude. Hence we set h50 and p to arbitrarily high values of -5000
cm and 6 to ensure that only very dry conditions could reduce potential root water uptake. The
30

CHAPTER 2 METHODOLOGY
root adaptability factor (Šimůnek et al., 2008) was set to zero so that water uptake hindered by
low water potential from one layer could be compensated for by increased uptake from another.
The model was not applied to describe soil water movement in individual plots due to the
fact that T and Pnet consisted of averages taken across all three roof plots and all three control
plots.
2.6.3 Adjustment of soil hydraulic parameters
For the purpose of this study, the main points of interest are the quantification of the re-
maining components of the stand water budget, especially the calculation of timing and volume
of drainage. To accurately monitor these variables it is necessary first to meet the mass balance
requirements (see “Model parameterization”) and second to match the measured soil water contents
to modeled soil water contents. The hydraulic parameters of the van Genuchten function esti-
mated from laboratory pressure plate measurements (van Straaten, unpublished data) were origi-
nally used to parameterize the model. However, primary model runs showed that these parame-
ters were not suitable to describe the water movement processes observed in the field. The
model was unstable and did not converge. It is a common occurrence that laboratory derived
hydraulic parameters differ from field conditions (Rasmussen et al., 1993). Such differences arise
from the high variability of soil pore systems in time and space and across a multitude of scales
(Durner and Lipsius, 2005). In addition, the sampling procedure (Durner and Lipsius, 2005) and
the measurement process itself (Ghezzehei and Or, 2003) can change the behavior of the system
under consideration. Hysteresis may also play an important role in the observed differences be-
cause soil water retention functions are mostly established by drying soil samples, while wetting
and drying events occur in the field (Belk et al., 2007). Thus, in order to model soil water flow,
some adaptation of soil hydraulic parameters is often necessary to derive “effective” hydraulic
parameters representative of the field conditions under consideration (Jhorar et al., 2004; Durner
et al., 2008). For this reason many modeling studies iteratively adjust soil hydraulic parameters
(e.g. Schlegel et al., 2004; Belk et al., 2007). It is also common to inversely adjust these parame-
ters based on evapotranspiration fluxes and soil water contents and/or potentials measured un-
der field conditions (e.g. Vrugt et al., 2001; Jhorar et. al., 2002; Ritter et al., 2003, Sommer et al.,
2003). Both methods seek to minimize deviations between simulated and measured variables.
However, manual adaptation of soil hydraulic parameters is considered somewhat ‘non-scientific’
(Ritter et al., 2003) so this study opted for an inverse adaptation of soil hydraulic parameters.
HYDRUS-1D implements a Marquardt-Levenberg type parameter estimation technique for
the simultaneous fitting of 15 hydraulic parameters (three per layer). The pedotransfer function
31

CHAPTER 2 METHODOLOGY
of the ROSETTA software (Schaap et al., 2001) was used to derive initial estimations of the soil
hydraulic parameters (θ s, θr ,α ,n and Ksat) from soil texture and bulk density for each layer. We set
λ to -1 based on Schaap and Leij (2000) who reported an improved prediction of unsaturated
hydraulic conductivity as compared to the originally suggested λ = 0.5 (Mualem, 1976). In a sen-
sitivity analysis based on the comparison of the root mean square errors (RMSE) of modeled and
predicted water contents, we found θ s, α and n to have the largest impact on model fit. These
were inversely optimized in this study, while θr, and Ksat were taken from the ROSETTA predic-
tion. Because observed water contents entered the objective function during optimization, model
evaluation is not strictly independent (Sommer et al., 2003). Thus it was necessary to separate the
measurement period into calibration and validation phases when evaluating the model’s per-
formance.
References Andrade, J.L., Meinzer, F.C., Goldstein, G., Holbrook, N.M., Cavelier, J., Jackson, P., Silvera, K., 1998. Regulation
of water flux through trunks, branches, and leaves in trees of a lowland tropical forest. Oecologia, 115, 463-471.
Belk, E. L., Markewitz, D., Rasmussen, T. C., Carvalho, E. J. M., Nepstad, D. C., Davidson, E. A., 2007. Modeling
the effects of throughfall reduction on soil water content in a Brazilian Oxisol under a moist tropical forest. Water
Resour. Res. 43, W08432.
Cienciala, E., Kucera, J., Malmer, A., 2000. Tree sap flow and stand transpiration of two Acacia mangium planta-
tions in Sabah, Borneo. Journal of Hydrology, 236, 109-120.
Clearwater, M. J., Meinzer, F. C., Andrade, J. L., Goldstein, G., Holbrook, N. M., 1999. Potential errors in measure-
ments of nonuniform sap flow using heat dissipation probes. Tree Physiology, 19, 681-687.
Dierick D., Hölscher D., 2009. Species-specific tree water use characteristics in reforestation stands in the Philip-
pines. Agricultural and Forest Meteorology, 149, 1317-1326.
Dietz J, 2007. Rainfall partitioning in differently used montane rainforests of Central Sulawesi, Indonesia. Disserta-
tion, Universität Göttingen, 103 pages.
Durner, W., Lipsius, K., 2005. Determining Soil Hydraulic Properties. In: Anderson M.G., McDonnell, J. J., Ency-
clopedia of Hydrological Sciences, Chapter 75, 1021-1144, John Wiley & Sons, Ltd.
Durner, W., Jansen, U., Iden, S.D., 2008. Effective hydraulic properties of layered soils at the lysimeter scale deter-
mined by inverse modeling. European Journal of Soil Science, 59, 114-124.
Edwards, W. R. N., Becker, P., Cermák, J., 1996. A unified nomenclature for sap flow measurements. Tree Physiol-
ogy 17 : 65-67.
FAO, 1998. Crop evapotranspiration - Guidelines for computing crop water requirements - FAO Irrigation and
drainage paper 56, Food and Agriculture Organization of the United Nations, Rome.
Fiès, J. C., De Louvigny, N., Chanzy, A., 2002. The role of stones in soil water retention. European Journal of Soil
Science 53, 95-104.
32

CHAPTER 2 METHODOLOGY
Ghezzehei, T. A., Or, D., 2003. Stress-induced volume reduction of isolated pores in wet soil. Water Resources Re-
search 39(3), 1067.
Granier, A., 1985. A new method of sap flow measurement in tree stems. Annals of Forest Science, 42, 193-200.
Granier, A., 1987. Evaluation of transpiration in a douglas-fir stand by means of sap flow measurements. Tree
Physiology, 3, 309-319.
Granier, A., Bobay, V., Gash, J. H. C., Gelpe, J., Saugier, B., Shuttleworth, W. J., 1990. Vapour flux density and tran-
spiration rate comparisons in a stand of maritime pine (Pinus pinaster Ait.) in Les Landes forest. Agricultural and
Forest Meteorology, 51, 309-19.
Granier, A., Loustau, D., Bréda, N., 2000. A generic model of forest canopy conductance dependent on climate, soil
water availability and leaf area index. Annals of Forest Science, 57, 755-765.
Harris, P. P., Huntingford, C., Cox, P. M., Gash, J. H. C., Malhi, Y., 2004. Effects of soil moisture on canopy con-
ductance of Amazonian rainforest. Agri-cultural and Forest Meteorology 122: 215-227.
James, S. A., Clearwater, M. J., Meinzer, F. C., Goldstein, G., 2002. Heat dissipation sensors of variable length for
the measurement of sap flow in trees with deep sapwood. Tree Physiology, 22, 277-283.
Jarvis, P. G., 1976. The interpretation of the variations in leaf water potential and stomatal conductance found in
canopies in the field. Philosophical Transactions of the Royal Society of London: Series B Biological Sciences,
273, 593-610.
Jhorar, R. K., Bastiaanssen, W. G. M., Feddes R. A., van Dam, J. C., 2002. Inversely estimating soil hydraulic func-
tions using evapotranspiration fluxes. J. Hydrol. 258, 198-13.
Jhorar, R. K., van Dam, J. C., Bastiaanssen, W. G. M., Feddes, R. A., 2004. Calibration of effective soil hydraulic
parameters of heterogeneous soil profiles, Journal of Hydrology, 285, 233–247.
Köhler, M., Dierick, D., Schwendenmann, L., Hölscher, D., 2009. Water use characteristics of cacao and Gliricidia
trees in an agroforest in Central Sulawesi, Indonesia. Ecohydrology 2, 520-529.
Langenberger, G., 2006. Habitat distribution of dipterocarp species in the Leyte Cordillera: an indicator for species-
site suitability in local reforestation programs. Annals of Forest Science, 63, 149-156.
Lu, P., Müller, W. J., Chacko, E. K., 2000. Spatial variations in xylem sap flux density in the trunk of orchard-grown,
mature mango trees under changing soil water conditions. Tree Physiology, 20, 683-692.
Lu, P., Urban, L., Zhao, P., 2004. Granier’s thermal dissipative probe (TDP) method for measuring sapflow in trees:
theory and practice. Acta Bot. Sin. 46 (6), 631–646.
Meinzer, F.C., Goldstein, G., Andrade, J.L., 2001. Regulation of water flux through tropical forest canopy trees: Do
universal rules apply? Tree Physiology 21 : 19-26.
Moser, G., Leuschner, C., Hertel. D., Hölscher, D., Köhler, M., Leitner, D., Michalzik, B., Prihastanti, E.,
Tjitrosemito, S., Schwendenmann, L., The drought response of cacao trees (Theobroma cacao) in a replicated 13-
months desiccation experiment (C. Sulawesi, Indonesia). accepted for publication in Agroforestry systems.
Mualem, Y., 1976. A new model for predicting the hydraulic conductivity of unsaturated porous media. Water Re-
sour Res 12, 513-522.
O'Brien, J. J., Oberbauer, S. F., Clark, D. B., 2004. Whole tree xylem sap flow responses to multiple environmental
variables in a wet tropical forest. Plant, Cell and Environment, 27, 551-567.
33

CHAPTER 2 METHODOLOGY
34
Oren, R., Phillips, N., Ewers, B. E., Pataki, D. E., Megonigal, J. P., 1999. Sap-flux-scaled transpiration responses to light,
vapor pressure deficit, and leaf area reduction in a flooded Taxodium distichum forest. Tree Physiology, 19, 337-347.
PAGASA, 2007. Philippine Atmospheric, Geophysical and Astronomical Services Administration, Philippines, available
from http://www.pagasa.dost.gov.ph (last visited: 20/08/2009).
Phillips, N, Oren R, and Zimmermann R., 1996., Radial patterns of xylem sap flow in non-, diffuse- and ring-porous tree
species. Plant Cell Environment 19 : 983-990.
Rasmussen, T. C., Evans, D. D., Sheets, P. J., Blanford, J. H., 1993. Permeability of Apache Leap Tuff: Borehole and core
measurements using water and air. Water Resour. Res. 29(7), 1997-2006.
Richards, L. A., 1931. Capillary conduction of liquids through porous mediums. Physics, 1 (5), 318–333.
Ritter, A., Hupet, F., Munoz-Carpena, R., Lambot, S., Vanclooster, M., 2003. Using inverse methods for estimating soil
hydraulic properties from field data as an alternative to direct methods. Agric. Water Management 59, 77-96.
Schaap, M. G., Leij, F. J., 2000. Improved prediction of unsaturated hydraulic conductivity with the Mualem-van Genuch-
ten model. Soil Sci. Soc. Am. J. 64, 843-851.
Schaap, M. G., Leij, F. J., van Genuchten, M. T., 2001. ROSETTA: a computer program for estimating soil hydraulic pa-
rameters with hierarchical pedotransfer functions. J. Hydrol. 251, 163-176.
Šimůnek, J., Šejna, M., Saito, H., Sakai, M., van Genuchten, M. T., 2008. The HYDRUS-1D software package for Simulat-
ing the One-Dimensional Movement of Water, Heat, and multiple solutes in variably-saturated media. Department of
environmental sciences University of California Riverside, Riverside, California, USA, Version 4.0.
Schlegel, P., Huwe, B., Teixeira, W. G., 2004. Modelling species and spacing effects on root zone water dynamics using
Hydrus-2D in an Amazonian agroforestry system. Agroforestry Systems 60, 277-289.
Sommer, R., Fölster, H., Vielhauer, K., Maklouf Carfvalho, E. J., Vlek, P. L. G., 2003. Deep Soil Water Dynamics and
Depletion by Secondary Vegetation in the Eastern Amazon. Soil Sci. Soc. Am. J. 67, 1672-1686.
Schwendenmann, L., Veldkamp, E., Moser, G., Hölscher, D., Köhler, M., Clough,Y., Anas, I., Djajakirana, G., Erasmi, S.,
Hertel, D., Leitner, D., Leuschner, C., Michalzik, B., Propastin, P., Tjoa, A., Tscharntke, T., van Straaten, O., 2010. Ef-
fects of an experimental drought on the functioning of a cacao agroforestry system, Sulawesi, Indonesia. Global Change
Biology 16, 1515–1530.
van Genuchten, M. T., 1980. A closed-form equation for predicting the hydraulic conductivity of unsaturated soils. Soil
Sci. Soc. Am. J. 44, 892-898.
van Genuchten, M. T., 1987. A numerical model for water and solute movement in and below the root zone. Res. Rep.
121, U.S. Salinity Lab., Agric. Res. Serv., U.S. Dep. of Agric., Riverside, California.
van Genuchten, M. T., Gupta, S. K., 1993. A reassessment of the crop tolerance response function. Bull. Indian Soc. Soil
Sci. 4, 730-737.
Veldkamp, E., O’Brien, J. J., 2000. Calibration of a frequency domain reflectrometry sensor for humid tropical soils of
volcanic origin. Soil Sci. Soc. Am. J. 64, 1549-1553.
Vrugt, J. A., van Wijk, M. T., Hopmans, J. W., Šimůnek, J., 2001. One, wo, and three-dimensional root water uptake func-
tions for transient modelling. Water Resour. Res. 37, 2457-2470.
Whitley, R., Zeppel, M., Armstrong, N., Mcinnis-Ng, C., Yunusa, I., Eamus, D., 2008. A modified Jarvis- Stewart model
for predicting stand-scale transpiration of an Australian native forest. Plant and Soil, 305, 35-47.

35

36 Picture source: http://klett.de

CHAPTER 3 Ecohydrology 2, 520 - 529
37
Water use characteristics of cacao and Gliricidia trees in an agro-forest in Central Sulawesi, Indonesia
Michael Köhler, Diego Dierick*, Luitgard Schwendenmann & Dirk Hölscher
Tropical Silviculture and Forest Ecology, Burckhardt Institute, Georg-August-Universität Göttingen, Büsgenweg 1, 37077
Göttingen, Germany
Abstract. Water use characteristics of cacao (Theobroma cacao) and Gliricidia sepium shade trees were studied in an agroforest on Sulawesi, Indonesia. The objectives were: (1) to identify environmental and tree structural factors controlling water use, (2) to analyze the effect of shade tree cover on cacao water use, and (3) to estimate stand level transpiration. Sap flux density was meas-ured in up to 18 trees per species and described with a Jarvis-type model. Model parameters suggested a 49% higher maximum sap flux density in cacao than in Gliricidia and species differences in the response to vapour pressure deficit and radiation. Tree water use was positively related to tree diameter in both species, but this relationship tended to differ between species. In cacao trees maximal tree water use increased with decreasing canopy gap fraction above the trees (R2adj = 0.39, p = 0.04). This was paralleled by an increase of cacao stem diameter and leaf area with decreasing gap fraction. Maximum water use rate per unit crown area of cacao was 13% higher than that of Gliricidia . At the stand level the average transpiration rate was estimated at 1.5 mm d-1 per unit ground area, 70% of which was contributed to by cacao. We conclude that, in the given stand, species differed substantially in water use characteristics, while estimated stand transpiration is in line with findings from other studies for cacao stands. Shade trees may enhance stand transpiration through own water use and additionally by increasing water use rates of ca-cao trees.
Keywords: transpiration, sap flux density, Theobroma cacao, Gliricidia Sepium, shade trees, gap fraction
Received 6 February 2009, Accepted 7 May 2009
* Corresponding author. Tel.: +49 551 399556; Fax: +49 551 394019; E-mail address: [email protected]

38

CHAPTER 3 Ecohydrology 2, 520 - 529
1. Introduction
Cacao (Theobroma cacao L.) is one of the most important perennial cash crops world-wide and
is cultivated in many tropical regions. Cacao, being originally an understorey tree of rainforests in
tropical America, is traditionally cultivated below the canopy of shade trees. Shade trees may
originate from natural forest, secondary forest or may be planted at stand establishment. If shade
trees are being planted as e.g. done on already deforested land, often fast growing potentially ni-
trogen fixing trees such as Gliricidia spp. and Erythrina spp. are chosen. Currently, there is a ten-
dency to remove shade trees a few years after establishment, which may give higher cacao yields
at least on a short term basis (Steffan-Dewenter et al., 2007).
However, a physiological production model (Zuidema et al., 2005) did not reveal a strong in-
fluence of moderate shading on cacao yield. Only when shade trees intercepted more than 60%
of available light, a decrease in cacao yield by more than 30% was predicted. Model outcome
rather suggested strong influences of radiation and rainfall during dry periods. The simulated
drought related yield reduction was up to 50% (compared to potential yield) under low rainfall
and adverse soil conditions. Shade trees can probably mitigate negative effects of droughts and
low rainfall as shade reduces evaporative demand of cacao trees and may thereby reduce stress of
cacao plants. On the other hand, shade trees may reduce the water available for cacao trees as
shade trees in cacao cultivation enhance rainfall interception loss and thus increase stand evapo-
ration (Dietz et al., 2006; Poppenborg and Hölscher, in press). Also, shade trees can increase
stand transpiration through their own water use, as well as by enhancing transpiration rates of
associated cacao trees. For coffee in Costa Rica, the estimated stand level transpiration of coffee
grown with shade trees was on average twice as high as that of coffee grown without shade trees
(van Kanten and Vaast, 2006). Coffee plants even showed higher transpiration rates underneath
a shade tree canopy than grown in full sun, which was explained by an enhanced vegetative
growth of coffee under shade (van Kanten and Vaast, 2006). Also for cacao trees in Ghana it
was observed that biomass was higher under shade trees and in a given stand biomass increased
with proximity to shade trees (Isaac et al., 2007).
Stand level evapotranspiration by a cacao plantation (>98% cacao trees) in Central Sulawesi,
Indonesia, was 2.6 mm d−1 as derived from eddy covariance measurements (Falk, 2004). Com-
paring the cacao plantation with natural forest suggested that a much smaller fraction of the
available energy was used for evapotranspiration. In a model based study for cacao with different
shade tree species in Costa Rica (Imbach et al., 1989), evapotranspiration was of similar magni-
tude as for cacao on Sulawesi. To our knowledge only one study determined transpiration rates
39
CHAPTER 3 Ecohydrology 2, 520 - 529
for cacao stands based on sap flux measurements (Colas et al., 1999). This study found compara-
tively low transpiration rates of cacao stands and little to no effect of the presence of a coconut
palm overstorey.
The present study was conducted in an upland region of Central Sulawesi, Indonesia, which
is the third largest country with respect to cacao bean production (FAO, 2009). We studied a 6-
year-old cacao stand with Gliricidium sepium (Jacq.) Kunth ex Steud. shade trees. The stand can be
considered young compared to the productive life span of cacao which may last 50 years, with
highest yields being achieved at 25 to 30 years of age (Montgomery, 1981 as cited in Olaiya et al.,
2006). In this stand we applied xylem sap flux techniques to measure water use at the tree level.
The objectives were: (1) to identify environmental and tree structural factors controlling water
use in the two species, (2) to analyze the effect of shade tree canopy cover on cacao water use,
and (3) to estimate stand level transpiration.
2. Methods 2.1 Study site
The study was conducted in the margin zone of the Lore Lindu National Park in Central Su-
lawesi, Indonesia, in the vicinity of the village of Marena (1.552°S, 120.020°E). Data from a
nearby climate station (Gimpu, 5 km south of Marena at 471 m a.s.l.) collected between 2002 and
2006 showed an average annual temperature of 25.5 °C and an annual precipitation of 2092 mm
y-1 (Kreilein, unpublished data). The soil type at the study site was described as a sandy-loam
Cambisol (Leitner unpublished data). The studied agroforest is located at 560 m a.s.l. on a mild
slope (8-12° inclination) about 30 m above the water level of a nearby river. Cacao grows under a
cover of Gliricidia sepium trees, which originate from cuttings. The stand had a mean stem density
of 1030 cacao and 325 Gliricidia stems ha-1 and covered a total area of 8400 m². Some coconut
trees occurred scattered on the site (23 stems ha-1). The leaf area index of the stand was 5.3 m2 m-
2. Leaf area index for the cacao tree layer was estimated at 3.8 m2 m-2 and for the shade trees in
the stand at 1.3 m2 m-2 (Propastin and Erasmi, unpublished data). During the study period, prun-
ing of cacao trees was carried out in July and December 2007. Gliricidia trees have not been
pruned during the study period. No other agricultural operations but harvesting the cacao pods
every two weeks and manual weeding were conducted.
40

CHAPTER 3 Ecohydrology 2, 520 - 529
2.2 Micrometeorological and soil moisture measurements
Data on air humidity and air temperature (CS215), global radiation (CS300, Apogee Instru-
ments Inc., Logan, UT, USA) and rainfall (ARG100, Environmental Measurements Ltd., Sunder-
land, UK) were gathered at a distance of 30 m from the study stand in an area where shade trees
were absent at a height of 2 m above the canopy of cacao trees. Data were measured every 5 sec-
onds, averaged and logged in 30 min intervals using a CR800 data logger. Measured global radia-
tion values indicated that the global radiation sensor underestimated real values from October
2007 onwards because of sensor malfunctioning. Based on reference measurements made with
two other sensors in June 2008 a correction factor was determined and applied to the data from
October 2007 onwards. Therefore, data obtained after October 2007 on global radiation should
be taken with caution. At the study site, volumetric soil water content was continuously meas-
ured with time domain reflectometry probes (CS616). We installed 8 and 6 probes at 10 and 75
cm depth respectively in 8 soil pits in proximity to the trees studied. Two soil pits could not be
equipped with probes at 75 cm due to high stone content. Data were logged hourly with a
CR1000 logger. The probes were calibrated for the local soil following the procedure described
in Veldkamp and O'Brien (2000).
The calibration equation derived was:
3494.00173.00003.0 2 −+= ττθ
Where θ (cm3 cm-3) is the fractional volumetric soil water content and τ (µs) is the output pe-
riod of the TDR probe. Unless otherwise stated, equipment originated from Campbell Scientific
Inc., Logan, UT, USA.
2.3 Sap flux measurements
Sap flux density was measured with thermal dissipation sensors constructed after Granier
(1987). A sensor consisted of a pair of probes with a diameter of 1.5 mm and a length of 24 mm.
The probes were inserted in tightly fitting aluminium tubes after heat conductive paste was ap-
plied to the probe. These were then inserted into predrilled holes in the outermost xylem spaced
on average 14 cm apart in vertical direction. In cacao the vertical spacing varied at times slightly
because of the rough architecture of the cacao bark which was covered with wounds, flowers
and old pod peduncles. Two thermal dissipation sensors were installed per tree at the north and
south side of the trunk at 130 cm height above the ground in Gliricidia . In cacao the sensors
needed to be installed below the branching point (jorquette) which was located around 60 to 100
cm above the ground. Sensors were shielded by a box made from insulating Styrofoam and a sec-
41

CHAPTER 3 Ecohydrology 2, 520 - 529
tion of the stem, extending well above and below the installation point, was covered in reflective
foil and plastic foil. This protected sensors against damage, prevented rainwater entering the
setup and limited temperature gradients caused by incident solar radiation heating the trunk.
The upper probe of each sensor was heated with a constant power of 250 mW. Temperature
difference between the two probes of each sensor was measured every 30 seconds, averaged and
stored every 30 min (CR1000 data logger and AM 16/32 multiplexer, Campbell Scientific Inc.,
Logan, UT, USA.). The temperature difference was converted to sap flux density (Js in g cm-2 h-1)
according to an empirically derived equation of Granier (1987).
Sap flux density was measured continuously for a 13 month period from February 1st 2007 to
February 29th 2008. If sap flux data for single trees was incomplete during a day due to power
outage or maintenance the specific tree did not enter the calculations on the respective day. If
more than 3 trees per species were not available we did not include the whole day in our species
comparison and the calculation of monthly averages (see Table 4 for the number of days enter-
ing the calculations per month).
During the first month of the study 18 individuals were available per species. Structural char-
acteristics of the trees studied are shown in Table 1. Presented relationships between tree water
use and tree structural characteristics as well as application of the sap flux model were based on
data collected in February 2007. This way we could make use of the 18 replicates. From March
2007 onwards half of the individuals were subjected to drought treatments (Schwendenmann et
al., 2010). The data presented on water use characteristics over the entire study period were
based on the 9 individuals per species growing under ambient conditions.
Table 1: Structural characteristics of the trees studied (mean and standard deviation, n = 18).
2.4 Sap flux model
The species-specific response towards driving forces of sap flux was described using a sap
flux model in analogy to the work of O'Brien et al. (2004). In this way the extensive dataset was
condensed to a set of few parameters which allowed a straightforward comparison between spe-
cies. The model was not used to make any predictions of sap flux densities. Preliminary correla-
tion analyses revealed that Js was highly correlated to Rg and VPD, but not to soil moisture
42

CHAPTER 3 Ecohydrology 2, 520 - 529
43
which was therefore omitted from the model. The specific model form used is a modification of
the Jarvis-model (Jarvis, 1976) and has also been used by Dierick and Hölscher (2009). This
model explains sap flux density Js (g cm-2 h-1) by global radiation Rg (J m-2 s-1) and vapour pressure
deficit VPD (kPa):
dc
g
gmodels
exp1
1Rb
RaJ VPD−
+×
+×=
Modelled sap flux density Js model reaches a maximum value a (g cm-2 h-1) when all environ-
mental conditions are optimal. Parameter b (J m-2 s-1) can be interpreted as a measure of the light
saturation level. Assuming VPD is non-limiting, sap flux density reaches just over 90% of the
maximum sap flux density a if radiation levels equal ten times parameter b. Parameter c (kPa)
equals the vapour pressure deficit for which Js model rises to half of the maximum value (Rg non-
limiting), whereas d (kPa) is related to the slope i.e. the increase in Js model for a given increase in
VPD. Model parameters a, b, c and d in the response functions were estimated by minimizing the
residual sum of squares using a Gauss-Newton algorithm.
2.5 Sapwood area and tree water use
The estimation of water use (Q) for individual trees was based upon the sapwood area of the
tree and the radial changes in Js present in the sapwood. We used two approaches to estimate
both the extent and the activity of conducting sapwood in the trunk cross-section. Sapwood
depth was determined for trees in the same stand by means of a dye staining experiment. Seven
cacao and 14 Gliricidia trees, different from the trees used for sap flux measurement, were se-
lected and sapwood depth was estimated at the respective installation height of the Granier sap
flux sensors. It was decided to use a larger sample for Gliricidia because trees were more variable
in shape and size than cacao. At noon on a bright day a 2.3 mm hole was drilled towards the cen-
tre of the stem of each tree and an Indigocarmin solution was injected into the drill hole. Three
hours later a wood core was taken 50 mm above the injection point using an increment borer.
The length of the coloured section of the wood core was measured to the nearest millimetre and
taken as an estimate of sapwood depth (Andrade et al., 1998; Meinzer et al., 2001).
To assess sapwood activity with increasing depth under the cambium, profiles of radial sap
flux density were measured in 8 trees per species for 10 days. These trees were mostly individuals
that were also being used in the long term sap flux measurements. We employed again two sen-
sors per tree, one of which remained at a depth of 0-24 mm below the cambium (reference
depth) and the other was installed at the opposite side of the stem at 24-48 mm (2nd depth) below

CHAPTER 3 Ecohydrology 2, 520 - 529
cambium. When measuring radial profiles it was necessary to select trees with a sufficiently large
diameter to avoid that the two sensors would influence each other by heat conduction. Other
studies (e.g. Delzon et al., 2004) overcame this problem by placing the two sensors at a sufficient
axial distance to each other. Since the cacao trees had a very low branching point and many of
the Gliricidia trees showed disturbances in the lower parts of the trunk due to former manage-
ment practices we could not opt for this method. A deeper installation at 48-72 mm (3rd depth)
was not applicable since the installation depth would exceed the radius of most of the cacao
trees. In large Gliricidia trees sensors installed at this depth would be in close proximity and po-
tentially influence each other. In addition the staining experiment revealed heartwood formation
at limited depth in large Gliricidia trees (see result section). To our knowledge there is no infor-
mation available in literature on radial profiles of sap flux density for the species studied.
Upscaling from a point measurement (sensor) to tree level water use was done by summing
water flow in a number of ring-shaped stem cross sections (Edwards et al., 1996):
10001
isii
ni
ii
AJQwithQQ ×==
=
=
∑
Where Q (kg d-1) is the water use per tree, Qi is the water flow through ring i, Jsi (g cm-2 d-1) is
the daily integrated sap flux density and Ai (cm2) is the ring-shaped area of sapwood that extents
between the tip and the end of each probe for a given depth interval i. Thus we have an outer
(reference depth) and an inner ring-shaped area (2nd depth). Except for large Gliricidia trees (di-
ameter >12 cm), the stem cross section consisted mainly out of sapwood. Radial profiles of sap
flux density usually show a declining or a Gaussian shape with depth regardless of wood anatomy
(Phillips et al., 1996). Therefore, if sapwood extended beyond the probe tip of the deepest sensor
we approximated the remaining part of the profile assuming that the sap flux density declined
linearly from the tip of the deepest probe to zero at the depth where heartwood formation was
expected. In large Gliricidia trees where sapwood was about 25 mm deep and extended just be-
yond the sensor, tree water use was determined assuming a uniform sap flux density in the sap-
wood. With no additional data on the sap flux density profile available, this assumption seems
reasonable. Moreover, sap flux sensors are expected to integrate flux differences over their
length (Granier et al., 1994; but see Clearwater et al., 1999).
Water use rates of individual trees (kg d-1) were also expressed per unit crown projection area
of that tree to yield tree level transpiration rates (Ttree, mm d-1). The stand transpiration rate (Tstand,
mm d-1) expressed per unit ground area was calculated following Garcia Santos (2007): We de-
rived daily relationships between measured tree water use rates and tree diameters for both spe-
44
CHAPTER 3 Ecohydrology 2, 520 - 529
cies, inserted the known diameters of all other individuals of the plot into the respective equa-
tions, summed the calculated water use rates of all trees and divided the result by the area of the
plot.
2.6 Tree dimension, leaf area and gap size above cacao trees
For trees where sap flux was determined, tree diameter was measured between upper and
lower probes of the sap flux sensor (60-130 cm above ground) with a tape measure. Tree diame-
ter for other trees on the study site was measured at 80 cm height for cacao (low jorquette) and
at 130 cm height for Gliricidia . Tree height was measured for the studied trees by means of a
measuring stake. Additional data was collected for trees in which sap flux density was studied in
the period from October 2007 to mid December 2007. Crown projection area of trees was esti-
mated by measuring the distance from the stem to the edge of the crown in eight cardinal direc-
tions. The crown projection area of a tree was calculated as the sum of eight triangles centred
around the stem. Tree leaf area (m²) was estimated for cacao trees in which sap flux density was
measured. To do so the number of leaves of each tree was counted and multiplied with the aver-
age area per leaf determined from 50 randomly sampled leaves. Also the gap fraction above stud-
ied cacao trees was determined. Hemispherical photographs were taken vertically upward above
each of the 9 study trees with a high resolution digital camera (Coolpix S3 and EC-F8 fisheye
lens, Nikon Coop. Tokyo, Japan). The camera was placed in a levelling device (Regent Instru-
ments Inc., Saint-Foy, QC, Canada) which in turn was mounted on top of a telescopic tripod.
Images were analysed for gap fraction within an angle of 10° from zenith with CanEye 5.0
(INRA, 2007).
2.7 Statistical analyses
The relationships between sap flux density and environmental variables (Rg and VPD) and
between water use and tree structural parameters were tested with linear regressions. The re-
sponse of sap flux density to changes in environmental parameters was evaluated with the above
mentioned non-linear model. In analogy to linear models we calculated an adjusted R2 for this
non-linear model. Additionally root mean square error (RMSE) is given to judge model perform-
ance. Species differences in estimated model parameters, sap flux and water use were evaluated
using a two sided Welch's t-test with a level of significance of p ≤ 0.05. The statistical analyses
were conducted with R version 2.8.0 (R Development Core Team, 2008)
45

CHAPTER 3 Ecohydrology 2, 520 - 529
3. Results 3.1 Micrometeorological and soil moisture measurements
Rainfall during the first 12 months of the study equalled 2937 mm. All months received over
100 mm of rain except for January 2008 where rainfall was only 44 mm (Table 2). The average
volumetric soil water content ranged from 0.38 to 0.45 m3 m-3 depending on depth and time of
observation. Average daily air temperature was between 23.5 and 25.1°C and the average daily
vapour pressure deficit (VPD) ranged from 0.6 to 0.8 kPa (day- and nighttimes were not consid-
ered separately). Integrated daily global radiation (Rg) varied from 15.8 to 20.4 MJ m-2 d-1.
Table 2: Monthly rainfall, meteorological conditions and volumetric soil water content (means and standard deviations) as meas-ured during the study period.
3.2 Sapwood area and radial profiles of sap flux
For cacao, the staining experiment revealed that the stem cross section consisted almost en-
tirely of conducting sapwood. Only the very central portion (< 1 cm radius) of the stem was left
uncoloured in all studied individuals. Also in sampled Gliricidia trees up to 12 cm diameter (4 in-
dividuals) staining showed that the stem was mainly composed of sapwood. In Gliricidia trees
with a larger diameter (10 individuals) only the outer 25 mm of the xylem were active in water
transport, indicating that heartwood formation occurred in these larger trees. The heart- and sap-
wood could also be distinguished based on wood colour. In cacao trees the sap flux density at a
depth of 24 to 48 mm below cambium was on average 82% of the sap flux density in the outer
reference depth. In Gliricidia average normalized sap flux density at that depth was 62%.
46
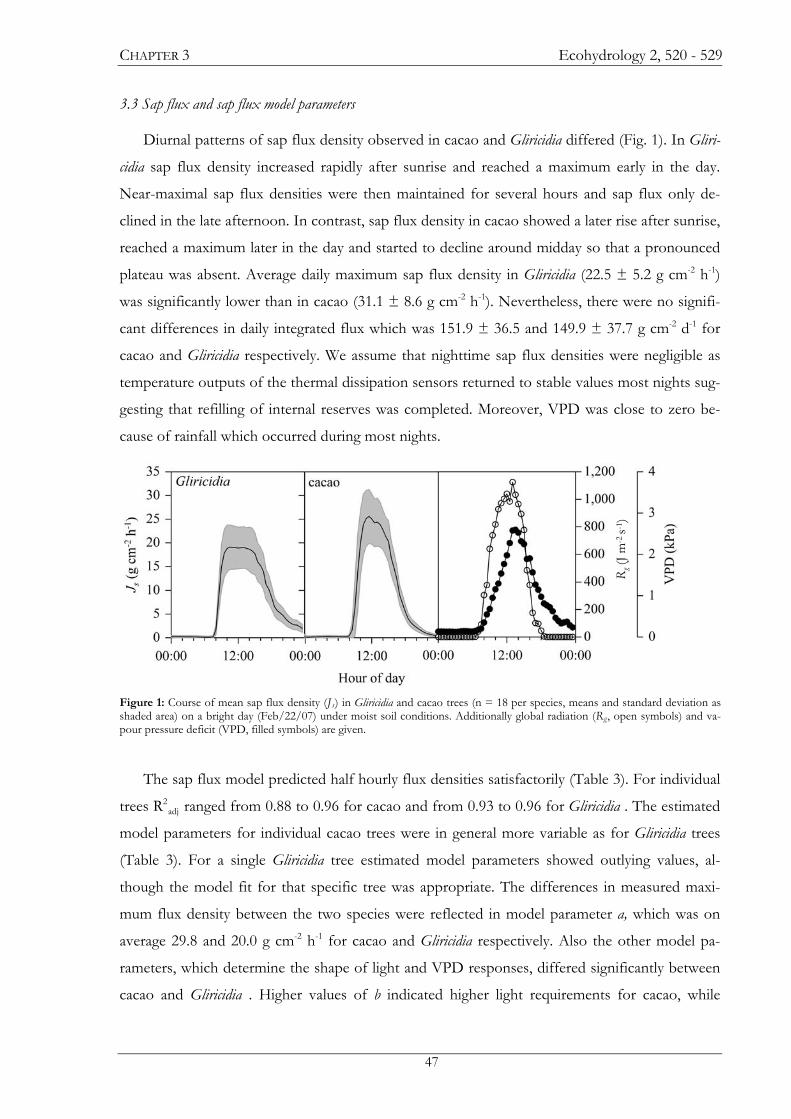
CHAPTER 3 Ecohydrology 2, 520 - 529
3.3 Sap flux and sap flux model parameters
Diurnal patterns of sap flux density observed in cacao and Gliricidia differed (Fig. 1). In Gliri-
cidia sap flux density increased rapidly after sunrise and reached a maximum early in the day.
Near-maximal sap flux densities were then maintained for several hours and sap flux only de-
clined in the late afternoon. In contrast, sap flux density in cacao showed a later rise after sunrise,
reached a maximum later in the day and started to decline around midday so that a pronounced
plateau was absent. Average daily maximum sap flux density in Gliricidia (22.5 ± 5.2 g cm-2 h-1)
was significantly lower than in cacao (31.1 ± 8.6 g cm-2 h-1). Nevertheless, there were no signifi-
cant differences in daily integrated flux which was 151.9 ± 36.5 and 149.9 ± 37.7 g cm-2 d-1 for
cacao and Gliricidia respectively. We assume that nighttime sap flux densities were negligible as
temperature outputs of the thermal dissipation sensors returned to stable values most nights sug-
gesting that refilling of internal reserves was completed. Moreover, VPD was close to zero be-
cause of rainfall which occurred during most nights.
Rg (J
m-2
s-1 )
Figure 1: Course of mean sap flux density (Js) in Gliricidia and cacao trees (n = 18 per species, means and standard deviation as shaded area) on a bright day (Feb/22/07) under moist soil conditions. Additionally global radiation (Rg, open symbols) and va-pour pressure deficit (VPD, filled symbols) are given.
The sap flux model predicted half hourly flux densities satisfactorily (Table 3). For individual
trees R2adj ranged from 0.88 to 0.96 for cacao and from 0.93 to 0.96 for Gliricidia . The estimated
model parameters for individual cacao trees were in general more variable as for Gliricidia trees
(Table 3). For a single Gliricidia tree estimated model parameters showed outlying values, al-
though the model fit for that specific tree was appropriate. The differences in measured maxi-
mum flux density between the two species were reflected in model parameter a, which was on
average 29.8 and 20.0 g cm-2 h-1 for cacao and Gliricidia respectively. Also the other model pa-
rameters, which determine the shape of light and VPD responses, differed significantly between
cacao and Gliricidia . Higher values of b indicated higher light requirements for cacao, while
47
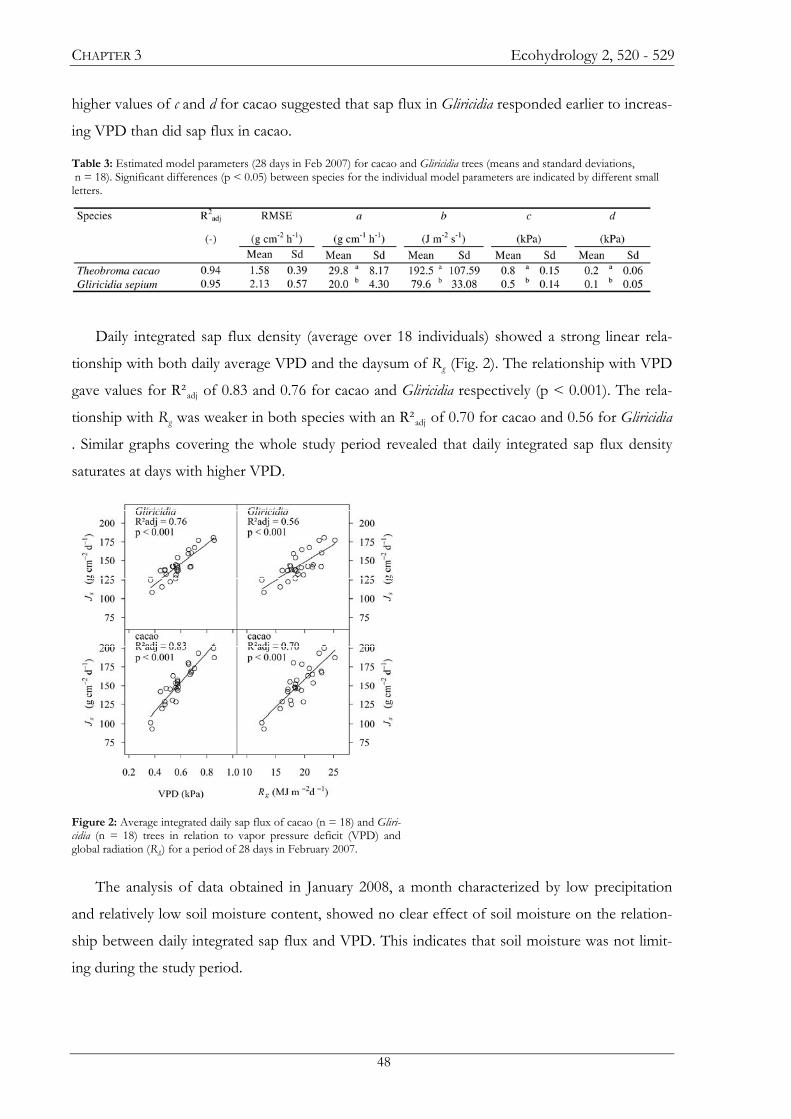
CHAPTER 3 Ecohydrology 2, 520 - 529
higher values of c and d for cacao suggested that sap flux in Gliricidia responded earlier to increas-
ing VPD than did sap flux in cacao.
Daily integrated sap flux density (average over 18 individuals) showed a strong linear rela-
tionship with both daily average VPD and the daysum of Rg (Fig. 2). The relationship with VPD
gave values for R²adj of 0.83 and 0.76 for cacao and Gliricidia respectively (p < 0.001). The rela-
tionship with Rg was weaker in both species with an R²adj of 0.70 for cacao and 0.56 for Gliricidia
. Similar graphs covering the whole study period revealed that daily integrated sap flux density
saturates at days with higher VPD.
Figure 2: Average integrated daily sap flux of cacao (n = 18) and Gliri-cidia (n = 18) trees in relation to vapor pressure deficit (VPD) and global radiation (Rg) for a period of 28 days in February 2007.
Table 3: Estimated model parameters (28 days in Feb 2007) for cacao and Gliricidia trees (means and standard deviations, n = 18). Significant differences (p < 0.05) between species for the individual model parameters are indicated by different small letters.
The analysis of data obtained in January 2008, a month characterized by low precipitation
and relatively low soil moisture content, showed no clear effect of soil moisture on the relation-
ship between daily integrated sap flux and VPD. This indicates that soil moisture was not limit-
ing during the study period.
48

CHAPTER 3 Ecohydrology 2, 520 - 529
3.4 Water use and transpiration in relation to tree characteristics
Over the 13-month study period, daily water use rates (Qmean) of cacao trees averaged 10.0 kg
d-1, while values for Gliricidia trees were in general higher and averaged 14.0 kg d-1 (Table 4). Av-
eraged over the individuals, the maximum daily water use rate (Qmax) was 17.3 kg d-1 in cacao and
23.0 kg d-1 in Gliricidia . In both species maximum water use rates were positively correlated with
tree diameter (Fig. 3). In cacao there was also a significant relation between tree height and
maximum water use (R2adj = 0.31, p = 0.010, not shown). For Gliricidia this relationship was not
significant (R2adj = 0.14, p = 0.070).
Table 4: Monthly averages of daily tree water use rates (Q) and transpiration at tree level (Ttree) for cacao and Gliri-cidia trees (n = 9 per species) over the study period. Also given is the estimated stand transpiration (Tstand).
In cacao maximum tree water use was positively correlated to leaf area measured in October-
December 2007 (R2adj = 0.72, p = 0.002, n = 9). Increasing openness of the overstorey canopy
(gap fraction) also influenced maximal tree water use rates in cacao. Maximum water use in cacao
trees increased significantly with decreasing gap fraction (R2adj = 0.39, p = 0.04) (Fig. 4). This
trend was particularly clear at gap fractions above 0.5. Tree diameter and leaf area also increased
with decreasing gap fractions and had values for R2adj of 0.33 (p = 0.062) and 0.34 (p = 0.057),
respectively. In Gliricidia maximum water use tended to increase with increasing crown projection
area (R2adj = 0.33, p = 0.061).
Average tree level transpiration over the study period varied strongly between individuals. It
was between 0.3 and 1.1 mm d-1 (average 0.51 mm d-1) for cacao trees and 0.1 to 1.3 mm d-1 (av-
erage 0.46 mm d-1) for Gliricidia trees (Table 4). Stand level transpiration averaged 1.5 mm d-1
over the 13 month study period to which cacao trees contributed 70%.
49
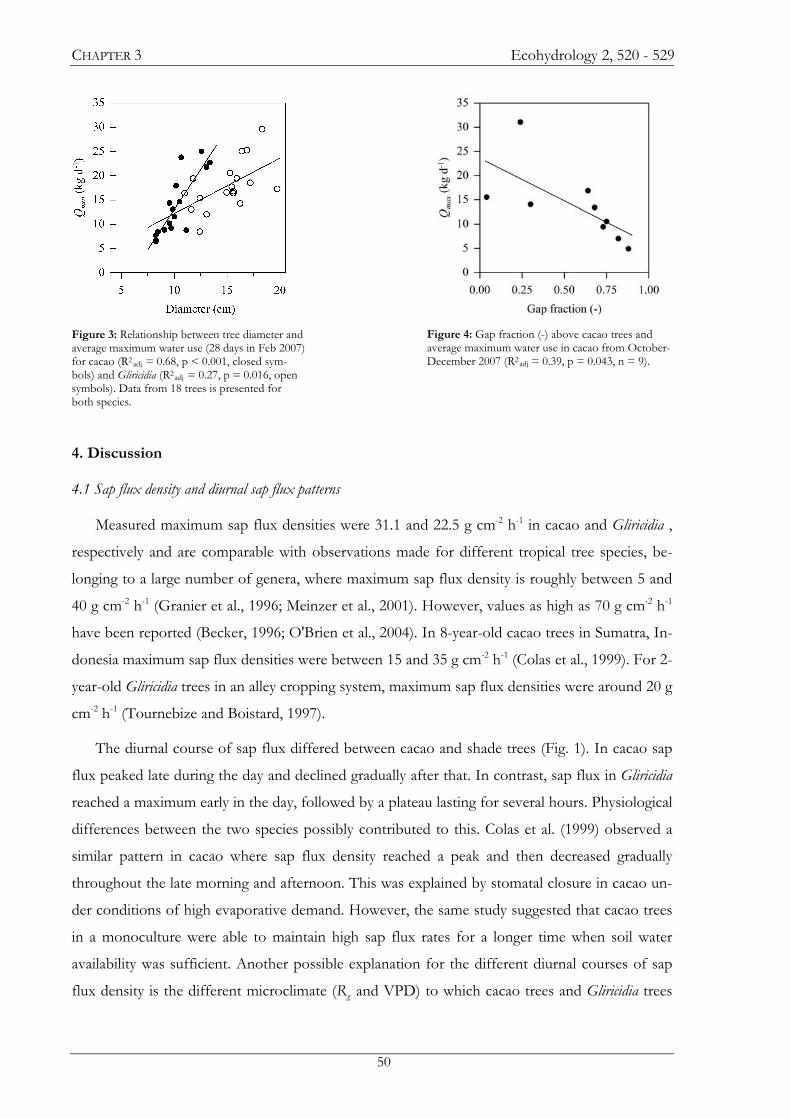
CHAPTER 3 Ecohydrology 2, 520 - 529
50
Figure 4: Gap fraction (-) above cacao trees and average maximum water use in cacao from October-December 2007 (R2adj = 0.39, p = 0.043, n = 9).
4. Discussion 4.1 Sap flux density and diurnal sap flux patterns
Measured maximum sap flux densities were 31.1 and 22.5 g cm-2 h-1 in cacao and Gliricidia ,
respectively and are comparable with observations made for different tropical tree species, be-
longing to a large number of genera, where maximum sap flux density is roughly between 5 and
40 g cm-2 h-1 (Granier et al., 1996; Meinzer et al., 2001). However, values as high as 70 g cm-2 h-1
have been reported (Becker, 1996; O'Brien et al., 2004). In 8-year-old cacao trees in Sumatra, In-
donesia maximum sap flux densities were between 15 and 35 g cm-2 h-1 (Colas et al., 1999). For 2-
year-old Gliricidia trees in an alley cropping system, maximum sap flux densities were around 20 g
cm-2 h-1 (Tournebize and Boistard, 1997).
The diurnal course of sap flux differed between cacao and shade trees (Fig. 1). In cacao sap
flux peaked late during the day and declined gradually after that. In contrast, sap flux in Gliricidia
reached a maximum early in the day, followed by a plateau lasting for several hours. Physiological
differences between the two species possibly contributed to this. Colas et al. (1999) observed a
similar pattern in cacao where sap flux density reached a peak and then decreased gradually
throughout the late morning and afternoon. This was explained by stomatal closure in cacao un-
der conditions of high evaporative demand. However, the same study suggested that cacao trees
in a monoculture were able to maintain high sap flux rates for a longer time when soil water
availability was sufficient. Another possible explanation for the different diurnal courses of sap
flux density is the different microclimate (Rg and VPD) to which cacao trees and Gliricidia trees
Figure 3: Relationship between tree diameter and average maximum water use (28 days in Feb 2007) for cacao (R2adj = 0.68, p < 0.001, closed sym-bols) and Gliricidia (R2adj = 0.27, p = 0.016, open symbols). Data from 18 trees is presented for both species.
CHAPTER 3 Ecohydrology 2, 520 - 529
are subjected. A recent study in coffee agroforestry systems (van Kanten and Vaast, 2006) pro-
vides strong indications of the influence of shading regimes and associated microclimate on di-
urnal sap flux patterns in coffee plants. During the dry season coffee plants under dense shade
started reducing transpiration at higher VPD levels compared to coffee plants under light shade
or in full sun. This was attributed to the distinct microclimate which these coffee trees growing
under a dense shade canopy experienced as a result of strong uncoupling from the bulk atmos-
phere.
Our data also provide indications for the role of microclimate on observed sap flux density
patterns. Model parameters suggested higher light saturation levels in cacao compared to Gliri-
cidia , which could result from a different canopy structure of both species. In a sparse canopy of
well exposed shade trees, leaf illumination can be expected to become optimal under relatively
low Rg. In the shaded and multi-layered canopy of cacao, individual leaves can still make use of
increasing light levels even when Rg is already high, hence the higher value of b. The remaining
model parameters c and d suggest a rise in sap flux density in Gliricidia under conditions of lower
evaporative demand (VPD) compared to cacao. As in the study of van Kanten and Vaast (2006),
this could reflect a stronger uncoupling of cacao trees from the atmosphere due to the effect of
shade trees, although a stronger uncoupling at the leaf level (cacao has a larger leaf size as Gliri-
cidia ) could contribute to this as well.
4.2 Tree water use
Scaling of sap flux density data to tree water use rates gave, for the two species combined,
maximum water use rates between 9.1 and 32.4 kg d-1 for trees with a diameter between 8.3 and
19.7 cm. This range of maximum water use rates is in agreement with observations for trees of
similar diameter in four Australian rainforest types (McJannet et al., 2007) and data presented for
trees in mixed young tree plantations in the Philippines (Dierick and Hölscher, 2009). The mean
daily tree water use over the 13 month study period differed between the two species, being on
average 10.0 kg d-1 in cacao trees compared to 14.0 kg d-1 in Gliricidia trees (Table 4). This differ-
ence can be attributed to the smaller average diameter of sampled cacao trees compared to Gliri-
cidia trees (Table 1). Even though daily cumulated sap flux densities did not differ among species,
higher water use rates are predicted for the larger Gliricidia trees due to a larger conductive sap-
wood area in large trees.
However, Fig. 3 clearly shows that both species exhibit a different relationship between esti-
mated maximum water use and tree diameter. The lower water use rates in Gliricidia compared to
cacao for trees of a given diameter are a consequence of the limited sapwood depth in larger
51

CHAPTER 3 Ecohydrology 2, 520 - 529
Gliricidia trees. Differences in sap flux density do not play a role here as cumulated daily flux is
almost identical for the two species. The different water use to diameter relation in cacao and
Gliricidia would contrast with the hypothesis that tree water use scales universally with tree size
and is essentially species independent (Meinzer, 2003; Meinzer et al., 2005). Note however that
the narrow diameter in this study potentially highlights the differences between the two species
and that the latter statement should thus be taken with care. Fig. 3 also suggests that the relation
between tree diameter and tree water use is weaker for Gliricidia than for cacao. This might be
explained by a higher variability of the conducting sapwood area and/or incorrect assumptions
on how sapwood activity declined with depth.
Maximum tree water use rates in cacao were negatively correlated to gap fraction, suggesting
higher water use in trees with increased shading. Although the reverse could be expected, similar
observations exist for coffee (van Kanten and Vaast, 2006). Coffee grown in full sun had higher
transpiration rates when expressed per unit leaf area than coffee grown under shade trees, but
the reverse was generally true when transpiration rates were expressed per unit ground area. The
increased transpiration per unit ground surface of coffee under shade trees was attributed to in-
creased vegetative growth. Also for cacao stands in Ghana enhanced vegetative growth under
shade trees was observed (Isaac et al., 2007). Under three shade tree species cacao tree biomass
was higher (in two treatments this was significant) than in unshaded cacao trees. It was also
found that cacao tree biomass decreased with increasing distance to the shade tree. The correla-
tions we found for individual trees between gap fraction on the one hand and tree diameter and
tree leaf area on the other hand, would suggest that also in our study enhanced vegetative growth
under increased shading occurred. This enhanced vegetative growth in combination with increas-
ing water use rates of shaded cacao trees suggests that shading could lead to increasing transpira-
tion rates per unit ground area at stand level as the study of van Kanten and Vaast (2006) dem-
onstrated. In addition, water use by the shade trees would further increase the total stand transpi-
ration.
52

CHAPTER 3 Ecohydrology 2, 520 - 529
4.3 Transpiration rates
Tree level transpiration rates, i.e. tree water use expressed per unit crown area, were around
0.5 mm d-1 for both species with a high variability between individuals. In a secondary forest
patch in Vietnam, estimated tree level transpiration rates were generally higher, between 0.4 and
2.9 mm d-1, and also highly variable between individuals (Giambelluca et al., 2003). The authors
suggested a possible role of tree species, tree crown exposure, edge effect, vine infestation and
leaf area index in explaining the different tree level transpiration rates.
During our study, the average stand transpiration rate in the cacao-Gliricidia agroforestry sys-
tem was estimated at 1.5 mm d-1. We only know of one study where transpiration in cacao was
measured by means of xylem sap flux measurements. Also using the Granier method, Colas et al.
(1999) estimated the transpiration in a cacao monoculture and cacao growing under coconut in
Sumatra, Indonesia. In these stands transpiration was 1.2 and 1.3 mm d-1 in a monoculture and in
association with coconut respectively.
Rather than transpiration rates, most literature on water relations in cacao stands provides es-
timates of stand evapotranspiration which includes evaporation from trees and litter layer after
interception. Using eddy covariance techniques, evapotranspiration was determined experimen-
tally for a mature cacao plantation near our study area in Central Sulawesi at 2.6 mm d-1 (Falk,
2004). For cacao with Erythrina poeppigiana and Cordia alliodora as shade trees in Costa Rica, Im-
bach et al. (1989) calculated a daily evapotranspiration of 2.7 to 2.8 mm d-1 respectively from
pan-evaporation, a crop coefficient and measurements of rain interception. In a cacao stand un-
der remaining forest trees in Sulawesi interception losses were estimated at 19% of gross precipi-
tation (Dietz et al., 2006). For the particular cacao agroforest where this study was conducted,
interception was estimated to be around 14% (L. Schwendenmann and G. Moser, unpublished
data). Taking into account the amount of rainfall during our study, approximately 1.1 mm d-1
evaporated back to the atmosphere after interception. When added to our estimate of stand tran-
spiration, this would give an average evapotranspiration rate (2.6 mm d-1) which is in good
agreement with results from Falk (2004) and Imbach et al. (1989).
5. Conclusions
In the stand studied, water use characteristics of the two species differed substantially with
respect to maximal sap flux density, response to atmospheric factors, and tree size relationships.
The resulting transpiration rates at the stand level combined with estimates of rainfall intercep-
tion are comparable to other observations of evapotranspiration. Remarkable was the influence
shade trees may exert on stand level transpiration. Our data suggested that shade trees may in-
53

CHAPTER 3 Ecohydrology 2, 520 - 529
crease enhance stand transpiration by their own water use and furthermore by enhancing water
use rates of cacao trees.
Acknowledgements
This study was conducted in the framework of the joint Indonesian-German research project
‘Stability of Tropical Rainforest Margins, Indonesia (STORMA)’ funded by the German Re-
search Foundation (SFB 552, sub-project B4). We also like to thank Masrillihardi Potabuga and
Andi Sofyan for their valued assistance with the field work.
References Andrade JL, Meinzer FC, Goldstein G, Holbrook NM, Cavelier J, Jackson P, Silvera K. 1998. Regulation of water
flux through trunks, branches, and leaves in trees of a lowland tropical forest. Oecologia 115 : 463-471.
Becker P. 1996. Sap flow in Bornean heath and dipterocarp forest trees during wet and dry periods. Tree Physiology
16 : 295-299.
Clearwater M J, Meinzer FC, Andrade J L, Goldstein G, Holbrook N M. 1999. Potential errors in measurement of
nonuniform sap flow using heat dissipation probes. Tree Physiology 19 : 681-687.
Colas H, Mouchet S, Rey H, Kitu WT. 1999. Une approche du comportement hybrique du cacaoyer (Theobroma
cacao L.) par des mesures de flux de sève brute : comparaison entre une culture pure et une culture associée sous
cocotier (Cocos nucifera L.) In: Efficacité de la production cacaoyère et la qualité du cacao au 21è. Actes. Lagos :
Cocoa Producers' Alliance, 637-644. Conférence internationale sur la recherche cacaoyère. 12, 1996-11-17/1996-
11-23, Salvador de Bahia, Brésil.
Delzon S, Sartore M, Granier A, Loustau D. 2004. Radial profiles of sap flow with increasing tree size in maritime
pine. Tree Physiology 24 : 1285-1293.
Dierick D, Hölscher D. 2009 Species-specific tree water use characteristics in reforestation stands in the Philippines.
Agricultural and Forest Meteorology 149 : 1317-1326.
Dietz J, Hölscher D, Leuschner C, Hendrayanto. 2006. Rainfall partitioning in relation to forest structure in differ-
ently managed montane forest stands in Central Sulawesi, Indonesia. Forest, Ecology and Management 237 : 170-
178.
Edwards W R N, Becker P, and Čermák J. 1996. A unified nomenclature for sap flow measurements. Tree Physiol-
ogy 17 : 65-67.
Falk U. 2004. Turbulent Fluxes of CO2, H2O and Energy in the Atmospheric Boundary Layer above Tropical
Vegetation investigated by Eddy-Covariance Measurements. Dissertation: University of Göttingen.
FAO. 2009. Food and Agriculture Organization of the United Nations. http://faostat.fao.org (last visited:
29/04/2009)
Garcia Santos G. 2007. An ecohydrological and soils study in a montane cloud forest in the National Park of Gara-
jonay, La Gomera (Canary Islands, Spain). Dissertation: Vrije Universiteit Amsterdam.
Giambelluca TW, Ziegler AD, Nullet MA, Truong DM, Tran LT. 2003. Transpiration in a small tropical forest
patch. Agricultural and Forest Meteorology 117 : 1-22.
54

CHAPTER 3 Ecohydrology 2, 520 - 529
Granier A. 1987. Evaluation of transpiration in a Douglas-fir stand by means of sap flow measurements. Tree
Physiology 3 : 309-320.
Granier A, Anfodillo T, Sabatti M, Cochard H, Dreyer E, Tomasi M, Valentini R, Breda N. 1994.Axial and radial
water-flow in the trunks of oak trees - a quantitative and qualitative analysis. Tree Physiology, 14 : 1383-1396.
Granier A, Huc R, Barigah ST. 1996. Transpiration of natural rain forest and its dependence on climatic factors.
Agricultural and Forest Meteorology 78 : 19-29.
Imbach AC, Fassbender HW, Borel J, Beer J, Bonnemann A. 1989. Modelling agroforestry systems of cacao (Theo-
broma cacao) with laurel (Cordia alliodora) and cacao with poro (Erythrina poeppigiana) in Costa Rica. Agrofor-
estry Systems 8 : 267-287.
INRA. 2007. French National Institute for Agricultural Research, Avignon, France. URL
http://www.avignon.inra.fr/can_eye (Last visited: 18/08/2008).
Isaac ME, Timmer VR, Quashie-Sam SJ. 2007. Shade tree effects in an 8-year-old cocoa agroforestry system: bio-
mass and nutrient diagnosis of Theobroma cacao by vector analysis. Nutrient Cycling in Agroecosystems 78 : 155-
165.
Jarvis PG. 1976. The interpretation of variations in leaf water potential and stomatal conductance found in canopies
in the field. Philosophical Transactions of the Royal Society of London. B. 273 : 593-610.
McJannet D, Fitch P, Disher M, Wallace J. 2007. Measurements of transpiration in four tropical rainforest types of
north Queensland, Australia. Hydrological Processes 21 : 3549-3564.
Meinzer FC. 2003. Functional convergence in plant responses to the environment. Oecologia 134 : 1-11.
Meinzer FC, Goldstein G, Andrade JL. 2001. Regulation of water flux through tropical forest canopy trees: Do uni-
versal rules apply? Tree Physiology 21 : 19-26.
Meinzer FC, Bond BJ, Warren JM, Woodruff DR. 2005. Does water transport scale universally with tree size? Func-
tional Ecology 19 : 558-565.
Montgomery PJ. 1981. Some thoughts on the life span of cocoa. Planter 57 : 604-609. Cited in: Olaiya AO, Fagbay-
ide JA, Hammed LA, Aliyu MO. 2006. Comparison of potential pod yield and loss in old and rehabilitated cocoa
plots. African Journal of Agricultural Research 1 : 189-193.
O'Brien JJ, Oberbauer SF, Clark DB. 2004. Whole tree xylem sap flow responses to multiple environmental vari-
ables in a wet tropical forest. Plant Cell and Environment 27 : 551-567.
Olaiya AO, Fagbayide JA, Hammed LA, Aliyu MO. 2006. Comparison of potential pod yield and loss in old and
rehabilitated cocoa plots. African Journal of Agricultural Research 1 : 189-193.
Phillips, N, Oren R, and Zimmermann R. 1996. Radial patterns of xylem sap flow in non-, diffuse- and ring-porous
tree species. Plant Cell Environment 19 : 983-990.
Poppenborg P, Hölscher D. The influence of emergent trees on rainfall distribution in a cacao agroforest (Sulawesi,
Indonesia). Flora (in press DOI: 10.1016/j.flora.2008.10.003).
R Development Core Team. 2008. R: A language and environment for statistical computing. R Foundation for Sta-
tistical Computing: Vienna, Austria. ISBN 3-900051-07-0, URL http://www.R-project.org.
Schwendenmann, L., Veldkamp, E., Moser, G., Hölscher, D., Köhler, M., Clough,Y., Anas, I., Djajakirana, G.,
Erasmi, S., Hertel, D., Leitner, D., Leuschner, C., Michalzik, B., Propastin, P., Tjoa, A., Tscharntke, T., van
55

CHAPTER 3 Ecohydrology 2, 520 - 529
56
Straaten, O., 2010. Effects of an experimental drought on the functioning of a cacao agroforestry system, Su-
lawesi, Indonesia. Global Change Biology 16, 1515–1530.
Steffan-Dewenter I, Kessler M, Barkmann J, Bos MM, Buchori D, Erasmi S, Faust H, Gerold G, Glenk K, Grad-
stein SR, Guhardja E, Harteveld M, Hertel D, Höhn P, Kappas M, Köhler S, Leuschner C, Maertens M, Marggraf
R, Migge-Kleian S, Mogea J, Pitopang R, Schaefer M, Schwarze S, Sporn SG, Steingrebe A, Tjitrosoedirdjo SS,
Tjitrosoemito S, Twele A, Weber R, Woltmann L, Zeller M, Tscharntke T. 2007. Tradeoffs between income, bio-
diversity, and ecosystem functioning during tropical rainforest conversion and agroforestry intensification. Pro-
ceedings of the National Academy of Science of the United States of America 104 : 4973-4978.
Tournebize R, Boistard S. 1997. Comparison of two sap flow methods for the estimation of tree transpiration. Ann.
of Forest Science 55 : 707-713.
van Kanten R, Vaast P. 2006. Transpiration of arabica coffee and associated shade tree species in sub-optimal, low-
altitude conditions of Costa Rica. Agroforestry Systems 67 : 187-202.
Veldkamp E, O'Brien JJ. 2000. Calibration of a frequency domain reflectometry sensor for humid tropical soils of
volcanic origin. Soil Science Society of America Journal 64 : 1549-1553.
Zuidema PA, Leffelaar PA, Gerritsma W, Mommer L, Anten NPR. 2005. A physiological production model for
cacao (Theobroma cacao): model presentation, validation and application. Agricultural Systems 84 : 195-225.
CHAPTER4 Contribution in: Tropical Rainforests and Agroforests under Global Change, Springer, Berlin

58 Picture source: http://commons.wikimedia.org

CHAPTER 4 Contribution in: Tropical Rainforests and Agroforests under Global Change, Springer, Berlin
Comparison of tree water use characteristics in reforestation and agroforestry stands across the tropics
Diego Dierick*, Norbert Kunert, Michael Köhler, Luitgard Schwendenmann & Dirk Hölscher Tropical Silviculture and Forest Ecology, Burckhardt Institute, Georg-August-Universität Göttingen, Büsgenweg 1, 37077 Göttingen, Germany
Abstract. In the tropics, reforestations and agroforestry become increasingly important and may help mitigate climate change. However, high water use by trees may deplete water resources for associated crops or other purposes. Choice of tree species might reduce water use rates to acceptable levels, but available information on species-specific water use characteristics is scarce. We addressed the following questions: (1) do species differ in xylem sap flux response to fluctuating environmental conditions, (2) are there species-specific differences in quantities of water used, and specifically (3) do universal rules relating tree size to water use apply? This chapter combines data on tree sap flux and water use gathered in Indonesia, Panama and the Philippines. These studies applied the same methods and were conducted in recently established stands (5-12 years old when studied) charac-terised by small diameter trees and relatively simple stand structure. We analyse data from more than 100 trees belonging to 17 species using a simple sap flux model. Model application suggests species-specific differences in parameters such as maximal sap flux velocity and responses to radiation and vapour pressure deficit. With respect to the quantity of water used per tree, we ob-served a strong correlation between tree diameter and tree water use, which confirms earlier publications. However, e.g. in the stands in the Philippines where tree diameter explained 65% of observed variation, some species clearly followed distinct trajecto-ries. For a given diameter, up to twofold differences in tree water use among species were observed. Our findings thus support the idea that species selection can be used to control tree water use of future reforestations and within agroforestry systems. This will be especially relevant in areas where water resources are limited already or where climate scenarios predict decreasing precipi-tation.
Keywords: Indonesia, Panama, Philippines, sap flux, tree size, tree species
* Corresponding author. Tel.: +49 551 399556; Fax: +49 551 394019; E-mail address: [email protected] (D. Dierick)
59

CHAPTER 4 Contribution in: Tropical Rainforests and Agroforests under Global Change, Springer, Berlin
1 Introduction
Natural forests in the tropics are still being converted at a high rate. Many of the former for-
est areas have been degraded, fail to produce goods and do not contribute to the protection of
climate and biodiversity. For the management of buffer zones around remaining protected for-
ests as well as for the restoration of degraded land, reforestation and agroforestry can be suitable
measures. The re-introduction of trees into the landscape and especially reforestations have
however been criticised because trees are potentially heavy water users and might deplete water
resources (Jackson et al. 2005). From a global synthesis it was concluded that annual runoff was
on average reduced by 44% and by 31% when reforesting grass- and shrubland, respectively
(Farley et al. 2005). Also trees in agroforestry may be problematic as they may reduce water avail-
ability for the main crops and additionally increase stand level transpiration. In Costa Rica, the
estimated stand level transpiration by coffee with shade trees was on average twice as high as that
of coffee grown without shade trees (van Kanten and Vaast 2006).
It has been suggested that a suitable tree species choice might reduce water use rates to ac-
ceptable levels (van Dijk and Keenan 2007). This contention is somewhat theoretical as available
information on species-specific water use characteristics is scarce. Furthermore, the effectiveness
of species selection is questionable as studies in diverse old-growth forests and a single-species
tree plantation showed repeatedly that tree size is the main factor influencing tree water use
(Cienciala et al. 2000; Meinzer et al. 2004; McJannet et al. 2007). Meinzer et al. (2005) suggested
that, as a result of functional convergence, plants operating within given biophysical limitations,
develop common patterns of sap flux and water use in relation to size characteristics across taxa.
This would leave little room for species selection to serve as a tool to influence stand water use,
at least if wood production or carbon fixation is a major goal.
A thorough analysis of the problem is difficult as single studies of sap flux and tree water use
often lack sufficient replicates within a species and/or analyse a limited number of species.
Comparison among studies is additionally hampered by differences in applied methods. Here we
bring together data from three case studies namely from the Philippines (Dierick and Hölscher
2009), Indonesia (Köhler et al. 2010) and Panama (Kunert, unpublished data), which were con-
ducted in relatively young reforestation and agroforestry stands. Our compilation comprises 106
individual trees belonging to 17 species, which were studied and analysed using the same proto-
col. In this data compilation, we concentrate on time periods with ample soil water supply and
on trees fully in leaves. As a diagnostic tool, we apply a model that predicts sap flux density
based on meteorological parameters. The following questions were addressed: (1) do species dif-
60

CHAPTER 4 Contribution in: Tropical Rainforests and Agroforests under Global Change, Springer, Berlin
fer in xylem sap flux response to fluctuating environmental conditions, (2) are there species-
specific differences in quantities of water used, and specifically (3) do universal rules relating tree
size to water use apply?
2 Methods 2.1 Study sites
In the Philippines, we worked on the island Leyte in the Eastern Visayas. Two study sites
were located near the villages Marcos (10.765°N, 124.790°E) and Patag (10.736°N, 124.804°E) at
an elevation of 30 and 40 m asl, respectively. Average rainfall in the region amounts to 2753 mm
y-1 and rain is relatively evenly distributed throughout the year (PAGASA 2007). Average annual
air temperature is 27.5 °C. The natural vegetation in the region is species-rich lowland diptero-
carp forest (Langenberger 2006). After deforestation and intermittent cultivation, the degraded
sites were reforested following the so called ‘rainforestation’ approach (Margraf and Milan 1996).
This means reforesting with a mixture of native species, promoting the incorporation of fruit
trees and combining fast growing trees with shade tolerant species. At the time of the field study,
from June to August 2006 at Marcos and July to September 2007 at Patag, both stands were 12
years old. Stem density was 796 and 1367 stems ha-1 in Marcos and Patag, respectively. We se-
lected ten tree species, eight of which were native to the region (Table 1). Each species was rep-
resented by five individuals selected to have well exposed crowns. Only for Hopea plagata S. Vidal,
a species with an in general smaller stature, some individuals had little exposed crowns.
In Indonesia, our study site was located in Central Sulawesi in the vicinity of the village of
Marena (1.552°S, 120.020°E) at 560 m asl. Measurements made between 2002 and 2006 at
Gimpu (5 km south of Marena, 471 m asl) show that the mean air temperature is 25.5 °C and
annual rainfall in the region is around 2092 mm y-1. Rainfall shows a weak bimodal pattern with
rainy seasons (>100 mm per month) from March to June and October to December. The struc-
ture and species composition of surrounding natural forest, which is usually only remaining at
higher elevations, was described by Gradstein et al. (2007). The studied agroforest was located on
former agricultural land used for cultivating annual crops such as maize and was 6 years old at
the time of study. Cacao (Theobroma cacao L.) was growing as crop under Gliricidia sepium (Jacq.)
Kunth ex Steud. shade trees. The stem density was 1030 stems ha-1 for cacao and 325 stems ha-1
for Gliricidia . Both tree species were represented by 18 individuals and studied for a one-month
period in February 2007.
61

CHAPTER 4 Contribution in: Tropical Rainforests and Agroforests under Global Change, Springer, Berlin
62
Tab
le 1
: Cha
ract
erist
ics o
f the
stud
y tre
es. S
cien
tific
nam
es a
re li
sted
with
the
resp
ectiv
e ab
brev
iatio
ns u
sed.

CHAPTER 4 Contribution in: Tropical Rainforests and Agroforests under Global Change, Springer, Berlin
Our site in Panama was located near the village of Sardinilla, Central Panama (9.317°N,
79.633°W), which is approximately 50 km north of Panama City. The elevation of the site is 70
m asl. Mean annual precipitation measured at Barro Colorado Island (at 30 km distance) is 2627
mm, with 25-50 mm per month during peak dry season (January-March) and 250 mm per month
during the rainy season (May to November). The mean annual temperature of the region is 25.9
°C (STRI 2009). The original forest vegetation at the Sardinilla site was probably a tropical moist
forest, similar to that of the Barro Colorado National Monument (Leigh et al. 1996). The study
site was clear-cut in the 1950’s and later used for cattle ranging. At the time of our study, the
stands were 6 years old and stem density was about 1100 stems ha-1. Five tree species growing in
monocultures were studied with four replicates each during the rainy season between June and
September 2007.
2.2 Sap flux measurements
Sap flux density Js (g cm-2 h-1) was measured using 25 mm long thermal dissipation probes
(Granier 1985). Per study tree, two sensor pairs were installed on opposite sides of the tree trunk
in the outermost xylem. Sensors were shielded and protected by styrofoam boxes, reflective foil,
and plastic foil. The thermocouple output from the thermal dissipation probes was measured
every 30 seconds and 5 or 30 minute averages were stored using dataloggers and attached multi-
plexers (CR1000 and AM16/32, Campbell Scientific Inc., Logan, UT, USA). Sap flux density was
calculated from raw temperature data using the calibration equation determined by Granier
(1987).
2.3 Radial sap-flux profiles and water use rates
Radial profiles of sap flux density Js were used to determine tree water use. Therefore Js was
measured at one or two additional depths below the cambium and expressed relatively (%) to
concurrent measurements at the outer reference depth. Sap flow of ring-shaped stem cross-
sections was then calculated, taking into account the cross-sectional area of the ring correspond-
ing with the respective installation depth, Js as measured at reference depth at the outer xylem,
and the normalised profile of Js for the species considered (Hatton et al. 1990; Meinzer et al.
2005). Contributions of the different cross sections were added to determine total tree sap flow
(g h-1) and summed over a day to give daily tree water use rates Q (kg d-1). Water use rates were
also expressed as transpiration rates (T, mm d-1) by dividing Q by the crown projection area of
the respective tree (m2).
63

CHAPTER 4 Contribution in: Tropical Rainforests and Agroforests under Global Change, Springer, Berlin
2.4 Sap flux density model
We used a model to capture species characteristics of sap flux density and its responses to
environmental conditions in analogy with work of O'Brien et al. (2004). The sap flux model used
is a modification of the Jarvis-type model (Jarvis 1976) which was originally developed to de-
scribe stomatal responses to environmental drivers. The model takes the form of a multiplication
of non-linear response functions, each depending on a single environmental factor. Each indi-
vidual response function takes a value between zero and one, thus limiting the overall response if
one or more environmental factors become suboptimal. The fact that environmental variables
appear isolated in the model enhances the interpretation of model parameters. This multiplicative
type of model has been widely used in a number of variations to describe canopy conductance
(Herbst et al. 1999; Granier et al. 2000; Harris et al. 2004), stand transpiration (Oren and Pataki
2001; Whitley et al. 2008) and to describe sap flow patterns in individual trees (Cienciala et al.
2000).
We opted for a sap flux density model with radiation Rg (W m-2) and vapour pressure deficit
VPD (kPa) as explanatory variables. Additional factors such as soil moisture conditions were not
included because a preliminary exploration of the data indicated that this would not improve
model fit much. The model form used was:
dc
g
gmodels
exp1
1Rb
RaJ VPD−
+×
+×=
with Js model the modeled sap flux density (g cm-2 h-1), a the maximum modeled sap flux
density (g cm-2 h-1), b a parameter describing Rg response (W m-2) and c, d parameters describing
the VPD response (kPa). Modeled sap flux density Js model reaches a maximum value a when all
environmental conditions are optimal. To account for the influence of radiation we introduced a
commonly used hyperbolic response function which asymptotically approaches a value of 1 at
high Rg. Parameter b can be interpreted as a measure of the light saturation level. Assuming VPD
is non-limiting, the sap flux reaches just over 90% of a if radiation levels equal ten times parame-
ter b. The response function used to describe the influence of VPD was taken from O'Brien et al.
(2004). In this response function parameter c equals the vapour pressure deficit for which Js model
rises to half of the maximum value (Rg non-limiting), whereas d is related to the slope i.e. the in-
crease in Js model for a given increase in VPD. Model parameters a, b, c and d in the response func-
tions were estimated by minimising the residual sum of squares using a Gauss-Newton algo-
rithm.
64
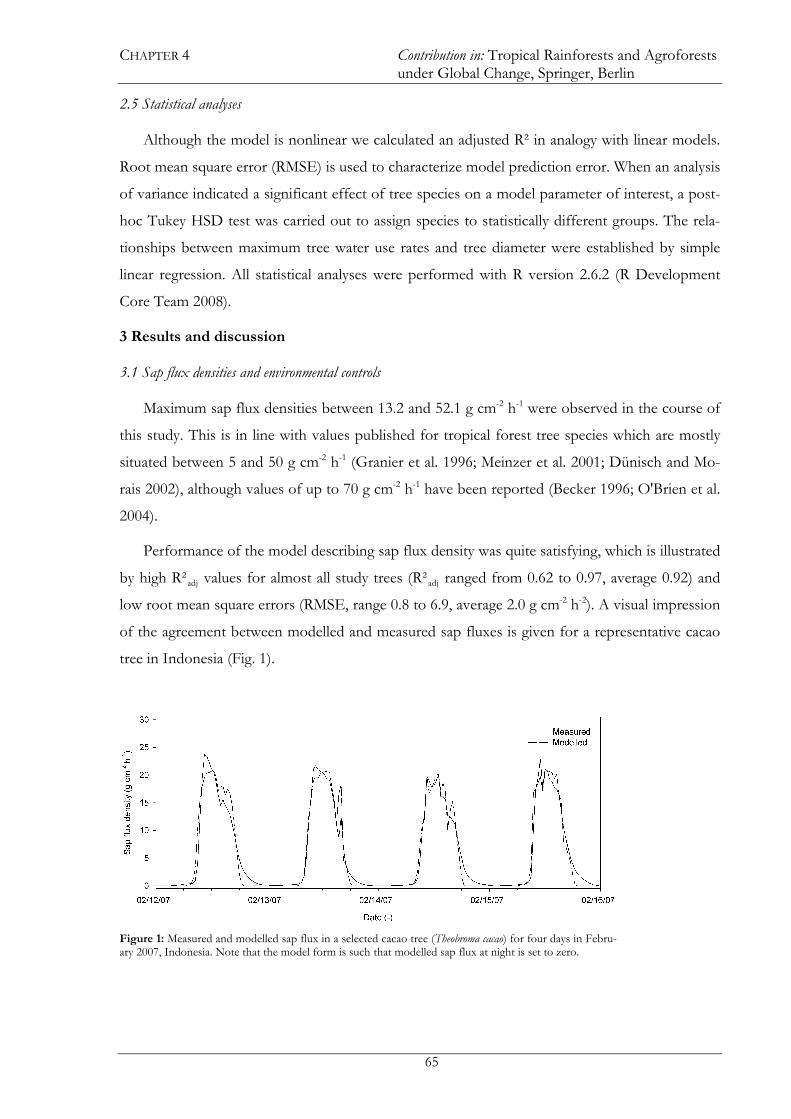
CHAPTER 4 Contribution in: Tropical Rainforests and Agroforests under Global Change, Springer, Berlin
2.5 Statistical analyses
Although the model is nonlinear we calculated an adjusted R² in analogy with linear models.
Root mean square error (RMSE) is used to characterize model prediction error. When an analysis
of variance indicated a significant effect of tree species on a model parameter of interest, a post-
hoc Tukey HSD test was carried out to assign species to statistically different groups. The rela-
tionships between maximum tree water use rates and tree diameter were established by simple
linear regression. All statistical analyses were performed with R version 2.6.2 (R Development
Core Team 2008).
3 Results and discussion 3.1 Sap flux densities and environmental controls
Maximum sap flux densities between 13.2 and 52.1 g cm-2 h-1 were observed in the course of
this study. This is in line with values published for tropical forest tree species which are mostly
situated between 5 and 50 g cm-2 h-1 (Granier et al. 1996; Meinzer et al. 2001; Dünisch and Mo-
rais 2002), although values of up to 70 g cm-2 h-1 have been reported (Becker 1996; O'Brien et al.
2004).
Performance of the model describing sap flux density was quite satisfying, which is illustrated
by high R²adj values for almost all study trees (R²adj ranged from 0.62 to 0.97, average 0.92) and
low root mean square errors (RMSE, range 0.8 to 6.9, average 2.0 g cm-2 h-2). A visual impression
of the agreement between modelled and measured sap fluxes is given for a representative cacao
tree in Indonesia (Fig. 1).
Figure 1: Measured and modelled sap flux in a selected cacao tree (Theobroma cacao) for four days in Febru-ary 2007, Indonesia. Note that the model form is such that modelled sap flux at night is set to zero.
65

CHAPTER 4 Contribution in: Tropical Rainforests and Agroforests under Global Change, Springer, Berlin
Model performance suggests that the model form was appropriate and that vapour pressure
deficit and radiation indeed exerted strong influence on sap flux of the trees in the study periods.
We acknowledge that at other times of the year this could be different. Especially when rainfall is
limited, soil moisture could become more influential as an explanatory variable and the need may
arise to include it in the model. In particular under seasonal climatic conditions such as at our
Panamanian site, this is expected to be the case. For the three study sites combined, the model
parameter a differed threefold among species (14.4 g cm-2 h-1 for Vitex parviflora A. L. Juss and
47.2 g cm-2 h-1 for Anacardium excelsum Beberto & Balb. ex Kunth) and accurately reflected meas-
ured maximal sap flux densities in studied species. Within each of the three study sites significant
species-specific differences were observed (Fig. 2). Model parameter b, which describes the sap
flux response to radiation, differed among species at the Philippine and the Indonesian site, but
not among the five species studied in Panama.
Figure 2: Estimated model parameters a (upper panel) and b (lower panel) for the species studied (means and standard deviations, n depends on study site (see Table 1)). Significant differences (p < 0.05) betweenspecies within a study site are indicated by different small letters. The complete species names and abbre-viations are listed in Table 1.
High values for parameter b were found in species which did not have full sun exposed
crowns such as Hopea plagata in the Philippines and Theobroma cacao in Indonesia. A possible ex-
planation is that in trees growing under shade or having a layered crown structure sap flux con-
tinues to rise with additional light even at high radiation.
66

CHAPTER 4 Contribution in: Tropical Rainforests and Agroforests under Global Change, Springer, Berlin
67
3.2 Sap flux density in relation to tree size
At first view our data suggests, despite a very low R2adj, a negative relation between maximum
sap flux density Js max and tree diameter (Fig. 3). This finding is explained by the significant de-
cline in sap flux density with increasing diameter we observed in the dataset from Indonesia (Fig.
3 inset). Rather than by a real effect of diameter on Js max, the latter is caused by the different di-
ameter range of sampled cacao and Gliricidia trees in combination with the different sap flux den-
sities observed for these species. The complete lack of a diameter-related decline of sap flux den-
sity with diameter at the two other study sites supports this interpretation.
The absence of a decline of sap flux density with diameter apparently contradicts the hy-
pothesis of functional convergence (Meinzer et al. 2001; Meinzer et al. 2005). Their work in Pa-
nama revealed a strong inverse relationship (R² = 0.85) between maximum sap flux density and
tree diameter in 24 co-occurring species in a Panamanian old-growth forest. Similarly, in a patch
of advanced secondary forest in Vietnam, a weak but significant (R² = 0.23) decline of mean Js
with tree diameter existed (Giambelluca et al. 2003).
At the same time however, that study acknowledged the presence of large differences in Js
across and within species and the decisive role of factors such as tree exposure and environ-
mental conditions. That our data did not reveal a similar pattern of declining Js max with tree di-
ameter could be due to the limited diameter range encompassed in comparison with the original
Figure 3: Maximum sap flux density Js max for individual trees in the three studies in relation to tree diameter. The inset shows the data from the Indonesian study site

CHAPTER 4 Contribution in: Tropical Rainforests and Agroforests under Global Change, Springer, Berlin
work (Meinzer et al. 2001). The data presented by Meinzer et al. (2001) revealed considerable
scatter, in particular in the lower diameter range where the steepest decline in Js max is predicted.
A possible implication is that general patterns resulting from functional convergence may remain
unnoticed if the range of tree diameters covered is too narrow. In our opinion the species differ-
ences we observed in Js max and responses of Js to environmental variables do not necessarily con-
tradict the hypothesis of functional convergence (Meinzer 2003). We hypothesise that this find-
ing merely reflects that considerable variation remains within general patterns observed across
species. This can in part be due to species-specific adaptation to a given set of growth conditions
and possibly also due to stand structural differences (see also Cienciala et al. 2000).
In stands where functional convergence can be demonstrated, it would be an essential tool in
assessing stand transpiration. This is particularly true in species-rich and highly structured natural
forest stands (McJannet et al. 2007). However, we argue functional convergence to be less rele-
vant in relatively young mixed reforestation or agroforest stands characterized by limited diame-
ter ranges and stand structure. In our opinion the species-specific differences in sap flux density
we observed in co-occurring trees would become relatively more important under such condi-
tions and become a determining factor for stand water use.
3.3 Tree water use, tree diameter, and transpiration
Our data revealed a strong positive correlation between maximum daily tree water use and
tree diameter (Fig. 4a). This is true for the pooled data, as well as for data from the individual
study sites (Fig. 4b-d). Also Meinzer et al. (2004) found for different co-occurring species in Pa-
nama, that tree size rather than tree species was a determining factor for tree water use. Follow-
up studies encompassing more species and replicates revealed similar allometric relationships be-
tween tree water use rates and tree diameter (and biomass) that were shared by species belonging
to distinct species groups (Meinzer et al. 2005). The relation between tree water use and tree di-
ameter was best described by a sigmoid relationship in 18 mainly tropical angiosperm tree spe-
cies. That a simple linear regression between tree diameter and tree water use explains most of
the variance in our data set, should be seen in relation to the small diameter range covered. Some
theoretical relationships describing water use versus tree size characteristics might be inappropri-
ate from a biological point of view, even though they provide an adequate fit in certain datasets
(Meinzer et al. 2005). The same appears to be the case in our study.
68

CHAPTER 4 Contribution in: Tropical Rainforests and Agroforests under Global Change, Springer, Berlin
Figure 4: Maximum daily water use rates Qmax for each individual in relation to tree diameter for all studied trees (a). Analogue plots show the data for species in the Philippines (b), Indonesia (c) and Panama (d). In each of the latter graphs two contrasting species are shown with a different symbol.
Despite the strong dependence of maximum water use on diameter for the individuals studied,
considerable scatter was present around the fitted curve with species located on distinct trajecto-
ries (Fig. 4b-d). For a given tree diameter, tree water use differed up to twofold between some of
the species studied. This resulted from a combination of both species-specific Js and species dif-
ferences in hydroactive xylem depth. Apart from these factors, the relationship would be deter-
mined strongly by cross correlation between estimated water use rates and tree diameter. This
can be expected to be most pronounced in the lower diameter ranges (Meinzer et al. 2001), mak-
ing the deviations from a common relationship even more significant. Maximum transpiration
rates observed in individual trees varied from 0.4 to 4.9 mm d-1, except for a single individual of
Swietenia macrophylla King which had a maximum transpiration rate of 7.5 mm d-1. A small crown
projection area and associated larger relative error in this individual could explain the high value.
Excluding this single tree, results are comparable with findings from Giambelluca et al. (2003)
who measured daily transpiration rates in individual trees from 0.5 to 4.6 mm d-1 in a patch of
advanced secondary forest in Vietnam during the wet season. In our study, mean transpiration
69

CHAPTER 4 Contribution in: Tropical Rainforests and Agroforests under Global Change, Springer, Berlin
rates over the study periods differed fourfold across species from 0.6 to 2.4 mm d-1 (Table 2). For
the mentioned study in a forest patch in Vietnam, transpiration rates were also found to be dif-
ferent among species and were, in addition, influenced by crown exposure, seasonality and en-
hanced transpiration at the forest edge (Giambelluca et al. 2003). It is unlikely that differences in
transpiration rates observed between species can be translated directly to transpiration at the
stand level as different stand development and stand structure of contrasting species (or species
mixtures) are likely to partly reduce species-specific transpiration rates. Nevertheless, we assume
that the remarkable differences across tree species in both tree water use and tree transpiration
rates could be exploited to manage stand water use.
Table 2: Maximum (Qmax) and mean water use (Qmean) and maximum (Tmax) and mean (Tmean) transpiration rates (means and standard deviations, n depends on study site (see Table 1)). Significant differences (p < 0.05) are indicated by different small letters.
4 Conclusions
We conclude that water use- and transpiration rates found in trees of tropical reforestation
and agroforestry stands showed considerable variation across species. Despite the strong de-
pendence of maximal tree water use on tree diameter for the individuals studied, considerable
scatter was present around the fitted curve with species located on distinct trajectories. At a
given diameter, up to twofold differences between trees of different species were observed. Spe-
cies selection might thus indeed be an effective tool to control water use in reforestation and
agroforestry. It can be used to optimise the balance between wood production or carbon seques-
tration and the use of water resources.
Acknowledgements
This study was funded by the German Research Foundation in the framework of the SFB
552 (sub-project B4) and a further grant for the study in Panama (Ho-2119/3-1).
70

CHAPTER 4 Contribution in: Tropical Rainforests and Agroforests under Global Change, Springer, Berlin
References Becker P (1996) Sap flow in Bornean heath and dipterocarp forest trees during wet and dry periods. Tree Physiology
16: 295-299
Cienciala E, Kucera J, Malmer A (2000) Tree sap flow and stand transpiration of two Acacia mangium plantations in
Sabah, Borneo. Journal of Hydrology 236: 109-120
Dierick D, Hölscher D (2009) Species-specific tree water use characteristics in reforestation stands in the Philip-
pines. Agricultural and Forest Meteorology 149: 1317-1326
Dünisch O, Morais RR (2002) Regulation of xylem sap flow in an evergreen, a semi-deciduous, and a deciduous
Meliaceae species from the Amazon. Trees-Structure and Function 16: 404-416
Farley KA, Jobbagy EG, Jackson RB (2005) Effects of afforestation on water yield: a global synthesis with implica-
tions for policy. Global Change Biology 11: 1565-1576
Giambelluca TW, Ziegler AD, Nullet MA, Truong DM, Tran LT (2003) Transpiration in a small tropical forest
patch. Agricultural and Forest Meteorology 117: 1-22
Gradstein SR, Kessler M, Pitopang R (2007) Tree species diversity relative to human land uses in tropical rain forest
margins in Central Sulawesi. In: Tscharntke T, Leuschner C, Guhardja E, Zeller M (Eds.), The Stability of Tropi-
cal Rainforest Margins: Linking Ecological, Economic and Social Constraints of Land Use and Conservation.
Springer, Berlin, p. 321-334
Granier A (1985) A new method of sap flow measurement in tree stems. Annals of Forest Science 42: 193-200
Granier A (1987) Evaluation of transpiration in a Douglas-fir stand by means of sap flow measurements. Tree
Physiology 3: 309-319
Granier A, Huc R, Barigah ST (1996) Transpiration of natural rain forest and its dependence on climatic factors.
Agricultural and Forest Meteorology 78: 19-29
Granier A, Loustau D, Breda N (2000) A generic model of forest canopy conductance dependent on climate, soil
water availability and leaf area index. Annals of Forest Science 57: 755-765
Harris PP, Huntingford C, Cox PM, Gash JHC, Malhi Y (2004) Effects of soil moisture on canopy conductance of
Amazonian rainforest. Agricultural and Forest Meteorology 122: 215-227
Hatton TJ, Catchpole EA, Vertessy RA (1990) Integration of sapflow velocity to estimate plant water-use. Tree
Physiology 6: 201-209
Herbst M, Eschenbach C, Kappen L (1999) Water use in neighbouring stands of beech (Fagus sylvatica L.) and
black alder (Alnus glutinosa (L.) Gaertn.). Annals of Forest Science 56: 107-120
Jackson BJ, Jobbagy EG, Avissar R, Roy SB, Barrett DJ, Cook CW, Farley KA, le Maitre DC, McCarl BA, Murray
BC (2005) Trading water for carbon with biological carbon sequestration. Science 310: 1944-1947
Jarvis PG (1976) The interpretation of the variations in leaf water potential and stomatal conductance found in
canopies in the field. Philosophical Transactions of the Royal Society of London B- Biological Sciences 273: 593-
610
Köhler, M., Dierick, D., Schwendenmann, L., Hölscher, D., 2009. Water use characteristics of cacao and Gliricidia
trees in an agroforest in Central Sulawesi, Indonesia , Ecohydrology 2, 520 – 529
71

CHAPTER 4 Contribution in: Tropical Rainforests and Agroforests under Global Change, Springer, Berlin
72
Langenberger G (2006) Habitat distribution of dipterocarp species in the Leyte Cordillera: an indicator for species-
site suitability in local reforestation programs. Annals of Forest Science 63: 149-156
Leigh EG, Rand AS, Windsor DW (1996) The ecology of a tropical forest, 2nd edn, Smithsonian Press, Washington,
DC
Margraf J, Milan PP (1996) Ecology of dipterocarp forests and its relevance for island rehabilitation in Leyte, Philip-
pines. In: Schulte A, Schöne D (Eds.), Dipterocarp Forest Ecosystems: Towards Sustainable Management. World
Scientific, Singapore, p. 124-154
McJannet D, Fitch P, Disher M, Wallace J (2007) Measurements of transpiration in four tropical rainforest types of
north Queensland, Australia. Hydrological Processes 21: 3549-3564
Meinzer FC (2003) Functional convergence in plant responses to the environment. Oecologia 134: 1-11
Meinzer FC, Goldstein G, Andrade JL (2001) Regulation of water flux through tropical forest canopy trees: Do uni-
versal rules apply? Tree Physiology 21: 19-26
Meinzer FC, James SA, Goldstein G (2004) Dynamics of transpiration, sap flow and use of stored water in tropical
forest canopy trees. Tree Physiology 24: 901-909
Meinzer FC, Bond BJ, Warren JM, Woodruff DR (2005) Does water transport scale universally with tree size? Func-
tional Ecology 19: 558-565
O'Brien JJ, Oberbauer SF, Clark DB (2004) Whole tree xylem sap flow responses to multiple environmental vari-
ables in a wet tropical forest. Plant, Cell and Environment 27: 551-567
Oren R, Pataki DE (2001) Transpiration in response to variation in microclimate and soil moisture in southeastern
deciduous forests. Oecologia 127: 549-559
PAGASA (2007) Philippine Atmospheric, Geophysical and Astronomical Services Administration, Philippines.
R Development Core Team (2008) R: A language and environment for statistical computing. R Foundation for Sta-
tistical Computing, Vienna, Austria, ISBN 3-900051-07-0,http://www.R-project.org (last visited 28/05/2009)
STRI (2009) Temperature and rainfall data Barro Colorado Island, Panama 1987-2006. http://striweb.si.edu/esp/
physical_monitoring/download_bci.htm (last visited 28/05/2009)
van Dijk AIJM, Keenan RJ (2007) Planted forests and water in perspective. Forest Ecology and Management 251: 1-
9
van Kanten R, Vaast P (2006) Transpiration of arabica coffee and associated shade tree species in sub-optimal, low-
altitude conditions of Costa Rica. Agroforestry Systems 67: 187-202
Whitley R, Zeppel M, Armstrong N, Macinnis-Ng C, Yunusa I, Eamus D (2008) A modified Jarvis-Stewart model
for predicting stand-scale transpiration of an Australian native forest. Plant and Soil 305: 35-47

73

74 Picture source: http://commons.wikimedia.org

CHAPTER 5 Agricultural and Forest Meteorology (in press)
Throughfall reduction in a cacao agroforest: tree water use and soil water budgeting
Michael Köhler*, Luitgard Schwendenmann1 & Dirk Hölscher
Tropical Silviculture and Forest Ecology, Burckhardt Institute, Georg-August-Universität Göttingen, Büsgenweg 1, 37077 Göttingen, Germany 1Present address: School of Environment, The University of Auckland, Private Bag 92019, Auckland 1142, New Zea-land
Abstract. In a cacao agroforest with Gliricidia shade trees we studied the effects of experimentally reduced throughfall on tree sap flux densities and soil water budget. The objectives of our study were: (1) to identify the response of cacao and Gliricidia sap flux densities to reduced soil water availability, and (2) to analyze the changes in stand level soil water partitioning, measured as changes in transpiration, drainage and soil moisture storage under reduced throughfall. The study was conducted in Sulawesi, Indonesia at a site where ambient precipitation was 2841 mm yr−1. The research site was subdivided into three control plots and three plastic roof plots in which net precipitation was reduced by 71% through the use of a sub-canopy roof for 13 months, to create rainfall conditions similar to an extended El Niño event. The two species differed in their sap flux response to declining soil water content. Daily Gliricidia sap flux declined at higher soil water contents than cacao, while Gliricidia sap flux declined in response to all levels of vapor pressure deficit (VPD) and cacao only responded to high levels of VPD. Average monthly sap flux densities of cacao and Gliricidia in the roof plots decreased linearly with decreasing soil water content reaching a maximum reduc-tion of 21% (cacao) and 29% (Gliricidia) as compared to control plots. Cacao withdrew water mainly from the topsoil where small amounts of throughfall entering gaps in the roof frequently rewetted the soil. Therefore the competition between the two species for water resources during long periods with only little precipitation was low or in favor of cacao. Average daily stand transpira-tion was 1.3 mm in roof plots and 1.5 mm in control plots. Measured soil water contents were simulated satisfactorily by the application of a one-dimensional soil water model based on Richards unsaturated flow equation. The model suggested that drain-age amounted to 1554 mm yr−1 in control plots. Drainage in roof plots was greatly reduced, totaling 299 mm yr−1. Soil moisture storage in the control underwent minor variations while it was heavily reduced in roof plots. Drainage in roof plots was a large driver of changes in soil moisture storage especially in deeper soil layers while precipitation and root water uptake were the main influencing factors for the topsoil. Deep root water uptake seemed to play a minor role in this experiment. Despite the strong reduction in net precipitation, declines in stand transpiration were moderate, suggesting that the stand did not react sensitively to the reduced throughfall scenario.
Keywords: drainage, transpiration, Gliricidia sepium, Indonesia, sap flux density, Theobroma cacao
Received 6 January 2010, Accepted 8 April 2010
* Corresponding author. Tel.: +49 551 399556; Fax: +49 551 394019; E-mail address: [email protected]
75

76

CHAPTER 5 Agricultural and Forest Meteorology (in press)
Introduction
Agroforestry is an important land use option in the human dominated landscapes of the
tropics. Agroforestry practices contribute to the conservation of biodiversity (Leakey, 1999) and
could potentially contribute to the mitigation of climate change through enhanced carbon stor-
age (Verchot et al., 2007). Furthermore, studies indicate that agroforests exhibit improved resil-
ience to reduced precipitation as trees draw water from deeper soil layers while providing shade
to main crops (Verchot et al., 2007). Resilience to drought may become increasingly important in
tropical regions as climate change studies predict that these regions could experience a shift in
precipitation patterns leading to more frequent and/or more severe droughts in the future (Shef-
field and Wood, 2008). The assessment of ecosystem water budgets and changes in plant water
use under reduced precipitation regimes is important because both contribute to the prediction
of specific ecosystem responses to climate change and provide insight which may be useful to
improve future watershed modeling as well as studies of soil nutrient cycles.
One method to study changes in forest ecosystem water budgets and plant water use caused
by reduced rainfall is the reduction or exclusion of canopy throughfall to artificially impose dry
conditions on selected plots. Such stand level approaches are advantageous over studies on water
limitations of pot grown plants or saplings because questions of individual plant response, inter-
actions between plants, and stand level water carbon and nutrient cycling responses can be han-
dled here (Hanson, 2000). Large scale water manipulation experiments have been conducted in
temperate grasslands (Fay et al., 2000) but also in forest ecosystems (Gebre et al., 1998; Hanson
et al., 1998). In some manipulation experiments roofs were constructed intercepting 100% of
throughfall (Fay et al., 2000; Bredemeier et al., 1998) and desired quantities and qualities of water
were supplied by irrigation.
Also frequently applied is the partial coverage of the ground area with gutters or troughs
(Hanson et al., 1998) to reduce incoming throughfall. Two stand level throughfall manipulation
experiments of this kind have already been conducted to study plant and whole ecosystem re-
sponses towards reduced throughfall in the tropical rainforests, namely in East-Central (Nepstad
et al., 2002; Belk et al., 2007) and Eastern Amazonia (Fisher et al., 2007). A soil water model ap-
plied to the East-Central Amazonian rainforest suggested only a mild transpiration decline after
two years of throughfall reduction. However, no data on tree water use characteristics were sur-
veyed to confirm these findings. Such measurements were conducted in the Eastern Amazon
and a strong sap flux decline was found (Fisher et al., 2007).
77
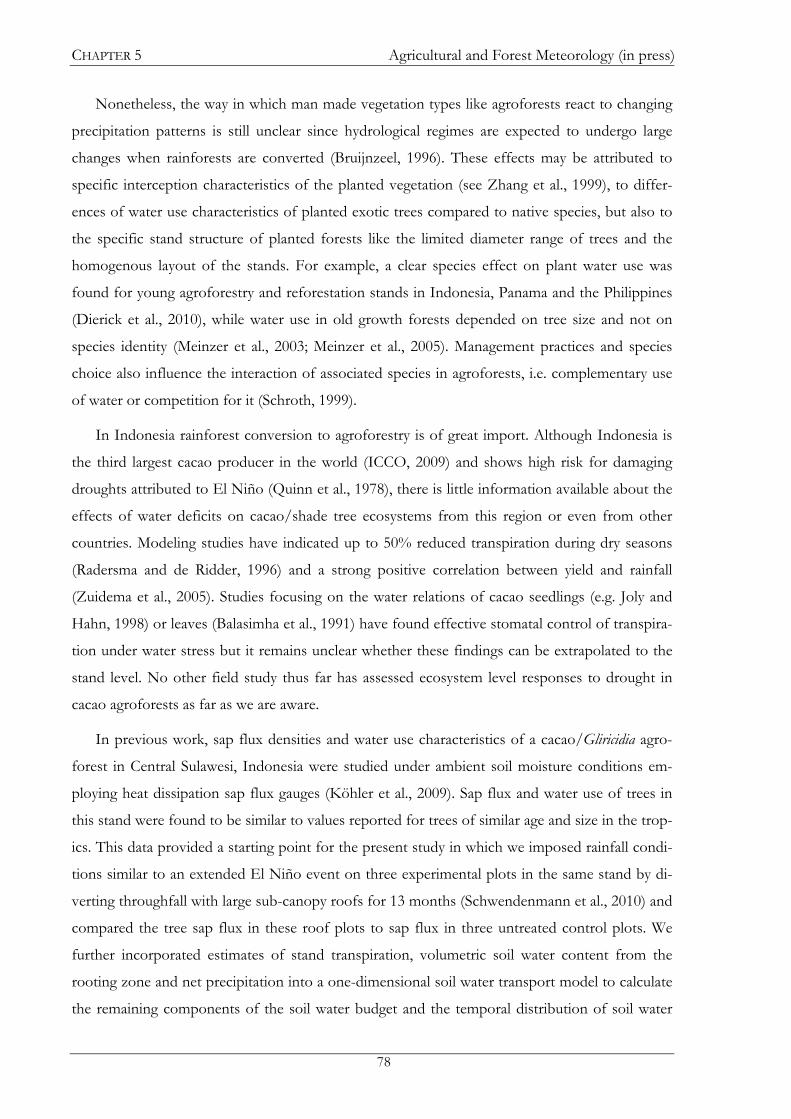
CHAPTER 5 Agricultural and Forest Meteorology (in press)
Nonetheless, the way in which man made vegetation types like agroforests react to changing
precipitation patterns is still unclear since hydrological regimes are expected to undergo large
changes when rainforests are converted (Bruijnzeel, 1996). These effects may be attributed to
specific interception characteristics of the planted vegetation (see Zhang et al., 1999), to differ-
ences of water use characteristics of planted exotic trees compared to native species, but also to
the specific stand structure of planted forests like the limited diameter range of trees and the
homogenous layout of the stands. For example, a clear species effect on plant water use was
found for young agroforestry and reforestation stands in Indonesia, Panama and the Philippines
(Dierick et al., 2010), while water use in old growth forests depended on tree size and not on
species identity (Meinzer et al., 2003; Meinzer et al., 2005). Management practices and species
choice also influence the interaction of associated species in agroforests, i.e. complementary use
of water or competition for it (Schroth, 1999).
In Indonesia rainforest conversion to agroforestry is of great import. Although Indonesia is
the third largest cacao producer in the world (ICCO, 2009) and shows high risk for damaging
droughts attributed to El Niño (Quinn et al., 1978), there is little information available about the
effects of water deficits on cacao/shade tree ecosystems from this region or even from other
countries. Modeling studies have indicated up to 50% reduced transpiration during dry seasons
(Radersma and de Ridder, 1996) and a strong positive correlation between yield and rainfall
(Zuidema et al., 2005). Studies focusing on the water relations of cacao seedlings (e.g. Joly and
Hahn, 1998) or leaves (Balasimha et al., 1991) have found effective stomatal control of transpira-
tion under water stress but it remains unclear whether these findings can be extrapolated to the
stand level. No other field study thus far has assessed ecosystem level responses to drought in
cacao agroforests as far as we are aware.
In previous work, sap flux densities and water use characteristics of a cacao/Gliricidia agro-
forest in Central Sulawesi, Indonesia were studied under ambient soil moisture conditions em-
ploying heat dissipation sap flux gauges (Köhler et al., 2009). Sap flux and water use of trees in
this stand were found to be similar to values reported for trees of similar age and size in the trop-
ics. This data provided a starting point for the present study in which we imposed rainfall condi-
tions similar to an extended El Niño event on three experimental plots in the same stand by di-
verting throughfall with large sub-canopy roofs for 13 months (Schwendenmann et al., 2010) and
compared the tree sap flux in these roof plots to sap flux in three untreated control plots. We
further incorporated estimates of stand transpiration, volumetric soil water content from the
rooting zone and net precipitation into a one-dimensional soil water transport model to calculate
the remaining components of the soil water budget and the temporal distribution of soil water
78

CHAPTER 5 Agricultural and Forest Meteorology (in press)
79
storage change and drainage. The model will also be applied for companion studies on nutrient
cycling and CO2 leaching flux conducted in this agroforestry system.
The objectives of our study were: 1) to identify the response of cacao and Gliricidia sap flux
densities to reduced soil water availability, and 2) to analyze the changes in stand level soil water
partitioning, measured as changes in transpiration, drainage and soil moisture storage under re-
duced throughfall. Our study may help to better understand the response of tree-based land use
systems in the tropics to extended droughts which may become more frequent and more severe
in the future due to climate change.
Methods Study site
The study was conducted in a seven year old cacao/Gliricidia agroforest at 560 m a.s.l. on a
mild slope (8-12° inclination) close to the village of Marena in the district of Bolapapu, in Central
Sulawesi, Indonesia (1.552°S, 120.020°E). Data from a nearby weather station (Gimpu, 5 km
south of Marena at 471 m a.s.l.) collected between 2002 and 2006 showed an average annual
temperature of 25.5°C and an annual precipitation of 2092 mm y-1 (Kreilein, Panferov &
Gravenhorst, unpublished data) with no distinct dry season. Leaf area index for the cacao tree
layer was estimated at 3.8 m2 m-2 and for the shade trees in the stand at 1.3 m2 m-2 (Schwenden-
mann et al., 2010). The water table at the site was below 4.5 m depth as estimated with piezome-
ters. The soil was classified as a Cambisol with sandy loam texture and high rock fragment con-
tent in the subsoil (Leitner & Michalzik, unpublished data). Main soil characteristics are listed in
Table 1.
Cacao trees (1030 stems ha-1) grew under a cover of Gliricidia sepium (Jacq.) Kunth ex Steud
shade trees (325 stems ha-1). Average tree height was 5.4 and 9.5 m for cacao and Gliricidia, re-
Table 1: Average soil texture, bulk density and rock content (mean ± SD, n = 6, no significant differences between roof and control).
Depth Sand Silt Clay Bulk density Depthb Rock content
(cm) (vol. %) (vol. %) (vol. %) (g cm-3) (cm) (vol. %) 0-10 55.0 ±3.4 29.7±3.6 15.3±2.4 1.28±0.04 0-50 7.9±3.0 10-20 55.7±0.9 28.2±3.0 16.1±3.5 1.31±0.02 50-100 19.0±4.3 20-40 53.9±4.8 26.5±3.3 18.6±2.9 1.32±0.05 100-150 20.9±2.4 40-75 57.9±2.3 22.8±3.4 19.3±3.3 1.37±0.09 150-200 26.7±8.8 75 - 150 68.7±5.3 19.4±3.0 11.9±4.4 1.52±0.10 200- 250 24.1±5.4 150 – 250a
70.3±7.1 22.8±6.4 6.9±2.3 1.60±0.06 a n=5, b depths for rock content estimation

CHAPTER 5 Agricultural and Forest Meteorology (in press)
spectively. Throughout the study period, cacao trees were pruned in July and December of 2007,
while Gliricidia trees were not pruned. The ground was kept free of an herbaceous understory due
to low light availability below the canopy supplemented by regular weeding.
Experimental design
The study stand (~1 ha) was subdivided into three throughfall reduction ‘roof plots’ and tree
control plots. Each plot measured 40 m × 35 m and all measurements were conducted in a cen-
tral ‘core zone’ (30 × 25 m) within each plot to avoid edge effects from the surrounding area.
The plots were separated by trenches extending over the main rooting zone (40 cm) lined with
plastic in order to obstruct lateral water movement, root water uptake from the surrounding and
the intrusion of overland flow. The roof plots were covered with large sub-canopy roofs made
from polyethylene foil lined bamboo frames covering approximately 80% of the total ground
area. The roof extended below the branching point of cacao (~100 cm above ground).
Measurements were taken continuously from February 1, 2007 to June 5, 2008. The roofs
were set up on March 1, 2007 and were operated subsequently for 13 months until April 10,
2008 when the throughfall reduction experiment was discontinued. This time span allowed the
recording of a baseline dataset before the initiation of throughfall reduction and also allowed for
the assessment of data within the rewetting phase after opening the roof. The percentage
throughfall reduction ranged from 48 to 59% in March and April 2007 and increased to 78%
from May 2007 onwards (Moser et al., in press). For a detailed description of this experiment see
Schwendenmann et al. (2010).
Micrometeorological and soil water content measurements
Data on air humidity and air temperature (CS215, Campbell Scientific Inc., Logan, UT,
USA), global radiation (Rg, CS300, Apogee Instruments Inc., Logan, UT, USA) and precipitation
(ARG100, Environmental Measurements Ltd., Sunderland, UK) were gathered at a distance of
30 m from the study stand and at a height of 4 m. Data was collected every 5 seconds, averaged
and logged at 30 min intervals using a CR800 data logger (Campbell Scientific Inc., Logan,
UT,USA). Measured global radiation values indicated that the sensor underestimated real values
from October 2007 onward due to malfunctioning. We therefore did not include global radiation
in the analyses of sap flux.
Volumetric soil water content was measured in the study site with time domain reflectrome-
try probes (TDR, CS616, Campbell Scientific Inc., Logan, UT). On each plot one large soil pit
(80 × 160 × 300 cm) was dug and TDR sensors were placed at depths of 10, 20, 40, 75, 150 and
80

CHAPTER 5 Agricultural and Forest Meteorology (in press)
250 cm. Two additional sensors were installed at depths of 10 cm and 75 cm in two smaller soil
pits (80 × 100 × 250 m) in each plot. The pit walls where TDRs were installed were covered with
plastic foil to prevent evaporation. Because TDR installation was hindered by high rock fragment
content at greater depths, only two roof and control plots carried TDRs at 150 cm. Additionally,
TDRs could only be installed at 250 cm in two control plots and one roof plot. The probes were
calibrated following Veldkamp and O’Brien (2000) using two samples from depths of 10, 40 and
70 cm. As differences in calibration curves between depths were minimal, one lumped calibration
was applied to TDRs at 10, 20, 40 and 75 cm depth (for details see Köhler et al., 2009). TDRs at
150 and 250 cm depth could not be calibrated because large rock fragments prevented the ex-
traction of undisturbed soil samples. In substitution, the manufacturer’s calibration was applied
here. Data was logged hourly using a CR1000 data logger (Campbell Scientific Inc., Logan, UT)
Care was taken to install the TDRs where there were no rock fragments. However, the rock
fragments remaining in the soil caused an overestimation of soil water storage due to the fact
that rock fragments do not hold (plant available) water. To correct for this overestimation all
measured volumetric water contents were proportionally reduced to the actual volume of soil
that was not occupied by rock fragments ( Fiès et al., 2002). The total volume of rock fragments
in the soil was estimated in soil layers between the depths of 50 and 250 cm in one pit per plot
(Table 1). Rock fragments were excavated, cleaned, sun-dried and weighed. Rock volume was
calculated from an estimate of rock bulk density which was derived from the weight and water
displacement of a sub sample of rock fragments. The measured volumetric soil water contents at
10, 20, 40, 75 and 250 cm depth were then corrected using the rock fragment contents from the
respective layers. For the water content measured at 150 cm depth we used the average rock
fraction of the 100-150 and 150-200 cm layers.
Sap flux density and tree water use
In each plot we equipped three randomly selected cacao and three Gliricidia trees with two
heat dissipation sap flux sensors constructed after Granier (1987). In Gliricidia trees, sensors were
placed at 130 cm height and in cacao trees below the branching point at around 60–100 cm
above the ground. The diameter measured between the upper and the lower probe and the
height (mean ± SD) of the selected trees were 10.1±1.6 cm and 4.5±0.8 m for cacao and
15.0±2.5 cm and 10.9±2.1 m for Gliricidia, respectively.
Each sap flux sensor consisted of a pair of probes 2.4 cm in lengths which were inserted at
14 cm vertical distance into the trunks of selected trees. Sensors were shielded by a box made
from insulating Styrofoam and a section of the stem extending well above and below the sensors
81

CHAPTER 5 Agricultural and Forest Meteorology (in press)
was covered by reflective foil to limit temperature gradients caused by incident solar radiation.
The temperature difference between the upstream and the heated downstream probes was re-
corded every 30 s and averaged and stored every 30 min (CR1000 data logger and AM 16/32
multiplexer, Campbell Scientific Inc., Logan, UT, USA.). Temperature differences were con-
verted to sap flux density (Js, g cm-2 h-1) employing an empirically derived equation Granier
(1987).
The reduction of sap flux density with increasing xylem depth was further assessed in eight
trees per species after xylem area was estimated by dye injection. Thereby, sap wood depth was
found to be greater than sensor length. Sap flux density measured at each xylem depth was mul-
tiplied by the respective xylem area to calculate water use rates for each depth. These were then
summed to yield the total tree water use Q (kg d-1).
For each species in the roof and control plots we established daily regressions between Q and
tree diameter (n = 9). These relationships were used to calculate Q for all other individuals pre-
sent in the stand based on measured tree diameters. Summing all tree water use rates and divid-
ing this sum by the ground area of the respective plots yielded stand transpiration (T, mm day-1).
The sap flux measurements collected from three individuals per species per plot were used to
derive T for the entire stand. As tree and row spacing was regular, the plot margins were located
just in between two rows of trees wherefore the ground area of each plot was well defined.
Therefore the error margin of the transpiration estimates was mainly associated to errors of sap
flux measurements. During the measurement campaign, we replaced the sensors once in Sep-
tember 2007 which led to missing data within that month. We therefore established a multiple
linear regression model between global radiation (Rg), vapor pressure deficit (VPD) and T of roof
and control plots using data from August 2007 (R2 = 0.84 - 0.87, p < 0.05) and derived T from
Rg and VPD for September with this model. Further details on sap flux measurements, water use
and transpiration calculations within this stand are described in Köhler et al. (2009).
A difference in sap flux density at a given atmospheric demand is attributed to limited soil
water availability if two periods (treatments) with clearly different soil water contents can be dis-
tinguished (Pataki et al., 2000). We therefore separated our study period into monthly sub-
periods and compared the response of cacao and Gliricidia daily integrated sap flux densities to
average daily VPD under given soil moisture conditions using nonlinear regression models. Dif-
ferences between roof and control plots were tested with F-tests comparing a null model compris-
ing lumped data from both treatments per species with alternative models for each of the treat-
ments.
82
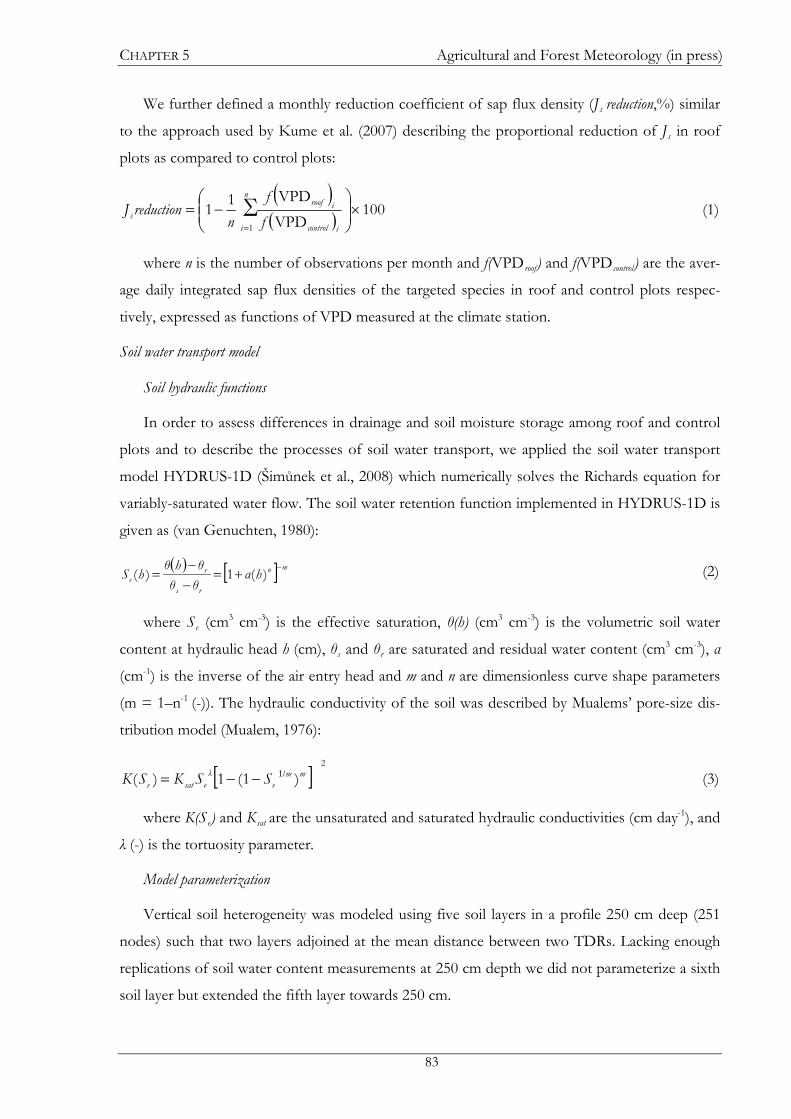
CHAPTER 5 Agricultural and Forest Meteorology (in press)
83
We further defined a monthly reduction coefficient of sap flux density (Js reduction,%) similar
to the approach used by Kume et al. (2007) describing the proportional reduction of Js in roof
plots as compared to control plots:
( )( ) 100VPDVPD11
1
×⎟⎟⎠
⎞⎜⎜⎝
⎛−=
=
∑n
i icontrol
iroofs f
fn
reductionJ (1)
where n is the number of observations per month and f(VPDroof) and f(VPDcontrol) are the aver-
age daily integrated sap flux densities of the targeted species in roof and control plots respec-
tively, expressed as functions of VPD measured at the climate station.
Soil water transport model
Soil hydraulic functions
In order to assess differences in drainage and soil moisture storage among roof and control
plots and to describe the processes of soil water transport, we applied the soil water transport
model HYDRUS-1D (Šimůnek et al., 2008) which numerically solves the Richards equation for
variably-saturated water flow. The soil water retention function implemented in HYDRUS-1D is
given as (van Genuchten, 1980):
( ) [ mn
rs
re hα
θθθhθhS −
+=−−
= )(1)( ]
, 1976):
]
(2)
where Se (cm3 cm-3) is the effective saturation, θ(h) (cm3 cm-3) is the volumetric soil water
content at hydraulic head h (cm), θs and θr are saturated and residual water content (cm3 cm-3), α
(cm-1) is the inverse of the air entry head and m and n are dimensionless curve shape parameters
(m = 1–n-1 (-)). The hydraulic conductivity of the soil was described by Mualems’ pore-size dis-
tribution model (Mualem
[2
)1(1)( mme
λesate SSKSK 1/−−= (3)
where K(Se) and Ksat are the unsaturated and saturated hydraulic conductivities (cm day-1), and
λ (-) is the tortuosity parameter.
Model parameterization
Vertical soil heterogeneity was modeled using five soil layers in a profile 250 cm deep (251
nodes) such that two layers adjoined at the mean distance between two TDRs. Lacking enough
replications of soil water content measurements at 250 cm depth we did not parameterize a sixth
soil layer but extended the fifth layer towards 250 cm.

CHAPTER 5 Agricultural and Forest Meteorology (in press)
84
Boundary conditions were set to ‘atmospheric with surface run off’ and ‘free drainage’.
Measured water contents provided the initial conditions. Time variable boundaries (input data)
were net precipitation (Pnet, , mm) and measured stand transpiration. Evaporation from the bare
soil was considered negligible because the soil was well covered with litter and little radiation
reached the ground. We established a linear regression from weekly measured canopy throughfall
and gross precipitation (Pgross, Moser, unpublished data) and applied it to daily rainfall data to de-
rive throughfall on a daily basis. Daily canopy throughfall in roof plots accounts also for meas-
ured interception caused by the roofs. Stem flow amounted to 5% of gross precipitation
(Schwendenmann, unpublished data) and was added to yield Pnet. We did not apply the model to
each plot separately due to the fact that T and Pnet consisted of averages taken across all three
roof plots and all three control plots. In addition, rock fragment content of the soil, soil texture
and bulk density were averaged over all six plots as differences between plots were insignificant.
The root biomass of each species was measured in steps of 20 cm depth (Schwendenmann et
al., 2010). Rooting patterns remained unchanged during the experiment (Schwendenmann et al.,
2010). Fine root biomass declined exponentially with depth to zero at 240 cm with 67% of the
total biomass being located in the top 40 cm. We chose an S-shaped root water uptake stress re-
sponse function (van Genuchten, 1987; van Genuchten and Gupta, 1993):
( )( )
⎥⎥⎦
⎤
⎢⎢⎣
⎡⎟⎟⎠
⎞⎜⎜⎝
⎛+
= p
hzh
hrα
50
1
1 (4)
where αr (-) is the water stress response (0 < αr < 1) with which potential root water uptake is
multiplied, h(z) (cm) is the soil water potential at location z, h50 (cm) is the soil water potential at
which root water uptake rate is reduced by 50%, and p (-) is a fitting parameter. Like Sommer et
al. (2003) we used actual transpiration as input and thus had to match potential and actual root
water uptake. Hence we set h50 and p to arbitrarily high values of -5000 cm and 6 to ensure that
only very dry conditions could alter root water uptake. In case water uptake might still be re-
duced by low potentials, the root adaptability factor (Šimůnek et al., 2008) was set to zero so that
hindered water uptake from one layer could be compensated for by increased uptake from an-
other.
Adjustment of soil hydraulic parameters
Hydraulic parameters of the van Genuchten function estimated from laboratory pressure
plate measurements (van Straaten, unpublished data) did not lead to model convergence in either
roof or control plots. Such deviations between field and laboratory retention data are common.

CHAPTER 5 Agricultural and Forest Meteorology (in press)
85
Therefore, in many studies soil hydraulic parameters are either iteratively adjusted by trial and
error (e.g. Schlegel et al., 2004; Belk et al., 2007) or inversely estimated from measured soil water
contents and/or potentials and evapotranspiration fluxes (e.g. Vrugt et al., 2001; Ritter et al.,
2003; Sommer et al., 2003) for which we opted. HYDRUS-1D implements a Marquardt-
Levenberg type parameter estimation technique for the simultaneous fit of 15 hydraulic parame-
ters (three per layer). The pedotransfer function of the ROSETTA software (Schaap et al., 2001)
was used to derive initial estimations of the soil hydraulic parameters (θ s, θr ,α ,n and Ksat) from
soil texture and bulk density for each layer. We set λ to -1 as an improved prediction of unsatu-
rated hydraulic conductivity was reported (Schaap and Leij, 2000) compared to the originally
suggested λ = 0.5 by Mualem (1975). In a sensitivity analysis based on comparison of the root
mean square error (RMSE) of modeled and predicted water contents, we found θ s, α and n to
have the largest impact on model fit. These were inversely optimized in this study, while θr, and
Ksat were taken from the ROSETTA prediction. Because observed water contents entered the
objective function during optimization, model evaluation is not strictly independent (Sommer et
al., 2003). Thus we separated the measurement period into calibration and validation phases to
evaluate the model performance.
Data analyses
Regression models and differences between them were considered significant if p < 0.05. In
analogy to linear models we calculated R2 adjusted also for nonlinear models. RMSE and Nash-
Sutcliffe model efficiency E are given to judge the goodness of the model fit (Nash and Sutcliffe,
1970). E varies from -∞ (negative values indicate that the average of a time series would be a bet-
ter predictor than the model) to 1.0 (perfect fit). All data analyses were conducted with R version
2.8.1 (RDCT, 2008).
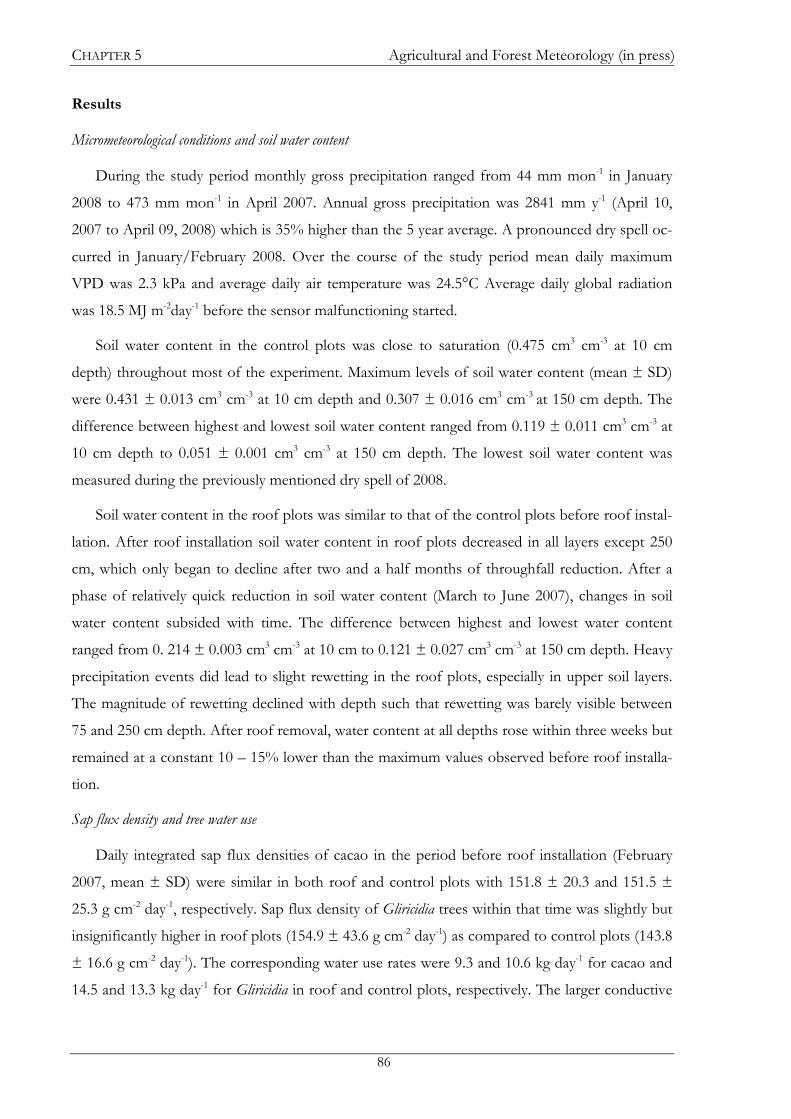
CHAPTER 5 Agricultural and Forest Meteorology (in press)
Results Micrometeorological conditions and soil water content
During the study period monthly gross precipitation ranged from 44 mm mon-1 in January
2008 to 473 mm mon-1 in April 2007. Annual gross precipitation was 2841 mm y-1 (April 10,
2007 to April 09, 2008) which is 35% higher than the 5 year average. A pronounced dry spell oc-
curred in January/February 2008. Over the course of the study period mean daily maximum
VPD was 2.3 kPa and average daily air temperature was 24.5°C Average daily global radiation
was 18.5 MJ m-2day-1 before the sensor malfunctioning started.
Soil water content in the control plots was close to saturation (0.475 cm3 cm-3 at 10 cm
depth) throughout most of the experiment. Maximum levels of soil water content (mean ± SD)
were 0.431 ± 0.013 cm3 cm-3 at 10 cm depth and 0.307 ± 0.016 cm3 cm-3 at 150 cm depth. The
difference between highest and lowest soil water content ranged from 0.119 ± 0.011 cm3 cm-3 at
10 cm depth to 0.051 ± 0.001 cm3 cm-3 at 150 cm depth. The lowest soil water content was
measured during the previously mentioned dry spell of 2008.
Soil water content in the roof plots was similar to that of the control plots before roof instal-
lation. After roof installation soil water content in roof plots decreased in all layers except 250
cm, which only began to decline after two and a half months of throughfall reduction. After a
phase of relatively quick reduction in soil water content (March to June 2007), changes in soil
water content subsided with time. The difference between highest and lowest water content
ranged from 0. 214 ± 0.003 cm3 cm-3 at 10 cm to 0.121 ± 0.027 cm3 cm-3 at 150 cm depth. Heavy
precipitation events did lead to slight rewetting in the roof plots, especially in upper soil layers.
The magnitude of rewetting declined with depth such that rewetting was barely visible between
75 and 250 cm depth. After roof removal, water content at all depths rose within three weeks but
remained at a constant 10 – 15% lower than the maximum values observed before roof installa-
tion.
Sap flux density and tree water use
Daily integrated sap flux densities of cacao in the period before roof installation (February
2007, mean ± SD) were similar in both roof and control plots with 151.8 ± 20.3 and 151.5 ±
25.3 g cm-2 day-1, respectively. Sap flux density of Gliricidia trees within that time was slightly but
insignificantly higher in roof plots (154.9 ± 43.6 g cm-2 day-1) as compared to control plots (143.8
± 16.6 g cm-2 day-1). The corresponding water use rates were 9.3 and 10.6 kg day-1 for cacao and
14.5 and 13.3 kg day-1 for Gliricidia in roof and control plots, respectively. The larger conductive
86

CHAPTER 5 Agricultural and Forest Meteorology (in press)
sap wood area of Gliricidia led to higher Q as compared to cacao despite similar sap flux densities
in both species. Daily average T was 1.3 and 1.5 mm day-1 in roof and control plots, respectively.
Cacao trees contributed approximately 70% of total stand transpiration in roof and control plots.
Monthly regression models of sap flux response to VPD showed no significant difference
between roof and control plots before roof installation for either Gliricidia or cacao (Figure 1, A).
From June (Gliricidia) and July 2007 (cacao) onward (4 and 5 months after roof closure) roof
plots exhibited a significant decline (p ≤ 0.05) in sap flux densities for both species. The sap flux
decline was greatest for both species during February 2008, the month in which lowest soil water
contents were measured (Figure 1 (B)). Some differences were observed between the two spe-
cies. For cacao, sap flux densities at low VPD in roof plots were comparable to those of the con-
trol, however Gliricidia exhibited sap flux densities below those of the control at low VPD. This
pattern was observed over the whole duration of the throughfall reduction period. Gliricidia sap
flux in roof plots fully recovered one month after the experiment (Figure 1 C), while cacao sap
flux had already recovered one month before roof removal (March 2008) during heavy rainwater
intrusion partially rewetting the topsoil in roof plots.
Figure 1: Daily integrated average sap flux density (Js, n = 9) in roof (open circles) and control plots (dots) as functions of daily average VPD for Gliricidia (upper graphs) and cacao (lower graphs). The relationships are shown for February 2007 (pre-treatment), February 2008 (treat-ment) and May 2008 (post treatment).
87

CHAPTER 5 Agricultural and Forest Meteorology (in press)
Sap flux density in control plots was not influenced by changes in soil water content, so we
expressed the sap flux reduction coefficient as a function of soil water content in roof plots at 10
cm depth (Figure 2). Sap flux reduction increased linearly with decreasing soil water content,
reaching a maximum of 29.0% reduction in Gliricidia and 20.1% in cacao. Lowest reduction coef-
ficients were found within the first three months of the experiment (-7.2% and -4.8% for Gliri-
cidia and cacao) indicating slightly higher sap flux densities in roof plots at that time.
Figure 2: Monthly reduction coefficient of integrateddaily sap flux density (Js, n = 9) in cacao and Gliricidia as functions of average volumetric water content in roofplots (θ roof , n= 9) at 10 cm depth.
Soil water model and stand water budget
Inversely estimated hydraulic functions differed between roof and control plots in α and n
while θ s remained similar to the primary ROSETTA estimates (Table 2). Driven by higher values
of α in the upper four soil layers of roof plots, hydraulic heads were lower in roof plots than in
control plots at any given water content. Larger n values in the control led to smaller slopes in
the retention curves for control plots (upper 4 layers) such that changes in head were smaller
over a wide range of water contents than in roof plots. In contrast, in the layer between 113 –
250 cm control plots exhibited much lower hydraulic heads at given water contents (higher n and
lower α compared to the roof plots). Simulated root zone pressure heads at lowest water con-
tents were approximately -2100 cm in roof plots and -520 cm in control plots. Stand transpira-
88

CHAPTER 5 Agricultural and Forest Meteorology (in press)
89
tion entering the model as input variable was only marginally reduced (<0.1mm) in both, roof
and control by the root water uptake stress response function.
Overall model efficiency and RMSE were satisfying (Table 3). In general, deviations between
measured and modeled water contents were small and declined with depth as indicated by de-
creasing RMSE. While calibration and validation phases in roof plots showed similar RMSE and
E at each depth, fits in control plots were much better in the calibration phase than in the valida-
tion phase. In the control, peak water contents were slightly underestimated between depths of
10 to 75 cm and water contents were overestimated at 150 cm (Figure 3).
Table 3: Nash-Sutcliffe model efficiency (E) and randomized mean square error (RMSE) for the com-parison between simulated and measured soil water contents of the soil layers of the calibration (cal.), validation (val.) and full study period (full) for average roof and control plots.
Soil layer E (cal.) E (val.) E (full) RMSE (cal.)
RMSE (val.)
RMSE (full) Treatment
(cm) (-) (-) (-) (cm3 cm-3) (cm3 cm-3) (cm3 cm-3) 0-15 0.83 0.81 0.86 0.021 0.020 0.020 15-30 0.90 0.90 0.92 0.014 0.013 0.014 30-58 0.82 0.88 0.87 0.020 0.013 0.017 58-113 0.91 0.94 0.94 0.009 0.008 0.008
Roof
113 - 250 0.92 0.88 0.93 0.009 0.009 0.009 0-15 0.87 0.54 0.77 0.010 0.013 0.011 15-30 0.92 0.51 0.77 0.006 0.010 0.008 30-58 0.89 0.42 0.68 0.004 0.008 0.006 58-113 0.89 0.61 0.79 0.005 0.007 0.006
Control
113 - 250 0.77 0.46 0.62 0.005 0.006 0.005
Table 2: Effective soil hydraulic parameters (saturated (θ s) and residual water content (θ r), inverse of the air entry head (α), curve shape parameter (n) and saturated hydraulic conduc-tivity (Ksat) as determined by ROSETTA or inversely predicted by HYDRUS 1D for average roof and control plots.
Soil layer θ sa
θ rb αa na Ksat
bTreatment
(cm) (cm3 cm-3) (cm3 cm-3) (cm-1) (-) (cm day-1)0-15 0.383 0.055 0.001426 1.60 49.15 15-30 0.399 0.056 0.002164 1.47 43.84 30-58 0.427 0.062 0.004525 1.30 35.63 58-113 0.412 0.061 0.009331 1.27 34.83
Roof
113 - 250 0.307 0.041 0.004273 1.39 41.39 0-15 0.416 0.055 0.001417 3.23 49.15 15-30 0.424 0.056 0.001234 2.82 43.84 30-58 0.425 0.062 0.001003 2.22 35.63 58-113 0.371 0.061 0.001307 1.80 34.83
Control
113 - 250 0.303 0.041 0.004885 1.11 41.39 a Inversely estimated, b ROSETTA estimate from soil texture and bulk density

CHAPTER 5 Agricultural and Forest Meteorology (in press)
The water budget for 12 months (April 10, 2007 to April 09, 2008) indicated that 80% of Pnet
went to transpiration in roof plots and 26% went to transpiration in control plots (Table 4). In
April, August and December 2007 and in March 2008 more water entered the soil than was
withdrawn by roots. Soil moisture storage (SMS) in the control underwent only minor variations
over the course of the year. In contrast, roof plots showed greatly reduced SMS due to drainage
in the early stages of the experiment and due to transpiration in more advanced stages.
Table 4: Gross and net precipitation (Pgross, Pnet), Drainage at 250 cm depth (D) and change in soil moisture storage between 0 and 250 cm depth (Δ SMS) from April 10, 2007 to April 9, 2008 for average roof and control plots during the period of throughfall reduction..
Pgross Pnet T D Δ SMS Treatment
(mm y-1) (mm y-1) (mm y-1) (mm y-1) (mm y-1)Roof 611 491 299 -179 Control
2841 2117 560 1554 4
Figure 3: Simulated (dots) and measured (lines) soil water content (θ, n = 3) at 10, 70 and 150 cm depth and net precipitation (Pnet) in control plots. The lines at top of the uppermost graph indicate calibration and validation periods used.
SMS in roof plots did not return to its initial levels after roof removal, as indicated by lower
maximum water contents after roof removal compared to beginning of the measurements (see
90

CHAPTER 5 Agricultural and Forest Meteorology (in press)
Figure 4). Daily drainage rates in the control plots averaged ~ 4 mm day-1 over the 12 month pe-
riod. In roof plots drainage averaged ~ 6 mm day-1 prior to roof installation.
Figure 4: Simulated (dotted lines) and measured (solid lines) average soil water content (θ, n = 3) at 10, 70 and 150 cm depth and net precipitation (Pnet) in roof plots. The grey area indicates the time of throughfall reduction. Lines at the top of the uppermost graph indicate the calibration and validation periods used.
Following roof installation drainage declined, reaching an inflection point in mid June 2007.
At this point, drainage rates were similar to daily transpiration rates (~1.5 mm d-1, Figure 5).
From July 2007 onward the decrease in drainage rates leveled off, approaching values less than
0.1 mm day-1 during the last month of the throughfall reduction experiment. Despite the strong
reduction in drainage, a total of 97 mm of water drained from the soil profile following July
2007, an amount equal to approximately 25% of cumulative transpiration during that time. After
the roof was removed, it took one month for drainage rates in the roof plots to return to levels
similar to those of the control plots.
91

CHAPTER 5 Agricultural and Forest Meteorology (in press)
Figure 5: Cumulated net precipitation (Pnet , solid line), drainage (D, dashed line) and stand transpi-ration (T, dotted line) in control (left) and roof plots (right). The grey area depicts the time ofthroughfall reduction.
Discussion Sap flux density response to decreasing soil water content
Before roof setup, daily integrated sap flux densities did not differ between roof and control
plots. Tree sap flux density and water use in this stand under ambient conditions were found to
be in line with values reported for trees of similar age and size in the tropics (Köhler et al., 2009).
Sap flux in both Gliricidia and cacao declined with declining soil water content in roof plots. De-
spite the often higher evaporative demand associated with dry conditions, a number of studies
have found lower sap flux densities under natural dry conditions than under natural wet condi-
tions (e.g. Pataki et al., 2000; Hölscher et al., 2005; Kume et al., 2007). In contrast, O’Grady et al.
(1999) found higher sap flux in a eucalyptus forest in Northern Australia during drought due to
higher evaporative demand and deep soil water exploration. However, in our experiment fine
roots only reached down to about 240 cm and evaporative demand was the same for all plots
(Schwendenmann et al., 2010).
In our experiment cacao trees were found less sensitive to reduced soil water content. In
contrast to Gliricidia, cacao sap flux densities during the period of roof closure were only reduced
at high levels of VPD (Figure 1 B) and the sap flux reduction was less pronounced under dry
conditions (Figure 2). The different responses of cacao and Gliricidia to reduced soil water con-
tent might have several causes:
1) Based on the root distribution of both species, soil water partitioning may have occurred
such that cacao drew water mainly from the topsoil while Gliricidia relied on water reserves from
deeper soil layers. More than 80% of the cacao fine root biomass was located in the top 40 cm of
92

CHAPTER 5 Agricultural and Forest Meteorology (in press)
soil (Schwendenmann et al., 2010), while total Gliricidia fine root biomass was more evenly dis-
tributed in the soil profile (Moser et al., in press) with a pronounced peak between 0.5 and 1.5 m.
Thus, competition for water in the upper soil layers may have been avoided or favored cacao.
This finding is supported by a slightly higher correlation in Gliricidia and a much weaker correla-
tion in cacao between the sap flux reduction coefficient and soil water content at 75 cm depth in
roof plots (Data not shown). This confirms the evidence of soil water partitioning derived from
stable isotope analysis conducted before roof installation in which cacao appeared to use water
mainly from the upper 30 cm while Gliricidia obtained water from depths below 30 cm
(Schwendenmann et al., 2010). However, no stable isotope data are available yet for the time dur-
ing roof closure. Thus it remains unknown if these patterns changed with time.
Soil water partitioning can also help explain the recovery of cacao sap flux densities before
roof removal, as cacao would have made better use of water present in upper soil layers follow-
ing rain events. In an Amazonian rainforest, Fisher et al. (2007) reported an immediate recovery
of tree sap flux in their throughfall reduction plot within two days after a large rain event trig-
gered rewetting. This evidence contrasts with the delayed response of Gliricidia trees to rewetting
in our experiment but is comparable to the quick response of cacao to the rain event before roof
opening. Vertical water uptake partitioning might have played a minor role in the Amazon, but
other plant and environmental parameters such as tree size, amount of precipitation and antece-
dent soil water content could also be responsible for differences in sap flux response to rewetting
(Zeppel et al., 2008).
Surprisingly, the shallow rooted cacao is less sensitive to reduced throughfall than the deeper
rooted Gliricidia. But it has to be considered that the throughfall entering gaps in the roof par-
tially rewetted the top soil but did not penetrate into the subsoil where it could have been benefi-
cial for Gliricidia. Furthermore, the rock fragment content of the soil was highest at depths where
also most Gliricidia roots where located which potentially restricted root water uptake further.
Gliricidia is also known to possess a relatively incompetitive root system (Schroth and Lehmann,
1995; Schroth and Zech, 1995). Therefore, not only root distribution but also root functioning
(Ong et al, 1999), and a variety of other factors determine whether trees compete for below-
ground resources or use them complementarily (Schroth, 1999; Jose et al., 2006).
2) Cacao leaves could be somewhat uncoupled from the bulk atmosphere due to shading and
low wind speed inside of the stand while crowns of Gliricidia experience greater exposure. Such
uncoupling could lead to a decrease in leaf boundary layer conductance and thus to a lower
evaporative demand on the leaf level in cacao leading to a higher water stress resilience. Evidence
93

CHAPTER 5 Agricultural and Forest Meteorology (in press)
for uncoupling has been found for coffee under shade trees (van Kanten and Vaast, 2006) and
gap colonizing tree species in tropical forests (Meinzer et al., 1995). Uncoupling can lead to a
limited control of transpiration by stomata. In contrast, effective stomatal control of transpira-
tion by cacao leaves under water deficit was reported for cacao (Joly and Hahn, 1989, Balasimha
et al., 1991), a finding which might be attributed to the atmospheric conditions and shading re-
gimes particular to their experiments.
It can also be assumed that VPD at the height where cacao crowns expand was lower than
VPD measured in the open where most Gliricidia leaves are found. Thus, regression models of
sap flux response to VPD can be similar for both species but might be shifted toward lower val-
ues of VPD for cacao.
3) In contrast to Gliricidia, cacao in this stand became acclimated to drier conditions through
osmotic adjustment of root water potential. For further discussion see Moser et al. (in press).
4) If root water uptake cannot balance transpiration rates (e.g. rapid onset of morning tran-
spiration, high resistance along the soil - leaf pathway), transpiration can be supported by the
short term depletion of stem water storage during the day (Goldstein et al., 1998), which will be
refilled as transpiration rates drop again. The data could therefore also suggest that cacao has
more readily available stem water storage capacity.
Despite the reduction in sap flux densities among trees in the roof plots, none of the species
showed significant reduction of biomass production during our experiment (Schwendenmann et
al., 2010), indicating increased water use efficiency. Cacao yield in roof plots, however, was
found to be 50% lower in the main harvest period following the opening of the roof (April –
June 2008); an indication that reduced soil water availability during pod development (5 – 6
months) had an important effect on generative growth. Nevertheless, cacao bean yield contrib-
uted only about 6% to total biomass production (Schwendenmann et al., 2010). The extent to
which the reproductive state of Gliricidia trees was affected by drought could not be assessed.
Soil water model and stand water budget
RMSE and model efficiencies (E) indicated appropriate model performance with the excep-
tion of very low efficiencies found during the validation phase of the control (Table 3). E is
known to underestimate model performance in time series showing little variation (Krause et al.,
2005). This was the case for the validation phase of the control plots, further reducing the al-
ready low expected efficiency. Nonetheless, RMSE showed that deviations were small. RMSE
were generally highest in upper soil layers where water dynamics were greatest; however, devia-
94
CHAPTER 5 Agricultural and Forest Meteorology (in press)
tions here had little influence on the total water balance as top soil layers were narrow and thus
did not contribute significantly to total soil water storage. Ritter et al. (2003) found that small
deviations in RMSE between measured and modeled water contents had large influences on soil
water drainage when comparing estimated hydraulic parameters from field samples, trial and er-
ror optimization and inverse adjustment. Because inverse methods minimize RMSE, we con-
clude that our approach was appropriate to obtain accurate data on drainage and soil water
movement.
Soil hydraulic parameters differed between roof and control plots (Table 2). This could be at-
tributed to a number of causes, including: some degree of ill posedness (equifinality) of the prob-
lem (Jhorar et al., 2002; Ritter et al., 2003), the small range of water contents measured in control
plots, or the effects of hysteresis in roof plots (see Durner et al., 2002) on a short discussion of
hysteresis and inverse modeling). Evidence of hysteresis can also be found in the larger deviation
of the model’s fit from the measured data at the beginning of the validation phase, an occurrence
which can be attributed to lower measured soil water contents during calibration than during
validation (Figure 4). A calibration using roof data and a validation with control data did also not
lead to model convergence from which we conclude that soil hydraulic parameters are only rep-
resentative for the respective treatment in or from which they were derived.
A certain limitation of the study was that soil water potential could not be monitored along-
side with soil water content at a series of depths. An indication to quantify the water status of the
soil was also seen in the laboratory derived soil water retention functions (van Straaten, unpub-
lished data). According to these functions, the soil water potential in roof plots at 10 and 75 cm
depth was close to the permanent wilting point (-15000 cm) during the dry spell in 2008. How-
ever, the soil water transport model revealed that the laboratory derived retention functions were
not suitable to describe the water movement in the soil. In addition, the minimum root zone wa-
ter potential modeled for roof plots employing soil water retention functions based on theoreti-
cal assumptions about soil texture was higher at that time. Unfortunately measured root water
potentials (minimum of -9700 cm and -5100 cm for cacao and Gliricidia in September 2007;
Moser et al. (in press)) could also not be used to verify the theoretical or the laboratory derived
retention functions, because these potentials where not assessed at predawn. Therefore, no tree
specific root water uptake parameters can be ascertained by this study and the severity of the
drought cannot be finally judged based on the soil water status.
Rainfall interception by the canopy amounted to 25% of Pgross which is 5% higher than for
cacao agroforests under remaining rainforest trees in the study region (Dietz et al., 2006), but
95

CHAPTER 5 Agricultural and Forest Meteorology (in press)
96
considerably lower than the 35% (without ground litter interception) given for cacao under
Erythrina fusca (de Miranda, 1994). Nonetheless, stem flow (5% of Pgross) was higher than the 1%
and 2% of Pgross given by Dietz et al. (2006) and de Miranda (1994) respectively.
Stand transpiration in control plots (1.5 mm day-1) was less than half of that estimated in
both Amazonian rainforest experiments (Belk et al., 2007; Fisher et al., 2007). There is also evi-
dence from energy flux measurements in Central Sulawesi, Indonesia suggesting that rainforest
conversion to cacao agroforests leads to a reduction of (evapo)transpiration (Ibrom et al., 2007).
Low transpiration rates are beneficial during drought because stored water is sufficient over
longer periods of time when depleted at a lower rate. T in roof plots (1.3 mm day-1) was on aver-
age 12% lower than the control with a maximum difference of 35% during the dry spell. Because
cacao trees showed less sap flux reduction than Gliricidia but contributed ~70% to T, the overall
decline in T was moderate. The throughfall reduction experiment in the Eastern Amazonian rain
forest revealed a much larger yearly average (41%) and maximal reduction (80%) of T, although
the percentage of Pnet used for transpiration was only about 10% higher than the percentage used
in our experiment (Fisher et al., 2007). Such strong reactions are caused by a natural dry season
of five months in the Central Amazon, during which sap flux in the control was already 29%
lower than during the wet season. Transpiration was not measured in the East-Central Amazo-
nian experiment (Nepstad et al., 2002), but the results of a soil water modeling study at this site
suggested that there was only a minor reduction in transpiration (5% average and 13% maximum
reduction) during the first two experimental years (Belk et al., 2007). This small reduction of T
can be explained by the removal of the roof during the dry seasons, reducing the impact of the
throughfall reduction. In addition, deep roots played a large role in water uptake in the East-
Central Amazonian experiment, while a stony laterite layer was supposed to prevented root
growth below 3-4 m in the Eastern Amazon (Fisher et al., 2007), and rooting depth was generally
lower in our experiment.
Because Pnet exceeded T while SMS was decreasing, drainage in roof plots was a major driving
force behind changes in soil water content during the 12 months in which the water balance was
established (Table 4). Drainage was high for four consecutive months after roof closure and be-
gan to level off in mid June 2007 (Figure 5), when root water uptake became the governing force
behind soil water movement. This point coincided with a significant reduction of Gliricidia sap
flux densities in roof plots while cacao responded one month later. Both species maintained high
transpiration only where high drainage rates indicated that surplus water was available. Total
drainage after the inflection point amounted to 25% of cumulative transpiration from that time
until roof opening, highlighting again the important impact of drainage on soil moisture storage.

CHAPTER 5 Agricultural and Forest Meteorology (in press)
Because root water uptake decreased with depth and precipitation did not reach lower soil layers,
changes in SMS were governed by drainage in deeper soil layers while precipitation and root wa-
ter uptake were the main influencing factors for the topsoil.
Conclusion
Agroforestry systems have to cope with changing climate and droughts are predicted to be-
come more frequent and more severe. In order to reduce competition for water the removal of
otherwise ecologically beneficial shade trees may therefore be considered. In contrast to this as-
sumption, our study suggests that competition between Gliricidia shade trees and cacao for water
resources during long periods with only little precipitation was low or would favor cacao. Water
uptake partitioning may have allowed cacao to benefit from small amounts of throughfall, while
the species also showed acclimation to water stress by osmotic adjustment in the roots and bene-
fited from shading provided by taller Gliricidia trees. The low stand transpiration rates further
contributed to the relatively high tolerance of this agroforest to reduce throughfall as competi-
tion for available water resources is reduced. However, throughout the throughfall reduction ex-
periment, also drainage was a strong driving force behind declining soil moisture storage which
indicates that Pnet exceeded T during some months of the experiment.
Acknowledgements
This study was conducted in the framework of the joint Indonesian–German research pro-
ject ‘Stability of Tropical Rainforest Margins, Indonesia (STORMA)’ funded by the German Re-
search Foundation (SFB 552, sub-project B4). We would also like to thank Diego Dierick, Hen-
drayanto and Uswah Hasanah for their support, two anonymous reviewers for valuable com-
ments on the manuscript, and Sara Hunt for English syntax and grammar editing.
Acknowledgements
This study was conducted in the framework of the joint Indonesian-German research project
‘Stability of Tropical Rainforest Margins, Indonesia (STORMA)’ funded by the German Re-
search Foundation (SFB 552, sub-project B4). We would also like to thank Diego Dierick and
two anonymous reviewers for valuable comments on the manuscript, and Sara Hunt for English
syntax and grammar editing.
97

CHAPTER 5 Agricultural and Forest Meteorology (in press)
References Balasimha et al., 1991 D. Balasimha, E.V. Daniel and P.G. Bhat, Influence of environmental factors on photosynthesis on cocoa
trees, Agric. Forest Meteorol. 55 (1991), pp. 15–21.
Belk et al., 2007 E.L. Belk, D. Markewitz, T.C. Rasmussen, E.J.M. Carvalho, D.C. Nepstad and E.A. Davidson, Modeling the
effects of throughfall reduction on soil water content in a Brazilian Oxisol under a moist tropical forest, Water Resour. Res. 43
(2007), p. W08432.
Bredemeier et al., 1998 M. Bredemeier, K. Blanck, A. Dohrenbusch, N. Lamersdorf, A.C. Meyer, D. Murach, A. Parth and Y.J.
Xu, The Solling roof project-site characteristics, experiments, and results, Forest Ecol. Manag. 101 (1998), pp. 281–293.
Bruijnzeel, 1996 L.A. Bruijnzeel, Predicting the hydrological impacts of land cover transformation in the humid tropics: the need
for integrated research. In: J.H.C. Gash, C.A. Nobre, J.M. Roberts and R.L. Victoria, Editors, Amazonian Deforestation and
Climate, John Wiley & Sons, New York (1996), pp. 15–55.
De Miranda, 1994 R.A.C. De Miranda, Partitioning of rainfall in a cocoa (Theobroma cacao L.) plantation, Hydrol. Processes 8
(1994), pp. 351–358.
Dierick et al., 2010 D. Dierick, N. Kunert, M. Köhler, L. Schwendenmann and D. Hölscher, Comparison of tree water use char-
acteristics in reforestation and agroforestry stands across the tropics. In: T. Tscharntke, C. Leuschner, E. Veldkamp, H. Faust,
E. Guhardja and A. Bidin, Editors, Tropical Rainforests and Agroforests under Global Change, Springer, Berlin (2010).
Dietz et al., 2006 J. Dietz, D. Hölscher, C. Leuschner and Hendrayanto, Rainfall partitioning in relation to forest structure in
differently managed montane forest stands in Central Sulawesi Indonesia, For. Ecol. Manage. 237 (2006), pp. 170–178.
Durner et al., 1999 W. Durner, B. Schultze and T. Zurmühl, State-of-the-art in inverse modeling of inflow/outflow experiments.
In: M.Th. van Genuchten, F.J. Leij and L. Wu, Editors, Proc. Int. Workshop on Characterization and Measurement of the Hy-
draulic Properties of Unsaturated Porous Media, October 22–24, 1997, University of California, Riverside, CA (1999), pp. 661–
681.
Fay et al., 2000 P.A. Fay, J.D. Carlisle, A.K. Knapp, .J.M. Blair and S.L. Collins, Altering rainfall timing and quantity in a mesic
grassland ecosystem: design and performance of rainfall manipulations shelters, Ecosystems 3 (2000), pp. 308–319.
Fiès et al., 2002 J.C. Fiès, N. De Louvigny and A. Chanzy, The role of stones in soil water retention, Eur. J. Soil Sci. 53 (2002),
pp. 95–104.
Fisher et al., 2007 R.A. Fisher, M. Williams, A.L. da Costa, Y. Malhi, R.F. da Costa, S. Almeida and P. Meir, The response of an
eastern Amazonian rain forest to drought stress: results and modelling analyses from a through-fall exclusion experiment,
Glob. Change Biol. 13 (2007), pp. 2361–2378.
Gebre et al., 1998 G.M. Gebre, T.J. Tschaplinski and T.L. Shirshac, Water relations of several hardwood species in response to
throughfall manipulation in an upland oak forest during a wet year, Tree Physiol. 18 (1998), pp. 299–305.
Goldstein et al., 1998 G. Goldstein, J.L. Andrade, F.C. Meinzer, N.M. Holbrook, J. Cavelier, P. Jackson and A. Celis, Stem water
storage and diurnal patterns of water use in tropical forest canopy trees, Plant Cell Environ. 21 (1998), pp. 397–406.
Granier, 1987 A. Granier, Evaluation of transpiration in a Douglas-fir stand by means of sap flow measurements, Tree Physiol. 3
(1987), pp. 309–320.
Hanson, 2000 P.J. Hanson, Large -scale water manipulations. In: O.E. Sala, R.B. Jackson, H.A. Mooney and R.H. Howarth, Edi-
tors, Methods in Ecosystem Science, Springer, Berlin, Heidelberg, New York (2000), pp. 341–352.
Hanson et al., 1998 Hanson, P.J., Todd, D.E., Huston, M.A., Joslin, J.D., Croker, J.L., Augé, R.M., 1998. Description and field
performance of the Walker branch throughfall displacement experiment: 1993–1996. ORNL/TM-13586, Oak Ridge National
Laboratory, Oak Ridge, TN, 46 p.
Hölscher et al., 2005 D. Hölscher, O. Koch, S. Korn and C. Leuschner, Sap flux of five co-occurring tree species in a temperate
broad-leaved forest during seasonal soil drought, Trees 19 (2005), pp. 628–637.
98

CHAPTER 5 Agricultural and Forest Meteorology (in press)
Ibrom et al., 2007 A. Ibrom, A. Oltchev, T. June, T. Ross, H. Kreilein, U. Falk, J. Merklein, A. Twele, G. Rakkibu, S. Grote, A.
Rauf and G. Gravenhorst, Effects of land-use change on matter and energy exchange between ecosystems in the rain forest
margin and the atmosphere. In: T. Tscharntke, Ch. Leuschner, M. Zeller, E. Guhardja and A. Bidin, Editors, The Stability of
Tropical Rainforest Margins: Linking Ecological, Economic and Social Constraints, Springer, Berlin (2007), pp. 463–492.
ICCO, 2009 ICCO, 2009. Quarterly Bulletin of Cocoa Statistics. Vol. XXXV, No. 2.
Jhorar et al., 2002 R.K. Jhorar, W.G.M. Bastiaanssen, R.A. Feddes and J.C. van Dam, Inversely estimating soil hydraulic functions
using evapotranspiration fluxes, J. Hydrol. 258 (2002), pp. 198–213.
Joly and Hahn, 1989 R.J. Joly and D.T. Hahn, Net CO2 assimilation of cacao seedlings during periods of plant water deficit,
Photosyn. Res. 21 (1989), pp. 151–159.
Jose et al., 2006 S. Jose, R. Williams and D. Zamora, Belowground ecological interactions in mixed species plantations, For. Ecol.
Manag. 233 (2006), pp. 231–239.
Köhler et al., 2009 M. Köhler, D. Dierick, L. Schwendenmann and D. Hölscher, Water use characteristics of cacao and Gliricidia
trees in an agroforest in Central Sulawesi Indonesia, Ecohydrology 2 (2009), pp. 520–529.
Krause et al., 2005 P. Krause, D.P. Boyle and F. Bäse, Comparison of different efficiency criteria for hydrological model assess-
ment, Adv. Geosci. 5 (2005), pp. 89–97. Full Text via CrossRef | View Record in Scopus | Cited By in Scopus (58)
Kume et al., 2007 T. Kume, H. Takizawac, N. Yoshifujib, K. Tanakad, C. Tantasirine, N. Tanakab and M. Suzukib, Impact of soil
drought on sap flow and water status of evergreen trees in a tropical monsoon forest in northern Thailand, For. Ecol. Manag.
238 (2007), pp. 220–230.
Leakey, 1999 R.R.B. Leakey, Agroforestry for biodiversity in farming systems. In: W.W. Collins and C.O. Qualset, Editors, Biodi-
versity in Agroecosystems, CRC Press, Boca Raton, USA (1999), pp. 127–145.
Meinzer, 2003 F.C. Meinzer, Functional convergence in plant responses to the environment, Oecologia 134 (2003), pp. 1–11.
Meinzer et al., 2005 F.C. Meinzer, B.J. Bond, J.M. Warren and D.R. Woodruff, Does water transport scale universally with tree
size?, Funct. Ecol. 19 (2005), pp. 558–565.
Meinzer et al., 1995 F.C. Meinzer, G. Goldstein, P. Jackson, N.M. Holbrook, M.V. Gutierrez and J. Cavelier, Environmental and
physiological regulation of transpiration in tropical forest gap species: the influence of boundary layer and hydraulic properties,
Oecologia 101 (1995), pp. 514–522.
Moser et al., in press Moser, G., Leuschner, C., Hertel. D., Hölscher, D., Köhler, M., Leitner, D., Michalzik, B., Prihastanti, E.,
Tjitrosemito, S., Schwendenmann, L. Response of cocoa trees (Theobroma cacao) to a 13-month desiccation period in Sulawe-
si, Indonesia. Agroforest. Syst., in press.
Mualem, 1976 Y. Mualem, A new model for predicting the hydraulic conductivity of unsaturated porous media, Water Resour.
Res. 12 (1976), pp. 513–522. Full Text via CrossRef | View Record in Scopus | Cited By in Scopus (1310)
Nash and Sutcliffe, 1970 J.E. Nash and J.V. Sutcliffe, River flow forecasting through conceptual models. Part I – A discussion of
principles, J. Hydrol. 10 (1970), pp. 282–290.
Nepstad et al., 2002 D.C. Nepstad, P. Moutinho, M.B. Dias-Filho, E. Davidson, G. Cardinot, D. Markewitz, R. Figueiredo, N.
Vianna, J. Chambers, D. Ray, J.B. Guerreiros, P. Lefebvre, L. Sternberg, M. Moreira, L. Barros, F.Y. Ishida, I. Tohlver, E. Belk,
K. Kalif and K. Schwalbe, The effects of partial throughfall exclusion on canopy processes, aboveground production, and bio-
geochemistry of an Amazon forest, J. Geophys. Res. 107 (2002), pp. 1–18.
O’Grady et al., 1999 A.P. O’Grady, D. Eamus and L.B. Hutley, Transpiration increases during the dry season: patterns of tree
water use in eucalypt open-forests of Northern Australia, Tree Physiol. 19 (1999), pp. 591–597.
Ong et al., 1999 C.K. Ong, J.D. Deans, J. Wilson, J. Mutua, A.A.H. Khan and E.M. Lawson, Exploring belowground comple-
mentarity in agroforestry using sap flow and root fractal techniques, Agroforest. Syst. 44 (1999), pp. 87–103.
99
CHAPTER 5 Agricultural and Forest Meteorology (in press)
Pataki et al., 2000 D.E. Pataki, R. Oren and W.K. Smith, Sap flux of co-occurring species in a western subalpine forest during
seasonal soil drought, Ecology 81 (2000), pp. 2557–2566.
Quinn et al., 1978 W.H. Quinn, D.O. Zopf, K.S. Short and R.T.W. Kuo Yang, Historical trends and statistics of the southern
oscillation. El Niño and Indonesian droughts, Fish Bull. 76 (1978), pp. 663–678.
Radersma and De Ridder, 1996 S. Radersma and N. De Ridder, Computed evapotranspiration of annual and perennial crops at
different temporal and spatial scales using published parameter values, Agric. Water Manag. 31 (1996), pp. 17–34.
RDCT, 2008 R Development Core Team, 2008. R: A language and environment for statistical computing. R Foundation for
Statistical Computing, Vienna, Austria. ISBN 3-900051-07-0, http://www.R-project.org.
Ritter et al., 2003 A. Ritter, F. Hupet, R. Munoz-Carpena, S. Lambot and M. Vanclooster, Using inverse methods for estimating
soil hydraulic properties from field data as an alternative to direct methods, Agric. Water Manag. 59 (2003), pp. 77–96.
Schaap and Leij, 2000 M.G. Schaap and F.J. Leij, Improved prediction of unsaturated hydraulic conductivity with the Mualem–
van Genuchten model, Soil Sci. Soc. Am. J. 64 (2000), pp. 843–851.
Schaap et al., 2001 M.G. Schaap, F.J. Leij and M.T. van Genuchten, ROSETTA: a computer program for estimating soil hydrau-
lic parameters with hierarchical pedotransfer functions, J. Hydrol. 251 (2001), pp. 163–176.
Schlegel et al., 2004 P. Schlegel, B. Huwe and W.G. Teixeira, Modelling species and spacing effects on root zone water dynamics
using Hydrus-2D in an Amazonian agroforestry system, Agroforest. Syst. 60 (2004), pp. 277–289.
Schroth, 1999 G. Schroth, A review of belowground interactions in agroforestry, focussing on mechanisms and management
options, Agroforest Syst. 43 (1999), pp. 5–34.
Schroth and Lehmann, 1995 G. Schroth and J. Lehmann, Contrasting effects of roots and mulch from three agroforestry tree
species on yields of alley cropped maize, Agric. Ecosys. Environ. 54 (1995), pp. 89–101.
Schroth and Zech, 1995 G. Schroth and W. Zech, Root length dynamics in agroforestry with Gliricidia sepium as compared to
sole cropping in the semi-deciduous rainforest zone of West Africa, Plant Soil 170 (1995), pp. 297–306.
Schwendenmann et al., 2010 L. Schwendenmann, E. Veldkamp, G. Moser, D. Hölscher, M. Köhler, Y. Clough, I. Anas, G. Dja-
jakirana, S. Erasmi, D. Hertel, D. Leitner, C. Leuschner, B. Michalzik, P. Propastin, A. Tjoa, T. Tscharntke and O. van
Straaten, Effects of an experimental drought on the functioning of a cacao agroforestry system, Sulawesi, Indonesia, Glob.
Chang Biol. 16 (2010), pp. 1515–1530
Sheffield and Wood, 2008 J. Sheffield and E.F. Wood, Projected changes in drought occurrence under future global warming
from multi-model, multi-scenario, IPCC AR4 simulations, Clim. Dyn. 31 (2008), pp. 79–105.
Šimůnek et al., 2008 J. Šimůnek, M. Šejna, H. Saito, M. Sakai and M.T. van Genuchten, The HYDRUS-1D Software Package for
Simulating the One-dimensional Movement of Water, Heat, and Multiple Solutes in Variably Saturated Media, Department of
Environmental Sciences, University of California Riverside, Riverside, California, USA (2008) Version 4.0.
Sommer et al., 2003 R. Sommer, H. Fölster, K. Vielhauer, E.J. Maklouf Carfvalho and P.L.G. Vlek, Deep soil water dynamics and
depletion by secondary vegetation in the eastern Amazon, Soil Sci. Soc. Am. J. 67 (2003), pp. 1672–1686.
van Genuchten, 1980 M.T. van Genuchten, A closed-form equation for predicting the hydraulic conductivity of unsaturated soils,
Soil Sci. Soc. Am. J. 44 (1980), pp. 892–898.
van Genuchten, 1987 van Genuchten, M.T., 1987. A numerical model for water and solute movement in and below the root
zone. Res. Rep. 121, U.S. Salinity Lab., Agric. Res. Serv., U.S. Dep. of Agric., Riverside, California.
van Genuchten and Gupta, 1993 M.T. van Genuchten and S.K. Gupta, A reassessment of the crop tolerance response function,
Bull. Indian Soc. Soil Sci. 4 (1993), pp. 730–737.
van Kanten and Vaast, 2006 R. van Kanten and P. Vaast, Transpiration of arabica coffee and associated shade tree species in sub-
optimal, low-altitude conditions of Costa Rica, Agroforest. Syst. 67 (2006), pp. 187–202.
100

CHAPTER 5 Agricultural and Forest Meteorology (in press)
101
Veldkamp and O’Brien, 2000 E. Veldkamp and J.J. O’Brien, Calibration of a frequency domain reflectrometry sensor for humid
tropical soils of volcanic origin, Soil Sci. Soc. Am. J. 64 (2000), pp. 1549–1553.
Verchot et al., 2007 L.V. Verchot, M. van Noordwijk, S. Kandji, T.P. Tomich, C.K. Ong, A. Albrecht, J. Mackensen, C. Bantilan,
K.V. Anupama and C. Palm, Climate change: linking adaptation and mitigation through agroforestry, Mitig. Adapt. Strat. Glob.
Change 12 (2007), pp. 901–918.
Vrugt et al., 2001 J.A. Vrugt, M.T. van Wijk, J.W. Hopmans and J. Šimůnek, One, two, and three-dimensional root water uptake
functions for transient modelling, Water Resour. Res. 37 (2001), pp. 2457–2470.
Zeppel et al., 2008 M.J.B. Zeppel, C.M.O. Macinnis-Ng, C.R. Ford and D. Eamus, The response of sap flow to pulses of rain in a
temperate Australian woodland, Plant Soil 305 (2008), pp. 121–130.
Zhang et al., 1999 L. Zhang, W.R. Dawes and G.R. Walker, Predicting the Effect of Vegetation Changes on Catchment Average
Water Balance, Cooperative Research Centre for Catchment Hydrology, CSIRO Land and Water, Canberra, ACT, Australia
(1999).
Zuidema et al., 2005 P.A. Zuidema, P.A. Leffelaar, W. Gerritsma, L. Mommer and N.P.R. Anten, A physiological production
model for cocoa (Theobroma cacao): model presentation, validation and application, Agric. Syst. 84 (2005), pp. 195–225.

102

CHAPTER 6 Conclusions
CHAPTER 6 CONCLUSIONS
103

104

CHAPTER 6 Conclusions
This dissertation brings together three studies which focus on the water use characteristics of
tree based land use systems, and on how tree structure, environmental variables, and varying soil
water content affect water use characteristics. The aim was threefold: 1) to give information on
the water use characteristics of trees commonly used for reforestation and agroforestry purposes,
2) to test whether species selection might be an appropriate tool to manage water use, and 3) to
examine how a specific agroforestry system responded to an artificial drought.
In the Indonesian agroforest significant differences were observed between species in both
maximum sap flux density and sap flux response to environmental variables. Despite similar sap
flux densities in the outer xylem, the water use rates of Gliricidia trees at a given diameter were
much lower than cacao, a consequence of the shallower sap wood depth of large Gliricidia trees
attributed to heartwood formation. Gliricidia shade trees were found to enhance stand water use
not only due to their own water use, but also by increasing water use rates of associated cacao.
Because cacao tree diameter and leaf area increased with decreasing canopy gap fraction (low gap
fraction is indicative of pronounced shading), it was concluded that proximity to shade trees
would enhance vegetative growth thereby enhancing water use.
From this first study it can be concluded that not only species identity, but also stand struc-
ture, shading regime, and tree exposure all have considerable effects on stand water use rates. If
stand water use would be the quantity to influence by shade management, a few large Gliricidia
shade trees should be desired over many smaller ones, because the number of cacao trees in di-
rect proximity to shade trees will be reduced. A few large Gliricidia trees might also use less water
than many smaller ones because the increase in water use rates with increasing tree diameter is
moderate due to the shallow sap wood depth of Gliricidia. Another valuable strategy for reducing
stand water use rates is the reduction of cacao leaf area by pruning because water use was found
to be positively related to leaf area. More research should focus on the comparison of water use
rates of cacao agroforestry systems with different shade tree densities to validate these findings
and suggestions. It is also important to note that strategies aimed at reducing stand water use
rates may interfere with production goals aimed at maximizing cacao yield.
A comparison of the water use characteristics of the cacao/Gliricidia agroforest with data
from other tropical reforestations of similar age revealed that species choice may also exert a
strong effect on stand water use. Significant differences were found in maximum sap flux density
and response to environmental parameters between 17 studied species. Only a very weak rela-
tionship between maximum sap flux density and tree diameter was detected. However, in Indo-
nesia this was mainly attributed to the different diameter range sampled for cacao and Gliricidia
trees. Species water use rates differed up to twofold for a given tree diameter and no species in-
105

CHAPTER 6 Conclusions
dependent relationships between sap wood depth and tree diameter were detected in our analysis
of data gathered in Indonesia, Panama, and the Philippines. This appears to contradict the hy-
pothesis of functional convergence. However, a relatively strong dependency of tree water use
on tree diameter was still found. But since tree diameter is used to calculate tree water use, there
is a strong auto correlation determining the relationship. This leads to the conclusion that in
young and homogeneous reforestation or agroforestry stands which have a limited diameter
range, functional convergence might be less pronounced. If this is indeed the case, then species
selection could be a valuable tool for balancing production goals with water use rates. Combining
trees with low cumulative daily sap flux density, shallow sap wood, and a sharp decline in sap
flux density with increasing sapwood depth, would therefore minimize stand water use. In this
context it is pertinent to mention that certain species in Panama and the Philippines shed their
leaves during the dry season, leading to a further reduction in water use on an annual scale.
But species with relatively low daily water use rates, may also exhibit certain leaf or branch
characteristics that cause very high rainfall interception rates. In this case, the benefits of low
transpirational water use overlap with increased evaporation of water from the canopy, which
leaves less water available for root water uptake. In addition to research on species-specific water
use rates under varying environmental conditions and stand structures, further throughfall meas-
urement studies are needed (where stand structure will allow) to assess the interception charac-
teristics of particular species. Other strategies could also be used to separate and assess the rela-
tive contribution of a species’ transpiration and its impact on rainfall interception (evaporation).
For example, a combination of sap flux measurements could be taken from individual trees and
analyzed alongside estimates of overall stand evapotranspiration estimates which could be made
using a method such as eddy covariance measurements.
The third part of this dissertation deals with the response of two tree species within a given
agroforestry system to reduced throughfall, and the effects of drought on the soil water budget.
The overarching conclusion drawn from this study was that reduced soil water content had little
effect on tree transpiration, and that among other factors (e.g. low stand transpiration) soil water
partitioning might have been a main reason for the drought resiliency exhibited. Especially re-
markable was the finding that, during long periods with limited precipitation, competition be-
tween the two species for water resources was either minimal or in favor of cacao. It may seem
surprising that a shallow rooted tree like cacao would cope better with reduced soil water avail-
ability than the deeper rooted Gliricidia, however, cacao could benefit from the limited amount of
water entering the roof and partially rewetting the topsoil; whereas this water source was hardly
available to the deeper roots of the Gliricidia. In addition, maximum rock fragment content was
106

CHAPTER 6 Conclusions
found in soil layers where maximum Gliricidia rooting density was found, further decreasing the
water availability for this species. Stable isotope data collected during the time of roof closure are
now being processed (L. Schwendenmann) and might also help to clarify which role soil water
partitioning played in the stand. Furthermore, Gliricidia seemed to lack the active osmotic ad-
justment of the roots that was seen in cacao.
The soil water budget indicated that throughfall exceeded evapotranspiration during most
months of the experiment. Nonetheless, significant declines in soil moisture storage were de-
tected, indicating that drainage was one of the largest drivers of the decline in soil water content.
The sap flux for both tree species in the roof plots only exhibited levels comparable to the con-
trol when drainage rates were high in the roof plots (beginning of the experiment) or when soil
moisture storage recovered at the end of the experiment. This indicates that high tree transpira-
tion was dependent on a certain quantity of available “surplus water” which might be indicative
of very high soil water potentials.
One limitation of this study however was that soil water potential could not be monitored
alongside soil water content at a series of depths. Therefore, no tree specific root water uptake
parameters can be ascertained from this study so far, and the severity of the drought cannot be
ultimately judged on the basis of soil water status. But a further step towards the quantification
of root water uptake parameters could be to try to combine the measured stand transpiration of
control plots (as input potential transpiration) with data of throughfall and soil water content
from roof plots and inversely adjust the plant water uptake stress response function such that the
derived actual transpiration and the measured transpiration in roof plots match. Still, modeled
soil water potentials need to be verified in the field to complete this task and a breakdown to the
species level is only possible by reprogramming the model to allow for two root systems. Also
certainly more research on the response of cacao agroforests with different shade tree densities
to throughfall reduction is needed to precisely quantify the role of shade trees on stand transpira-
tion and stand drought response. It would be especially useful to conduct a similar experiment
on the same site after the complete removal of shade trees.
In summary it can be concluded from the throughfall reduction experiment, that the combi-
nation of cacao and Gliricidia under the given soil and environmental conditions was appropriate
to withstand long lasting droughts similar to those which might occur in the area during strong
El Niño events. Nevertheless, the yield declines observed following the throughfall reduction
experiment suggest that the income of Indonesian farmers in cacao agroforestry would still be
heavily affected by droughts.
107

CHAPTER 6 Conclusions
108
ACKNOWLEDGMENTS
ACKNOWLEDGMENTS
It would not have been possible to complete this dissertation without the support of all the great
people around me:
I am very thankful to Prof. Dr. Dirk Hölscher for his guidance, advice, and patience. Only with
Dirk’s support in all fields was I able to both take care of my family and finish my PHD thesis in
time.
I would also like to thank Luitgard Schwendenmann for her valuable ideas, the good discus-
sions, the quick reading of my thesis and most importantly for all the great motivation boosts. I
hope you’ll do well in New Zealand.
Thanks also to Eva Siegelkow for organizing all the administrative stuff and reminding every-
body of everybody’s birthdays – I’ll buy flowers next time, I promise!
My special acknowledgement goes to the friendly and competent support of all colleges at the
Institute, in particular Diego Dierick, who supported me during my parental leave. Thanks also
for sharing laughter, frustration, food and cigarettes with me.
Terima kasih banyak juga untuk orang2 yang bekerja di plot2 di Marena dan Pono, sopir2, rekan2
dan teman2 yang lain. Cuma anda sekalian bikin Indonesia tempat yang baik untuk saya! Saya
mau berterima kasih untuk menjelaskan dan memperkenalkan budaya Indonesia dan untuk
kesabaran dengan ini “Peneliti gila”. Saya pasti akan rindu sama kalian. Terima kasih terlebih-lebih
sama Bapak Masrillihardi Potabuga dan Bapak Andi Sofyan yang membantu dan menunjang saya
“supaia penelitian mau jadi suksess”. Semoga sehat selalu!
Thanks also to all my “orang barat” colleagues working in the STORMA project, especially
Oliver, Bernhard, Carsten and Norbert who made my days at times. The time in Indonesia
would not have been that great if you hadn’t been there!
I am also very thankful to Sara who did a wonderful job correcting my “genglish” at times and
Heidi for upgrading the punctuation in the German Introduction and supporting my well-being
in Göttingen with the wonderful “Ostpaket”.
My particular gratitude goes also to the grandmothers and grandfathers, aunts and uncles for all
their support during the last 3 years. Lenka must have been a much unexpected surprise for all of
you but nevertheless you provided a very warm welcome for each of us.
Last but not least I want to thank you, my two girls Lenka and Xenia for all the love, care and
patience. The two of you managed to direct my life onto the right track.
109

110

SUPPORTING DOCUMENTS
DECLARATION OF HONOR
I hereby declare that I am the sole author of this dissertation entitled “CACAO AGROFOR-
ESTRY UNDER AMBIENT AND REDUCED THROUGHFALL: TREE WATER USE
CHARACTERISTICS AND STAND WATER BUDGETING” and that all references and data
sources used have been acknowledged as such. I further declare that this work has never been
submitted in any form as part of other dissertation procedures.
Göttingen, February 2010 __________ (Michael Köhler)
111

112

SUPPORTING DOCUMENTS
113
CURRICULUM VITAE
Name: Michael Köhler
Date of birth: 16.11.1980
Place of birth: Schmölln, Germany
Positions
08. 2006 - 02.2010 Research associate at Georg-August-Universität, Göttingen, Department of Tropical Silviculture and Forest Ecology
08. 2008 - 03. 2009 Parental leave
01. 2006 - 06. 2006 Research associate at Utah-State-University, Logan, Utah, Department of Bio-logical and Irrigation Engineering
Education
08. 2006 - 05. 2010 PhD programme Forest Sciences and Wood Ecology, Georg-August-Universität, Göttingen, Department of Tropical Silviculture and Forest Ecology
08. 2005 - 06. 2006 Graduate Student (DAAD Scholarship), Utah-State-University, Logan, Utah, Department of Biological and Irrigation Engineering
10. 2000 - 04. 2005 Diploma (MSc) in Agronomy, Martin-Luther-Universität Halle-Wittenberg, Landwirtschaftliche Fakultät
09. 1991 - 06. 1999 Secondary school, Schmölln
List of Publications
Hölscher, D., Faust, H., Juhrbandt, J., Moser, G., Binternagel, N., Köhler, M., van Edig, X., Schwarze, S., Schwendenmann, L., Barkmann, J., Veldkamp, E., Cacao agroforestry under drought risk - an ecological and socio-economic analysis. Forests, Trees and Livelihoods (in review).
Schwendenmann, L., Dierick, D., Köhler, M., Hölscher, D., Can deuterium tracing be used for reliably estimating water use of tropical trees and bamboo? Tree Physiology (in press).
Köhler, M., Schwendenmann, L., Hölscher, D., Throughfall reduction in a cacao agroforest: tree water use and soil water budgeting. Agricultural and Forest Meteorology (in press).
van Straaten, O., Veldkamp, E., Köhler, M., Anas, I., 2010. Spatial and temporal effects of drought on soil CO2 efflux in a cacao agroforestry system in Sulawesi, Indonesia. Biogeosciences 7, 1223–1235.
Moser, G., Leuschner, C., Hertel, D., Hölscher, D., Köhler, M., Leitner, D., Michalzik, B., Prihastanti, E., Tjitrose-mito, S., Schwendenmann, L., 2010. Response of cocoa trees (Theobroma cacao) to a 13-month desiccation period in Sulawesi, Indonesia. Agroforestry Systems 79, 171–187.
Schwendenmann, L., Veldkamp, E., Moser, G., Hölscher, D., Köhler, M., Clough,Y., Anas, I., Djajakirana, G., Erasmi, S., Hertel, D., Leitner, D., Leuschner, C., Michalzik, B., Propastin, P., Tjoa, A., Tscharntke, T., van Straaten, O., 2010. Effects of an experimental drought on the functioning of a cacao agroforestry system, Su-lawesi, Indonesia. Global Change Biology 16, 1515-1530.
Dierick, D., Kunert, N., Köhler, M., Schwendenmann, L., Hölscher, D., 2010. Comparison of tree water use charac-teristics in reforestation and agroforestry stands across the tropics. In: T. Tscharntke, C. Leuschner, E. Veldkamp, H. Faust, E. Guhardja, A. Bidin (Eds.), Tropical Rainforests and Agroforests under Global Change, Springer, Ber-lin, pp 293-308.
Köhler, M., Dierick, D., Schwendenmann, L., Hölscher, D., 2009. Water use characteristics of cacao and Gliricidia trees in an agroforest in Central Sulawesi, Indonesia. Ecohydrology 2, 520-529.
