cable channel test report by xfbn -...
TRANSCRIPT

Cable channel test report by
XFBN • EPOC project team, cable working committee of CRTA
• Xiaoping Hu, Kai Zheng, Wei Chen - XFBN
• Guangsheng Wu, Yanbin Sun –Huawei
• Xiwen Deng, Zidou Liu - Fiberhome
• Linzhi Wang - Broadcom
• Yong Yao - CRTA
1 IEEE P802.3bn> EPoC – October
2012 Additional Interim Meeting

Network Overview
2 IEEE P802.3bn> EPoC – October
2012 Additional Interim Meeting

Xiangyang Cable Network Overviews
• Xiangyang CATV network began construction in November
1992, and officially put into operation in 1993.
• By 2003, Xiangyang network had developed into a
comprehensive information network that included HFC
network, SDH transmission networkm and IP-MAN, and built
the city's first e-government network transmission platform.
• Currently, 5 platforms have been operationg on Xiangyang
network which are HFC network, PTN (SDH) network, Gigabit
MAN, e-government, safe city monitoring network platform.
3 IEEE P802.3bn> EPoC – October
2012 Additional Interim Meeting

• Xiangyang network has covered the whole urban areas and belonging townships, with 300,000 CATV subscribers and 15,000 residential internet users.
• The FTTB ratio in urban has has reached more than 90%. The common FTTB network topologies are 50~200 households per fiber node, and mainly with centralized coaxial distribution network. The maximum distance of coaxial cable is less than 200 meters.
• Currently, the bi-directional covered subscribers in Xiangyang network are 80,000households and the penetrated subscribers are 30,000households. There are mainly two type of two-way network transformation technologies:
– Urban areas are mainly with EPON + baseband EOC, and also parts of users are with CAT-5 to the home.
– Suburb and township mainly plans to deploy EPON + C-HomePlug AV.
4 IEEE P802.3bn> EPoC – October
2012 Additional Interim Meeting

Spectrum planning
• The occupied spectrums in cable network are below:
– 6 analog TV channels: Z1-Z6
– 50 channels for DVB-C and VOD broadcast: 319M-463MHz, 470M-502MHz, 510M-526MHz, 534M-542MHz, 558M-622MHz, 742M-862MHz
• 6 Terrestrial TV channels are not used in cable network:
– DS7/DS8/DS17/DS21/DS23/DS29 are Terrestrial TV channels, the spectrum are not used in cable network.
• 622M-742MHz (exclusive of DS29 638MHz-646MHz) are reserved for digital channels.
5 IEEE P802.3bn> EPoC – October
2012 Additional Interim Meeting

EPoC spectrum planning
• Near-term planning
– 862-960MHz is for isolation zone inclusive of wireless spectrum
– 960M-1200MHz is for TDD mode EPoC spectrum. TDD UP/DN
bandwidth can be flexible adjusted according to services.
• Medium-term planning
– EPoC spectrum can be extension to below 960MHz.
• Long-term planning
– Change TAP/splitters and expand EPOC spectrum above
1.2GHz
– Part of fiber nodes still go closer to users.
6 IEEE P802.3bn> EPoC – October
2012 Additional Interim Meeting

Channel test and analysis
--Part1 noise and interference test
--Part2 network test and micro-
reflection analysis
7 IEEE P802.3bn> EPoC – October
2012 Additional Interim Meeting

Xiangyang Channel test
• Equipments used for test – Spectrum analyzer: Agilent N9030A, N9320B
– CATV analyzer: R&S ETL, signal level meter
– Network analyzer: Agilent E5061B, E5071C
– Other equipments: Tek TDR
• Tested 6 sites at 3 times during about 2 months.
• To meet the demand for short-term and medium-term spectrum planning and without change of existing network, we tested two-way 5-1300MHz spectrum. The main test items are below: – Tested with network analyzer: Amplitude/phase/group delay Vs
frequency
– Noise and interference
– transmission loss/group delay parameters converts to micro-reflection
• We’ll focus on one test site with some problems (mainly with poor connections)
8 IEEE P802.3bn> EPoC – October
2012 Additional Interim Meeting

Test site 1 topologies
Optical
receiver
SP14 with
baseband EOC
and diplexer
SP16 with
baseband EOC
and diplexer
Test point test point
-10
10m-9 25m-9
47meters
75-5 cable
10m-5
9 IEEE P802.3bn> EPoC – October
2012 Additional Interim Meeting
Test site 1

Test site 1- downstream signals / noise /
Interference test Interf sources Freq(MHz)
Power(dBm 1M RBW)
Wireless 13.62 -113.689
Wideband 15.22 -118.512
DS4 77.25 -101.404
FM 88.99 -82.887
FM 90.9 -88.856
FM 93 -94.058
FM 104.0125 -89.252
FM 106.6075 -116.155
Z6 152.25 -81.568
DS7 176.25 -92.849
DS8 184.25 -81.924
DS17 503.25 -87.478
DS29 639.25 -85.413
GSM 810.4175 -95.141
GSM 839.655 -92.742
GSM 951.5975 -96.007
GSM 957.39 -97.996
5M-1.3GHz downstream image
•Main interference resources and interference levels are
recorded as the right table.
The main interference resources are from: FM, Terrestrial
TV, GSM signals etc.
There are some non-linear products shows in above
picture. (e.g. spurious and emissions.)
10 IEEE P802.3bn> EPoC – October
2012 Additional Interim Meeting
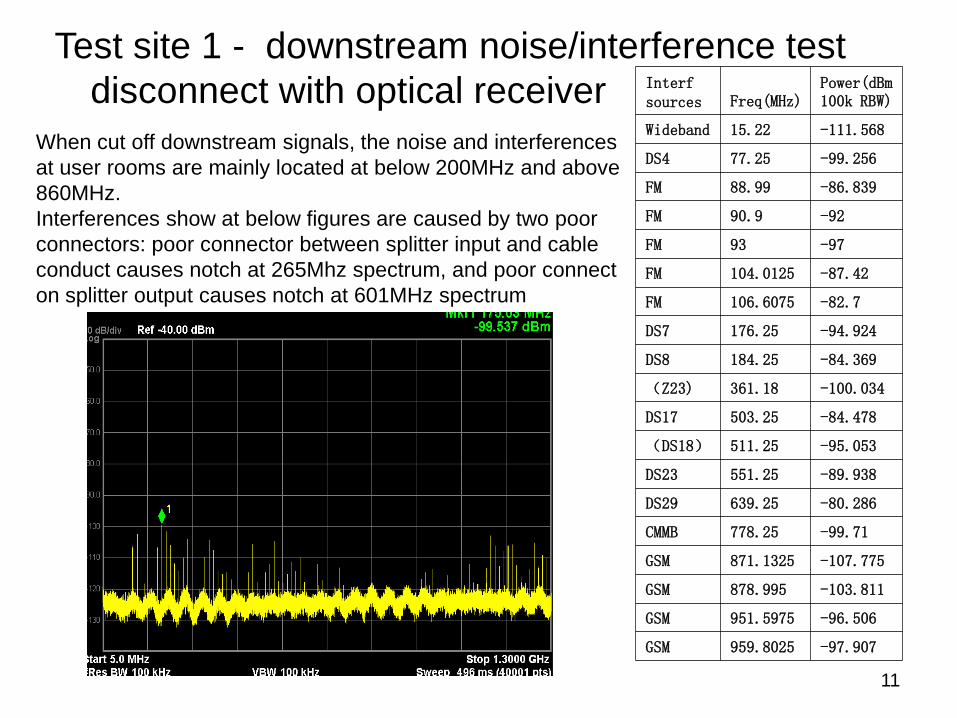
Interf sources Freq(MHz)
Power(dBm 100k RBW)
Wideband 15.22 -111.568
DS4 77.25 -99.256
FM 88.99 -86.839
FM 90.9 -92
FM 93 -97
FM 104.0125 -87.42
FM 106.6075 -82.7
DS7 176.25 -94.924
DS8 184.25 -84.369
(Z23) 361.18 -100.034
DS17 503.25 -84.478
(DS18) 511.25 -95.053
DS23 551.25 -89.938
DS29 639.25 -80.286
CMMB 778.25 -99.71
GSM 871.1325 -107.775
GSM 878.995 -103.811
GSM 951.5975 -96.506
GSM 959.8025 -97.907
Test site 1 - downstream noise/interference test
disconnect with optical receiver
When cut off downstream signals, the noise and interferences
at user rooms are mainly located at below 200MHz and above
860MHz.
Interferences show at below figures are caused by two poor
connectors: poor connector between splitter input and cable
conduct causes notch at 265Mhz spectrum, and poor connect
on splitter output causes notch at 601MHz spectrum
5-1300Mhz downstream
11

Test site 1- one connector caused fault
Fault status shows on frequency
response After the connector problem
corrected, the figures shows below

Test site 1 – upstream ingress noise
(without signals) Test point located behind the optical receiver, disconnect with the the optical
receiver and without user signals.
The main interference sources are from FM. Terrestrial TV, and wireless.
13 IEEE P802.3bn> EPoC – October
2012 Additional Interim Meeting

Test site 2 topologies
14 IEEE P802.3bn> EPoC – October
2012 Additional Interim Meeting
K772
CY-12×2
80m-9
Te
st
po
int
30m-5
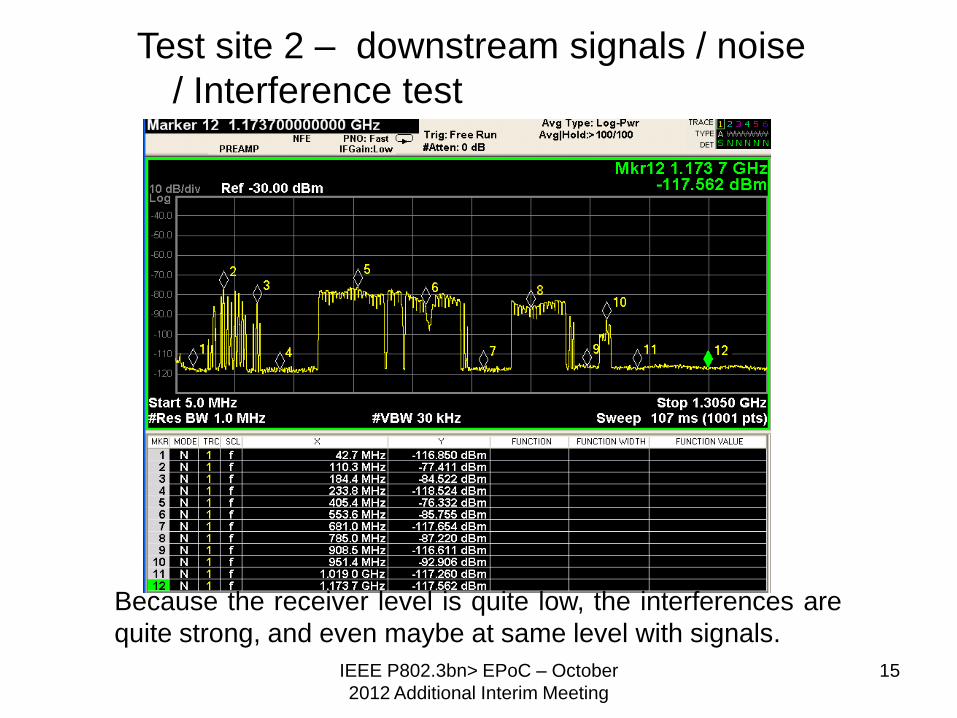
Because the receiver level is quite low, the interferences are
quite strong, and even maybe at same level with signals.
Test site 2 – downstream signals / noise
/ Interference test
15 IEEE P802.3bn> EPoC – October
2012 Additional Interim Meeting

Channel test and analysis
--Part1 noise and interference test
--Part2 network test and micro-
reflection analysis
16 IEEE P802.3bn> EPoC – October
2012 Additional Interim Meeting

Test site 1 - topology
17 IEEE P802.3bn> EPoC – October
2012 Additional Interim Meeting

Tested with network analyzer
S11/S21/S12/S22 parameters Group delay Vs frequency
18 IEEE P802.3bn> EPoC – October
2012 Additional Interim Meeting
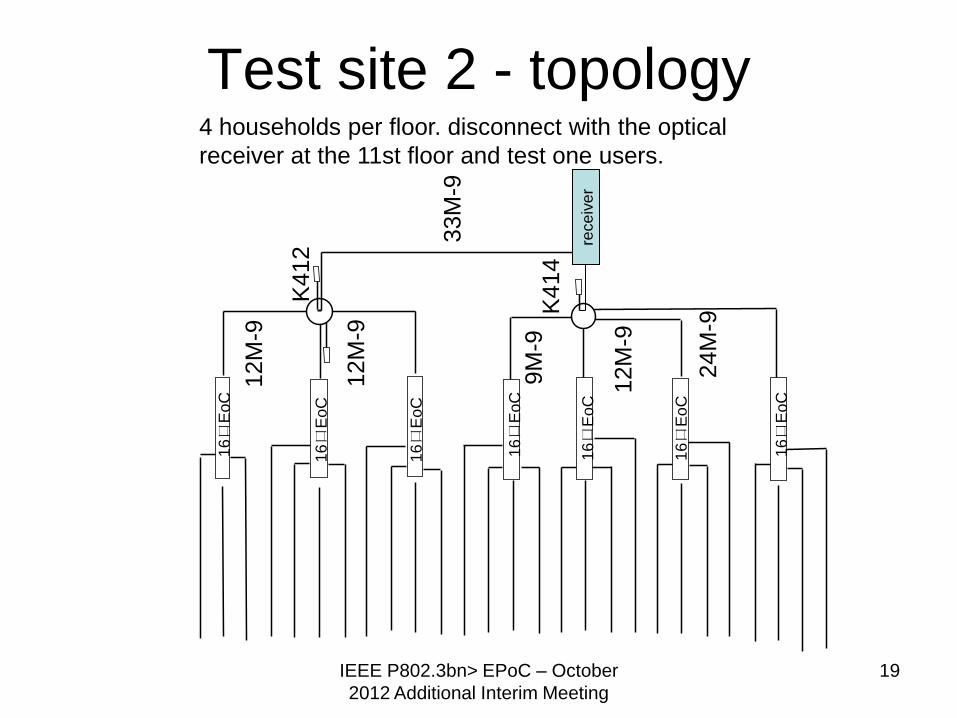
Test site 2 - topology
19 IEEE P802.3bn> EPoC – October
2012 Additional Interim Meeting
K414
12M
-9
12M
-9
33M
-9
9M
-9
12M
-9
16口
Eo
C
16口
Eo
C
16口
Eo
C
16口
Eo
C
16口
Eo
C
16口
Eo
C
16口
Eo
C
rece
ive
r
24M
-9
K412
4 households per floor. disconnect with the optical
receiver at the 11st floor and test one users.

Tested with network analyzer
S11/S21/S12/S22 parameters Group delay Vs frequency
20 IEEE P802.3bn> EPoC – October
2012 Additional Interim Meeting

Micro-reflection analysis
Test site1 1.0-1.2GHz micro-reflection simulation
Refer to the method described at “Digital transmission characterization of cable television systems by
CableLabs” - 3.3.1 impulse response.
Test site1 1.2-1.3GHz micro-reflection simulation
Test site2 1.0-1.2GHz micro-reflection simulation Test site2 1.2-1.3GHz micro-reflection simulation
21 IEEE P802.3bn> EPoC – October
2012 Additional Interim Meeting

Micro-reflection summary
22 IEEE P802.3bn> EPoC – October
2012 Additional Interim Meeting
Test site 1 Test site 2
frequency(MHz) delay(ns) Echo power(dBc) Echo power(dBc)
5-65
0 to 200 -34
EoC signals 200 - 400 -42
400 - 800 -39
800 - 1200 -48
110-750
0 to 200 -30 -46
200 - 400 -46 -49
400 - 800 -50 -50
800 - 1200 -58 -51
> 1200 no data no data
750-1000
0 to 200 -25 -31
200 - 400 -38 -33
400 - 800 -45 -44
800 - 1200 -50 -48
1000-1200
0 to 200 -15 -21
200 - 400 -28 -30
400 - 800 -35 -32
800 - 1200 -42 -33
1200-1300
0 to 200 -15 -16
200 - 400 -29 -20
400 - 800 -30 -18
800 - 1200 -36 -17
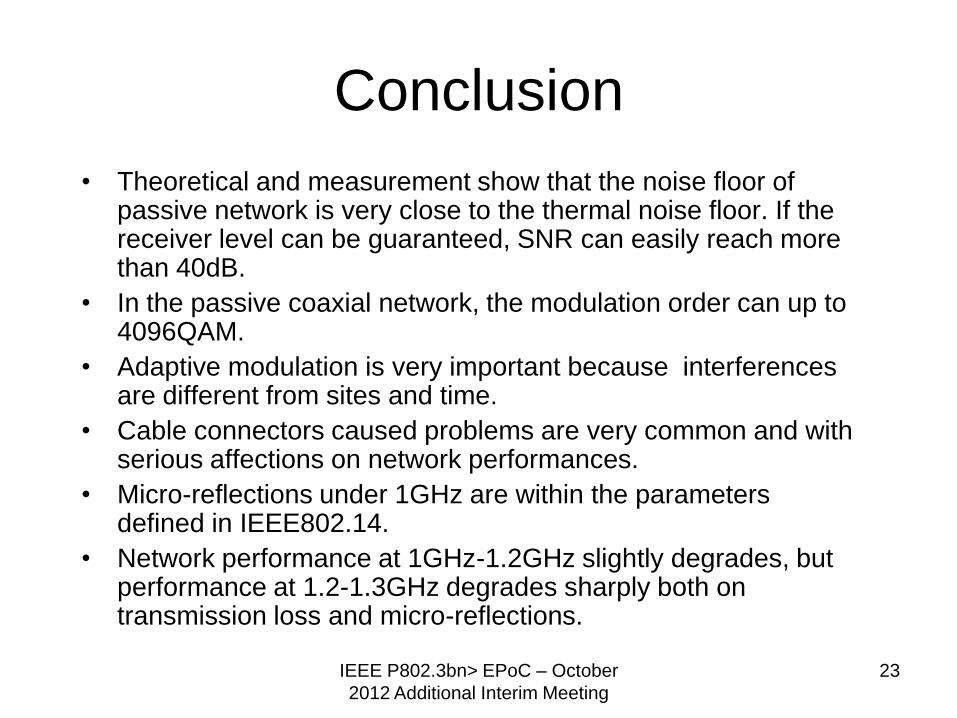
Conclusion
• Theoretical and measurement show that the noise floor of passive network is very close to the thermal noise floor. If the receiver level can be guaranteed, SNR can easily reach more than 40dB.
• In the passive coaxial network, the modulation order can up to 4096QAM.
• Adaptive modulation is very important because interferences are different from sites and time.
• Cable connectors caused problems are very common and with serious affections on network performances.
• Micro-reflections under 1GHz are within the parameters defined in IEEE802.14.
• Network performance at 1GHz-1.2GHz slightly degrades, but performance at 1.2-1.3GHz degrades sharply both on transmission loss and micro-reflections.
23 IEEE P802.3bn> EPoC – October
2012 Additional Interim Meeting

Thanks!
24 IEEE P802.3bn> EPoC – October
2012 Additional Interim Meeting