c2: what is your climate...
TRANSCRIPT
GLOBE® 2011 C2: What Is Your Climate Classification? Earth System Science
Learning Activity
Protocols A
ppendix Introduction
Welcom
e
Page 1
!?
PurposeTo help students become familiar with the Köppen-Geiger Climate Classification system. Students will also understand that climates can be broadly classified using a system that is based upon specific variables: air temperature and precipitation.
OverviewStudents will calculate simple statistics and analyze a long-term (30 year) temperature and precipitation dataset. They will explore the relationship between temperature and precipitation to determine the climate classification for their location.
Student OutcomesStudents will be able to:
• Explain the importance of consistent and accurate data collection
• Synthesize and analyze long-term (30 year) data to determine the climate classification of a location
• Use a classification key
• Recognize that air temperature and precipitation data can be used to describe and classify climate.
Science ConceptsUnifying concepts and processes: Systems, order, and organization
• Systems are organized groups of related objects or components.
• Types and levels of organization provide useful ways of thinking about the world.
Scientific Inquiry Abilities• Use appropriate tools and
techniques to gather, analyze and interpret data including
mathematics. • Develop descriptions, explanations,
and predictions using evidence• Communicate scientific procedures
and explanations, following instructions and describing observations.
Earth and Space Science• Global climate is determined by
energy transfer from the Sun at and near the Earth’s surface and is influenced by dynamic processes such as cloud cover and the Earth’s rotation, and static conditions such as the position of mountain ranges and oceans.
Climate Literacy Principles • Earth’s climate is influenced by
interactions involving the Sun, ocean, atmosphere, clouds, ice, land, and life. Climate varies by region as a result of local differences in these interactions. (Climate Literacy Principle 2A)
• Climate is determined by the long-term patterns of temperature and precipitation averages and extremes at a location. Climate descriptions can refer to areas that are local, regional, or global in extent. (Climate Literacy Principle 4A)
Time: Two class periods.
Level: Upper Primary, Secondary (Grades 6–12).
Materials (These investigations can be used as either paper based or on-line interactive activities)
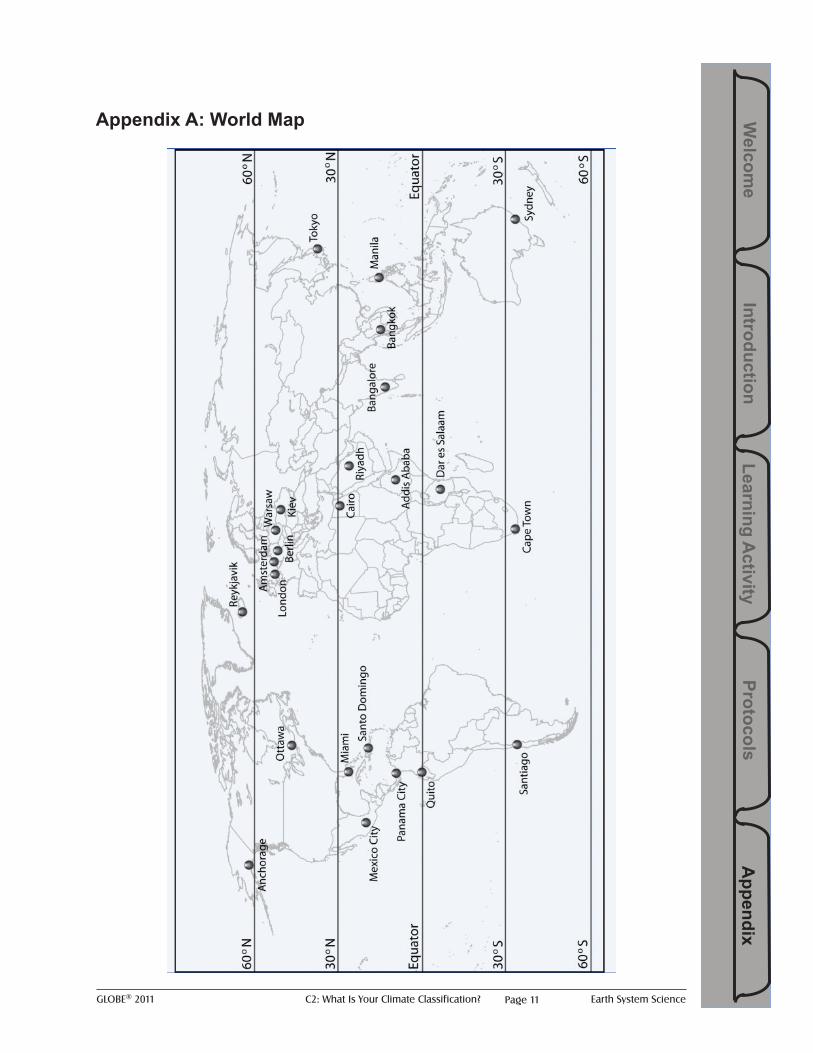
• World Map (Appendix A) • Student Worksheets (Appendix B)
C2: What Is Your Climate Classification?
GLOBE® 2011 C2: What Is Your Climate Classification? Earth System SciencePage 2
BackgroundClimateClimate is the average of the day-to-day weather over a long duration. Generally, this long duration refers to 30 years or more. Two weather elements are extremely important to climate: temperature and precipitation.
Climate ClassificationA climate classification can provide a great understanding that temperature and precipitation are both important to climate.Wladimir Köppen (1900) developed a climate classification system for world climate types using annual and seasonal patterns of
temperature and precipitation as well as vegetation types. In 1954, Rudolf Geiger updated Köppen’s system and made it available as a world map. Today, this system, known as the Köppen-Geiger Climate Classification system, is widely used and identifies 31 different climatic regions.There are five major climate types:
• Equatorial (A)• Arid (B)• Warm Temperate (C)• Snow (D)• and Polar (E).
• Köppen-Geiger Climate Classification Key (Appendix C) • Köppen-Geiger Classification map and Classification Descriptions (Appendix D) • Caculators or access to computer-based spreadsheet tool • Access to 30-year local temperature & precipitation data (for Activity 2 and
Extension work) • Graph paper For Activity 2 (Optional)
Preparation• Print student worksheets and handouts (Appendices A through D)• Locate local long-term data (Activity 2 and Extension activities)
Prerequisites:• Students should have basic mathematical skills including calculation of means,
addition, multiplication and inequalities. • Graphing and interpretation of graphs skills• Experience with related GLOBE Climate Foundation Activities is recommended,
specifically: - From Weather to Climate (http://globe.gov/scrc/pilots/data)
Assessment Opportunities:On-going (formative) assessment:
• individual self-checking throughout Activity 1 or• Whole class review and discussion of findings
Final (summative) assessment:• Individual or small group project classifying the climate of additional cities or
their own location through the use of relevant data
GLOBE® 2011 C2: What Is Your Climate Classification? Earth System Science
Learning Activity
Protocols A
ppendix Introduction
Welcom
e
Page 3
Each climate type can then be further classified by precipitation and temperature conditions. This results in 31 different climate classifications.
Teacher notes:• For students wishing to explore the Köppen-Geiger Climate Classification system
used in the development of this activity, visit http://www.schweizerbart.de/resources/downloads/paper_free/55034.pdf.
• These Investigations are also available as an on-line learning activity at: http://globe.gov/scrc/pilots/classification
• Student worksheets can be completed as either paper copies or electronic documents• Students can upload their climate classification to Google Earth at: http://globe.gov/
scrc/pilots/ccpost.
GLOBE® 2011 C2: What Is Your Climate Classification? Earth System SciencePage 4
Activity 1 - Climate Classification Categories
During this activity, students will become familiar with the 5 major climate types and the 31 climatic regions.
What To Do and How To Do It
Setting the SceneExplain that according to the Köppen-Geiger Climate Classification system there are 5 major climate types and that these are given a specific letter A, B, C, D and E.
Provide students with Activity 1 Student Worksheets and the World Map (Appendix A).
Student task 1: Classify each city in Table 1 into one of the 5 major climate types. Use the World Map as reference.
Compare the choices and reasoning for the whole class.
Explain that within the 5 major climate types there are 31 sub-classifications depending on temperature and precipitation. This is known as the Köppen-Geiger Climate Classification.
Explain to students that in the next part of Activity 1 they will carry out calculations which can be used to determine the major and sub-classification for a particular location.
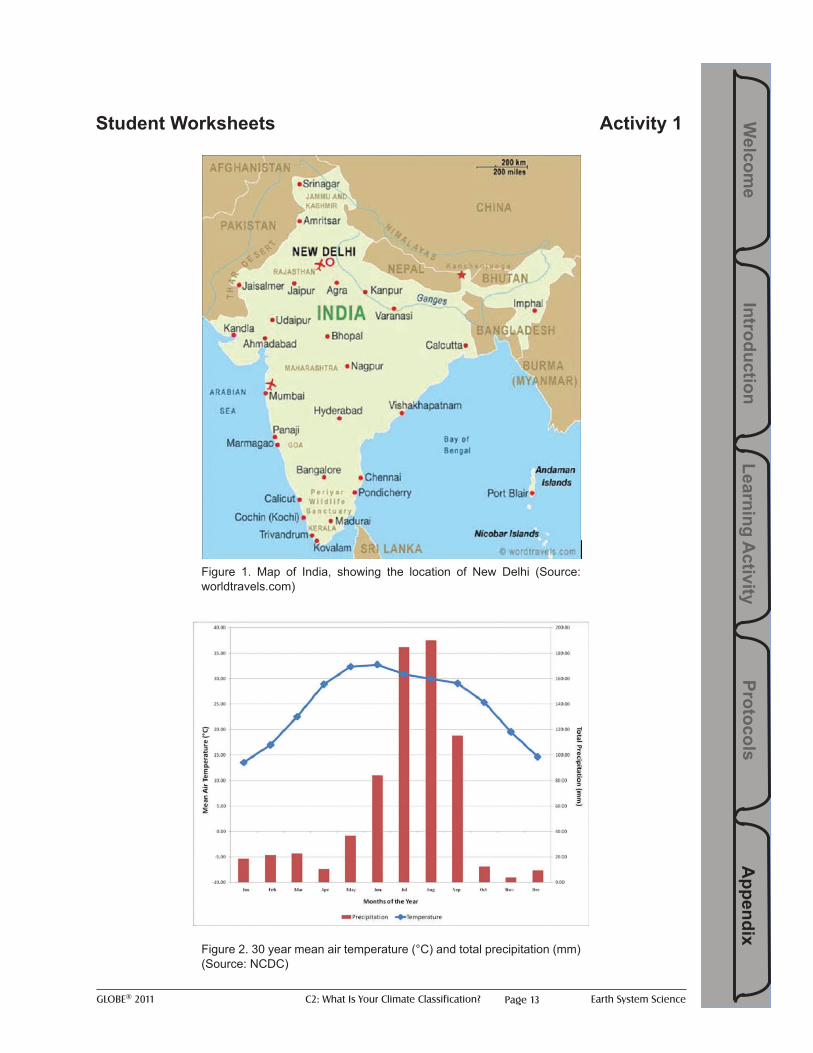
Step 1: How to determine the major climate type using the Köppen-Geiger Climate ClassificationExplain that the calculations will be made based on long-term (30 Year) data from New Delhi, Delhi, India.
Student task 2: From Table 2 calculate the annual temperature (Tann) by adding up the monthly mean temperature values and dividing by 12 (the number of months in a year). Put this answer in Table 2A. Student task 3: Record the coldest month’s temperature (Tmin) and the warmest month’s temperature (Tmax) in Table 2A. Student task 4: Add up the monthly mean precipitation values to find the accumulated annual precipitation (Pann).
Explain that the Precipitation Threshold (Pth) determines the relationship between precipitation and evaporation. This also know as the dryness index and is dependent upon when precipitation falls during the year.
GLOBE® 2011 C2: What Is Your Climate Classification? Earth System Science
Learning Activity
Protocols A
ppendix Introduction
Welcom
e
Page 5
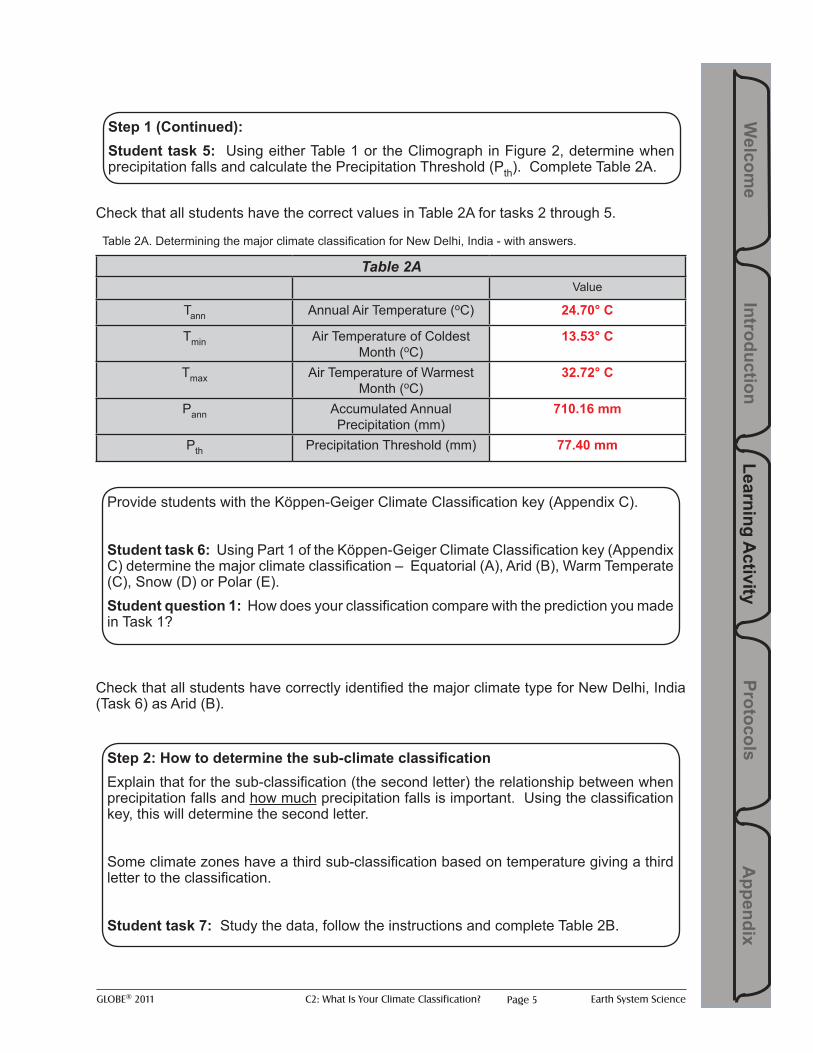
Check that all students have the correct values in Table 2A for tasks 2 through 5.
Table 2AValue
Tann Annual Air Temperature (oC) 24.70° C
Tmin Air Temperature of Coldest Month (oC)
13.53° C
Tmax Air Temperature of Warmest Month (oC)
32.72° C
Pann Accumulated Annual Precipitation (mm)
710.16 mm
Pth Precipitation Threshold (mm) 77.40 mm
Check that all students have correctly identified the major climate type for New Delhi, India (Task 6) as Arid (B).
Step 1 (Continued): Student task 5: Using either Table 1 or the Climograph in Figure 2, determine when precipitation falls and calculate the Precipitation Threshold (Pth). Complete Table 2A.
Provide students with the Köppen-Geiger Climate Classification key (Appendix C).
Student task 6: Using Part 1 of the Köppen-Geiger Climate Classification key (Appendix C) determine the major climate classification – Equatorial (A), Arid (B), Warm Temperate (C), Snow (D) or Polar (E). Student question 1: How does your classification compare with the prediction you made in Task 1?
Table 2A. Determining the major climate classification for New Delhi, India - with answers.
Step 2: How to determine the sub-climate classificationExplain that for the sub-classification (the second letter) the relationship between when precipitation falls and how much precipitation falls is important. Using the classification key, this will determine the second letter.
Some climate zones have a third sub-classification based on temperature giving a third letter to the classification.
Student task 7: Study the data, follow the instructions and complete Table 2B.
GLOBE® 2011 C2: What Is Your Climate Classification? Earth System SciencePage 6
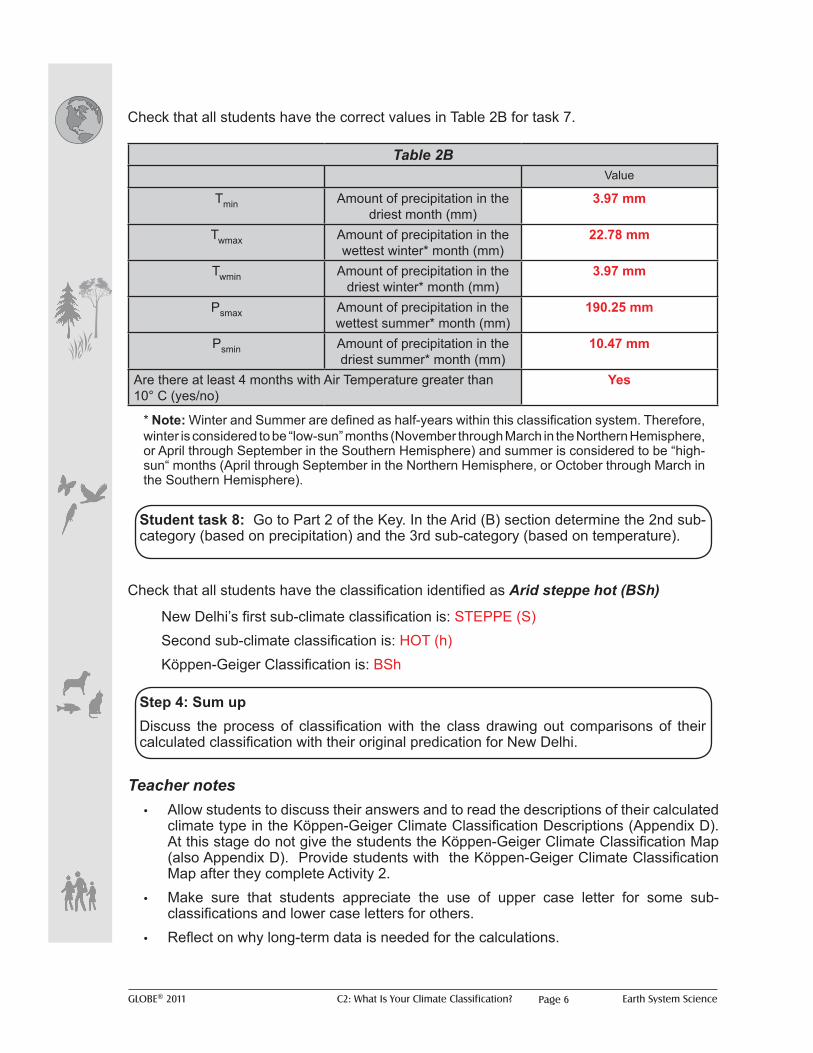
Check that all students have the correct values in Table 2B for task 7.
Table 2BValue
Tmin Amount of precipitation in the driest month (mm)
3.97 mm
Twmax Amount of precipitation in the wettest winter* month (mm)
22.78 mm
Twmin Amount of precipitation in the driest winter* month (mm)
3.97 mm
Psmax Amount of precipitation in the wettest summer* month (mm)
190.25 mm
Psmin Amount of precipitation in the driest summer* month (mm)
10.47 mm
Are there at least 4 months with Air Temperature greater than 10° C (yes/no)
Yes
Check that all students have the classification identified as Arid steppe hot (BSh)
Teacher notes• Allow students to discuss their answers and to read the descriptions of their calculated
climate type in the Köppen-Geiger Climate Classification Descriptions (Appendix D). At this stage do not give the students the Köppen-Geiger Climate Classification Map (also Appendix D). Provide students with the Köppen-Geiger Climate Classification Map after they complete Activity 2.
• Make sure that students appreciate the use of upper case letter for some sub-classifications and lower case letters for others.
• Reflect on why long-term data is needed for the calculations.
Step 4: Sum upDiscuss the process of classification with the class drawing out comparisons of their calculated classification with their original predication for New Delhi.
Student task 8: Go to Part 2 of the Key. In the Arid (B) section determine the 2nd sub-category (based on precipitation) and the 3rd sub-category (based on temperature).
New Delhi’s first sub-climate classification is: STEPPE (S)Second sub-climate classification is: HOT (h)Köppen-Geiger Classification is: BSh
* Note: Winter and Summer are defined as half-years within this classification system. Therefore, winter is considered to be “low-sun” months (November through March in the Northern Hemisphere, or April through September in the Southern Hemisphere) and summer is considered to be “high-sun“ months (April through September in the Northern Hemisphere, or October through March in the Southern Hemisphere).
GLOBE® 2011 C2: What Is Your Climate Classification? Earth System Science
Learning Activity
Protocols A
ppendix Introduction
Welcom
e
Page 7
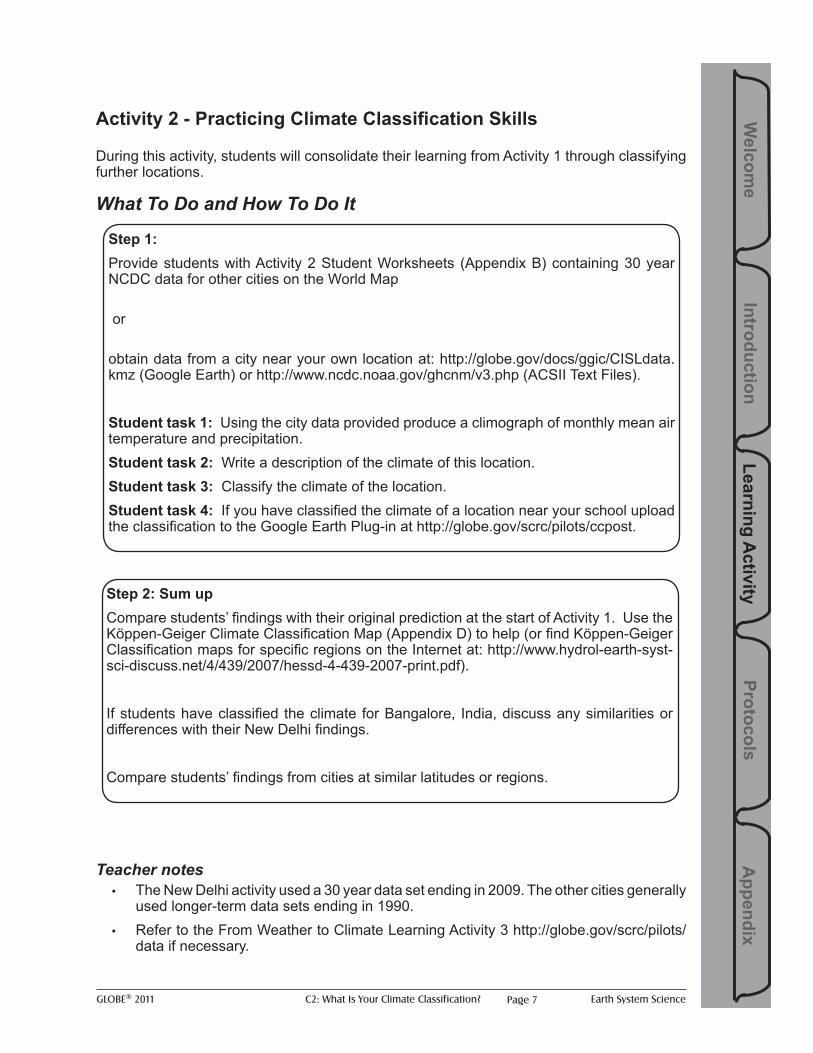
Activity 2 - Practicing Climate Classification Skills
During this activity, students will consolidate their learning from Activity 1 through classifying further locations.
What To Do and How To Do It
Teacher notes• The New Delhi activity used a 30 year data set ending in 2009. The other cities generally
used longer-term data sets ending in 1990.• Refer to the From Weather to Climate Learning Activity 3 http://globe.gov/scrc/pilots/
data if necessary.
Step 1: Provide students with Activity 2 Student Worksheets (Appendix B) containing 30 year NCDC data for other cities on the World Map
or
obtain data from a city near your own location at: http://globe.gov/docs/ggic/CISLdata.kmz (Google Earth) or http://www.ncdc.noaa.gov/ghcnm/v3.php (ACSII Text Files).
Student task 1: Using the city data provided produce a climograph of monthly mean air temperature and precipitation. Student task 2: Write a description of the climate of this location. Student task 3: Classify the climate of the location. Student task 4: If you have classified the climate of a location near your school upload the classification to the Google Earth Plug-in at http://globe.gov/scrc/pilots/ccpost.
Step 2: Sum upCompare students’ findings with their original prediction at the start of Activity 1. Use the Köppen-Geiger Climate Classification Map (Appendix D) to help (or find Köppen-Geiger Classification maps for specific regions on the Internet at: http://www.hydrol-earth-syst-sci-discuss.net/4/439/2007/hessd-4-439-2007-print.pdf).
If students have classified the climate for Bangalore, India, discuss any similarities or differences with their New Delhi findings.
Compare students’ findings from cities at similar latitudes or regions.
GLOBE® 2011 C2: What Is Your Climate Classification? Earth System SciencePage 8
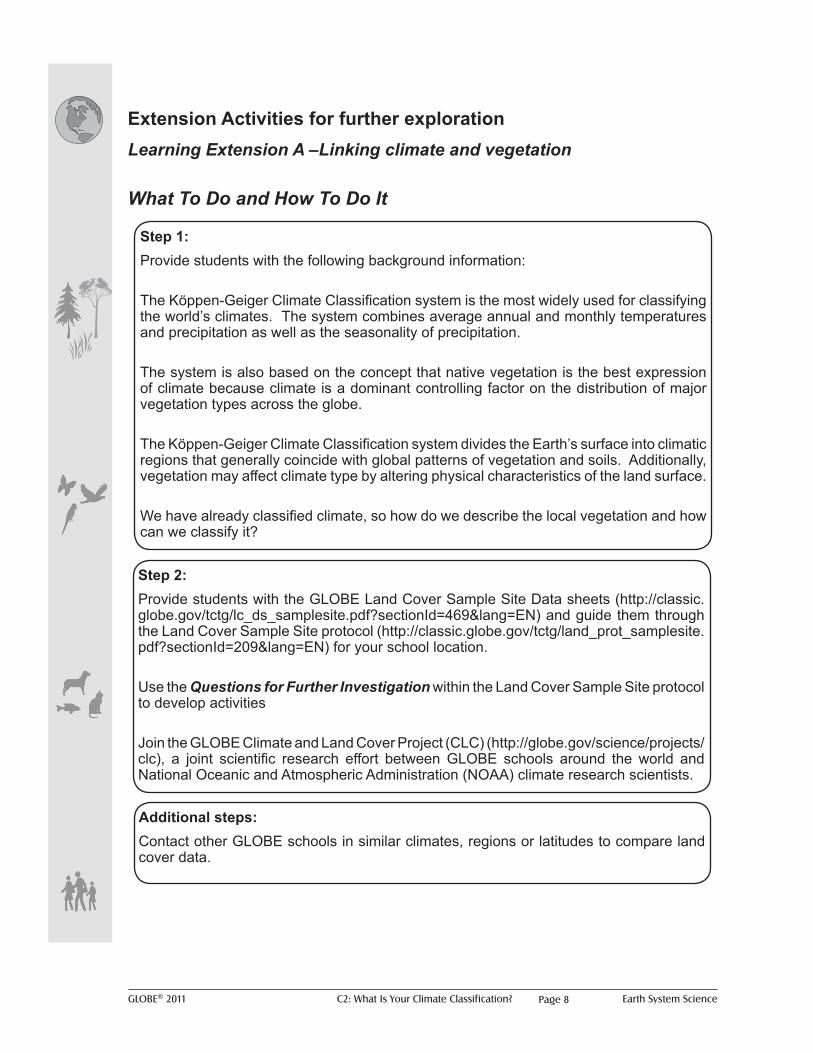
Extension Activities for further exploration Learning Extension A –Linking climate and vegetation
What To Do and How To Do It
Step 1: Provide students with the following background information:
The Köppen-Geiger Climate Classification system is the most widely used for classifying the world’s climates. The system combines average annual and monthly temperatures and precipitation as well as the seasonality of precipitation.
The system is also based on the concept that native vegetation is the best expression of climate because climate is a dominant controlling factor on the distribution of major vegetation types across the globe.
The Köppen-Geiger Climate Classification system divides the Earth’s surface into climatic regions that generally coincide with global patterns of vegetation and soils. Additionally, vegetation may affect climate type by altering physical characteristics of the land surface.
We have already classified climate, so how do we describe the local vegetation and how can we classify it?
Step 2: Provide students with the GLOBE Land Cover Sample Site Data sheets (http://classic.globe.gov/tctg/lc_ds_samplesite.pdf?sectionId=469&lang=EN) and guide them through the Land Cover Sample Site protocol (http://classic.globe.gov/tctg/land_prot_samplesite.pdf?sectionId=209&lang=EN) for your school location.
Use the Questions for Further Investigation within the Land Cover Sample Site protocol to develop activities
Join the GLOBE Climate and Land Cover Project (CLC) (http://globe.gov/science/projects/clc), a joint scientific research effort between GLOBE schools around the world and National Oceanic and Atmospheric Administration (NOAA) climate research scientists.
Additional steps: Contact other GLOBE schools in similar climates, regions or latitudes to compare land cover data.
GLOBE® 2011 C2: What Is Your Climate Classification? Earth System Science
Learning Activity
Protocols A
ppendix Introduction
Welcom
e
Page 9
Learning Extension B – Microclimates
What To Do and How To Do It
Step 1: Provide students with the following background information:
A microclimate is a local atmospheric zone where the climate differs from the surrounding area. The term may refer to areas as small as a few square meters (for example a garden bed) or as large as many square kilometers.
Microclimates exist, for example, near bodies of water which may cool the local atmosphere, or in heavily urban areas where brick, concrete, and asphalt absorb the sun’s energy, heat up, and re-radiate that heat to the ambient air; the resulting urban heat island is a kind of microclimate.
Another contributing factor to a microclimate is the slope or aspect of an area. South-facing slopes in the Northern Hemisphere and north-facing slopes in the Southern Hemisphere are exposed to more direct sunlight than opposite slopes and are therefore warmer for longer periods of time.
Some cities or large areas are renowned for their microclimates and may have a wide range of extremes of temperature due to the influence of physical factors.
Step 2: Small scale: Have students sketch a map of their school grounds then collect temperature and precipitation data at a number of sites around the school. Have students explore the influence of this on a particular species of vegetation.
Large scale: Use GLOBE school data to compare temperature and precipitation data for an upland area, coastal area and forest area that are all in the same climate type.
Additional steps: Use the GLOBE Surface Temperature protocol to discover how different surfaces radiate energy and use this to introduce the topic of Urban Heat Islands. For additional learning activities, see the Land, Water and Air Learning Activity. Both the Surface Temperature Protocol and the Land, Water and Air Learning Activity can be found in the GLOBE Teacher’s Guide (http://classic.globe.gov/tctg/atmo_chap.pdf?sectionId=1&lang=EN).
GLOBE® 2011 C2: What Is Your Climate Classification? Earth System SciencePage 10
Additional Climate and Land Cover-Related Resources
NASA (National Aeronautics and Space Administration) • Global Climate Change http://climate.nasa.gov/
NOAA (National Oceanic and Atmospheric Administration) • Climate Services http://www.climate.gov/#climateWatch • Climate http://www.srh.noaa.gov/jetstream/global/climate.htm • Paleoclimatology http://www.ncdc.noaa.gov/paleo/globalwarming/animation/
animation.html
WMO (World Meteorological Organization) • Weather, Climate and Water Science for Youth http://www.wmo.int/youth/index_
en.html
European Space Agency • Atmosphere http://www.esa.int/esaEO/SEMJEX2VQUD_planet_0.html
MetOffice • Education http://www.metoffice.gov.uk/education
Miscellaneous Resources: • Climate Classification quiz http://highered.mcgraw-hill.com/sites/0078664233/
student_view0/unit4/chapter14/section2/self-check_quiz.html• World Climate Data http://www.worldclimate.com • Interactive Climate Maps http://www4.uwsp.edu/geo/faculty/ritter/interactive_
climate_map/climate_map.html• Climate Classification and Climatic Regions of the World (http://www.
physicalgeography.net/fundamentals/7v.html • World maps of Köppen-Geiger Climate Classification, including papers and
model animations http://koeppen-geiger.vu-wien.ac.at/
GLOBE® 2011 C2: What Is Your Climate Classification? Earth System Science
Learning Activity
Protocols A
ppendix Introduction
Welcom
e
Page 11
Appendix A: World Map
GLOBE® 2011 C2: What Is Your Climate Classification? Earth System SciencePage 12
Appendix B: Student Worksheets Student Handout 1
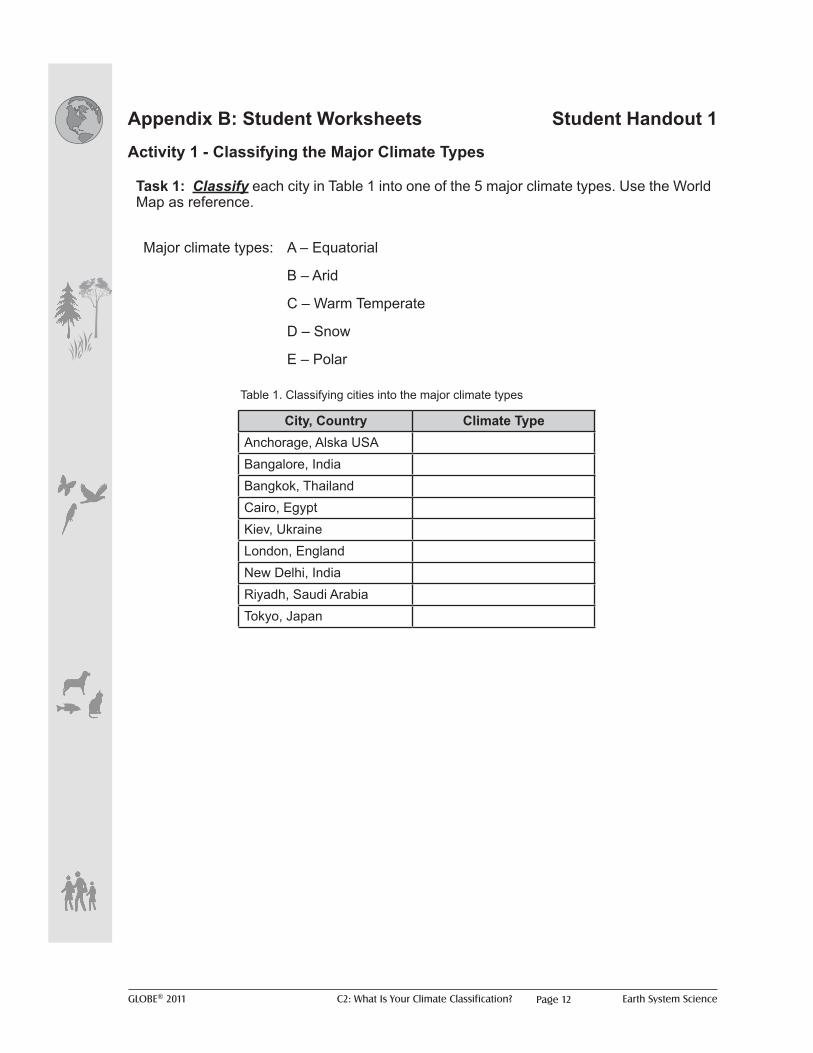
City, Country Climate TypeAnchorage, Alska USABangalore, IndiaBangkok, ThailandCairo, EgyptKiev, UkraineLondon, EnglandNew Delhi, IndiaRiyadh, Saudi ArabiaTokyo, Japan
Activity 1 - Classifying the Major Climate Types
Task 1: Classify each city in Table 1 into one of the 5 major climate types. Use the World Map as reference.
Major climate types: A – Equatorial
B – Arid
C – Warm Temperate
D – Snow
E – Polar
Table 1. Classifying cities into the major climate types
GLOBE® 2011 C2: What Is Your Climate Classification? Earth System Science
Learning Activity
Protocols A
ppendix Introduction
Welcom
e
Page 13
Student Worksheets Activity 1
Figure 1. Map of India, showing the location of New Delhi (Source: worldtravels.com)
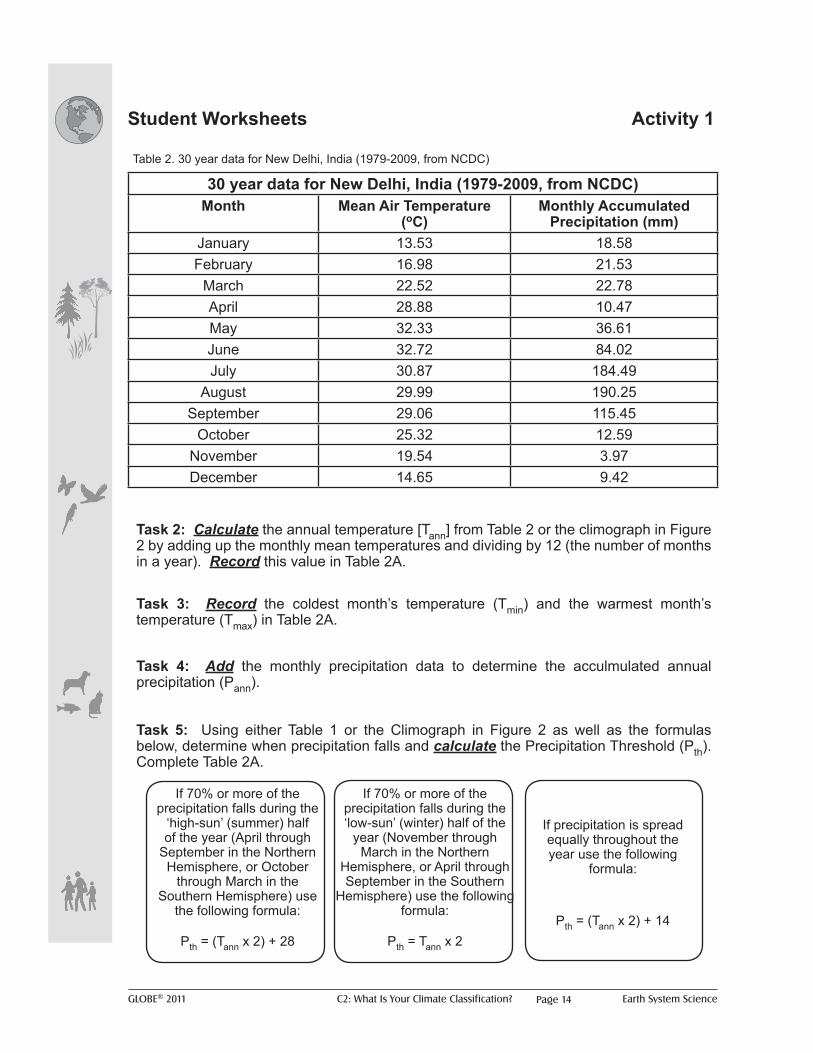
Figure 2. 30 year mean air temperature (°C) and total precipitation (mm) (Source: NCDC)
GLOBE® 2011 C2: What Is Your Climate Classification? Earth System SciencePage 14
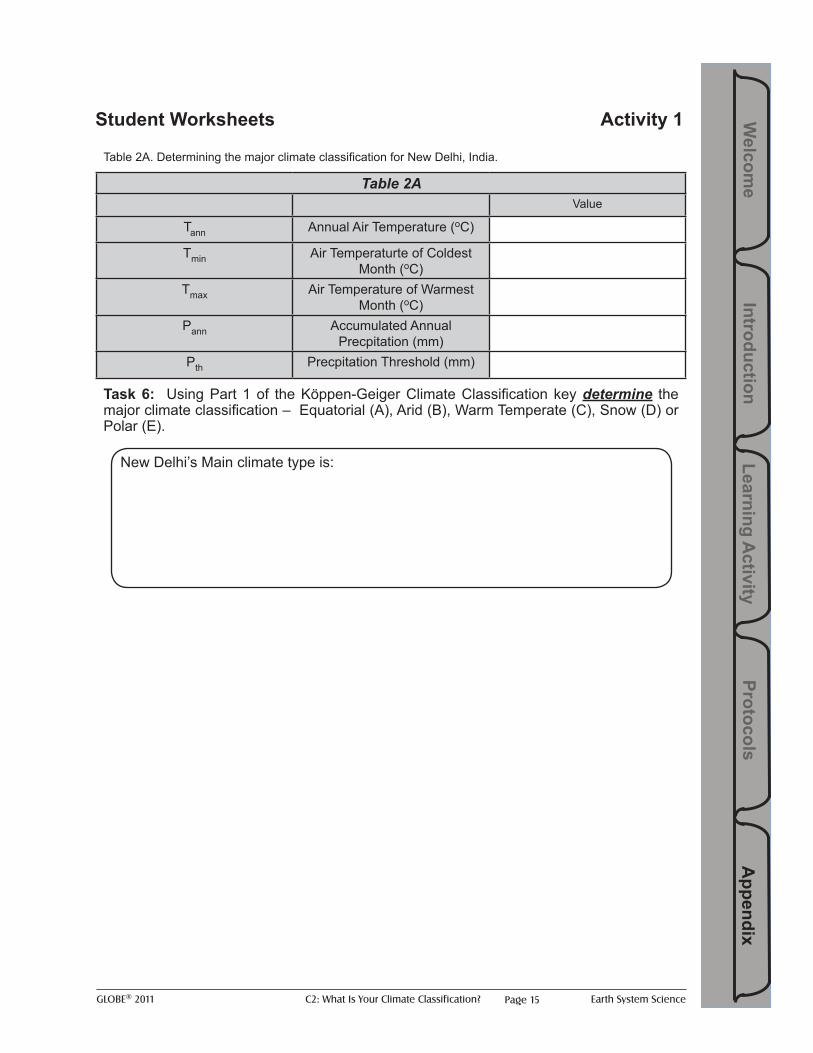
30 year data for New Delhi, India (1979-2009, from NCDC)Month Mean Air Temperature
(oC)Monthly Accumulated
Precipitation (mm)January 13.53 18.58February 16.98 21.53
March 22.52 22.78April 28.88 10.47May 32.33 36.61June 32.72 84.02July 30.87 184.49
August 29.99 190.25September 29.06 115.45
October 25.32 12.59November 19.54 3.97December 14.65 9.42
Table 2. 30 year data for New Delhi, India (1979-2009, from NCDC)
Student Worksheets Activity 1
Task 2: Calculate the annual temperature [Tann] from Table 2 or the climograph in Figure 2 by adding up the monthly mean temperatures and dividing by 12 (the number of months in a year). Record this value in Table 2A.
Task 3: Record the coldest month’s temperature (Tmin) and the warmest month’s temperature (Tmax) in Table 2A.
Task 4: Add the monthly precipitation data to determine the acculmulated annual precipitation (Pann).
Task 5: Using either Table 1 or the Climograph in Figure 2 as well as the formulas below, determine when precipitation falls and calculate the Precipitation Threshold (Pth). Complete Table 2A.
If 70% or more of the precipitation falls during the
‘high-sun’ (summer) half of the year (April through
September in the Northern Hemisphere, or October
through March in the Southern Hemisphere) use
the following formula:
Pth = (Tann x 2) + 28
If precipitation is spread equally throughout the year use the following
formula:
Pth = (Tann x 2) + 14
If 70% or more of the precipitation falls during the ‘low-sun’ (winter) half of the
year (November through March in the Northern
Hemisphere, or April through September in the Southern
Hemisphere) use the following formula:
Pth = Tann x 2
GLOBE® 2011 C2: What Is Your Climate Classification? Earth System Science
Learning Activity
Protocols A
ppendix Introduction
Welcom
e
Page 15
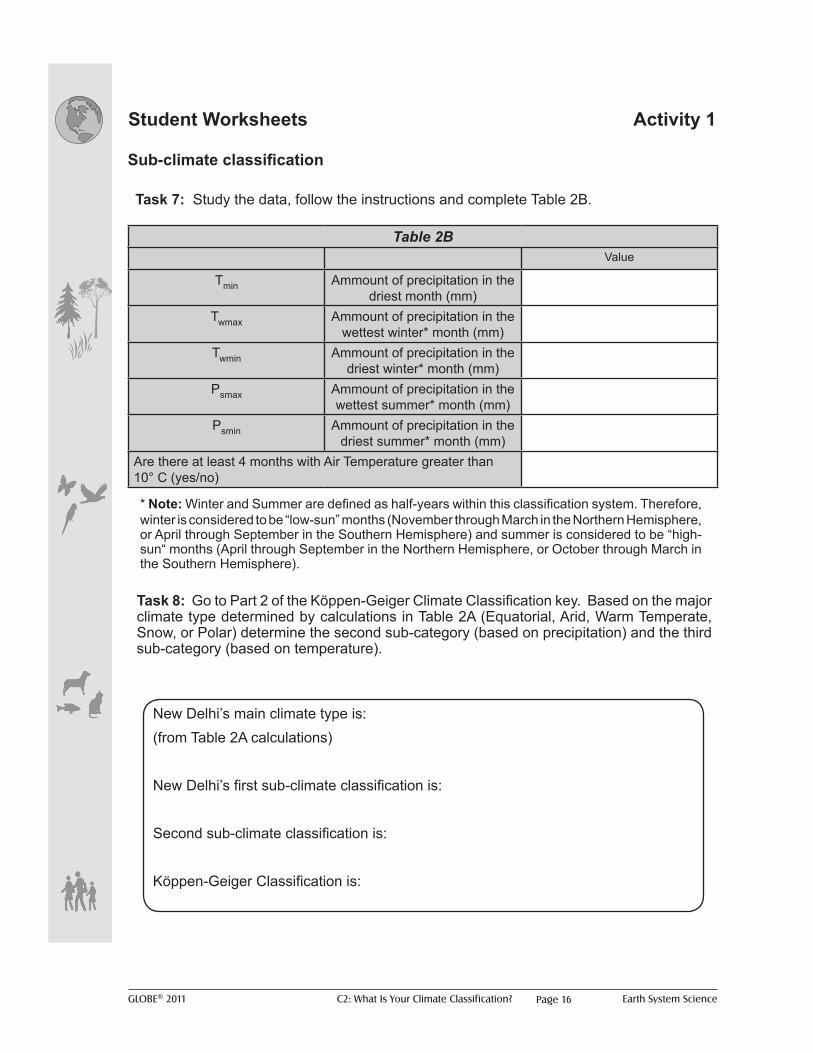
Table 2AValue
Tann Annual Air Temperature (oC)
Tmin Air Temperaturte of Coldest Month (oC)
Tmax Air Temperature of Warmest Month (oC)
Pann Accumulated Annual Precpitation (mm)
Pth Precpitation Threshold (mm)
Task 6: Using Part 1 of the Köppen-Geiger Climate Classification key determine the major climate classification – Equatorial (A), Arid (B), Warm Temperate (C), Snow (D) or Polar (E).
New Delhi’s Main climate type is:
Student Worksheets Activity 1
Table 2A. Determining the major climate classification for New Delhi, India.
GLOBE® 2011 C2: What Is Your Climate Classification? Earth System SciencePage 16
Sub-climate classification
Table 2BValue
Tmin Ammount of precipitation in the driest month (mm)
Twmax Ammount of precipitation in the wettest winter* month (mm)
Twmin Ammount of precipitation in the driest winter* month (mm)
Psmax Ammount of precipitation in the wettest summer* month (mm)
Psmin Ammount of precipitation in the driest summer* month (mm)
Are there at least 4 months with Air Temperature greater than 10° C (yes/no)
Student Worksheets Activity 1
Task 7: Study the data, follow the instructions and complete Table 2B.
Task 8: Go to Part 2 of the Köppen-Geiger Climate Classification key. Based on the major climate type determined by calculations in Table 2A (Equatorial, Arid, Warm Temperate, Snow, or Polar) determine the second sub-category (based on precipitation) and the third
sub-category (based on temperature).
New Delhi’s main climate type is: (from Table 2A calculations)
New Delhi’s first sub-climate classification is:
Second sub-climate classification is:
Köppen-Geiger Classification is:
* Note: Winter and Summer are defined as half-years within this classification system. Therefore, winter is considered to be “low-sun” months (November through March in the Northern Hemisphere, or April through September in the Southern Hemisphere) and summer is considered to be “high-sun“ months (April through September in the Northern Hemisphere, or October through March in the Southern Hemisphere).
GLOBE® 2011 C2: What Is Your Climate Classification? Earth System Science
Learning Activity
Protocols A
ppendix Introduction
Welcom
e
Page 17
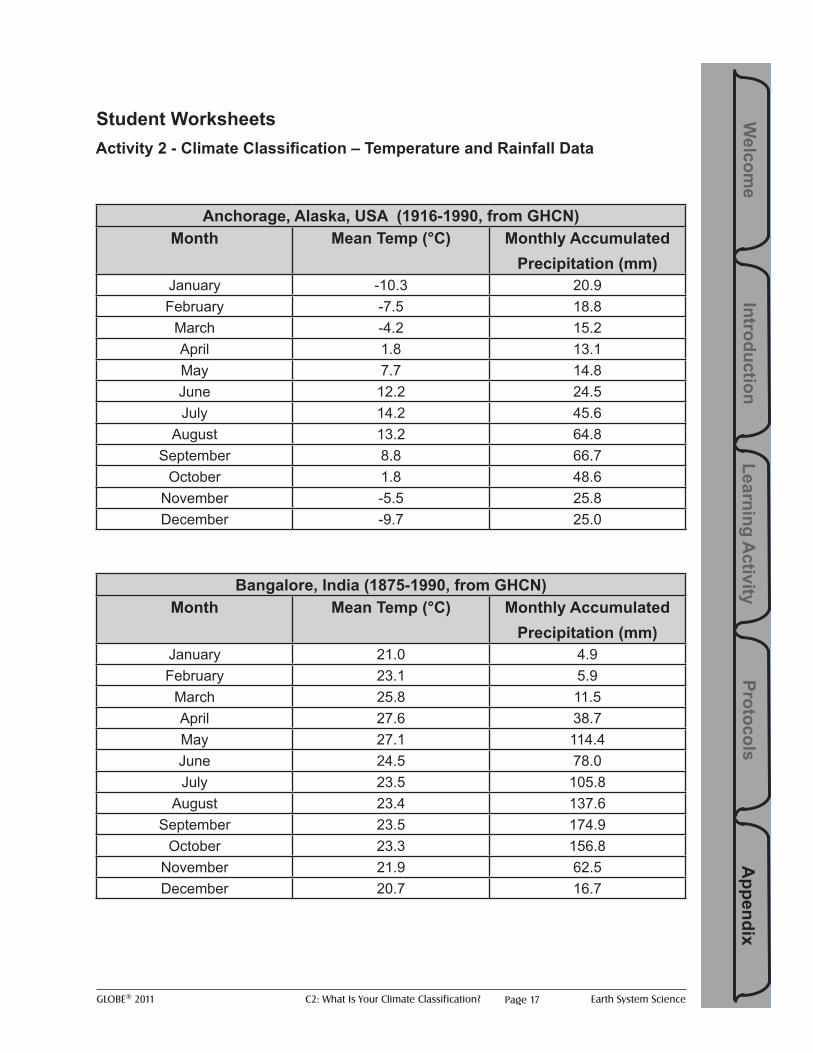
Anchorage, Alaska, USA (1916-1990, from GHCN)Month Mean Temp (°C) Monthly Accumulated
Precipitation (mm)January -10.3 20.9February -7.5 18.8
March -4.2 15.2April 1.8 13.1May 7.7 14.8June 12.2 24.5July 14.2 45.6
August 13.2 64.8September 8.8 66.7
October 1.8 48.6November -5.5 25.8December -9.7 25.0
Bangalore, India (1875-1990, from GHCN)Month Mean Temp (°C) Monthly Accumulated
Precipitation (mm)January 21.0 4.9February 23.1 5.9
March 25.8 11.5April 27.6 38.7May 27.1 114.4June 24.5 78.0July 23.5 105.8
August 23.4 137.6September 23.5 174.9
October 23.3 156.8November 21.9 62.5December 20.7 16.7
Activity 2 - Climate Classification – Temperature and Rainfall Data
Student Worksheets
GLOBE® 2011 C2: What Is Your Climate Classification? Earth System SciencePage 18
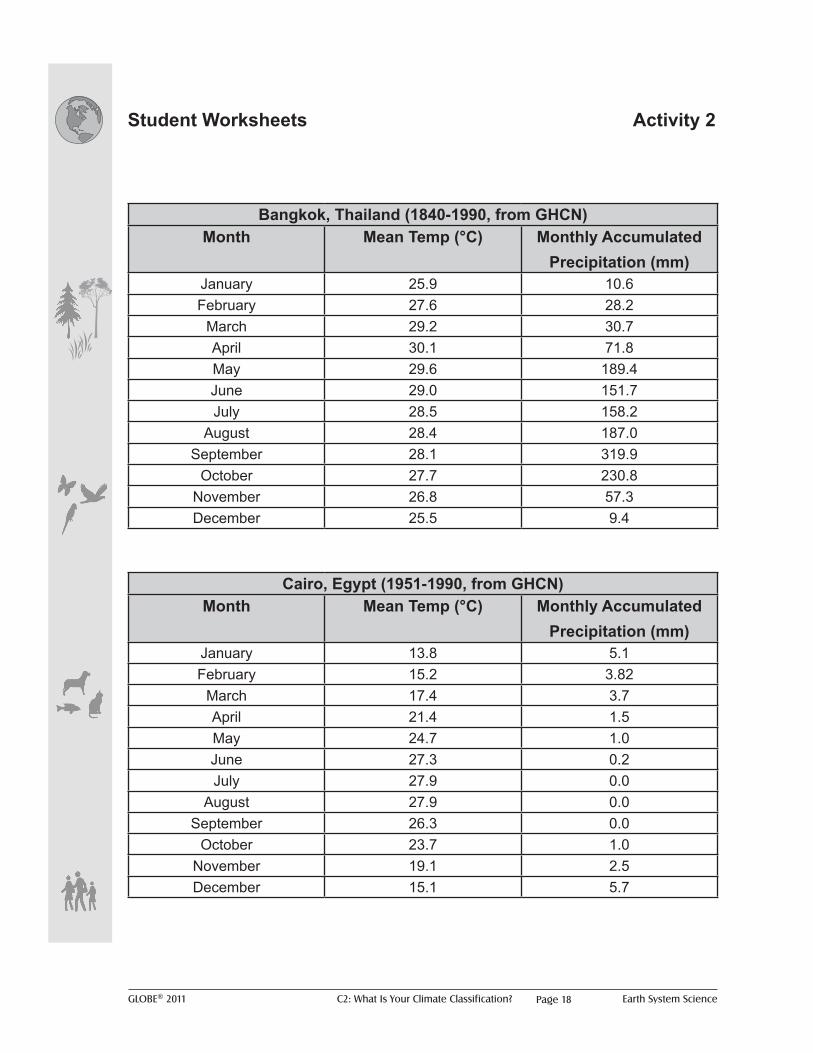
Bangkok, Thailand (1840-1990, from GHCN)Month Mean Temp (°C) Monthly Accumulated
Precipitation (mm)January 25.9 10.6February 27.6 28.2
March 29.2 30.7April 30.1 71.8May 29.6 189.4June 29.0 151.7July 28.5 158.2
August 28.4 187.0September 28.1 319.9
October 27.7 230.8November 26.8 57.3December 25.5 9.4
Cairo, Egypt (1951-1990, from GHCN)Month Mean Temp (°C) Monthly Accumulated
Precipitation (mm)January 13.8 5.1February 15.2 3.82
March 17.4 3.7April 21.4 1.5May 24.7 1.0June 27.3 0.2July 27.9 0.0
August 27.9 0.0September 26.3 0.0
October 23.7 1.0November 19.1 2.5December 15.1 5.7
Student Worksheets Activity 2
GLOBE® 2011 C2: What Is Your Climate Classification? Earth System Science
Learning Activity
Protocols A
ppendix Introduction
Welcom
e
Page 19
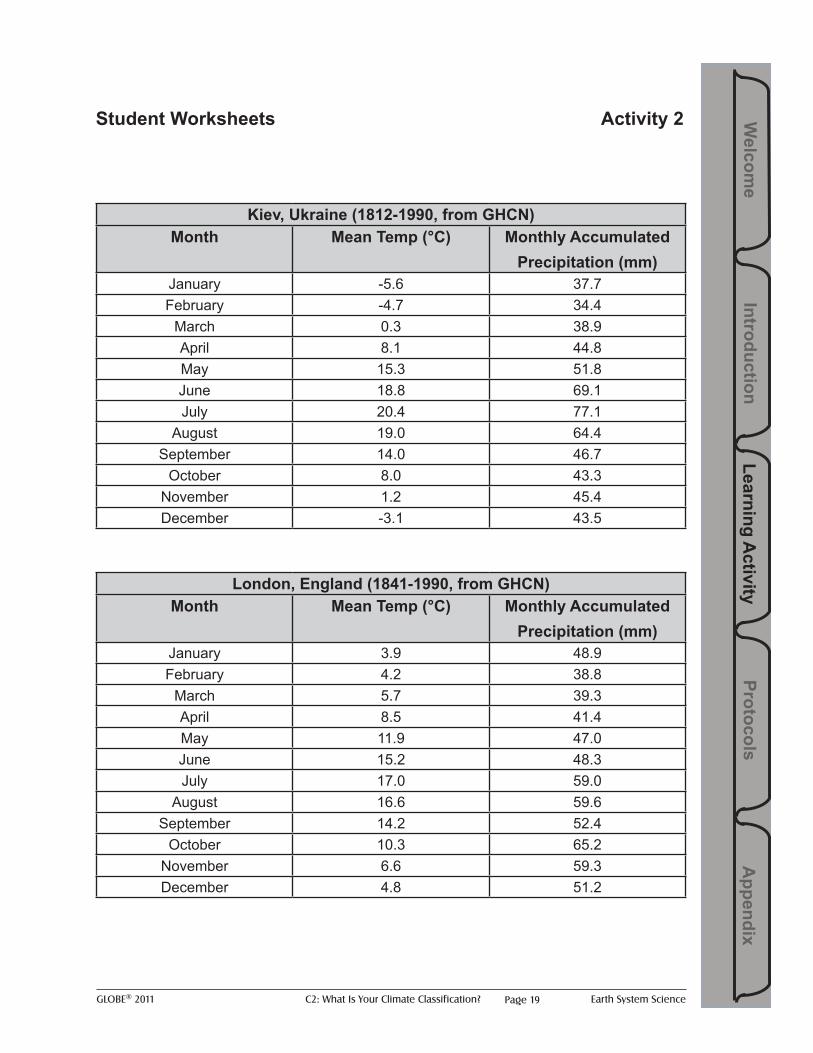
Kiev, Ukraine (1812-1990, from GHCN)Month Mean Temp (°C) Monthly Accumulated
Precipitation (mm)January -5.6 37.7February -4.7 34.4
March 0.3 38.9April 8.1 44.8May 15.3 51.8June 18.8 69.1July 20.4 77.1
August 19.0 64.4September 14.0 46.7
October 8.0 43.3November 1.2 45.4December -3.1 43.5
London, England (1841-1990, from GHCN)Month Mean Temp (°C) Monthly Accumulated
Precipitation (mm)January 3.9 48.9February 4.2 38.8
March 5.7 39.3April 8.5 41.4May 11.9 47.0June 15.2 48.3July 17.0 59.0
August 16.6 59.6September 14.2 52.4
October 10.3 65.2November 6.6 59.3December 4.8 51.2
Student Worksheets Activity 2
GLOBE® 2011 C2: What Is Your Climate Classification? Earth System SciencePage 20
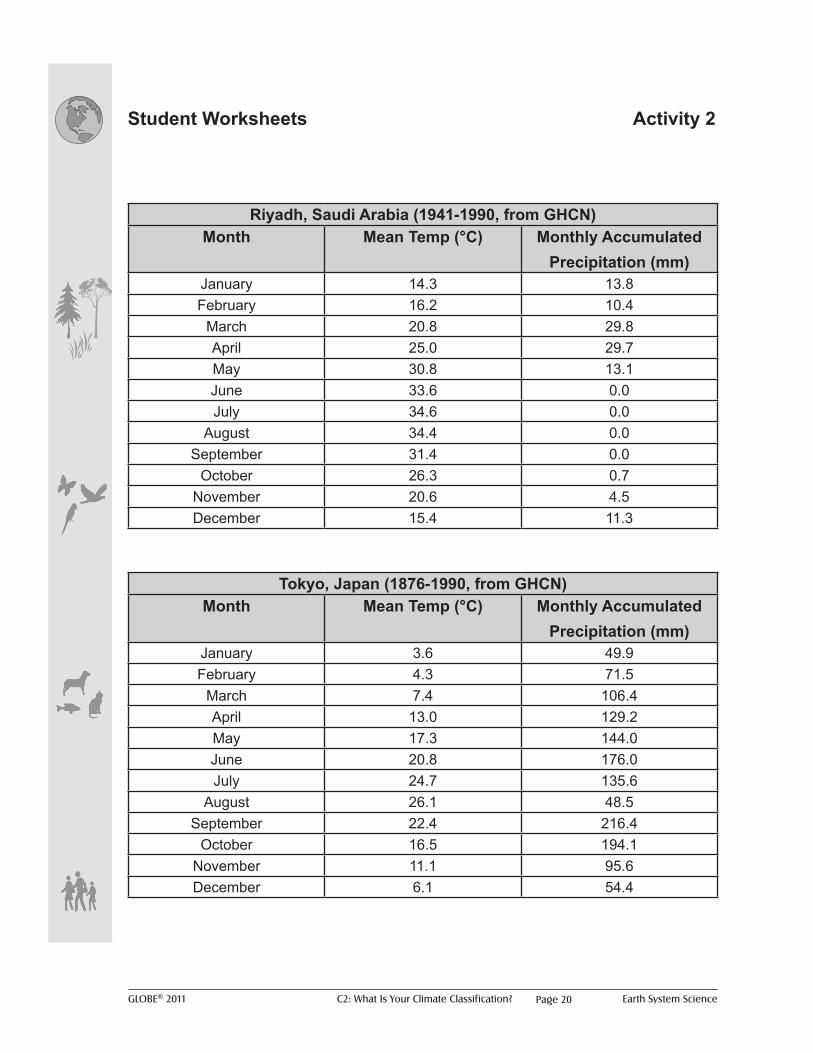
Riyadh, Saudi Arabia (1941-1990, from GHCN)Month Mean Temp (°C) Monthly Accumulated
Precipitation (mm)January 14.3 13.8February 16.2 10.4
March 20.8 29.8April 25.0 29.7May 30.8 13.1June 33.6 0.0July 34.6 0.0
August 34.4 0.0September 31.4 0.0
October 26.3 0.7November 20.6 4.5December 15.4 11.3
Tokyo, Japan (1876-1990, from GHCN)Month Mean Temp (°C) Monthly Accumulated
Precipitation (mm)January 3.6 49.9February 4.3 71.5
March 7.4 106.4April 13.0 129.2May 17.3 144.0June 20.8 176.0July 24.7 135.6
August 26.1 48.5September 22.4 216.4
October 16.5 194.1November 11.1 95.6December 6.1 54.4
Student Worksheets Activity 2
GLOBE® 2011 C2: What Is Your Climate Classification? Earth System Science
Learning Activity
Protocols A
ppendix Introduction
Welcom
e
Page 21
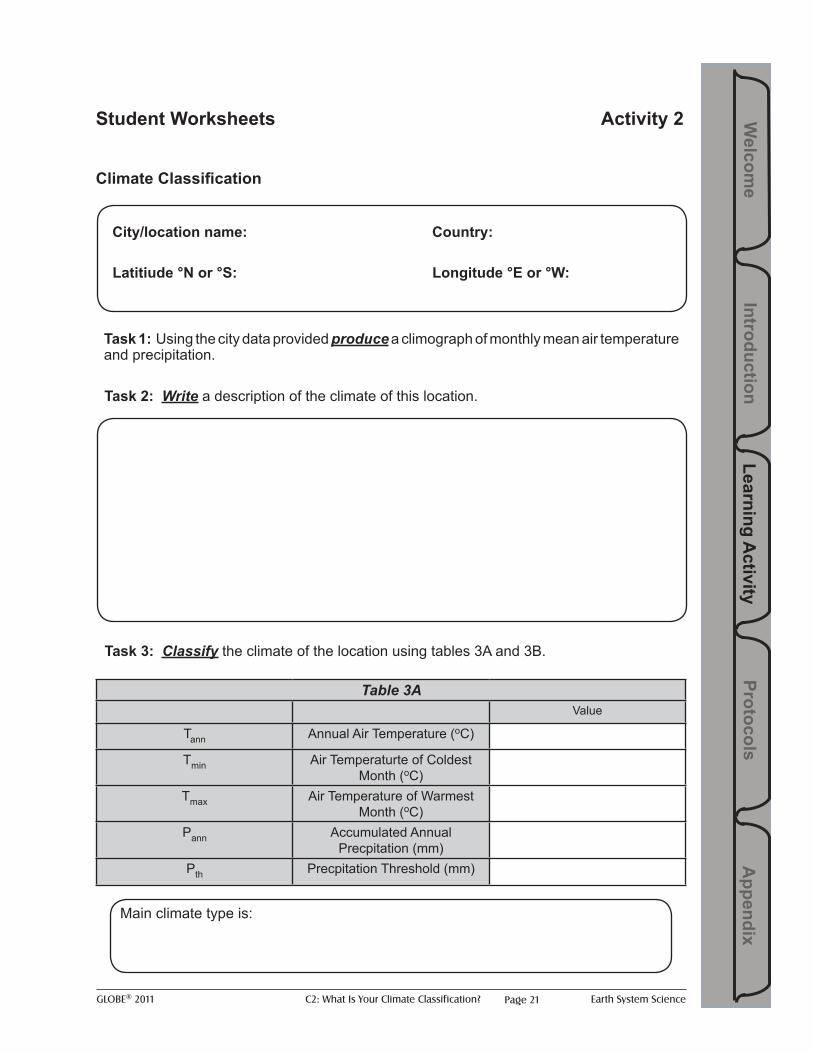
Climate Classification
Table 3AValue
Tann Annual Air Temperature (oC)
Tmin Air Temperaturte of Coldest Month (oC)
Tmax Air Temperature of Warmest Month (oC)
Pann Accumulated Annual Precpitation (mm)
Pth Precpitation Threshold (mm)
Student Worksheets Activity 2
Task 1: Using the city data provided produce a climograph of monthly mean air temperature and precipitation.
City/location name: Country:
Latitiude °N or °S: Longitude °E or °W:
Task 2: Write a description of the climate of this location.
Task 3: Classify the climate of the location using tables 3A and 3B.
Main climate type is:
GLOBE® 2011 C2: What Is Your Climate Classification? Earth System SciencePage 22
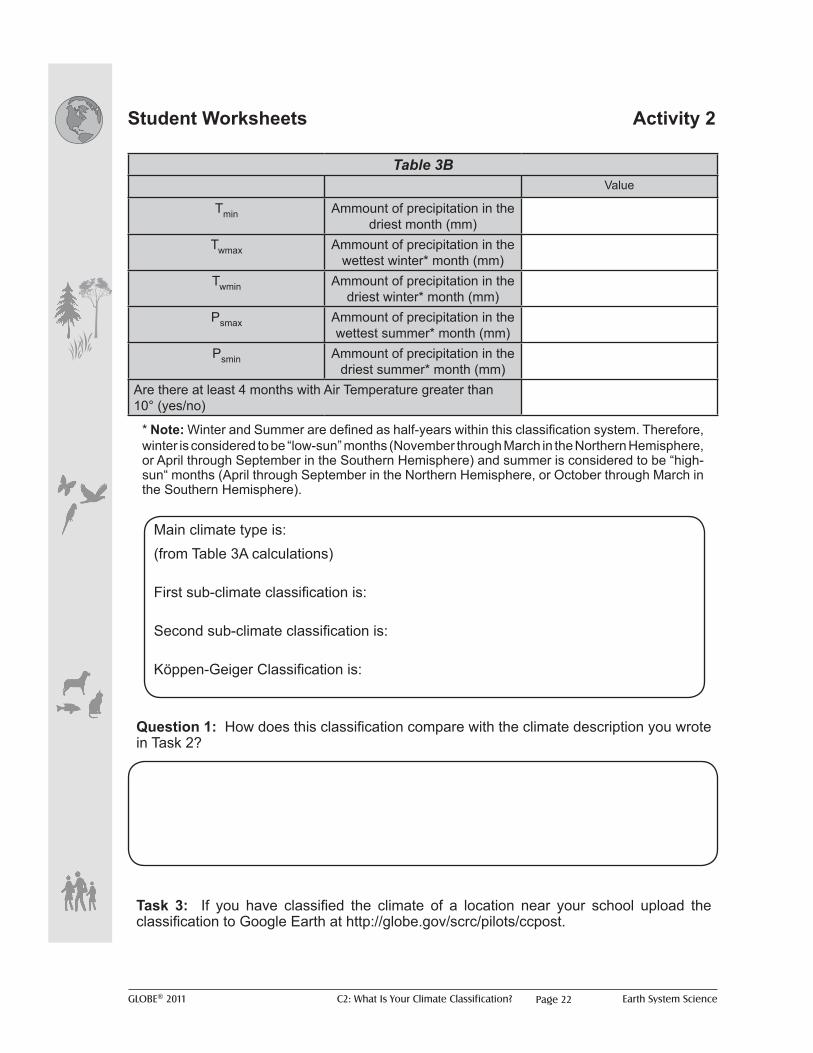
Table 3BValue
Tmin Ammount of precipitation in the driest month (mm)
Twmax Ammount of precipitation in the wettest winter* month (mm)
Twmin Ammount of precipitation in the driest winter* month (mm)
Psmax Ammount of precipitation in the wettest summer* month (mm)
Psmin Ammount of precipitation in the driest summer* month (mm)
Are there at least 4 months with Air Temperature greater than 10° (yes/no)
Student Worksheets Activity 2
Main climate type is: (from Table 3A calculations)
First sub-climate classification is:
Second sub-climate classification is:
Köppen-Geiger Classification is:
Question 1: How does this classification compare with the climate description you wrote in Task 2?
Task 3: If you have classified the climate of a location near your school upload the classification to Google Earth at http://globe.gov/scrc/pilots/ccpost.
* Note: Winter and Summer are defined as half-years within this classification system. Therefore, winter is considered to be “low-sun” months (November through March in the Northern Hemisphere, or April through September in the Southern Hemisphere) and summer is considered to be “high-sun“ months (April through September in the Northern Hemisphere, or October through March in the Southern Hemisphere).
GLOBE® 2011 C2: What Is Your Climate Classification? Earth System Science
Learning Activity
Protocols A
ppendix Introduction
Welcom
e
Page 23
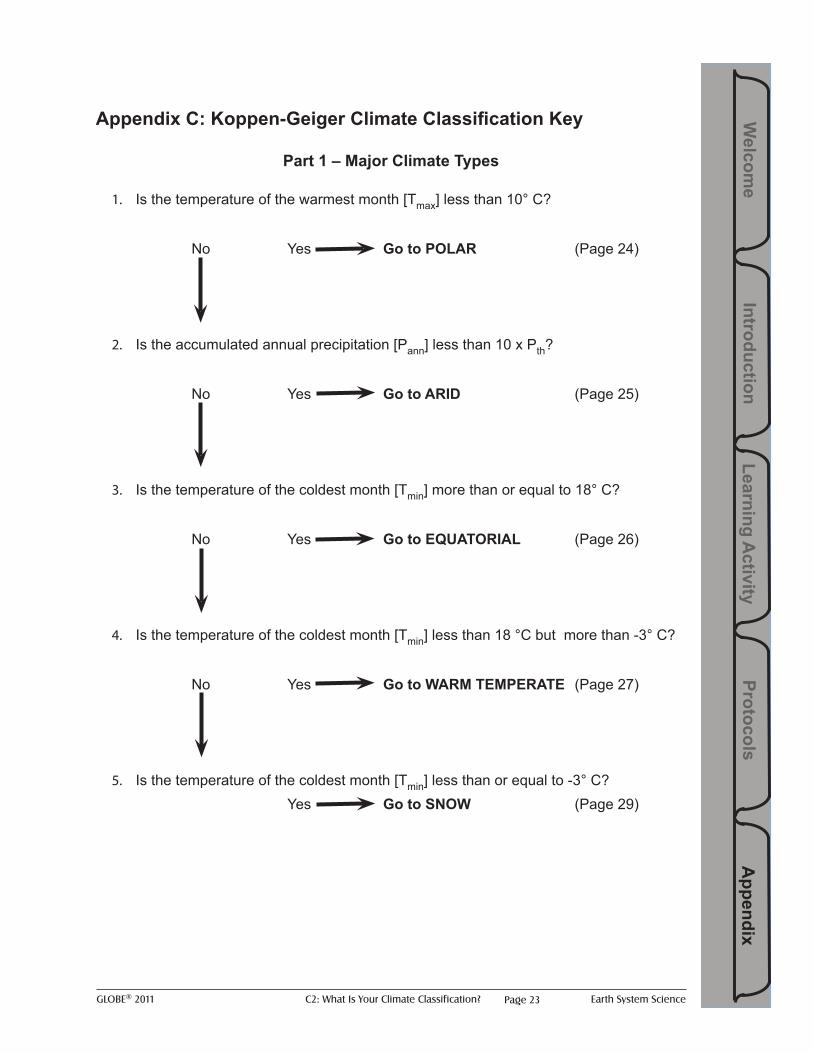
Appendix C: Koppen-Geiger Climate Classification Key
Part 1 – Major Climate Types
1. Is the temperature of the warmest month [Tmax] less than 10° C?
No Yes Go to POLAR (Page 24)
2. Is the accumulated annual precipitation [Pann] less than 10 x Pth?
No Yes Go to ARID (Page 25)
3. Is the temperature of the coldest month [Tmin] more than or equal to 18° C?
No Yes Go to EQUATORIAL (Page 26)
4. Is the temperature of the coldest month [Tmin] less than 18 °C but more than -3° C?
No Yes Go to WARM TEMPERATE (Page 27)
5. Is the temperature of the coldest month [Tmin] less than or equal to -3° C? Yes Go to SNOW (Page 29)
GLOBE® 2011 C2: What Is Your Climate Classification? Earth System SciencePage 24
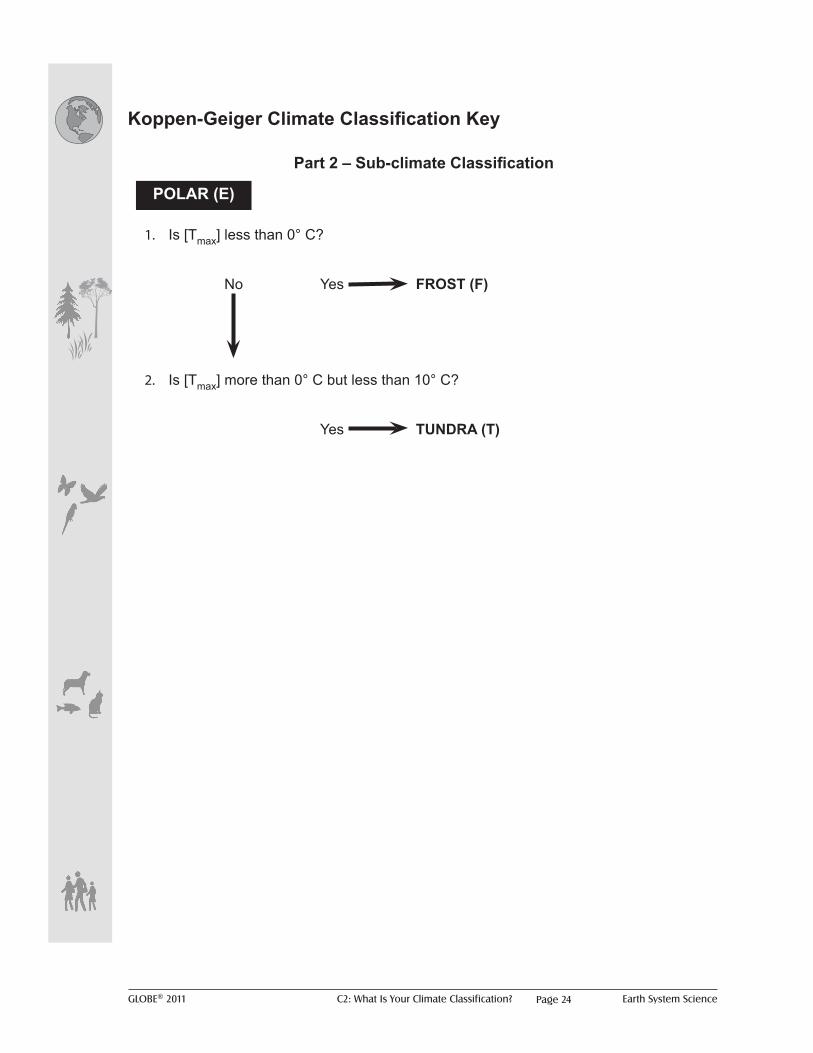
Koppen-Geiger Climate Classification Key
Part 2 – Sub-climate Classification
1. Is [Tmax] less than 0° C?
No Yes FROST (F)
2. Is [Tmax] more than 0° C but less than 10° C?
Yes TUNDRA (T)
POLAR (E)
GLOBE® 2011 C2: What Is Your Climate Classification? Earth System Science
Learning Activity
Protocols A
ppendix Introduction
Welcom
e
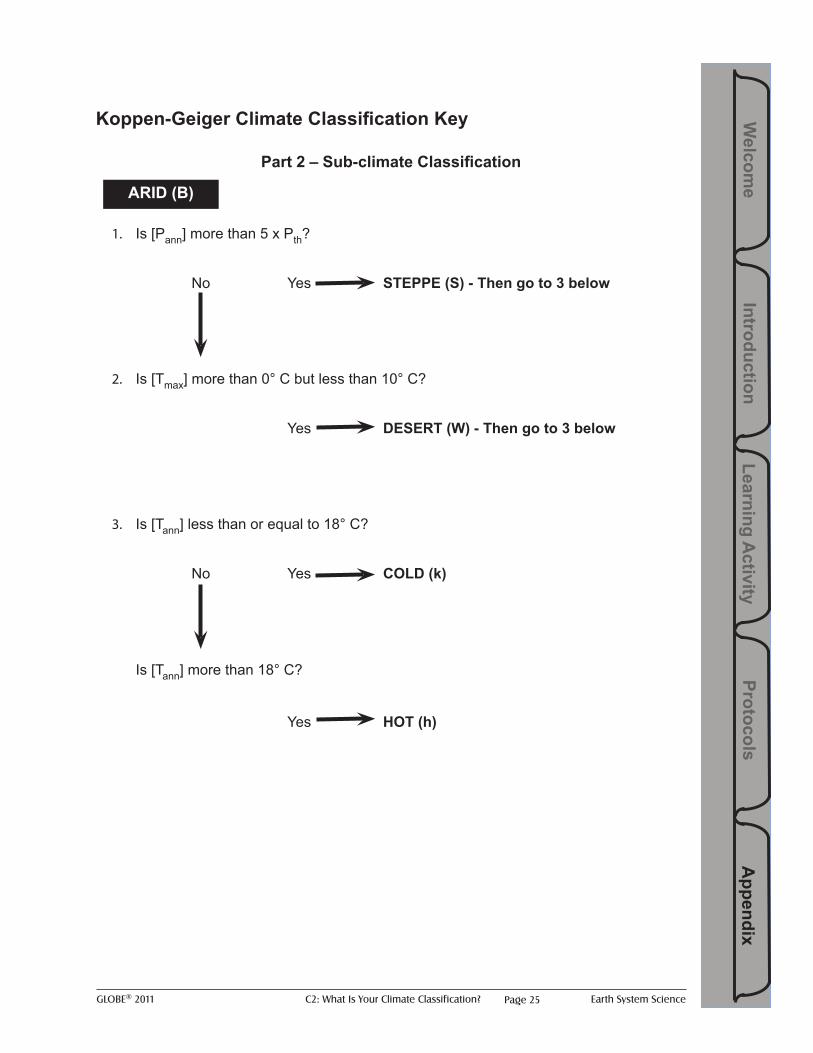
Page 25
Koppen-Geiger Climate Classification Key
Part 2 – Sub-climate Classification
1. Is [Pann] more than 5 x Pth?
No Yes STEPPE (S) - Then go to 3 below
2. Is [Tmax] more than 0° C but less than 10° C?
Yes DESERT (W) - Then go to 3 below
3. Is [Tann] less than or equal to 18° C?
No Yes COLD (k)
Yes HOT (h)
ARID (B)
Is [Tann] more than 18° C?
GLOBE® 2011 C2: What Is Your Climate Classification? Earth System SciencePage 26
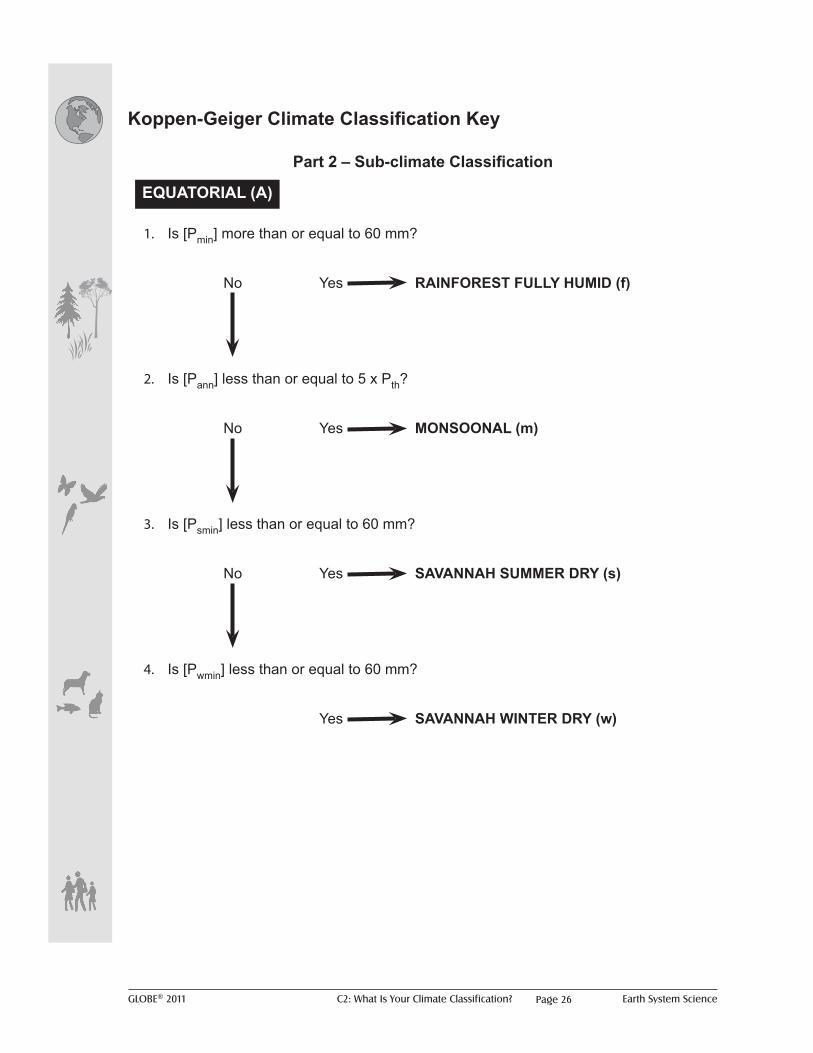
Koppen-Geiger Climate Classification Key
Part 2 – Sub-climate Classification
1. Is [Pmin] more than or equal to 60 mm?
No Yes RAINFOREST FULLY HUMID (f)
2. Is [Pann] less than or equal to 5 x Pth?
No Yes MONSOONAL (m)
3. Is [Psmin] less than or equal to 60 mm?
No Yes SAVANNAH SUMMER DRY (s)
4. Is [Pwmin] less than or equal to 60 mm?
Yes SAVANNAH WINTER DRY (w)
EQUATORIAL (A)
GLOBE® 2011 C2: What Is Your Climate Classification? Earth System Science
Learning Activity
Protocols A
ppendix Introduction
Welcom
e
Page 27
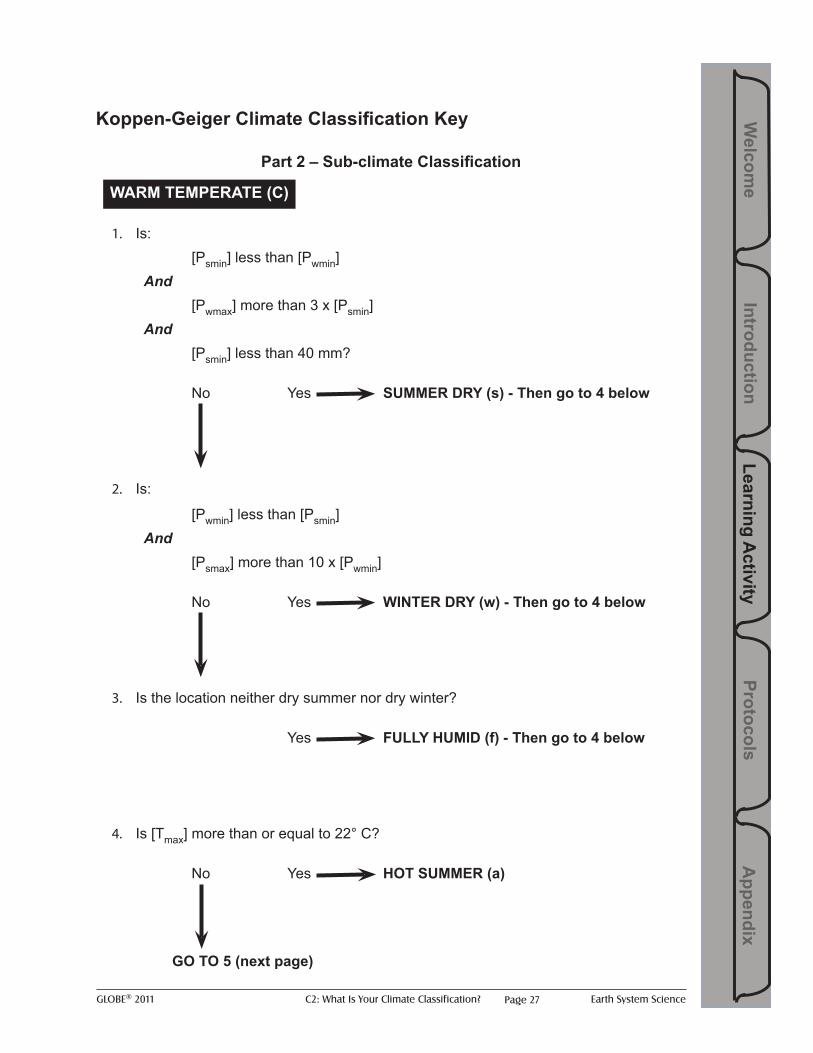
Koppen-Geiger Climate Classification Key
Part 2 – Sub-climate Classification
1. Is: [Psmin] less than [Pwmin] And [Pwmax] more than 3 x [Psmin] And [Psmin] less than 40 mm?
No Yes SUMMER DRY (s) - Then go to 4 below
2. Is:
[Pwmin] less than [Psmin] And [Psmax] more than 10 x [Pwmin]
No Yes WINTER DRY (w) - Then go to 4 below
3. Is the location neither dry summer nor dry winter?
Yes FULLY HUMID (f) - Then go to 4 below
4. Is [Tmax] more than or equal to 22° C?
No Yes HOT SUMMER (a)
GO TO 5 (next page)
WARM TEMPERATE (C)
GLOBE® 2011 C2: What Is Your Climate Classification? Earth System SciencePage 28
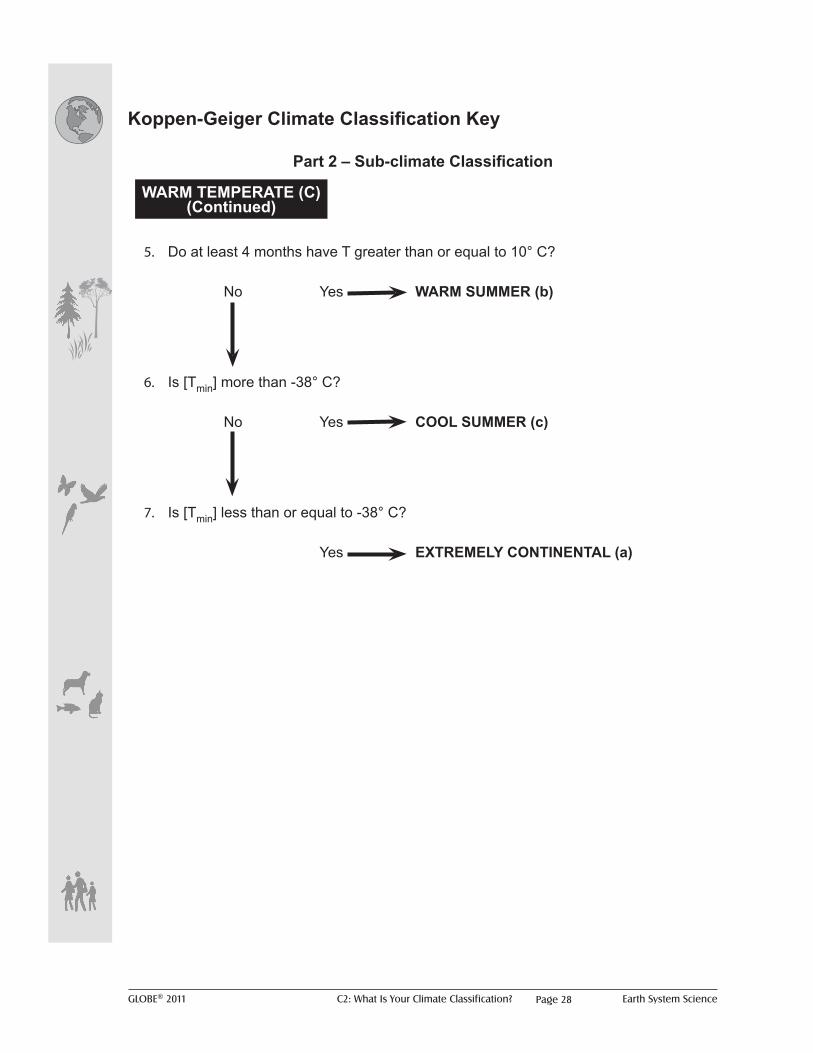
Koppen-Geiger Climate Classification Key
5. Do at least 4 months have T greater than or equal to 10° C?
No Yes WARM SUMMER (b)
6. Is [Tmin] more than -38° C?
No Yes COOL SUMMER (c)
7. Is [Tmin] less than or equal to -38° C?
Yes EXTREMELY CONTINENTAL (a)
Part 2 – Sub-climate Classification
WARM TEMPERATE (C) (Continued)
GLOBE® 2011 C2: What Is Your Climate Classification? Earth System Science
Learning Activity
Protocols A
ppendix Introduction
Welcom
e
Page 29
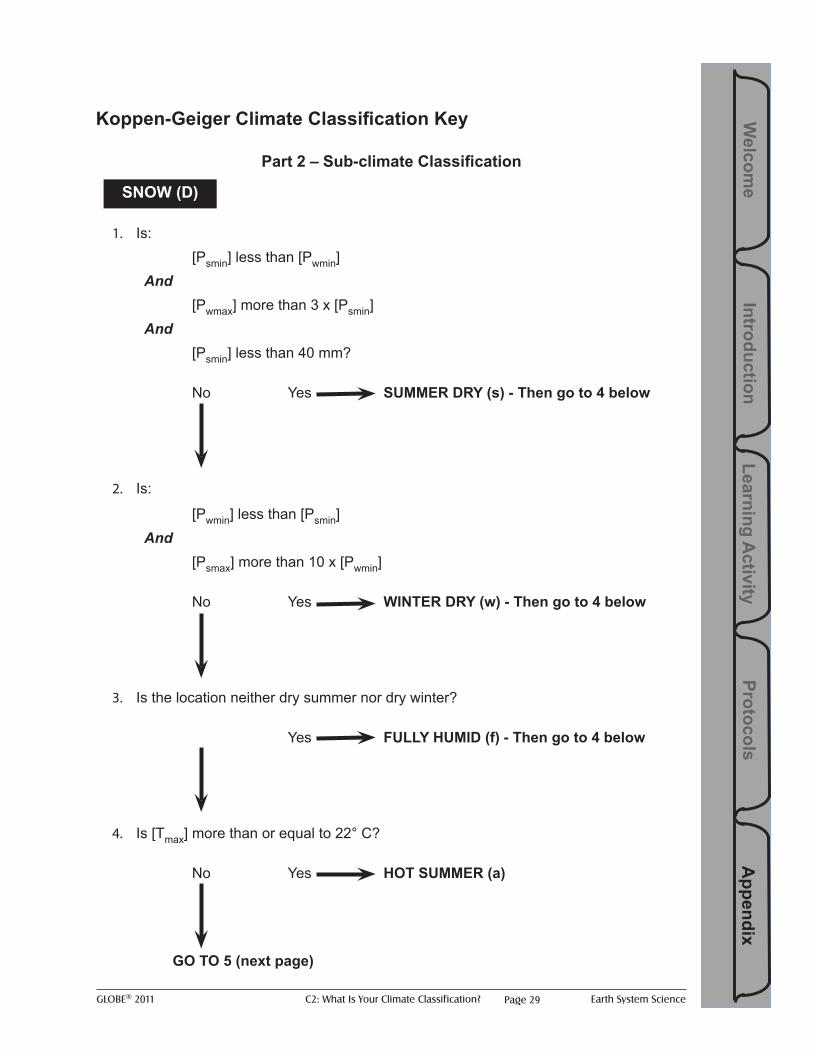
Koppen-Geiger Climate Classification Key
Part 2 – Sub-climate Classification
1. Is: [Psmin] less than [Pwmin] And [Pwmax] more than 3 x [Psmin] And [Psmin] less than 40 mm?
No Yes SUMMER DRY (s) - Then go to 4 below
2. Is:
[Pwmin] less than [Psmin] And [Psmax] more than 10 x [Pwmin]
No Yes WINTER DRY (w) - Then go to 4 below
3. Is the location neither dry summer nor dry winter?
Yes FULLY HUMID (f) - Then go to 4 below
4. Is [Tmax] more than or equal to 22° C?
No Yes HOT SUMMER (a)
GO TO 5 (next page)
SNOW (D)
GLOBE® 2011 C2: What Is Your Climate Classification? Earth System SciencePage 30
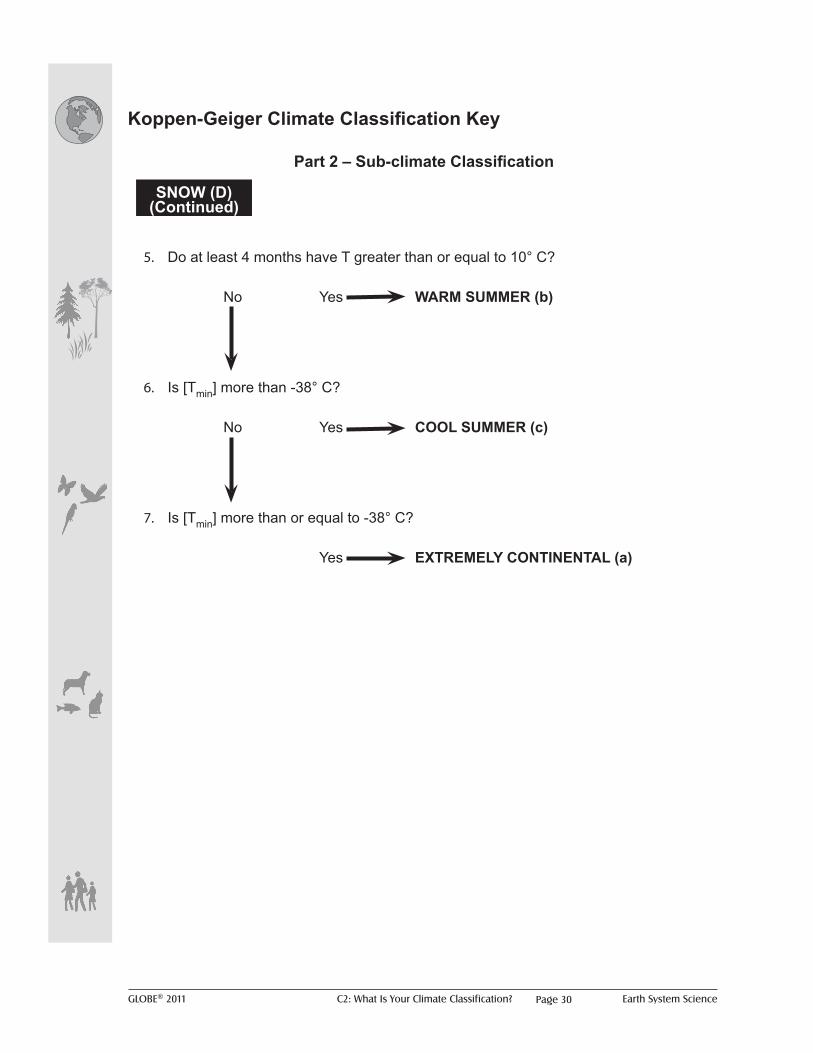
Koppen-Geiger Climate Classification Key
5. Do at least 4 months have T greater than or equal to 10° C?
No Yes WARM SUMMER (b)
6. Is [Tmin] more than -38° C?
No Yes COOL SUMMER (c)
7. Is [Tmin] more than or equal to -38° C?
Yes EXTREMELY CONTINENTAL (a)
Part 2 – Sub-climate Classification
SNOW (D) (Continued)
GLOBE® 2011 C2: What Is Your Climate Classification? Earth System Science
Learning Activity
Protocols A
ppendix Introduction
Welcom
e
Page 31
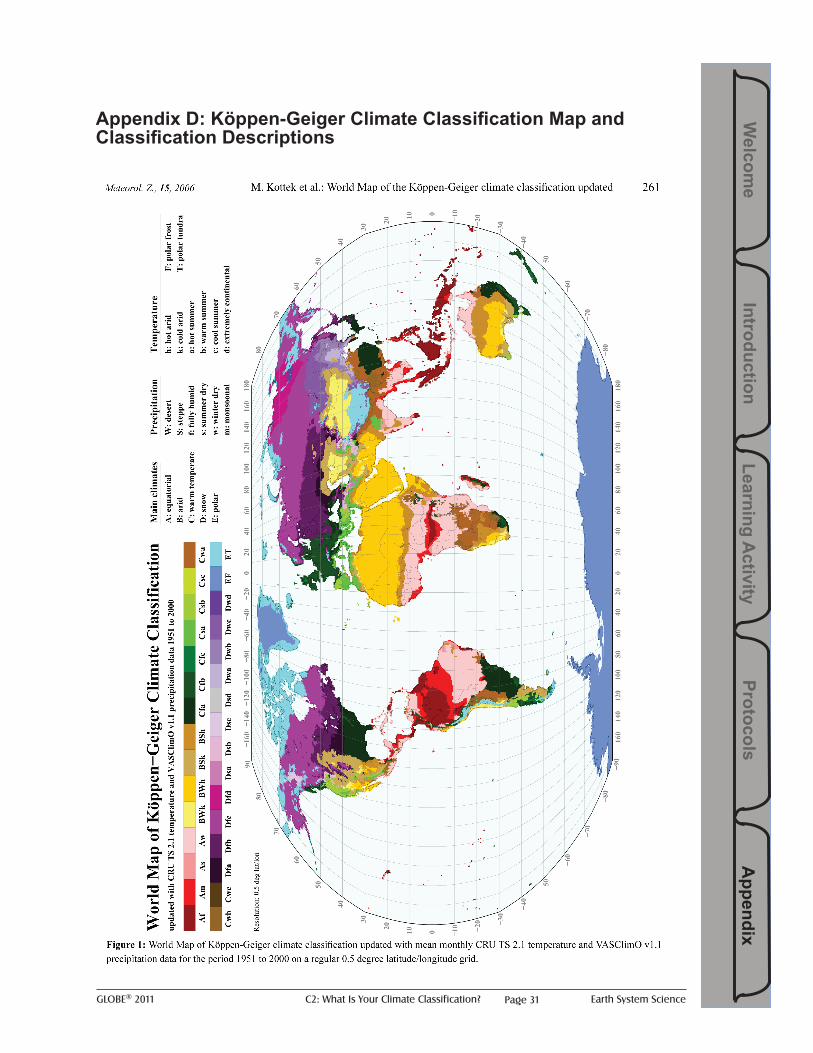
Appendix D: Köppen-Geiger Climate Classification Map and Classification Descriptions
GLOBE® 2011 C2: What Is Your Climate Classification? Earth System SciencePage 32
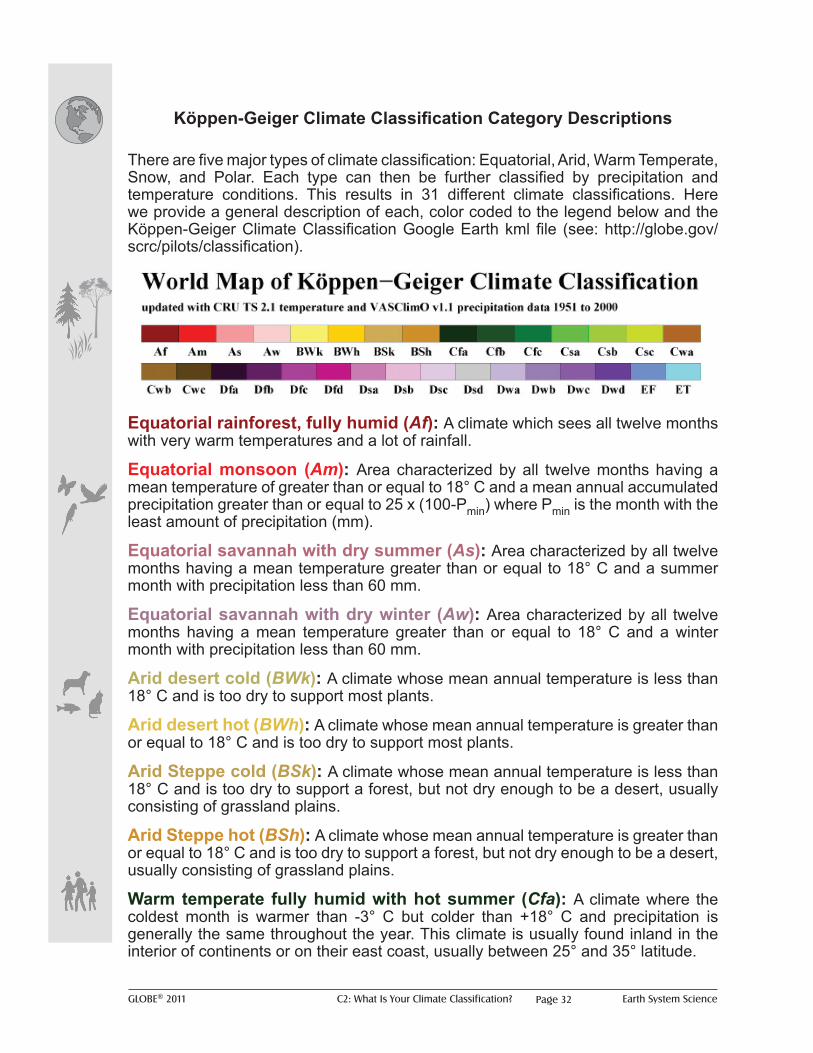
Köppen-Geiger Climate Classification Category Descriptions
There are five major types of climate classification: Equatorial, Arid, Warm Temperate, Snow, and Polar. Each type can then be further classified by precipitation and temperature conditions. This results in 31 different climate classifications. Here we provide a general description of each, color coded to the legend below and the Köppen-Geiger Climate Classification Google Earth kml file (see: http://globe.gov/scrc/pilots/classification).
Equatorial rainforest, fully humid (Af): A climate which sees all twelve months with very warm temperatures and a lot of rainfall.
Equatorial monsoon (Am): Area characterized by all twelve months having a mean temperature of greater than or equal to 18° C and a mean annual accumulated precipitation greater than or equal to 25 x (100-Pmin) where Pmin is the month with the least amount of precipitation (mm).
Equatorial savannah with dry summer (As): Area characterized by all twelve months having a mean temperature greater than or equal to 18° C and a summer month with precipitation less than 60 mm.
Equatorial savannah with dry winter (Aw): Area characterized by all twelve months having a mean temperature greater than or equal to 18° C and a winter month with precipitation less than 60 mm.
Arid desert cold (BWk): A climate whose mean annual temperature is less than 18° C and is too dry to support most plants.
Arid desert hot (BWh): A climate whose mean annual temperature is greater than or equal to 18° C and is too dry to support most plants.
Arid Steppe cold (BSk): A climate whose mean annual temperature is less than 18° C and is too dry to support a forest, but not dry enough to be a desert, usually consisting of grassland plains.
Arid Steppe hot (BSh): A climate whose mean annual temperature is greater than or equal to 18° C and is too dry to support a forest, but not dry enough to be a desert, usually consisting of grassland plains.
Warm temperate fully humid with hot summer (Cfa): A climate where the coldest month is warmer than -3° C but colder than +18° C and precipitation is generally the same throughout the year. This climate is usually found inland in the interior of continents or on their east coast, usually between 25° and 35° latitude.
GLOBE® 2011 C2: What Is Your Climate Classification? Earth System Science
Learning Activity
Protocols A
ppendix Introduction
Welcom
e
Page 33
Köppen-Geiger Climate Classification Category Descriptions
Warm temperate fully humid with warm summer (Cfb): A climate where the coldest month is warmer than -3° C but colder than +18° C and precipitation is generally the same throughout the year. This climate is usually found inland in the interior of continents or on their east coast, usually between 35° and 45° latitude.
Warm temperate fully humid with cool summer (Cfc): A climate where the coldest month is warmer than -3° C but colder than +18° C and precipitation is generally the same throughout the year. This climate is usually found inland in the interior of continents or on their east coast, usually between 45° and 55° latitude, but may extend to 65° latitude.
Warm temperate with dry, hot summer (Csa): A climate where the coldest month is warmer than -3° C but colder than +18° C and summers are dry and hot. This climate is usually found inland on western sides of continents.
Warm temperate with dry, warm summer (Csb): A climate where the coldest month is warmer than -3° C but colder than +18° C and summers are dry and mild. This climate is usually found closer to the coast on western sides of continents.
Warm temperate with dry, cool summer (Csc): A climate where the coldest month is warmer than -3° C but colder than +18° C and summers are dry and cool. This climate is usually found on the western coast of continents, where they are influenced by cold ocean currents.
Warm temperate with dry winter and hot summer (Cwa): A climate where the coldest month is warmer than -3° C but colder than +18° C and dry winters. This climate is also characterized by hot, humid summers and is usually found on the interiors of continents or on their east coast.
Warm temperate with dry winter and warm summer (Cwb): A climate where the coldest month is warmer than -3° C but colder than +18° C and a noticeable difference between the dry winters and rainy summers. This climate is usually found in the highlands of some tropical countries.
Warm temperate with dry winter and cool summer (Cwc): A climate where the coldest month is warmer than -3° C but colder than +18° C and a noticeable difference between the dry winters and rainy summers. This climate is usually found in the highest altitudes of some tropical countries.
Snow with fully humid hot summer (Dfa): A climate where there is at least one month colder than -3° C and precipitation is generally the same throughout the year, and summers can get very hot. This climate is usually found between 35° and 45° latitude.
Snow fully humid warm summer (Dfb): A climate where there is at least one month colder than -3°C and precipitation is generally the same throughout the year. This climate is usually found between 45° and 55° latitude, but may extend up to 60° latitude.
GLOBE® 2011 C2: What Is Your Climate Classification? Earth System SciencePage 34
Köppen-Geiger Climate Classification Category Descriptions
Snow fully humid cool summer (Dfc): A climate where there is at least one month colder than -3° C and precipitation is generally the same throughout the year. This climate is found even further toward the poles, usually found between 45° and 55° latitude, but may extend up to 60° latitude.
Snow fully humid extremely continental (Dfd): A climate where there is at least one month colder than -3° C and precipitation is generally the same throughout the year. This climate is found only in eastern Siberia and is notable for its extreme winter cold.
Snow dry, hot summer (Dsa): A climate where there is at least one month colder than -3° C and summers are dry and hot. This climate is usually at high elevations near locations that are warm temperate with dry, hot summers.
Snow dry, warm summer (Dsb): A climate where there is at least one month colder than -3° C and summers are dry and warm. This climate is usually at even higher elevations near locations that are warm temperate with dry, hot summers.
Snow dry, cool summer (Dsc): A climate where there is at least one month colder than -3° C and summers are dry and warm. This climate is usually at the highest elevations near locations that are warm temperate with dry, hot summers.
Snow dry summer extremely continental (Dsd): A climate where there is at least one month colder than -3° C and winter is wetter than summer. This climate is found only in eastern Siberia and is notable for its extreme winter cold.
Snow dry winter hot summer (Dwa): A climate where there is at least one month colder than -3° C with dry winters and wet summers. This climate is usually found in eastern Asia between 35° and 45° latitude.
Snow dry winter warm summer (Dwb): A climate where there is at least one month colder than -3° C with dry winters and wet summers. This climate is usually found in eastern Asia between 45° and 55° latitude but may extend up to 60° latitude.
Snow dry winter cool summer (Dwc): A climate where there is at least one month colder than -3° C with dry winters and wet summers. This climate is usually found in eastern Asia between 55° and 65° latitude but may extend up to 70° latitude.
Snow dry winter extremely continental (Dwd): A climate where there is at least one month colder than -3°C with dry winters and wet summers. This climate is found only in eastern Siberia and is notable for its extreme winter cold.
Polar frost (EF): A climate where each month is colder than 10° C, but the warmest month is still warmer than 0° C. This climate is generally found on the northern edges of Northern Hemisphere continents and surrounding islands.
Polar tundra (ET): A climate where each month is colder than 0° C. This climate is generally found in Antarctica and inner Greenland.