c105 part 4 applications)
TRANSCRIPT
AB
B -
1
Part 4EMS
ApplicationsOverview
Part 4Part 4EMSEMS
ApplicationsApplicationsOverviewOverview
AB
B -
2Introduction
� State-of-the-Art Suite of Power Applications
� Highly Reliable and Field Tested
� Proven to Deliver the Highest Possible Benefits in Areas of:� Generation Monitoring, Dispatch & Control
� Scheduling of Power
� Network Security Analysis
� Operator’s Training
� Provide the Key to:� Substantial Savings
� Improved Power System Reliability
� Compliance with NERC Policies and regional reliability standards
� Accuracy and Ease of Use Contribute to the Key Objectives

AB
B -
3
AdvancedPower SystemApplications
AdvancedAdvancedPower SystemPower SystemApplicationsApplications
GenerationControl
SchedulingApplications
DispatcherTraining
Simulator
Network Analysis
Optimization &Network Control
Comprehensive Set of Power Applications
� Specifically designed for Energy Management Systems
� Allows the Utility to make modifications and/or additions in response to changes in the electricity market environment

AB
B -
4Benefits
� Standardized User Interface for Power Applications and SCADA Functions
� Fully Integrated Functions� Exchange of Data between Programs and between Functions
� Minimize Operator Intervention
� Automated Triggering of Functions� Based on Events or Periodically
� Results are Easy to Interpret� Designed to Reduce Operator Effort
� Safer Operation for the Network
� Common set of One-Line Diagrams� Same One-Line Diagrams used by SCADA and Apps Functions

AB
B -
5Generation Control Subsystems
� Integrated - Each subsystem performs a portion of the Generation Control Function
GenerationControl
GenerationGenerationControlControl
AutomaticGeneration
Control
AutomaticAutomaticGenerationGeneration
ControlControl
− Regulates the generating unit MW outputs
ReserveMonitoringReserveReserve
MonitoringMonitoring
− Provides economic basepoints and participation factors
− Optional Hydro Hydro CoordinationCoordination function
EconomicDispatch
EconomicEconomicDispatchDispatch
Production CostCalculation
Production CostProduction CostCalculationCalculation
− Calculates and monitors system reserves to meet reliability requirements
− Calculates fuel usage and production costs

AB
B -
6Automatic Generation Control Interfaces
• ACE Calculation• Unit Control Mode• Unit Basepoint• Unit Ramp Schedules
AutomaticGeneration
Control
AutomaticGeneration
Control
Energy Scheduling & Accounting /Transaction Information Management
Energy Scheduling & Accounting /Transaction Information Management
• Net Scheduled Interchange
EconomicDispatch
EconomicDispatch
• Unit Economic Basepoints• Unit Economic Participation Factors
• Unit Connection Status• Unit Control Status• Unit Output• Unit Limits• Unit Ramp Rates
• System frequency• System Time Error• Tie Line Flows
• Setpoint/PulseControl Commands
ISOISOISO
• External ACE• External Unit Data
RT U
or I CC
P
StateEstimator
StateEstimator
• Island Data

AB
B -
7Generation Control Functions
� Closed Loop Control of Internal Generation to Meet Economic, Environmental, and Regulation Requirements
PenaltyFactor
Calculation
PenaltyFactor
Calculation
OptimalPowerFlow
OptimalPowerFlow
EconomicDispatch
EconomicDispatch
NERCCPS1/CPS2/DCS
Calculations
NERCCPS1/CPS2/DCS
Calculations
ProductionCost
Calculation
ProductionCost
Calculation
AutomaticGeneration
Control
AutomaticGeneration
ControlReserve
Monitoring
ReserveMonitoring
SCADASCADASCADA
Network ManagerHistorian
ESAScheduling
ESAScheduling
HydroCoordination
HydroCoordination
EtagEtagEtag
OASISOASISOASIS
StateEstimator
StateEstimator

AB
B -
8Automatic Generation Control
� Regulates System Frequency and Area Net Interchange to the Scheduled Values
� Calculates Area Control Error
� Calculates Desired MW output of the Generating Units placed under AGC control
� Performs Closed-Loop Control of the selected Generating Units
� Support for Jointly Owned Units
� Reduces excessive duty, unit maintenance and repair cost by monitoring unit response and applying operational constraints
� Performs Inadvertent Interchange Payback and Time Error Correction
� Performs Reserve Monitoring
� Compliance with NERC Policy 1 and regional reliability guidelines (WSCC, NWPP)
� Hierarchical Implementation
AutomaticGeneration
Control
AutomaticAutomaticGenerationGeneration
ControlControl

AB
B -
9AGC Closed Loop Control
Retrieve and Filter Telemetered:• Frequency• Time Error• Generator Data• Tie Line Flows• Dynamic Schedules
Retrieve and Filter Telemetered:• Frequency• Time Error• Generator Data• Tie Line Flows• Dynamic Schedules
Calculate theArea Control Error(ACE)
Calculate theArea Control Error(ACE)
Calculate the DesiredMW output for eachGenerating Unit basedon Unit Control Mode andParticipation Factor
Calculate the DesiredMW output for eachGenerating Unit basedon Unit Control Mode andParticipation Factor
Initiate and MonitorControl Actions foreach Generating Unit
Initiate and MonitorControl Actions foreach Generating Unit

AB
B -
10ACE Calculation Methods
� Constant Frequency
� Constant Net Interchange
� Tie Line Bias
� Tie Line Time Bias
� Constant Frequency Time Bias
� Constant Power Production
ACECF = -10 Bf (fa - fs)
ACECNI = Ia - (Is + Iic + Ids) + Ime
ACETLB = ACECF + ACECNI
ACETLTB = ACETLB + 10Bt Dt
ACECFT = ACECF + 10Bt Dt
ACECPP = Pa - Ps + Po
Ia = actual interchange (MW)Is = scheduled interchange (MW)Iic = Inadvertent correction
= Auto payback Rate (MW)or Schedule Offset (MW)
Ids = Net dynamic scheduleIme = Meter error correction
fa = actual frequency (Hz)fs = scheduled frequency (Hz)Bf = frequency bias constant (MW/0.1Hz)Bt = time bias constant (MW/0.1 sec)Dt = actual time error (sec)Pa = actual power production (MW)Ps = scheduled power production (MW)Po = power production offset (MW)

AB
B -
11Unit Control Modes
� AUTO - Automatic
� ECON - Economic
� RAMP - Ramping
� BASE - Baseloaded
� BREG - Baseloaded & Regulating
� SCHD - Scheduled
� SREG - Scheduled & Regulating
� MANL - Manual
� MAND - Manual Dispatch
� AVAL - Available
� UNAV - Unavailable
� TEST - Test Mode
� PUMP - Pumping
� SYNC - Synchronous Condenser

AB
B -
12Generating Unit Limits� High Capability Limit
� High Regulating Limit (Telemetered)
� High Economic Limit
� Up Ramp Rate (Telemetered)
� Low Economic Limit
� Low Regulating Limit (Telemetered)
� Low Capability Limit
� Down Ramp Rate (Telemetered)
� Prohibited Zones
� Minimum Threshold to be on-line
� Regulating range for BREG/SREG units
AB
B -
13Reserve Monitoring
� Unit Reserve Quantities� Unit spinning reserve is the difference between the high regulating
limit and the current output of all the on-line units, limited by the maximum unit response rate for a tunable time period (normally ten minutes)
� Unit ready reserve is the capability limit of the off-line but available units
� System Reserve Quantities� System spinning reserve is the sum of the unit spinning reserves� System ready reserve is the sum of the unit ready reserves� System operating reserve is the sum of system spinning and ready
reserves� The operator may enter system reserve quantity requirements � AGC issues alarms when system reserve requirements are violated
� WSCC and NWPP Reserves� Full compliance with WSCC and NWPP reserve guidelines� Calculation, monitoring, and alarming of reserve requirements for
each category

AB
B -
14Economic Dispatch
Provides Economic Basepoints and Participation Factors
EconomicDispatch
EconomicDispatch
� Establishes the Optimum MW Basepoints for Generating Units in a manner that :� Minimizes Total System Production Cost
� Considers the Effects of Transmission Losses
� Respects Unit Economic and Response Rate Limits
� Ability to Utilize Selective:� Heat Rate Curves
� Fuel Cost
� Water Values (Hydro Dispatch)
� Marginal Water Rate Curves (Hydro Dispatch)
� Supports combined cycle units and JOUs
� Event-triggered executions following relevant changes in system or generating unit conditions
� Supports multiple prohibited zones

AB
B -
15Economic Dispatch (Cont’d)
� Executes Periodically� Prevents Excessive Event
Triggered Executions
� Time Period is Tunable
� Executes Automatically as a result of the following Events:� Control Area Load Changes
Significantly since the Last Basepoint Calculation
� Control Area Net Interchange Changes Significantly since the Last Basepoint Calculation
� Dispatch Status of Generating Unit Changes
� AGC Adjusts the Economic Basepoint of Generating Unit
� Operator Modifies Generating Unit Fuel Cost or Heat Rate Curve Data
� Executes on Operator Demand
� Use of Real-Time Penalty Factors, derived from the State Estimator results (if available)� Account for Transmission Losses
� Provides the most Accurate Analysis
� Ensures the Maximum Possible Fuel Savings
� Supports Multiple IHR Curves and Fuel Types per generating unit
� Equal Lambda or Constrained Dynamic Dispatch algorithms
� Transmission Constraints taken into account through an interface with Optimal Power Flow
� Unit ramp rates, economic limits, and regulating limits are also considered during dispatch

AB
B -
16Hydro Coordination (option)
� Provides real-time Control and Management of the Hydro Power Plants and the associated Water Resources
� Follows and Maintains a short-term Hydro Optimization Plan:� Reservoir Elevation� Natural Water Inflow Projections� Reservoir Water Value� Reservoir Sensitivity Factor� Unit MW Generation
� Provides real-time Control Actions that correct deviations from the Plan
� Calculates and provides information about the current Hydro Network Topology
� Produces results that are used by the Economic Dispatch function for a combined Hydro-Thermal Dispatch
HydroCoordination
HydroCoordination
Real-Time Monitoring and Dispatch of the Hydroelectric Plants and Associated Water Resources

AB
B -
17
� Provide Short-Term Decision Making Tools to determine the Most Economic Scheduling of Generation & Interchange Transactions
� The results of these Programs have a Significant Impact on theCost of Operations and the Cost of Electricity Production
Scheduling Applications
SchedulingApplicationsSchedulingScheduling
ApplicationsApplicationsShort Term
Load ForecastingResource
Scheduling
EnergyScheduling
& Accounting
* OASIS + TIM are options within ESA
OASISInterface *
TransactionInformation
Management *

AB
B -
18Scheduling Applications Overview� Optimal Scheduling of Generation and Interchange Transactions
to Minimize Total System Operating Cost
ThermalUnit
Commitment
ThermalUnit
Commitment
Short TermLoad
Forecasting
Short TermLoad
Forecasting
AutomaticGeneration
Control
AutomaticGeneration
ControlDispatcherLoad Flow
DispatcherLoad Flow
TransactionEvaluationEconomy A
TransactionEvaluationEconomy A
TransactionEvaluationEconomy B
TransactionEvaluationEconomy B
InterchangeScheduling
(ESA or TIM)
Resource Scheduling
PenaltyFactor
Calculation
PenaltyFactor
Calculation

AB
B -
19Significant Features & Benefits
� Models used are the same as those used in real-time software� Ensures Consistency between
Planning & Real-Time Activities
� Ensures Accurate Implementation of Strategies
� Very Rigorous Optimization Algorithms are used� Effectively Minimize Production Cost
� Operational Strategies will always be feasible
� Solution Techniques reduce computer time and increase responsiveness
� Real-Time Penalty Factors provide most accurate information on losses within the Transmission System
� Interactive User Interface

AB
B -
20Energy Scheduling & Accounting
� Oracle-based ESA consists of two functions: Energy Accounting and Interchange Scheduling
� Fast & accurate Energy Accounting Calculations, with on-line capability to update Independent Accounts and Calculation Definitions
� Optional ODBC interface to support Windows clients (Excel spreadsheets)
� Transaction Information Management (TIM) provides interchange scheduling functionality compliant with NERC Policy 3 (Electronic Tagging)
� Conventional Interchange Scheduling tool if NERC Etag is not required
� Automated OASIS Interface
Energy Scheduling& Accounting
Energy Scheduling& Accounting
Energy Scheduling
Energy Accounting

AB
B -
21Energy Scheduling & Accounting (Cont’d)
Network Manager Run-TimeData Structures
Network Manager EMS DATA
Network Manager Run-TimeData Structures
Network Manager EMS DATA
Periodic Data Collection:� Generation� Load� Interchange Transaction� etc.
Schedule Data
to PC LAN
ODBC access to datausing:� MS Excel� MS Access� etc.
Network Manager ConsoleNetwork Manager Console
View / Edit:� Tabular Displays� Graphical Displays� On-Line Update� Daily, Weekly, Monthlyand Yearly Reports
� etc.
PowerfulGraphics
User Defined Reports:� Automatic Printing� Multiple Fonts� Screen Preview� Report Designer� etc.
4GL Access
ORACLE DatabaseLong Term
Data Retention

AB
B -
22ESA Accounting
� Collects, Calculates and Retains energy values from the Network Manager Database, on a periodic basis
� Retains Data in the Oracle RDBMS
� Retains Results for a User Specified Historical Period
Network Manager System
ESADB
DataCollection
DataCollection
DataCalculation
DataCalculation
AccountDefinition
CalculationDefinition
AccountData
Update
AccountData
Update
Oracle
AB
B -
23ESA Accounting (Cont’d)
� A Graphical User Interface provides a flexible and intuitive means for review and editing of future and historical data � The graphical tools allow visualization of the data using line
graphs, bar charts, pie charts, etc.
� Maximum Flexibility for On-Line Definition of Calculations (dependent accounts) and Reports

AB
B -
24Interchange Scheduling (conventional)
� Allows EMS Operators to Schedule Interchange Transactions with NeighboringUtility Companies:� Energy� Wheeling� Reserve� Joint Owned Units� Etc.
� Access to Interchange Schedule which Presents Future and Historical Data
NeighborUtilityCompany
ESA Scheduling
ActiveSchedules
Automatic Generation Control
FutureSchedules
NeighborUtilityCompany
AB
B -
25ESA Scheduling
� Interchange schedules consist of hourly MW level and price data values
� A Graphical User Interface serves as the operator interfaceto the ESA Scheduling function. � Interchange Schedule display presents future and historical
schedule data,
� Active Schedule Summary display presents active and impending schedules
� Schedule Overview display presents hourly and daily scheduletotals on a company and control area basis
� Calculates the Area Net Scheduled Interchange for AGC
AB
B -
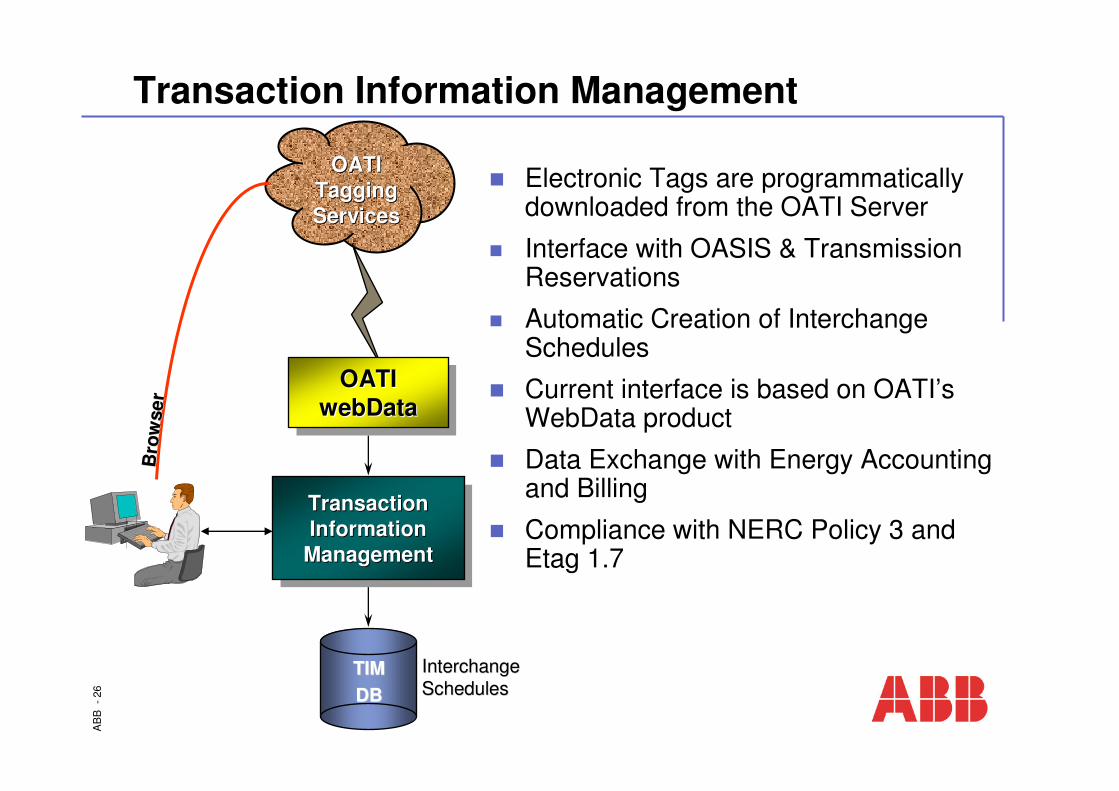
26Transaction Information Management
� Electronic Tags are programmatically downloaded from the OATI Server
� Interface with OASIS & Transmission Reservations
� Automatic Creation of Interchange Schedules
� Current interface is based on OATI’sWebData product
� Data Exchange with Energy Accounting and Billing
� Compliance with NERC Policy 3 and Etag 1.7
OATIOATITaggingTaggingServicesServices
OATIwebData
OATIOATIwebDatawebData
TransactionInformation
Management
TransactionTransactionInformationInformation
ManagementManagement
TIMTIMDBDB
Bro
wse
rB
row
ser
InterchangeInterchangeSchedulesSchedules
AB
B -
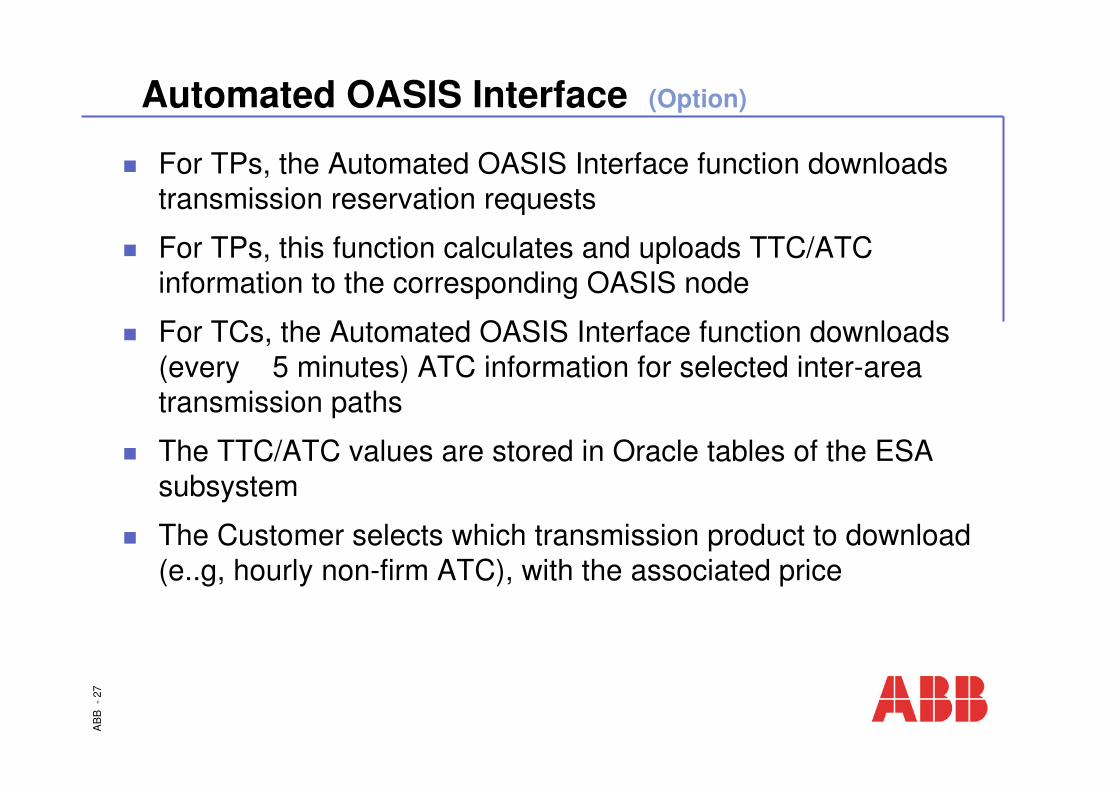
27Automated OASIS Interface (Option)
� For TPs, the Automated OASIS Interface function downloads transmission reservation requests
� For TPs, this function calculates and uploads TTC/ATC information to the corresponding OASIS node
� For TCs, the Automated OASIS Interface function downloads (every 5 minutes) ATC information for selected inter-area transmission paths
� The TTC/ATC values are stored in Oracle tables of the ESA subsystem
� The Customer selects which transmission product to download (e..g, hourly non-firm ATC), with the associated price

AB
B -
28Automated OASIS Interface
FirewallFirewall
InternetInternetInternet
Network ManagerApplications
Server
OASISNode
OASISOASISNodeNode
OracleRDBMS
WEB Server
WEB Browser+
Applications
HTTPHTTP
Transactionand Security
DatabaseATC ATC TTCTTC

AB
B -
29Automated OASIS Interface1. Capability to enter, modify, confirm, & view transmission
reservations
2. Capability to post and view source & sink information for transmission reservations
3. Capability to post secondary capacity for resale
4. Capability to post and view ATC information and data to back up studies
5. Capability to post and view transmission status details: system configuration and facility status
6. Capability to post and view advance notice of pending or possible curtailments
7. Capability to post and view pricing, discount information, including options
8. Capability to post and view curtailments with reason
AB
B -
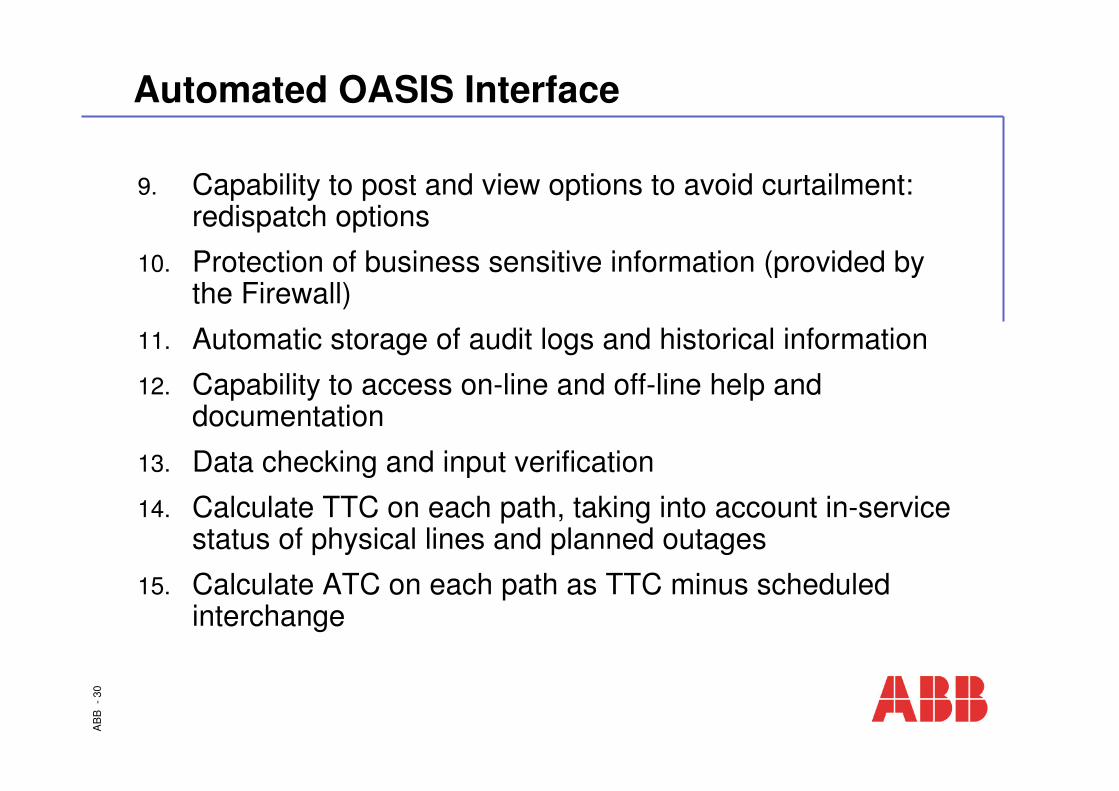
30Automated OASIS Interface
9. Capability to post and view options to avoid curtailment: redispatch options
10. Protection of business sensitive information (provided by the Firewall)
11. Automatic storage of audit logs and historical information
12. Capability to access on-line and off-line help and documentation
13. Data checking and input verification
14. Calculate TTC on each path, taking into account in-service status of physical lines and planned outages
15. Calculate ATC on each path as TTC minus scheduled interchange

AB
B -
31Automated OASIS Interface
Historian MMI Server Windows NT
Tradewaveproxy
RASUNIX
Network Manager
Applications
GSS
To Web Server
Network Manager
proxy
AB
B -
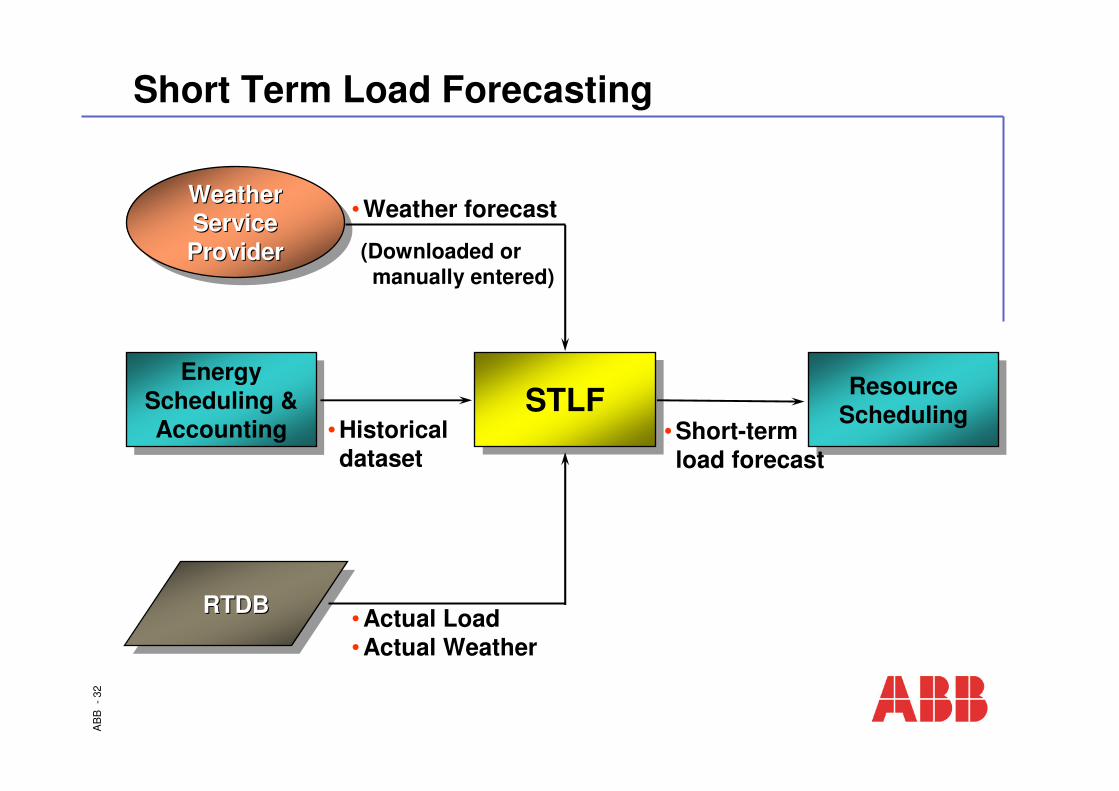
32Short Term Load Forecasting
ResourceSchedulingResource
SchedulingSTLFSTLFEnergy
Scheduling &Accounting
EnergyScheduling &Accounting •Historical
dataset•Short-term load forecast
•Weather forecast
•Actual Load•Actual Weather
WeatherServiceProvider
WeatherWeatherServiceServiceProviderProvider
RTDBRTDBRTDB
(Downloaded or manually entered)
AB
B -
33Short Term Load Forecasting
� Accurate prediction of the native load, with lead times ranging from one hour to seven days ahead (configurable)
� Supports multiple forecast areas
� Supports multiple simultaneous users
� Processes the different patterns that characterize the system load (daily, weekly and seasonal)
� Models the correlation between the load and the weather� Automated or manual retrieval of weather forecast from external sources
(Weather Service Providers) or internal PC files
� Supports multiple weather variables:� temperature� relative humidity� wind speed and wind direction� cloud cover

AB
B -
34Forecasting Techniques
� STLF provides two alternative Forecast Engines:
Short-Term Load Forecasting
Neural Network Technique
Pattern Matching (Similar Day) Technique

AB
B -
35Neural Network Method
� This method uses Artificial Neural Networks for pattern recognition and short-to-mid-term load prediction
� Multiple sets of Neural Networks, for each of the different day types
� Improved performance of the neural network training process allows daily retraining of the Neural Networks

AB
B -
36
TRAINNETWORK
TRAINNETWORK
Neural NetworkStructureDefinition
Neural NetworkStructureDefinition
Neural NetworkWeights and
Activation
Neural NetworkWeights and
Activation
Neural NetworkFeature
Definitions
Neural NetworkFeature
Definitions
FORECASTNETWORK
FORECASTNETWORK
ForecastResults
ForecastResults
HistoricalLoad & Weather
Data
HistoricalLoad & Weather
Data
ForecastWeather
Input
ForecastWeather
Input
Neural Network Forecast Overview

AB
B -
37Pattern Matching (Similar Day) Method
� PMLF compares the current conditions, i.e., day type, day of the year, and weather forecast to historical data profiles for the best match
� For every match, an index is computed that is a measure of the quality of the match
� Tunable period for Historical Data Searching, typically set to:� Two most recent months of historical data with the same day-type as
the forecast date
� In case of last year’s historical data, use one month before and one month after the forecast date with the same day-type
� Midnight Smoothing capability
AB
B -
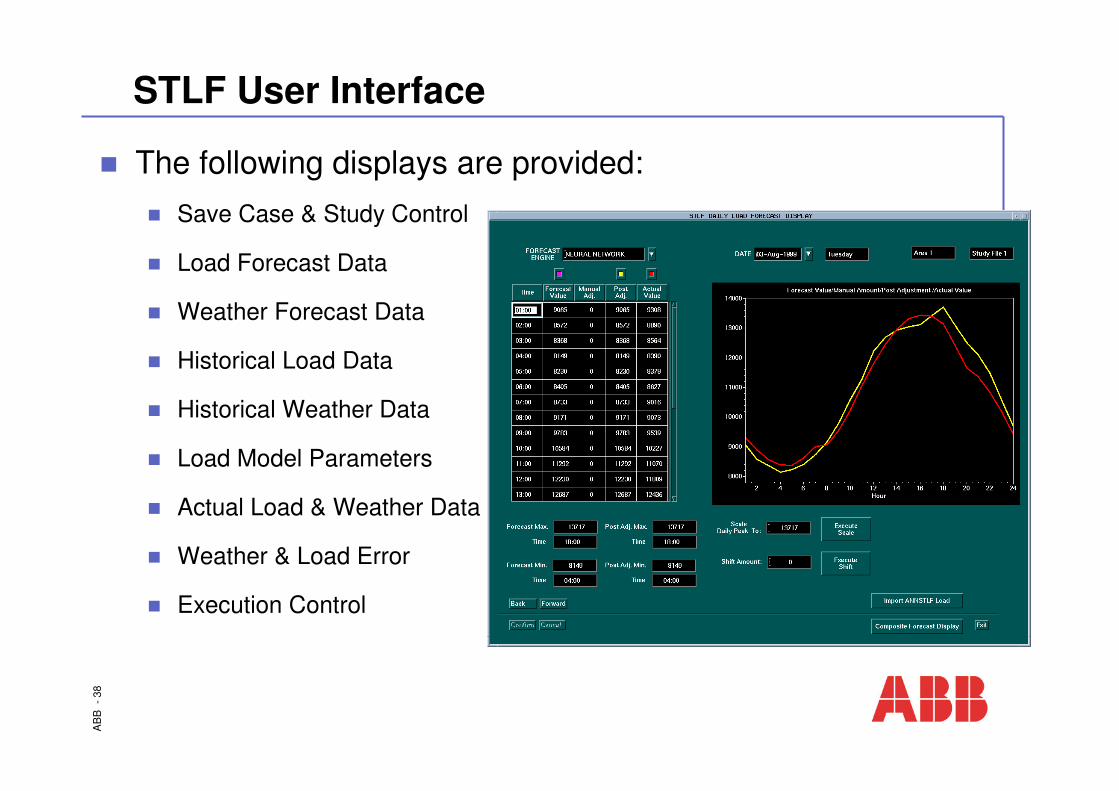
38STLF User Interface
� The following displays are provided:� Save Case & Study Control
� Load Forecast Data
� Weather Forecast Data
� Historical Load Data
� Historical Weather Data
� Load Model Parameters
� Actual Load & Weather Data
� Weather & Load Error
� Execution Control

AB
B -
39STLF Error Analysis and Forecast Adjustment
Actual Load Original Forecast Adjusted Forecast
� After the fact analysis compares actual and forecasted load and weather data for each area

AB
B -
40STLF Three-Tier Architecture
DatabaseLayer
ApplicationLayer
GUILayer
STLF EXECUTABLESTLF EXECUTABLE
STLFUser Interface
GUI BUILDERDatabase Xcessory
GUI BUILDERDatabase Xcessory
RDBSHL
STLF tablesOracle RDBMS
Standard SQL access for easy data sharing across the corporate LAN

AB
B -
41
Resource SchedulingResource Resource SchedulingScheduling
TRANSACTIONEVALUATIONECONOMY B
TRANSACTIONEVALUATIONECONOMY B
TRANSACTIONEVALUATIONECONOMY A
TRANSACTIONEVALUATIONECONOMY A
UNITCOMMITMENT
UNITCOMMITMENT
AFTER-THE-FACTEVALUATION
AFTER-THE-FACTEVALUATION
CASECOMPARISON
CASECOMPARISONRECOSTINGRECOSTING
Resource Scheduling

AB
B -
42Resource Scheduling Functions
� Unit Commitment (UC)� Determine the schedules for bringing the generating units on-line or
off-line to minimize the overall system operating cost.
� Transaction Evaluation Economy A (TEA)� Evaluate proposed interchange transactions with the generating
unit status unchanged.
� Transaction Evaluation Economy B (TEB)� Evaluate proposed interchange transactions with possible changes
in generating unit status
� Block Mode Analysis (BM)� Evaluate a single interchange in steps

AB
B -
43Resource Scheduling Functions
� Case Comparison (CC)� Side-by-side comparison with Significant Deviation Limits as filter
� After-the-Fact Evaluation (AFE)� Current Operating Plan (COP), Actual Operation and Ideal
Operation
� Recosting (RC)� Recalculate costs for user-defined changes to the input data
using an economic dispatch calculation for the affected hours

AB
B -
44Resource Scheduling Objectives
� The main objectives of the RS subsystem are to:� Obtain a feasible schedule for the generating units using
optimization techniques such that the total cumulative operatingcost is minimized
� Obtain an economic selection (and dispatch) from purchase and sale transaction opportunities
� Enforce the system and unit constraints

AB
B -
45Resource Scheduling Objectives
� System Constraints:� Total Power System Load
Requirement
� Reserve Requirement
� Scheduled Interchange Requirement
� Fuel and Emission Constraints
� Generating Unit parameters:� Unit startup cost (fixed or
polynomial equation)
� Unit shutdown cost
� Fixed & variable maintenance cost
� Unit Penalty Factors
� Unit Efficiency
� Generating Unit Constraints:� Unit Limit Constraints
� Unit Response Rate
� Unit Minimum Uptime and Minimum Downtime
� Unit Scheduled Mode
� Startup and Shutdown Costs
� Power Station and Generating Unit Startup Constraint
� Fuel Switching
� Prohibited Zones
The resulting schedules will satisfy the following system and generating unit constraints for each time interval in the study period:
AB
B -
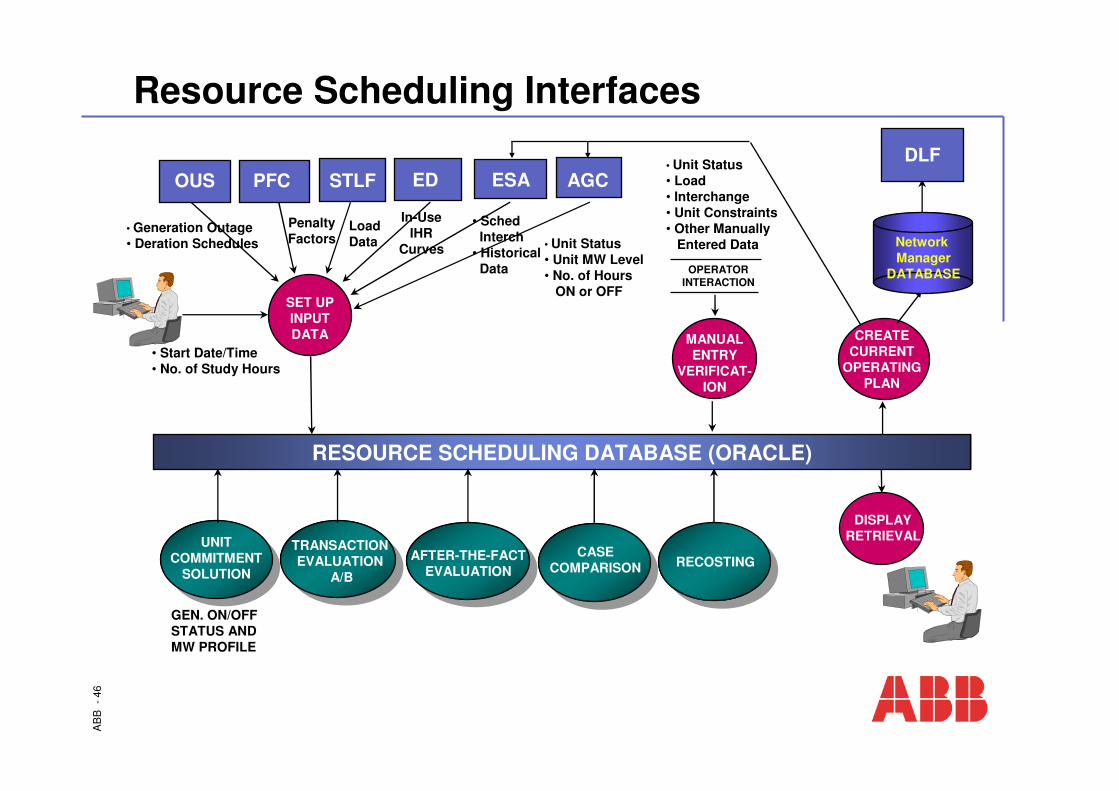
46Resource Scheduling Interfaces
PFC STLF ED
SET UPINPUTDATA
• Unit Status• Unit MW Level• No. of Hours
ON or OFF
In-UseIHR
Curves
LoadData
PenaltyFactors
• Start Date/Time• No. of Study Hours
MANUALENTRY
VERIFICAT-ION
• Unit Status• Load• Interchange• Unit Constraints• Other Manually
Entered Data
UNITCOMMITMENT
SOLUTION
TRANSACTIONEVALUATION
A/B
GEN. ON/OFFSTATUS AND MW PROFILE
CREATECURRENT
OPERATINGPLAN
RESOURCE SCHEDULING DATABASE (ORACLE)
OPERATORINTERACTION
ESARPSRPS
AGC
• SchedInterch
• HistoricalData
DLF
DISPLAYRETRIEVAL
OUS
• Generation Outage• Deration Schedules
AFTER-THE-FACTEVALUATION
CASECOMPARISON RECOSTING
Network Manager
DATABASE
AB
B -
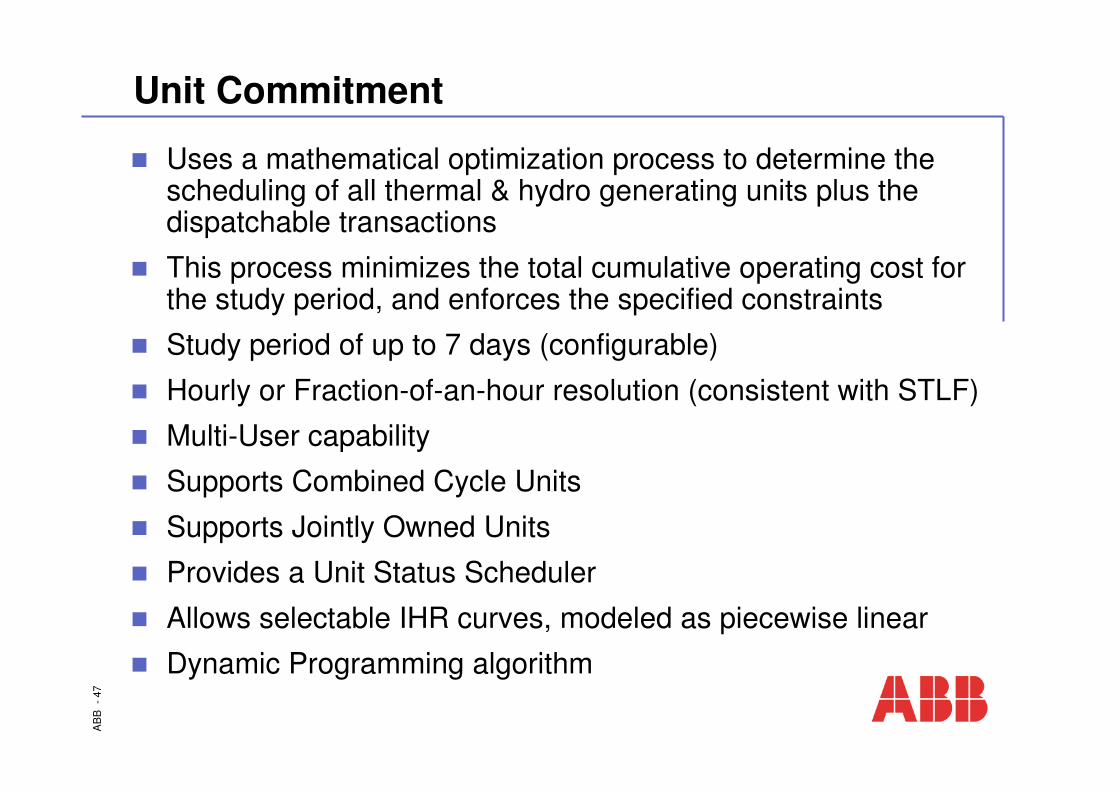
47Unit Commitment
� Uses a mathematical optimization process to determine the scheduling of all thermal & hydro generating units plus the dispatchable transactions
� This process minimizes the total cumulative operating cost for the study period, and enforces the specified constraints
� Study period of up to 7 days (configurable)
� Hourly or Fraction-of-an-hour resolution (consistent with STLF)
� Multi-User capability
� Supports Combined Cycle Units
� Supports Jointly Owned Units
� Provides a Unit Status Scheduler
� Allows selectable IHR curves, modeled as piecewise linear
� Dynamic Programming algorithm

AB
B -
48Unit Commitment
� SQL Relational Database (Oracle)
� Graphical User Interface (Oracle Forms)
� Event Summaries
� Data Validation capability
� Save Cases
� Current Operating Plan
� Case Comparison capability

AB
B -
49Transaction Evaluation Economy A
� Provides a convenient method for the operator to evaluate costs, for a given hour, associated with proposed interchanges of energy with interconnected neighboring utilities
� Starts from a valid UC solution
� Real time data initialization (AGC/ED) for current hour studies� In use IHR curves
� In use fuels
� No recommitment
� After the evaluation is performed:� Use Option Menu to view either UC or TEA results on all output displays
� Case Comparison function performs side-by-side comparison and displays only those results where the difference between the active and the comparison case is greater than a percentage significant deviation limit

AB
B -
50Transaction Evaluation Economy B
� Provides a convenient method for the operator to evaluate the cost associated with proposed interchanges of energy with interconnected neighboring utilities
� TEB performs a full unit commitment study with the proposed transaction
� The difference with respect to the base case provides the necessary information to evaluate the transaction
� The user may analyze a transaction as fixed or dispatchable purchase:� Fixed:
� Transaction Price� Fixed Transaction MW
� Dispatchable purchase:� Transaction Price� Min and Max Transaction MW
� Dispatchable transactions can be characterized by a capacity, a fixed cost and an incremental cost.

AB
B -
51Transaction Evaluation Economy B
� After the evaluation is performed:� Use Option Menu to view either UC or TEB results on all output
displays
� Case Comparison function performs side-by-side comparison and displays only those results where the difference between the active and the comparison case is greater than a percentage significant deviation limit

AB
B -
52RS Three-Tier Architecture
DatabaseLayer
ApplicationLayer
GUILayer
RS EXECUTABLERS EXECUTABLERS EXECUTABLE
RSRSUser InterfaceUser Interface
GUI BUILDERDatabase Xcessory
GUI BUILDERDatabase Xcessory
RDBSHL
RS tablesOracle RDBMS
Standard SQL access for easy data sharing across the corporate LAN

AB
B -
53
NetworkApplications
NetworkApplications

AB
B -
54Network Applications
� The Network Applications system contains both real-time and study mode programs which are concerned with:� The steady state analysis
� Optimization and control of the electric power system network, with a primary emphasis on the network integrity and security.
� These functions deal with such tasks as:� Determining network topology
� Estimating bus voltages and circuit flows
� Determining abnormal conditions for predefined contingencies
� Computing optimal control actions to correct abnormal conditions and
� Applying the control actions in a closed loop manner.

AB
B -
55Introduction
� Today’s Limited Budgets & Downsizing of Utility Personnel make Network Analysis software beneficial to Utilities:� Functional Capabilities enable
postponement of major capital equipment because present equipment can be operated closer to its limit
� Fully Integrated with SCADA & EMS Functions
� Same set of One-Line Diagrams used in SCADA are also used in State Estimation & Study
� The Network Manager Network Analysis functions provide� Ability to Obtain the Best Estimate
of the Power System State
� Ability to Develop Strategies to Maintain Service and keep Power System Secure prior to removing equipment for maintenance
� Tools for Developing Strategies to provide a more secure power system
� Data for Optimization and Network Control Functions which can provide the control actions necessary to operate the system under optimal and safe economic conditions (which results in real savings)
� Multi-user Capability

AB
B -
56Network Applications
� State-of-the-Art Mathematical Algorithms and Numerical Techniques Provide Outstanding Accuracy and Performance
� Multi-User Capability for Study Functions
� Operator Friendly Interfaces� e.g., Point & Click Procedures and Graphical Displays
� Enhances Network Security through Interfaces with SCADA/AGC
� Allows the Operators to perform “What If?” Scenarios on Power System Network.
AB
B -
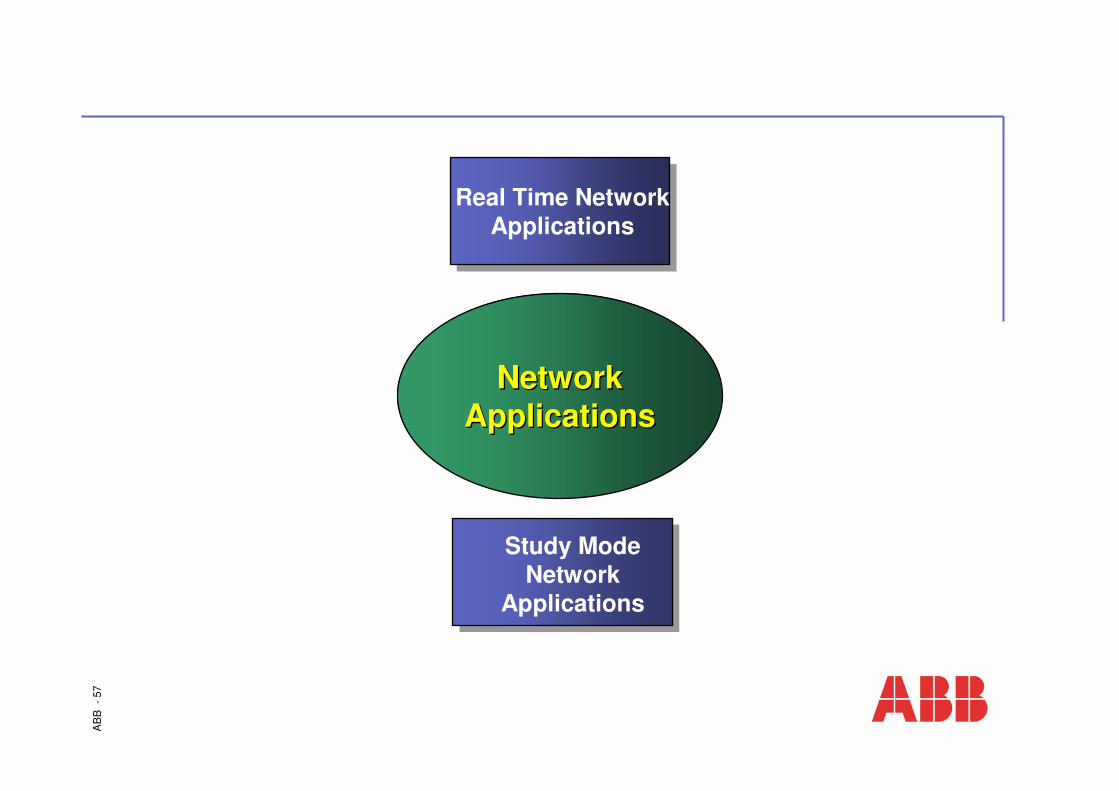
57
NetworkNetworkApplicationsApplications
Real Time NetworkApplications
Study ModeNetwork
Applications

AB
B -
58Overview of Real-Time Network Applications
SCADA
ProductionScheduling Generation
ControlSCADA
SaveCasesSchedules
EquipmentStatus
Processor
SystemStatus
Processor
StateEstimation
OutageScheduler
Quick StabilityAssessment
SecurityMonitor
Real-TimeContingency
Constrained OPF
Real -TimeOPF
ContingencySelection
& Analysis
PenaltyFactor
Calculation
Study ModeNetwork Analysisand Optimization
Mapboard/Displays
Reactive PowerScheduling
TTCCalculations
Look AheadContingency
Analysis
RemedialActions
EMSFault
Calculation
VoltageSecurity
Assessment
DynamicSecurity
Assessment
Check BeforeControl
DistributionSubstation
Control
AB
B -
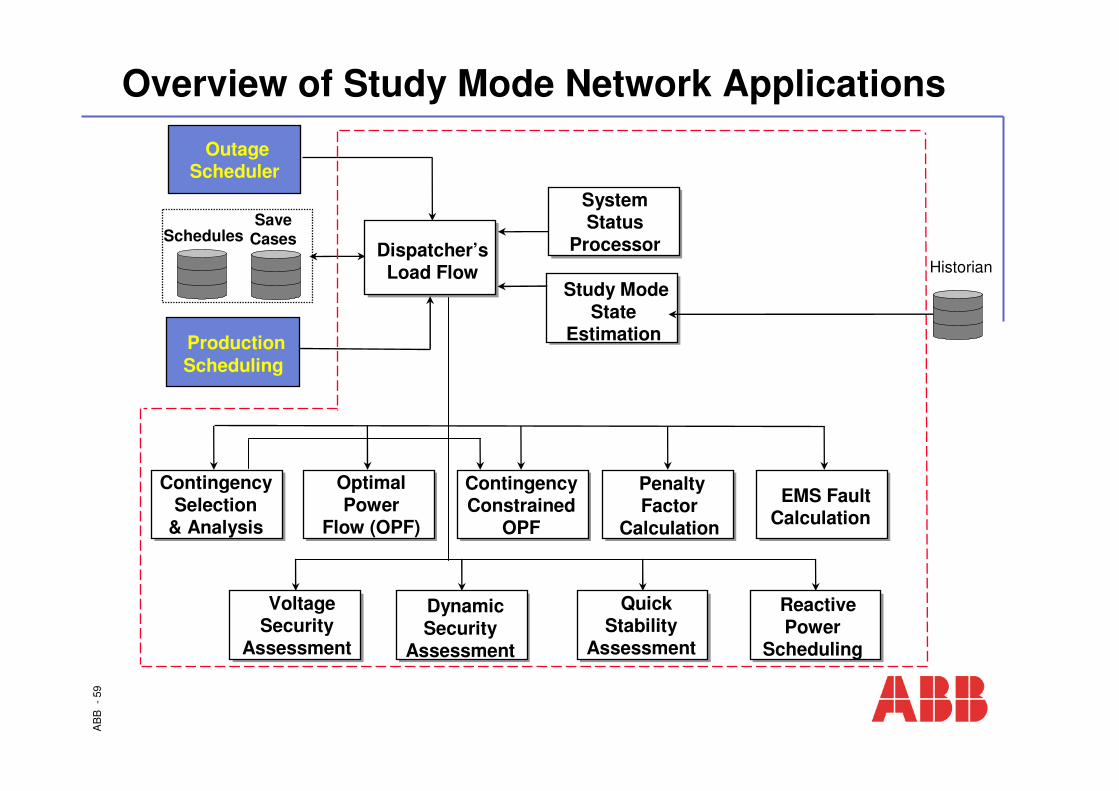
59Overview of Study Mode Network Applications
ProductionScheduling
SystemStatus
Processor
Study Mode State
Estimation
Dispatcher’sLoad Flow
EMS FaultCalculation
PenaltyFactor
Calculation
ContingencyConstrained
OPF
OptimalPower
Flow (OPF)
ContingencySelection
& Analysis
SaveCasesSchedules
OutageScheduler
VoltageSecurity
Assessment
DynamicSecurity
Assessment
QuickStability
Assessment
ReactivePower
Scheduling
Historian

AB
B -
60
SystemStatus
Processor EquipmentStatus
Processor
StateEstimation
Dispatcher’sLoad Flow
ContingencyAnalysis
PenaltyFactor
CalculationOutage
Scheduler
SecurityMonitor
NetworkReduction
MeterPlacement
Study
DistributionSubstation
Control
EMS FaultCalculation
OptimalPowerFlow
VoltageSecurity
Assessment
DynamicSecurity
Assessment
ReactivePower
Scheduling
TTCCalculations
QuickStability
Assessment
NetworkNetworkApplicationsApplications

AB
B -
61System Status Processor
� Establishes the Topology of the Power System Network Model
� Determines the Status of Breakers & Switches
� Determines the in/out-of-service Status of all Equipment
� Determines bus bar connectivity
� Establishes Load Flow Busses
� Detects Multiple Islands and Determines the energization state of each island
� Detects any change in Network Configuration
� Executes in Both Real-Time & Study Mode

AB
B -
62Equipment Status Processor
� Establishes the Raw Configuration of the Power System Network Model Resulting from any Status Point Changes
� Used to Dynamically Color Station One-Line Displays
� Provides the Interface between the Scanned Real-Time Equipment Status and the Mapboard Representation of this Equipment (drives mapboard lamps)

AB
B -
63Equipment Status Processor (cont)
� Determines Energization Status For:� Generators
� Circuits and Transformers
� Shunt Elements
� Loads
� Bus bars
� Can Determine “grounding” status, “one-end open” and “islanding”

AB
B -
64State Estimation
� Determines the “Best Estimate” of the State of the Power System Network Model
� Produces an Assessment of the Reliability and Accuracy of the Real-Time Database by performing Error Detection of two types of measurement Errors:� Gross Measurement Errors (Large
Measurement Errors)
� Bias Measurement Errors (Small constant magnitude Measurement Errors)
� Internal and External Areas Solved Simultaneously
� Solves Multiple Islands
� Calculates the Following:� Voltage and Angles for all Load Flow
Busses
� MW, MVAR, MVA, Ampere Flows through all Transmission Lines and Transformers
� MW and MVAR Injections for all the Load & Generation Points
� Estimates Transformer Tap Positions (Phase Shifters & TCUL)
� Pseudo Measurements when Telemetry is Invalid or Missing
� Load and Generation Points
� Generating Units
� Voltage Magnitude on Regulated Busses

AB
B -
65State Estimation
� Decoupled Weight-Least-Squares Algorithms
� Quality Flags in RTDB for Bad Measurements
� Exponential Smoothing of Measurement Residuals (BIAS Calculations)
� Automatic Update of Bus Injection Allocation Files
� Field Experience (examples)� California ISO 12,000 Busses
� Comisión Federal de Electricidad (CFE) 1,200 Busses
� Dubai Electricity & Water Authority (DEWA) 1,000 Busses
� Power Pool of Alberta (PPoA) 1,000 Busses
� CAMMESA 1,200 Busses
� Potomac Electric Power (PEPCO) 2,500 Busses
� New York State Electric & Gas (NYSEG) 2,500 Busses

AB
B -
66State Estimator
StateEstimation
Telemetry Datafrom SCADA
Telemetry Datafrom SCADA
Neighbor UtilityData from
Data Links (CCR)
Neighbor UtilityData from
Data Links (CCR)
Network Topology from
SSP
Network Topology from
SSP
Network Solution:
•MW, MVA, MVAR for Transmission Lines & Transformers
•MW & MVAR Injection for Load & Generation Sources
•Estimated Transformer & Phase ShifterTap Positions
Network Solution:
•MW, MVA, MVAR for Transmission Lines & Transformers
•MW & MVAR Injection for Load & Generation Sources
•Estimated Transformer & Phase ShifterTap Positions
Overloaded Linesand Transformers
Overloaded Linesand Transformers
ContingencyAnalysis
List
Alarms Generated For:
•Bad Data•Circuit Overloads•Bus Voltage Violations•Steady State Not Achieved•Network Topology Error
Alarms Generated For:
•Bad Data•Circuit Overloads•Bus Voltage Violations•Steady State Not Achieved•Network Topology Error
SAVECASES
Results Available forOperator Viewing
AB
B -
67Study-Mode State Estimation
� Similar to real-time State Estimation, but estimates the network solution using meter data from the Historian
� Operator can enter date and time to retrieve snapshot of Power System from Historian
� Provides all capabilities of Real-time State Estimator

AB
B -
68Dispatchers Load Flow� Interactive Study Mode Function which lets the Operator Set-Up
and Analyze Different Operating Conditions of the Power System Network Model
� Uses State Estimation Results as Starting Point
� Operator can Change the Following:� In/Out-of-Service Status of Network Equipment
� Operating Limits of Network Equipment
� Enable/Disable Regulation Capabilities such as:� MW Interchange Control
� Phase Shifting Transformer Power Flow Control
� Voltage Regulation by Shunt Capacitor and Reactor Banks
� Output of Generating Units & Generation Points
� Load Data

AB
B -
69Dispatchers Load Flow� Data may be Input from:
� Thermal Unit Commitment
� Energy Scheduling & Accounting
� Economic Dispatch
� Outage Scheduler
� Calculates the Following:� Voltage and Angles for all Load Flow Busses
� MW, MVAR, MVA, Ampere Flows and MW Losses through all Transmission Lines and Transformers
� MW and MVAR Output of all Generation Points
� Tap Position of TCUL & Phase Shifting Transformers
� Summary of MW and MVAR Load, Generation, and Losses for the Areas, Islands and the Entire System
� Provides a Side by Side Comparison of Two Load Flow Solution Cases

AB
B -
70Dispatchers Load Flow
� Allows Multiple Users� Input and Output in IEEE and PTI’s PSS/E formats� Test Case Initialization� Regulation Capabilities Include:
� Area Net Interchange Control� Phase Shifter Active Power Flow Control� Regulated Bus Bar Voltage Magnitude by:
� TCUL Transformers� Shunt Capacitor / Reactor Banks� Generating Units� External Area Generation Source
� Solution is Based on the Following Two Techniques:� Fast Decoupled� Fully Coupled Newton Raphson

AB
B -
71DLF Interface with Power Applications Software
StateEstimation
Dispatcher’sLoad Flow
DLFSAVE
CASES
SESAVE
CASES
ContingencyAnalysis
(Study Mode)
SystemStatus
Processor
NetworkTopology
Data
NetworkTopology
Data
DatabaseGeneration
Power SystemNetwork
Data
Power SystemNetwork
Data
Base caseand optimal
control
Base caseand optimal
control
EquipmentOutage
Data
EquipmentOutage
Data
MW Gen. &Load Data
MW Gen. &Load Data
Area MwLoadData
Area MwLoadData
Gen. UnitMW Output
Data
Gen. UnitMW Output
Data
OutageScheduler
Gen. UnitStatus &
MW Output
Gen. UnitStatus &
MW Output
ResourceScheduling
OptimalPower Flow
EconomicDispatch

AB
B -
72Contingency Analysis
� Used to Quickly Predict Power System Conditions for a Series of “What If?” Scenarios of Equipment Failure
� Calculates the Steady State Conditions Following the Equipment Outages or Breaker Operations
� Provides Operator with Timely Information about Impending Problems in the Real-Time Network
� Inputs from Dispatcher’s Load Flow (DLF) or Optimal Power Flow (OPF) can be used as Starting Point

AB
B -
73Contingency Analysis
� Operates in Two Modes:� Real-Time Mode� Study Mode
� Real-Time Mode� Runs Periodically after a Successful State Estimation Execution� Runs whenever SSP Detects a New Network Configuration� Runs on Demand
� Study Mode� Starting Points
� Dispatcher’s Load Flow Result � Optimal Power Flow Result
� Results can be Transferred to DLF� For Development of a Counteractive Strategy

AB
B -
74Contingency Analysis Functions
ContingencyAnalysis
DefinitionDefinition SelectionSelection DetailedDetailedAnalysisAnalysis
� Studies can be Performed on the following types of Equipment Outages:� Bus Bars� Generating Units� Bus Injection Generation Points� Bus Injection Load Points� Circuits � Breaker Open/Close
� Each Contingency may consist of a number of different equipment outages, breaker operations and remedial action schemes
� Use One-Line Diagrams or Tabular Displays
� Contingencies can be Assigned to Groups to Facilitate Handling
� Contingency Ranking Formed Based on following Performance Indices:� MVA Overloads� Reactive Power Violations
� Overloaded Circuits (as detected by State Estimator) are Automatically Processed as Single-Circuit Outages
� Lost Generation or Load are Redistributed
� Can Specify Contingencies to be Inhibited Individually or by Group
� Can Specify Detailed Analysis for any Contingencies
� Partial Refactorization with Fast Forward and Backward Substitution Techniques
� Worst Contingencies Analyzed� Operator Specified� MVA overload ranked� Voltage-Reactive ranked
� Multiple Island Capability� Limit Checking for circuit flows, bus
voltages, flowgate flows, and angular changes
� Detailed Summary Provided for Each Contingency such as:� Ranking� Violated Equipment Names� Equipment LIMITS� Pre and Post Contingency Values� Percent Violation
� Summary of all flow violations� Summary of all voltage violations

AB
B -
75Penalty Factor Calculation
� Executes right after a Successful State Estimation solution to Calculate and Update Penalty Factors for Generating Units� Penalty Factors are used by the Real-Time Economic Dispatch to
incorporate the effect of Transmission Losses when trying to Optimally dispatch Load to Generating Units
� This has a significant impact on the Final Dispatch Profile, thus minimizing actual fuel cost accurately
AB
B -
76Outage Scheduler
� Used by the Operator to Enter & Display Power System Equipment which are Scheduled to be Out-of-Service
� Significant Features:� Point-and-Click Selection of Equipment Directly from One-
Line and Tabular Displays
� User Friendly Procedure to run Load Flow to Simulate the Impact of the Outaged Equipment
� Display Retrieval and Report Printout of Outage Schedules by Equipment Type, Date, Voltage Level & Category
� Extensive Data Validity Checking to Prevent Erroneous Operator Entries

AB
B -
77Security Monitor
� Real-Time Function which Executes Periodically to Maintain a Centralized Information about Actual and Potential Equipment Limit Violations
� Circuit Flow Violations� Bus Bar Voltage Over-limit
� Conditions may be Detected by:� SCADA
� State Estimator
� Real-Time Contingency
� Equipment eligible for Security Monitor Processing is Database driven
� Displays can be organized by Geographical Areas
� Currently Operational at New York State Electric & Gas (NYSEG)� 2800 Circuits (Lines & Transformers)
� 2300 Bus Bars

AB
B -
78Security Monitor
� Dispatcher can enter the threshold for percent overload above which the overloaded equipment will appear on the display
� Display is Organized by Equipment with most severe loading with the following information:� Equipment Name
� Currently Scanned Value
� Subsystem that Detected the Equipment in Abnormal Condition
� Pre and Post Contingency Values (if appropriate)
� Percent Overload
� Equipment Limits

AB
B -
79Network Reduction
� Off-Line Tool to Reduce the External Network and Produces an Equivalent Network� Replaces the Network’s
Unneeded Parts with Smaller Equivalent Model
� Reduces the Computational Requirement for Network Analysis Model
� Used for Building the Transmission Network Model that will be Delivered for FAT
� User Selectable Reduction Techniques, including � Extended Ward Reduction
� Sparsity-Oriented Reduction
� Checks the Validity of the Reduced Model
� Automatic Update of Database with Reduced Model Data
� Uses IEEE Load Flow Data
� Produces Reduced Power Flow Model in IEEE Format

AB
B -
80Meter Placement Study
� Off-Line Function which Determines if a given Power System is Observable for State Estimation� That is, there are enough measurements in the power system for SE
� Used to Determine where to Place Field Instrumentation to Make the Network Observable� Unnecessary Instrumentation may be eliminated, saving equipment
cost and installation effort
� Identifies redundant and critical measurement points
� Analysis is Performed using the following Measurement Types:� Circuit Flows (MW & Mvar)
� Bus Voltage Magnitude (kV)
� Bus Injection (MW and Mvar)
� Can run on any Personal Computer (PC)� Uses IEEE Load Flow Data Format
AB
B -
81Distribution Substation Control
� Provides for Voltage Regulation using several schemes
� Can be used to perform Voltage Reduction and Restoration
� Provides for Closed-Loop Control of on-load Transformer Taps and Shunt Capacitors
� Executes both on-demand and periodically

AB
B -
82Distribution Substation Control (cont)
� Regulation Schemes/Objectives:� Elimination of Transformer Leading Power Factor Out-of-Limit
Condition
� Regulation of Voltage to Scheduled Value including Voltage Reduction/Restoration Multipliers
� Elimination of MW Backfeed (Circulating Real Power) on Parallel Transformers
� Elimination of MVAR Backfeed (Circulating Reactive Power) on Parallel Transformers
� Balancing MVA on Parallel Transformers
� Regulation of Lagging Power Factor

AB
B -
83Short Circuit (Fault) Calculation
� Calculates the Fault MVA and Circuit Currents which result from a Three-Phase to Ground Faults on Selected Bus Bars
� Can Perform Fault Calculation on:
� Current Network Conditions (using results of State Estimation)
� Hypothetical Network Conditions (using results of Dispatcher’s Load Flow)
� Operator can Select Bus Bars for which a Short Circuit Calculation is to be Performed
� Fault Analysis Study Produces the Following Results:� Information about the Faulted Bus Bar
� Bus Bar Name � Per-Fault Voltage Magnitude and Angle
� Fault Duty Rating � Three-Phase Fault
� Fault Duty Rating Percent Load
� List of Overloaded Circuits� Circuit Name � Three-Phase Fault Current Flow
� Fault Current Rating � Fault Current Rating Percent Overloads

AB
B -
84Optimal Power Flow
� Determines and Optionally Implements a set of Control Actions Which:� Insure the Security of the Electrical Network while, at the same time,
� Minimize the Currently Selected Objective Function
� Can be Executed with the following Objective Functions:� Minimum System Generation Cost
� Minimum Control Deviation
� Minimum Real Power Transmission Loss
� Minimum Reactive Power Transmission Loss
� The Optimized Solution may be Implemented by:� Issue Supervisory Control Commands to Associated Field Devices
� Modify Pertinent Dispatcher’s Load Flow Parameters in Study Mode
� Executes in Real-Time or Study Mode

AB
B -
85Four Processors of OPF� Real-Time Actual-Condition
� Determines an Optimized set of Control changes corresponding to actual network conditions
� Real-Time Contingency-Condition� Calculates an Optimized Control Solution that is secure under
actual (pre-contingency) condition, as well as post-contingency condition
� Study Mode Actual-Condition� Calculates an Optimized control solution corresponding to the
operator-established base case conditions of a study environment
� Study Mode Contingency-Condition� Performs Study Mode Optimization function similar to that
performed by Real-Time Contingency-Condition OPF

AB
B -
86Features of OPF
� Eliminates the following Security Violations � Line and Transformer Ampere Limits
� Internal Area MW Import / Export Limits
� Bus Voltage Magnitude Limits
� Minimum System MW Reserve Limit
� Minimum System MVAR Reserve Limit
� Internal Area MVAR Import / Export Limits
� Algorithm is Based on a Combination of Linear Programming and Quadratic Programming
� Switches to Minimum Violation Objective when Unfeasibility is Detected
� Recommended Control Settings are Grouped and Sequenced to Progressively Reduce the Security Violations
� Controls Enabled / Disabled Individually or by Type
AB
B -
87Features of OPF
� Utilizes the Following Controls which can be Individually Prioritized for each Type of Security Violation:� Generator or Bus Injection Generation MW Output
� Phase Shifting Transformer Taps
� Net Active Power Interchange with each External Area
� Voltage-Ratio Transformer Taps
� Generator or Bus Injection Generation Voltage Setpoint
� Shunt Capacitor / Reactor Breakers
� Selected Control Settings Checked for Violations Prior to Application
� Control Settings are Sent Automatically or by Operator Intervention
� Suspends Automatic Issuance of Control when a Device is Determined to be Non-Responsive

AB
B -
88Quick Stability Analysis
� ABB NETWORK MANAGEMENT is the first supplier to offer and commission the QSTAB function in real time.
� Baseline Application. Two installations in the field.
� Computes Voltage Stability Margin (distance to voltage collapse) for the current operating condition using SE results
� Predicts Voltage Stability Margin for any future conditions using DLF study results
� Predicts the Maximum Load Carrying Capability immediately before
� Steady-state instability
� Voltage collapse

AB
B -
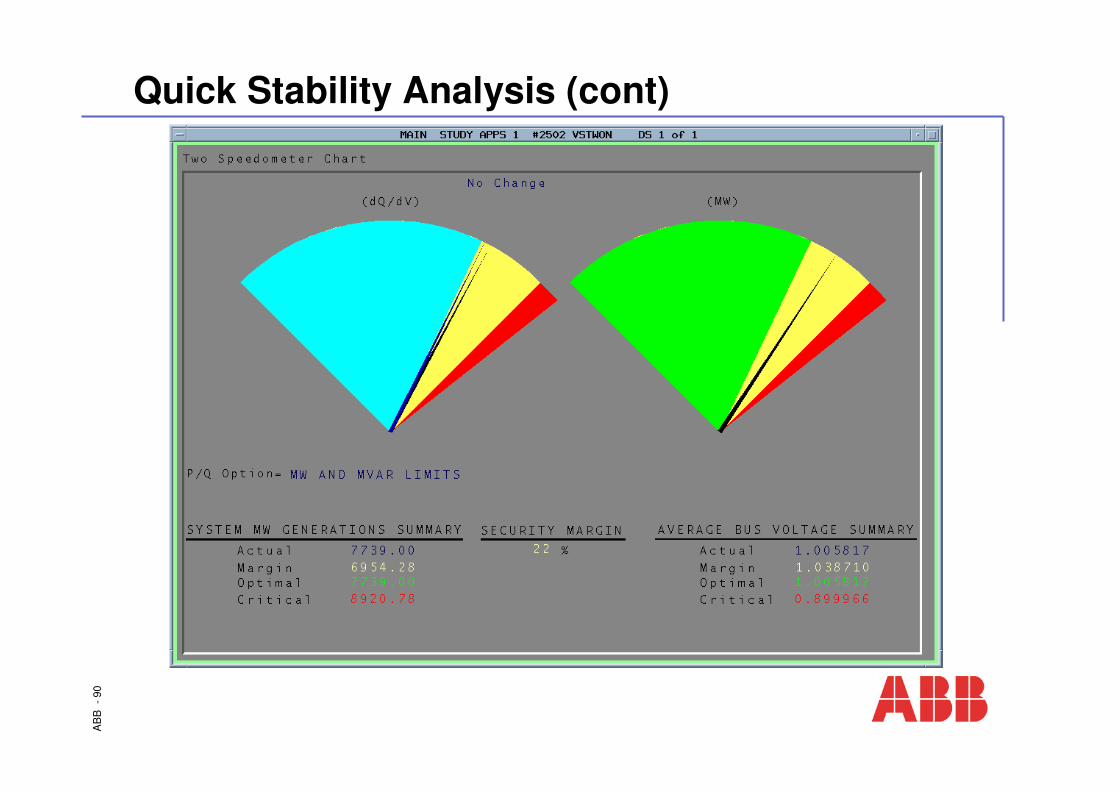
89Quick Stability Analysis (cont)
� Uses QSTAB (quick stability) software
� Determines the optimal operating point to maximize the margin
� Identifies generators, synchronous condensers and tie-line injections that cause instability
� Displays the results on easy-to-understand charts
� Speedometer charts for displaying the distance to critical, marginal and optimal states
� Bar diagrams for unit ranking
� Detailed results on tabular displays
� Helps develop remedial action strategies
AB
B -
90Quick Stability Analysis (cont)

AB
B -
91Voltage Security Assessment (VSA)
� Evaluates voltage dip and voltage collapse condition due to increased load and transfers
� Computes margin to voltage collapse point
� Generates P-V curve for increased loading
� P-V curve for any selected bus
� Evaluates using SE results in Real-time mode
� Evaluates using DLF results in Study mode
� Tabular results of worst voltage busses
� Uses Continuation Power flow (CPFLOW)
� Predictor-corrector continuation method

AB
B -
92
Bus Voltage
Load
BasePoint
CriticalPoint
Prediction Correction
Voltage Security Assessment (VSA)
AB
B -
93Dynamic Security Assessment (DSA)
� Identifies Contingencies that cause transient instability
� Computes Stability Margin for each stable contingency
� Performs analysis using the results of SE
� Performs analysis using the results of DLF
� Uses direct method based on energy function
� Display of contingencies in the order of stability margin

AB
B -
94Dynamic Security Assessment (DSA)
� Models:� Synchronous M/C Transients
� Voltage Exciter transients
� Voltage Control
� Static Var Compensator
� Loads as Constant Z,I,P
� Contingency:� Fault on the bus
� Clearance of fault
� Tripping of one or more equipment

AB
B -
95
Post-Fault Systemx = f(x,y)tcl< t < t
.
Time-Domain Approach Direct Methods (Energy Function)
Pre-Fault System
Numerical integration
x(t)
t = tcl tpost-fault trajectory
initial point of post-faulttrajectory
1. The post-fault trajectory x(t) is not required2. If v(x(tcl))< vcr, x(t) is stable. Otherwise, x(t) may be unstable.
• (Pre-fault s.e.p.) • (Pre-fault s.e.p.)
Fault-On Systemx = fF(x,y)t0< t < tcl
.
Direct stability assessment is based on an energy function and the associated
critical energy
∞
x(t) end point of fault-ontrajectory
t = t0 t = tcl t
Numerical integration
fault-on trajectory
x(t) end point of fault-ontrajectory
t = t0 t = tcl t
Numerical integration
fault-on trajectory
Dynamic Security Assessment (DSA)
AB
B -
96Reactive Power Scheduling (RPS)
� Computes an optimized schedule for transmission-level reactive control devices
� Uses optimum generating unit commitment schedule produced by Unit Commitment
� Schedules for up to 24 or more hours in the future
� Executes in Real Time and Study mode
� Stores the optimized schedule into a save case file
� Output the RPS schedule from the latest RPS execution in report format.
� Evaluates using SE results in Real-time mode
� Evaluates using DLF results in Study mode

AB
B -
97TTC Calculation
� Computes TTC for each transfer path
� Computes Hourly, daily, weekly, and monthly TTC
� Uses the thermal limits of the in-service circuits defined in that path. (or Nomogram based)
� Uses the current circuit status information from the real-time System Status Processor
� Uses the outage schedules from the Outage Scheduler
� Allows the transfer path to have multiple areas with several sub paths
AB
B -
98
DispatcherTraining
Simulator
DispatcherDispatcherTrainingTraining
SimulatorSimulator
AB
B -
99Dispatchers Training Simulator
� Provides a realistic simulation of the dynamic response of the power system under a wide range of operating conditions, within the limitations of the power system model
� The CRT Displays and Operating Procedures are Identical to what the Trainee would use in the real-time EMS environment
� The Trainee is almost unaware that he is operating a Simulator and not the real-time EMS
� The DTS is a tool to train Dispatchers to make Correct Power System Operation Decision Quickly under Varying Conditions� Ability to Expose the Operator to those Emergency Conditions which
Occur Once in a Lifetime
� Operators become more confident and able to Recognize Imminent Problems
� Improve Competence will Result in Operational Savings, Reduction of Outages, and Reduced Restoration Time

AB
B -
100
Dispatchers Training Simulator
� High Fidelity Simulator Integrated with EMS� One EMS / DTS Database Management System
� Power System Model - Functionally equivalent to EPRI OTS
� Simulator Elements� Duplicate of SCADA / EMS Software
� Duplicate of SCADA / EMS MMI
� Power System Simulation at Scan Rates
� Scenario Building and Control
� Provides Two Functional Capabilities:� Trainee Functions
� Instructor Functions

AB
B -
101
Dispatcher Training Simulator Overview
• Initial System State (from EMS Database)• Power Flow• Scheduled Interchanges• Scenario Event File• Load Profile
TRAINING SESSION SETUP
TRAININGSIMULATOR
EMSFunctions
Instructor
Trainee
VerbalCommunication
During Dynamic Simulation
� Insert Unplanned Events� Simulate Operator Actions at Remote
Control Centers� Control the Simulation� Evaluate Trainee Performance
Prior to Dynamic Simulation
SimulatedField Data
SupervisoryControlCommands
Results
Information
Control ActionsProgram Initiation
Manual Entries
EMSDatabase

AB
B -
102
SCADA / EMS Functions Running under DTS
� Automatic Generation Control
� Economic Dispatch
� Interchange Scheduling
� Load Forecasting
� Unit Commitment
� Transaction Evaluation A & B
� System Status Processor
� State Estimator
� Dispatcher’s Load Flow
� Contingency Analysis
� Optimal Power Flow
� Penalty Factor Calculation
� Short Circuit Calculation
� RTU Data Acquisition
� Supervisory Controls
� Alarms
� Calculated Values
� System Disturbance Review
� Graphical User Interface (MMI)
� Data Entry
� Logging
� Load Shedding & Restoration
� System Configuration Control
� Trending
� Database Functions
� Executive Services

AB
B -
103
High Fidelity Simulation
� Training Scenarios can be Initialized from EMS Save Cases
� AGC Periods same as Real-Time SCADA/EMS
� Multiple Island Capability
� Multiple Generation Control Areas
� Accurate Simulation of Cascading Disturbances
� Blackout and Blackstart Capability
� Protective Relay Operation
� Dynamic Profiles for Conforming and Non-Conforming Load
� Load Characteristics include Voltage and Frequency Effects
� Pool Simulation (custom)

AB
B -
104
Instructor’s Capabilities
� The DTS Instructor has two roles to fulfill:� Before the training session: when he sets up the simulation scenarios
and maintains the database
� During the training session: when he controls the scenario activities and communicates with the trainee, acting as an external EMS dispatcher, plant operator or field crew member
� The Instructor uses the standard EMS MMI and Applications (e.g., the Dispatcher’s Load Flow)
� Instructor MMI for Scenario Preparation:� User Friendly Graphical Interface to define equipment-related events
(Point-and-Click Operation from one-line diagrams)
� Presentation of Instructor Data on SCADA one-line diagrams
� Instructor MMI for Simulation Control: Stop, Restart, Back-in-Time, and Clock Rate Control (Acceleration/Deceleration)
AB
B -
105
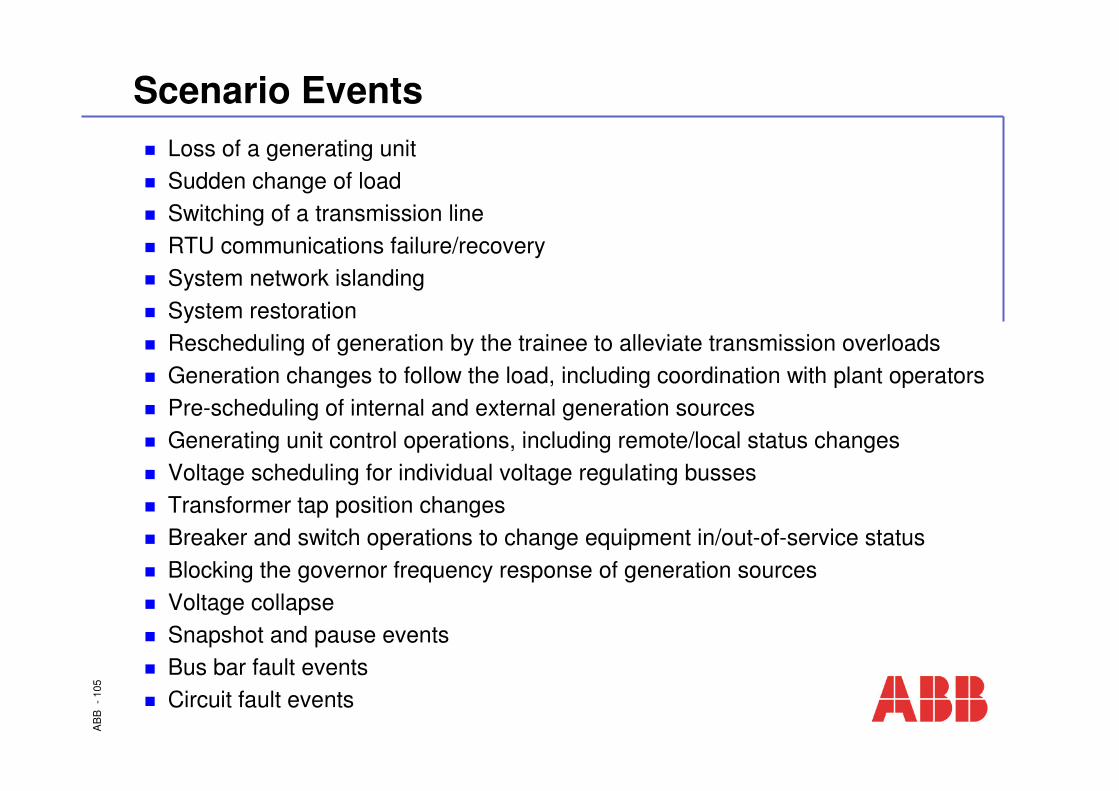
Scenario Events� Loss of a generating unit� Sudden change of load� Switching of a transmission line� RTU communications failure/recovery� System network islanding� System restoration� Rescheduling of generation by the trainee to alleviate transmission overloads� Generation changes to follow the load, including coordination with plant operators� Pre-scheduling of internal and external generation sources � Generating unit control operations, including remote/local status changes � Voltage scheduling for individual voltage regulating busses � Transformer tap position changes� Breaker and switch operations to change equipment in/out-of-service status � Blocking the governor frequency response of generation sources � Voltage collapse� Snapshot and pause events� Bus bar fault events� Circuit fault events

AB
B -
106
Additional DTS Capabilities
� Capability for build Scenarios Event Files from Actual disturbance (HIS)
� Conditional Events (triggered via Real Time Calculations – RTC)
� Disturbance Replay from historical data (HIS)
� Simulation of Dynamic Schedules, e.g.- External JOU’s
- External Loads
� Simulation of Aggregate Units under AGC control
� Trainee Evaluation
ANALOG PT.
STATUS PT.
RTC TRIGGER PT Scratchpad Events

AB
B -
107
Additional DTS Capabilities (Continued)
�Simulation of Remedial Action Schemes (RAS)Example : Overcurrent Relay at San Luis Rey
* Armed all the time
* If either bank 70 or bank 72 (230/69kV) exceeds 336MVA for 10 seconds, trip San Luis Rey load (breaker 83)

AB
B -
108
DTS Accuracy Permits its use for Other Functions
� Train Dispatchers on Future Power System Configurations
� Develop Power System Restoration Strategies
� Develop and Verify Power System Operation Procedures
� Refresher Training for Experienced Dispatchers
� After-the-fact power system disturbance investigation
� Trainee evaluation/certification
� Test Future EMS Databases
� Test EMS Software Changes

AB
B -
109
DTS Hardware Configuration� DTS Uses Identical Hardware as the EMS, reducing Training,
Maintenance, and Spare Parts
� Available DTS Configurations:� Dedicated DTS Server� Backup EMS Server
Network Manager
ApplicationsServer
(DTS Machine)
InstructorConsoles
TraineeConsole
TraineeConsole
Ethernet Backbone

AB
B -
110
Summary of Network Manager DTS Features
� Standard EPRI Models for Energy Source Prime Movers:� Fossil Fuel Units
� Nuclear Units
� Hydro Units
� Combustion Turbine Units
� Simplified Model
� Block Frequency Response
� Block AGC Controls

AB
B -
111
Summary of Network Manager DTS Features
� Load Models:� Conforming Load Model
� Non-conforming Load Model
� Auxiliary Load Model
� Zone Load Profile
� Voltage & Frequency Sensitivity
� Random Noise
� Dynamic Load Profile (1-minute granularity)
AB
B -
112
Summary of Network Manager DTS Features
� Relay Models:� Over/Under Voltage Relays
� Over/Under Frequency Relays
� Synchronism Check Relays
� Over Current / Impedance Relays
� Automatic Reclosure Scheme
� Automatic Capacitor Switching
� Load Rollover Scheme
� Load Shedding via Reduction Factor

AB
B -
113
Summary of Network Manager DTS Features
� Frequency Model
� DTS Power Flow:� Fast Decoupled Algorithm
� Blackout Simulation
� TCUL Transformers
� Phase Shifting Transformers
� Voltage Control
� External Area EMS Simulation:� AGC Model
� Economic Dispatch Calculation
� Interchange Scheduling
� Power Pool Simulation (Custom)

AB
B -
114