c use of s hear-stress-sensi tive, temperature-insensitive...
TRANSCRIPT
SANDIA REPORT SAND92-2469 UC-706 Unlimited Release Printed April 1997
c
Use of S hear-Stress-Sensi tive, Temperature-Insensitive Liquid Crystals for Hypersonic Boundary-Layer Transition Detection
Issued by Sandia National Laboratories, operated for the United States Department of Energy by Sandia Corporation. NOTICE: This report was prepared as an account of work sponsored by an agency of the United States Government. Neither the United States Govern- ment nor any agency thereof, nor any of their employees, nor any of their contractors, subcontractors, or their employees, makes any warranty, express or implied, or assumes any legal liability or responsibility for the accuracy, completeness, or usefulness of any information, apparatus, prod- uct, or process disclosed, or represents that its use would not *ge pri- vately owned rights. Reference herein to any specific commercial product, process, or service by tradeaame, trademark, manufacturer, or otherwise, does not necessarily constitute or imply its endorsement, recommendation, or favoring by the United States Government, any agency thereof, or any of their contractors or subcontractors. The views and opinions expressed herein do not necessarily state or reflect those of the United States Govern- ment, any agency thereof, or any of their contractors.
Prihted in the United States of America. This report has been reproduced directly lkom the best available copy.
Available to DOE and DOE contractors lkom Office of Scient& and Technical Information P.O. Box 62 Oak Ridge, TN 37831
Prices available &om (615) 576-8401, FTS 626-8401
Available to the public &om National Technical Idormation Service US. Department of Commerce 5285 Port Royal Rd Springfield, VA 22161
NTIS price codes Printed copy: A03 Microfiche copy: A01
.
Portions of this document may be illegible in electronic image produds. Images are produced from the best avabble original dOCIIment.
SAND92-2469 Unlimited Release Printed April 1997
Distribution Category UC-706
Use of Shear-Stress-Sensitive, Temperature-Insensitive Liquid Crystals for Hypersonic Boundary-Layer Transition Detection
D. P. Aeschliman, R. H. Croll, and D. W. Kuntz Engineering Sciences Center
Sandia National Laboratories I? 0. Box5800
Albuquerque, NM 871 85-0825
ABSTRACT
The use of shear-stress-sensitive, temperature-insensitive (SSS/T.I) liquid crystals (LCs) has been evaluated as a boundary-layer transition detection technique for hypersonic flows. Experiments were conducted at Mach 8 in the Sandia National Laboratories Hypersonic Wind Tunnel using a flat plate model at near zero-degree angle of attack over the freestream unit Reynolds number range 1.2-5.8x10⁶/ft. Standard 35mm color photography and Super VHS color video were used to record LC color changes due to varying surface shear stress during the transition process for a range of commercial S S S liquid crystals. Visual transition data were compared to an established method using calorimetric surface heat-transfer measurements to evaluate the LC technique. It is concluded that the use of SSSRI LCs can be an inexpensive, safe, and easy to use boundary-layer transition detection method for hypersonic flows. However, a valid interpretation of the visual records requires careful attention to illumination intensity levels and uniformity, lighting and viewing angles, some prior under-standing of the general character of the flow, and the selection of the appropriate liquid crystal for the particular-flow conditions.
3
Acknowledgments
The authors are indebted to the following Sandia National Laboratories' personnel: W.E. Escapule for the detailed model design; J.F. Henfling for the data acquisition, reduction, and plotting software7 and for instrumentation installation; J.M. Bonasidi for assistance in video and still camera recording; D.R. MacKenzie and K.N. Harmon for operating the wind tunnel; and C.B. LafFerty for operating the facility pumping and support systems. We also thank C.G. Miller, ID7 of NASA Langley Research Center for several valuable suggestions and comments.
4
NOMENCLATURE
Symbols
M P 9 Re T t X a z
Mach number Pressure, psia Heat transfer rate, BTU/fi2-s Unit Reynolds number, fi-1 Temperature, R Time, s Distance from leading edge, in Angle of attack, deg Shear stress, lbdft2
Subscripts
C Calculated cw Cold wall m Measured 0 Stagnation conditions r Recovery 00 Freestream conditions 1 Initial conditions, t = 0
Acronvms
LC Liquid Crystal S S S/TI Shear- S tress-S ensitive/Temp erature-Insensitive CMA Charring and Mass Ablation CFPBL Cold-wall Flat Plate Boundary-Layer HWT Hypersonic Wind Tunnel
5
Table of Contents
1 INTRODUCTION ............................................................................................................ 7
2 LIQUID CRYSTALS ....................................................................................................... 8 2.1 General Descnption ............................................................................................ 8 . . 2.2 Molecular Structure and Optical Characteristics ................................................. 9
3 EXPERDENTAL PROGRAM ...................................................................................... 10 3.1 Background and Analytical Predictions ............................................................. 10
3.3 Flow Visualrzation Equipment .......................................................................... 12 3.2 Model Design ................................................................................................... 11
3.4 Test Program ................................................................................................... 12
. .
4 RESULTS ...................................................................................................................... 14 4.1 Flow Conditions ............................................................................................... 14 4.2 Heat Transfer Data ........................................................................................... 14 4.3 Liqmd Crystal Evaluation ................................................................................. 17
..
. .
5 CONCLUSIONS ............................................................................................................ 18
6 REFERENCES ............................................................................................................... 20
Tabie 1 . Characteristics of Shear.Stress.Sensitive. Temperature-Insensitive Liquid Crystals ....................................................................................................... 22
6
1 INTRODUCTION
Boundary-layer transition on flight vehicles or wind-tunnel models is a critically- important fluid mechanic phenomenon. The occurrence and location of transition must be known in order to predict forces and moments, vehicle stability, heat transfer, etc. Since transition cannot at present be predicted with acceptable accuracy, it must be determined empirically.
Boundary-layer transition detection on wind-tunnel models has typically been performed using embedded instrumentation that responds either to the increased heat transfer or shear stress associated with transition. Since the functional forms of the heat-transfer and shear-stress distributions are similar, the choice of which to measure is largely a matter of experimental convenience. Alternatives to instrumenting the model include the use of phase- or shape-change techniques; observins the surface temperature distribution using idtared thermography; and studying the boundary layer itself using optical or mechanical probes.
Each of these approaches has disadvantages. Instrumented models are costly and generally yield data only at discrete points. Phase- and shape-change materials are irreversible and the observed effects are integrated over time. Thermographic methods typically require special model materials and sophisticated idtared equipment and imase analysis techniques. Boundary-layer probe techniques are complex and generally difficult to implement. These difficulties are compounded for flight systems, and the usage of some techniques may be precluded for structural or other reasons.
The use of liquid crystals will result in a change of the color of white light reflected fiom a liquid-crystal-coated surface, and the color changes can be associated with a change in shear stress due to transition. This method has been employed for relatively low-speed (incompressible to weakly compressible) flows for both wind tunnel testing 1 ~ 2 and for flight3. Smith4 has recently reviewed the use of liquid crystals for aerodynamic flow visualization applications. Liquid crystals have the advantage of providing continuous data over a surface, and the method has been successful for low temperature flows at subsonic to low supersonic Mach numbers, where the primary boundary-layer effect is mechanical shear. However, for high enthalpy hypersonic flows both thermal and shear stress effects are present and are of comparable magnitude; earlier liquid crystal formulations sensitive to both temperature and shear stress variations were unsuitable due to the inherent ambisuity of the observed color changes.
Sandia National Laboratories has been exploring the use of new shear-stress-sensitive, temperature-insensitive (SSS/TI), liquid crystals &Cs) as a boundary-layer transition diagnostic5-7 for hypersonic flows in the Sandia Hypersonic Wind Tunnel. These new LC types respond to shear stress but not to temperature change over a substantial temperature range. Reference 5 describes the use of a particular liquid crystal, Type TI-622 (BDH, Ltd., Poole, England) for boundary-layer transition detection on a 6.5 des half-angle cone with
blunt and sharp noses at one hypersonic flow condition (Mach 5, Reoo = 7x1O6/ft, To =640 R) However, S S S LCs have not been studied over a range of hypersonic ground-test conditions. Such a demonstration is necessary if the method is to be developed into a technique with a broader utility for hypersonic wind-tunnel testing. Also, it has not been demonstrated that the liquid crystals and the (black) paint required to achieve color contrast do not alter the boundary-layer characteristics and/or the transition process. Finally, although purely qualitative transition information as given in Ref 5 is useful, a quantitative calibration of liquid crystals in terms of the required shear stress, even if only approximate, to produce a given wavelength shift (color change) at high Mach number would enhance significantly the value of the method. The present work was undertaken to address these issues. Our intent was to evaluate several commercially-available SSS LCs over a range of Reynolds number at Mach numbers of 5 and 8. Experimental problems, coupled with budgetary and schedule constraints, precluded testing at Mach 5. Therefore, only results for Mach 8 are presented in this report.
2 LIQUID CRYSTALS
2.1 General Description
Liquid crystals are viscous organic fluids with some of the optical characteristics of solid crystalline materials. Liquid crystals have been used for over thirty years as a surface- flow visualization aid, beginning with the work of Klein8. The viscous nature of LCs permits surface flow direction to be determined, similar to the use of oil flow compounds, and the "color play"--the variation in observed colors under white-light illumination--which results fiom the crystalline properties can, in principle, be related to important fluid flow phenomena (boundary-layer transition, flow separation, shock wave passage or impingement).
As implied above, the use of shear-stress-sensitive, temperature-insensitive liquid crystals permits a change in the level of shear stress to be detected in the presence of a varying surface temperature. Since shear stress due to transition fiom laminar to turbulent flow can increase by a factor of 5 or more in hypersonic flow, the transition zone can be observed ifthe shear stress response of the LC is in the correct range. Added advantages are that the color changes are completely reversible and response time is very fast (in the range of a few milliseconds or less). Liquid crystals are therefore applicable to highly transient flows, for example shock wave passage5 and flows over oscillating airfoils9 .
The LCs are easy and safe to use, and are relatively inexpensive, 33-10 per square foot of surface area, depending on LC type. However, there is a potentially serious disadvantage of the SSS/TI LCs in a hypersonic flow environment. Although the color response does not vary with temperature per se, the fluid viscosity is a strong function of temperature and the LC flow characteristics change as the surface temperature varies. In general, there will be a combination of surface temperature and shear stress level for which the color play will be lost due to complete disruption of the crystalline structure. This is a very important consideration in using LCs on uncooled models in hypersonic wind tunnels,
8
which generally utilize elevated stagnation temperatures to prevent flow liquefaction during expansion to hypersonic Mach numbers.
2.2 Molecular Structure & Optical Properties
Liquid crystals consist of long-chain, rod-like organic molecules organized in certain regular (Le., crystal-like) structures. For a typical LC coating thickness (.0004-.OOOS in.), the molecular arrangement, after alignment into the planar (also referred to as the Grandjean) texture, consists of a layer of parallel planes of LCs with the molecules in each plane aligned parallel to each other. This alignment can be achieved using an air gun before tunnel start, or it can be allowed to occur spontaneously with the wind tunnel flow itself In order to achieve a minimum energy configuration, the direction of molecular orientation within a given plane is rotated by a fixed amount, depending on the particular LC, with respect to the direction in the adjacent planes above and below. This creates a helical structure whose pitch spacing (the distance required for 360 deg of rotation) is in the range of visible light wavelengths. The wavelength scattered in the direction normal to the surface by the LC is equal to the pitch spacing; any process which alters the spacing will give rise to a change in observed color. Mechanical shear stress will in general cause the pitch to decrease, thus scattering light of shorter wavelength.
At some temperature, referred to as the "melt" or "clearing" temperature, the ordered structure is lost and the LCs become transparent. Loss of ordered structure can also happen due to excessive shear stress, as noted above. (See Ref. 10 for a description of liquid crystal types, properties, and behavior. Reference 10 also includes an extensive bibliography (LR- 0 1A) of liquid crystal applications for heat-transfer and flow-visualization studies.)
The fiaction of incident white light scattered as a nearly pure color is much smaller than the portion transmitted. The transmitted light must therefore be absorbed at the surface to prevent its reflection from the surface and subsequent transmission back through the LC coating to the observer. (LCs on reflective surfaces are essentially invisible.) Typically, the surface is painted flat-black to absorb the transmitted light. Liquid crystal vendors supply aqueous-based paints for this purpose. However, because of the harsh environment and the use of stainless steel models with high surface finish, we typically use epoxy-based flat-black aircraft paint over an epoxy primer to spray-paint the model. The epoxy paint is very tough, and is virtually unaffected by repeated cleaning with typical solvents (fieons, alcohols).
In addition to the color shift due to shear stress, the observed color is also a fbnction of both the angle of illumination and the viewing angle. These are substantial effects.ll Variations in viewing angle of only 10-20 deg can give rise to significant color variations, from red to orange, for example. A change in viewing angle of 45 deg or more can produce wavelength shifts fiom red into the green and blue. Reda, et all2 discuss techniques that utilize these effects to optimize color play for particular situations. They have also shown that the direction of flow at the surface can be deduced by appropriate choices of illumination and viewing angles.
In order to avoid conhsion caused by combinations of colors, lighting should be from only one direction for each visual record (still or video camera). If lighting from more than one direction is required to achieve full illumination of the region of interest, and overlapping illuminations patterns are unavoidable, the color response for lighting from each lamp should be recorded independently with flow ofE Then the lamps should be operated individually during the test itself Once the lights have been positioned and the pre-run colors recorded, the relative positions of lighting and cameras should not be changed. Finally, the intensity level of white-light illumination should be as low as possible to achieve adequate photographic and video records. The radiant energy imparted to the liquid crystal coat via absorption by the black paint will cause an increase in surface temperature, with several undesirable consequences. The run time will be reduced since the LC will approach the clearing temperature faster; the viscosity of the LC will decrease, which increases the likelihood of the LC running or stripping off; and the additional heat input will represent an error in measurement of convective heat transfer, as used here. (The possible effect of the lights on the present results is discussed later.)
Although the effect is generally not as dramatic, impurities can also affect the color In general, it is necessary to thoroughly remove contaminants (such as oils, response.
solvents, and fingerprints) from the surface before applying the LCs.
3 EXPERIMENTAL PROGRAM
3.1 Background & Analytical Predictions
A flat plate at near zero-degree angle of attack was selected for the wind-tunnel model. There were several justifications for this choice. The confidence in predicted heat- transfer rate and shear stress is higher, and the planar geometry provides more nearly constant illumination and viewing angles as opposed to, for example, a conical body. The use of a flat plate also provides a zero pressure gradient, simplimg analysis. (Although it is not in general a significant effect, LC response can also depend on static pressure.) The change in heat-transfer rate rather than the level of shear stress associated with transition was chosen as the standard for comparison to LC-derived transition location, since it is the easier to measure. In order to reduce mechanical complexity and cost, the model was designed as an uncooled, hollow-core, flat-plate calorimeter, using thermocouples on the back face of the flat plate to monitor the temporal increase in plate temperature.
Testing was conducted using the Sandia Hypersonic Wind Tunnel (HWT), an axisymmetric, electric-resistance-heated blowdown to vacuum facility with Mach 5, 8, and 14 capability. Experience with the HWT has shown that for sharp and blunt-nosed conical models of the order of one foot in length, natural transition can be achieved relatively easily at Mach 5 and at the higher attainable unit Reynolds numbers at Mach 8. The flow at Mach 14 is laminar for any realistic model size. This information was used to help define the model dimensions. However, we had no prior experience in the HWT using a flat-plate model.
10
Prior to detailed design definition, the surface shear stress and heat-transfer rates were calculated using a flat-plate boundary-layer code, CFPBL. This code uses compressible flow theory and semi-empirical correlations to calculate shear stress and heat-transfer rates for laminar and turbulent boundary layers. Solutions were computed for a range of achievable flow conditions at Mach 5 and 8. The predictions of the surface shear stress and heat-transfer rate were obtained over a range of freestream unit Reynolds numbers and stagnation temperatures as a fbnction of distance downstream from the leading edge for the flat plate at zero-deg and at +I-deg angle of attack, a. The variation in a permitted the assessment of the effect of small experimental departures from zero-deg angle of attack on heat transfer and shear stress. Using the results of those calculations and estimates of the length of the transition zone (which influences the axial gradient in surface heat transfer), and assuming the heat transfer is one-dimensionaly plate temperature rise as a function of time was computed for a range of plate thickness (0.0625-0.250 in.) for several candidate plate materials (e.g., stainless steel, aluminum).
The results were used to specifjr the dimensions and material for the flat plate model. It was important to select a plate thickness low enough to yield easily measured backface temperatures but not so high that the clearing temperature (typically, 120 F) would be exceeded in reasonable run times; and to minimize axial heat transfer within the plate, which would violate the one-dimensional heat transfer assumption (thin-wall approximation). At the same time, the plate needed to be thick enough to provide adequate mechanical strength and rigidity against deformation during testing. A satisfactory compromise was found to be a stainless steel (15-5PH) plate of 0.125411 thickness. Errors due to non-uniform temperature distribution normal to the surface and to axial temperature gradient were estimated using criteria from Ref. 13. These errors were predicted to be negligible for the heat-transfer distributions anticipated, and subsequently observed in the. experiment.
3.2 Model Design
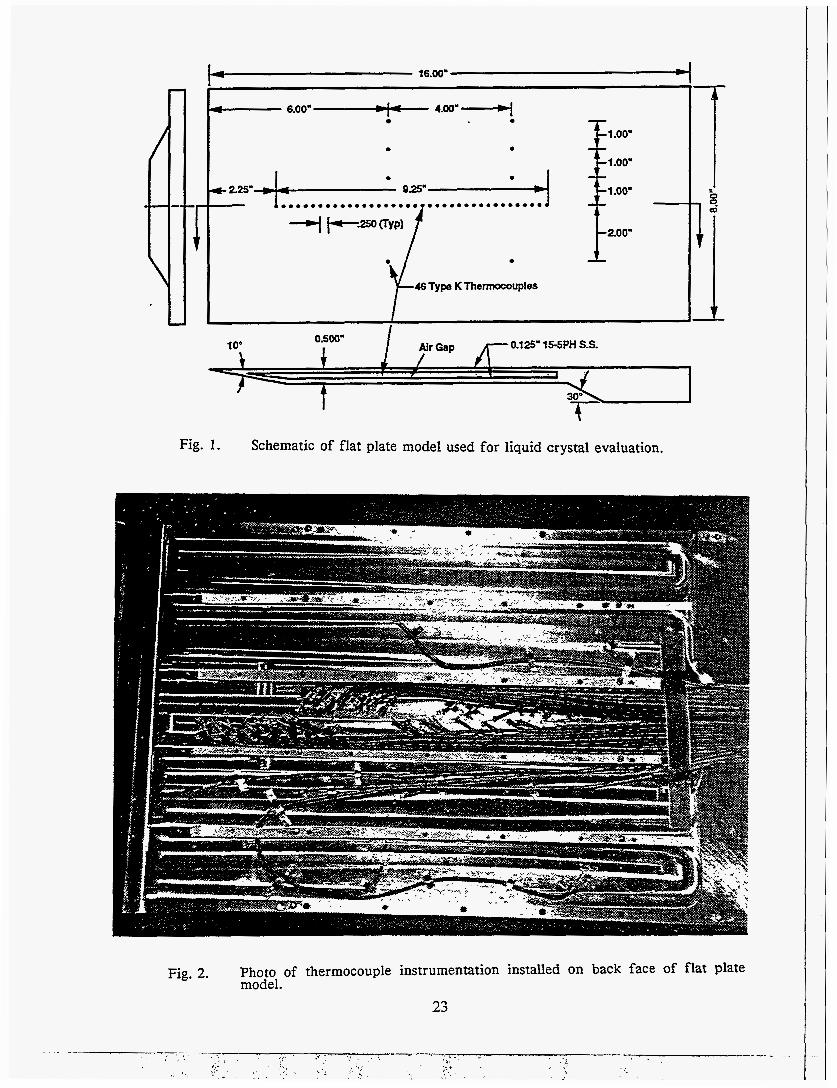
The flat plate model is 8.00-in.’ wide, 16.00-in. long, and 0.500-in. thick. The model is shown schematically in Fig. 1. The opposing model surfaces are 0.125+.001-in. thick and are separated by four 0.250-in wide by 0.250411 deep longitudinal interior ribs and two 0.250- in. wide x 0.250411. deep edge ribs which provide s t a e s s to the model. The leading edge is an asymmetric 10-deg razor-sharp wedge to minimize shock formation on the instrumented surface. Shear pins between the plates and the stiffening ribs are used to react the induced bending stress due to aerodynamic loads and thermal expansion, and to assist in assembly. The 0.250-in. air gap between the plates provides an approximately adiabatic boundary condition on the backface of the flat plate. Heat conduction through the ribs is minimized by 2-mil mylar insulation strips. Figure 2 shows the instrumented back-face of the model with the backing plate removed.
Heat-transfer instrumentation consisted of an array of 46 Type K thermocouples, formed from fiberglass-insulated 36 AWG extension wire, spot-welded to the backside of the
flat plate. The thermocouples were located at 0.25-in. intervals along the model centerline from X = 2.25 in. to 11-50 in., and at various off-centerline locations to assess heat-transfer non-uniformity across the plate at several axial stations. Positional accuracy is kO.01-in. in the axial direction. The thermocouple junction welds were protected from stress due to handling and dynamic loads during tunnel start and shutdown by means of spot-welded tie- down straps. The thermocouple wires were routed through the model sting and tunnel pitching strut for external connection to the data system.
3.3 Flow Visualization Equipment
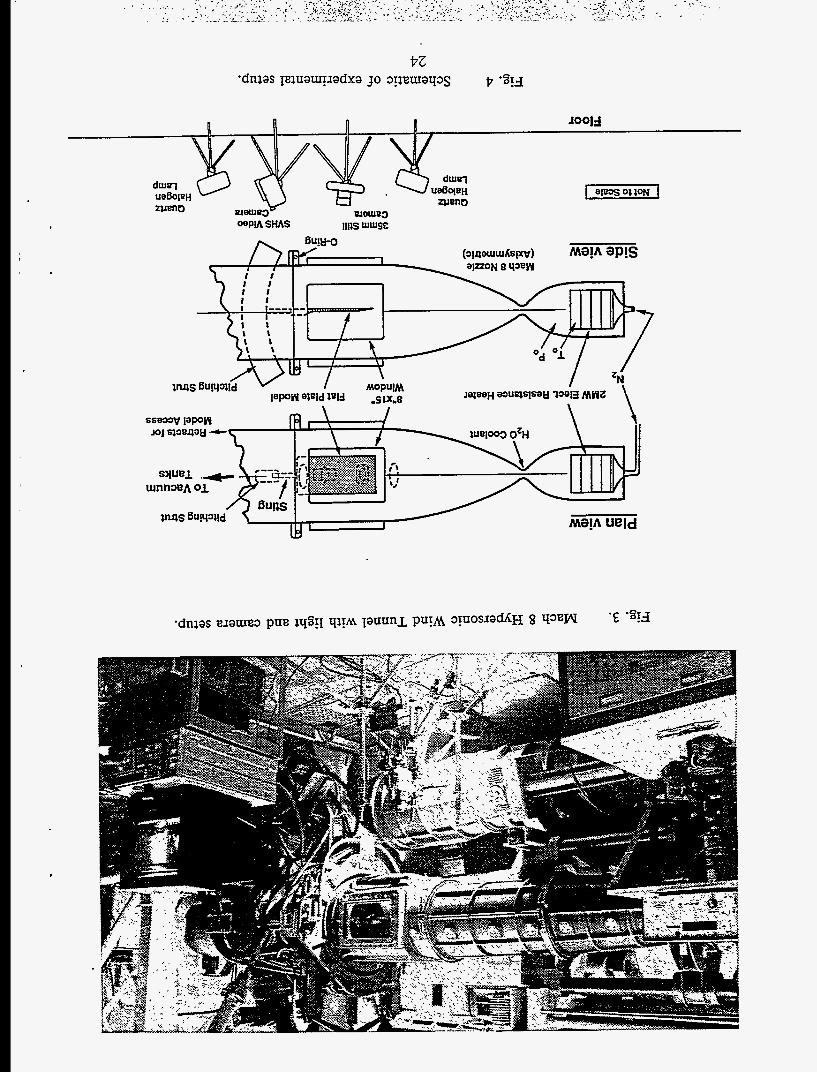
Visual recording equipment consisted of tripod-mounted 30 f p s S-VHS color video and 35 mm still cameras. One of the video cameras allowed stop-action exposure times down to 1/2000 s for each frame and was used to view the model from the side to monitor model motion during testing, especially during tunnel start and shutdown. (Super VHS video equipment, although useful for the higher spatial resolution available, is not required for implementing the LC technique.) The cameras used to record the LC color changes were positioned on the floor below the tunnel and viewed the model through the bottom tunnel window (8 in. W x 15 in. L for the Mach 8 nozzle.) The video camera was centered on the model surface approximately 7 in. aft of the leading edge and subtended f17 deg along the plate axis, and 12 deg side-to-side. The still camera was placed approximately 6 in. upstream of the video camera, and subtended a viewing angle ranging from -4 to +30 deg along the plate axis and f12 deg laterally. Single 500-W quartz-halogen adjustable-focus photo flood lamps were arranged fore and aft of the cameras, providing illumination angles for each of approximately 25 deg. Figure 3 shows the light and camera setup, and Fig. 4 is a schematic of the experimental system.
3.4 Test Program
The test program was conducted in two phases. The first phase was performed to determine whether the paint and/or the liquid crystals had an effect on the boundary-layer transition process or on the heat-transfer measurements used for comparison. During the second phase, various liquid crystals were studied to determine their response to a range of tunnel freestream and boundary-layer conditions. Also during the second phase, an unsuccessful effort was made to accelerate boundary-layer transition by using a trip-strip at various locations on the plate. For all runs, the model was oriented with the instrumented face down, with the LC-coated surface viewed by the cameras from below. Model angle of attack was set to zero (kO.01) deg prior to each run. The actual angle of attack during each run was slightly negative due to a net normal force caused by the asymmetric wedge. Based on a calibration of the model deflection as a fbnction of static load, the angle of attack ranged from approximately -0.05 deg to approximately -0.30 deg over the range of flow conditions used.
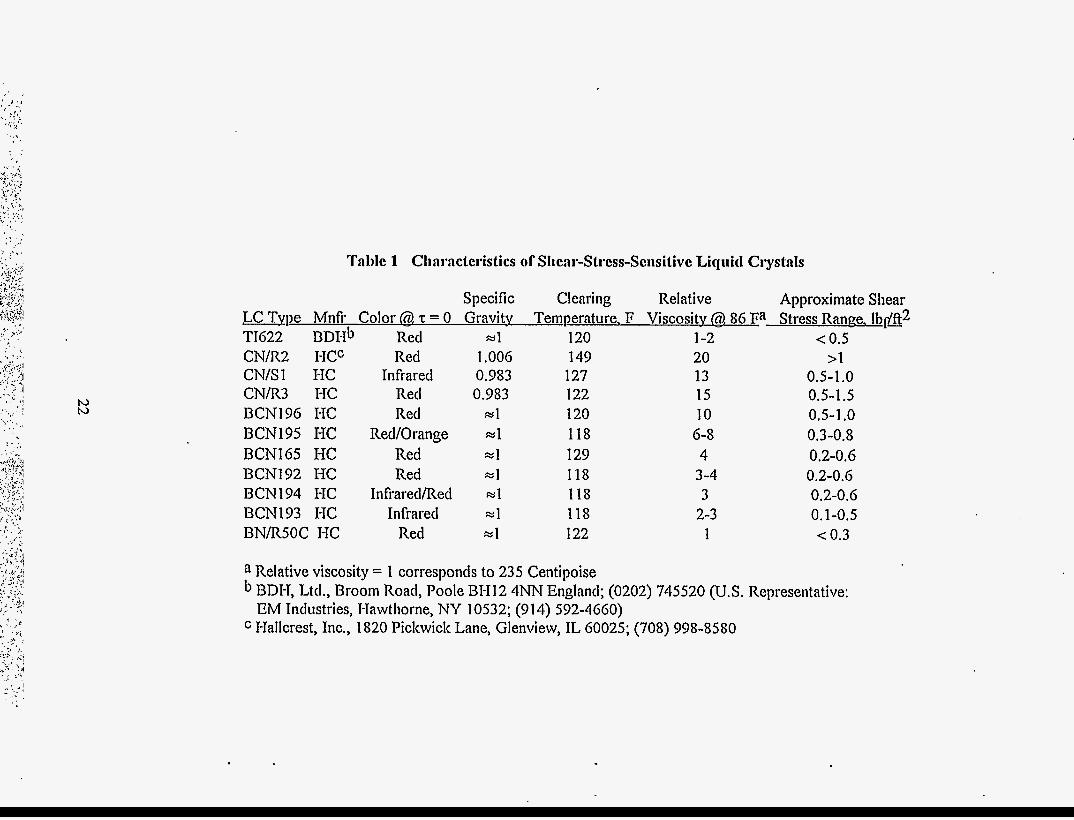
Eleven different shear-stress-sensitive, temperature-insensitive liquid crystal formulations were used in the study; 10 from Hallcrest, Inc., and 1 from BDH, Ltd. (See
12
Table 1 for supplier information.) All of the LCs are unsealed, i.e., non-encapsulated. (Encapsulated LCs, in which the liquid crystal compounds are encased in microspheres, are not usable as shear stress indicators, since the encapsulating material isolates the molecular structure of the LC fiom variations in shear stress. However, encapsulated, temperature- sensitive LC types have been used as a surface temperature thermometer for heat-transfer measurement by Platzer, et al. 1 The disadvantage of using encapsulated, temperature- sensitive LCs for the present application is that the color observed at a point on the model will continually vary in time for steady-state heat transfer whereas, for the SSS LCs, the color distribution is invariant in time for a constant shear stress. An additional advantage of the SSS types is the insensitivity to color variations induced by any heating fiom the lamps.)
Specifications for the LCs studied here, where available, are presented in Table 1. The liquid crystals are non-Newtonian fluids; consequently, the relative viscosity datal4 are for a particular viscometer, test sequence, and time. Quantitative values of shear-stress sensitivity of the different LCs is not available. Typically, however, shear-stress sensitivity varies approximately with the inverse of the viscosity, with the least viscous LCs generally the most sensitive.14 Also shown in Table 1 are the clearing temperature, specific gravity, and color at zero shear (viewed normal to the surface) for each LC used. The clearing temperature is an especially important characteristic for this work, since this temperature determines the maximum usable plate temperature before color response is lost. With all other considerations being equal, the highest clearing point LC is the most desirable for hypersonic flow applications using uncooled models. However, clearing-point temperature and viscosity do not correlate well. The utility of the LC may be degraded at temperatures well below the clearing point due to increased fluidity as the temperature of the LC increases.
The LCs were mixed with a solvent, trifluorotrichloroethane (Freon-1 13) at a ratio of approximately one part by volume liquid crystal to 4-5 parts by volume solvent. Although the different LC types vary greatly in ease of dissolution, the dissolved mixture is clear and colorless for all LC types. Prior to applying the LCs, the plate surface was cleaned thoroughly with Freon. A hand-held aerosol atomizer (Crown Spra-Tool, No. 8001) was used for applying the LCs. Each LC type was mixed with Freon in a Spra-Tool bottle, and the bottle and atomizer labeled for the particular LC to avoid contamination between types. After the surface was clean and dry, the LC was applied by sweeping the atomizer across the surface in a steady back-and-forth motion while maintaining the spray normal to the surface and the spray nozzle 6-8 in. fiom it. To avoid the deposition of large droplets, the spray was started away from the surface. We have found that for the Spra-Tool atomizers, 3-6 passes at a sweep rate of about 1 A/s will yield a coating of acceptable thickness, generally presumed to be 0.0004-0.0008 in.
We know of no simple way to gauge the coating thickness except by trial and error. If the coat is too thin, it will lack sufficient color play; however, if it is too thick, the LC film will be more apt to run and strip off during testing. Stripping of the LC coating will also occur if the surface temperature gets too high, or if the shear stress is simply too high for the LC, regardless of thickness. The undiluted LCs and the LCEreon mixtures can be stored in
sealed containers for extended periods at room temperature and out of direct sunlight (the LCs can be damaged by exposure to U V light.) The liquid crystals are not hazardous; however, Freon is an irritant and it is prudent to take care during the preparation and spraying processes to avoid unnecessary exposure. It is recommended that latex gloves be worn when handling the LCs or LC-coated parts, and during mixing and cleanup. In addition, use of gloves, a painter's mask, and a face shield is recommended during the spraying operation. Also, Freon-113 is a known upper-atmosphere ozone depleter and will be phased out of production. Several of the non-chlorinated fluorocarbons, and petroleum ether (unfortunately, highly flammable) are alternative solvents14.
In order to maximize the amount of information obtained from each tunnel run, up to five LCs were tested at a time. The different LCs were applied individually using a metal template with five slots, arranged parallel to the model centerline Only one slot was uncovered during the spray application of each LC in order to avoid contamination between LC types. Reference tabs on one edge and one end of the template provided positioning of the template on the model during spraying. Self-sticking plastic foam strips attached to the back side of the template provided a seal to confine each LC to the desired area. Since the model was tested facing down, it was convenient to rotate the plate into a vertical position during spraying.
4 RESULTS 4.1 Flow Conditions
After a series of Mach 8 shakedown runs, four nominal tunnel conditions were selected for repeated running for the liquid crystal testing. (As noted previously, data were not obtained at Mach 5). The nominal Mach 8 conditions were: (1) Po = 285 psia, To = 1310 R, Re, = 1.3x10⁶/ft; (2) Po = 370 psia, To = 1100 R, Re, = 2.3x10⁶/ft; (3) Po = 620 psia, To = 1000 R, Re, = 4.3x10⁶/R; (4) Po = 930 psia, To = 1080 R, Re, = 5.8x10⁶/ft. These values were then used for final heat transfer and shear stress CFPBL code calculations as a fbnction of distance fiom the leading edge.
4.2 Heat-Transfer Data
Heat-transfer data were used to determine the state of the boundary layer along and laterally across the flat plate. At some time after tunnel startup and after having achieved steady running conditions, the plate (backface) temperatures were recorded; these data formed the t=O baselines for subsequent increases in plate temperature during each run. (Of course, any given set of temperature data can be used as a new baseline for still-later times.) This technique is sensitive to errors in dT/dt, but is insensitive to absolute temperature errors which can arise due to heat transfer during tunnel startup; variations in plate temperature across the model at the start of the run (as much as 25 deg. F, depending on the lengh of time used to air-cool the model between runs); and the use of thermocouple extension wire (which is fabricated to a lower composition standard) for the thermocouples.
14
A potential limitation of the calorimeter method is the hot-wall correction. However, the driving potential (Tr -Tw) is large for the current conditions and the hot-wall correction is not significant. Accuracy of the heat-transfer measurements is subject to a number of error sources: these are uncertainties in the plate temperature rise as a function of time, including effects of non-ideal TC junctions and heat conduction in the TC wires; inaccuracies in Tr; uncertainties in the plate thickness and material properties; and the extraneous heat input from the lamps. The combined uncertainty due to the thermocouple and plate errors is estimated to be +lo%.
The radiant heating due to the lamps introduces an error in absolute heat transfer measurement. The minimum point in the heat-transfer distribution is unaffected by this error, however, if the radiant heating is uniformly distributed. Measurements using a broad-band power meter of the irradiance incident on the flat plate indicate a radiant heat flux of 0.1-0.2 BTU/ft2-s. The flux has a slowly varying nonuniformity over the plate of O(SO%). The range of measured heat-transfer rate, qm, in these experiments is 0.2SqmS1.0 BTU/ft2-s; therefore, the uncertainty contributed by the lamps is 7-33%. Although relatively large in terms of total heat flux, the slowly varying nature of the light intensity distribution greatly reduces its effect on determination of the minimum heat-transfer point. The added uncertainty is estimated to be SO. 1 inch.
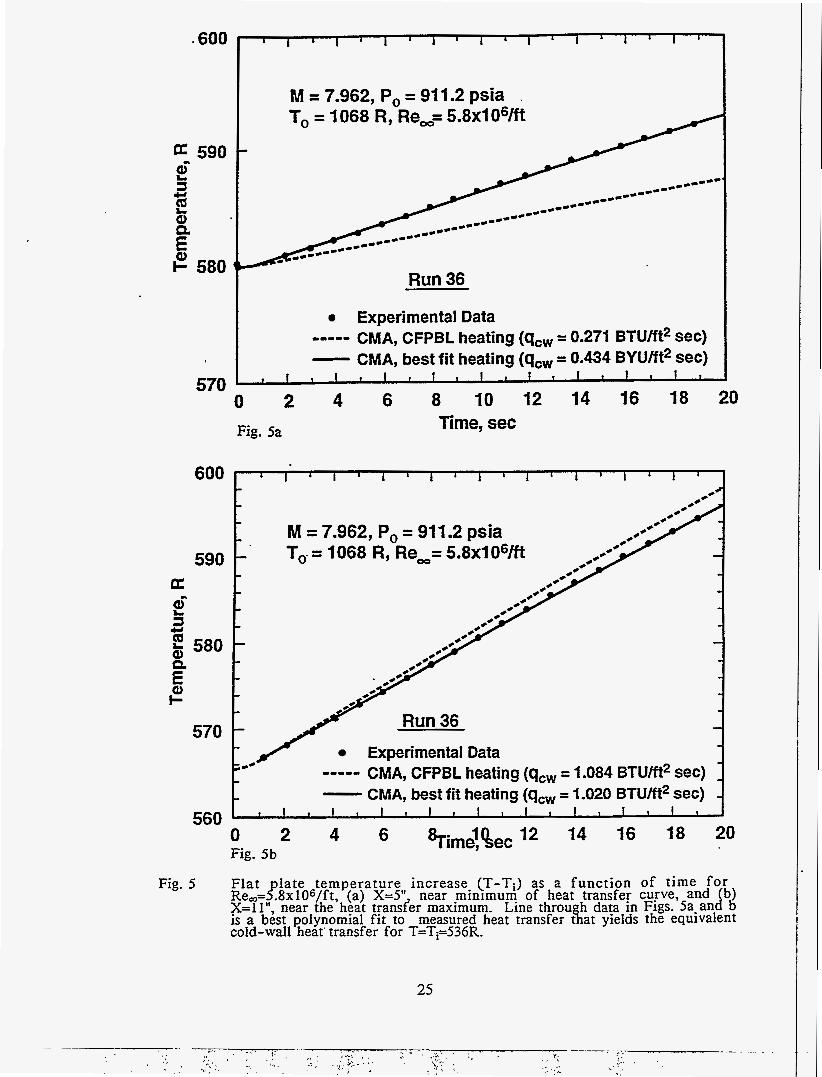
An example of a typical plot of flat plate temperature vs time is shown in Figs. 5a and 5b for two axial locations, (X=5.00, near the minimum in the heat-transfer curve, and X=11.00 in.), for a freestream Reynolds number of 5.8x10⁶/fl. The solid line through the data in each plot is a least-squares polynomial fit that yields the equivalent cold-wall heat transfer at T=Ti=536R for the measured temperature distribution, T#%. The departure from linearity due to increasing plate temperature is discernible in the data at X=l 1 in. Also shown are cold-wall calculations for a=O deg, and corrected to a=0.3 deg for comparison to the expected nose-down plate deflection for this run.
The question of whether the presence of the paint and/or liquid crystals alter the state of the boundary layer is crucial. Using time-dependent plate temperature data, the heat- transfer distributions were determined over a range of unit freestream Reynolds number from 1.2-5.8x10⁶/fi. Over the region in which transition from a laminar to a turbulent boundary layer occurred, the heat transfer experiences a minimum. The minimum, typically referred to as transition onset in the literature, can be defined with good accuracy, except at the lowest Reynolds numbers, and has been used as a measure of comparison for the effect of flat plate surface treatment. This, approach has the added advantage that because the heat-transfer distributions are nearly symmetric about the minimum, this method virtually eliminates spatial errors due to (the already small) axial heat conduction within the plate.
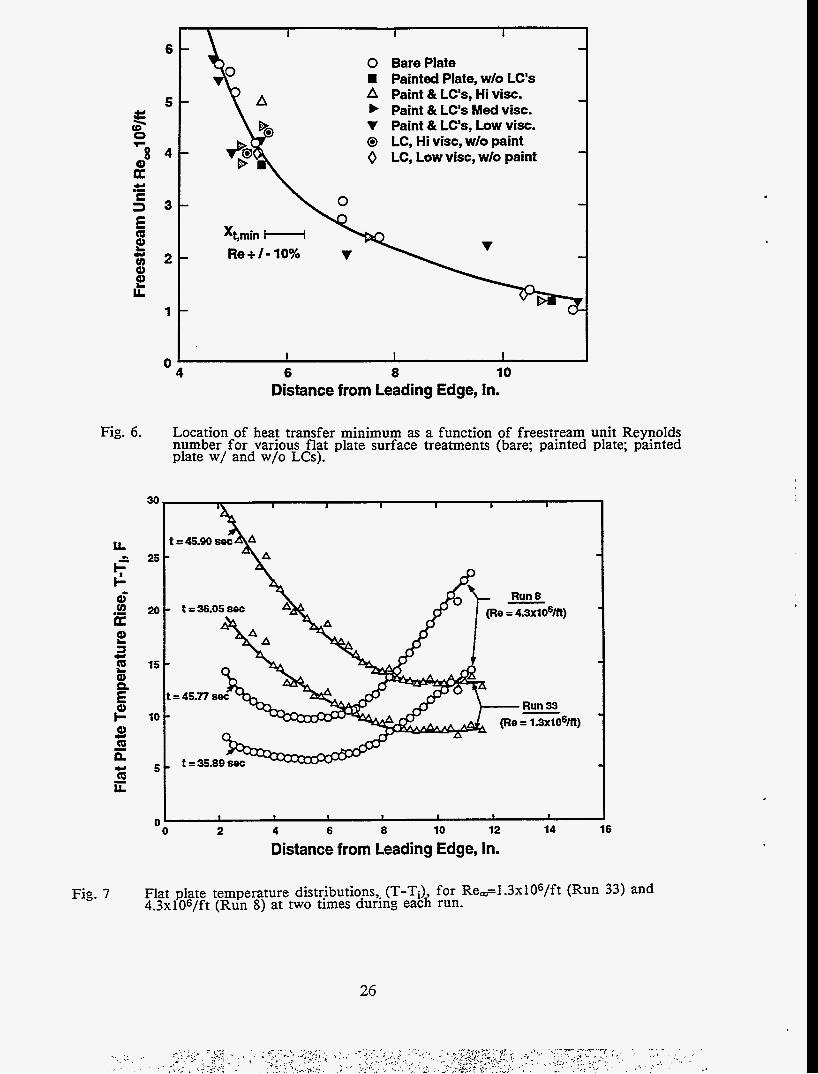
Variations tested included: bare flat plate; LCs (low to high viscosity) without paint; painted plate without LCs; and low-to-high viscosity LCs with paint. Figure 6 shows the results of that study. The estimated uncertainty in choosing the heat-transfer minimum varies fiom M.3 in. to k1.0 in., and increases with decreasing Re,. The Reynolds number varies
15
slightly, typically a few percent, during the course of a run; the value of Re, is the average over the time interval used for the heat-transfer measurement. The uncertainty in Re, is estimated to be +5%,.which includes errors due to averaging over the time variation; to estimated uncertainties in the measurements of Po and To; and to the algorithms used to compute Reynolds number given the tunnel stagnation conditions.
It is seen in Fig. 6 that there is no apparent dependence of the minimum point on surface treatment. We have also compared the measured heat transfer rates at various axial positions on the plate for different surface treatments and the same nominal flow conditions. These distributions overlie each other to within run-to-run variations in test conditions. No systematic effect of the paint or the LCs, regardless of LC viscosity, is discernible. These results demonstrate that the boundary layer development is not affected by the presence of either the paint or the liquid crystals for hypersonic flow conditions over the freestream unit Reynolds number range 1.2-5.8x10⁶/R. It is important to note, however, that the observed insensitivity may not hold for comparable Reynolds numbers at lower Mach numbers, for which the boundary layer is thinner and more sensitive to surface roughness effects.
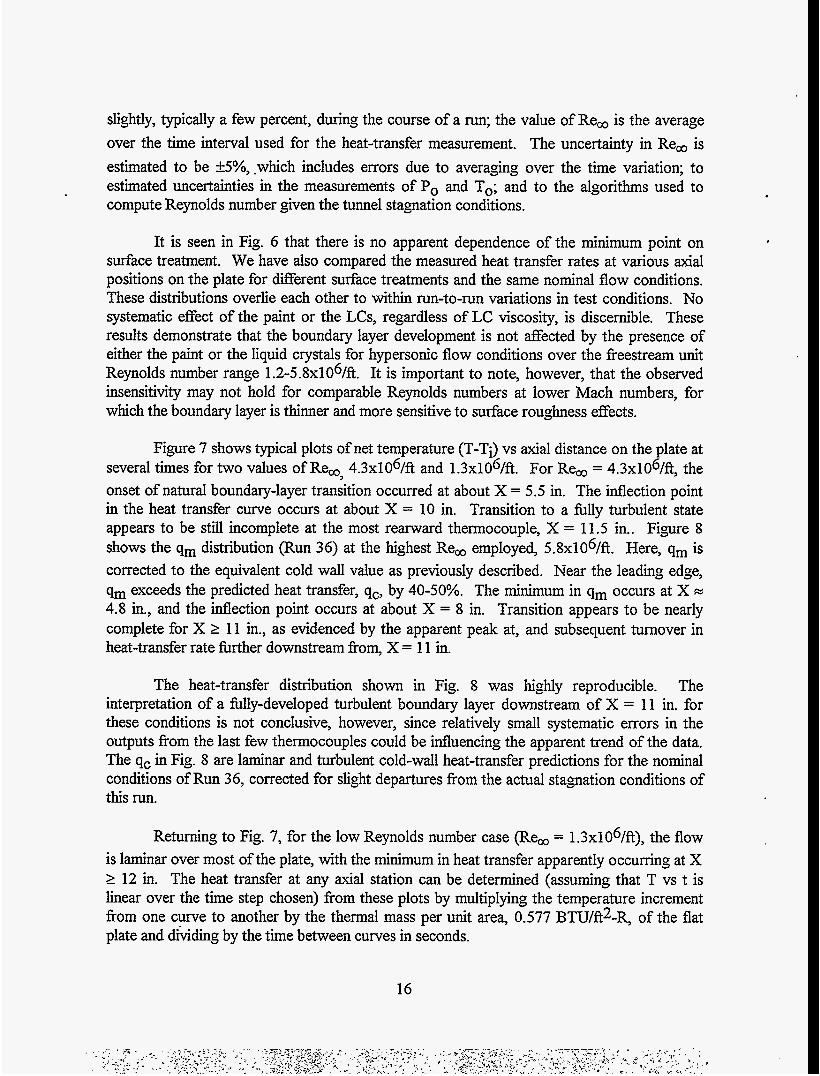
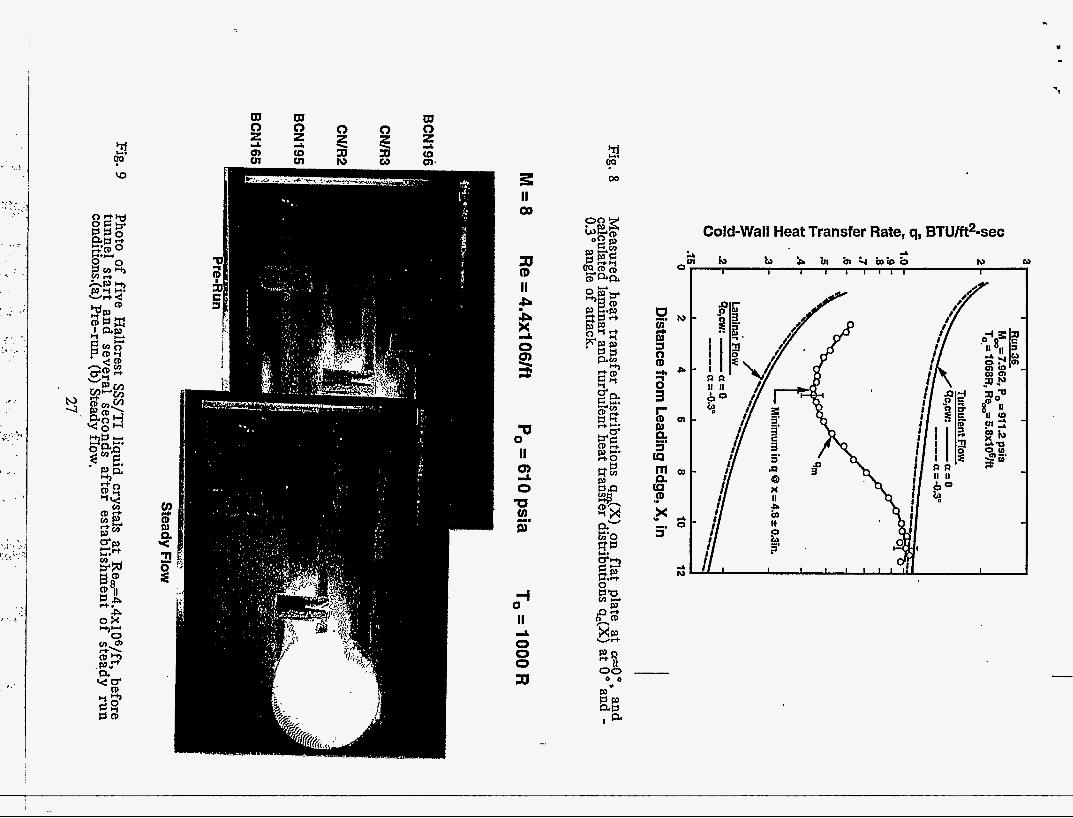
Figure 7 shows typical plots of net temperature (T-Ti) vs axial distance on the plate at several times for two values of Re, 4.3~10% and 1.3x10⁶/ft. For Re, = 4.3x10⁶/ft, the onset of natural boundary-layer transition occurred at about X = 5.5 in. The inflection point in the heat transfer curve occurs at about X = 10 in. Transition to a fblly turbulent state appears to be still incomplete at the most rearward thermocouple, X = 11.5 in.. Figure 8 shows the qm distribution (Run 36) at the highest Re, employed, 5.8x10⁶/ft. Here, qm is corrected to the equivalent cold wall value as previously described. Near the leading edge, qm exceeds the predicted heat transfer, qc, by 40-50%. The minimum in qm occurs at X = 4.8 in., and the inflection point occurs at about X = 8 in. Transition appears to be nearly complete for X 2 11 in., as evidenced by the apparent peak at, and subsequent turnover in heat-transfer rate fbrther downstream from, X = 11 in.
The heat-transfer distribution shown in Fig. 8 was highly reproducible. The interpretation of a Illy-developed turbulent boundary layer downstream of X = 11 in. for these conditions is not conclusive, however, since relatively small systematic errors in the outputs from the last few thermocouples could be influencing the apparent trend of the data. The qc in Fig. 8 are laminar and turbulent cold-wall heat-transfer predictions for the nominal conditions of Run 36, corrected for slight departures from the actual stagnation conditions of this run.
Returning to Fig. 7, for the low Reynolds number case (Re, = 1.3x10⁶/ft), the flow is laminar over most of the plate, with the minimum in heat transfer apparently occurring at X 2 12 in. The heat transfer at any axial station can be determined (assuming that T vs t is linear over the time step chosen) from these plots by multiplying the temperature increment from one curve to another by the thermal mass per unit area, 0.577 BTU/ft2-R, of the flat plate and dividing by the time between curves in seconds.
16
The agreement between the measured and predicted heat-transfer distributions on the flat plate is excellent for regions where the boundary layer appears to be fblly turbulent, Le., for large X and high unit Reynolds number. Here, the differences are typically less than 10 percent, and well within the combined estimated uncertainties of the measurements (&15%) and the calculations (10-20%). Wherever the flow is assumed to be laminar (based on the character of the laminar boundary-layer heat-transfer distribution, q,cX-1/2), the differences generally exceed the combined uncertainties. For Re, > 4x10⁶/ftY the measured heat transfer typically exceeds the predicted values by 40 percent or more at a given X on the forward part of the flat plate, and by a comparable percentage for Re, < 2x10⁶/ft over the entire instrumented length of the plate. This behavior is not &lly understood, but must in part be due to the heating by the lamps, and may in addition be related to the effects of the finite (but unquantified) fieestream turbulence level, and the possible presence of cross-flow due to the slightly-negative angle of attack. Freestream turbulence would not be expected to affect the heat transfer for the turbulent boundary layer, and this view is consistent with the observed trends. However, it is noted in Ref. 15 that averaged macroscopic variables such as heat transfer or shear stress do not accurately represent the initial phases of transition. Hence, the differences between the predicted and measured heat transfer, or related phenomena such as color change of liquid crystals, near the leading edge may simply reflect the inadequacy of the measurement technique for the early stage of the transition process.
4.3 Liquid Crystal Evaluation
Various combinations of liquid crystals were tested, singly and in combinations of up to five LCs at a time applied using the 5-slot template, for the four nominal tunnel conditions. For each test, S-VHS and 35mm still camera records were taken before, during, and after the test run. For the still photos, Kodak Kodachome IS0 100 film was used throughout.
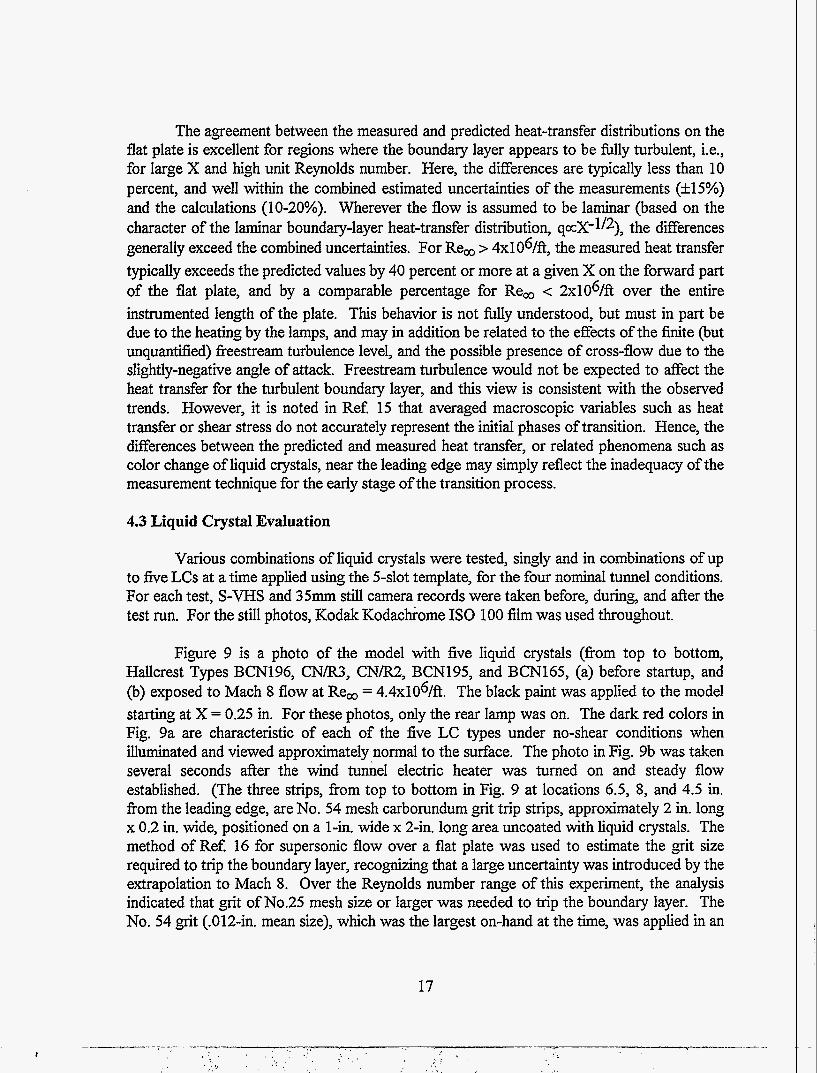
Figure 9 is a photo of the model with five liquid crystals (from top to bottom, Hallcrest Types BCN196, C N N , CN/R2, BCN195, and BCN165, (a) before startup, and (b) exposed to Mach 8 flow at Re, = 4.4x10⁶/ft. The black paint was applied to the model starting at X = 0.25 in. For these photos, only the rear lamp was on. The dark red colors in Fig. 9a are characteristic of each of the five LC types under no-shear conditions when illuminated and viewed approximately normal to the surface. The photo in Fig. 9b was taken several seconds after the wind tunnel electric heater was turned on and steady flow established. (The three strips, from top to bottom in Fig. 9 at locations 6.5, 8, and 4.5 in. fiom the leading edge, are No. 54 mesh carborundum grit trip strips, approximately 2 in. long x 0.2 in. wide, positioned on a 1-in. wide x 2-in. long area uncoated with liquid crystals. The method of Ref. 16 for supersonic flow over a flat plate was used to estimate the grit size required to trip the boundary layer, recognizing that a large uncertainty was introduced by the extrapolation to Mach 8. Over the Reynolds number range of this experiment, the analysis indicated that grit of No.25 mesh size or larger was needed to trip the boundary layer. The No. 54 grit (.012-in. mean size), which was the largest on-hand at the time, was applied in an
attempt to initiate boundary-layer transition l r ther forward on the plate compared to where transition was observed to occur naturally. The grit proved to be much too small to have any influence on the transition process, and was simply left in place for subsequent testing. The lack of effect on stability of the boundary layer due to the grit is consistent with our conclusion that neither the paint nor the LCs affect the transition location.)
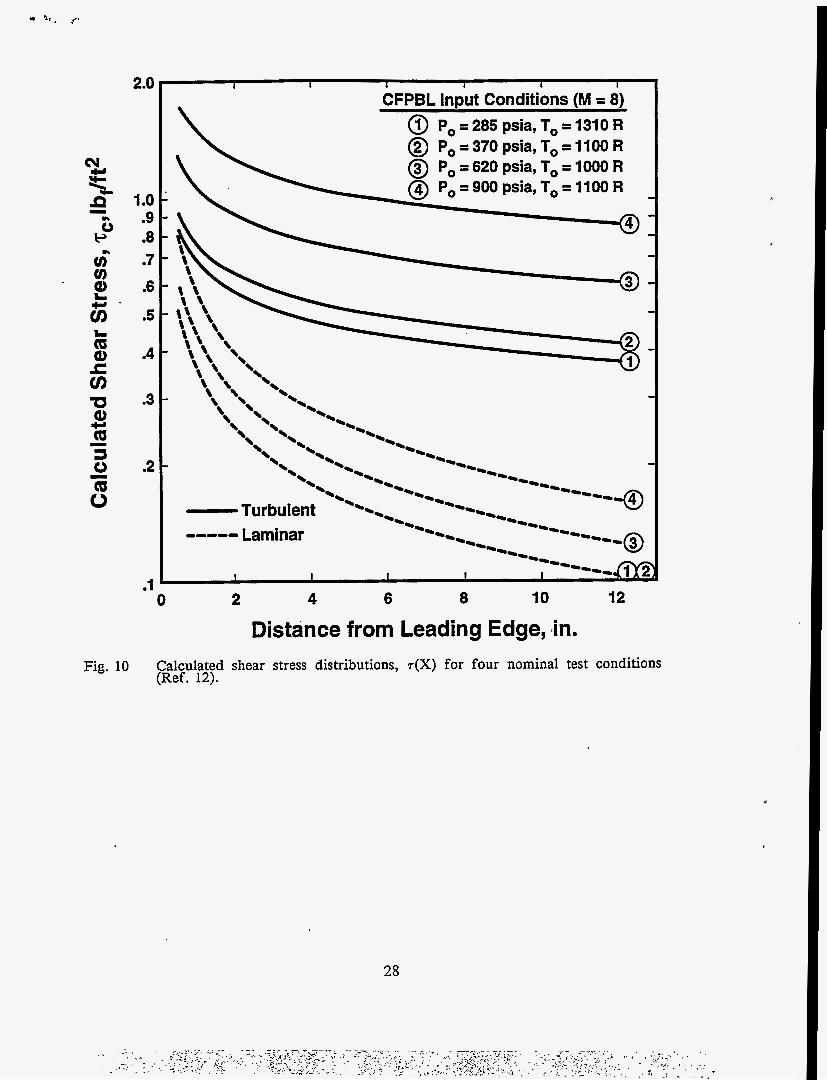
Based on comparison to the predicted and measured heat-transfer distributions presented in Fig. 8, the observed color changes can be interpreted in terms of predicted laminar and turbulent shear stress distributions on the plate for this test condition (laminar and turbulent curves labeled 3 in Fig. 10). The predicted shear stress is high near the leading edge, decreases along the laminar-flow curve to a minimum in the vicinity of X =5.5 in., increases again over the transition region, and peaks along the turbulent-flow curve at about X = 11 in. The pronounced green bands near the leading edge for the BCN196, CN/R3, and BCN195 LCs, and to a lesser extent the BCN165 LC, indicate a high shear stress, laminar boundary-layer region. For example, the BCN196 exhibits a blue-green color over the first inch downstream. From X = 2 to X = 7 in., the shear stress is approximately constant and is a minimum, based on a comparison to the measured heat-transfer distribution. Over this region, the color is red-orange. Green is recovered lrther downstream for the BCN196 as transition proceeds and the shear stress again increases. The predicted laminar flow shear stress near the leading edge is 0.4-0.6 lbp‘fiz. The predicted turbulent flow shear stress over the span from X = 7 to 11 in. is 0.6-0.7 lbp’fiz.
Therefore, allowing for uncertainty in the predicted shear stresses, the poorly- characterized effects of radiant heating due to the lamps, and LC property changes due to the flow, we conclude that the BCN196 LC is usel l in the shear stress range ~0.5-1.0 lbp’fiz. At later times, the color play is distorted or lost completely. This is because, as noted above, as the plate heats up and the viscosity decreases, the LCs become too fluid and the crystalline structure is altered or destroyed. The lack of a color response of the CN/R2 LC in the present experiments is consistent with the high viscosity (low shear stress sensitivity) of that LC. The visual records and the calculated shear stress distributions have been used to develop rough estimates for the ranges of shear stress over which each of the LCs examined will be useful. These estimated ranges of shear stress are presented in Table I. It is cautioned that the uncertainty in the ranges indicated for each LC is at least a factor of two.
We found that if run times were kept short, so that the LCs did not get too warm and thus experience excessive flow, one LC application could be used for several runs, with reproducible results. For the more viscous LC types especially, up to four runs could be conducted with a single LC application.
5 CONCLUSIONS
The model performed predictably and provided reasonable heat-transfer data with a minimum of plate distortion. There appears to be no effect of the paint and/or liquid crystals on the boundary-layer development over the plate for the model and test conditions
18
.i . \. .
employed. This result is an important observation which encourages further development of the technique for hypersonic boundary-layer transition detection. A number of commercially- available shear-stress-sensitive, temperature-insensitive liquid crystals were evaluated. The liquid crystals tested in this study appear to provide a range of shear-stress sensitivities useful over a range of hypersonic flow conditions at Mach 8, up to and including relatively high unit Reynolds numbers and shear stress levels. Efforts to extend the study to Mach 5 were unsuccessful for reasons unrelated to the characteristics of the liquid crystals.
The utility of the technique depends on a number of variables, not all of which are easily controlled. Optical access in general, and lighting in particular, is a problem. Physical constraints may limit where lamps can-be placed relative to the model and to camera systems, and even small changes in lamp position or viewing angle can noticeably affect the colors observed. The minimum light intensity necessary for visual recording is recommended to minimize complications due to radiant heating. The use of strobed light systems synchronized with the cameras should further mitigate this problem.
The physical properties of the liquid crystals are also very important to consider for liquid crystal applications in a hypersonic flow environment. Unless the model is actively cooled, a difficult and expensive feature to implement, changes in surface temperature alter the viscosity of the LC coating. Consequently, not only the color play but also the "oil flow" properties of the LCs are affected. In general, the most informative records fi-om heated, intermittent wind tunnels will be those obtained soon after the establishment of steady flow conditions. At later times, the change in LC properties can make interpretation of color changes difficult. Continuous flow facilities will almost certainly require a model injection system to limit exposure time of the LCs to the flow. A careful review of the available LC characteristics and expected flow conditions is necessary to maximize the information obtainable using the technique described here.
In summary, the LC flow visualization technique for boundary-layer transition detection has been demonstrated over a range of fieestream unit Reynolds numbers at Mach 8. The method is easy, safe, and relatively inexpensive to use. A valid interpretation of observed color changes, however, requires attention to detail (lighting and viewing angle, especially), and a general understanding of the nature of the flow and of the liquid crystals themselves. Nevertheless, we anticipate that the use of shear-stress-sensitive, temperature- insensitive liquid crystals will ultimately become an accepted boundary-layer transition detection method for hypersonic wind tunnel flows.
19
6 REFERENCES
1. Gaudet, L., and Gell, T.G., "Use of Liquid Crystals for Qualitative 2D Studies of Transition and Skin Friction", Defence Research Agency, TM AERO-2159, June, 1959.
2. Mee, D.J., Walton, T.W., Harrison, S.B., and Jones, T.V., "A Comparison of Liquid Crystal Techniques for Transition Detection", AIAA Paper 9 1-0062, Jan. 199 1.
3. Holmes, B.J., Gall, P.D., Croom, C.C., Manuel, G.S., and Kelliher, W.C., "A New Method for Laminar Boundary Layer Transition Visualization in Flight--Color Changes in Liquid Crystal Coatings", NASA TM-87666, 1986.
4. Smith, S., "The Use of Liquid Crystals for Surface Flow Visualization", AIAA Paper 90- 1382, June 1990.
5. Reda, D.C., and Aeschliman, D.P., "Liquid Crystal Coatings for Surface Shear-Stress Visualization in Hypersonic Flows", J. Spacecraft & Rockets, Vol. 29, No. 2, Mar.-Apr.
* 1992, pp. 155-158.
6. Oberkampf, W.L., Aeschliman, D.P., and Walker, M.M., "Joint Computational and Experimental Aerodynamics Research on a Hypersonic Vehicle", AGARD-CP-5 14, April 1993, pp. 23-1-23-11, (AGARD Fluid Dynamics Symposium on Theoretical and Experimental Methods in Hypersonic Flows, Turin, Italy, May 1992).
7. Oberkampf, W.L., and Aeschliman, D.P., "Joint ComputationaVExperimental Aerodynamics Research on a Hypersonic Vehicle, Part 1: Experimental Results", M A Journal, Vol. 30, NO. 8, A u ~ . 1992, pp. 2000-2009.
8. Klein, E.J., "Application of Liquid Crystals to Boundary Layer Flow Visualization", AIAA Paper 68-376, Jan. 1968.
9. Reda, D.C., "Liquid Crystals for Unsteady Surface Shear Stress Visualization", AIAA Paper 88-3834CP, First National Fluid Dynamics Congress, Cincinnati, OH, July 1988.
10. Parsley, M., The Hallcrest Handbook of Thermochromic Liquid Crystal Technology, 1991. (Also, Hallcrest Product and Application Information Bulletins LR-lOA, DS-074 DS- 19, DS-OlC, DS-024 DS-074 DS-18, and DS-22).
11. Platzer, K.-H., Hirsch, C., Metzger, D.E., and Wittig, S., "Computer-based Areal Surface Temperature and Local Heat Transfer Measurements with Thermochromic Liquid Crystals (TLC)", Experiments in Fluids, Vol. 13, No. 1, May 1992, pp. 26-32.
12. Reda, D.C., Muratore, J.J., Jr., and Heineck, J.T., "Experimental Investigations of the Time and Flow Direction Responses of Shear-Stress-Sensitive Liquid Crystals", ATAA Paper 93-0181, Jan. 1993.
13. George, A.R., and Reinecke, W.G., ''Conduction in Thin-Skinned Heat Transfer Models", A I . Journal, Vol. 1, No. 8, Aug. 1963, pp. 1956-1958.
14. Parsley, M., Hallcrest, Inc., Personal Communication, 1992.
15. Owen, F.K., "Transition and Turbulence Measurements in Hypersonic Flowst1, AIAA Paper 90-523 1, Oct. 1990.
16. Braslow, A.L., Hicks, R.M., and Harris, R.V., Jr., "Use of Grit-Type Boundary-Layer- Transition Trips on Wind-Tunnel Models", NASA TN D-3579, Sept. 1966.
21
Q
TabIc 1 Cliaractcristics of Slicar-S~rcss-Sciisi~ivc Liquid Crystals
Specific Clearing Relative Approximate Shear Temperature. F Viscositv @I 86 Fa Stress Range. Ib@2 LC Type Mnfr Color @I z = 0 Gravity
TI622 BDI-Ib Red a1 120 1-2 < 0.5 CN/R2 I-ICC Red 1 .006 149 20 >1
0.5-1 .O CN/S1 I-IC Infrared 0.983 127 13 CN/R3 I-IC Red 0.983 122 15 0.5-1.5 BCNM 1-rc Red XI 120 10 0.5-1 .O
6-8 0.3-0.8 BCN195 I3C Red/Orange ~1 118 BCN165 I-IC Red Xl 129 4 0.2-0.6
0.2-0.6 BCNl92 HC Red X l 118 3 -4 BCN194 I-IC Infrared/Red xl 118 3 0.2-0.6 BCNl93 I-IC Infrared X l 118 2-3 0.1-0.5 BNLRSOC I-IC Red W l 122 1 < 0.3
a Relative viscosity = 1 corresponds to 235 Centipoise b BDI-T, Ltd., Broom Road, Poole BI-I12 I N N England; (0202) 745520 (U.S. Representative:
C Hallcrest, Inc., 1820 Piclcwick Lane, Glenview, IL 60025; (708) 998-8580 EM Industries, I-Iawtliorne, NY 10532; (914) 592-1660)
c I
1 16.00"
6.00',-- 4.00',-4
1.00'
1.00'
1.00'
0
2.00" . 46 Type KThennocoupla
0.125" 15SPH S-S.
1 + \ - /
t
Air Gap 0.500" 10"
Fig. 1. Schematic of flat plate model used for liquid crystal evaluation.
Fig. 2. Photo of thermocouple instrumentation installed on back face of flat plate model.
23
.600
a 590 E !l? =I
Q)
CI
E 580
570
600
590 a
!! 580 Q) U E
570
560
M = 7.962, Po = 91 I .2 psia ~
To = 1068 R, Re,, 5.8x1O6/ft
Run 36
Experimental Data -1.11 CMA, CFPBL heating (qcw = 0.271 BTUlft2 sec) - CMA, best fit heating (qcw = 0.434 BYU/ft2 s e c )
I 1 1 1 1 I 1 I 1 I
0 2 4 6 8 10 12 14 16 18 20 Fig. 5a Time, sec
b - - - - M = 7.962, Po = 911.2 psia To = I068 R, Re,= 58x1 0% -
- - - - - - - - - - - - - - - - - - - - - Experimental Data -
00-1- CMA, CFPBL heating (qcw = 1.084 BTU/ft2 sec) 1 - - - CMA, best fit heating (qcw = 1.020 BTUm2 SeC) -
I I I I I 1 1 I I 1
12 14 16 18 20 0 2 4 6 %im&ec Fig. 5b
Fig. 5 Flat Rea=$8xl06/ft, (a) X=5" near minimum of heat transfer curve, and Ab2 X=l l , near the heat transfer maximum. Line throu h data in Figs. Sa-an is a best polynomial fit to measured heat transfer &at yields the equivalent cold-wall heat' transfer for T=Ti=536R.
late temperature increase (T-Ti) as a function of time fo r
25
6 -
5 - s: 3 0
-8 4 - d CI .- c 3 3 - E L 00 2 - 2
Q
U
Q)
L 1 -
7 1
0 Bare Plate Painted Plate, w/o LC's
A Paint & LC's, Hi visc. b Paint & LC's Med visc. V Paint & LC's, Low visc. 0 LC, Hi visc, w/o paint 0 LC, Low visc, w/o paint
Fig. 6.
30
IL - 25 F c .- K
c, f Q 15 a L
E g 10 a Q
- 5 Q L
c
zi: - a
I 1 I 6 8 10
Distance from Leading Edge, In.
Location of hea! transfer minimum as a function of freestream unit Reynolds number for various flat plate surface treatments (bare; painted plate; painted plate w/ and w/o LCs).
I t I I t a 9 I 2 4 6 8 10 12 14 16
Distance from Leading Edge, In.
Fig. 7 Flat plate temperature distrjbutions,. (T-Ti), for Rem=1.3x10⁶/ft (Run 33) and 4.3x10⁶/ft (Run 8) at two times during each run.
26
.
I \ , -
.' I, *
m 0 f k
m
. . . . , .
-i II
0
Cold-Wall Heat Transfer Rate, q, BTU/ft2-sec
ki L b tn b,hbb;ob )s -L
2.0 1 1 I I 1 1
CFPBL Input Conditions (M = 8)
2 4 6 8 10 12 . I 0
Distance from Leading Edge, fin. Fig. 10 Calculated shear stress distributions, T ( X ) for four nominal test conditions
(Ref. 12).
28
Distribution
MS03 12 MS0708 MS084 1 MS0828 MS0826 MS0834 MS0835 MS0835 MS0825 MS0825 MS0825 MS0825 MS0825 MS9018 MS0899 MS0619
2414 6214 9100 9 102 9111 91 12 91 13 91 13 91 15 91 15 91 15 91 15 91 15
4414 12690
8940-2
W. E. Williamson H. M. Dodd P. J. Hommert R. D. Skocypec T. J. O'Hern A. C. Ratzel D. W. Kuntz D. L. Potter W. H. Rutledge D. P. Aeschliman V. A. Amatucci M. W. Kniskern W. L. Oberkampf Central Technical Files Technical Library Review & Approval Desk for DOEIOSTI
29