c onnecting for a r esilient a merica 1 public- private partnerships: key drivers of disaster supply...
TRANSCRIPT

CCONNECTINGONNECTING FOR AFOR A R RESILIENT ESILIENT AAMERICAMERICA 1CCONNECTINGONNECTING FOR AFOR A R RESILIENT ESILIENT AAMERICAMERICA
Public- Private Partnerships: Key Drivers of Disaster Supply
Chains
Dr. Ramesh KolluruDr. Mark Smith

CCONNECTINGONNECTING FOR AFOR A R RESILIENT ESILIENT AAMERICAMERICA 2
Public- Private Collaboration
Partnership
Public SectorPrivate
Businesses
4
Owns 85% of CIKR assets
Drives 98% Supply Chains

CCONNECTINGONNECTING FOR AFOR A R RESILIENT ESILIENT AAMERICAMERICA 35
Louisiana Business Emergency Operations Center
State Initiative
To support disaster management in Louisiana by developing an accurate understanding of economic impacts to critical
infrastructures and major economic drivers, as well as facilitating the coordination of businesses and volunteer organizations with the
public sector through enhanced resource and information management.
A Partnership Of

CCONNECTINGONNECTING FOR AFOR A R RESILIENT ESILIENT AAMERICAMERICA 4
Public-Private Partnerships
The NIMSAT Institute establishment of public-private partnerships through the LABEOC seeks to mitigate the risks we face as a nation to the intricate interdependencies between CIKR assets and the public and private sector supply chains that depend on these assets.
•Through the Louisiana BEOC, the State of Louisiana will :– Facilitate communication between public and private sectors– Enable business and industry to identify roadblocks to recovery– Reduce overall economic impacts to Louisiana businesses and
industry– Mobilize government resources
- Ex.- Fuel Supply-Demand Project
*The long term goal would be to create and replicate this model in Louisiana, the Gulf Coast and the Nation.

CCONNECTINGONNECTING FOR AFOR A R RESILIENT ESILIENT AAMERICAMERICA 5
Current Issues in Public-Private Partnerships
• Can government resources be utilized?
• What types of information are useful and can be shared?
• What are the motivators and roadblocks for such
partnerships?
• Is there a governance structure that all sectors could utilize
in engaging with their counterparts or other stakeholders in
response?
• What is the capability maturity model?
• Modeling, Simulation and Analysis of Operational Capability for
Simple and Complex Events

CCONNECTINGONNECTING FOR AFOR A R RESILIENT ESILIENT AAMERICAMERICA 6
Challenges & Progress
• Information Sharing Between the Sectors- Government-to-Business Information Sharing- Business-to-Government Information Sharing** The LABEOC has begun to engage these partners in willingness to participate
• Motivators or Roadblocks- Concerns between sectors- LABEOC facilitate these partnerships- Legal policy- Integrated monitoring systems** The LABEOC managers have begun to coordinate and
solve these issues. Since the LABEOC is a neutral party there is a receptiveness .

CCONNECTINGONNECTING FOR AFOR A R RESILIENT ESILIENT AAMERICAMERICA 7
Challenges & Progress
• Capability Maturity Model
- Complex Emergencies
- Real Time Plans
- Measuring performance between interactions
** LABEOC plans to engage all sectors through a
information hub website to ensure coordinating communications
• Established private sector supply chain models already created- CPFR Model – (Collaborative Planning, Forecasting and Replenishment
**Industry Standard framework in development

CCONNECTINGONNECTING FOR AFOR A R RESILIENT ESILIENT AAMERICAMERICA 8
Fuel Supply-Demand Project
To enhance Energy sector resiliency through improved information sharing from the “platform to the pump” that enable communications across the energy supply chain to facilitate processing delivery, and distribution, while enhancing the State Energy Profile.
In collaboration with Department of Energy & Louisiana Department of Natural Resources

CCONNECTINGONNECTING FOR AFOR A R RESILIENT ESILIENT AAMERICAMERICA 9
Current Development
• SmartGrid policy
• Energy Supply-Demand Model
• Evacuation Fuel Plan
• Improved LABEOC measures for monitoring energy sector
• Conduct regional exercises that include the Gulf Coast Region

CCONNECTINGONNECTING FOR AFOR A R RESILIENT ESILIENT AAMERICAMERICA 10
Fuel Supply Grant
• Transportation/Fuel Demand Model – How much fuel is needed to support an evacuation?
• Behavioral Social Network Model– When will people evacuate? (shadow evacuations?)– Where are they likely to go?
• Fuel Supply System Model– What is the fuel availability at gas stations?
• Results for Decision Support – Can we mobilize adequate emergency fuel, if needed?

11
CCONNECTINGONNECTING FOR AFOR A R RESILIENT ESILIENT AAMERICAMERICA11
Private Industry Response to Gustav/Ike
• Public-Private Partnerships– Mobilized business products and services: $23.8
million dollars– Enhanced Situational Awareness: shortages of
fuel
• CIKR Consequence Models– Reported disruptions to operating capacity of 120
petroleum, natural gas, chemical and electricity facilities (CITGO Refinery, Entergy, Henry Hub, LOOP, Port Fourchon, etc.)
– Economic impact to Oil & Gas industry: $7.6B - $8.3B

CCONNECTINGONNECTING FOR AFOR A R RESILIENT ESILIENT AAMERICAMERICA 12
Future Research Areas
• LABEOC has begun research on partnerships
• Ability to integrate systems and plans between
sectors
• State Emergency Center communication
• Facilitation on all levels (legal issues, monitoring,
planning, etc.)
• Possible merging of operational systems
• Regional cooperation
• Energy sector and Fuel Supply- Demand project

CCONNECTINGONNECTING FOR AFOR A R RESILIENT ESILIENT AAMERICAMERICA 13
CCONNECTINGONNECTING FOR AFOR A R RESILIENT ESILIENT AAMERICAMERICA
Public- Private Partnerships: Key Drivers of Disaster Supply
Chains
Dr. Ramesh KolluruDr. Mark Smith

Ronald T. EguchiPaul AmyxCharles K. HuyckImageCat, Inc.
www.virtualdisasterviewer.com
DHS – S&T Workshop on Emergency Management: Incident, Resource, and Supply Chain Management
5-6, November 2009, UCI, Irvine, CA

Presentation Outline
• The Problem• VDV interface for damage assessment • Outreach• Future activities• Summary

There is a post-disaster need…… for expert analysis to provide rapid and accurate commentary after significant
events… to harness the skills of experts from a wide variety of industries, affiliations, and
locations… for a central repository for experts’ interpretations to improve dissemination
and discussion of data from current and past disasters
After major disasters, it is not always feasible to deploy field teams due to damage and/or access restrictions
Multiple field deployments can result in duplication of effort and costs
Data is not shared from multiple field teams

KoreaJapan
Philippines
Hong Kong
Beijing
Tibetan Plateau
Shanghai
Wenchuan Earthquake
Chengdu
2008 Wenchuan Earthquake
Details (known):May 12, 2008, 2:28pm (Local time)Magnitude: 7.9 (USGS)Location: 30.986°N, 103.364°E Depth: 19kmFault length: approx. 250km
Details (unknown):Number of ? dead (missing)
? injured? buildings
collapsed ? buildings damaged ? homeless ? evacuated ? people affected ? Economic loss
Damage Estimates:69,200 dead (20,000 missing)374,200 injured5.4 million buildings collapsed21 million buildings damaged5 million homeless15 million evacuated46 million people affectedEconomic loss US$80 billion?UNDMT Situation Report No. 8, 14 June 2008

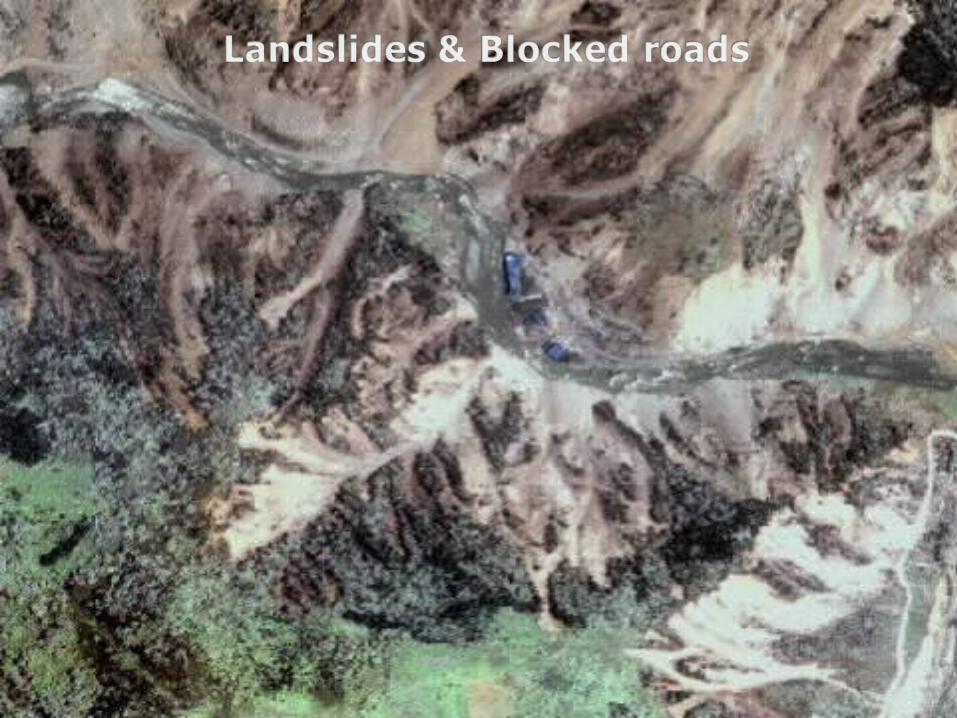
VDV Interface for Damage Assessment
• The login procedure• Accepting an assignment• Scope of evaluation• The notion of a damage scale based on
remote-sensed images• Damage assessment procedure• Results from 2008 Sichuan, China
earthquake

Figure 1. Virtual Disaster Viewer homepage
Virtual Earth navigation
controls
Virtual Earth base data
and imagery
Details of project sponsors and participating organizations
Pre- and post-disaster
satellite imagery
Derived layers
Field data
Legend for expert interpretation results
Major sponsors and affiliations
www.virtualdisasterviewer.com


Grid Cells for Analysis


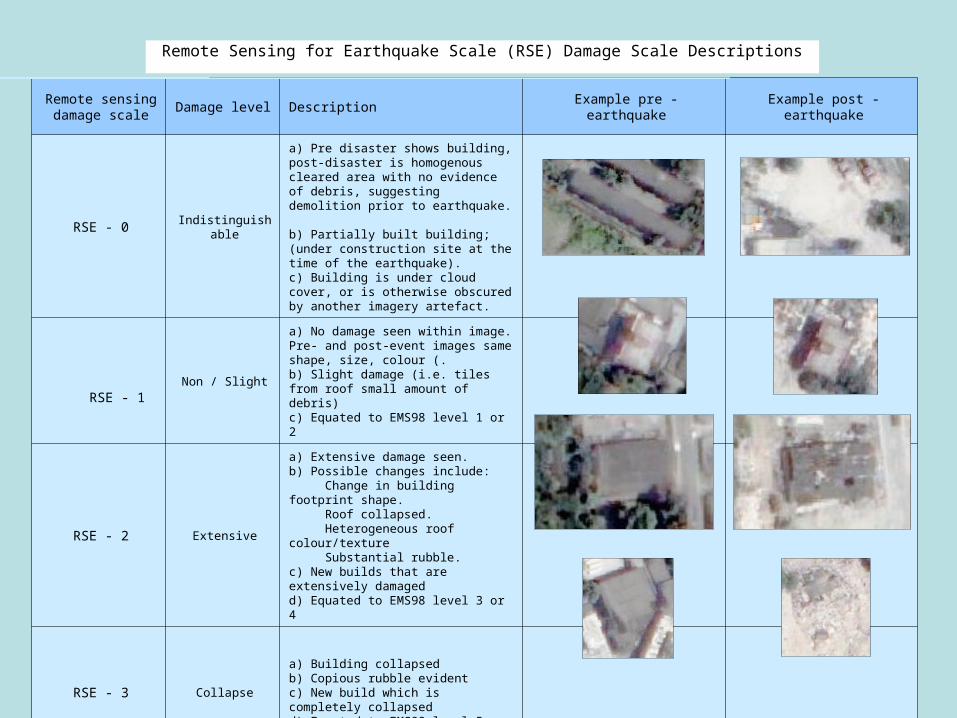
Remote sensing damage scale
Damage level Description Example pre - earthquakeExample post -
earthquake
RSE - 0 Indistinguishable
a) Pre disaster shows building, post-disaster is homogenous cleared area with no evidence of debris, suggesting demolition prior to earthquake. b) Partially built building; (under construction site at the time of the earthquake). c) Building is under cloud cover, or is otherwise obscured by another imagery artefact.
RSE - 1Non / Slight
a) No damage seen within image. Pre- and post-event images same shape, size, colour (.b) Slight damage (i.e. tiles from roof small amount of debris)c) Equated to EMS98 level 1 or 2
RSE - 2 Extensive
a) Extensive damage seen. b) Possible changes include: Change in building footprint shape. Roof collapsed. Heterogeneous roof colour/texture Substantial rubble. c) New builds that are extensively damagedd) Equated to EMS98 level 3 or 4
RSE - 3 Collapse
a) Building collapsedb) Copious rubble evidentc) New build which is completely collapsedd) Equated to EMS98 level 5.
Remote Sensing for Earthquake Scale (RSE) Damage Scale Descriptions
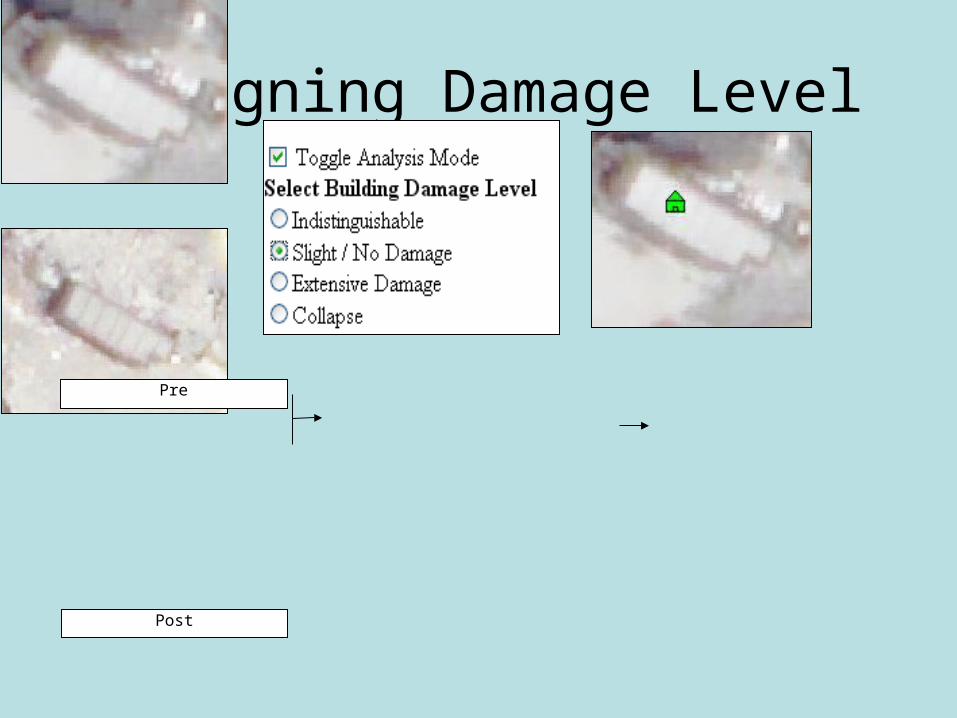
Assigning Damage Level
Pre
Post

Results
BUILDING
DAMAGE

Results
LANDSLIDE
EXTENT

Initial funding from EPSRC (UK), EERI, MCEER (USA) Tool developed by ImageCat Currently being developed for inclusion in EEFIT
missions to Indonesia & South Pacific 84 expert volunteers from 8 countries

• Conferences & Workshops• Wired Magazine article: April 2009• Imaging Notes Magazine article:
Fall 2009
• Flagship project for Community Remote Sensing theme: IEEE International Geoscience & Remote Sensing Symposium (IGARSS) 2010

• Sumatra & Samoa currently being developed• Validation of expert analysis & assessing
experts’ skills – “superusers”• Extend functionality may include
– Video field blogs & text summaries of professional findings
– Greater use of commenting facilities– Develop analytical tools for automatic
interpretation of results

• VDV developed to fill technological need for a post-disaster data portal
• Multiple functions developed according to needs of field teams on per-event basis
• Currently broadening VDV’s outreach for future funding and data partnerships
• A growing community of expert users and contributors are realizing VDV’s potential

Presented: 11/05/09 http://teamcore.usc.edu
Agent-based Evacuation Modeling:Simulating the Los Angeles International Airport
Milind Tambe, Jason Tsai, Matthew E. Taylor, Shira Epstein, Andrew Ogden, Prakhar Garg
University of Southern California
Gal Kaminka, Natalie Fridman
Bar Ilan University
Emma Bowring
University of the Pacific

Presented: 11/05/09 Jason Tsaihttp://teamcore.usc.edu
Emergency evacuationTraining and policy decisions are difficult
Scenario: Evacuation of an airport terminal after an event
Ideal: Conduct live exercises Personnel can see what actually happens
Policy-makers can try different rules
Issue: Live exercises are difficult Requires the terminal to be shut down
Requires realistic response of hundreds of people
Unethical to instill real fear/anxiety in people

Presented: 11/05/09 Jason Tsaihttp://teamcore.usc.edu
Evacuation simulationSimulations provide an answer
Proposal: Simulation replaces live exercises Evaluate different policies
Decision-making training for officer
Visual conditioning for officers
We propose to build an agent-based model with realistic human behavior and compelling visualization

Presented: 11/05/09 Jason Tsaihttp://teamcore.usc.edu
Our approachWe focus on unaddressed issues unique to the domain
BDI-style architecture Standard architecture style for agents
Social Comparison Theory mechanics General theory of how agents impact each other
Transition to emergency Model the transition from normal to emergency behavior
Massive software visualization Movie-quality people seen at eye-level

Presented: 11/05/09 Jason Tsaihttp://teamcore.usc.edu
Previous work: TeamcoreWe have worked in simulations in the past
DEFACTO system Training / coordination tool for fire
department incident commanders
Robocup Rescue Search and rescue simulation
Helicopter team simulations Helicopter attack strategy simulation

Presented: 11/05/09 Jason Tsaihttp://teamcore.usc.edu
Previous work: Academic Evac. SimulationWealth of work in evacuation simulations
BDI-style architecture Agent interactivity without underlying social theory
Social Psychology simulations Apply theories limited to very specific activities
Physics-based simulations Individual behaviors are generalized
We propose to use a general psychological model that can model both ‘normal’ and ‘emergency’ behavior

Presented: 11/05/09 Jason Tsaihttp://teamcore.usc.edu
Previous work: Architectural planningArchitectural simulations provide a high-level view
Metrics are high-level (e.g., time to clear a building)
Lacks validated realism in individual behaviorLegion software
Presented: 11/05/09 Jason Tsaihttp://teamcore.usc.edu
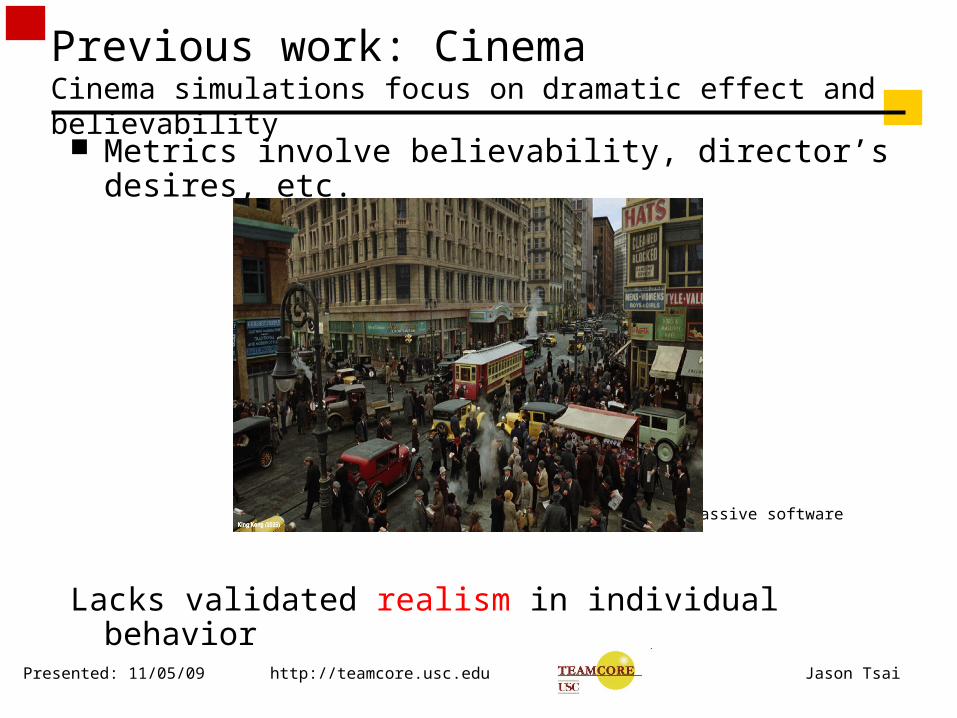
Previous work: CinemaCinema simulations focus on dramatic effect and believability
Metrics involve believability, director’s desires, etc.
Lacks validated realism in individual behavior
Massive software

Presented: 11/05/09 Jason Tsaihttp://teamcore.usc.edu
CollaborationsWe have established key collaborations
Los Angeles Airport Police and TSA First step will be to develop a simulation of Terminal 1
Massive software
USC School of Cinematic Arts
Cross-institutional team Expertise in crowd simulation, disaster response simulation, and Social
Comparison Theory

Presented: 11/05/09 Jason Tsaihttp://teamcore.usc.edu
Challenges
Computational speed Hundreds of agents with complex decision mechanisms
Parameters / Calibration Data for calibration is sensitive information
Techniques for analyzing the data are imperfect
Validation Scientific validation
Expert user buy-in
[email protected]://teamcore.usc.edu