c -d i r modeling: t i f simulation and reservoir...
TRANSCRIPT

Al-Qassab is the team leader of the Northern Onshore and CentralArabia Team of Reservoir Characterization Department. He is a PhDcandidate and holds a bachelor’s degree in geology from the University ofAlabama and a master’s degree from King Fahd University of Petroleumand Minerals (KFUPM). His work focuses on data integration in reser-voir modeling. Al-Khalifa is a geological modeler working with theNorthern Onshore and Central Arabia Team of ReservoirCharacterization Department. He holds a bachelor’s degree in geologyfrom KFUPM and is working on his master’s degree at KFUPM. Al-Khalifa is a member of the American Association of Petroleum Geologists(AAPG). Aktas joined Saudi Aramco’s Reservoir CharacterizationDepartment in 1993. He previously was with Robertson Research, U.K.,and EIE of Turkey. He has a BSc in geological engineering from IstanbulUniversity, an MSc from Leeds University and a PhD from EdinburghUniversity, U.K. His interests include sequence stratigraphy, sedimentol-ogy and reservoir characterization of both clastic and carbonate reser-voirs. He is a member of the AAPG and the London Geological Society.Fitzmaurice received a BSc in geophysics in 1978 from Virginia Tech inBlacksburg, Virginia. He worked at Texaco from 1978 to 1985 and thenjoined Saudi Aramco. He is a member of the Society of ExplorationGeologists, AAPG and European Association of Geoscientists andEngineers. Al-Ali joined the Saudi Ministry of Petroleum and MineralsResources after receiving his BS in petroleum engineering from KFUPMin 1983. In 1987 he obtained an MS degree in petroleum engineeringfrom KFUPM and joined Saudi Aramco. Al-Ali has worked in severalpetroleum industry sectors including production, drilling and reservoirengineering. He contributed to the development of new correlations andmethods of cost savings.
ABSTRACT
A new technique has been developed for modeling 3D permeabil-
ity distributions. The technique integrates all available data into a
fluid flow simulation model. The integrated modeling process
honors the essential aspects of the established reservoir descrip-
tions as well as geological facies models and engineering data.
C R O S S -D I S C I P L I N E I N T E G R AT I O N I N R E S E R V O I R
M O D E L I N G : T H E I M PA C T O N F L U I D F L O W
S I M U L AT I O N A N D R E S E R V O I R M A N A G E M E N T
Hisham M. Al-Qassab,Mohammed A. Al-Khalifa, Gurhan AktasJohn Fitzmaurice, Zaki A. Al-Ali, and Paul W. Glover

The added value of data integration of the fluid flow simula-tion is illustrated by the improved accuracy of the resultingwell performance predictions and the decrease in time require-ments for reservoir modeling history matching.
The technique utilizes diverse data at different scales to con-dition reservoir models of facies, porosity and permeability.Such data includes 3D seismic, well logs, core measurements,geologic facies distribution, flow meter logs and pressurebuildup tests. The model building process explicitly accounts forthe difference in scale of the various measurements. The modelcalculates the porosity, facies and permeability in the inter-wellvolume using geostatistical techniques that are constrained byseismic impedance derived from 3D seismic data. The use ofengineering data in the permeability modeling constrains theresults and decreases the history matching time requirements.
A case study demonstrates the modeling technique. A reser-voir model is developed for the ‘Unayzah formation in theHawtah field of Saudi Arabia. The ‘Unayzah is a highly strati-fied clastic reservoir in a mixed fluvial and eolian depositionalenvironment. Data integration provided a more realistic reser-voir model for this complex geologic setting than the conven-tional approach. Specifically, the integrated approach provid-ed a reservoir model that captured the complex and highlystratified nature of the lithological units. Fluid flow simula-tion was carried out for both the new integrated reservoirmodel and the conventional reservoir model. Results showtremendous savings in history matching time and more accu-rate results for use in reservoir management productionstrategies when applying the new technique.
I N T R O D U C T I O N
At present there is an increasing demand for detailed geologi-cal numerical models, which incorporate all available datainto reservoir characterization studies for the purpose of fluidflow simulation. Conventional modeling techniques, whichlack the ability to quantitatively integrate data, tend to pro-duce homogenous results of reservoir properties in the inter-well regions.
These models, when fed into reservoir simulations for per-formance predictions, may generate biased and unreliableresults. This necessitates the development of a method thatintegrates all available data, despite differences in scale,improving the predictive power of the models and making itpossible to obtain quicker production history matching fromreservoir simulation.
One of the primary reasons for using geostatistics in thereservoir modeling process is data integration. That is, itallows the incorporation of diverse data of varying scale. Thiscan include very descriptive data, such as conceptual geologicinterpretations, or measurements such as 3D seismic time
traces, their derivatives and the resulting interpretations.Geostatistical tools can use data such as 3D seismic to directlyor indirectly contribute to the modeling of the inter-wellregions. This may provide significant risk reduction in reser-voir development and management.
This paper presents a geostatistical methodology that hasbeen adopted for integrating geophysical, geological and engi-neering data in reservoir modeling. The Hawtah field, locatedin the central part of Saudi Arabia (fig. 1), has been chosen todemonstrate the approach. Hawtah is a recently developedfield with a wealth of modern geological, petrophysical, geo-physical and production data. Incorporating all of this infor-mation into the reservoir model exceeded the capability ofconventional numerical models.
Depositional facies maps representing geologic environ-ments were generated using core-calibrated electrofacies fromwell logs. The facies model was generated by geostatisticalinterpolation of the electrofacies logs using SequentialIndicator Simulation (SIS).
A stochastic seismic post-stack amplitude inversion wascarried out to produce a high-resolution (well log scale)acoustic impedance model. A porosity model was then gener-ated using both the SIS facies model and the acoustic imped-ance model as soft data. Finally, a permeability model wasconstructed, which is conditioned to Kh from pressurebuildups allocated by flow meter profiles, core data and theresulting porosity model.
Reservoir properties of this integrated model were theninput to the reservoir simulation and the history match results
Fig. 1. Location map of Hawtah field
S A U D I A R A M C O J O U R N A L O F T E C H N O L O G Y • S U M M E R 2 0 0 1 45

compared with those of the conventional models. Histogramsof pressure match, CPU versus time steps and error analysisplots are displayed for comparative analysis for flow predic-tions using both models.
S T R AT I G R A P H I C A N D R E S E R V O I R A R C H I -T E C T U R E O F ‘ U N AY Z A H R E S E R V O I R S I NH A W TA H F I E L D
The ‘Unayzah reservoirs in the Hawtah field are composedlargely of rocks of continental origin, organized in a highlycomplex fashion. Untangling the complex facies architectureof these reservoirs has required passing through several evolu-tionary stages. Earlier conceptions advocated a complex pic-ture with a relatively random distribution of reservoir andnon-reservoir facies distributions. However, more recentdetailed stratigraphic and sedimentological studies suggestthat the rock architecture of the ‘Unayzah reservoirs is in factmuch better organized than originally believed. Furthermore,a sequence stratigraphic scheme can be applied to allow a bet-ter understanding of reservoir prediction and connectivity formost parts of the reservoirs.
The ‘Unayzah reservoirs in the Hawtah field can be dividedinto three major units: the basal Lower ‘Unayzah (B), themiddle Upper ‘Unayzah (A), and locally well-developed basalKhuff clastics on top (fig. 2).
The Lower ‘Unayzah (B) and underlying pre-‘Unayzahsequences represent sedimentary successions filling a struc-turally irregular topography (post orogenic early rift) follow-ing the Hercynian orogeny. These sediments are composed of
dry and wet alluvial fan and also associated glaciofluvialdeposits.
The sediments of ‘Unayzah (A) signal a major shift in depositional and tectonic styles from underlying ‘Unayzah (B)sandstones. The principal reservoir unit of the ‘Unayzah (A)can be divided into five major aggradational cycles which arelaterally correlatable and can be further subdivided into 13sequences. Individual cycles show upward-cleaning character-istics, most commonly starting with trangressive lacustrineand associated sabkha and interdune facies in the lower parts,followed by aeolian, and locally by ephemeral fluvial channeldeposits in variable proportions. These cycles represent over-all upward-drying sequences developed in response to fluctu-ating climatic conditions probably caused by large-scale cyclicorbital variations. Lake transgressions are attributed to theperiods of deglaciation of gradually diminishing icecaps.Thickening of cycles along the flanks of fields is attributed toongoing subtle differential tectonic subsidence.
The youngest reservoir unit, the Basal Khuff, is character-ized in the study area by localized lowstand incised valley fill sandstones, which form locally prominent high-qualityreservoir bodies.
This brings the total number of stratigraphic sequences/zones to 15, which will be used for the purpose of reservoirmodeling.
‘ U N AY Z A H D E P O S I T I O N A L FA C I E S M A P SA N D M O D E L
The goal of building facies models in any reservoir characteri-zation study is to identify the spatial distribution of rocktypes that control fluid flow behavior. However, one difficultyin any study, including this one, is the availability and qualityof core data that define rock or facies types. Therefore, weadopted a two-fold method.
First, we identify facies types and associations in terms ofdepositional environment from cored wells so that geologicalcharacteristics can be explained in details that are geologically
46 S A U D I A R A M C O J O U R N A L O F T E C H N O L O G Y • S U M M E R 2 0 0 1
Fig. 2. ‘Unayzah stratigraphic chart
LITHOSTRATIGRAPHYCHROMOSTRATIGRAPHY
Age
210Rhastian
Morian
Carnian
Ladinian
LUHJUMLUHJUMLUHJUMU
Anidan
Bkythian
Kazanian
Kungurian
Arigniann
Sakmarian
Aggollan
Stphanian
Wagtollan
Kamurian
Tatarian
220
230
240
250
260
270
280
290
300
310
320
Syst. StageSer.
SEQUENCES
3rd 2nd
TECTONICEVENTS
TRIA
SSIC
PER
MIA
NC
AR
BO
NIF
ERO
US
MID
DLE
UPP
ERU
PPER
UPP
ERM
IDD
LEL.
Jilh
-su
dai
rM
inju
r-M
arra
t
SAH
TAN
Kh
uff
Un
ayza
hPr
e-U
nay
zah
seq
uen
tes
MARRAT
U. MINJUR Fm. clastics
Erosion
Erosion
JILH Fm. anhydrites & carbonates
SUDAIR clasticsSSUDA
KHUFF Fm. cyclic anhydrites,carbonates & shales
Basal Khuff sandstonesndstonesandstones
’UNAYZAH-Asandstones and mudstones
B’UNAYZAH-BB
HARADH &JUWAIL Fms.
PRE-’UNAYZAHFORMATIONSof alluvial fan andglacio-fluvial origin
Kimmerianorogeny
Tethysoceanicrifting
Deglaciation
Subtle rifttectonics&glaciation
Thermal upliftafterHercyrianorogeny
FACIES TYPE DESCRIPTION
Dune Medium to fine grained clean sandstones, well sorted, poorly cemented.
Interdune Very fine to fine grained, moderately argillaceoussandstones, horizontal to wavy laminated.
Lake margin Very fine grained sandstone, interlaminated sabkha with silty layers. Horizontal to wavy bedded.
Fluvial Fine to coarse grained, poorly sorted sandstones, organized into sharp erosive based upward-finingpackage.
Lacustrine Variable silty mudstones, present in varying thicknesses,most commonly at the base of upward-drying cycles.
TABLE 1. DESCRIPTION OF DEPOSITIONAL ENVIRONMENTAL FACIES

sound. Once the facies were identified at cored wells, theywere extended to non-cored wells, which have well logs avail-able. The output from this method was a foot-by-foot deter-mination of depositional environmental facies types in eachwell in Hawtah field. Table 1 shows a description of each ofthe depositional environmental facies associations.
Facies maps were hand-drawn by the geologist for each ofthe 13 zones within ‘Unayzah (A) reservoir. This was accom-plished by simply assigning a facies type for each well for agiven zone. This facies type represents the facies with thehighest proportion for a given zone. A facies value was thenplotted for every well location, and directional data from borehole image logs in the form of a trend were placed next to thefacies type. This map was then hand-contoured honoring thefacies type, directional indication from well image logs andthe regional depositional characteristics of ‘Unayzah forma-tion (fig. 3).
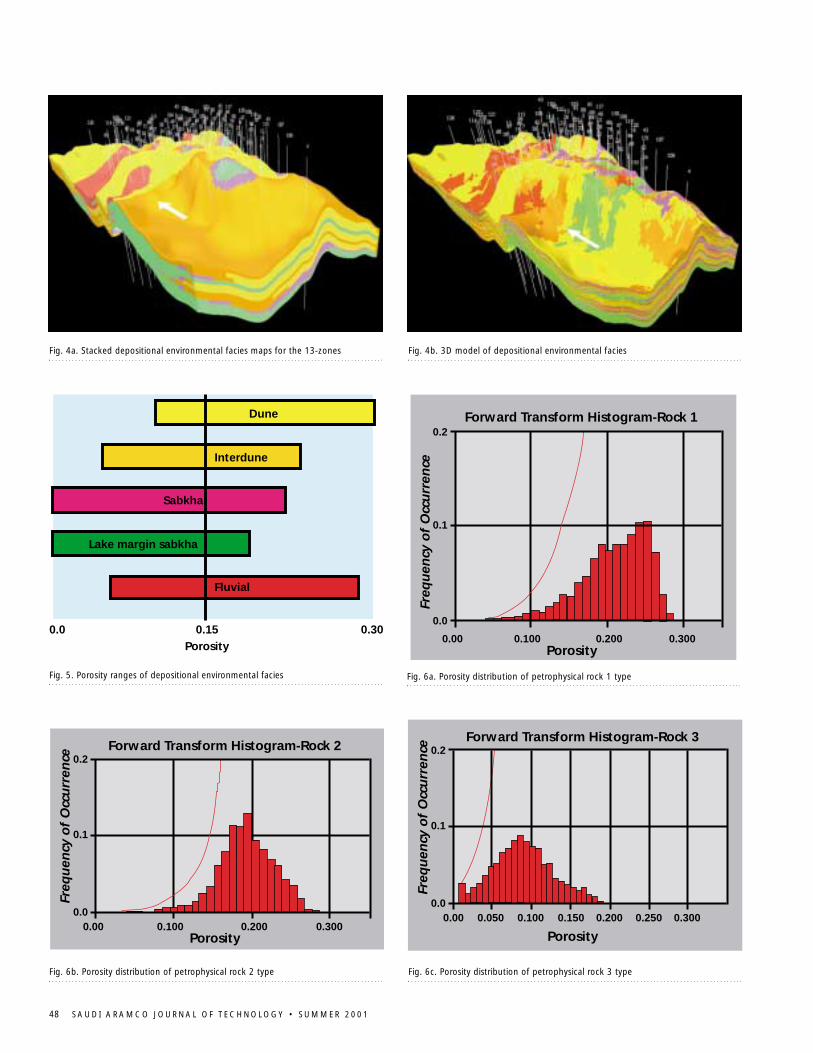
These hand-drawn maps were then used to build a 3Denvironment of depositional facies model for the entire reser-voir. This was done by treating each facies type from thehand-drawn facies maps as a region, and then separately dis-
tributing facies available at wells within that region using acategorical geostatistical algorithm for facies, namely SIS. Fig.4 shows comparisons between facies maps for a selected zoneand the resulting 3D model.
‘Unayzah petrophysical rock model
Examination of reservoir properties such as porosity and per-meability for their different depositional environmental faciesindicated substantial overlap between them, as clearly seen infig. 5. Therefore, it was concluded that depositional environ-mental facies could not be used alone to determine reservoirflow units for the purpose of this study. As a result, an in-housecluster analysis was used to establish petrophysical rock typesfor all the wells utilizing eight electric log curves. These petrophysical rock types were then cross-referenced with the core data.
The result showed three main petrophysical rock typeswith a distinct reservoir quality for each one: namely reservoir-rock (rock 1), an intermediate rock type (rock 2),and non-reservoir rock (rock 3). Table 2 shows detaileddescriptions of each rock type. Furthermore, univariate
interdune
dune
dune
sabkha
fluvial
lacustrine
DEPOSITIONAL MODEL FOR A DRY ’UNAYZAH CYCLE
AN ERG MARGIN DEPOSITIONAL SETTING
ALLUVIAL FANS/FLOOD PLAIN DUNES AND INTERDUNE
BRAIDDELTAS
SABKHASOVERBANK
BRAIDEDFLUVIALCHANNELS
BRAID DELTAS
LACUSTRINE
GH
HW
Hawtah Field
Fig. 3. Hand-contoured map (left) of depositional facies using well data and regional depositional setting (right)
S A U D I A R A M C O J O U R N A L O F T E C H N O L O G Y • S U M M E R 2 0 0 1 47
48 S A U D I A R A M C O J O U R N A L O F T E C H N O L O G Y • S U M M E R 2 0 0 1
Forward Transform Histogram
Porosity
Forward Transform Histogram-Rock 1Fr
equ
ency
of
Occ
urr
ence
0.2
0.1
0.0
0.00 0.100 0.200 0.300
Fig. 6a. Porosity distribution of petrophysical rock 1 typeFig. 5. Porosity ranges of depositional environmental facies
Dune
Interdune
Sabkha
Lake margin sabkha
Fluvial
0.0 0.15Porosity
0.30
Fig. 4a. Stacked depositional environmental facies maps for the 13-zones Fig. 4b. 3D model of depositional environmental facies
Forward Transform Histogram-Rock 2
Porosity
Freq
uen
cy o
f O
ccu
rren
ce 0.2
0.1
0.00.00 0.100 0.200 0.300
Fig. 6b. Porosity distribution of petrophysical rock 2 type
Forward Transform Histogram-Rock 3
Porosity
Freq
uen
cy o
f O
ccu
rren
ce 0.2
0.1
0.00.00 0.050 0.100 0.150 0.200 0.250 0.300
Fig. 6c. Porosity distribution of petrophysical rock 3 type

statistics of porosity for each rock type show clear separationbetween each class of porosity as indicated in the histogramsshown in fig. 6.
An attempt was made to build a 3D petrophysical rockmodel as defined at the wells, but the resulting model (fig. 7)has no geological character or meaning. Therefore, it wasdecided to combine both the environmental/depositionalfacies model built earlier, fully supported by the geologist,with the petrophysical rock type model, supported by thereservoir engineer, into a single integrated facies model. Thiswas accomplished by distributing the petrophysical rock typesdefined at the wells within each environment of depositionalfacies separately. Fig 8 shows the resulting 3D model of petro-physical rock type distributions utilizing a depositional envi-ronmental facies model as regions.
Stochastic seismic inversion
A post-stack amplitude inversion was performed on the 3DHawtah seismic volume for the purpose of incorporating seis-
mic impedance data into the 3D Hawtah model. That is, theavailable seismic data was transformed from wiggle traceinformation to acoustic impedance to be useful for influencing3D reservoir descriptions. This transformation and integrationexplicitly considered that seismic-based information is animperfect predictor of well impedance logs and, subsequently,an even less perfect predictor of facies.
Stochastic inversion has been employed in this study in placeof the conventional deterministic approach, which givesabsolute impedance results with resolution dependent on theinherent seismic bandwidth. The stochastic inversion approachcapitalizes on stochastic simulations such as Sequential GaussianSimulation (sGs)-including collocated cokriging to generate mul-tiple, equi-probable realizations of impedance pseudo-logs ateach seismic trace location and then selecting the closest one tothe actual seismic trace. Moreover, the stochastic inversionapproach honors the constraining well impedance logs alongwith their vertical resolution as well as the specified univariateand bivariate statistics of impedance by area and/or zone.
Elements of the inversion processing of the ‘Unayzah reser-voir included a simultaneous wavelet estimation and time-depth analysis, zero-phase broadband reflectivity processing,3D forward modeling of low-frequency reflectivity balancingand impedance fields, deterministic inversion, and a high-fre-quency log-scale stochastic simulation of impedance con-strained by the deterministic inversion. The result is an imped-ance model at the same scale of resolution as the well logs asshown in fig 9.
Fig. 7. Slice of the petrophysical rock model
Fig. 8. Petrophysical rock model using rock types defined at wells and environmentof depositional facies model as regions
ROCK TYPE DESCRIPTION
Rock 1 Well sorted, medium to coarse grain sandstone.Connate water saturation of less than 10 percent and gamma ray of less than 30 API units.
Rock 2 Fine to medium grained silt sandstone. Gamma raybetween 30-45 API units.
Rock 3 Fine grained siltstone. Gamma ray greater than 45API units with high connate water saturation.
TABLE 2. DESCRIPTION OF PETROPHYSICAL ROCK TYPES
S A U D I A R A M C O J O U R N A L O F T E C H N O L O G Y • S U M M E R 2 0 0 1 49

A seismic horizon picked at the top reservoir, combinedwith time-to-depth relationships determined from log-to-seis-mic-ties, was used to convert the geologic model layeringscheme to seismic micro-horizons within the reservoir, and toestimate the seismic wavelet.
Time-to-depth conversion of Acoustic Impedance (AI)
Reservoir modeling is carried out in the depth domain, whichrequires the conversion of seismic acoustic impedance (AI)from the time-to-depth domain. The conversion can be doneby simply snapping the impedance values between two mark-ers, which are equivalent to the same depth markers, into apre-defined 3D grid.
In the case of the ‘Unayzah model, the geological 3D reser-voir grid model was defined in depths utilizing all the 13zones and an areal grid which covers the field outline. Thetotal number of vertical cells (layers) is 133 with an areal gridof 113 in the x direction and 217 in the y direction (fig. 10),making the model size more than three million cells in total.AI data among each of the 15 zones (which are available intime domain) were snapped to the corresponding 15 zones indepth. This conversion from one domain to another is consid-ered as an implicit one, unlike the conventional velocity-basedconversion. Fig. 11 shows a schematic diagram of how thiswas done.
50 S A U D I A R A M C O J O U R N A L O F T E C H N O L O G Y • S U M M E R 2 0 0 1
Fig. 10. Areal grid showing number of cells in X- and Y-directions
Fig. 11. Schematic diagram showing time, top, to depth, bottom and conversion.The 25 cells are snapped between two equivalent markers.
Fig. 9. High-resolution seismic impedance model as a product of stochasticinversion

Acoustic Impedance porosity relationship
Well data were thoroughly examined by means of univariateand bivariate analysis such as histograms and scattergrams,respectively, to look for a systematic relationship between wellAI and porosity. Fig 12 shows a cross plot of porosity and AI,which indicated a large cloud of data with no strong relation-ship between these two variables. However, there was evi-dence of a strong AI and porosity relationship once the datawas segregated by petrophysical rock type as shown in fig.13. This figure shows that the better the reservoir quality rock(rock 1) the higher the correlation coefficient between porosi-ty and AI. However, in the non-reservoir rock type (rock 3),the relationship between the two variables is lost. As a result,
facies modeling plays a major role in determining how muchweight the seismic should have to influence the estimation ofporosity in the inter well regions.
Porosity and permeability modeling
A 3D porosity model was built using the high-resolutionimpedance model and utilizing the proper correlation coeffi-cient for each rock type as defined in the 3D petrophysicalrock model built earlier. This was accomplished through theuse of sGs of porosity with collocated cokriging using AI as
Fig. 12. Cross plot of well porosity, X-axis, AI and Y-axis, for the entire reservoir Fig. 13a. Cross plot of well porosity, X-axis, AI and Y-axis, for type 1 rock
Fig. 13b. Cross plot of well porosity, X-axis, AI and Y-axis, for type 2 rock
Fig. 13c. Cross plot of well porosity, X-axis, AI and Y-axis, for type 3 rock
Aco
ust
ic Im
ped
ance
Aco
ust
ic Im
ped
ance
Aco
ust
ic Im
ped
ance
Aco
ust
ic Im
ped
ance
S A U D I A R A M C O J O U R N A L O F T E C H N O L O G Y • S U M M E R 2 0 0 1 51

soft data. Fig. 14 shows the resulting 3D model of facies’ spe-cific porosity. The sGs was chosen for its ability to generatemodels of porosity, which capture the heterogeneity of thereservoir as well as its power to generate multiple realizationsof modeled porosity models, which can be ranked for usewith fluid flow simulation tools, such as streamline simula-tion. In the case of ‘Unayzah reservoir, only one realization ofporosity was selected for fluid flow simulation for practicalreasons.
Permeability curves were constructed for each well in theHawtah field honoring both the permeability thickness frompressure buildups, flow meter profiles and core permeabilitydata. The flow profile is used to allocate the total or grossmeasurement of pressure buildup to a higher resolution per-meability log. Fig. 15 illustrates how flow meter data is usedin allocating permeability logs which have the same scale andresolution as the flow meter profile. The newly produced per-meability log is then integrated with core porosity and perme-ability data (fig. 16) for each facies to overcome the problem
52 S A U D I A R A M C O J O U R N A L O F T E C H N O L O G Y • S U M M E R 2 0 0 1
Fig. 14. Rock specific porosity model using sGs with collocated cokriging
Fig. 15. Permeability thickness (Kh) allocated by flow meter profile in one of Hawtah field wells
Flow Meter

of missing data at non-perforated intervals of the well. Theintegration is accomplished by assigning permeability valuesfrom cloud transforms of core porosity and permeability asshown in fig. 17.
In non-perforated intervals, however, facies-based cloudtransforms are used to randomly sample possible permeabilityvalues from the core data for a given porosity class. A 3D correlated probability field was generated from the existingconditioned permeability logs at each well location. The corre-lated probability field is then used to sample the cloud trans-forms for each facies. For a given porosity value correspondingto the existing facies-based porosity model it then assigns a per-meability value. The result is a permeability model that bothhonors the engineering data at the well location (permeability
from pressure buildup and flow meter) and retains core porosi-ty and permeability characteristics for each facies. Stratificationof the ‘Unayzah reservoir is better captured this way than usingconventional techniques, as illustrated in fig. 18, where thinlayers of high permeability are retained in the model thatwould have otherwise been lost.
Conventional porosity and permeability models
Two sets of porosity and permeability models were construct-ed using the interpolation methods of least squares andinverse distance and a linear transformation of porosity topermeability. Porosity was distributed between the wells usingthe inverse distance for the same 3D gridded integrated frame-work. Fig. 19 shows the inverse distance porosity model. This
Fig. 16a. Cross plot of core porosity and permeability for type 1 petrophysical rock Fig. 16b. Cross plot of core porosity and permeability for type 2 petrophysical rock
Fig. 16c. Cross plot of core porosity and permeability for type 3 petrophysical rock
Porosity Facies Buildup K Constrained KPossible Kfrom core
0.030.0 0.0
5000.00.0
5000.0
At non-perforated intervals, cloud transforms are
used to randomly sample possible
permeability values
Engineering-derived Kis used to sample possible K values
from cloud transforms
Fig. 17. Integrating buildup permeability as selecting criteria in sampling a range ofpermeability values from core data
S A U D I A R A M C O J O U R N A L O F T E C H N O L O G Y • S U M M E R 2 0 0 1 53

54 S A U D I A R A M C O J O U R N A L O F T E C H N O L O G Y • S U M M E R 2 0 0 1
1.0
0.8
0.6
0.4
0.2
0.00.0 0.5 1.0
kt
krokrw
Fig. 18. 3D permeability model using core, engineering and seismically constrainedrock-specific porosity model
Fig. 19. Porosity model using inverse distance approach
Fig. 20. Permeability model using linear transformation of porosity to permeability
Fig. 21. An example of relative permeability curves for rock 1 tType with five porosity bins
Fig. 22. Cross section of integrated model showing water breakthrough time. Notethe stratification, right, of the reservoir.
Fig. 23. A cross section of conventional model showing water breakthrough time.Note the uniform fluid front, right, of the reservoir.

figure shows a very homogeneous porosity distribution,achieved by the inverse distance interpolation using only thewell porosity data.
The permeability model was built by directly transformingthis porosity model. A regression line was fitted through thecloud of core porosity and permeability values by averagingthe distribution of permeability for a given porosity value.This linear relationship was then used to transform the poros-ity model. The resulting permeability model is unconstrained,with no actual permeabilities at the well locations. Fig. 20shows the resulting homogenous permeability distributionderived using this technique.
Fluid flow performance
To determine the level of accuracy between the two approachesand the advantage of data integration, fluid flow simulationswere run. Several criteria were set to determine the level ofaccuracy, which included water breakthrough time, CPU timerequired to history match and fluid flow movement pattern.
The simulation models were constructed using permeability,porosity, depth and cell thickness and petrophysical rocktypes. No upscaling was done on either set of models to elimi-nate any inherent errors associated with upscaling. Relativepermeability curves and capillary pressure curves were builtfor each rock type. The global porosity of rock types weresplit into five bins for simulation modeling as shown in fig. 21.Water injectors were placed at the down-dip ends of the struc-ture while oil producers were placed on the structural high.
Water floods were modeled using a streamline simulatorwith the porosity and permeability distributions obtainedfrom both the conventional and the integrated approach.
Quick-look water flood simulations provided water break-through times, fluid front behavior and water cut compar-isons. A detailed fluid flow simulation was also carried outusing a finite difference simulation technique for bothapproaches to assess the required CPU time for history match-ing and pressure and error analysis comparisons.
R E S U LT S A N D D I S C U S S I O N
Each set of models produced very different flow results in termsof water breakthrough times and fluid movement patterns.
In the case of the integrated models, water had a preferreddirection through thin zones of high permeability (fig. 22)capturing the stratification of the reservoir model and moreclosely matching well observations.
By contrast, for the conventional approach the fluid frontmovement has no preferred direction throughout the model,shown in fig. 23, because the conventional reservoir model ismore homogenous compared to the integrated model. Thecomputed water arrival time of the integrated model is amuch closer match to the field data than that of the conven-tional model shown in fig. 24.
The fluid flow simulation results seem to indicate a signifi-cant impact on level of accuracy in both history matchingtime and well performance. Fig. 25 shows the error analysisfor each time step for both the conventional and the integrat-ed models. The error at each time step for the integratedmodel is smaller and more stable than the errors from theconventional non-integrated model. Another advantage of theintegrated approach is clearly seen in the improvement of sim-ulation speed for every time step, shown in fig. 26, with asmuch as 17 percent savings of computational time withoutchanging the properties of the model.
Fig. 24a. Water cut of integrated model. Note the water arrival time compared tofield date.
Fig. 24b. Water cut of conventional model. Note the water arrival time comparedto field date.
S A U D I A R A M C O J O U R N A L O F T E C H N O L O G Y • S U M M E R 2 0 0 1 55

Improvement in using the integrated approach is shown infig. 27, which compares calculated pressure values versusobserved pressure. As shown in the figure, the calculated pres-sures from the integrated model simulation match theobserved pressure data. The calculated pressures from theconventional model simulation overestimates the observedpressures by up to 25 percent.
C O N C L U S I O N
A new technique for integrating data of diverse sources anddifferent scales has been presented. The added value of dataintegration has been demonstrated by the significant effect onthe characteristics of the reservoir models generated. The inte-gration of geological depositional facies data produced pro-found effects on the spatial distribution of petrophysical rocktypes between wells. Moreover, the incorporation of seismicacoustic impedance data provided additional informationallowing the heterogeneity and small-scale variations in theinter-well regions to be captured in the model. The integratedmethod provided more realistic and meaningful models forthe complex heterogeneity of the ‘Unayzah reservoir as com-pared to the homogenous results produced by the non-inte-grated, conventional approach. The effect of predictions offluid flow behavior was significant when using the integratedapproach. Fluid flow movement patterns, breakthrough time,major reduction of CPU time and the pressure match withobserved data are only a few examples of the many advan-tages of this integrated approach.
A C K N O W L E D G M E N T S
The authors would like to extend thanks to the University ofAberdeen for their support. We wish to thank our colleaguesHassan Al-Kaf, Maher Al-Marhoon and Khalid Al-Mashouqfor their valuable contributions.
56 S A U D I A R A M C O J O U R N A L O F T E C H N O L O G Y • S U M M E R 2 0 0 1
2900
2700
2500
2300
2100
1900
1700
15001994 1995 1996 1997 1998 1999
Time
Pres
sure
CONVENTIONAL
INTEGRATED
ACTUAL
Fig. 25. Error plot analysis for each time step for both approaches
Fig. 26. Comparison of the two approaches in terms of CPU time
Fig. 27. Pressure match comparison between both types of approaches

R E F E R E N C E S
Al-Ali, Z. and H. Alqassab. 2000. “Optimizing SimulationModels by Upscaling from Integrated Reservoir Models,A Case History,” SPE 59448.
Alqassab, H. 1999. “Constraining Permeability Field toEngineering Data: An Innovative Approach in Reservoir Characterization,” Saudi Aramco Journal of Technology, fall.
Alqassab, H. and C. Heine. 1998. “A GeostatisticalApproach to Attribute Interpolation Using FaciesTemplates, An Advanced Technique in ReservoirCharacterization,” SPE 49449.
Araktingi, U. and W. Bashore. 1992. “Effects of Propertiesin Seismic Data on Reservoir Characterization andConsequent Fluid Flow-Predictions When IntegratedWith Well Logs,” SPE 24753.
Araktingi, U., W. Bashore, T. Hewett and T. Tran. 1990.“Integration of Seismic and Well Log Data in ReservoirModeling,” presented at the Third Annual NIPERConference on Reservoir Characterization, Tulsa, Oct. 5-7.
Jones, D., Z. Al-Ali. M. Al-Khalifa and Aktas, G. 1999.“Development of a Conceptual Model for The StudyField, Saudi Arabia,” an internal report.
S A U D I A R A M C O J O U R N A L O F T E C H N O L O G Y • S U M M E R 2 0 0 1 57