by - rutgers university
TRANSCRIPT

SEX DIFFERENCES IN RESPONSE TO ACUTE DIESEL EXHAUST EXPSOURE
by
Chizoba Nwankwo
A dissertation submitted to the
Graduate School-New Brunswick
Rutgers The State University of New Jersey
And
The School of Public Health
University of Medicine and Dentistry of New Jersey
In partial fulfillment of the requirements
For the degree of
Doctor of Philosophy
Graduate Program in Public Health
Written under the direction of
Professor Junfeng (Jim) Zhang and
Professor Nancy Fiedler
And approved by
__________________________________
__________________________________
__________________________________
__________________________________
__________________________________
__________________________________
New Brunswick New Jersey
May 2010
ii
ABSTRACT OF THE DISSERTATION
Sex Differences in Response to Acute Diesel Exhaust Exposure
By Chizoba Nwankwo
Dissertation Directors
Dr Junfeng (Jim) Zhang
And
Dr Nancy Fiedler
Introduction Diesel exhaust is ubiquitous and has been shown to cause a variety of
health effects related to innate immune response in the airways that leads to a cascade of
local and systemic health effects Sex is known to influence variations in immune
responses and many other aspects of the internal physiological environment
Aims The primary aim of this dissertation research is to evaluate whether there are sex
differences in the symptomatic local and systemic inflammation and acute-phase
responses that have been attributed to acute diesel exhaust exposure The secondary aim
is to see if sex differences exist in the rates of metabolism of diesel exhaust and its
metabolites
Methods In a crossover design study healthy subjects were exposed to 300microgm3 of
diesel exhaust and clean air for 1 hour each in a controlled environmental exposure
chamber on two different days (ge1 week washout) in random order Nasal lavage and
sputum samples were collected and analyzed for cytokines and soluble proteins in
relation to local inflammation Blood samples were collected and analyzed for cytokines
acute phase reaction proteins neutrophils and cell blood counts in relation to systemic
inflammation Questionnaires were used to collect self-reported symptoms Spot urine
iii
samples were collected within 24 hours of exposure to analyze the levels of 1-
aminopyrene a metabolite of 1-nitropyrene which is the most abundant nitro-polycyclic
aromatic hydrocarbons in diesel exhaust
Results There was a statistically significant sex difference in self reported somatic and
lower respiratory symptom severity ratings with females having higher symptom severity
ratings than males after exposure to diesel exhaust relative to clean air There was also a
statistically significant sex difference in the concentration of tumor necrosis factor ndash α in
nasal lavage samples and platelet count in peripheral blood with males having higher
tumor necrosis factor ndash α concentrations than females and lower platelet counts than
females after exposure to diesel exhaust relative to clean air
Conclusion Sex is a significant effect modifier for certain health effects of acute diesel
exhaust exposure with females tending to show greater lower respiratory and systemic
effects and males tending to show greater upper respiratory effects
iv
Acknowledgement
It gives me great pleasure to thank all those who made this dissertation possible
by providing me with strength wisdom moral and financial support throughout the entire
process
I would like to express the deepest appreciation to my committee chairs Dr
Junfeng (Jim) Zhang and Dr Nancy Fiedler Without their combined guidance and their
available and persistent help this dissertation would not have been possible
I would like to thank Dr Pamela Ohman-Strickland for her time and patience in
providing me with the knowledge and help that I needed to successfully conduct and
interpret the required statistical analysis I am very grateful to Dr Mark Robson for all
his constant support and encouragement throughout the entire project I would also like to
thank my other committee members Dr Alan Stern and Dr Robert Laumbach for their
insightful critique and comments on my dissertation
I would like acknowledge the staff at the Environmental and Occupational Health
Sciences Institute for all the help that they provided to me with the creation of the
datasets that were used In addition I would like to thank the student members of my
doctoral journal club for their friendship and support
I would like to sincerely thank my family for all their tremendous love
encouragement support and all the sacrifices that they made on my behalf to help me to
successfully complete my dissertation
Lastly I offer my regards and blessings to all of those who supported me in any
respect during the completion of the project
v
Dedication
To My Wonderful Family
vi
Table of Contents
Abstract helliphelliphelliphelliphelliphelliphelliphelliphelliphelliphelliphelliphelliphelliphelliphelliphelliphelliphelliphelliphelliphelliphelliphelliphelliphelliphelliphelliphelliphelliphellip ii
Acknowledgement helliphelliphelliphelliphelliphelliphelliphelliphelliphelliphelliphelliphelliphelliphelliphelliphelliphelliphelliphelliphelliphelliphelliphelliphelliphellip iv
Dedication helliphelliphelliphelliphelliphelliphelliphelliphelliphelliphelliphelliphelliphelliphelliphelliphelliphelliphelliphelliphelliphelliphelliphelliphelliphelliphelliphelliphelliphellip v
1 Introduction helliphelliphelliphelliphelliphelliphelliphelliphelliphelliphelliphelliphelliphelliphelliphelliphelliphelliphelliphelliphelliphelliphelliphelliphelliphelliphelliphellip 1
11 Background helliphelliphelliphelliphelliphelliphelliphelliphelliphelliphelliphelliphelliphelliphelliphelliphelliphelliphelliphelliphelliphelliphellip 4
12 Diesel Exhaust helliphelliphelliphelliphelliphelliphelliphelliphelliphelliphelliphelliphelliphelliphelliphelliphelliphelliphelliphelliphelliphelliphelliphellip 5
121 Exposure to Diesel Exhaust helliphelliphelliphelliphelliphelliphelliphelliphelliphelliphelliphelliphelliphelliphellip 5
122 Composition of Diesel Exhaust helliphelliphelliphelliphelliphelliphelliphelliphelliphelliphelliphelliphelliphellip 6
123 Overall Health Effects of Diesel Exhaust helliphelliphelliphelliphelliphelliphelliphelliphelliphellip 7
124 Hypothesized Mechanisms of Diesel Exhaust Induced Health Effects
helliphelliphelliphelliphelliphelliphelliphelliphelliphelliphelliphelliphelliphelliphelliphelliphelliphelliphelliphelliphelliphelliphelliphelliphelliphelliphelliphelliphellip 8
125 Diesel Exhaust and Cytokine Release helliphelliphelliphelliphelliphelliphelliphelliphelliphelliphellip 10
126 Diesel Exhaust and Oxidative Stress helliphelliphelliphelliphelliphelliphelliphelliphelliphelliphellip 11
127 Respiratory and Cardiovascular Effects of Diesel Exhaust Exposure
helliphelliphelliphelliphelliphelliphelliphelliphelliphelliphelliphelliphelliphelliphelliphelliphelliphelliphelliphelliphelliphelliphelliphelliphelliphelliphelliphellip 13
13 Sex helliphelliphelliphelliphelliphelliphelliphelliphelliphelliphelliphelliphelliphelliphelliphelliphelliphelliphelliphelliphelliphelliphelliphelliphelliphelliphelliphellip 14
131 Definition of Sex and Gender helliphelliphelliphelliphelliphelliphelliphelliphelliphelliphelliphelliphelliphellip 14
132 Sex and Toxicity helliphelliphelliphelliphelliphelliphelliphelliphelliphelliphelliphelliphelliphelliphelliphelliphelliphelliphellip 16
133 Sex and the Effects of Diesel Exhaust Exposure helliphelliphelliphelliphelliphelliphellip 17
134 Sex and the Metabolism of Diesel Exhaust helliphelliphelliphelliphelliphelliphelliphellip 18
1341 1-Nitropyrene helliphelliphelliphelliphelliphellip 18
1342 Sex and the Metabolism of 1-Nitropyrene helliphelliphelliphelliphellip 20
vii
14 Dissertation Research helliphelliphelliphelliphelliphelliphelliphelliphelliphelliphelliphelliphelliphelliphelliphelliphelliphelliphelliphelliphellip 20
141 Aims helliphelliphelliphelliphelliphelliphelliphelliphelliphelliphelliphelliphelliphelliphelliphelliphelliphelliphelliphelliphelliphelliphelliphellip 20
15 Research Design and Data helliphelliphelliphelliphelliphelliphelliphelliphelliphelliphelliphelliphelliphelliphelliphelliphelliphellip 21
151 Data Collection helliphelliphelliphelliphelliphelliphelliphelliphelliphelliphelliphelliphelliphelliphelliphelliphelliphelliphellip 21
152 Original Study Data helliphelliphelliphelliphelliphelliphelliphelliphelliphelliphelliphelliphelliphelliphelliphelliphellip 21
153 Subjects Demographic Data helliphelliphelliphelliphelliphelliphelliphelliphelliphelliphelliphelliphelliphelliphellip 23
16 Hypothesis and research Questions helliphelliphelliphelliphelliphelliphelliphelliphelliphelliphelliphelliphelliphelliphellip 24
161 Overall Hypothesis helliphelliphelliphelliphelliphelliphelliphelliphelliphelliphelliphelliphelliphelliphelliphelliphelliphellip 24
162 Research Question 1 helliphelliphelliphelliphelliphelliphelliphelliphelliphelliphelliphelliphelliphelliphelliphelliphellip 25
163 Research Question 2 helliphelliphelliphelliphelliphelliphelliphelliphelliphelliphelliphelliphelliphelliphelliphelliphellip 26
164 Research Question 3 helliphelliphelliphelliphelliphelliphelliphelliphelliphelliphelliphelliphelliphelliphelliphelliphellip 26
165 Research Question 4 helliphelliphelliphelliphelliphelliphelliphelliphelliphelliphelliphelliphelliphelliphelliphelliphellip 27
References helliphelliphelliphelliphelliphelliphelliphelliphelliphelliphelliphelliphelliphelliphelliphelliphelliphelliphelliphelliphelliphelliphelliphelliphelliphelliphellip 28
2 Analysis of Sex Differences in Acute Diesel Exhaust Exposure Induced Airway
Inflammatory Response helliphelliphelliphelliphelliphelliphelliphelliphelliphelliphelliphelliphelliphelliphelliphelliphelliphelliphelliphelliphelliphellip 34
21 Abstract helliphelliphelliphelliphelliphelliphelliphelliphelliphelliphelliphelliphelliphelliphelliphelliphelliphelliphelliphelliphelliphelliphelliphelliphelliphellip 34
22 Introduction helliphelliphelliphelliphelliphelliphelliphelliphelliphelliphelliphelliphelliphelliphelliphelliphelliphelliphelliphelliphelliphelliphelliphelliphellip 34
23 Toxicokinetics of Diesel Exhaust in Human Nasal and Airway Passages 35
231 Hypothesized Mechanism of Adverse Reaction to Inhaled Diesel
Exhaust helliphelliphelliphelliphelliphelliphelliphelliphelliphelliphelliphelliphelliphelliphelliphelliphelliphelliphelliphelliphelliphelliphellip 36
24 Nasal Lavage and Sputum Induction Studies helliphelliphelliphelliphelliphelliphelliphelliphelliphelliphellip 38
25 Sex Differences in Innate Immune Response helliphelliphelliphelliphelliphelliphelliphelliphelliphelliphelliphellip 39
26 Materials and Methods helliphelliphelliphelliphelliphelliphelliphelliphelliphelliphelliphelliphelliphelliphelliphelliphelliphelliphelliphellip 41
261 Data Collection helliphelliphelliphelliphelliphelliphelliphelliphelliphelliphelliphelliphelliphelliphelliphelliphelliphelliphellip 41
viii
262 Subjects Demographic Data helliphelliphelliphelliphelliphelliphelliphelliphelliphelliphelliphelliphelliphelliphellip 41
263 Exposure Conditions and Experimental Design helliphelliphelliphelliphelliphellip 42
264 Nasal Lavage Sample Collection helliphelliphelliphelliphelliphelliphelliphelliphelliphelliphelliphelliphellip 43
265 Nasal Lavage Sample Analysis helliphelliphelliphelliphelliphelliphelliphelliphelliphelliphelliphelliphellip 43
266 Sputum Sample Collection helliphelliphelliphelliphelliphelliphelliphelliphelliphelliphelliphelliphelliphelliphellip 43
267 Sputum Sample analysis helliphelliphelliphelliphelliphelliphelliphelliphelliphelliphelliphelliphelliphelliphellip 44
268 Airway Markers of Inflammation helliphelliphelliphelliphelliphelliphelliphelliphelliphelliphelliphellip 45
27 Statistical Methods helliphelliphelliphelliphelliphelliphelliphelliphelliphelliphelliphelliphelliphelliphelliphelliphelliphelliphelliphelliphellip 46
271 Calculation of Response Measure helliphelliphelliphelliphelliphelliphelliphelliphelliphelliphelliphellip 46
28 Results helliphelliphelliphelliphelliphelliphelliphelliphelliphelliphelliphelliphelliphelliphelliphelliphelliphelliphelliphelliphelliphelliphelliphelliphelliphelliphellip 48
281 Study Aim Interaction Effect of Diesel Exhaust Exposure and Sex
helliphelliphelliphelliphelliphelliphelliphelliphelliphelliphelliphelliphelliphelliphelliphelliphelliphelliphelliphelliphelliphelliphelliphelliphelliphelliphelliphellip 48
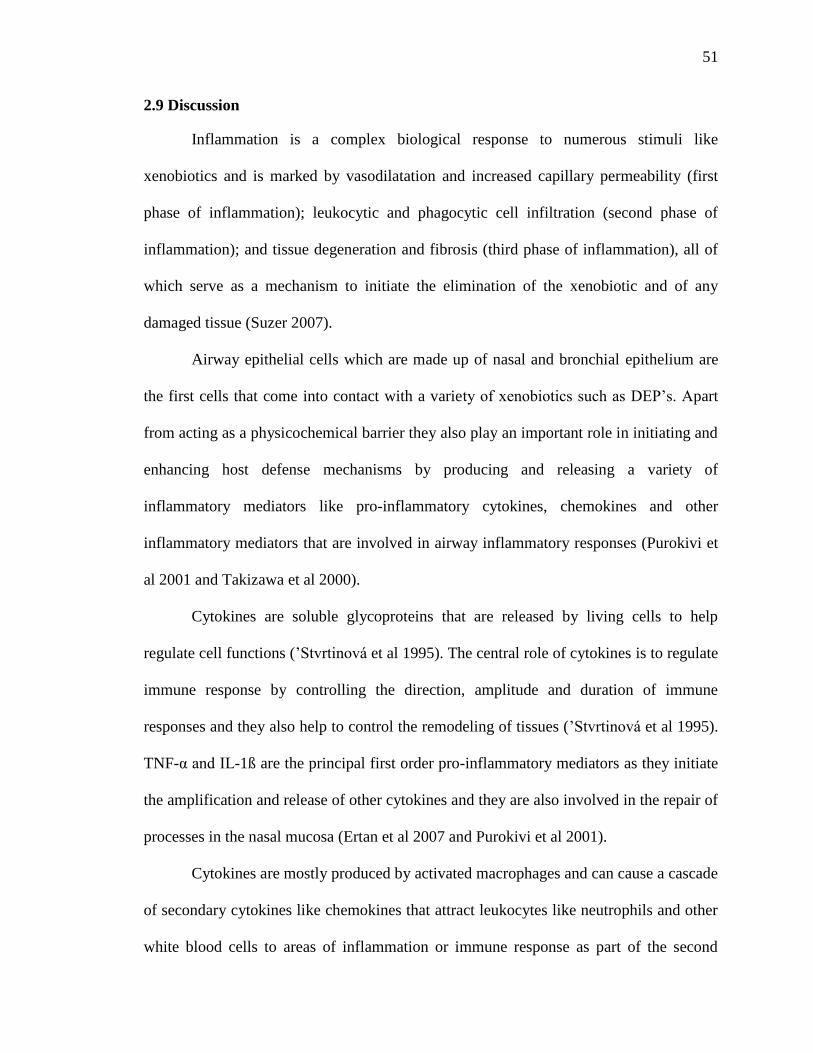
29 Discussion helliphelliphelliphelliphelliphelliphelliphelliphelliphelliphelliphelliphelliphelliphelliphelliphelliphelliphelliphelliphelliphelliphelliphelliphellip 51
291 Study Limitations helliphelliphelliphelliphelliphelliphelliphelliphelliphelliphelliphelliphelliphelliphelliphelliphelliphelliphellip 55
210 Conclusions helliphelliphelliphelliphelliphelliphelliphelliphelliphelliphelliphelliphelliphelliphelliphelliphelliphelliphelliphelliphelliphelliphelliphellip 56
Appendix A helliphelliphelliphelliphelliphelliphelliphelliphelliphelliphelliphelliphelliphelliphelliphelliphelliphelliphelliphelliphelliphelliphelliphelliphelliphellip 57
References helliphelliphelliphelliphelliphelliphelliphelliphelliphelliphelliphelliphelliphelliphelliphelliphelliphelliphelliphelliphelliphelliphelliphelliphelliphelliphellip 61
3 Analysis of Sex Differences in Systemic Inflammation and Acute Phase response
Markers after Acute Exposure to Diesel Exhaust helliphelliphelliphelliphelliphelliphelliphelliphelliphelliphelliphellip 64
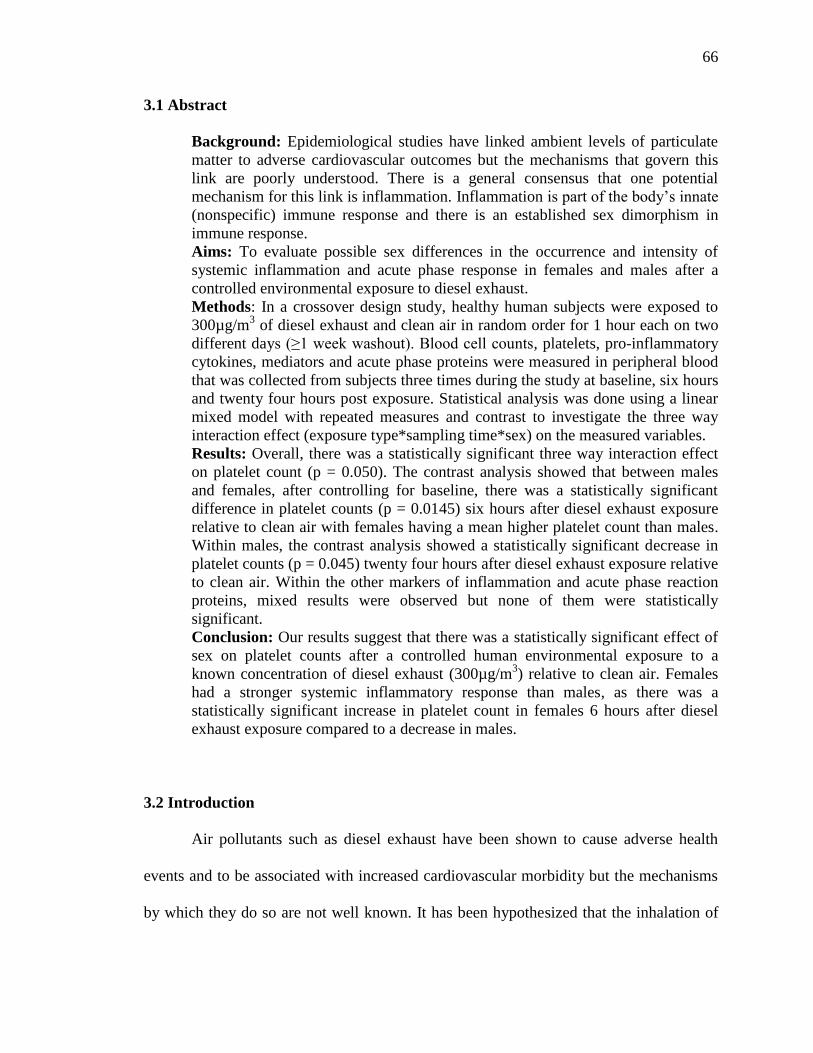
31 Abstract helliphelliphelliphelliphelliphelliphelliphelliphelliphelliphelliphelliphelliphelliphelliphelliphelliphelliphelliphelliphelliphelliphelliphelliphellip 66
32 Introduction helliphelliphelliphelliphelliphelliphelliphelliphelliphelliphelliphelliphelliphelliphelliphelliphelliphelliphelliphelliphelliphelliphelliphelliphellip 66
321 Cytokines helliphelliphelliphelliphelliphelliphelliphelliphelliphelliphelliphelliphelliphelliphelliphelliphelliphelliphelliphelliphellip 67
322 Acute Phase Response helliphelliphelliphelliphelliphelliphelliphelliphelliphelliphelliphelliphelliphelliphelliphellip 68
323 Platelets and Other Blood Cells helliphelliphelliphelliphelliphelliphelliphelliphelliphelliphelliphelliphellip 68
ix
324 Sex Differences in Immune Response helliphelliphelliphelliphelliphelliphelliphelliphelliphelliphellip 69
33 Materials and Methods helliphelliphelliphelliphelliphelliphelliphelliphelliphelliphelliphelliphelliphelliphelliphelliphelliphelliphelliphellip 70
331 Data Collection helliphelliphelliphelliphelliphelliphelliphelliphelliphelliphelliphelliphelliphelliphelliphelliphelliphelliphellip 70
332 Subjects Demographic Data helliphelliphelliphelliphelliphelliphelliphelliphelliphelliphelliphelliphelliphelliphellip 71
333 Exposure Conditions and Experimental Design helliphelliphelliphelliphelliphellip 72
334 Systemic Inflammation and Acute Phase Response Markers hellip 73
335 Blood Sample Collection helliphelliphelliphelliphelliphelliphelliphelliphelliphelliphelliphelliphelliphelliphellip 73
336 Blood Sample Analysis helliphelliphelliphelliphelliphelliphelliphelliphelliphelliphelliphelliphelliphelliphelliphellip 73
34 Statistical Methods helliphelliphelliphelliphelliphelliphelliphelliphelliphelliphelliphelliphelliphelliphelliphelliphelliphelliphelliphelliphellip 73
35 Results helliphelliphelliphelliphelliphelliphelliphelliphelliphelliphelliphelliphelliphelliphelliphelliphelliphelliphelliphelliphelliphelliphelliphelliphelliphelliphellip 75
36 Discussion helliphelliphelliphelliphelliphelliphelliphelliphelliphelliphelliphelliphelliphelliphelliphelliphelliphelliphelliphelliphelliphelliphelliphelliphellip 81
361 Study Limitations helliphelliphelliphelliphelliphelliphelliphelliphelliphelliphelliphelliphelliphelliphelliphelliphelliphelliphellip 86
37 Conclusions helliphelliphelliphelliphelliphelliphelliphelliphelliphelliphelliphelliphelliphelliphelliphelliphelliphelliphelliphelliphelliphelliphelliphelliphellip 87
Appendix B helliphelliphelliphelliphelliphelliphelliphelliphelliphelliphelliphelliphelliphelliphelliphelliphelliphelliphelliphelliphelliphelliphelliphelliphelliphellip 89
References 94
4 Analysis of Sex Differences in Self Reported Symptoms after Acute Exposure to
Diesel Exhaust helliphelliphelliphelliphelliphelliphelliphelliphelliphelliphelliphelliphelliphelliphelliphelliphelliphelliphelliphelliphelliphelliphelliphelliphelliphelliphellip 99
41 Abstract helliphelliphelliphelliphelliphelliphelliphelliphelliphelliphelliphelliphelliphelliphelliphelliphelliphelliphelliphelliphelliphelliphelliphelliphelliphellip 101
42 Introduction helliphelliphelliphelliphelliphelliphelliphelliphelliphelliphelliphelliphelliphelliphelliphelliphelliphelliphelliphelliphelliphelliphelliphellip 101
421 Symptoms of Diesel Exhaust Exposure helliphelliphelliphelliphelliphelliphelliphelliphelliphellip 102
422 Sex Gender and Symptoms helliphelliphelliphelliphelliphelliphelliphelliphelliphelliphelliphelliphelliphellip 103
423 Sex and Respiratory Related Symptoms helliphelliphelliphelliphelliphelliphelliphelliphellip 105
43 Materials and Methods helliphelliphelliphelliphelliphelliphelliphelliphelliphelliphelliphelliphelliphelliphelliphelliphelliphelliphelliphellip 107
431 Data Collection helliphelliphelliphelliphelliphelliphelliphelliphelliphelliphelliphelliphelliphelliphelliphelliphelliphelliphellip 107
x
432 Exposure Conditions and Experimental Design helliphelliphelliphelliphelliphellip 107
433 Subject Selection and Demographic Data helliphelliphelliphelliphelliphelliphelliphelliphellip 108
434 Symptom Questionnaire helliphelliphelliphelliphelliphelliphelliphelliphelliphelliphelliphelliphelliphelliphelliphellip 109
435 Questionnaire Administration Protocol helliphelliphelliphelliphelliphelliphelliphelliphellip 110
44 Statistical Methods helliphelliphelliphelliphelliphelliphelliphelliphelliphelliphelliphelliphelliphelliphelliphelliphelliphelliphelliphelliphellip 110
441 Calculation of Response Measures helliphelliphelliphelliphelliphelliphelliphelliphelliphelliphellip 111
45 Results helliphelliphelliphelliphelliphelliphelliphelliphelliphelliphelliphelliphelliphelliphelliphelliphelliphelliphelliphelliphelliphelliphelliphelliphelliphellip 114
46 Discussion helliphelliphelliphelliphelliphelliphelliphelliphelliphelliphelliphelliphelliphelliphelliphelliphelliphelliphelliphelliphelliphelliphelliphelliphellip 126
461 Study Limitations helliphelliphelliphelliphelliphelliphelliphelliphelliphelliphelliphelliphelliphelliphelliphelliphelliphellip 128
47 Conclusions helliphelliphelliphelliphelliphelliphelliphelliphelliphelliphelliphelliphelliphelliphelliphelliphelliphelliphelliphelliphelliphelliphelliphellip 128
Appendix C helliphelliphelliphelliphelliphelliphelliphelliphelliphelliphelliphelliphelliphelliphelliphelliphelliphelliphelliphelliphelliphelliphelliphelliphelliphellip 130
References helliphelliphelliphelliphelliphelliphelliphelliphelliphelliphelliphelliphelliphelliphelliphelliphelliphelliphelliphelliphelliphelliphelliphelliphelliphellip 133
5 Analysis of Sex Differences in the Urinary Concentration of 1-Aminopyrene after
Acute Exposure to Diesel Exhaust helliphelliphelliphelliphelliphelliphelliphelliphelliphelliphelliphelliphelliphelliphelliphelliphelliphellip 138
51 Abstract helliphelliphelliphelliphelliphelliphelliphelliphelliphelliphelliphelliphelliphelliphelliphelliphelliphelliphelliphelliphelliphelliphelliphelliphelliphellip 141
52 Introduction helliphelliphelliphelliphelliphelliphelliphelliphelliphelliphelliphelliphelliphelliphelliphelliphelliphelliphelliphelliphelliphelliphelliphellip 141
521 1-Nitropyrene helliphelliphelliphelliphelliphelliphelliphelliphelliphelliphelliphelliphelliphelliphelliphelliphelliphelliphelliphellip 142
5211 Metabolism of 1-Nitropyrene helliphelliphelliphelliphelliphelliphelliphelliphelliphellip 143
522 Sex Differences in Physiology helliphelliphelliphelliphelliphelliphelliphelliphelliphelliphelliphelliphellip 143
53 Materials and Methods helliphelliphelliphelliphelliphelliphelliphelliphelliphelliphelliphelliphelliphelliphelliphelliphelliphelliphelliphellip 146
531 Data Collection helliphelliphelliphelliphelliphelliphelliphelliphelliphelliphelliphelliphelliphelliphelliphelliphelliphelliphellip 146
532 Subjects helliphelliphelliphelliphelliphelliphelliphelliphelliphelliphelliphelliphelliphelliphelliphelliphelliphelliphelliphelliphelliphellip 146
533 Exposure Conditions and Experimental Design helliphelliphelliphelliphelliphellip 147
534 Urine Sample Collection helliphelliphelliphelliphelliphelliphelliphelliphelliphelliphelliphelliphelliphelliphellip 147
xi
535 Urine Sample Analysis helliphelliphelliphellip 148
536 Creatinine Measurements helliphelliphelliphelliphelliphelliphelliphelliphelliphelliphelliphelliphelliphelliphellip 149
537 Exclusion of Invalid Data and calculation of Time Weighted
Average Concentrations helliphelliphelliphelliphelliphelliphelliphelliphelliphelliphelliphelliphelliphelliphelliphellip 149
538 Exclusion of Baseline Values helliphelliphelliphelliphelliphelliphelliphelliphelliphelliphelliphelliphellip 150
539 Calculation of Response Measure helliphelliphelliphelliphelliphelliphelliphelliphelliphelliphelliphellip 152
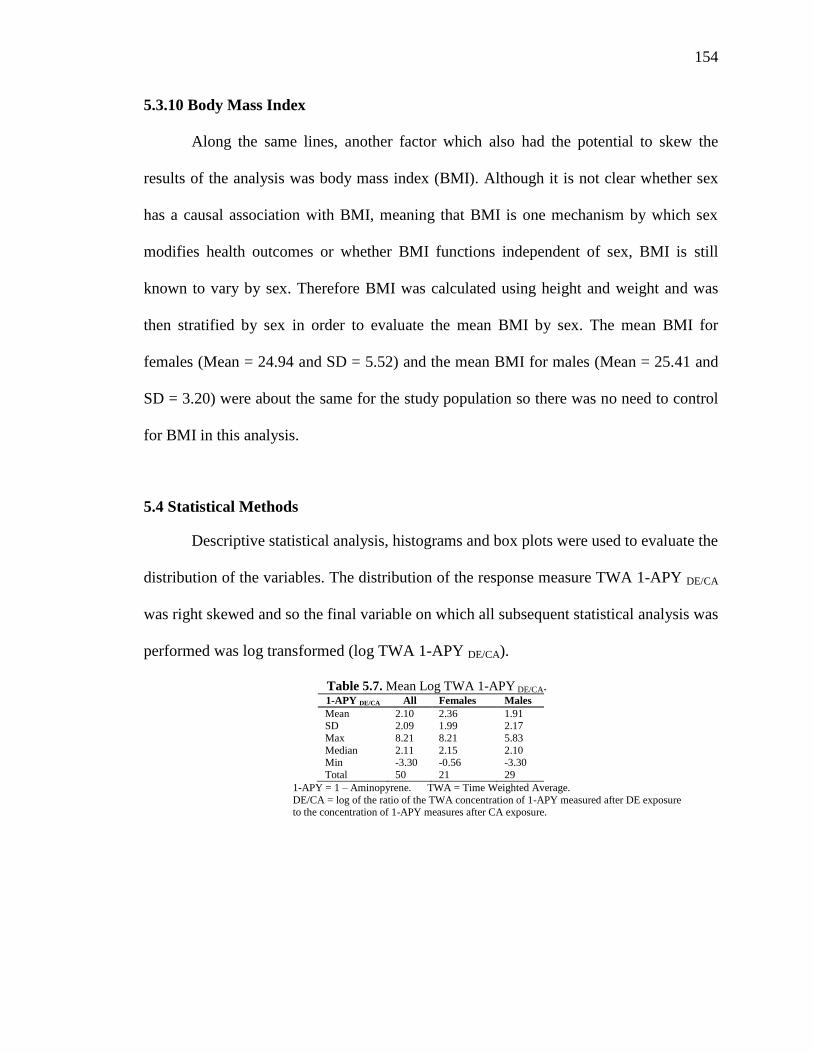
5310 Body Mass Index helliphelliphelliphelliphelliphelliphelliphelliphelliphelliphelliphelliphelliphelliphelliphelliphelliphellip 154
54 Statistical Methods helliphelliphelliphelliphelliphelliphelliphelliphelliphelliphelliphelliphelliphelliphelliphelliphelliphelliphelliphelliphellip 154
55 Results helliphelliphelliphelliphelliphelliphelliphelliphelliphelliphelliphelliphelliphelliphelliphelliphelliphelliphelliphelliphelliphelliphelliphelliphelliphellip 154
551 Aim 1 helliphelliphelliphelliphelliphelliphelliphelliphelliphelliphelliphelliphelliphelliphelliphelliphelliphelliphelliphelliphelliphelliphellip 157
552 Aim 2 helliphelliphelliphelliphelliphelliphelliphelliphelliphelliphelliphelliphelliphelliphelliphelliphelliphelliphelliphelliphelliphelliphellip 159
56 Discussion helliphelliphelliphelliphelliphelliphelliphelliphelliphelliphelliphelliphelliphelliphelliphelliphelliphelliphelliphelliphelliphelliphelliphelliphellip 159
561 Study Limitations helliphelliphelliphelliphelliphelliphelliphelliphelliphelliphelliphelliphelliphelliphelliphelliphelliphellip 161
57 Conclusions helliphelliphelliphelliphelliphelliphelliphelliphelliphelliphelliphelliphelliphelliphelliphelliphelliphelliphelliphelliphelliphelliphelliphellip 162
Appendix D helliphelliphelliphelliphelliphelliphelliphelliphelliphelliphelliphelliphelliphelliphelliphelliphelliphelliphelliphelliphelliphelliphelliphelliphellip 163
References helliphelliphelliphelliphelliphelliphelliphelliphelliphelliphelliphelliphelliphelliphelliphelliphelliphelliphelliphelliphelliphelliphelliphelliphelliphellip 164
6 Summary Implications and Future Research Directions helliphelliphelliphelliphelliphelliphelliphelliphellip 167
61 Summary of Results helliphelliphelliphelliphelliphelliphelliphelliphelliphelliphelliphelliphelliphelliphelliphelliphelliphelliphelliphelliphellip 169
611 Local Immune and Inflammatory Responses helliphelliphelliphelliphelliphelliphellip 169
612 Systemic and acute Phase Reactions helliphelliphelliphelliphelliphelliphelliphelliphelliphelliphellip 169
613 Self Reported Symptoms helliphelliphelliphelliphelliphelliphelliphelliphelliphelliphelliphelliphelliphelliphellip 170
614 Metabolism of 1-Nitropyrene helliphelliphelliphelliphelliphelliphelliphelliphelliphelliphelliphelliphellip 171
615 Integration of Study Results helliphelliphelliphelliphelliphelliphelliphelliphelliphelliphelliphelliphelliphellip 171
62 Implications helliphelliphelliphelliphelliphelliphelliphelliphelliphelliphelliphelliphelliphelliphelliphelliphelliphelliphelliphelliphelliphelliphelliphellip 172
xii
63 Future Research Directions helliphelliphelliphelliphelliphelliphelliphelliphelliphelliphelliphelliphelliphelliphelliphelliphelliphellip 175
64 Uncertainties helliphelliphelliphelliphelliphelliphelliphelliphelliphelliphelliphelliphelliphelliphelliphelliphelliphelliphelliphelliphelliphelliphelliphellip 176
Curriculum Vitae helliphelliphelliphelliphelliphelliphelliphelliphelliphelliphelliphelliphelliphelliphelliphelliphelliphelliphelliphelliphelliphelliphelliphelliphellip 178
xiii
List of Tables
Table 11 Summary of In-Vitro and In-Vivo Responses to Diesel Exhaust Diesel
Exhaust Particles Exposure helliphelliphelliphelliphelliphelliphelliphelliphelliphelliphelliphelliphelliphelliphelliphelliphellip 12
Table 12 Controlled Environmental Exposure Study of Diesel Exhaust Outcome
Variables helliphelliphelliphelliphelliphelliphelliphelliphelliphelliphelliphelliphelliphelliphelliphelliphelliphelliphelliphelliphelliphelliphelliphellip 23
Table 13 Original Study Data Collection Protocol helliphelliphelliphelliphelliphelliphelliphelliphelliphelliphelliphelliphellip 23
Table 14 Total Subject Demographic Information helliphelliphelliphelliphelliphelliphelliphelliphelliphelliphelliphelliphellip 24
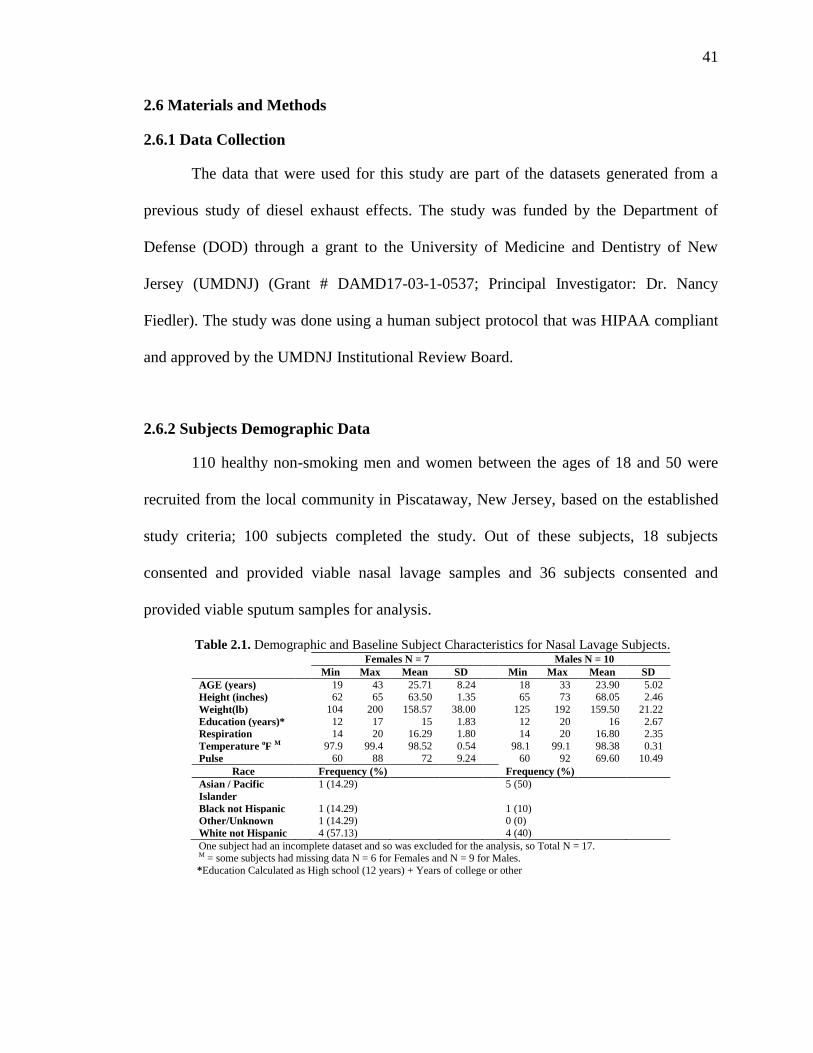
Table 21 Demographic and Baseline Subject Characteristics for Nasal Lavage
Subjects helliphelliphelliphelliphelliphelliphelliphelliphelliphelliphelliphelliphelliphelliphelliphelliphelliphelliphelliphelliphelliphelliphelliphelliphellip 41
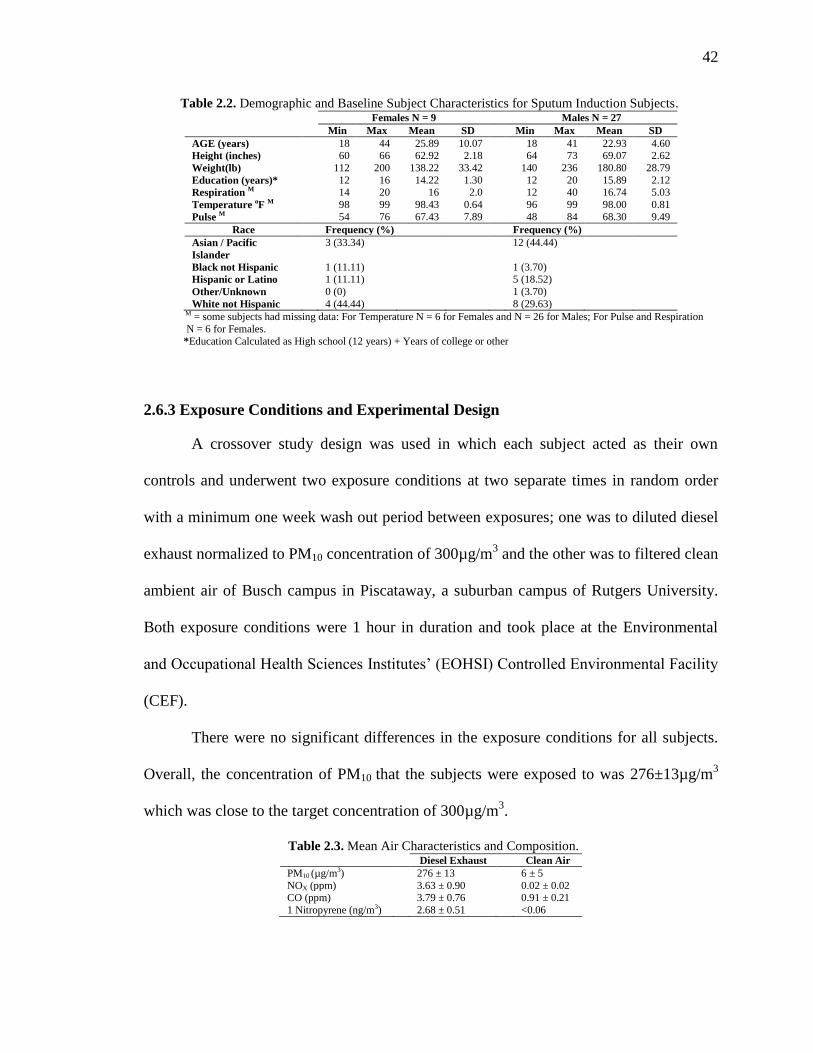
Table 22 Demographic and Baseline Subject Characteristics for Sputum Induction
Subjects helliphelliphelliphelliphelliphelliphelliphelliphelliphelliphelliphelliphelliphelliphelliphelliphelliphelliphelliphelliphelliphelliphelliphelliphellip 42
Table 23 Mean Air Characteristics and Composition helliphelliphelliphelliphelliphelliphelliphelliphelliphelliphelliphellip 42
Table 24 Difference in Soluble Proteins and Cytokines Measured in the Nasal Lavage
Analyte 24 Hours after Exposure to Clean Air and Diesel Exhaust helliphellip 47
Table 25 Difference in Soluble Proteins and Cytokines Measured in Sputum 6 Hours
after Exposure to Clean Air and Diesel Exhaust helliphelliphelliphelliphelliphelliphelliphelliphellip 47
Table 26a Two Way Interaction Significance Test Results and Nasal Analyte
Concentrations for the Difference in the Concentrations of Proteins and
Cytokines Measured in Nasal Lavage Samples 24 Hours after Exposure to
Diesel Exhaust and Clean Air helliphelliphelliphelliphelliphelliphelliphelliphelliphelliphelliphelliphelliphelliphelliphellip 49
Table 26b Mean Ranks for TNF-α DE-CA Measured in Nasal Lavage Samples 24 Hours
after Exposure to Diesel Exhaust and Clean Air helliphelliphelliphelliphelliphelliphelliphelliphellip 49
Table 27 Two Way Interaction Significance Test Results and Sputum Analyte
Concentrations for the Difference in the Concentrations of Proteins and
Cytokines Measured in Sputum Induction Samples 6 Hours after Exposure
to Diesel Exhaust and Clean Air helliphelliphelliphelliphelliphelliphelliphelliphelliphelliphelliphelliphelliphelliphellip 50
Table A1 Nasal Analyte Concentration of Soluble Proteins and Cytokines 24 Hours
after Exposure to Clean Air and Diesel Exhaust helliphelliphelliphelliphelliphelliphelliphelliphelliphellip 57
Table A2 Sputum Concentration of Soluble Proteins and Cytokines 6 Hours after
Exposure to Clean Air and Diesel Exhaust helliphelliphelliphelliphelliphelliphelliphelliphelliphelliphellip 57
xiv
Table A3 Nasal Lavage Median and Percentiles for Diesel Exhaust and Clean Air for
All Subjects helliphelliphelliphelliphelliphelliphelliphelliphelliphelliphelliphelliphelliphelliphelliphelliphelliphelliphelliphelliphelliphelliphellip 58
Table A4 Nasal Lavage Median and Percentiles for Diesel Exhaust and Clean Air for
Females helliphelliphelliphelliphelliphelliphelliphelliphelliphelliphelliphelliphelliphelliphelliphelliphelliphelliphelliphelliphelliphelliphelliphelliphellip 58
TableA5 Nasal Lavage Median and Percentiles for Diesel Exhaust and Clean Air for
Males helliphelliphelliphelliphelliphelliphelliphelliphelliphelliphelliphelliphelliphelliphelliphelliphelliphelliphelliphelliphelliphelliphelliphelliphelliphellip 58
Table A6 Sputum Median and Percentiles for Diesel Exhaust and Clean Air for All
Subjects helliphelliphelliphelliphelliphelliphelliphelliphelliphelliphelliphelliphelliphelliphelliphelliphelliphelliphelliphelliphelliphelliphelliphelliphellip 58
Table A8 Sputum Median and Percentiles for Diesel Exhaust and Clean Air for Males
helliphelliphelliphelliphelliphelliphelliphelliphelliphelliphelliphelliphelliphelliphelliphelliphelliphelliphelliphelliphelliphelliphelliphelliphelliphelliphelliphelliphelliphelliphelliphelliphelliphellip 59
Table A9 Nasal Lavage Median and Percentiles for the the Difference in the
Concentrations of Proteins and Cytokines For Females and Males Measured
in Nasal Lavage Samples helliphelliphelliphelliphelliphelliphelliphelliphelliphelliphelliphelliphelliphelliphelliphelliphelliphelliphellip 59
Table A10 Sputum Lavage Median and Percentiles for the the Difference in the
Concentrations of Proteins and Cytokines For Females and Males Measured
in Nasal Lavage Samples helliphelliphelliphelliphelliphelliphelliphelliphelliphelliphelliphelliphelliphelliphelliphelliphelliphelliphellip 60
Table A11 Mann-Whitney U Test Results Showing the Ranks of the Difference in the
Concentrations of Proteins and Cytokines For Females and Males Measured
in Nasal Lavage Samples helliphelliphelliphelliphelliphelliphelliphelliphelliphelliphelliphelliphelliphelliphelliphelliphelliphelliphellip 60
Table A12 Mann-Whitney U Test Results Showing the Ranks of the Difference in the
Concentrations of Proteins and Cytokines For Females and Males Measured
in Sputum Induction Samples helliphelliphelliphelliphelliphelliphelliphelliphelliphelliphelliphelliphelliphelliphelliphelliphellip 60
Table 31a CBC Subjects Demographic Information helliphelliphelliphelliphelliphelliphelliphelliphelliphelliphelliphellip 71
Table 31b IL-6 Subjects Demographic Information helliphelliphelliphelliphelliphelliphelliphelliphelliphelliphelliphellip 71
Table 31c C - reactive protein Subjects Demographic Information helliphelliphelliphelliphelliphelliphellip 71
Table 31d Fibrinogen Subject Demographics helliphelliphelliphelliphelliphelliphelliphelliphelliphelliphelliphelliphelliphellip 72
Table 32 Mean Air Characteristics and Composition helliphelliphelliphelliphelliphelliphelliphelliphelliphelliphelliphellip 72
Table 33 Three Way Interaction Results helliphelliphelliphelliphelliphelliphelliphelliphelliphelliphelliphelliphelliphelliphelliphelliphellip 76
Table 34a Mean Log Blood Cell Values (Absolute) and Contrast Test Results helliphellip 78
xv
Table 34b Mean Log Blood Cell Blood Count Values (Absolute) and Contrast Test
Results (continued) helliphelliphelliphelliphelliphelliphelliphelliphelliphelliphelliphelliphelliphelliphelliphelliphelliphelliphelliphelliphellip 79
Table 34c Mean Log Cell Blood Count Values (Percentage) and Contrast Test Results
helliphelliphelliphelliphelliphelliphelliphelliphelliphelliphelliphelliphelliphelliphelliphelliphelliphelliphelliphelliphelliphelliphelliphelliphelliphelliphelliphelliphelliphelliphelliphelliphelliphellip 80
Table 34d Mean Log Mediators Values and Contrast Test Results helliphelliphelliphelliphelliphellip 81
Table 34e Mean Log Coagulation Factor Values and Contrast Test Results helliphelliphellip 81
Table 35 Difference in Platelet Counts by Exposure and Sex helliphelliphelliphelliphelliphelliphelliphellip 83
Table B1 Systemic Inflammation Markers helliphelliphelliphelliphelliphelliphelliphelliphelliphelliphelliphelliphelliphelliphellip 89
Table B2 CRP Mean Values helliphelliphelliphelliphelliphelliphelliphelliphelliphelliphelliphelliphelliphelliphelliphelliphelliphelliphelliphelliphellip 89
Table B3 IL-6 Mean Values helliphelliphelliphelliphelliphelliphelliphelliphelliphelliphelliphelliphelliphelliphelliphelliphelliphelliphelliphelliphellip 90
Table B4 WBC Mean Values helliphelliphelliphelliphelliphelliphelliphelliphelliphelliphelliphelliphelliphelliphelliphelliphelliphelliphelliphellip 90
Table B5 Cell Blood Counts Means (Absolute Values) helliphelliphelliphelliphelliphelliphelliphelliphelliphellip 91
Table B6 Cell Blood Counts (Percent Values) helliphelliphelliphelliphelliphelliphelliphelliphelliphelliphelliphelliphelliphellip 92
Table B7 Fibrinogen Mean Values helliphelliphelliphelliphelliphelliphelliphelliphelliphelliphelliphelliphelliphelliphelliphelliphelliphellip 93
Table B8 Mean Platelet Counts (x10e3microl) helliphelliphelliphelliphelliphelliphelliphelliphelliphelliphelliphelliphelliphelliphellip 93
Table 41 Proposed Determinants of Self Reported Symptoms helliphelliphelliphelliphelliphelliphellip 105
Table 42 Mean Air Characteristics and Composition helliphelliphelliphelliphelliphelliphelliphelliphelliphelliphellip 108
Table 43 Demographic Information and Baseline Subject Characteristics helliphelliphellip 108
Table 44 Description of Symptom Categories and The Creation of the Summary
Severity Scores helliphelliphelliphelliphelliphelliphelliphelliphelliphelliphelliphelliphelliphelliphelliphelliphelliphelliphelliphelliphelliphellip 111
Table 45a Mean Total Symptom Severity Ratings by Category and the Time Reported
helliphelliphelliphelliphelliphelliphelliphelliphelliphelliphelliphelliphelliphelliphelliphelliphelliphelliphelliphelliphelliphelliphelliphelliphelliphelliphelliphelliphelliphelliphelliphelliphelliphellip 112
Table 45b Mean Total Symptom Severity Ratings by Category and the Time Reported
(continued) helliphelliphelliphelliphelliphelliphelliphelliphelliphelliphelliphelliphelliphelliphelliphelliphelliphelliphelliphelliphelliphelliphellip 113
Table 46 Three Way Interaction Results helliphelliphelliphelliphelliphelliphelliphelliphelliphelliphelliphelliphelliphelliphelliphellip 115
xvi
Table 47a Count of Reported Eye Irritation Symptoms (NY) by Sex Exposure and
Time helliphelliphelliphelliphelliphelliphelliphelliphelliphelliphelliphelliphelliphelliphelliphelliphelliphelliphelliphelliphelliphelliphelliphelliphelliphellip 116
Table 47b Count of Reported Anxiety Symptoms (NY) by Sex Exposure and Time
helliphelliphelliphelliphelliphelliphelliphelliphelliphelliphelliphelliphelliphelliphelliphelliphelliphelliphelliphelliphelliphelliphelliphelliphelliphelliphelliphelliphelliphelliphelliphelliphelliphellip 116
Table 47c Count of Reported Central Nervous System Symptoms (NY) by Sex
Exposure and Time helliphelliphelliphelliphelliphelliphelliphelliphelliphelliphelliphelliphelliphelliphelliphelliphelliphelliphelliphellip 117
Table 47d Count of Reported No Load (General) Symptoms (NY) by Sex Exposure
and Time helliphelliphelliphelliphelliphelliphelliphelliphelliphelliphelliphelliphelliphelliphelliphelliphelliphelliphelliphelliphelliphelliphelliphellip 117
Table 48 Contrast Between Sex (Males vs Females) Test Results helliphelliphelliphelliphellip 118
Table 49 Contrast Within Sex Test Results helliphelliphelliphelliphelliphelliphelliphelliphelliphelliphelliphellip 119
Table 410a Mean Change (DE-CA) from Baseline in Symptom Severity Ratings for
Males and Females helliphelliphelliphelliphelliphelliphelliphelliphelliphelliphelliphelliphelliphelliphelliphelliphelliphelliphelliphellip 120
Table 410b Mean Change (DE-CA) from Baseline in Symptom Severity Ratings for
Males and Females (continued) helliphelliphelliphelliphelliphelliphelliphelliphelliphelliphelliphelliphelliphelliphellip 123
Table C1a Mean Difference (DE-CA) in Symptom Severity Ratings for Males and
Female helliphelliphelliphelliphelliphelliphelliphelliphelliphelliphelliphelliphelliphelliphelliphelliphelliphelliphelliphelliphelliphelliphelliphelliphellip 130
Table C1b Mean Difference (DE-CA) in Symptom Severity Ratings for Males and
Females (continued) helliphelliphelliphelliphelliphelliphelliphelliphelliphelliphelliphelliphelliphelliphelliphelliphelliphelliphellip 131
Table 51 Subject Characteristics by Sex helliphelliphelliphelliphelliphelliphelliphelliphelliphelliphelliphelliphelliphelliphellip 146
Table 52 Mean Air Characteristics and Composition helliphelliphelliphelliphelliphelliphelliphelliphelliphellip 147
Table 53 TWA 1-APY Concentrations for All Subjects and by Sex helliphelliphelliphelliphellip 150
Table 54 Baseline 1-APY Concentrations helliphelliphelliphelliphelliphelliphelliphelliphelliphelliphelliphelliphelliphellip 151
Table 55a Results of the ANCOVA Sensitivity Analysis helliphelliphelliphelliphelliphelliphelliphelliphellip 152
Table 55b Mean and Adjusted Mean Concentrations of Baseline TWA 1-APY by
Sex helliphelliphelliphelliphelliphelliphelliphelliphelliphelliphelliphelliphelliphelliphelliphelliphelliphelliphelliphelliphelliphelliphelliphelliphelliphellip 152
Table 56 Mean TWA 1-APY DECA for All Subjects and by Sex helliphelliphelliphelliphelliphellip 153
Table 57 Mean Log TWA 1-APY DECA helliphelliphelliphelliphelliphelliphelliphelliphelliphelliphelliphelliphelliphelliphelliphellip 154
xvii
Table 58 ANOVA Results helliphelliphelliphelliphelliphelliphelliphelliphelliphelliphelliphelliphelliphelliphelliphelliphelliphelliphelliphelliphellip 157
Table 59 Summary of Backward Elimination Regression of TWA 1-APY DECA
helliphelliphelliphelliphelliphelliphelliphelliphelliphelliphelliphelliphelliphelliphelliphelliphelliphelliphelliphelliphelliphelliphelliphelliphelliphelliphelliphelliphelliphelliphelliphelliphelliphellip 159
Table D1 One Sample t-test results of Log TWA 1-APY by Stress for All Subjects
and also by Sex helliphelliphelliphelliphelliphelliphelliphelliphelliphelliphelliphelliphelliphelliphelliphelliphelliphelliphelliphelliphellip 163
xviii
List of Illustrations and Graphs
Figure 11 Typical Chemical Compositions for Diesel Particulate Matter PM25 (US
EPA 2002) helliphelliphelliphelliphelliphelliphelliphelliphelliphelliphelliphelliphelliphelliphelliphelliphelliphelliphelliphelliphelliphellip 7
Figure 12 Hypothesized Diesel Exhaust Effects Model Used in this Dissertation
helliphelliphelliphelliphelliphelliphelliphelliphelliphelliphelliphelliphelliphelliphelliphelliphelliphelliphelliphelliphelliphelliphelliphelliphelliphelliphelliphelliphelliphelliphelliphelliphelliphellip 15
Figure 13 Possible roles of gender and sex in shaping observed relationships
between air pollution and health (Clougherty 2010) helliphelliphelliphelliphelliphellip 16
Figure 14 Metabolites of 1-Nitropyerene in-vivo (Howard et al 1995) helliphelliphellip 19
Figure 21 The Human Respiratory System helliphelliphelliphelliphelliphelliphelliphelliphelliphelliphelliphelliphelliphelliphellip 36
Graph 21 Difference in Proteins Measured in Nasal Lavage Post Clean Air and
Diesel Exhaust Exposure helliphelliphelliphelliphelliphelliphelliphelliphelliphelliphelliphelliphelliphelliphelliphelliphellip 47
Graph 22 Difference in TNF-α Measured in Nasal Lavage Post Clean Air and
Diesel Exhaust Exposure helliphelliphelliphelliphelliphelliphelliphelliphelliphelliphelliphelliphelliphelliphelliphelliphellip 48
Graph 23 TNF-α in Nasal Lavage from Healthy Subjects at 24 Hours (N = 17)
after Exposure to Clean Air and Diesel Exhaust helliphelliphelliphelliphelliphelliphelliphellip 49
Graph 24 Boxplot of Median TNF-α Concentrations by Sex and Exposure hellip 50
Graph 31 Plot of Mean Platelet Count Difference by Exposure by Sex and Time
helliphelliphelliphelliphelliphelliphelliphelliphelliphelliphelliphelliphelliphelliphelliphelliphelliphelliphelliphelliphelliphelliphelliphelliphelliphelliphelliphelliphelliphelliphelliphelliphelliphellip 76
Graph 32 Graph of Mean Percent Change in Platelet Counts Measured in Diesel
Exhaust Relative to Clean Air by Sex helliphelliphelliphelliphelliphelliphelliphelliphelliphelliphelliphelliphellip 77
Graph B1 Mean Platelet Count by Sex helliphelliphelliphelliphelliphelliphelliphelliphelliphelliphelliphelliphelliphelliphelliphellip 93
Figure 41 Intersetion of Sex and Gender and Self Reported Symptom
Determinants helliphelliphelliphelliphelliphelliphelliphelliphelliphelliphelliphelliphelliphelliphelliphelliphelliphelliphelliphelliphellip 104
Figure 42 Labeled Magnitude Scale (Green et al 1996) helliphelliphelliphelliphelliphelliphelliphelliphellip 109
Figure 43 Questionnaire Study Protocol helliphelliphelliphelliphelliphelliphelliphelliphelliphelliphelliphelliphelliphelliphellip 110
Graph 41a-b Line Graph of Mean Self reported Somatic and Lower Respiratory
Symptoms by Sex helliphelliphelliphelliphelliphelliphelliphelliphelliphelliphelliphelliphelliphelliphelliphelliphelliphelliphellip 115
xix
Graph 42 Changes in Mean Somatic Symptoms Severity Ratings helliphelliphelliphelliphellip 121
Graph 43 Changes in Mean Lower Respiratory Symptoms Severity Ratings hellip 121
Graph 44 Changes in Mean Acute Phase Reaction Symptoms Severity Ratings
helliphelliphelliphelliphelliphelliphelliphelliphelliphelliphelliphelliphelliphelliphelliphelliphelliphelliphelliphelliphelliphelliphelliphelliphelliphelliphelliphelliphelliphelliphelliphelliphelliphellip 122
Graph 45 Changes in Mean Anxiety Symptoms Severity Ratings helliphelliphelliphelliphellip 122
Graph 46 Changes in Mean No Load (General) Symptoms Severity Ratings hellip 124
Graph 47a-h Distribution of Mean Symptom Severity ratings by Exposure Time and
Sex helliphelliphelliphelliphelliphelliphelliphelliphelliphelliphelliphelliphelliphelliphelliphelliphelliphelliphelliphelliphelliphelliphellip 124 - 125
Graph C1andashh Line Graph of Mean Symptom Severity Ratings by Sex helliphellip 131 - 132
Figure 51 Distribution of the TWA 1-APY DECA by Sex helliphelliphelliphelliphelliphelliphelliphelliphelliphellip 153
Figure 52a Distribution of the Concentration of Log TWADECA by Sex helliphelliphelliphellip 155
Figure 52b Box Plot of the Mean Concentration of Log TWA 1-APY DECA by Sex
helliphelliphelliphelliphelliphelliphelliphelliphelliphelliphelliphelliphelliphelliphelliphelliphelliphelliphelliphelliphellip 155
Figure 53 Mean TWA 1-APY Concentrations Secreted by Exposure and by Sex
helliphelliphelliphelliphelliphelliphelliphelliphelliphelliphelliphelliphelliphelliphelliphelliphelliphelliphelliphelliphelliphelliphelliphelliphelliphelliphelliphelliphelliphelliphelliphelliphelliphellip 158
Figure D1 Profile Plot of Log TWA 1-APY by Stress for All Subjects and also by Sex
helliphelliphelliphelliphelliphelliphelliphelliphelliphelliphelliphelliphelliphelliphelliphelliphelliphelliphelliphelliphelliphelliphelliphelliphelliphelliphelliphelliphelliphelliphelliphelliphelliphellip 163
1
Chapter 1
Introduction
2
11 Background
12 Diesel Exhaust
121 Exposure to Diesel Exhaust
122 Composition of Diesel Exhaust
123 Overall Health Effects of Diesel Exhaust
124 Hypothesized Mechanisms of Diesel Exhaust Induced Health Effects
125 Diesel Exhaust and Cytokine Release
126 Diesel Exhaust and Oxidative Stress
127 Respiratory and Cardiovascular Effects of Diesel Exhaust Exposure
13 Sex
131 Definition of Sex and Gender
132 Sex and Toxicity
133 Sex and the Effects of Diesel Exhaust Exposure
134 Sex and the Metabolism of Diesel Exhaust
1341 1-Nitropyrene
1342 Sex and the Metabolism of 1-Nitropyrene
14 Dissertation Research
141 Aims
15 Research Design and Data
151 Data Collection
152 Original Study Data
153 Subjects Demographic Data
16 Hypothesis and research Questions
161 Overall Hypothesis
162 Research Question 1
3
163 Research Question 2
164 Research Question 3
165 Research Question 4
4
11 Background
Diesel exhaust is produced from the combustion of diesel fuel The superior
energy efficiency and endurance of diesel engines have led to a rapid rise in the use of
diesel fuel worldwide to power vehicles and other machineries (USEPA HAD 2002)
This has made diesel exhaust a significant contributor to ambient air pollution and the
largest single source of airborne particulate matter (PM) in many urban areas (Riedl and
Diaz-Sanchez 2005) Across populations exposures may be acute or chronic and the
exposure amounts may be either high or low depending on the temporal and spatial
distribution of diesel exhaust sources Due to the ubiquitous nature of diesel exhaust and
the potential for the high exposure of certain populations like workers using diesel-
powered machinery and people who live close to diesel traffic diesel exhaust has been
one of the most studied environmental pollutants in an attempt to determine its
toxicological effects in humans and rodents
Toxicology is the study of the adverse effects of a xenobiotic (Casarett and
Doulllsquos 2001) on a target population or species This involves understanding the nature of
the xenobiotic as well as the host or target factors that may make it more or less
susceptible to the xenobiotic Such factors include genetic traits sex age pre-existing
conditions behavioral traits and coexisting exposures to other xenobiotics (Casarett and
Doulllsquos 2001) When making inferences from animal studies or from epidemiological
studies some of these factors are usually handled as uncertainty factors and are
mathematically used in the calculation of acceptable exposure levels and for policy
measures
5
In particular sex is often considered to be a confounder or a modifying variable
and is usually controlled for by the choice of design or by some standardization or
multivariate procedure (Gochfeld 2007) This has led to the fact that in the toxicology of
environmental xenobiotics especially with regards to non-cancerous health outcomes
differences in susceptibility by sex have not received adequate attention in human and
animal toxicology nor in epidemiology and generalizations are often made about species
response without data or consideration of sex differences (Gochfeld et al 2007)
Why is this important It is important because males and females differ
substantially with respect to physiology and biology and these differences may have
significant effects on the toxicity of any xenobiotic and thus may affect how vulnerable
males and females are to the effects of xenobiotics and other environmental stressors
(Gochfeld 2007) Along the continuum from exposure to absorption to metabolism to
excretion to systemic effects and to overall health outcomes every step may be
potentially influenced by sex
12 Diesel Exhaust
121 Exposure to Diesel Exhaust
Most acute exposure to very high levels of diesel exhaust and chronic exposure to
low levels of diesel exhaust occur via occupational exposures either by accident or as a
routine part of the job Toll workers truck drivers bridge and tunnel workers mine
workers forklift drivers railroad and dock drivers and garage workers usually have the
highest occupational exposure Exposure to the general public is not as frequent as seen
in the occupational setting and it is usually to lower levels of diesel exhaust The highest
6
exposure to the public occurs along highways and in cities or anywhere diesel traffic is
heaviest (Frumkin and Thun 2001) Children are also thought to have one of the highest
opportunities for exposure to diesel exhaust fumes due to the use of diesel powered
school buses
Inhalation of diesel exhaust is the primary route of exposure therefore
experimental studies have often been done to examine the association between diesel
exhaust exposure and respiratory and cardiovascular effects
122 Composition of Diesel Exhaust
Diesel exhaust is made up of a complex mixture of hundreds of constituents in
either a gaseous or particulate form Gaseous components of diesel exhaust include
carbon dioxide oxygen nitrogen water vapor carbon monoxide nitrogen compounds
sulfur compounds and numerous low-molecular-weight hydrocarbons
Figure 11 Typical Chemical Compositions for Diesel Particulate Matter PM25
Source Health Assessment Document for Diesel Engine Exhaust US EPA 2002
Elemental Carbon
75
Organic Carbon19
Sulfate Nitrate1
Minerals2
Unknown3
7
The particles produced by diesel exhaust fuel combustion are composed of a
center core of elemental carbon and absorbed organic compounds as well as small
amounts of sulfate nitrate metals and other trace elements (Figure 1) (USEPA HAD
2002) These particles are collectively called diesel exhaust particles (DEPs) and they are
primarily made up of fine (25 - 01 microm) and ultra-fine (lt01 microm) particles These
primary DEPs can also coalesce to form aggregates of varying size ranges (Riedl and
Diaz-Sanchez 2005) Both the gaseous and particulate fractions of diesel exhaust contain
polycyclic aromatic hydrocarbons (PAHs) which are produced as pyrolytic products
during the combustion of diesel exhaust and any fossil fuel (Frumkin and Thun 2001)
Due to these characteristics of diesel exhaust as well as its vast use in society
diesel exhaust accounts for a significant source of ambient PM25 (especially in urban
environments) For this reason many experimental studies use diesel exhaust as a model
for PM pollution (Torqvist et al 2007)
123 Overall Health Effects of Diesel Exhaust Exposure
In 1988 the National Institute for Occupational Safety and Health (NIOSH)
proposed a potential link between occupational exposure to diesel exhaust and lung
cancer based on the consistency of toxicological studies in rats and mice and the limited
epidemiological evidence which was mainly from railroad workers at the time (Rogers
and Davies 2005)
Overall chronic inhalation exposure to diesel exhaust is likely to pose a lung
cancer hazard to humans as well as damage the lungs in other ways depending on the
length and intensity of the exposure While acute exposure to diesel exhaust can cause
8
acute irritation (eg eye nose throat bronchial) neurophysiological symptoms (eg
lightheadedness nausea) inflammatory responses in the airway and the lungs respiratory
symptoms (cough phlegm) there is also evidence for an immunologic effect (the
exacerbation of allergenic responses to known allergens and asthma-like symptoms) and
cardiovascular effects (USEPA HAD 2002 Donaldson et al 2001) such as impaired
vascular function and increase in blood coagulation
Normally the lungs are able to deal with the isolation neutralization and removal
of inhaled diesel exhaust and other xenobiotics or air pollutants via various mechanisms
but these natural defense mechanisms can often become overwhelmed for a variety of
reasons including illness or high burden of pollutants and this can then lead to the adverse
health effects mentioned above (Salvi and Holgate 1999)
124 Hypothesized Mechanisms of Diesel Exhaust Induced Health Effects
The mechanism by which diesel exhaust and other air pollutants cause these
adverse health effects are not well known Currently there are two leading hypotheses
about the mechanisms by which diesel exhaust and other air pollutants cause the health
effects that have been observed In particular diesel exhaust (or other particulate matter)
induced effects on the cardiovascular system lung and blood receptors are hypothesized
to occur either via the direct action of DEPs or other particulate matter on these endpoints
(Brook et al 2004 and Shimada et al 2006) or indirectly via mediators released in
response to DEPs (or other particulate matter) initiated pulmonary oxidative stress and
inflammatory responses in the airway and lungs (Brook et al 2004 and Shimada et al
2006)
9
The direct effect of DEPs (or other particulate matter) on cardiovascular system
lung and blood receptors are hypothesized to happen due to the translocation of ultra fine
DEPs (or other ultra fine particulate matter) transition metals and gases from the lungs to
systemic circulation Under this hypothesis the translocated DEPs or other particulate
matter directly influence homeostasis and other cardiovascular endpoints
(Kaewamatawong et al 2008 and Shimada et al 2006) leading to cardiovascular effects
An alternative hypothesis upon which this dissertation research is based is that
exposure to diesel exhaust (or other air pollutants) causes an inflammation reaction in the
airways and lungs via oxidative stress which results in the systemic release of cytokines
which influence the heart coagulation factors and other cardiovascular endpoints and
leads to cardiovascular symptoms (Kaewamatawong et al 2008 and Shimada et al 2006)
The exact mechanism (s) of the anatomical translocation of inhaled ultra fine
DEPs (or other ultra fine particulate matter) across the air-blood barrier at the alveolar
wall are not fully understood (Shimada et al 2006) but the alternative inflammation
induced systemic effect of DEPs (or other particulate matter) is hypothesized to take
place when the previously mentioned overload or hindrance of the lunglsquos natural defenses
occurs When this happens it sets off a variety of cascading adverse systemic reactions
involving and mediated by multiple cell lines cytokines and acute phase proteins All of
these may contribute to the overall adverse respiratory and cardiovascular health effects
that have so far been linked with exposure to diesel exhaust and other air pollutants The
consensus amongst the diesel exhaust studies that have been done is that diesel exhaust is
capable of causing pro-inflammatory and pro-allergenic effects which cause marked
pulmonary and systemic inflammatory responses involving a variety of cell types (Diaz
10
and Riedl 2005 Salvi et al 1999) that include epithelial cells macrophages neutrophils
mast cells and lymphocytes
As with the actions of the different components of air pollution it is very hard to
tease apart the effect of the two fractions of diesel exhaust because despite their distinct
nature it appears that both the particulate and gaseous fractions of air pollutants and
diesel exhaust alike share the ability to initiate and heighten these cellular inflammation
in the upper and lower airways
125 Diesel Exhaust and Cytokine Release
It is hypothesized that the cascading events that follow diesel exhaust exposure
are heavily influenced by the pro-inflammatory cytokines and chemokines released from
affected cells in response to diesel exhaust induced local inflammation Furthermore
these cytokines are also hypothesized to have an added inflammatory effect on the
surrounding cells and to modify the production of acute phase proteins by the liver
thereby leading to adverse cardiovascular effects
Cytokines are intercellular signaling polypeptides produced by activated cells
(Gabay C et all 1999) Of particular interest in diesel exhaust exposure are those
cytokines that are produced during inflammation and which also participate and
contribute to the inflammatory process because they are the chief stimulant of the acute
phase proteins Macrophages and monocytes are the most important sources of these
cytokines at the sites of inflammation although they are also produced by a number of
other different cells These pro-inflammatory cytokines include interleukin 6 (IL-6)
11
interleukin 1β (IL-1β) Tumor necrosis factor - α (TNF-α) interferon γ (IFN-γ)
transforming growth factor β2 interleukin 8 (IL-8) (Gabay C et all 1999)
126 Diesel Exhaust and Oxidative Stress
The roles of these pro-inflammatory cytokines in increasing inflammation in
response to diesel exhaust exposure has been well documented (van Eeden et al 2001)
but the initial cause of the inflammatory process which stimulates the release of these
cytokines is still under debate One leading thought is that the inflammation is instigated
by oxidative stress (Furuyama et al 2006 Diaz-Sanchez and Riedl 2005 Salvi and
Holgate1999) caused by the subsequent prolonged contact of the metals PAHs and
quinines contained in diesel exhaust with the epithelial and macrophage cells when the
natural lung safety mechanisms become overwhelmed The epithelial and macrophage
cells are the initial target cells for particle interaction and deposition and thus are thought
to be the initial site of toxicity (Salvi et all 1999) This theory has been supported by the
fact that antioxidants can block the effects of DEPs in animal models and in in-vitro
models (Diaz-Sanchez and Riedl 2005) Diesel exhaust has also been demonstrated to
activate redox-sensitive transcription factors in the bronchial epithelium of healthy
subjects consistent with oxidative stress triggering the increased synthesis of cytokines
(Pourazar et al 2005)
This oxidative stress initiated inflammation is thought to either directly or
indirectly cause or trigger other mechanisms that are behind the effects that have been
seen in in-vitro and in-vivo studies (Table 1)
12
Table 11 Summary of In-Vitro and In-Vivo Responses to Diesel Exhaust Diesel Exhaust particles
Exposure Summary of In-Vitro Cell responses
Summary of Responses by Cell Types Sources
1 In bronchial and nasal epithelial and endothelial cells ndash
Increase expression of chemokines and cytokines IL-8 eotaxin
RANTES GM-CSF and IL-6 Up regulation of the expression of histamine H-1 receptor mRNA and
enhanced inducement of histamine induced increase in IL-8 and GM-
CSF production 2 In Eosinophils - Enhanced adhesion of to nasal epithelial cells and induced
eosinophil degranulation
3 In Mast cells ndash Enhanced IgE mediated release histamine release
Increase in the production of IL-4 and IL-6
4 In Basophils ndash Induced histamine release in the absence of IgE and enhanced cytokine production of IL-4
5 In PMDCs ndash Inducement of chemokine production of IL-8 and RANTES and
combining with allergen to increase IL-8 RANTES and TNF-α production 6 In B cells ndash Enhancement of IgE production in the presence of co-stimulatory
molecules such as after IL-4 and CD40
7 In Monocytes and Macrophages ndash Impaired Phagocytosis
Induction of oxidative stress
Stimulation of the release of TNF-α and IL-6 Modulation of cytokine production by inhibition of IL-12p40
production
Inhibition of prostaglandin E2 release Increase in phase 2 enzyme expression
Saxton and Diaz 2000 Riedl and Diaz-
Sanchez 2005
Salvi and Holgate 1999Salvi et al
1999 Pourazar et al 2005 Saxton and
Diaz-Sanchez 2000 Diaz- Sanchez et al
1996
Summary of In-Vivo responses
Summary of Responses in Animals Sources
1 Damage to alveolar macrophage membranes and depressed phagocytic activity
2 Damage to ciliated epithelial cells lining the trachea and large airways
3 Activation of Macrophages and release of IL-1 IL-6 and TNF-α 4 Release of neutrophils into the blood from the bone marrow
5 Increase levels of cytoplasmic and lysosomal enzymes and total proteins in
response to chronic exposure 6 Increased synthesis and deposition of collagen producing thickening of the
alveolar septa and blood vessels and the development of interstitial fibrosis
7 Increased levels of mRNA for IL-2 IL-4 and GM-CSF in airway tissue
Saxton and Diaz 2000 Riedl and Diaz-
Sanchez 2005
Salvi and Holgate 1999Salvi et al
1999 Pourazar et al 2005 Saxton and
Diaz-Sanchez 2000 Diaz- Sanchez et al
1996 Salvi et al 2000 Nightingale et
al 2000
Summary of Responses in Humans Subjects
1 Increase in the number of neutrophils B cells T cells and mast cells
(inflammatory cells) in the airways
2 Increase in circulating neutrophils and platelets 3 Increase in histamine fibronectin neutrophils and B lymphocytes levels in
the airway lumen
4 Up regulation of the expression of adhesion molecules on the capillary endothelial cells and leucocytes cell surfaces
5 Increase of gene transcription and expression of IL-8 and GRO-α protein
and an accompanying trend towards an increase in IL-5 mRNA gene transcripts in the bronchial epithelium
6 Decrease in macrophage function
7 Increase in airway resistance 8 Up-regulation of redox sensitive transcription factors and cell signaling
pathways in the bronchial epithelium
9 Enhanced local mucosal IgE production 10 Increase in nasal cytokine expression following DEP exposure ie IL-2 IL-
4 IL-5 IL-6 IL-10 IL-13 and Interferon γ
13
127 Respiratory and Cardiovascular Health Effects of Diesel Exhaust Exposure
The respiratory and cardiovascular effects of diesel exhaust are thought to be
connected via oxidative stress initiated inflammation because inflammation is known to
cause a large number of changes far from the initial site of the local inflammation and
potentially involving many organ systems More specifically changes in the levels of
acute phase proteins in response to inflammation and mediated by pro-inflammatory
cytokines are believed to cause the corresponding adverse cardiovascular effects that are
often seen following the inhalation of diesel exhaust especially in compromised
populations
Acute phase proteins are proteins that are produced by the liver and whose plasma
concentrations increase or decrease by at least 25 during an inflammatory disorder
(Gabay et al 1999) Of particular interest are fibrinogen and C-reactive proteins
Fibrinogen can cause endothelial cell adhesion spreading and proliferation while C-
reactive proteins have been shown to be a cardiovascular risk factor in both healthy
subjects and those with coronary heart disease (Peter et al 2001) C-reactive proteins are
tightly regulated and their plasma concentrations can increase by over 1000 fold during
an acute phase response to inflammation or other forms of tissue damage or infection
(Peter et al 2001)
Acute phase changes reflect the presence and intensity of inflammation (Gabay et
al 1999) so it is hypothesized that in response to the injury caused by diesel exhaust
induced oxidative stress the local inflammatory cells ie neutrophils monocytes and
macrophages secrete a number of cytokines (IL-6 IL1β IL-8 and TNF-α) into the blood
stream These cytokines ate thought to act as a cascade and as a network in stimulating
14
the production of C-reactive proteins and other acute phase proteins in the liver (Gabay et
al1999) This leads to the presentation of acute phase symptoms which include fever and
lethargy (Gabay et al 1999)
In summary the activation and mobilization of inflammatory cells by oxidative
stress the production of pro-inflammatory cytokines the production of acute phase
proteins and the production of circulating inflammatory mediators all characterize the
systemic inflammatory response (van Eeden et al 2001) that is hypothesized to cause
adverse cardiovascular effects (Figure 3)
13 Sex
131 Definition of Sex and gender
In public health terms sex can be thought to determine genetically based
sensitivity to health determinants and gender can be thought to express some social forces
that could influence exposure and responses to health determinants (Messing and
Stellman 2006)
The effects of sex and gender on the adverse health effects of a xenobiotic often
complement each other Gender often has a big influence on the types and levels of a
xenobiotic that men and women get exposed to especially in the occupational setting and
sex often has a big effect on how men and women absorb distribute metabolize and
excrete the xenobiotic once the exposure has taken place (Figure 4) (Arbuckle 2006 and
Dimich-Wald et al 2006)
15
Diesel Exhaust Exposure
Subject
Oxidative Stress
Local Inflammation
(Macrophages and Epithelial Cells)
Activation of inflammatory cells
(Neutrophils)
Production of pro-inflammatory cytokines and chemokines
(IL-6 IL-1 IL-8 TNF-α and IFN-γ)
Peripheral blood
(Platelets increase)
Liver
Production of Acute Phase Proteins
(C - reactive protein and Fibrinogen)
Acute Phase Symptoms
(Fever and Lethargy)
Figure 12 Hypothesized Diesel Exhaust Effects Model Used in this Dissertation
16
Figure 13 Possible roles of gender and sex in shaping observed relationships between air pollution and
health Source Clougherty 2010 (Reproduced with permission from Environmental Health Perspectives)
132 Sex and Toxicity
With regards to the toxicity of environmental air pollution there is little
information on environmentally related health effects that manifest differently in females
compared with males and in experimental animal toxicological studies male animals have
almost exclusively been used (Vahter et al 2007) Some studies have been done to look
at the differences in the reaction to different xenobiotics by sex and a lot of these studies
have focused on form and structural differences between males and females rather than
on functional differences (eg Becklake and Kauffmann 1999) These studies have
looked at differences in lung capacity ventilation rates and so on in an attempt to
identify how these morphological differences affect the rates of absorption of the inhaled
xenobiotic The fact remains that once a xenobiotic reaches the lungs there are many
local interactions involving macrophages and cytokines which can lead to inflammation
17
or other local pulmonary effects which are unrelated to the rates of systemic absorption
(Gochfeld 2007)
Recently some epidemiological studies have been done to examine gender and
sex differences in health effects in relation to residential exposure to air pollution (Kan et
al 2007 Kan et al 2008 Franklin et al Luginaah et al 2005 Sunyer et al 2006) These
studies together suggest stronger sex linked associations among women in response to air
pollution such as lower forced respiratory volume in 1 second (FEV1) increased phlegm
production and increased respiratory mortality (Clougherty 2010) Physiological
explanations that have been suggested to explain these observed susceptibility of women
to respiratory hazards include the possibility that females have differential rates of
absorption kinetics and metabolism of xenobiotics that affect their dose for the average
male or female (Dimich-Ward et al 2006)
133 Sex and the Effects of Diesel Exhaust Exposure
It is hypothesized that sex hormones (estrogens and testosterone) play an essential
role in the different susceptibilities between males and females to xenobiotics
Differences in xenobiotic particle clearance oxidative stress handling cytokine pathway
activation and cytochrome P450 enzymes activity are all influenced by sex hormones
(Fortoul et al 2005) There is also evidence that sex hormones have an influence on many
aspects of airway behavior especially in females which may be unrelated to the gender
related socioeconomic determinants of exposure for example it has been suggested that
the airways of girls (and women) may be more sensitive to the effects of tobacco smoke
than those of boys and men (Becklake and Kauffmann 1999) This raises the question of
18
whether this increased susceptibility to tobacco smoke is unique or whether it may be
applicable to other environmental exposures like diesel exhaust
134 Sex and the Metabolism of Diesel Exhaust
Not all differences between male and female susceptibility can be attributed to
hormones (Vahter et al 2007) For example the metabolism and excretion of a
xenobiotic and its metabolites is something that is highly influenced by differences in
morphology and other internal metabolic processes The rate and type of metabolism and
the rate of excretion of a xenobiotic and its subsequent metabolites can have a big effect
on the differences in susceptibly of males and females Exposure to diesel exhaust is
known to increase urinary levels of oxidative stress by-products and urinary metabolites
of diesel exhaust components but so far no one has examined whether a difference exists
between males and females in the levels of metabolites excreted in urine This is
important because the clearance rate of diesel exhaust and other inhaled xenobiotics may
differ by sex depending on whether they are metabolized via conjugation oxidative
mechanisms or reduction (Arbuckle et al 2006) in the airway lungs and subsequently in
the liver These potential differences in clearance rates may also produce sex related
differences in response to diesel exhaust exposure and other xenobiotics
1341 1-Nitropyrene
1-Nitropyrene (1-NP) is the most abundant nitro-PAH contained in diesel exhaust
and so it along with its metabolites (Figure 5) are thought to be good specific biomarkers
of diesel exhaust exposure (Toriba et al 2007)
19
Figure 14 Metabolites of 1-Nitropyerene in-vivo Source Howard et al 1995 (Reproduced with permission from Chemico-Biological Interactions)
20
1-NP is also a main contributor of the direct acting mutagenicity that has been observed
in DEPs (Toriba et al 2007) The metabolism of 1-NP can occur via nitro-reduction or
cytochrome P450 mediated ring oxidation (Silvers et al 1997 and Chae et al 1999) but
nitro-reduction appears to be a principal pathway by which 1-NP is activated resulting in
the formation of DNA adducts (Silvers et al 1997)
1342 Sex and the Metabolism of 1-Nitropyrene
The human Cytochrome P450 family of enzymes in particular the P450 3A3 and
3A4 isomers are the predominant enzymes involved in the oxidative metabolism of 1-NP
(Silvers et al 1997 and Chae et al 1999) In the mammalian system 1-NP is metabolized
by xanthine oxidase DT-diaphorase or aldehyde oxidase (NTP 1996)
There are known variations by sex in the function and activity of the P450 isomers in
particular CYP 3A4 with females having a higher activity than males (Anderson 2008)
Also in 1992 Relling et al showed that females had a higher activity of xanthine oxidase
than males after exposure to a low dose of caffeine Therefore there is the possibility that
there may be a variation by sex in the concentration of 1-NP metabolites that are
produced regardless of the metabolic pathway that is used
14 Dissertation Research
141 Aims
The primary aim of this dissertation research is to investigate the potential effect
of sex on local airway and systemic inflammation acute phase responses and self
reported symptomatic responses that have been attributed to acute diesel exhaust
exposure The secondary aim of this dissertation research is to examine whether there is a
21
sex difference in the metabolism of 1-nitropyrene a diesel exhaust specific compound
and a potent mutagen and carcinogen
15 Research Design and Data
151 Data Collection
The data used for this dissertation research are part of the datasets generated from
a study of diesel exhaust effects and a subsequent add-on study of diesel exhaust
exposure biomarkers The parent study was funded by the Department of Defense (DOD)
through a grant to the University of Medicine and Dentistry of New Jersey (UMDNJ)
(Grant DAMD17-03-1-0537 Principal Investigator Dr Nancy Fiedler) and the add-on
project was funded by the Environmental Protection Agency (EPA) through a STAR
grant to UMDNJ (Grant R832097 Principal Investigator Dr Junfeng Zhang)
The parent study and the add-on project were done using human subject protocols that
were HIPAA compliant and approved by the UMDNJ Institutional Review Board
152 Original Study Data
The main objective of the original parent study was to assess the effects of an
interaction between acute psychological stress and airway inflammation due to diesel
exhaust exposure One hundred and ten healthy men and women between the ages of 18
and 50 were recruited from the community based on the established study criteria Each
subject underwent two exposure conditions one was to diluted exhaust normalized to
PM10 concentration of 300 microgm3 and the other was to filtered clean ambient air of Busch
campus in Piscataway a suburban campus of Rutgers University Both exposure
22
conditions were 1 hour in duration and took place at the Environmental and Occupational
Health Sciences Instituteslsquo (EOHSI) Controlled Environmental Facility (CEF) Each
exposure condition was presented with and without an acute psychological stressor to two
groups of subjects high and low in self reported chemical intolerance (CI)
Study Design 2 (CI) X S (Stress) x 2 (Exposure)
= CI and psychological stress were between subjects factors and exposure was a within subjects factor
The outcome variables of the original study are listed in table 2 For both the diesel
exhaust and clean air exposures the data for the outcome variables were collected as
described in Table 3
The aim of the add-on study was to test the hypothesis that exposure to diesel
exhaust leads to increases in urinary levels of amino-PAHs To test this hypothesis urine
samples were collected from 55 out of the 110 subjects and analyzed for concentrations
of 1-aminopyrene 3-aminobenzanthrone 1-aminonaphthalene and 2-aminonaphthalene
which are metabolites of 1-nitropyrene 3-nitrobenzanthrone 1-nitronaphthalene and 2-
nitronaphthalene respectively
1-aminopyrene is the main metabolite produced via the nitro-reduction of 1-
nitropyrene (NTP 1996) making it a potentially good biomarker of diesel exhaust
exposure and susceptibility Therefore this dissertation research will only use the data
collected on urinary levels of 1-aminopyrene from the add-on study
23
Table 12 Controlled Environmental Exposure Study of Diesel Exhaust Outcome Variables
Outcomes Outcome Variables Time Measured
Respiratory Tract Inflammation
Local inflammation in the nasal mucosa
(upper respiratory tract)
Local inflammation in the lower
respiratory tract
Nasal Lavage
Concentration of proteins TNF-α IL-6
and IL-8
Induced Sputum
Concentration of proteins TNF-α IL-6
and IL-8
24 hours post exposure
6 hours post exposure
Acute Phase Response
Peripheral Blood
Absolute number and relative percentage
of neutrophils and blood cells number of
platelets and the concentration of IL-6
levels of C-reactive protein and
fibrinogen
Baseline (pre exposure) 6 and
24 hours post exposure
Symptoms
Symptoms
8 Symptom questionnaires
Baseline (2) during exposure
(3) post expousre (3)
Table 13 Original Study Data Collection Protocol
Time Activity
Pre Exposure 1 Complete symptom questionnaire ndash Qu-1
ExposureStress 1 Complete another symptom questionnaire ndash Qu-2 2 Baseline blood sample ndash B1
3 Baseline CO2 measurement
4 Complete another symptom questionnaire ndash Qu-3
5 Average Heart rate ndash HR-1
6 Pre stress blood ndash B2
7 Complete symptom questionnaire ndash Qu-4 8 Post stress blood ndash B3
9 Average Heart rate ndash HR-2
10 Complete symptom questionnaire ndash Qu-5 11 Complete symptom questionnaire ndash Qu-6
6 hours post exposure 1 Complete symptom questionnaire ndash Qu-7
2 Post exposure blood sample ndash B4 3 Induced sputum
24 hours post
exposure
1 Complete symptom questionnaire ndash Qu-8
2 Post exposure blood sample ndash B5
3 Post exposure Nasal lavage
153 Subjects Demographic Data
The total number of subjects that completed the parent study out of the 110
subjects that were enrolled was 100 and table 4 below gives a demographic summary of
the subjects
24
Table 14 Total Subject Demographic Information Females Males
N Min Max Mean SD N Min Max Mean SD
AGE (years) 36 18 44 2378 596 64 18 43 2408 574
Education (Years) 36 12 22 1542 232 64 12 25 1600 271
Height (inches) 36 58 73 6368 262 64 60 75 6893 272
Weight(lb) 36 100 200 13625 2632 64 125 239 17343 2526
BMI (kgm2) 36 1757 3717 2365 468 64 2080 3586 2566 346
Race Frequency () Frequency ()
Asian Pacific Islander 23 3594 15 4167
Black not Hispanic 5 781 2 556
Hispanic or Latino 11 1719 7 1944
OtherUnknown 1 156 1 277
White not Hispanic 24 3750 11 3056
Education Calculated as High school (12 years) + Years of college or other BMI = (weightheight2) 703
16 Hypothesis and Research Questions
161 Overall Hypothesis
The overall hypothesis of this dissertation research is that sex has an effect on the
occurrence and intensity of diesel exhaust induced local airway and systemic
inflammation acute phase responses and self reported symptomatic responses and also on
the metabolism of 1-nitropyrene with females expected to be responsive to diesel exhaust
exposure than males
The proposed formula of the overall hypothesis is shown as follows
Null Hypothesis Ho = micro(ΔMales) = micro(ΔFemales)
Alternate Hypothesis Hi = micro(ΔMales) ne micro(ΔFemales)
Where micro(ΔMales) is the mean change in the outcome variables of male subjects measured
after exposure to diesel exhaust relative to clean air and micro(ΔFemales) is mean change in the
outcome variables of female subjects measured after exposure to diesel exhaust relative
to clean air
25
162 Research Question 1
Do sex differences exist in the occurrence and intensity of local airway
inflammation between males and females as indicated by differences in the change in the
concentrations of pro-inflammatory cytokines and protein mediators in the cells of the
nasal mucosa and the lower respiratory tract after exposure to diesel exhaust relative to
clean air
a Are there sex differences in the incidence and intensity of nasal inflammation
as indicated by differences in the mean changes in the concentrations of IL-6
IL-8 TNF-α and proteins measured in nasal lavage 24 hours post exposure to
diesel exhaust relative to clean air between males and females
Hypothesis 11 There is a difference in the expression of cytokines and protein
mediators by the nasal mucosal cells of males and females after exposure to diesel
exhaust relative to clean air with females showing a greater local inflammatory response
in the nasal epithelium than males
b Are there sex differences in the incidence and intensity of inflammation in the
lower respiratory tract as indicated by differences in the mean changes in the
concentrations of IL-6 IL-8 TNF-α and proteins measured in induced sputum
6 hours post exposure to diesel exhaust relative to clean air between males and
females
Hypothesis 12 There is a difference in the expression of cytokines and protein
mediators by the cells of the lower respiratory tract of males and females after exposure
to diesel exhaust relative to clean air with females showing a greater local inflammatory
response in the lungs than males
26
163 Research Question 2
Do sex differences exist in the occurrence and intensity of systemic inflammation
and acute phase responses between males and females as indicated by differences in the
changes in the concentrations of pro-inflammatory cytokines mediators and acute phase
proteins in peripheral blood after exposure to diesel exhaust relative to clean air
a Are there sex differences in the incidence and intensity of systemic
inflammation as indicated by differences in the mean changes of the levels of
c-reactive proteins fibrinogen the absolute number and relative percentage of
blood cells number of platelets and the mean change in the concentration IL-6
in peripheral blood post exposure to diesel exhaust and relative to clean air
between males and females
Hypothesis 21 There is a difference in the expression of cytokines blood cells c-
reactive protein and fibrinogen in peripheral blood after exposure to diesel exhaust
relative to clean air between males and females with females showing a greater systemic
inflammatory response than males
164 Research Question 3
Do sex differences exist in self reported health symptoms collected after acute exposure
to diesel exhaust relative to clean air between males and females
a Are there sex differences in self reported symptoms collected post exposure to
diesel exhaust relative to clean air between males and females
27
Hypothesis 31 There is a difference in self reported symptoms collected post diesel
exhaust exposure relative to clean air between males and females with females reporting
higher symptoms than males
165 Research Question 4
Do sex differences exist in the metabolism of 1-nitropyrene as indicated by changes in
the concentration of urinary 1-aminopyrene levels following diesel exhaust exposure
relative to clean air between males and females
a Are there sex differences in urinary levels of 1-aminopyrene post exposure to
diesel exhaust relative to clean air between males and females
Hypothesis 41 There is a difference in the concentration of urinary levels of 1-
aminopyrene after diesel exhaust exposure relative to clean air between males and
females with females excreting a higher concentration of 1-aminopyrene than males
28
References
Arbuckle TE 2006 Are there sex and gender differences in acute exposure to
chemicals in the same setting Environmental Research101 pg 195-204
Becklake MR and Kauffmann F 1999 Gender differences in airway behavior over
the human life span Thorax 54 pg 1119-1138
Brook RD Franklin B Cascio W Hong Y Howard G Lipsett M Luepker R
Mittleman M Samet J Smith SC Tager I 2004 Air Pollution and Cardiovascular
Disease A Statement for Healthcare Professionals From the Expert Panel on
Population and Prevention Science of the American Heart Association Circulation
109 pg 2655 ndash 2671
Chae YH Thomas T Guengerich P Fu PP and El-Bayoumy K 1999
Comparative Metabolism of 1- 2- and 4-Nitropyrene by Human Hepatic and
Pulmonary Microsomes Cancer Research 59 pg 1473-1480
Christian MS 2001 IntroductionOverview Gender-Based Differences in
Pharmacologic and Toxicologic Responses International Journal of Toxicology 20
pg 145-148
Clougherty JE 2010 A Growing Role for Gender Analysis in Air Pollution
Epidemiology Environmental Health Perspectives 118 pg 167 ndash 176
Czerniak R Gender-Based Differences in Pharmacokinetics in Laboratory Animal
Models 2001 International Journal of Toxicology 20 pg 161-163
Diaz-Sanchez D and Riedl M 2005 Diesel effects on human health a question of
stress American Journal of Physiology ndash Lung Cellular and Molecular Physiology
289 pg L722-L723
Diaz-Sanchez D Tsien A Casillas A Dotson AR and Saxon A 1996 Enhanced
nasal cytokine production in human beings after in vivo challenge with diesel exhaust
particles Journal of Allergy and Clinical Immunology 98 pg114-123
Dimich-Warda H Campa PG and Kennedy SM 2006 Gender differences in
respiratory symptomsmdashDoes occupation matter Environmental Research 101 pg
175ndash183
Donaldson K Stone V Seaton A and MacNee W 2001 Ambient Particle Inhalation
and the Cardiovascular System Potential Mechanisms Environmental Health
Perspectives 109(supplement 4) pg 523-527
Ersntgard L Sjogren B Warholm M and Johanson G 2003 Sex differences in
toxicokinetics of inhaled solvent vapors in humans 1 m-Xylene Toxicology and
Applied Pharmacology 193 pg 147-157
29
Faustman E and Omenn G Risk Assessment in Klaassen CD (eds) Casarett and
Doulllsquos Toxicology The Basic Science of Poisons 6th
ed New York Macmillan
2001 pg 83-104
Fortoul TI Moncada-Henandez S Saldivar-Osorio L Espejel-Maya G Mussali-
Galante P Avila-Casado MC Colin-Barenque L Hernandez-Serrato MI and
Avila-Costa MR 2005 Sex differences in bronchiolar epithelium response after the
inhalation of lead acetate (Pb) Toxicology 207 pg 323-330
Franklin M Zeka A Schwartz J 2007 Association between PM25 and all-cause and
specific-cause mortality in 27 US communities Journal of Exposure Science and
Environmental Epidemiology17 pg 279 ndash 287
Frumkin H and Thun MJ 2001 Diesel Exhaust Environmental Carcinogens 51 pg
193-198
Furuyama A Hirano S Koike E and Kobayashi T 2006 Induction of oxidative
stress and inhibition of plasminogen activator inhibitor-1 production in endothelial
cells following exposure to organic extracts of diesel exhaust particles and urban fine
particles Archives of Toxicology 80 pg 154-162
Gabay C and Kushner J 1999 Acute phase proteins and other systemic responses to
inflammation New England Journal of Medicine 340 pg 448ndash54
Gochfeld M 2007 Framework for gender differences in human and animal
toxicology Environmental Research 104 pg 4-21
Howard PC Consolo MC Dooley KL and Beland FA 1995 Metabolism of 1-
nitropyrene in mice Transport across the placenta and mammary tissues Chemico-
Biological Interactions 95 pg 309 ndash 325
Kaewamatawong T Banlunara W Bintvihok A Morita T and Shimada A 2008 Acute
and Subacute Pulmonary effects of Low Dose of Diesel Exhaust Particles in Mice
Pathological Changes and Translocation Pathways to the Circulation Proceedings
the 15th Congress of FAVA 27-30 October FAVA -OIE Joint Symposium on
Emerging Diseases Bangkok Thailand pg 371 ndash 374
Kan H Heiss G Rose KM 2007 Traffic exposure and lung function in adults the
Atherosclerosis in Communities study Thorax 62 pg 873 ndash 879
Kan H London SJ Chen G Zhang Y Song G Zhao N et al 2008 Season sex age and
education as modifiers of the effects of outdoor air pollution on daily mortality in
Shanghai China the Public Health and Air Pollution in Asia (PAPA) study Environ
Health Perspectives 116 pg 1183 ndash 1188
30
Luginaah IN Fung KY Gorey KM Webster G Wills C 2005 Association of
ambient air pollution with respiratory hospitalization in a government-designated
―area of concern the case of Windsor Ontario Environ Health Perspectives 113
pg 290 ndash 296
Messing K and Stellman JM 2006 Sex gender and womenlsquos occupational health
The importance of considering mechanism Environmental Research 101 pg 149-
162
National Toxicology Program Toxicity Report Series Number 34 1-Nitropyrene
Administered by Inhalation to F344N Rats NIH Publication 96-3383 1996
Nightingale JA Maggs R Cullinan Donnelly LE Rodgers DF Kinnersley R
Chung KF Barnes PJ Ashmore M and Newman-Taylor A 2000 Airway
Inflammation after Controlled Exposure to Diesel Exhaust Particles American
Journal of Respiratory and Critical Care Medicine 162 pg 161-166
Nordenhall C Pourazar J Blomberg A Levin J-O Sandstrom T and Adelroth E
2000 Airway inflammation following exposure to diesel exhaust a study of time
kinetics using induced sputum European Respiratory Journal 15 pg 1046-1051
Peters A Frohlich M Doring A Immervoll T Wichmann H-E Hutchinson WL
Pepys MB and Koening W 2001 Particulate air pollution is associated with an
acute phase response in men European Heart Journal 22 pg 1198-1204
Pourazar J Mudway IS Samet JM Helleday R Blomberg A Wilson S Frew
AJ Kelly FJ and Sandstrom T 2005 Diesle Exhaust activates redox-sensitive
transcription factors and kinases in human airways American Journal of Physiology ndash
Lung Cellular and Molecular Physiology 289 pg L724-L730
Relling MV Lin JS Ayers GD and Evans WE 1992 Racial and gender differences
in N-acetyltransferase xanthine oxidase and CYP1A2 activities Clinical
Pharmacology and Therapeutics 52 pg 643 ndash 58
Riedl M and Diaz-Sanchez D 2005 Biology of diesel exhaust effects on respiratory
function Journal of Allergy and Clinical Immunology 115 pg 221-8
Rogers A and Davies B 2005 Diesel Particles ndash Recent Progress on an Old Issue
Annals of Occupational Hygiene 49 (6) pg 453-456
Salvi S Blomberg A Rudell B Kelly F Sandstrom T Holgate ST and Frew A
1999 Acute Inflammatory Responses in the Airway and Peripheral Blood After
Short-Term Exposure to Diesel Exhaust in Healthy Human Volunteers American
Journal of Respiratory and Critical Care Medicine 159 pg 702-709
31
Salvi S and Holgate ST 1999 Mechanisms of particulate matter toxicity Clinical
and Experimental Allergy 29 pg 1187-1194
Salvi S Nordenhall C Blomberg A Rudell B Pourazar J Kelly F Wilson S
Sandstrom T Holgate ST and Frew A 2000 Acute Exposure to Diesel Exhaust
increase IL-8 and GRO-α Production in Healthy Human Airways American Journal
of Respiratory and Critical Care Medicine 161 pg 550-557
Saxton A and Diaz-Sanchez D 2000 Diesel exhaust as a model xenobiotic in
allergic inflammation Immunophamacology 48 pg 325-327
Shimada A Kawamura N Okajima M Kaewamatawong T Inoue H and Morita T
2006 Translocation Pathway of the Intratracheally Instilled Ultrafine Particles from
the Lung into the Blood Circulation in the Mouse Toxicologic Pathology 34 pg 949
ndash 957
Silvers KJ Couch LH Rorke EA and Howard PC 1997 Role of nitroreductases but
not cytochromes P450 in the metabolic activation of 1-nitropyrene in the HepG2
human hepatoblastoma cell line Biochemical Pharmacology 54 pg 927 ndash 936
Sunyer J Jarvis D Gotschi T Garcia-Esteban R Jacquemin B Aguilera I Ackerman
U de Marco R Forsberg B Gislason T Heinrich J Norbaumlck D Villani S Kuumlnzli
N 2006 Chronic bronchitis and urban air pollution in an international study
Occupational and Environmental Medicine 63 pg 836 ndash 843
Tornqvist H Mills NL Gonzalez M Miller MR Robinson SD Megson IL
MacNee W Donaldson K Soderberg S Newby DE Sandstrom T and Blomberg
A 2007 Persistent endothelial dysfunction following diesel exhaust inhalation in
man American Journal of Respiratory and Critical Care Medicine 176 pg 395 ndash pg
400
US EPA 2002 Health assessment document for diesel engine exhaust US
Environmental Protection Agency Document EPA6008-90057F
Vahter M Gochfeld M Casati B Thiruchelvam M Falk-Filippson A Kavlock R
Marafante E and Cory-Slechta D 2007 Implications of gender differences for
human health risk assessment and toxicology Environmental research 104 pg 70-84
Van Eeden SF Tan WC Suwa T Mukae H Terashima T Fujii T Qui D
Vincent R and Hogg JC 2001 Cytokines Involved in Systemic Inflammatory
Response Induced by Exposure to Particulate Matter Air Pollutants (PM10) American
Journal of Respiratory and Critical Care Medicine 164 pg 826-830
32
Chapter 2
Analysis of Sex Differences in Airway Inflammatory Response
after Acute Diesel Exhaust Exposure
33
21 Abstract
22 Introduction
23 Toxicokinetics of Diesel Exhaust in Human Nasal and Airway Passages
231 Hypothesized Mechanism of Adverse Reaction to Inhaled Diesel Exhaust
24 Nasal Lavage and Sputum Induction Studies
25 Sex Differences in Innate Immune Response
26 Materials and Methods
261 Data Collection
262 Subjects Demographic Data
263 Exposure Conditions and Experimental Design
264 Nasal Lavage Sample Collection
265 Nasal Lavage Sample Analysis
266 Sputum Sample Collection
267 Sputum Sample analysis
268 Airway Markers of Inflammation
27 Statistical Methods
271 Calculation of Response Measure
28 Results
281 Study Aim Interaction Effect of Diesel Exhaust Exposure and Sex
29 Discussion
291 Study Limitations
210 Conclusions
Appendix A
References
34
21 Abstract
Background Inhalation of diesel exhaust in humans has been associated with
local immune and inflammatory responses in the upper and lower respiratory
airways Studies have shown that there is a sexual dimorphism in immune
response with females having a stronger immune reactivity than males
Aims To evaluate possible differences between females and males in local
immune and inflammatory responses in the upper and lower respiratory airways
after a controlled environmental exposure to diesel exhaust
Methods In a crossover design study healthy human subjects were exposed to
300microgm3 of diesel exhaust and to clean air in random order for 1 hour each in a
controlled environmental exposure chamber on two different days (ge1 week
washout) Fluid from the lungs were collected from subjects via sputum induction
6 hours after each exposure and nasal mucosal cells and fluid were collected from
subjects via nasal lavage 24 hours after each exposure Cytokines (TNF-α IL-6
and IL-8) and total protein were measured in sputum and nasal lavage Statistical
analysis was done using Mann-Whitney U Test
Results There was a difference between males and females in the concentrations
of cytokines and total protein in the nasal lavage analyte and sputum after
exposure to diesel exhaust relative to clean air exposure but except for TNF-α (p
= 0051) in the nasal lavage analyte these observed sex differences were not
statistically significant In the nasal lavage analyte males showed a diesel exhaust
attributable mean increase in TNF-α concentration compared to a mean decrease
in females
Conclusion Our results suggest that 24 hours after acute exposure to 300microgm3
of diesel exhaust males have a stronger inflammatory response in the upper
airway than females as indicated by a statistically significant difference in nasal
TNF-α concentration between males and females with males showing a mean
increase in TNF-α concentrations compared to a mean decrease in females
22 Introduction and Background
Air pollution is a major source of nasal and airway irritation Diesel exhaust is a
significant contributor to ambient air pollution and the largest single source of airborne
particulate matter (PM) in many urban areas (Riedl and Diaz-Sanchez 2005) Across
populations exposures may be acute or chronic and the exposure amounts may be either
high or low depending on the temporal and spatial distribution of diesel exhaust sources
Inhalation of diesel exhaust is the primary route of exposure and has been shown
to cause various health effects Overall chronic inhalation exposure to diesel exhaust is
35
likely to pose a lung cancer hazard to humans as well as damage the lungs in other ways
depending on the length and intensity of the exposure (USEPA HAD 2002 Donaldson et
al 2001) While acute exposure to diesel exhaust can cause acute irritation (eg eye
nose throat bronchial) neurophysiological symptoms (eg lightheadedness nausea)
inflammatory responses in the airway and the lungs respiratory symptoms (cough
phlegm) there is also evidence for an immunologic effect (the exacerbation of allergenic
responses to known allergens and asthma-like symptoms) and cardiovascular effects
(USEPA HAD 2002 Donaldson et al 2001)
23 Toxicokinetics of Diesel Exhaust in Human Nasal and Airway Passages
The biological effects of diesel exhaust particles (DEPs) are a function of their
deposition and clearance in the airway (USEPA HAD 2002) DEPs are made up of fine
particles (diameter lt25microm) including a subgroup with a large number of ultrafine
particles (diameter lt01 microm) (USEPA HAD 2002) In humans inhalation can occur via
the nose mouth or both and upon inhalation the deposition of DEPs will occur
throughout the respiratory tract (see figure 1 below) Primarily the deposition pattern of
DEPs in the airway is influenced by particle size but there are other factors that can alter
the deposition of DEPs in humans including sex age particle size and pre-existing
respiratory tract disease (USEPA HAD 2002)
Following deposition the subsequent clearance of DEPs is affected by the
solubility of the particles DEPs are poorly soluble particles and so they are primarily
cleared by non absorptive process which involves the removal of the intact particles This
means that when there is an override of the clearance mechanisms of the nasal and airway
36
passages this will lead to not only prolonged contact between the cells and the DEPlsquos but
also to other organic compounds that are adsorbed onto the large surface area of DEPs as
well as small amounts of sulfate nitrate metals and other trace elements (USEPA HAD
2002)
Figure 21 The Human Respiratory System
Source httpwwwecgccacleanair-airpurdefaultasplang=Enampn=FCAFC364-1 (Reproduced with permission from Environment
Canada)
231 Hypothesized Mechanism of Adverse Reactions to Inhaled Diesel Exhaust
It is hypothesized that this prolonged contact between DEPs and the cells of the
airway gives rise to the cascading events that follow diesel exhaust exposure and which
leads to the adverse health effects that have been observed These cascading events are
thought to be heavily influenced by pro-inflammatory cytokines and chemokines which
are released from affected cells in response to the immune and local inflammation
response caused by diesel exhaust and that these cytokines also have an added
37
inflammatory effect on the surrounding cells and that they also modify the production of
acute phase proteins by the liver thereby leading to adverse cardiovascular effects
Some studies that have been done to date have confirmed that inhalation of diesel
exhaust does produce a local immune and inflammatory response (Nightingale et al 2000
Diaz et al 1996 and Nordenhall et al 2000) in the upper and lower respiratory airways
Also the roles of pro-inflammatory cytokines in increasing inflammation in response to
diesel exhaust exposure has been well documented (van Eeden et al 2001) but the initial
cause of the inflammatory process which stimulates the release of these cytokines is still
under debate
One leading thought is that the inflammation is instigated by oxidative stress
(Furuyama et al 2006 Diaz-Sanchez and Riedl 2005 Salvi and Holgate1999) caused by
the subsequent prolonged contact of the metals PAHs and quinines contained in diesel
exhaust particles (DEPs) with the epithelial and macrophage cells of the nose and lungs
when the natural lung safety mechanisms become overwhelmed
Normally the lungs are able to deal with the isolation neutralization and removal
of inhaled diesel exhaust and other xenobiotics or air pollutants via various mechanisms
but these natural defense mechanisms can often become overwhelmed for a variety of
reasons including illness or high burden of pollutants and this can then lead to the adverse
health effects mentioned above (Salvi and Holgate 1999) The epithelial and macrophage
cells are the initial target cells for particle interaction and deposition and thus are thought
to be the initial site of toxicity (Salvi et all 1999)
This breakdown in the safety mechanism then leads to the generation of reactive
oxygen species (ROS) that activate and mobilize immune and inflammatory cells via
38
oxidative stress causing the activation of redox-sensitive transcription factors and thus
changing the expression of many pro-inflammatory cytokines (Ritz et al 2005 van Eeden
et al 2001) These pro-inflammatory cytokines include interleukin 6 (IL-6) interleukin 1β
(IL-1β) Tumor necrosis factor α (TNF-α) interferon γ (IFN-γ) transforming growth
factor β2 interleukin 8 (IL-8) (Gabay C et all 1999) This oxidative stress initiated
inflammation is thought to either directly cause or trigger other mechanisms that are
behind the effects that have been seen in in-vitro and in-vivo studies
Usually the cells of the airway are able to effectively reduce the cycle of ROS
generation and inflammation using the cells natural defenses but the oxidative stress that
leads to the immune and inflammatory response usually happens when these defenses are
overwhelmed (Riedl and Diaz-Sanchez 2005) for a variety of reasons including illness or
high burden of pollutants and as mentioned before these can cause an override of the
clearance mechanisms of the nasal and airway passages thus leading to inflammation and
other adverse health effects (Salvi and Holgate 1999)
24 Nasal Lavage and Sputum Induction Studies
In humans experimental and clinical evidence from diesel exhaust exposure
studies that have been done so far to look at the ability of inhaled DEPs to initiate
inflammation in the nasal and airway passages have shown varying responses Studies
done using high concentrations of DEPs have provided evidence of airway inflammation
and studies done using lower concentrations of DEPs have provided less clear-cut
inflammatory responses (Behndig et al 2006 Diaz-Sanchez et al 1996 Salvi et al 2000
39
Nightingale et al 2000 Nordenhall et al 2000 Sydbom et al 2001 and Takizawa et al
2000)
Particularly with regards to the mechanism of diesel exhaust induced airway
inflammation these studies have also helped to confirm that acute cell mediator and
cytokine responses along with the enhanced expression of vascular adhesion molecules in
the airway mucosa could represent an early stage in the inflammatory response following
diesel exhaust exposure (Sydbom et al 2001) This mechanism also might be important in
the development of the diesel exhaust induced airway inflammation (Sydbom et al 2001)
This early stage local inflammatory response is part of the bodylsquos innate immune
response to irritation or injury caused by inhaled foreign particles like DEPs
25 Sex Differences in Innate Immune Response
Innate immunity is the bodylsquos non-specific first active line of defense to harmful
foreign agents It is designed to eliminate or control the injury or infection caused by
these agents by phagocytosis the release of enzymes to degrade these agents and the
activation of the adaptive immune response via cytokine release and cell to cell
interactions which results in a more specific and robust immune response (Bird et al
2008 and Casarett and Doulls 2001) There is an established sexual dimorphism in
immune response with females having a stronger immune reactivity than males (Da Silva
1995) This suggests that sex is an important determinant of the amplitude of the innate
immune response especially since the effects of cytokines can be inhibited or enhanced
by sex hormones (Gabay et al 1999)
40
In-vitro sex hormones have been shown to modulate the production of different
pro-inflammatory cytokines that are involved in immune responses like IL-6 thus
indicating the potential role of sex hormones in the sexual dimorphism of the immune
system (Da Silva 1995) While in-vivo the interactions between sex hormones and other
immunomodulatory factors like glucocorticoids are thought to mediate an indirect action
of sex hormones on the immune system (Da Silva 1995) Therefore they have the
potential to cause variations by sex on the onset of local inflammation as part of the
bodylsquos initial innate immune response that has been demonstrated to happen in response
to diesel exhaust exposure For example in-vivo estrogen has a rapid non-genomic effect
that protects organs from damage and attenuates physiological insult induced
inflammation (Bullard et al 2010)
So with regards to airway induced inflammation either via the direct modulation
(suppression or expression) of cytokines or via the indirect modulation of the immune
system it can be hypothesized that sex hormones have the potential to cause a variation
in the local airway immune and inflammatory response of females and males in response
to diesel exhaust exposure
Therefore the purpose of this study is to determine whether there are sex
differences in the occurrence and intensity of local airway inflammation of females and
males as indicated by the potential variation in the levels of soluble proteins and pro-
inflammatory cytokines in nasal lavage and sputum induction samples collected after
exposure to diesel exhaust relative to clean air
41
26 Materials and Methods
261 Data Collection
The data that were used for this study are part of the datasets generated from a
previous study of diesel exhaust effects The study was funded by the Department of
Defense (DOD) through a grant to the University of Medicine and Dentistry of New
Jersey (UMDNJ) (Grant DAMD17-03-1-0537 Principal Investigator Dr Nancy
Fiedler) The study was done using a human subject protocol that was HIPAA compliant
and approved by the UMDNJ Institutional Review Board
262 Subjects Demographic Data
110 healthy non-smoking men and women between the ages of 18 and 50 were
recruited from the local community in Piscataway New Jersey based on the established
study criteria 100 subjects completed the study Out of these subjects 18 subjects
consented and provided viable nasal lavage samples and 36 subjects consented and
provided viable sputum samples for analysis
Table 21 Demographic and Baseline Subject Characteristics for Nasal Lavage Subjects Females N = 7 Males N = 10
Min Max Mean SD Min Max Mean SD
AGE (years) 19 43 2571 824 18 33 2390 502
Height (inches) 62 65 6350 135 65 73 6805 246
Weight(lb) 104 200 15857 3800 125 192 15950 2122
Education (years) 12 17 15 183 12 20 16 267
Respiration 14 20 1629 180 14 20 1680 235
Temperature oF M 979 994 9852 054 981 991 9838 031
Pulse 60 88 72 924 60 92 6960 1049
Race Frequency () Frequency ()
Asian Pacific
Islander
1 (1429) 5 (50)
Black not Hispanic 1 (1429) 1 (10)
OtherUnknown 1 (1429) 0 (0)
White not Hispanic 4 (5713) 4 (40) One subject had an incomplete dataset and so was excluded for the analysis so Total N = 17 M = some subjects had missing data N = 6 for Females and N = 9 for Males
Education Calculated as High school (12 years) + Years of college or other
42
Table 22 Demographic and Baseline Subject Characteristics for Sputum Induction Subjects Females N = 9 Males N = 27
Min Max Mean SD Min Max Mean SD
AGE (years) 18 44 2589 1007 18 41 2293 460
Height (inches) 60 66 6292 218 64 73 6907 262
Weight(lb) 112 200 13822 3342 140 236 18080 2879
Education (years) 12 16 1422 130 12 20 1589 212
Respiration M 14 20 16 20 12 40 1674 503
Temperature oF M 98 99 9843 064 96 99 9800 081
Pulse M 54 76 6743 789 48 84 6830 949
Race Frequency () Frequency ()
Asian Pacific
Islander
3 (3334) 12 (4444)
Black not Hispanic 1 (1111) 1 (370)
Hispanic or Latino 1 (1111) 5 (1852)
OtherUnknown 0 (0) 1 (370)
White not Hispanic 4 (4444) 8 (2963) M = some subjects had missing data For Temperature N = 6 for Females and N = 26 for Males For Pulse and Respiration
N = 6 for Females
Education Calculated as High school (12 years) + Years of college or other
263 Exposure Conditions and Experimental Design
A crossover study design was used in which each subject acted as their own
controls and underwent two exposure conditions at two separate times in random order
with a minimum one week wash out period between exposures one was to diluted diesel
exhaust normalized to PM10 concentration of 300microgm3 and the other was to filtered clean
ambient air of Busch campus in Piscataway a suburban campus of Rutgers University
Both exposure conditions were 1 hour in duration and took place at the Environmental
and Occupational Health Sciences Instituteslsquo (EOHSI) Controlled Environmental Facility
(CEF)
There were no significant differences in the exposure conditions for all subjects
Overall the concentration of PM10 that the subjects were exposed to was 276plusmn13microgm3
which was close to the target concentration of 300microgm3
Table 23 Mean Air Characteristics and Composition Diesel Exhaust Clean Air
PM10 (microgm3) 276 plusmn 13 6 plusmn 5
NOX (ppm) 363 plusmn 090 002 plusmn 002 CO (ppm) 379 plusmn 076 091 plusmn 021
1 Nitropyrene (ngm3) 268 plusmn 051 lt006
43
264 Nasal Lavage Sample Collection
The nasal lavage procedure was adapted from Koren amp Devlin (1992) and was
performed 24 hours after each exposure While seated the subjects were asked to tilt their
heads backwards at an approximate 45 degree angle Using a sterile needle-less syringe
with a blunt plastic tip 5 ml of warmed (body temperature 37 degree centigrade) sterile
normal saline was instilled into one nostril Subjects were asked to hold their breath and
perform a partial swallow in order to raise the soft palate and hold the fluid in the nasal
cavity After retaining the saline for 10 seconds the subjects were then asked to tilt their
heads forward and allow the fluid to drain passively into a sterile collection cup for 30
seconds This procedure was repeated in the other nostril Each nostril was washed two
times
265 Nasal Lavage Sample Analysis
After collection a portion of the sample was run through syringe-mounted filters
to remove mucous and cell debris This resulting filtrate was frozen immediately on dry
ice in aliquots and then stored at -80 C for subsequent soluble protein and cytokine
analysis using a commercially available enzyme-linked immunosorbent assay (ELISA)
kits This was done consistent with the work of Diaz-Sanchez et al in 1996
266 Sputum Sample Collection
Sputum induction was performed at about 6 hours post-exposure Subjects were
pre-medicated with an inhaled salbutamol (200 microg) to inhibit possible airway constriction
during the sputum induction Using the method described by Pin et al (1992) and
modified by Pizzichini (1996) subjects inhaled increasing concentrations of saline (3 4
44
and 5) for 7 minutes each through a mouthpiece without a valve or nose clip The
aerosol was generated by an Ultraneb 99 ultrasonic nebulizer with an output of 087
mlmin and aerodynamic mass median diameter of 558 um After each period of
inhalation a forced expiratory volume after 1 second (FEV1) was measured for safety
Then subjects were asked to rinse their mouths swallow some water and blow their nose
in order to minimize contamination by saliva or post nasal drip Subjects were then asked
to cough sputum into a sterile container for sample collection
267 Sputum Sample Analysis
Sputum samples were processed as soon as possible usually within 2 hours after
expectoration Sputum was poured into a petri dish Using blunt forceps all portions
that appeared to be free of salivary contamination (up to 1 gm) were placed in a tared 15
ml polystyrene tube and weighed Four times the volume of 01 dithiotheitol (DTT) in
distilled water was added to dissociate disulfide bonds in the mucous The mixture was
vortexed for 15 sec and then rocked on a platform for 15 minutes to ensure mixing To
terminate the reaction 4 volumes of phosphate buffered saline (PBS) were added and the
mixture was rocked for 5 additional minutes The suspension was filtered through a 48
microm nylon gauze to remove cell debris and mucus The resulting clear suspension was
then centrifuged at 790 x g for 10 min and the supernatant was aspirated and stored in six
Eppindorf tubes at ndash70 C for later assay
The pellet was re-suspended in a volume of PBS 200 to 600 microl depending on
macroscopic size and the total cell counts were determined using a hemocytometer Cell
viability was determined with the trypan blue exclusion method The total and absolute
45
number of cells per milligram processed sputum was calculated Three samples of 75 microL
of the cell suspension adjusted to 1 x 10⁶
ml were cytospun at 150 x g for 6 min Slides
were air dried and stained with Wrightlsquos Giemsa stain Nonsquamous cells (n = 400)
were counted The results were expressed as percentage of total nonsquamous cells The
levels of soluble proteins IL-6 IL-8 and TNF-α in the induced sputum were measured
using commercially available ELISA plates (RampD Systems UK)
268 Airway Markers of Inflammation
Only 17 out of the 18 subjects that consented for nasal lavage had a complete set
of samples that were collected 24 hours after both exposures Therefore the subject with
the missing sample was excluded from the analysis All 36 subjects that consented for
sputum induction had a complete set of samples and so they were all included in the
analysis Total protein and cytokine (IL-6 IL-8 and TNF-α) concentrations as measured
from the nasal lavage and sputum induction samples were used as markers of local upper
and lower airway inflammation
In an attempt to control for the possible dilution of the nasal lavage and sputum
samples the cytokine concentrations were normalized using the total protein
concentration Since this is not yet an established method all analysis was done using the
actual concentrations of cytokines measured in nasal lavage and sputum analytes and the
normalized concentrations
46
27 Statistical Methods
Descriptive statistical analysis histograms and box plots were used to evaluate the
distribution of the airway inflammatory marker variables (soluble proteins and cytokines)
and the results indicated that the variables were not normally distributed so non
parametric statistical methods were used for all further analysis
271 Calculation of Response Measures
The main objective of this study is to look at sex differences in the occurrence and
intensity of local airway inflammation as indicated by the potential variation in the levels
of upper and lower airway markers of inflammation (soluble proteins and cytokines) after
exposure to diesel exhaust relative to clean air Therefore for the protein and cytokines
the response measure was the difference between the concentrations measured in nasal
lavage and sputum samples post diesel exhaust exposure and post clean air exposure
Response Measure = ProteinCytokine DE-CA = ProteinCytokine DE - ProteinCytokine CA
The inflammatory response measures were not normally distributed Therefore to address
the aim of the paper the non parametric Mann-Whitney U Test was performed to see if
there was a significant difference in the inflammatory response measures between sex
groups (male females) in nasal lavage and sputum induction samples
All statistical analysis for this paper were done using SPSS software
Version 170 (SPSS inc Chicago IL) and SAS software Version 91 of the SAS System
for Windows (SAS Institute Inc Cary NC USA) Also some graphs were created using
Microsoft Excel 2007 P-values less than or equal to 005 were considered to be
significant
47
Table 24 Difference in Soluble Proteins and Cytokines Measured in the Nasal Lavage Analyte 24
Hours after Exposure to Clean Air and Diesel Exhaust
Females N = 7 Males N = 10
Variables Min Max Mean SD Min Max Mean SD
Protein -13879 8221 -1942 7123 -32777 68970 5829 26832
TNF-α -5535 4896 -380 3316 -582 12096 3413 3496
IL-6 -885 103 -165 348 -710 9880 900 3172
IL-8 -4475 5169 845 3261 -5602 13653 3093 5828
TNF-αProtein 015 196 0685 061 011 062 039 020
IL-6Protein -008 002 -0024 004 -006 028 002 010
IL-8Protein -031 044 -004 029 -086 026 -011 038
Data as presented = Concentrations measured after DE ndash Concentrations measured after CA Protein concentrations are presented as
microgml The cytokines concentrations are presented as pgml and Normalized cytokine concentrations are presented as mgg of total
protein
Table 25 Difference in Soluble Proteins and Cytokines Measured in Sputum 6 Hours after Exposure
to Clean Air and Diesel Exhaust
Females N = 9 Males N = 27
Variables Min Max Mean SD Min Max Mean SD
Protein -714300 207073 -88086 261421 -816692 4974300 133433 1048781
TNF-α -15247 43934 5249 16516 -55488 33318 1420 15464
IL-6 -7195 7877 2477 4470 -6201 16953 307 4514
IL-8 -2803 24268 9361 8100 -34574 46912 1329 17952
TNF-αProtein 000 005 001 002 -007 004 000 002
IL-6Protein 000 001 000 000 000 003 000 001
IL-8Protein 000 002 001 001 -003 005 000 002
Data as presented = Concentrations measured after DE ndash Concentrations measured after CA Protein concentrations are presented as
microgml The cytokines concentrations are presented as pgml and Normalized cytokine concentrations are presented as mgg of total
protein
Graph 21
48
Graph 22
28 Results
281 Study Aim Interaction Effect of Diesel Exhaust Exposure and Sex
Nasal Lavage Analytes
With the exception of TNF-αDE-CA the Mann-Whitney test of the effect of diesel
exhaust exposure by sex (males vs females) revealed no statistically significant two way
interaction effect (exposuresex) on the concentrations of the upper airway inflammatory
response measures (see table 6a below) There was a statistically significant two way
interaction (exposuresex) effect on the concentration of TNF-αDE-CA (p = 0051) between
females (Md = -120 N = 7) and males (Md = 3193 N = 10) The results indicated that
diesel exhaust caused a mean decrease in TNF-α concentrations in females (TNF-αDE-CA
= -127) and a mean increase in TNF-α concentrations in males (TNF-αDE-CA = 3193)
relative to clean air
49
Table 26a Two Way Interaction Significance Test Results and Nasal Analyte Concentrations for the
Difference in the Concentrations of Proteins and Cytokines Measured in Nasal Lavage Samples 24 Hours
after Exposure to Diesel Exhaust and Clean Air
Females Males
Variables Mean Median Mean Median Mann-Whitney U p-value r
Protein -1942 -214 5829 2989 2800 050 -017
TNF-α -380 -120 3413 3193 1500 0051 -047
IL-6 -165 000 900 114 2250 022 -030
IL-8 845 960 3093 2667 3000 063 -012
TNF-αProtein 0685 062 039 041 2200 021 -031
IL-6Protein -0024 000 002 000 2400 028 -026
IL-8Protein -004 -010 -011 -000 3500 100 000
Protein concentrations are presented as microgml The Cytokines concentrations are presented as pgml and normalized cytokine
concentrations are presented as mgg of total protein r = Effect size calculated as z score square root of N (Cohen 1988)
DE = diesel exhaust and CA = Clean air
Table 26b Mean Ranks for TNF-α DE-CA Measured in Nasal Lavage Samples 24 Hours
after Exposure to Diesel Exhaust and Clean Air
Sex Mean Rank Sum of Ranks
TNF-α Females 614 4300
Males 1100 11000
Total
Mean ranks calculated using Mann U Whitney statistical procedure
Graph 23
The horizontal Lines connect TNF-α concentrations from
Nasal Lavage samples collected from each subject after both exposures by sex (Females N = 7 and Males N = 10)
50
Graph 24 Boxplot of Median TNF-α Concentrations by Sex and Exposure
For most of the remaining cytokines and the total protein although not statistically
significant the mean difference (eg IL-8DE-CA) was lower for females than in males after
diesel exhaust exposure relative to clean air
Sputum Analytes
The Mann-Whitney test of the effect of diesel exhaust exposure by sex (males vs
females) showed no statistically significant two way interaction effect (exposuresex) on
the concentrations of the lower airway inflammatory response measures
Table 27 Two Way Interaction Significance Test Results and Sputum Analyte Concentrations for the
Difference in the Concentrations of Proteins and Cytokines Measured in Sputum Induction Samples 6
Hours after Exposure to Diesel Exhaust and Clean Air Females Males
Variables Mean Median Mean Median Mann-Whitney U Z score p-value r
Protein -88086 -17065 133433 -48108 11800 -013 090 -002 TNF-α 5249 696 1420 371 11200 -035 073 -006 IL-6 2477 2934 307 480 7800 -159 011 -026 IL-8 9361 8687 1329 348 7100 -185 0065 -031 TNF-αProtein 001 000 000 000 10700 -053 060 -009 IL-6Protein 000 000 000 000 7800 -159 011 -026 IL-8Protein 001 001 000 000 8800 -122 022 -020
Protein concentrations are presented as microgml The Cytokines concentrations are presented as pgml and normalized cytokine
concentrations are presented as mgg of total protein r = Effect size calculated as z score square root of N (Cohen 1988)
DE = diesel exhaust and CA = Clean air
Although not statistically significant for almost all of the cytokines and the total protein
measured in sputum the mean difference (eg IL-8DE-CA) was higher in females than in
males after diesel exhaust exposure relative to clean air
51
29 Discussion
Inflammation is a complex biological response to numerous stimuli like
xenobiotics and is marked by vasodilatation and increased capillary permeability (first
phase of inflammation) leukocytic and phagocytic cell infiltration (second phase of
inflammation) and tissue degeneration and fibrosis (third phase of inflammation) all of
which serve as a mechanism to initiate the elimination of the xenobiotic and of any
damaged tissue (Suzer 2007)
Airway epithelial cells which are made up of nasal and bronchial epithelium are
the first cells that come into contact with a variety of xenobiotics such as DEPlsquos Apart
from acting as a physicochemical barrier they also play an important role in initiating and
enhancing host defense mechanisms by producing and releasing a variety of
inflammatory mediators like pro-inflammatory cytokines chemokines and other
inflammatory mediators that are involved in airway inflammatory responses (Purokivi et
al 2001 and Takizawa et al 2000)
Cytokines are soluble glycoproteins that are released by living cells to help
regulate cell functions (lsquoStvrtinovaacute et al 1995) The central role of cytokines is to regulate
immune response by controlling the direction amplitude and duration of immune
responses and they also help to control the remodeling of tissues (lsquoStvrtinovaacute et al 1995)
TNF-α and IL-1szlig are the principal first order pro-inflammatory mediators as they initiate
the amplification and release of other cytokines and they are also involved in the repair of
processes in the nasal mucosa (Ertan et al 2007 and Purokivi et al 2001)
Cytokines are mostly produced by activated macrophages and can cause a cascade
of secondary cytokines like chemokines that attract leukocytes like neutrophils and other
white blood cells to areas of inflammation or immune response as part of the second
52
phase of inflammation (Ganong 1999 and Suzer 2007) There are two main groups of
chemokines ie α and β and the α chemokines eg IL-8 act to attract and activate
neutrophils and are mainly involved in the acute inflammatory response (Suzer 2007 and
lsquoStvrtinovaacute et al 1995) such as has been shown to occur in the airway after exposure to
diesel exhaust
This diesel exhaust induced airway inflammation is time dependent (Nordenhall
et al 2000) meaning that in a controlled environmental study the levels of these
cytokines and mediators will depend on when the sampling is done in relation to the
exposure event One thing that could potentially have an effect on the time kinetics of
diesel exhaust induced airway inflammation is sex This is because sex hormones are
known to regulate immunity creating a dichotomy in immune response to injury between
the sexes leading to differences in immune cell activation infiltration and cytokine
production during and after injury (Bird et al 2008)
Female sex hormones especially estrogen stimulate immune response and male
sex hormones especially testosterone are immunosuppressive (Ertan et al 2007 and
Kovacs et al 2002) thus implying that sex is an important determinant in the amplitude
and intensity of the innate immune response (Imahara et al 2005) that is involved in the
initiation of inflammation in response to diesel exhaust exposure This means that in
addition to seeing a variation in the expression of the inflammatory mediators and
markers by time one could also expect to see a variation in them by sex as well
The lung is the main target organ of diesel exhaust and so it can then be
hypothesized that in response to diesel exhaust exposure (depending on the concentration
and duration of the exposure) upon initiation of the cells of the lungs females will show
53
a stronger and faster up-regulation of the creation and secretion of pro-inflammatory
cytokines This is turn will stimulate the synthesis and release of chemokines leading to
the infiltration of leukocytes and hopefully the isolation removal or degradation of the
DEPs in order to prevent tissue damage So in a controlled environmental study this
stronger and faster response in females would most likely enable them to move quickly
from one phase of inflammation to the other ahead of males possibly leading to the
variation in the amplitude and intensity of inflammatory markers by sex that was seen in
this study
After subtracting the concentration of the pro-inflammatory markers measured in
sputum 6 hours post clean air exposure from those measured 6 hours after diesel exhaust
exposure there was a mean increase in inflammatory cytokines (TNF-α and IL-6) and
chemokines (IL-8) for both females and males with females having higher mean
difference levels of TNF-α DE-CA (p = 073) IL-6 DE-CA (p = 011) and IL-8 DE-CA (p =
0065) than males although these observations were not statistically significant Despite
this lack of statistical significance the fact that all three of these cytokines were observed
to be much higher in females than in males (eg IL-8 DE-CA was approximately seven
times higher in females) could reflect a stronger and faster response of females in
response to diesel exhaust exposure relative to males However due to the fact that
sputum samples were only measured at one time point (6 hours after exposure) we cannot
accurately speculate about whether the observed differences are a reflection of kinetic
differences in response to diesel exhaust exposure between males and females
Diesel exhaust particles range from fine to ultrafine particles (UFPs) and upon
inhalation it is the UFPs that are thought to penetrate the lung and elicit the effects
54
observed above in the lungs while the larger particles are thought to induce upper
respiratory effects Therefore the observed higher increase in cytokine concentrations in
females relative to males after diesel exhaust exposure relative to clean air could also
indicate that females are more sensitive to UFPs of diesel exhaust than males This is
similar to what was observed by Franklin et al in 2007 They looked at the association
between UFPs in the environment and both all-cause and specific cause mortality in 27
US communities between 1997 and 2002 and found suggestive evidence that women may
be more susceptible to UFPs effects than men (Franklin et al 2007)
On the other hand the significant increase in TNF-α in nasal fluid and the
observed higher increase in the other cytokines in males compared to females (which
were not statistically significant) 24 hours after diesel exhaust exposure relative to clean
air suggests that males may be more sensitive than females to the fine particles of diesel
exhaust in the upper airways This is probably due to a greater diesel exhaust induced
oxidative stress damage to the nasal epithelial cells of males relative to females owing to
the potential protective effects of estrogen in females reducing leukocyte activity and
exerting antioxidant effects on the nasal epithelial cells (Fortoul et al 2004) This idea is
plausible because in 2004 Fortoul et al observed genotoxic damage to nasal epithelium
and leukocytes which was more severe in males compared with females exposed to air
pollution that was high in ozone The potential antioxidant effect of estrogen in the upper
airway needs to be studied further in order to better elucidate its mechanism of action
especially with regards to the airwaylsquos epithelium
55
291 Study limitations
The observations of this study need to be studied with larger populations of
females and males especially since the sample size used for this study was relatively
small and uneven As an example a power analysis using the observed mean and
standard deviations of this study indicates that with the study sample size (9 for females
and 27 for males) the likelihood to detect a 5 sex difference in IL-6 in sputum is
approximately 010 This means that at the observed effect sizes a total sample size of
368 subjects will be needed to achieve an acceptable power of 070 to detect sex
differences in IL-6 concentrations in sputum at an alpha level of 005
In addition a potential source of error that was not investigated was the possible
additional exposure of subjects to DEPs outside of the exposure chamber during their
diverse daily activities
Although these findings need to be further investigated for confirmation they do
have an important implication for the selection of subjects for diesel exhaust controlled
environmental studies Raising the question of whether sex should be controlled for in
such studies Combining the sexes and not controlling for their potential effect could be
one of the reasons why as previously mentioned there have been some contrasting results
in some studies that have been done so far especially to lower exposures levels of diesel
exhaust So when interpreting the data from these studies the influence of sex needs to be
taken into account
56
210 Conclusions
In healthy volunteers inhalation of 300microgm3 of diesel exhaust for an hour in a
controlled environmental study showed a variation by sex in the occurrence and intensity
of local airway inflammation as indicated by differences in the concentrations of airway
inflammatory markers measured in nasal lavage fluid and induced sputum after diesel
exhaust exposure compared to clean air Six hours after the exposure to diesel exhaust
relative to clean air females tended to show a higher increase in lower airway
inflammatory markers compared to males Twenty four hours after exposure to diesel
exhaust relative to clean air males showed a significant increase in TNF-α concentration
in nasal lavage compared to a decrease in females Males also tended to have higher
concentrations of other upper airway inflammatory markers in nasal lavage compared to
females twenty four hours after exposure to diesel exhaust relative to clean air
Although not statistically significant (except for TNF-α) the observations of this
study suggests a sex difference in the initial site of diesel exhaust toxicity (upper airway
in males versus lower airway in females) that may be due to the possibility that males
may be more sensitive to effects of the fine particles of diesel exhaust which tend to
deposit in the upper airways while females may be more sensitive to the effects of the
ultra fine particles of diesel exhaust which tend to deposit in the lower airways
57
Appendix A
Table A1 Nasal Analyte Concentration of Soluble Proteins and Cytokines 24 Hours after Exposure to
Clean Air and Diesel Exhaust Clean Air Diesel Exhaust
Females N = 7
Variables Min Max Mean SD Min Max Mean SD
Protein 3148 50978 18278 16533 6137 37099 16336 10294
TNF-α 4539 14132 9045 3891 3773 16543 8665 4598
IL-6 000 885 444 371 000 949 279 337
IL-8 3565 16148 8628 4810 4525 20145 9473 6589
TNF-αProtein 010 449 1132 150 018 205 073 063
IL6 Protein 000 010 004 004 000 005 002 002
IL8Protein 032 128 065 033 031 097 061 026
Males N = 10
Variables Min Max Mean SD Min Max Mean SD
Protein 9661 58131 25078 14020 13291 84289 30907 20138
TNF-α 3337 12270 7073 3157 5095 16527 10486 4128
IL-6 009 1114 418 407 000 10234 1318 3142
IL-8 3186 17989 10527 5264 5041 28402 13620 7926
TNF-αProtein 019 047 030 010 018 064 041 019
IL6Protein 000 007 002 003 000 032 004 020
IL 8Protein 012 153 058 051 025 089 047 022
Protein concentrations are presented as microgml Cytokines concentrations presented
as pgml and Soluble Protein concentrations presented as mgg of total protein
Table A2 Sputum Concentration of Soluble Proteins and Cytokines 6 Hours after Exposure to
Clean Air and Diesel Exhaust Clean Air Diesel Exhaust
Females N = 9
Variables Min Max Mean SD Min Max Mean SD
Protein 10475 19178 1401824 3089524 9925 16813 1313738 239489
TNF-α 12962 77002 26174 21117 14081 67332 31422 23191
IL-6 8584 36003 14172 8747 10977 38938 16649 8757
IL-8 42088 101314 62364 002 43384 106649 71725 002
TNF-αProtein 001 006 002 002 001 007 003 002
IL-6Protein 0007 003 001 001 001 003 001 001
IL-8Protein 002 007 005 001 004 008 005 002
Males N = 27
Variables Min Max Mean SD Min Max Mean SD
Protein 8126 26428 1331592 7917 76171 1465025 1276417 4417169
TNF-α 13789 103914 38879 11534 71790 40299 19726 20116
IL-6 8520 18672 12762 8248 29832 13068 4021 3041
IL-8 13936 126006 59052 23661 119685 60382 024 003
TNF-αProtein 001 010 003 001 007 003 002 002
IL-6Protein 000 002 001 000 004 001 001 000
IL-8Protein 001 011 005 000 010 005 002 002
Protein concentrations are presented as microgml Cytokines concentrations presented as pgml and Soluble Protein concentrations presented as mgg of total protein
58
Table A3 Nasal Lavage Median and Percentiles for Diesel Exhaust and Clean Air for All Subjects
Clean Air Diesel Exhaust
Variables 25th Median 75th 25th Median 75th
Protein 11903 17988 29198 14091 21938 30159
TNF-α 4702 7332 11696 6676 8334 14058
il_6 077 354 760 064 318 533
il_8 4607 9064 14081 5726 11044 16571
TNF-αProtein 023 035 063 022 045 063
IL-6Protein 000 002 006 000 001 002
IL-8Protein 030 043 098 037 043 075
Protein concentrations are presented as microgml Cytokines concentrations presented
as pgml and Soluble Protein concentrations presented as mgg of total protein
Table A4 Nasal Lavage Median and Percentiles for Diesel Exhaust and Clean Air for Females
Clean Air Diesel Exhaust
Variables 25th Median 75th 25th Median 75th
Protein 6564 14145 25462 7098 14785 19020
TNF-α 4866 9076 12685 4419 7151 12592
IL6 000 405 846 000 318 334
IL8 4023 7651 12666 4657 6539 17835
TNF-αProtein 046 064 097 026 062 087
IL-6Protein 000 003 009 000 002 005
IL-8Protein 037 054 079 040 054 094
Protein concentrations are presented as microgml Cytokines concentrations presented
as pgml and Soluble Protein concentrations presented as mgg of total protein
TableA5 Nasal Lavage Median and Percentiles for Diesel Exhaust and Clean Air for Males
Clean Air Diesel Exhaust
Variables 25th Median 75th 25th Median 75th
Protein 15025 21725 31601 20017 25995 33389
TNF-α 4261 7149 9302 7303 9029 15540
IL6 084 339 772 132 310 613
IL8 6240 10407 15284 8843 11170 18144
TNF-αProtein 022 028 038 018 045 060
IL-6Protein 000 001 004 001 001 002
IL-8Protein 018 039 118 034 040 055
Protein concentrations are presented as microgml Cytokines concentrations presented
as pgml and Soluble Protein concentrations presented as mgg of total protein
Table A6 Sputum Median and Percentiles for Diesel Exhaust and Clean Air for All Subjects
Clean Air Diesel Exhaust
Variables 25th Median 75th 25th Median 75th
Protein 1068317 1237217 1524077 1042172 1168779 1443032
TNF-α 18457 36054 47676 16687 40299 56781
IL6 9931 11918 14161 10891 12357 15273
IL8 44461 49821 85865 45568 52452 81116
TNF-αProtein 001 003 004 001 003 005
IL-6Protein 001 001 001 001 001 001
IL-8Protein 003 004 005 004 005 006
Protein concentrations are presented as microgml Cytokines concentrations presented
as pgml and Soluble Protein concentrations presented as mgg of total protein
59
Table A7 Sputum Median and Percentiles for Diesel Exhaust and Clean Air for Females
Clean Air Diesel Exhaust
Variables 25th Median 75th 25th Median 75th
Protein 1089757 1345983 1675241 1141263 1254705 1569193
TNF-α 13232 17691 32767 16188 16650 59549
IL6 9306 10499 16045 11616 13576 17748
IL8 45230 55181 82623 48138 76201 95303
TNF-αProtein 001 001 003 001 001 005
IL-6Protein 001 001 001 001 001 002
IL-8Protein 004 004 006 004 005 007
Protein concentrations are presented as microgml Cytokines concentrations presented
as pgml and Soluble Protein concentrations presented as mgg of total protein
Table A8 Sputum Median and Percentiles for Diesel Exhaust and Clean Air for Males
Clean Air Diesel Exhaust
Variables 25th Median 75th 25th Median 75th
Protein 1057336 1225451 1396103 1019687 1140124 1422919
TNF-α 20331 38823 50276 18568 46573 55092
IL6 10213 12077 14178 10498 12290 14388
IL8 44357 49753 87553 44687 52297 80574
TNF-αProtein 001 003 005 001 003 005
IL-6Protein 001 001 001 001 001 001
IL-8Protein 003 004 005 004 005 006
Protein concentrations are presented as microgml Cytokines concentrations presented
as pgml and Soluble Protein concentrations presented as mgg of total protein
Table A9 Nasal Lavage Median and Percentiles for the the Difference in the Concentrations of
Proteins and Cytokines For Females and Males Measured in Nasal Lavage Samples
Females Males
Variables 25th Median 75th 25th Median 75th
Protein -6442 -214 2989 -9582 2989 13586
TNF-α -2595 -120 1736 1259 3193 4041
IL6 -340 000 039 -374 114 192
IL8 -1111 960 3997 -1819 2668 8496
TNF-αProtein 018 062 084 017 041 060
IL-6Protein -006 000 000 -002 000 001
IL-8Protein -031 -010 023 -042 -000 024
Variables = Concentrations measured after DE ndash Concentrations measured after CA Protein concentrations are presented as
microgml The Cytokines concentrations are presented as pgml and normalized cytokine concentrations are presented as mgg of total protein
60
Table A10 Sputum Lavage Median and Percentiles for the the Difference in the Concentrations of
Proteins and Cytokines For Females and Males Measured in Nasal Lavage Samples
Females Males
Variables 25th Median 75th 25th Median 75th
Protein -161056 -17065 42663 -234263 -48108 152690
TNF-α -2018 696 9390 -4055 371 6654
IL6 448 2934 6192 -2850 480 2997
IL8 3454 8687 15040 -5682 348 10421
TNF-αProtein -000 000 001 -000 000 001
IL-6Protein -000 000 001 -000 000 000
IL-8Protein 000 001 002 -001 000 001
Variables = Concentrations measured after DE ndash Concentrations measured after CA Protein concentrations are presented as
microgml The Cytokines concentrations are presented as pgml and normalized cytokine concentrations are presented as mgg of total
protein
Table A11 Mann-Whitney U Test Results Showing the Ranks of the Difference in the Concentrations of
Proteins and Cytokines For Females and Males Measured in Nasal Lavage Samples
Females N = 7 Males N = 10
Variables Mean Rank Sum of Ranks Mean Rank Sum of Ranks
Protein 800 5600 970 9700
TNF-α 614 4300 1100 11000
IL6 721 5050 1025 10250
IL8 829 5800 950 9500
TNF-αProtein 1086 7600 770 7700
IL-6Protein 743 5200 1010 10100
IL-8Protein 900 6300 900 9000
Variables = Concentrations measured after DE ndash Concentrations measured after CA Protein concentrations are presented as microgml The Cytokines concentrations are presented as pgml and normalized cytokine concentrations are presented as mgg of total
protein
Table A12 Mann-Whitney U Test Results Showing the Ranks of the Difference in the Concentrations of
Proteins and Cytokines For Females and Males Measured in Sputum Induction Samples
Females N = 9 Males N = 27
Variables Mean Rank Sum of Ranks Mean Rank Sum of Ranks
Protein 1811 16300 1863 50300
TNF-α 1956 17600 1815 49000
IL6 2333 21000 1689 45600
IL8 2411 21700 1663 44900
TNF-αProtein 2011 18100 1796 48500
IL-6Protein 2333 21000 1689 45600
IL-8Protein 2222 20000 1726 46600
Variables = Concentrations measured after DE ndash Concentrations measured after CA Protein concentrations are presented as microgml The Cytokines concentrations are presented as pgml and normalized cytokine concentrations are presented as mgg of total
protein
61
References
Behndig AF Mudway IS Brown JL Stenfors N Helleday R Duggan ST
Wilson SJ Boman C Cassee1 FR Frew AJ Kelly FJ Sandstrom T and
Blomberg A 2006 Airway antioxidant and inflammatory responses to diesel exhaust
exposure in healthy humans European Respiratory Journal 27 pg 359 ndash pg 365
Bird M Karavitis J and Kovacs EJ 2008 Sex differences and estrogen modulation
of the cellular immune response after injury Cellular Immunology 252 pg 57 ndash pg
67
Bullard MK Bir N Kwan R Cureton E Knudson P and Harken A Women rule
Surgery 147 pg 134-137
Casarett and Doulllsquos 2001 Toxicology The Basic Science of Poisons 6th
Edition
New York McGraw-Hill pg 159-194 419-430
Cohen JW 1988 Statistical Power Analysis for the Behavioral Sciences 2nd
Edition
Hillsdale NJ Lawrence Erlbaum Associates
Croston G Biocarta httpwwwbiocartacompathfilesh_inflamPathwayasp
Da Silva JA 1995 Sex Hormones Glucocorticoids and Autoimmunity facts and
hypotheses Annals of the Rheumatic Disease 54 pg 6-16
Diaz-Sanchez D Tsien A Casillas A Dotson AR and Saxon A 1996 Enhanced
nasal cytokine production in human beings after in vivo challenge with diesel exhaust
particles Journal of Allergy and Clinical Immunology 98 pg114-123
Donaldson K Stone V Seaton A and MacNee W 2001 Ambient Particle Inhalation
and the Cardiovascular System Potential Mechanisms Environmental Health
Perspectives 109(supplement 4) pg 523-527
Ertan T Keskek M Kilic M Gocmen E Oguz H Aksaray S and Koc M Effects
of Gender Difference in Early Cytokine Levels in Trauma Patinets Bratisl Lek Listy
108 pg 128-132
Faul F and Erdfelder E 1992 GPower A priori Post-hoc and Compromise Power
Analysis for MS DOS [Computer Program] Bonn FRG Bonn University
Department of Psychology
Fortoul TI Valverde M Lopez MC Avila-Costa MR Avila-Casado MC
Mussali-Galante P Gonzalez-Villalva A Rojas E and Ostrosky-Shejet P 2004
Genotoxic differences by sex in nasal epithelium and blood leukocytes in subjects
residing in a highly polluted area Environmental Research 94 pg 243 ndash 248
62
Furuyama A Hirano S Koike E and Kobayashi T 2006 Induction of oxidative
stress and inhibition of plasminogen activator inhibitor-1 production in endothelial
cells following exposure to organic extracts of diesel exhaust particles and urban fine
particles Archives of Toxicology 80 pg 154-162
Gabay C and Kushner J 1999 Acute phase proteins and other systemic responses to
inflammation New England Journal of Medicine 340 pg 448ndash54
Ganong W F Lange J and Lange D 1999 Review of Medical Physiology 19th
Edition Stamford CT Appleton and Lange pg 500
Imahara SDJelacic S Junker CE and OlsquoKeefe GE The influence of gender on
human innate immunity Surgery138 pg 275 ndash pg 82
Koren HS and Devlin RB Human Upper Respiratory Tract Responses to Inhaled
Pollutants with Emphasis on Nasal Lavage Annals New York academy of Sciences
641 pg 215 ndash pg 224
Kovacs E J Messingham KAN Influence of Alcohol and Gender on Immune
Response Alcohol Research and Health 27 pg 257 ndash 263
Matthay MA and Clements JA 2004 Coagulation-dependent mechanisms and asthma
The Journal of Clinical Investigation 114 pg 20 ndash 23
Merriam Webster Dictionary 2010 Online Edition
Nightingale JA Maggs R Cullinan Donnelly LE Rodgers DF Kinnersley R
Chung KF Barnes PJ Ashmore M and Newman-Taylor A 2000 Airway
Inflammation after Controlled Exposure to Diesel Exhaust Particles American
Journal of Respiratory and Critical Care Medicine 162 pg 161-166
Nordenhall C Pourazar J Blomberg A Levin J-O Sandstrom T and Adelroth E
2000 Airway inflammation following exposure to diesel exhaust a study of time
kinetics using induced sputum European Respiratory Journal 15 pg 1046-1051
Pallant J 2007 SPSS Survival Manual 3rd
Edition McGraw-Hill pg 210-232
Pin I Freitag AP OByrne PM Girgis-Gabardo A Watson RM Dolovich J 1992
Changes in the cellular profile of induced sputum after allergen-induced asthmatic
responses The American Review of Respiratory Disease 145 pg 1265 ndash 1269
Pizzichini E Pizzichini MMM Efthimiadis A Evans S Morris MM Squillace D
1996 Indices of airway inflammation in induced sputum reproducibility and validity
of cell and fluid-phase measurements American Journal of Respiratory and Critical
Care Medicine 154 pg 308 ndash 317
Rand and Dales Pharmacology 2007 6th
Edition Grune and Stratton Inc
63
Riedl M and Diaz-Sanchez D 2005 Biology of diesel exhaust effects on respiratory
function Journal of Allergy and Clinical Immunology 115 pg 221-8
Ritz SA Wan J and Diaz-Sanchez D 2007 Sulforaphane-stimulated phase II
enzyme induction inhibits cytokine production by airway epithelial cells stimulated
with diesel extract American Journal of Physiology ndash Lung Cellular and Molecular
Physiology 292 L 33 ndash L 39
Salvi S and Holgate ST 1999 Mechanisms of particulate matter toxicity Clinical
and Experimental Allergy 29 pg 1187-1194
lsquoStvrtinovaacute V Jakubovskyacute J and Huliacuten I 1995 Inflammation and Fever
Comenius University Bratislava Slovak Republic Retrieved January 23rd
2010 from
httpnicsavsklogosbooksscientificzhtml
Suzer O 2007 Cytokine Slides Retrieved on January 23rd
2010 from
httpwwwctfedutrfarmaonersuzerpdfing11_Cytokinespdf
Sydbom A Bomberg A Parnia S Stenfors N Sandstrom T and Dah en SE 2001
Health Effects of Diesel Exhaust Emissions European Respiratory Journal 17 pg
733-746
Takizawa H Ohtoshi T Kawasaki S Abe S Sugawara I Nakahara K
Matsushima K and Kudoh S 2000 Diesel Exhaust Particles Activate Human
Bronchial Epithelial Cells to Express Inflammatory Mediators in Airways A Review
5 pg 197 ndash pg 203
Tornqvist H Mills NL Gonzalez M Miller MR Robinson SD Megson IL
MacNee W Donaldson K Soderberg S Newby DE Sandstrom T and Blomberg
A 2007 Persistent endothelial dysfunction following diesel exhaust inhalation in
man American Journal of Respiratory and Critical Care Medicine 176 pg 395-400
ToxProbe Inc Diesel Exhaust in Toronto
US Environmental Protection Agency (EPA) (2002) Health assessment document
for diesel engine exhaust Prepared by the National Center for Environmental
Assessment Washington DC for the Office of Transportation and Air Quality
EPA6008-90057F Available from National Technical Information Service
Springfield VA PB2002-107661 and lthttpwwwepagovnceagt
Van Eeden SF Tan WC Suwa T Mukae H Terashima T Fujii T Qui D
Vincent R and Hogg JC 2001 Cytokines Involved in Systemic Inflammatory
Response Induced by Exposure to Particulate Matter Air Pollutants (PM10) American
Journal of Respiratory and Critical Care Medicine 2001 164 pg 826-830
64
Chapter 3
Analysis of Sex Differences in Systemic Inflammation and
Acute Phase Response Markers after Acute Diesel Exhaust
Exposure
65
31 Abstract
32 Introduction
321 Cytokines
322 Acute Phase Response
323 Platelets and Other Blood Cells
324 Sex Differences in Immune Response
33 Materials and Methods
331 Data Collection
332 Subjects Demographic Data
333 Exposure Conditions and Experimental Design
334 Systemic Inflammation and Acute Phase Response Markers
335 Blood Sample Collection
336 Blood Sample Analysis
34 Statistical Methods
35 Results
36 Discussion
361 Study Limitations
37 Conclusions
Appendix B
References
66
31 Abstract
Background Epidemiological studies have linked ambient levels of particulate
matter to adverse cardiovascular outcomes but the mechanisms that govern this
link are poorly understood There is a general consensus that one potential
mechanism for this link is inflammation Inflammation is part of the bodylsquos innate
(nonspecific) immune response and there is an established sex dimorphism in
immune response
Aims To evaluate possible sex differences in the occurrence and intensity of
systemic inflammation and acute phase response in females and males after a
controlled environmental exposure to diesel exhaust
Methods In a crossover design study healthy human subjects were exposed to
300microgm3 of diesel exhaust and clean air in random order for 1 hour each on two
different days (ge1 week washout) Blood cell counts platelets pro-inflammatory
cytokines mediators and acute phase proteins were measured in peripheral blood
that was collected from subjects three times during the study at baseline six hours
and twenty four hours post exposure Statistical analysis was done using a linear
mixed model with repeated measures and contrast to investigate the three way
interaction effect (exposure typesampling timesex) on the measured variables
Results Overall there was a statistically significant three way interaction effect
on platelet count (p = 0050) The contrast analysis showed that between males
and females after controlling for baseline there was a statistically significant
difference in platelet counts (p = 00145) six hours after diesel exhaust exposure
relative to clean air with females having a mean higher platelet count than males
Within males the contrast analysis showed a statistically significant decrease in
platelet counts (p = 0045) twenty four hours after diesel exhaust exposure relative
to clean air Within the other markers of inflammation and acute phase reaction
proteins mixed results were observed but none of them were statistically
significant
Conclusion Our results suggest that there was a statistically significant effect of
sex on platelet counts after a controlled human environmental exposure to a
known concentration of diesel exhaust (300microgm3) relative to clean air Females
had a stronger systemic inflammatory response than males as there was a
statistically significant increase in platelet count in females 6 hours after diesel
exhaust exposure compared to a decrease in males
32 Introduction
Air pollutants such as diesel exhaust have been shown to cause adverse health
events and to be associated with increased cardiovascular morbidity but the mechanisms
by which they do so are not well known It has been hypothesized that the inhalation of
67
these pollutants over a period of time causes an overload or hindrance of the lungs
natural defenses which then sets off a variety of cascading adverse systemic reactions
involving and mediated by multiple cell lines (epithelial cells macrophages neutrophils
mast cells and lymphocytes) cytokines and acute phase proteins all of which may
contribute to the overall adverse respiratory and cardiovascular health effects that have so
far been linked with exposure to diesel exhaust and other air pollutants
321 Cytokines
Cytokines are intercellular signaling polypeptides produced by activated cells
(Gabay C et all 1999) in response to local inflammation caused by xenobiotics like diesel
exhaust They have an added inflammatory effect on the surrounding cells and they also
modify the production of acute phase proteins by the liver thereby leading to adverse
cardiovascular outcomes Of particular interest in diesel exhaust exposure are those
cytokines that are produced during inflammation and which also participate and
contribute to the inflammatory process because they are the chief stimulant of the acute
phase proteins These pro-inflammatory cytokines include interleukin 6 (IL-6)
interleukin 1β (IL-1β) Tumor necrosis factor α (TNF-α) interferon γ (IFN-γ)
transforming growth factor β2 interleukin 8 (IL-8) (Gabay C et all 1999) Macrophages
and monocytes are the most important sources of these cytokines at the sites of
inflammation although they are also produced by a number of other different cells
It is hypothesized that diesel exhaust induced inflammation is instigated by
oxidative stress (Furuyama et al 2006 Diaz-Sanchez and Riedl 2005 Salvi and
Holgate1999) caused by the subsequent prolonged contact of the metals PAHs and
68
quinines contained in diesel exhaust with the epithelial and macrophage cells when the
natural lung safety mechanisms become overwhelmed This oxidative stress initiated
inflammation is thought to either directly cause or trigger other mechanisms that are
behind the effects that have been seen in in-vitro and in-vivo studies
322 Acute Phase Response
The respiratory and cardiovascular effects of diesel exhaust are thus thought to be
connected via an oxidative-stress initiated inflammation because inflammation is known
to cause a large number of changes far from the initial site of the local inflammation and
potentially involving many organ systems More specifically changes in the levels of
acute phase proteins in response to inflammation and mediated by pro-inflammatory
cytokines are believed to be one of the possible causes of the corresponding adverse
cardiovascular effects that are often seen following the inhalation of diesel exhaust
Acute phase proteins are proteins that are produced by the liver and whose plasma
concentrations increase or decrease by at least 25 during an inflammatory disorder
(Gabay et al 1999) Of particular interest are fibrinogen and c-reactive proteins
Fibrinogen can cause endothelial cell adhesion spreading and proliferation and is also a
factor of the coagulation cascade when clotting occurs while c-reactive proteins have
been shown to be a cardiovascular risk factor in both healthy subjects and those with
coronary heart disease (Peter et al 2001)
323 Platelets and Other Blood Cells
Cascading adverse systemic reactions such as changes in acute phase reaction
proteins mentioned above are mediated by multiple cell lines in the blood like platelets
69
Platelets are unique anucleate mammalian blood cells that are involved in haemostasis
and in the innate inflammatory response to xenobiotics They act both directly and
indirectly via the secretion of chemokines and they help to attract other blood cells like
leukocytes to sites of inflammation as part of the innate inflammatory response (Weyrich
et al 2004) Activated platelets also secrete key components of coagulation (Weyrich et al
2004) and so may also be involved in the adverse cardiovascular effects that have been
seen following diesel exhaust exposure
To summarize the activation and mobilization of inflammatory cells and platelets
by oxidative stress the production of pro-inflammatory cytokines the production of
acute phase proteins and the production of circulating inflammatory mediators all
characterize the systemic inflammatory response (van Eeden et al 2001) to diesel exhaust
that is hypothesized to cause adverse cardiovascular effects
324 Sex Differences in Immune Response
This systemic inflammatory response to inhaled diesel exhaust particles is part of
the bodylsquos innate (nonspecific) immune response which is the bodylsquos first line of defense
against potentially harmful foreign agents that have entered the body through the
respiratory system or other routes such as the gut or genitourinary tract (Casarett and
Doulls 2001) There is an established sex dimorphism in immune response with females
having a stronger immune reactivity (humoral and cellular mediated immune) than males
(Da Silva 1995)
The effects of cytokines can be inhibited or enhanced by hormones (Gabay et al
1999) In-vitro sex hormones have been shown to modulate the production of different
70
cytokines that are involved in immune responses like IL-6 thus indicating the potential
role of sex hormones in the sexual dimorphism of the immune system (Da Silva 1995)
While in-vivo the interactions between sex hormones and other immunomodulatory
factors like glucocorticoids are thought to mediate an indirect action of sex hormones on
the immune system (Da Silva 1995) and therefore have the potential to cause variations
by sex in the systemic inflammation and acute phase responses that have been
demonstrated in response to diesel exhaust exposure
Therefore the purpose of this study is to determine whether there are sex
differences in the occurrence and intensity of systemic inflammation and acute phase
response in males and females as indicated by the potential variation in the levels of
blood cells platelets pro-inflammatory cytokines mediators and acute phase proteins in
peripheral blood after acute exposure to diesel exhaust relative to clean air
33 Materials and Methods
331 Data Collection
The data that were used for this study are part of the datasets generated from a
previous study of diesel exhaust effects The study was funded by the Department of
Defense (DOD) through a grant to the University of Medicine and Dentistry of New
Jersey (UMDNJ) (Grant DAMD17-03-1-0537 Principal Investigator Dr Nancy
Fiedler) The parent study was done using a human subject protocol that was HIPAA
compliant and approved by the UMDNJ Institutional Review Board
71
332 Subjects Demographic Data
110 healthy non-smoking men and women between the ages of 18 and 50 were
recruited from the local community in Piscataway New Jersey based on the established
study criteria 100 subjects completed the study Due to problems with blood sample
collection at various study time points all the subjects did not have complete sets of
samples collected at the three sampling time points Therefore depending on the sampling
time and the measure being analyzed the total analysis sample size was different (see
tables 1a to 1d below)
Table 31a CBC Subjects Demographic Information Females
N = 35
Males
N = 60
Min Max Mean SD Min Max Mean SD
AGE (years) 18 44 2389 601 18 43 2382 581
Education (years) 12 22 1546 234 12 23 1567 236
Race Frequency () Frequency ()
Asian Pacific Islander 14 (40) 22 (3667)
Black not Hispanic 2 (571) 5 (833)
Hispanic or Latino 7 (20) 10 (1667)
OtherUnknown 1 (286) 1 (166)
White not Hispanic 11 (3143) 22 (3667)
Table 31b IL-6 Subjects Demographic Information Females
N = 27
Males
N = 53
Min Max Mean SD Min Max Mean SD
AGE (years) 18 44 2393 658 18 43 2449 604
Education (years) 12 20 1522 176 12 23 1604 259
Race Frequency () Frequency ()
Asian Pacific Islander 12 (4444) 21 (3962)
Black not Hispanic 1 (370) 4 (755)
Hispanic or Latino 3 (1111) 8 (1509)
OtherUnknown 1 (370) 0 (0)
White not Hispanic 10 (3705) 20 (3774)
Table 31c C - reactive protein Subjects Demographic Information Females
N = 32
Males
N = 57
Min Max Mean SD Min Max Mean SD
AGE (years) 18 44 2412 621 18 43 2398 557
Education (years) 12 22 1563 232 12 23 1596 252
Race Frequency () Frequency ()
Asian Pacific Islander 15 (4687) 22 (3860)
Black not Hispanic 2 (625) 4 (702)
Hispanic or Latino 5 (1563) 10 (1754)
OtherUnknown 1 (312) 0 (0)
White not Hispanic 9 (2813) 21 (3684)
72
Table 31d Fibrinogen Subject Demographics Females
N = 31
Males
N = 61
Min Max Mean SD Min Max Mean SD
AGE (years) 18 44 2400 610 18 43 2407 578
Education (years) 12 22 1545 236 12 23 1589 251
Race Frequency () Frequency ()
Asian Pacific Islander 12 (3871) 23 (3770)
Black not Hispanic 2 (645) 5 (820)
Hispanic or Latino 5 (1613) 10 (1639)
OtherUnknown 1 (323) 1 (164)
White not Hispanic 11 (3548) 22 (3607)
333 Exposure Conditions and Experimental Design
A crossover design was used in which each subject underwent two exposure
conditions in random order on two separate days one was to a diluted diesel exhaust
normalized to PM10 concentration of 300microgm3 and the other was to filtered clean
ambient air of Busch campus in Piscataway a suburban campus of Rutgers University
Both exposure conditions were 1 hour in duration and took place at the Environmental
and Occupational Health Sciences Instituteslsquo (EOHSI) Controlled Environmental Facility
(CEF) Each exposure condition was presented with and without an acute psychological
stressor to two groups of subjects high and low in self reported chemical intolerance (CI)
Subjects were also asked to fast overnight the day before the study until after each
exposure session and to also abstain from any exercise
There were no significant differences in the exposure conditions for all subjects
Overall the concentration of PM10 that the subjects were exposed to was 276plusmn13microgm3
which was close to the target concentration of 300microgm3
Table 32 Mean Air Characteristics and Composition Diesel Exhaust Clean Air
PM10 (microgm3) 276 plusmn 13 6 plusmn 5 NOX (ppm) 363 plusmn 090 002 plusmn 002
CO (ppm) 379 plusmn 076 091 plusmn 021
1 Nitropyrene (ngm3) 268 plusmn 051 lt006
73
334 Systemic Inflammation and Acute Phase Response Markers
The following variables were measured in peripheral blood as systemic
inflammation and acute phase response markers based on similar studies that have been
done so far white blood cell count (WBC) red blood cell count (RBC) platelet count
cell blood count measures (neutrophils lymphocytes monocytes eosinophils and
basophils) c-reactive protein IL-6 and fibrinogen concentrations
335 Blood Sample Collection
Peripheral venous blood was collected from subjects at about the same time of
day 3 times during the study before exposure six hours after exposure and 24 hours
after exposure
336 Blood Sample Analysis
Blood was sent to Quest diagnostics laboratories for neutrophil count platelet
count and cell blood count (CBC) measurements Peripheral blood IL-6 and c-reactive
protein concentrations were analyzed using commercially available ELISAs while the
peripheral blood fibrinogen content was measured using functional assay at the Robert
Wood Johnson University hematology laboratory
34 Statistical Methods
Descriptive statistical analysis histograms and box plots were used to evaluate the
distribution of all the variables Based on the results of the descriptive analysis all the
values of the raw systematic inflammation and acute phase response outcome variables
74
were log transformed in order to normalize their distribution before use in further
analysis
A potential confounder which could have skewed the results of the analysis was
body mass index (BMI) Therefore BMI was calculated for all the study subjects using
height and weight and was then stratified by sex in order to evaluate the mean BMI by
sex The mean BMI for females (Mean = 2365 and SD = 468) and the mean BMI for
males (Mean = 2566 and SD = 340) were about the same for the study population so
there was no need to control for BMI in this analysis
To address the aim of the paper a linear mixed model with repeated analysis was
used to examine if there was a significant three way interaction among exposure type
(diesel exhaust and clean air) sampling time (Baseline 6 hours and 24 hours) and sex
(males and females) on the log transformed outcome variables
Since some subjects were also exposed to an acute psychological stressor (a
potential effect modifier) an initial stress stratified linear mixed model with repeated
analysis was done on those subjects who were exposed to stress and those subjects who
were not exposed to stress in order to determine if there was a stress effect on the
concentrations of the outcome variables The effect sizes of the stratified analyses were
compared and it was determined that there was no stress effect Therefore the final
model contained sex as a between subjects variable exposure and time as within subjects
variables with the log transformed outcome variables as the dependent variables The
exposuretimesexlsquo three way interaction was examined to assess the hypothesis of
interest
75
Tests of the three interactions were conducted using Type 3 score tests (Liang and
Zeger 1986) of the interaction between exposure time and sex Contrasts were used to
test whether males and females differed with respect to the effect of exposure on changes
in the concentration of systemic inflammation markers from baseline to each subsequent
time point Contrasts were also used to test whether within males and within females
changes in the concentration of systemic inflammation markers from baseline to each
subsequent time point differed between exposures
All statistical analysis for this paper were done using SAS software Version 91
of the SAS System for Windows (SAS Institute Inc Cary NC USA) and SPSS
software Version 170 (SPSS inc Chicago IL) Also some graphs were created using
Microsoft Excel 2007 P-values less than or equal to 005 were considered to be
significant
35 Results
Three Way Interaction Effect of Exposure Time and Sex on Systemic Inflammation
and Acute Phase Response Markers
With the exception of platelets the linear mixed model with repeated analysis of
the exposuretimesexlsquo three way interaction revealed no statistically significant three
way interaction effect on the concentrations of the systemic inflammation and acute
phase reaction markers (see table 3)
76
Table 33 Three Way Interaction Results E x T x S
Variables F Value P Value
Platelet 302 0050
WBC 017 085
RBC 181 017
Absolute CBC Values
Neutrophils 047 062
Lymphocytes 028 075
Monocytes 035 071
Eosinophils 027 077
Basophils 005 095
Percent CBC Values
Neutrophils 077 046
Lymphocytes 097 038 Monocytes 090 041
Eosinophils 031 074
Basophils 004 096
Mediators
CRP 147 023
Il6 007 093
Coagulation Factors
Fibrinogen 045 050
E = Exposure (Diesel Exhaust and Clean Air) T = Time (6 hrs and 24 hrs)
S = Sex (Females and Males) WBC = White Blood Cells RBC = Red Blood Cells CRP = C - reactive protein IL6 = Interleukin 6 and CBC = Cell Blood Count
Units of WBC and Platelets = 10e3microL Units of RBC = 10e6microL Units of absolute
CBC variables 10e3microL Units of percent CBC variables = Unit of CRP = mgl Unit of IL6 = pgml and Unit of Fibrinogen = mgdl p le 005 is significant
There was a statistically significant three way interaction effect on platelet count (p =
0050 for exposuretimesex) The contrast analysis showed that males differed from
females with respect to the effect of diesel exhaust on changes in platelet counts from
baseline to 6 hours (p = 00145) with males showing a mean decrease in platelet count
compared to a mean increase in females (see table 4a and graph 1)
Graph 31 Plot of Mean Platelet Count Difference by Exposure by Sex and Time
Baseline 6 Hrs 24 Hrs
Males 0 -915 -773
Females 0 347 261
-15
-10
-5
0
5
10
15
Me
an P
late
let
Dif
fere
nce
10
e3micro
L (+
-1
SE
)
Mean Platelet Difference From Baseline by Sex
77
Within males the contrast analysis showed a statistically significant effect of diesel
exhaust on the change in platelet counts at 24 hours (p = 0045) while a significant effect
at 24 hours was not seen within females (see table 4a and graph 2) However these
effects were also not significantly different between males and females at 24 hours
Graph 32 Graph of Mean Percent Change in Platelet Counts Measured in Diesel Exhaust Relative to
Clean Air by Sex
78
Table 34a Mean Log Blood Cell Values (Absolute) and Contrast Test Results Baseline 6hr 24hr 6hr Δ
24hr Δ
Exposure
Main
Effect On
6hr Δ
Exposure
Main
Effect On
24hr Δ
Exposure
by Sex
Effect
On 6hr Δ
Exposure
by Sex
Effect On
24hr Δ
Variables
Sex
Exp
Mean
(SD)
N
Mean
(SD)
N
Mean
(SD)
N
Mean
(SD)
N
Mean
(SD)
N
t-Value
(SE)
p-Value
t-Value
(SE)
p-Value
t-Value
(SE)
p-Value
t-Value
(SE)
p-Value
Log
Platelet
(x10e3microl)
Males DE 550
(021)
60
556
(021)
60
552
(021)
60
006
(008)
60
002
(007)
60
-174
(001)
0082
-201
(001)
0045
-245
(002)
00145
-142
(002)
016
CA 549
(020)
59
557
(020)
56
553
(020)
60
008
(008)
55
004
(009)
59
Females DE 550
(024)
32
557
(021)
33
553
(024)
34
009
(011)
31
005
(012)
31
175
(002)
0081
027
(002)
078
CA 555
(022)
35
560
(020)
35
560
(022)
33
005
(006)
35
003
(005)
33
Log
WBC
(x10e3microl)
Males DE 173
(022)
60
186
(024)
60
169
(026)
60
013
(018)
60
-004
(013)
60
-014
(003)
089
032
(003)
075
-058
(005)
056
-031
(005)
076
CA 173
(024)
58
187
(022)
55
168
(022)
60
012
(016)
54
-004
(014)
58
Females DE 167
(029)
32
182
(027)
33
161
(025)
34
015
(022)
31
-005
(014)
31
062
(004)
054
063
(004)
053
CA 172
(028)
35
184
(026)
34
164
(025)
33
012
(018)
34
-009
(014)
33
Log
RBC
(x10e6microl)
Males DE 160
(007)
60
159
(007)
60
160
(007)
60
-000
(003)
60
001
(003)
60
-015
(001)
088
-079
(001)
043
-189
(002)
0060
-073
(002)
047
CA 159
(006)
59
159
(007)
56
160
(007)
60
000
(003)
55
001
(003)
59
Females DE 139
(015)
32
142
(009)
33
142
(009)
34
003
(014)
31
004
(013)
31
225
(001)
0024
032
(001)
075
CA 141
(008)
35
142
(008)
35
144
(008)
33
001
(004)
35
003
(004)
33
Exp = Exposure DE = Diesel Exhaust CA = Clean Air Δ = Change from baseline SD = Standard deviation and SE = Standard Error WBC = White
Blood Cells and RBC = Red Blood Cells Signt = Significant = statistically significant at p = 005
= borderline statistically significant at p = 005
79
Table 34b Mean Log Blood Cell Blood Count Values (Absolute) and Contrast Test Results (continued) Baseline 6hr 24hr 6hr Δ
24hr Δ
Exposure
Main
Effect On
6hr Δ
Exposure
Main
Effect On
24hr Δ
Exposure
by Sex
Effect On
6hr Δ
Exposure
by Sex
Effect On
24hr Δ
Variables
Sex
Exp
Mean
(SD)
N
Mean
(SD)
N
Mean
(SD)
N
Mean
(SD)
N
Mean
(SD)
N
t-Value
(SE)
p-Value
t-Value
(SE)
p-Value
t-Value
(SE)
p-Value
t-Value
(SE)
p-Value
Log
Neutrophils
(cellsmicrol)
Males DE 807
(030)
60
822
(031)
60
803
(034)
60
016
(022)
60
-004
(017)
60
-023
(004)
082
013
(004)
089
-096
(007)
034
-059
(007)
055
CA 806
(034)
59
822
(032)
56
801
(029)
60
014
(022)
55
-004
(021)
59
Females DE 801
(037)
32
815
(039)
33
793
(035)
34
013
(029)
31
-007
(021)
31
103
(006)
030
084
(006)
040
CA 807
(040)
35
814
(039)
35
795
(034)
33
007
(024)
35
-013
(022)
33
Log
Lymphocytes
(cellsmicrol)
Males DE 747
(025)
60
757
(026)
60
745
(029)
60
010
(021)
60
-003
(017)
60
001
(003)
099
-018
(003)
085
071
(006)
048
057
(006)
057
CA 747
(018)
59
756
(022)
56
745
(025)
60
010
(017)
55
-002
(018)
59
Females DE 745
(032)
32
760
(030)
33
741
(030)
34
016
(020)
31
-003
(016)
31
-088
(004)
038
-085
(005)
040
CA 744
(028)
35
764
(027)
35
744
(029)
33
019
(016)
35
-000
(013)
33
Log
Monocytes
(cellsmicrol)
Males DE 604
(032)
60
621
(026)
60
602
(032)
60
017
(027)
60
-003
(027)
60
082
(004)
041
162
(004)
010
044
(007)
066
084
(007)
040
CA 609
(031)
59
621
(024)
56
599
(030)
60
013
(026)
55
-010
(021)
59
Females DE 587
(028)
32
606
(029)
33
581
(029)
34
-019
(026)
31
-008
(029)
31
007
(006)
095
019
(006)
085
CA 593
(028)
35
610
(029)
35
586
(026)
33
018
(024)
35
-008
(018)
33
Log
Eosinophils
(cellsmicrol)
Males DE 489
(069)
60
482
(076)
60
476
(076)
60
-008
(047)
60
-014
(028)
60
059
(008)
056
026
(007)
080
008
(013)
094
-059
(013)
056
CA 498
(060)
59
482
(089)
56
479
(074)
60
-010
(045)
55
-016
(035)
59
Females DE 460
(082)
32
455
(087)
33
451
(080)
34
-002
(036)
31
-003
(032)
31
035
(010)
073
093
(010)
036
CA 465
(073)
35
458
(085)
35
451
(075)
33
-007
(052)
35
-013
(026)
33
Log
Basophils
(cellsmicrol)
Males DE 305
(052)
60
329
(045)
60
304
(046)
60
023
(059)
60
-004
(055)
59
-147
(009)
014
-110
(009)
027
-012
(016)
091
019
(016)
085
CA 301
(052)
59
337
(039)
56
309
(045)
60
038
(054)
55
010
(046)
59
Females DE 307
(053)
32
331
(035)
33
301
(048)
33
030
(056)
31
-008
(048)
30
-096
(013)
034
-106
(013)
029
CA 309
(053)
35
351
(043)
34
318
(055)
33
040
(045)
35
034
(059)
33
Exp = Exposure DE = Diesel Exhaust CA = Clean Air Δ = Change from baseline SD = Standard deviation and SE = Standard Error Signt =
Significant ple 005 is significant
80
Table 34c Mean Log Cell Blood Count Values (Percentage) and Contrast Test Results Baseline 6hr 24hr 6hr Δ
24hr
Δ
Exposure
Main
Effect On
6hr Δ
Exposure
Main
Effect On
24hr Δ
Exposure
by Sex
Effect
On 6hr Δ
Exposure
by Sex
Effect On
24hr Δ
Variables
Sex
Exp
Mean
(SD)
N
Mean
(SD)
N
Mean
(SD)
N
Mean
(SD)
N
Mean
(SD)
N
t-Value
(SE)
p-Value
t-Value
(SE)
p-Value
t-Value
(SE)
p-Value
t-Value
(SE)
p-Value
Log
Neutrophils
()
Males DE 404
(013)
60
406
(013)
60
403
(014)
60
002
(010)
60
-001
(008)
60
-046
(002)
065
-023
(002)
081
-123
(003)
022
-078
(003)
044
CA 403
(014)
58
406
(013)
55
403
(014)
60
002
(010)
54
000
(013)
58
Females DE 403
(015)
32
402
(018)
33
402
(018)
34
-002
(011)
31
-002
(011)
31
120
(003)
023
080
(003)
043
CA 405
(017)
35
400
(018)
34
401
(016)
33
-005
(010)
34
-004
(010)
33
Log
Lymphocytes
()
Males DE 344
(022)
60
340
(023)
60
345
(025)
60
-004
(016)
60
001
(015)
60
015
(003)
088
-055
(003)
058
137
(005)
017
090
(005)
037
CA 344
(021)
58
340
(021)
55
346
(021)
60
-003
(015)
54
002
(017)
58
Females DE 348
(024)
32
347
(028)
33
350
(226)
34
001
(015)
31
002
(015)
31
-160
(004)
011
-153
(004)
013
CA 342
(029)
35
350
(027)
34
350
(026)
33
008
(016)
34
009
(016)
33
Log
Monocytes
()
Males DE 201
(026)
60
205
(021)
60
202
(023)
60
004
(018)
60
001
(021)
60
110
(004)
027
171
(004)
009
102
(006)
031
127
(006)
021
CA 206
(027)
58
205
(021)
55
200
(022)
60
001
(021)
54
-005
(021)
58
Females DE 190
(021)
32
193
(024)
33
190
(026)
34
005
(020)
31
-002
(022)
31
-045
(005)
065
-031
(005)
076
CA 191
(027)
35
196
(029)
34
192
(025)
33
006
(018)
34
001
(015)
33
Log
Eosinophils
()
Males DE 086
(063)
60
065
(069)
60
076
(067)
60
-021
(046)
60
-010
(027)
60
069
(008)
049
012
(008)
090
034
(013)
073
-044
(013)
066
CA 093
(058)
58
063
(086)
55
081
(067)
60
-023
(047)
54
-011
(038)
58
Females DE 063
(075)
32
043
(084)
33
059
(075)
34
-017
(032)
31
002
(027)
31
009
(010)
093
064
(010)
052
CA 063
(070)
35
043
(082)
34
056
(069)
33
-019
(054)
34
-005
(025)
33
Log
Basophils
()
Males DE -098
(046)
60
-088
(044)
60
-096
(047)
59
010
(056)
60
-000
(054)
59
-141
(009)
016
-119
(009)
023
015
(015)
088
028
(015)
078
CA -103
(056)
58
-080
(037)
55
-090
(044)
60
026
(054)
54
014
(047)
58
Females DE -091
(046)
32
-077
(037)
33
-089
(046)
33
014
(053)
31
-003
(046)
30
-125
(012)
021
-124
(012)
022
CA -093
(046)
35
-063
(039)
33
-076
(050)
33
030
(044)
33
013
(057)
33
Exp = Exposure DE = Diesel Exhaust CA = Clean Air Δ = Change from baseline SD = Standard deviation and SE = Standard Error Signt = =
statistically significant at p = 005 = borderline statistically significant at p = 005
81
Table 34d Mean Log Mediators Values and Contrast Test Results Baseline 6hr 24hr 6hr Δ
24hr Δ
Exposure
Main
Effect
On 6hr Δ
Exposure
Main
Effect On
24hr Δ
Exposure
by Sex
Effect
On 6hr Δ
Exposure
by Sex
Effect On
24hr Δ
Variables
Sex
Exp
Mean
(SD)
N
Mean
(SD)
N
Mean
(SD)
N
Mean
(SD)
N
Mean
(SD)
N
t-Value
(SE)
p-Value
t-Value
(SE)
p-Value
t-Value
(SE)
p-Value
t-Value
(SE)
p-Value
Log
CRP
(mgl)
Males DE -032
(129)
55
-040
(127)
49
-042
(149)
55
002
(044)
48
-015
(052)
53
-076
(010)
045
120
(009)
023
-126
(016)
021
-163
(015)
010
CA -046
(136)
56
-047
(145)
48
-047
(135)
57
009
(043)
48
-002
(055)
56
Females DE -030
(164)
32
-026
(153)
30
-020
(155)
32
008
(039)
30
010
(055)
32
100
(012)
032
114
(012)
025
CA -006
(134)
31
-022
(147)
30
-019
(153)
31
-004
(039)
29
-004
(034)
30
Log
IL-6
(pgml)
Males DE 241
(173)
49
232
(178)
48
294
(185)
26
-002
(089)
45
026
(105)
25
049
(023)
062
074
(026)
046
036
(041)
072
003
(046)
097
CA 253
(184)
48
241
(164)
45
300
(190)
27
-007
(118)
44
023
(152)
25
Females DE 170
(094)
21
139
(103)
21
144
(118)
13
-030
(083)
19
-019
(112)
11
-011
(035)
091
047
(038)
064
CA 160
(135)
20
106
(123)
20
108
(086)
14
-012
(054)
18
-011
(150)
10
Exp = Exposure DE = Diesel Exhaust CA = Clean Air Δ = Change from baseline SD = Standard deviation and SE = Standard Error CRP = C -
reactive protein and IL-6 = Interleukin 6 Signt = Significant = statistically significant at p = 005
= borderline statistically significant at p = 005
Table 34e Mean Log Coagulation Factor Values and Contrast Test Results Baseline 24hr 24hr Δ
Exposure Main
Effect On 24hr Δ
Exposure by Sex
Effect On 24hr Δ
Variables
Sex
Exp
Mean
(SD)
N
Mean
(SD)
N
Mean
(SD)
N
t-Value
(SE)
p-Value
t-Value
(SE)
p-Value
Log
Fibrinogen
(mgdl)
Males DE 549
(023)
57
550
(025)
58
001
(020)
55
008
(004)
094
-067
(007)
050
CA 548
(024)
53
548
(022)
54
002
(020)
49
Females DE 562
(020)
24
561
(020)
22
003
(018)
20
084
(006)
040
CA 564
(021)
22
562
(023)
27
-003
(026)
22
Exp = Exposure DE = Diesel Exhaust CA = Clean Air Δ = Change from baseline SD = Standard deviation and SE =
Standard Error Signt = Significant ple 005 is significant
36 Discussion
The results showed that there was a statistically significant exposuretimesex
three way interaction effect on platelet count after a 1-hour controlled human
environmental exposure to a known concentration of diesel exhaust (300microgm3) This
82
means that for platelets sex was a significant modifier of the effect of diesel exhaust
exposure relative to clean air depending on the time that the platelet sample was
measured
For the other systemic inflammatory and acute phase response markers that were
analyzed no other statistically significant differences in concentration were observed
between males and females These results are similar to results seen in other controlled
exposure studies that have been done (Lucking et al 2008 Carlsten et al 2007 Mills et al
2007 Tornqvist et al 2007 and Mills et al 2005) except that these studies did not examine
sex differences and they also had subjects engaging in some form of exercise during
exposure (Lucking et al 2008 Mills et al 2007 Tornqvist et al 2007 and Mills et al 2005)
Between males and females there was a statistically significant diesel exhaust
attributable difference in platelet count from baseline to 6 hours with females having a
mean higher platelet count than males Platelets are hypothesized to have an early role in
systemic surveillance and information transfer similar to macrophages (Weyrich et al
2009) Activated platelets are rapidly deployed through neutrophils to sites of
inflammation and can modulate inflammatory processes by the secretion of chemokines
which interact with leukocytes causing the secretion of cytokines and other inflammatory
mediators (Weyrich et al 2004 and Semple et al 2010) Therefore the observed significant
difference in platelet counts between males and females could be an indication of a diesel
exhaust induced systemic inflammatory response in females This is somewhat supported
by the fact that within females there was also an observed mean increase in platelet count
at 24 hours after exposure to diesel exhaust relative to clean air although this observation
was not statistically significant While within males there was an observed mean
83
decrease at 6 hours and 24 hours after exposure to diesel exhaust relative to clean air
although only the decrease at 24 hours was statistically significant
Table 35 Difference in Platelet Counts by Exposure and Sex
Sex Exposure 6 hr Δ 24 hr Δ
Males DEΔ ndash CAΔ -915 -773
SE 323 385
Females DEΔ ndash CAΔ 347 261
SE 542 705 Δ = Change from baseline
This observed mean decrease in platelet count within males could be due to the potential
suppressive effect of male hormones on the innate immune inflammatory response to
diesel exhaust exposure thereby causing a reduction in platelet count in an attempt to
hinder any ensuing inflammatory response to the DEPs in diesel exhaust
Another factor that could have contributed to the increase in platelets that was
observed in females is psychological stress which some subjects were exposed to
simultaneously with diesel exhaust This is because psychological stress has been shown
to modify hemostasis and thrombosis by causing a decrease in plasma volume thereby
leading to hemoconcentration (Deepa et al 2001) and an increase in the plasma
concentrations of blood cells like platelets and blood lipids like cholesterol
In contrast to this there is also the possibility that the mean decrease in platelet
count that was observed in males could be due to platelet aggregation in response to
oxidative stress induced injury Since the mechanism by which testosterone inhibits the
immune system is poorly understood and due to the fact that platelet aggregation
oxidative stress and hemoconcentration were not measured in this study there is no way
to directly evaluate either of the three possible alternate explanations for the observations
seen in males and females
84
Regardless the fact that there was a statistically significant mean decrease in
platelet count within males 24 hours after exposure to diesel exhaust relative to clean air
does help to further highlight the possibility that there is an underlying mechanism that
could be protective in males (hormonal suppression of inflammation) or harmful (platelet
aggregation) that needs to be further investigated for clarification
Epidemiological studies (Diez Roux et al 2006 Zeka et al 2006 Peters et al 2001
Samet et al 2000 and Schwartz 2001 ) have linked ambient levels of particulate matter to
adverse cardiovascular outcomes but the mechanisms that govern this link are poorly
understood (Riedl and Diaz Sanchez 2005) There is a general consensus that one
potential mechanism for this link is inflammation
Diesel exhaust is the largest single source of airborne combustion derived
particulate matter in many urban areas (Mills et al 2005 Riedl and Diaz Sanchez 2005)
and so it is one of the most studied environmental pollutants Epidemiological animal
and in-vitro studies that have examined the effects of exposure to diesel exhaust particles
have been able to demonstrate its pro-inflammatory nature via oxidative stress (Tornqvist
et al 2007) but the inflammation process itself is complex and remains incompletely
understood
Based on this for all subjects we expected to see diesel exhaust attributable
changes from baseline that exceeded those seen after exposure to clean air but this was
not observed In some instances there were equivalent or greater clean air attributable
changes than those seen after exposure to diesel exhaust Overall we observed a mixed
response trend in all the outcome variables between the sex groups which is different
85
from what has been observed in other studies where subject responses have often been in
one direction
Since both the diesel exhaust and clean air exposure conditions were monitored
and found to be similar for all subjects and also due to the fact that there was no
significant difference in baseline values between the two sex groups the observed results
could imply the following
that the study exposure was not long or intense enough or
that the observations could be due to the fact that the subjects were
relatively young and healthy or
the possibility of the effect of potential exposure to ambient DEPs to
subjects after the controlled exposures or
that the observations could be due to an interaction effect of one or more
study interventions which included a stress exercise for some subjects a
prolonged fast and repeated blood sampling (Tornqvist et al 2007)
Consequently the results do point to the possible presence of an underlying factor or
factors that needs to be investigated further for clarity
With the exception of platelets even though this study did not find a significant
difference in systemic inflammation and acute phase response markers between males
and females it still warrants further investigation because of the established link between
particulate matter exposure and cardiovascular disease and also due to the pro-
inflammatory nature of diesel exhaust This is because recent studies have emerged to
show inflammation as a strong independent risk indicator for cardiovascular disease
(Kritchevsky et al 2005) so this particulate matter induced inflammation poses a threat to
86
certain vulnerable populations and may increase the likelihood of adverse cardiovascular
outcomes
Also there are gender specific differences in the burden of cardiovascular disease
the prevalence of cardiovascular disease risk factors and the clinical presentation of
cardiovascular disease (Roberts 2005) which all point to a potential sex driven
mechanism that may be modifying the gender related differences that have been
observed For example in the United States cardiovascular disease is the leading cause
of death in adult women and also a leading cause of disability (Bedinghaus et al 2001 and
American Heart Association 2009) The observed increase in platelet concentration
following diesel exhaust exposure relative to clean air is one of the first steps that is
thought to give rise to the ambient air pollution inflammation induced cardiovascular
effects (Brooks et al 2004) that have been observed This observed platelet increase in
females whether in response to diesel exhaust induced systemic inflammation or due to
hemoconcentration both represent a potential risk factor and a potential modification by
sex which needs to be further investigated
361 Study Limitations
Due to issues with blood collection not all subjects had blood samples for all time
points and there was an imbalance in the number of males and females that were
analyzed with a higher ratio of males to females for all the outcome variables that were
analyzed Both of these could potentially have influenced the results that were seen
through the potential increase in variability between the groups (males and females)
being analyzed
87
In addition a potential source of error that was not investigated was the possible
additional exposure of subjects to DEPs and other types of pollution outside of the
exposure chamber during their diverse daily activities This might be a potential critical
confounder as indicated by the mixed response trend that was seen after exposure to
diesel exhaust and especially after exposure to clean air
Lastly since stress is a potential modifier of the response by sex due to the effect
of glucocorticoids on the cell mediated immune response the acute psychological
stressor that was used in this study may have masked any potential sex differences
Consequently further investigation using a larger more balanced study excluding any
additional acute stressors (psychological or physiological) may help to better elucidate
the potential modifying effect of sex on the systemic inflammation and acute phase
response to acute diesel exhaust exposure
37 Conclusions
Using a controlled human environmental exposure to a known concentration of
DE (300microgm3) with the exception of platelet count we observed a mixed response trend
in identified systemic inflammation and acute phase response markers by sex that was not
statistically significant Platelet count was statistically significantly different between
males and females at 6 hours after diesel exhaust exposure relative to clean air with
females having a mean higher platelet count than males There was also a statistically
significant decrease in mean plate count within males at 24 hours after diesel exhaust
exposure relative to clean air The significant sex difference in platelet count at 6 hours
88
indicates that females had a stronger systemic inflammatory response to diesel exhaust
exposure than males relative to clean air
89
Appendix B
Table B1 Systemic Inflammation Markers
Blood Cell Values
Variables Times Measured
Platelet 1 Baseline 2 6hrs Post exposure
3 24hrs Post Exposure WBC RBC
MPV
Variables Times Measured
Neutrophils 1 Baseline
2 6hrs Post exposure
3 24hrs Post Exposure Lymphocytes
Monocytes
Eosinophils
Basophils
Variables Times Measured
Neutrophils 1 Baseline
2 6hrs Post exposure
3 24hrs Post Exposure
Lymphocytes
Monocytes
Eosinophils
Basophils
Variables Times Measured
CRP 1 Baseline
2 6hrs Post exposure 3 24hrs Post Exposure
Il-6
Variables Times Measured
Fibrinogen 1 Baseline
2 24hrs Post Exposure WBC = White Blood Cells and RBC = Red Blood Cells
Units of RBC = 10e6microL
Units of WBC and Cell Blood Count absolute variables 10e3microL Units of percent variables =
Unit of CRP = mgl Unit of IL-6 = pgml and Unit of Fibrinogen = mgdl
Table B2 CRP Mean Values
Sex Exposure Time N Min Max Mean SD
Males DE 1 55 002 750 132 144
6 49 002 669 127 147
24 55 000 626 127 128
CA 1 56 001 847 120 145
6 48 000 999 127 169
24 57 001 530 114 111
Females DE 1 32 001 704 165 193
6 30 001 677 161 186
24 32 001 820 175 210
CA 1 31 001 616 162 148
6 30 001 543 148 135
24 31 001 796 170 185
90
Table B3 IL-6 Mean Values
SEX Exposure Time N Min Max Mean SD
Males DE 1 49 017 52777 5267 11644
6 48 017 50999 5423 12265
24 26 102 53043 8675 14782
CA 1 48 019 52715 5961 12443
6 45 065 52220 5064 11027
24 27 067 52807 8936 14958
Females DE 1 21 080 4337 829 916
6 21 033 1499 600 467
24 13 120 7758 1005 2055
CA 1 20 033 9964 1166 2159
6 20 017 1233 475 385
24 14 059 1094 402 327
Table B4 WBC Mean Values
SEX Exposure Time N Min Max Mean SD
Males
DE 1 WBC 60 370 1000 577 126
6 WBC 60 380 990 661 154
24 WBC 60 290 980 563 153
CA 1 WBC 58 310 940 581 132
6 WBC 55 440 1040 663 149
24 WBC 60 320 830 550 118
Females DE 1 WBC 32 260 930 553 154
6 WBC 33 360 1150 641 179
24 WBC 34 260 810 514 120
CA 1 WBC 35 250 1040 578 162
6 WBC 34 350 1090 652 170
24 WBC 33 280 960 531 135
91
Table B5 Cell Blood Counts Means (Absolute Values) SEX Exposure Time N Min Max Mean SD
Males DE 1 Neutrophils 60 1410 6230 332848 94811
6 Neutrophils 60 1733 7108 390300 121108
24 Neutrophils 60 1505 7614 324340 116424
CA 1 Neutrophils 59 1081 6420 333627 105980
6 Neutrophils 56 1989 6753 390350 121943
24 Neutrophils 60 1284 5312 314038 87644
Females DE 1 Neutrophils 32 1427 6408 319672 112304
6 Neutrophils 33 1698 7613 371600 144311
24 Neutrophils 34 1161 5190 293218 95793
CA 1 Neutrophils 35 1263 7363 345626 137562
6 Neutrophils 35 1425 7281 367751 144616
24 Neutrophils 33 1627 6739 301861 111583
Males DE 1 Lymphocytes 60 761 2643 180962 40484
6 Lymphocytes 60 975 3258 200280 50966
24 Lymphocytes 60 765 3420 177748 48015
CA 1 Lymphocytes 59 1240 2647 178181 33298
6 Lymphocytes 56 1334 3115 196938 42931
24 Lymphocytes 60 838 2770 176558 41664
Females DE 1 Lymphocytes 32 892 3054 180938 56817
6 Lymphocytes 33 1001 3396 208142 60855
24 Lymphocytes 34 924 2643 171659 49895
CA 1 Lymphocytes 35 973 3191 177740 51295
6 Lymphocytes 35 1139 3394 214223 54878
24 Lymphocytes 33 885 2950 178233 51878
Males DE 1 Monocytes 60 176 860 44250 13636
6 Monocytes 60 279 833 51640 13379
24 Monocytes 60 184 892 43207 14141
CA 1 Monocytes 59 232 979 46215 14940
6 Monocytes 56 285 878 51439 12093
24 Monocytes 60 188 730 41703 12834
Females DE 1 Monocytes 32 165 559 36766 94371
6 Monocytes 33 234 733 44388 12879
24 Monocytes 34 188 558 34756 9783
CA 1 Monocytes 35 170 771 39026 11231
6 Monocytes 35 233 796 46620 13348
24 Monocytes 33 190 608 36273 9564
Males DE 1 Eosinophils 60 19 618 16592 11711
6 Eosinophils 60 14 583 15988 11597
24 Eosinophils 60 11 644 15108 11400
CA 1 Eosinophils 59 31 630 18003 13176
6 Eosinophils 56 8 624 16923 13129
24 Eosinophils 60 17 592 15622 12086
Females DE 1 Eosinophils 32 14 524 13341 10977
6 Eosinophils 33 14 542 13455 12407
24 Eosinophils 34 16 400 12021 9287
CA 1 Eosinophils 35 17 464 13403 10116
6 Eosinophils 35 17 661 13903 13758
24 Eosinophils 33 17 363 11730 86858
Males DE 1 Basophils 60 5 61 2380 1072
6 Basophils 60 9 72 2958 1421
24 Basophils 60 0 70 2282 1168
CA 1 Basophils 59 6 59 2290 1079
6 Basophils 56 13 64 3125 1226
24 Basophils 60 8 89 2453 1279
Females DE 1 Basophils 32 5 47 2416 1088
6 Basophils 33 12 55 3052 1018
24 Basophils 34 0 53 2182 1114
CA 1 Basophils 35 6 64 2511 1308
6 Basophils 35 0 90 3537 1702
24 Basophils 33 8 108 2809 1866
92
Table B6 Cell Blood Counts (Percent Values) SEX Exposure Time N Min Max Mean SD
Males DE 1 Neutrophils 60 3810 7310 5707 729
6 Neutrophils 60 4550 7290 5836 735
24 Neutrophils 60 4180 8100 5683 793
CA 1 Neutrophils 58 3180 7120 5669 750
6 Neutrophils 55 4270 7340 5852 747
24 Neutrophils 60 3470 7570 5665 755
Females DE 1 Neutrophils 32 4380 7380 5704 819
6 Neutrophils 33 3790 7950 5682 991
24 Neutrophils 34 3500 7300 5632 935
CA 1 Neutrophils 35 4050 7570 5829 982
6 Neutrophils 34 4020 7610 5564 974
24 Neutrophils 33 3910 7360 5595 891
Males DE 1 Lymphocytes 60 1410 5500 3198 703
6 Lymphocytes 60 1650 4750 3087 686
24 Lymphocytes 60 1500 5240 3238 753
CA 1 Lymphocytes 58 1580 5150 3176 645
6 Lymphocytes 55 1760 4640 3054 639
24 Lymphocytes 60 1710 5350 3256 677
Females DE 1 Lymphocytes 32 1830 4870 3331 798
6 Lymphocytes 33 1450 5460 3346 870
24 Lymphocytes 34 2020 5530 3402 875
CA 1 Lymphocytes 35 1670 5070 3194 882
6 Lymphocytes 34 1690 5050 3415 860
24 Lymphocytes 33 2010 5250 3429 859
Males DE 1 Monocytes 60 380 1160 771 185
6 Monocytes 60 400 1240 793 157
24 Monocytes 60 350 1240 775 166
CA 1 Monocytes 58 390 1530 810 221
6 Monocytes 55 440 1240 796 169
24 Monocytes 60 470 1270 758 164
Females DE 1 Monocytes 32 450 900 681 137
6 Monocytes 33 45 106 709 167
24 Monocytes 34 36 91 690 169
CA 1 Monocytes 35 35 164 699 211
6 Monocytes 34 40 171 744 242
24 Monocytes 33 46 156 704 202
Males DE 1 Eosinophils 60 3 95 283 176
6 Eosinophils 60 3 81 238 157
24 Eosinophils 60 3 99 263 174
CA 1 Eosinophils 58 8 107 304 211
6 Eosinophils 55 1 99 250 186
24 Eosinophils 60 4 101 276 191
Females DE 1 Eosinophils 32 3 84 239 179
6 Eosinophils 33 2 95 214 205
24 Eosinophils 34 3 75 232 166
CA 1 Eosinophils 35 3 83 235 176
6 Eosinophils 34 3 112 221 233
24 Eosinophils 33 4 74 219 154
Males DE 1 Basophils 60 1 9 041 016
6 Basophils 60 1 13 046 021
24 Basophils 60 0 14 042 021
CA 1 Basophils 58 1 10 041 019
6 Basophils 55 2 10 048 017
24 Basophils 60 2 11 045 019
Females DE 1 Basophils 32 1 10 044 019
6 Basophils 33 2 10 050 019
24 Basophils 34 0 9 044 019
CA 1 Basophils 35 1 8 043 017
6 Basophils 34 0 17 056 031
24 Basophils 33 2 19 053 033
93
Table B7 Fibrinogen Mean Values
SEX Exposure Time N Min Max Mean SD
Males DE 1 Fibrinogen 57 14860 42840 24841 5842
24 Fibrinogen 58 15570 50600 25381 7090
CA 1 Fibrinogen 53 12060 37910 24523 5491
24 Fibrinogen 54 13450 45020 24555 5549
Females DE 1 Fibrinogen 24 18250 43250 28010 5666
24 Fibrinogen 22 19810 43870 27846 5825
CA 1 Fibrinogen 22 22220 45170 28776 6754
24 Fibrinogen 27 15450 44470 28265 6321
Table B8 Mean Platelet Counts (x10e3microl)
SEX Exposure Time N Min Max Mean SD
Males DE 1 60 151 399 25053 55610
6 60 164 421 26458 56046
24 60 163 376 25417 54061
CA 1 59 171 362 24636 51001
6 56 174 382 26693 53311
24 60 174 387 25707 52106
Females DE 1 32 152 358 25066 58975
6 33 181 364 26791 56363
24 34 152 370 25947 59703
CA 1 35 167 381 26329 56414
6 35 181 363 27689 53421
24 33 169 373 27576 58314
DE = Diesel Exhaust CA = Clean Air SD = Standard deviation
Graph B1 Mean Platelet Count by Sex
94
References
American Heart Association 2010 Women and Cardiovascular Disease ndash Statistics
httpwwwamericanheartorgdownloadableheart1260905040318FS10WM10pdf
Becklake MR and Kauffmann F 1999 Gender differences in airway behavior over
the human life span Thorax 54 pg 1119-1138
Bedinghaus J Leshan L and Diehr S 2001 CoronaryArtery Disease Prevention Whatlsquos
Different for Women American Family Physician 63 pg 1393 ndash 1400
Brook RD Franklin B Cascio W Hong Y Howard G Lipsett M Luepker R
Mittleman M Samet J Smith SC Tager I 2004 Air Pollution and Cardiovascular
Disease A Statement for Healthcare Professionals From the Expert Panel on
Population and Prevention Science of the American Heart Association Circulation
109 pg 2655 ndash 2671
Carlsten C Kaufman JD Peretz A Trenga CA Sheppard L and Sullivan JH
2007 Coagulation Markers in Healthy Human Subjects Exposed to Diesel Exhaust
Thrombosis Research 120 pg 849-855
Christian MS 2001 IntroductionOverview Gender-Based Differences in
Pharmacologic and Toxicologic Responses International Journal of Toxicology 20
pg 145-148
Czerniak R Gender-Based Differences in Pharmacokinetics in Laboratory Animal
Models 2001 International Journal of Toxicology 20 pg 161-163
Da Silva JA 1995 Sex Hormones Glucocorticoids and Autoimmunity facts and
hypotheses Annals of the Rheumatic Disease 54 pg 6-16
Diaz-Sanchez D and Riedl M 2005 Diesel effects on human health a question of
stress American Journal of Physiology ndash Lung Cellular and Molecular Physiology
289 pg L722-L723
Deepa R Pradeep R and Mohan V 2001 Role of Psychological stress in Cardiovascular
Disease International Journal of Diabetes in Developing Countries 21 pg 121 ndash 123
Diaz-Sanchez D Tsien A Casillas A Dotson AR and Saxon A 1996 Enhanced
nasal cytokine production in human beings after in vivo challenge with diesel exhaust
particles Journal of Allergy and Clinical Immunology 98 pg114-123
Diez Roux AV Auchincloss AH Astor B Barr RG Cushman M Dvonch T
Jacobs Jr DR Kaufman J Lin X and Samson P 2006 Recent Exposure to
Particulate Matter and C-reactive Protein Concentration in the Multi-Ethnic Study of
Atherosclerosis American Journal of Epidemiology 164 pg 437-448
95
Donaldson K Stone V Seaton A and MacNee W 2001 Ambient Particle Inhalation
and the Cardiovascular System Potential Mechanisms Environmental Health
Perspectives 109(supplement 4) pg 523-527
Ersntgard L Sjogren B Warholm M and Johanson G 2003 Sex differences in
toxicokinetics of inhaled solvent vapors in humans 1 m-Xylene Toxicology and
Applied Pharmacology 193 pg 147-157
Fairweather D and Rose NR 2004 Women and Autoimmune Disease Emerging
Infectious Disease [Serial on the internet] 2004 November Available from
httpwwwcdcgovncidodEIDvol10no1104-0367htm
Faustman E and Omenn G Risk Assessment in Klaassen CD (eds) Casarett and
Doulllsquos Toxicology The Basic Science of Poisons 6th
ed New York Macmillan
2001 pg 83-104
Fortoul TI Moncada-Henandez S Saldivar-Osorio L Espejel-Maya G Mussali-
Galante P Avila-Casado MC Colin-Barenque L Hernandez-Serrato MI and
Avila-Costa MR 2005 Sex differences in bronchiolar epithelium response after the
inhalation of lead acetate (Pb) Toxicology 207 pg 323-330
Frumkin H and Thun MJ 2001 Diesel Exhaust Environmental Carcinogens 51 pg
193-198
Furuyama A Hirano S Koike E and Kobayashi T 2006 Induction of oxidative
stress and inhibition of plasminogen activator inhibitor-1 production in endothelial
cells following exposure to organic extracts of diesel exhaust particles and urban fine
particles Archives of Toxicology 80 pg 154-162
Gabay C and Kushner J 1999 Acute phase proteins and other systemic responses to
inflammation New England Journal of Medicine 340 pg 448ndash54
Gochfeld M 2007 Framework for gender differences in human and animal
toxicology Environmental Research 104 pg 4-21
Kritchevsky S Cesari M and Pahor M 2005 Inflammatory markers and
cardiovascular health in older adults Cardiovascular Research 66 pg 265ndash 275
Lamason R Zhao P Rawat R Davis A Hall JC Chae JJ Agarwal R Cohen
P Rosen A Hoffman EP and Nagaraju K 2006 Sexual dimorphism in immune
response genes as a function of puberty BMC Immunology 7 pg 2
Liang KY and Zeger LL 1986 Longitudinal Data Analysis Using Generalized Linear
Models Biometrika 73 pg 13 ndash 22
Lucking AJ Lundback M Mills NL Faratian D Barath SL Pourazar J Cassee
96
FR Donaldson K Boon NA Badimon JJ Sandstrom T Blomberg A and
Newby DE 2008 Diesel Exhaust Inhalation Increases Thrombus Formation In Man
European Heart Journal 29 pg 3043-3051
Messing K and Stellman JM 2006 Sex gender and womenlsquos occupational health
The importance of considering mechanism Environmental Research 101 pg 149-
162
Mills NL Tornqvist H Robinson SD Gonzalez M Darnley K MacNee W
Boon NA Donaldson K Blomberg A Sandstrom T and Newby DE 2005 Diesel
Exhaust Inhalation Causes Vascular Dysfunction and Impaired Endogenous
Fibrinolysis American Heart Association 112 pg 3930-3936
Mills NL Tornqvist H Gonzalez MC Vink E Robinson SD Soderberg S
Boon NA Donaldson K Sandstrom T Blomberg A and Newby DE 2007
Ischemic and Thrombotic Effects of Dilute Diesel-Exhaust Inhalation in Men with
Coronary Heart Disease The New England Journal of Medicine 357 pg 1075-1082
Nightingale JA Maggs R Cullinan Donnelly LE Rodgers DF Kinnersley R
Chung KF Barnes PJ Ashmore M and Newman-Taylor A 2000 Airway
Inflammation after Controlled Exposure to Diesel Exhaust Particles American
Journal of Respiratory and Critical Care Medicine 162 pg 161-166
Nordenhall C Pourazar J Blomberg A Levin J-O Sandstrom T and Adelroth E
2000 Airway inflammation following exposure to diesel exhaust a study of time
kinetics using induced sputum European Respiratory Journal 15 pg 1046-1051
Peters A Frouml hlich M Douml ring A Immervoll T Wichmann HE Hutchinson
WL Pepys MB and Koenig W 2001 Particulate Air Pollution is Associated with
an Acute Phase Response in Men Results from the MONICAndashAugsburg Study
European Heart Journal 22 pg 1198ndash1204
Pourazar J Mudway IS Samet JM Helleday R Blomberg A Wilson S Frew
AJ Kelly FJ and Sandstrom T 2005 Diesle Exhaust activates redox-sensitive
transcription factors and kinases in human airways American Journal of Physiology ndash
Lung Cellular and Molecular Physiology 289 pg L724-L730
Riedl M and Diaz-Sanchez D 2005 Biology of diesel exhaust effects on respiratory
function Journal of Allergy and Clinical Immunology 115 pg 221-8
Robert B Gender-Specific Aspects of Cardiovascular Disease 2005 Womenlsquos Heart
Foundation RI Medicine and Health Article
Rogers A and Davies B 2005 Diesel Particles ndash Recent Progress on an Old Issue
Annals of Occupational Hygiene 49 pg 453-456
97
Salvi S Blomberg A Rudell B Kelly F Sandstrom T Holgate ST and Frew A
1999 Acute Inflammatory Responses in the Airway and Peripheral Blood After
Short-Term Exposure to Diesel Exhaust in Healthy Human Volunteers American
Journal of Respiratory and Critical Care Medicine 159 pg 702-709
Salvi S and Holgate ST 1999 Mechanisms of particulate matter toxicity Clinical
and Experimental Allergy 29 pg 1187-1194
Salvi S Nordenhall C Blomberg A Rudell B Pourazar J Kelly F Wilson S
Sandstrom T Holgate ST and Frew A 2000 Acute Exposure to Diesel Exhaust
increase IL-8 and GRO-α Production in Healthy Human Airways American Journal
of Respiratory and Critical Care Medicine 161 pg 550-557
Samet JM Dominici F Curriero FC Coursac I and Zeger SL 2000 Fine
Particulate Air Pollution and Mortality in 20 US Cities 1987-1994 The New
England Journal of Medicine 343 pg 1742-1749
Saxton A and Diaz-Sanchez D 2000 Diesel exhaust as a model xenobiotic in
allergic inflammation Immunophamacology 48 pg 325-327
Schwartz J 2001 Air Pollution and Blood Markers of Cardiovascular Risk
Environmental Health Perspectives 109(supplement 3) pg 405ndash409
Semple JW and Freedman J 2010 Platelets and innate immunity Cellular and
Molecular Life Sciences 67 pg 499ndash511
Sydbom A Bomberg A Parnia S Stenfors N Sandstrom T and Dah en SE 2001
Health Effects of Diesel Exhaust Emissions European Respiratory Journal 17 pg
733-746
Tornqvist H Mills NL Gonzalez M Miller MR Robinson SD Megson IL
MacNee W Donaldson K Soderberg S Newby DE Sandstrom T and Blomberg
A 2007 Persistent endothelial dysfunction following diesel exhaust inhalation in
man American Journal of Respiratory and Critical Care Medicine 176 pg 395-400
US EPA 2002 Health assessment document for diesel engine exhaust US
Environmental Protection Agency Document EPA6008-90057F
Vahter M Gochfeld M Casati B Thiruchelvam M Falk-Filippson A Kavlock R
Marafante E and Cory-Slechta D 2007 Implications of gender differences for
human health risk assessment and toxicology Environmental research 104 pg 70-84
Van Eeden SF Tan WC Suwa T Mukae H Terashima T Fujii T Qui D
Vincent R and Hogg JC 2001 Cytokines Involved in Systemic Inflammatory
Response Induced by Exposure to Particulate Matter Air Pollutants (PM10) American
Journal of Respiratory and Critical Care Medicine 164 pg 826-830
98
Weyrich AS and Zimmerman GA 2004 Platelets signaling cells in the immune
continuum Trends in Immunology 25 pg 489 ndash 495
Zeka A Sullivan JR Vokonas PS Sparrow D Schwartz J 2006 Inflammatory
Markers and Particulate Air Pollution characterizing the pathway to disease
International Journal of Epidemiology 35 pg 1347ndash1354
99
Chapter 4
Analysis of Sex Differences in Self Reported Symptoms after
Acute Exposure to Diesel Exhaust
100
41 Abstract
42 Introduction
421 Symptoms of Diesel Exhaust Exposure
422 Sex Gender and Symptoms
423 Sex and Respiratory Related Symptoms
43 Materials and Methods
431 Data Collection
432 Exposure Conditions and Experimental Design
433 Subject Selection and Demographic Data
434 Symptom Questionnaire
435 Questionnaire Administration Protocol
44 Statistical Methods
441 Calculation of Response Measures
45 Results
46 Discussion
461 Study Limitations
47 Conclusions
Appendix C
References
101
41 Abstract
Background Inhalation of diesel exhaust has been associated with range of
health effects from eye irritation to cardiovascular effects Sex differences have
been observed in self reported somatic symptoms after exposure to an injurious
substance
Aims To evaluate possible sex differences in self reported health symptoms after
acute exposure to diesel exhaust in a controlled environmental facility
Method In a crossover design study healthy subjects were exposed to 300microgm3
of diesel exhaust and clean air in random order for 1 hour each in a controlled
environmental exposure chamber on two different days (ge1 week washout)
Subjects completed eight symptom questionnaires during the study session which
were analyzed using a generalized linear equation model
Results There were statistically significant diesel exhaust induced sex
differences in somatic (p = 00501) and lower respiratory (p lt00001) symptoms
with females primarily having higher mean symptom severity ratings than males
Conclusion In healthy volunteers acute exposure to 300microgm3 of diesel exhaust
for an hour in a controlled environmental study resulted in females having
statistically significantly higher self reported somatic and lower respiratory
symptom severity ratings than males relative to clean air exposure This indicates
that females may be more sensitive to the effects of diesel exhaust exposure than
males
42 Introduction
Diesel exhaust is produced from the combustion of diesel fuel Due to the superior
performance characteristics of the diesel engine it has been widely used to power
vehicles and other machineries (USEPA HAD 2002) Compared to gasoline engines
diesel exhaust engines emit more particulate matter per mile driven (Tox Probe) This
along with its wide use has made diesel exhaust a significant contributor to ambient air
pollution and the largest single source of airborne particulate matter (PM) in many urban
areas (Riedl and Diaz-Sanchez 2005)
Due to the ubiquitous nature of diesel exhaust and the potential for the high
exposure of certain populations like workers using diesel-powered machinery and people
who live close to diesel traffic diesel exhaust has been one of the most studied
102
environmental pollutants in an attempt to determine its toxicological effects in humans
and rodents Inhalation of diesel exhaust is the primary route of exposure therefore
experimental studies have often been done to examine the association between diesel
exhaust exposure and respiratory and cardiovascular effects The measures that have been
used to assess these effects include cell changes (in-vivo and in-vitro) biomarkers
physiological changes and self reported symptoms following diesel exhaust exposure
421 Symptoms of Diesel Exhaust Exposure
Epidemiological and clinical studies that have been done to date have shown that
there are a range of symptoms that can occur after exposure to diesel exhaust via
inhalation Depending on the concentration of the exposure acute exposure to diesel
exhaust has been shown to cause the following symptoms and effects acute irritation
(eg eye nose throat bronchial) neurophysiological symptoms (eg lightheadedness
nausea) respiratory symptoms (cough phlegm) there is also evidence for an
immunologic effect (the exacerbation of allergenic responses to known allergens and
asthma-like symptoms) and cardiovascular effects (USEPA HAD 2002 Donaldson et al
2001)
Following inhalation of diesel exhaust not everyone will report the same types
frequency and severity of symptoms This is because there are many determinants that
affect the type frequency and severity of self reported symptoms following the inhalation
of a harmful substance like diesel exhaust A broad definition of a symptom can be gotten
from Gijsberlsquos model of physical symptom perception where a symptom is defined as ―an
aversely perceived internal state (Gijsbers et al 1997) By adapting this model to self
103
reported symptoms following an inhalation exposure and incorporating Becklake and
Kauffmans (1999) definition of determinants of airway behavior within this modified
model a determinant of a self reported symptom can be seen as anything that causes or
does not cause a change in the occurrence and perception of a symptom and anything
that may increase or decrease the risk of perceiving the symptom This definition
encompasses a ―biopsychosocial (Gijsbers et al 1997) explanation of the factors that
contribute to the types frequency and severity of self reported symptoms following the
exposure to an inhaled air pollutant like diesel exhaust A key assumption of this model is
that a self reported symptom is ―the outcome of a perceptual process (Gijsbers et al
1997) Two individual factors where the biological psychological and environmental
aspects of self reported symptom perception intercept are sex and gender
422 Sex Gender and Symptoms
In public health terms sex can be thought to determine genetically based
sensitivity to health determinants and gender can be thought to express some social forces
that can influence exposure and responses to health determinants (Messing and Stellman
2006) The effects of sex and gender on the adverse health effects following the exposure
to a harmful substance or stimuli often complement each other Gender often has a big
influence on the context types and levels of the substance that males and females get
exposed to especially in the occupational setting and sex often has a big effect on how
males and females absorb distribute metabolize and excrete the xenobiotic once the
exposure has taken place (Arbuckle 2006 and Dimich-Wald et al 2006) Thus it is easy to
104
see how these two factors (sex and gender) are involved in the proposed biopsychosocial
model of self reported symptoms and where they intersect with each other (figure 1)
It follows therefore that determinants of self reported symptoms related to exposures can
be broadly grouped into biological determinants implicit in the word sex and
sociocultural determinants implicit in the word gender (Becklake and Kauffmann 1999)
Figure 41 Intersetion of Sex and Gender and Self Reported Symptom Determinants
This is especially so because sex differences with respect to symptoms are
thought to involve differences in neuroanatomical neurophysiological and
neurobiological pathways that are activated upon exposure to an injurious substance and
which produce differences in the perception processing and modulation of the resulting
symptoms (Barsky et al 2001) In contrast to that gender related differences in symptom
perception and sensitivity (Dimich et al 2006 and Barsky et al 2001) especially with
regards to somatic symptoms are thought to involve innate differences in somatic and
visceral perceptions differences in the socializing process and differences in symptom
labeling description and reporting (Barsky et al 2001) Thus males and females often
differ in the types frequency and severity of self reported symptoms with females having
been shown to report ―more intense more numerous and more frequent bodily symptoms
than men (Barsky et al 2001 and Kroenke et al 1990)
Environmental
Biological Psychological
Sex and
Gender
105
This observed gender difference with regards to somatic symptoms is one that has
been well established and is independent of the symptom measure response format the
time frame used and the population being studied in females (Gijsbers et al 1997)
Looking at the proposed biological and social factors that are thought to contribute to
both sex and gender differences (Table 1) in relation to reported somatic symptoms and
presentations it becomes obvious that it can be difficult to distinguish between the effects
of sex and gender as they often work together or modulate one another in the perception
and presentation of self reported symptoms
Table 41 Proposed Determinants of Self Reported Symptoms Determinants Examples
Biological Physiological
1 Dimensional ndash there are differences in airway dimensions relative to lung size eg women exhibit on average a higher flow rate in relation to lung size than men
2 Immunological ndash there are differences in total serum IgE levels
3 Hormonal ndash Sex hormones influence many aspects of airway behavior eg female airways are responsive to their sex hormones and cyclical fluctuations
4 Sensitivity ndash Laboratory and field studies have shown that women are more
sensitive to external environmental cues (including stress) and men to internal physiological stimuli in noticing defining and reacting to physical symptoms
Psychosocial and Environmental
1 Some psychosocial factors which are more prevalent in women are strongly associated with symptom reporting particularly depressive and anxiety disorders
as well as a history of sexual or physical abuse
2 Other psychosocial antecedents that have been hypothesized include cultural factors permitting less stoicism and greater expressiveness among women
amplification of somatic symptoms a lower threshold for seeking health care and
gender differences in social roles and responsibilities
Sources Barsky et al 2001 Kroenke et al 1990 and Becklake and Kauffmann 1999
423 Sex and Respiratory Related Symptoms
Overall there has been increasing evidence of the interaction of biological factors
with socio-environmental factors in the perception reporting and interpretation of
respiratory symptoms related to airway disease (Becklake and Kauffmann 1999) When
looking at self reported symptoms in relation to an inhaled air pollutant like diesel
exhaust one is usually interested in assessing both primary (eg cough and irritation of
the nose) and secondary (eg fatigue and body pain) respiratory related symptoms and
morbidity With regards to respiratory morbidity comparatively little attention has been
106
given in the scientific literature to the potential effect of sex and there is a tendency to
control for sex instead of examining sex based influences on health (Dimich-Wald et al
2006)
In 2006 Dimich-Ward et al looked at gender differences in respiratory morbidity
based on surveys of food service workers radiographers and respiratory therapists and
they found that across occupations women consistently had a greater respiratory
morbidity for symptoms associated with shortness of breath while men usually had a
higher prevalence of phlegm complaints
Ernstgard et al in 2002 examined differences between men and women in acute
health effects after a controlled chamber exposure to 2-propanol and m-xylene vapors
Within the self reported symptoms they found that the rating for throat or airway
discomfort increased more in women during exposure to 2-propanol or m-xylene and that
the rating for fatigue was more increased in men after a one hour exposure to 2-propanol
but more increased in women after a two hour exposure to 2-propanol (Ernstgard et al
2002)
This then raises the question of whether the observations of the studies above as
well as the sex differences observed in relation to somatic symptom reporting could be
present in self reported symptoms following diesel exhaust exposure and whether this
trend extends beyond somatic symptoms to other respiratory symptoms Therefore the
purpose of this study is to investigate whether there are sex differences in the self
reported symptoms of males and females after acute exposure to diesel exhaust
107
43 Materials and Methods
431 Data Collection
The data that were used for this study are part of the datasets generated from a
previous study of diesel exhaust effects The study was funded by the Department of
Defense (DOD) through a grant to the University of Medicine and Dentistry of New
Jersey (UMDNJ) (Grant DAMD17-03-1-0537 Principal Investigator Dr Nancy
Fiedler)
432 Exposure Conditions and Experimental Design
A crossover design was used in which each subject underwent two exposure
conditions on two separate days in random order one was to a diluted diesel exhaust
normalized to PM10 concentration of 300microgm3 and the other was to filtered clean
ambient air of Busch campus in Piscataway a suburban campus of Rutgers University
Both exposure conditions were 1 hour in duration and took place at the Environmental
and Occupational Health Sciences Instituteslsquo (EOHSI) Controlled Environmental Facility
(CEF) Each exposure condition was presented with and without an acute psychological
stressor to two groups of subjects high and low in self reported chemical intolerance (CI)
Subjects were also asked to fast overnight the day before the study until after each
exposure session and to also abstain from any exercise
There were no significant differences in the exposure conditions for all subjects
Overall the concentration of PM10 that the subjects were exposed to was 276plusmn13microgm3
which was close to the target concentration of 300microgm3
108
Table 42 Mean Air Characteristics and Composition Diesel Exhaust Clean Air
PM10 (microgm3) 276 plusmn 13 6 plusmn 5 NOX (ppm) 363 plusmn 090 002 plusmn 002
CO (ppm) 379 plusmn 076 091 plusmn 021
1 Nitropyrene (ngm3) 268 plusmn 051 lt006
433 Subject Selections and Demographic Data
110 healthy non-smoking men and women between the ages of 18 and 50 were
recruited from the local community in Piscataway New Jersey based on the established
study criteria 100 subjects completed the study
As mentioned previously some subjects were simultaneously exposed to a
psychological stressor and to diesel exhaust Due to the fact that we were analyzing self
reported symptoms which have the potential to be heavily influenced by psychological
stress therefore all subjects who were also exposed to the psychological stressor were
excluded from the analysis leaving 49 subjects
Table 43 Demographic Information and Baseline Subject Characteristics Females N = 22 Males N = 27
Min Max Mean SD Min Max Mean SD
AGE (years) 19 43 2409 567 18 34 2311 357
Education (Years) 12 22 1564 235 12 20 1591 226
Pulse M 50 94 7018 1081 56 86 6915 786
Respiration M 14 20 1636 201 10 20 1538 210
Temperature oF M 96 99 9820 065 96 99 9809 079
Height (inches) 60 73 6405 269 65 75 6906 267
Weight(lb) 104 200 13450 2579 136 236 17300 2506
Race Frequency () Frequency ()
Asian Pacific Islander 9 (4091) 10 (3704)
Black not Hispanic 1 (455) 4 (1481)
Hispanic or Latino 4 (1818) 6 (2222)
OtherUnknown 1 (455) 0 (0)
White not Hispanic 7 (3181) 7 (2593)
M = Some subjects had missing data For Pulse and Respiration N = 26 for Males For Temperature N = 19 for Females
and N = 25 for Males Education Calculated as High school (12 years) + Years of college or other
109
434 Symptom Questionnaire
A symptom questionnaire that consisted of 37 symptom questions that could be
grouped into the following symptom clusters 1) somatic 2) eye irritation 3) anxiety 4)
lower respiratory 5) upper respiratory 6) central nervous system (CNS) 7) acute phase
reaction (APR) and 8) no load (general symptoms) was used (see table 3 for a list of
individual symptoms)
Figure 42 Labeled Magnitude Scale
Source Green et al 1996 (Reproduced with permission from Chemical Senses)
These clusters were chosen because they represent categories of symptoms that
have been directly associated with either upstream responses to diesel exhaust exposure
such as upper and lower respiratory symptoms or which are thought to be an indirect
110
representation of downstream systemic changes in response to diesel exhaust exposure
such as acute phase reaction symptoms which reflect the presence and intensity of
systemic inflammation (Gabay et al 1999)
The symptoms were rated using a labeled magnitude scale that was developed by
Green et al (1996) and which ranged from 0 (barely detectable) to 100 (strongest
imaginable) (see Figure 2)
435 Questionnaire Administration Protocol
The questionnaire was administered at eight times before during and after the
experimental exposure to diesel exhaust and clean air (see figure 3)
Exposure
S1 S2 S3 S4 S5 S6 S7 S8
Baseline asymp25 min asymp10 min asymp40 min asymp55 min asymp10 min asymp6 hrs asymp24 hrs Pre- After After After After After After
Exposure Exposure Exposure Exposure Exposure Exposure Exposure
Start Start Start End End End
Figure 43 Questionnaire Study Protocol S = Symptom questionnaire
44 Statistical Methods
Descriptive statistical analysis histograms and box plots were used to evaluate the
distribution of all the variables and to check for outliers Based on the fact that the data
were right skewed a Poisson distribution was used in the final analysis
111
441 Calculation of Response Measures
The individual severity ratings for the 37 symptoms were added together within
the previously mentioned eight categories (see table 4) to give eight total summary
symptom severity response measures
Table 44 Description of Symptom Categories and The Creation of the Summary Severity Scores
Symptom Categories
Individual Symptoms
Range of Total
Summary Score
Somatic = Skin irritation + Ear ringing + Leg cramp +
Perspiration + Leg tingling + Back pain
0 - 600
Eye Irritation = Eye Irritation + Running Eyes 0 ndash 300
Anxiety = Jittery + Nervous + Palpitation + Tense + Worried 0 ndash 500
Lower Respiratory = Shortness of breath + Chest pain + Wheezing + Chest
tightness + Coughing + pain upon deep inspiration
0 ndash 800
Upper Respiratory = Nasal congestion + Sneezing + Choking + Throat
irritation + Nose irritation
0 ndash 500
Central Nervous System = Disoriented + Dizzy + Headache + Light headed 0 ndash 400
Acute Phase Reaction = Fatigue + Drowsy + Concentration + Nausea + Body
temperature + Body ache + Stomach ache
0 ndash 700
0 ndash 200 No Load = Bad taste + Facial temperature
To address the aim of the paper a Poisson regression using a generalized linear
model with repeated analysis and contrast was done to see if there was a significant three
way interaction between exposure (diesel exhaust and clean air) sampling time (Time 1
to Time 8) and sex (males and females) The final model contained sex as a between
subjects variable exposure and time as within subjects variables with the eight symptom
outcome variables as the dependent variables The exposuretimesexlsquo three way
interaction was examined to assess the hypothesis of interest
112
Table 45a Mean Total Symptom Severity Ratings by Category and the Time Reported T1 T2 T3 T4 T5 T6 T7 T8
Sex
Exp
Mean
(SD)
N
Mean
SD
N
Mean
SD
N
Mean
SD
N
Mean
SD
N
Mean
SD
N
Mean
SD
N
Mean
SD
N
Somatic Males DE 056
(160) 27
259
(801) 27
167
(416) 27
296
(763) 27
148
(496) 27
111
(406) 27
056
(212) 27
074
(267) 27
CA 167
(605) 27
093
(242) 27
241
(526) 27
385
(697) 26
389
(670) 27
241
(578) 27
058
(216) 26
074
(267) 27
Females DE 091
(251) 22
182
(395) 22
295
(630) 22
455
(987) 22
773
(1369) 22
273
(481) 22
182
(424) 22
227
(592) 22
CA 364
(693)
22
159
(358)
22
364
(727)
22
250
(572)
22
205
(527)
22
114
(343)
22
250
(798)
22
318
(749)
22
Eye
Irritation
Males DE 204
(542) 27
241
(641) 27
667
(1932) 27
463
(796) 27
444
(594) 27
130
(407) 27
019
(096) 27
000
(000) 26
CA 278
(684) 27
241
(870) 27
481
(1535) 27
212
(619) 26
148
(677) 27
019
(096) 27
019
(098) 26
148
(477) 27
Females DE 091
(251) 22
114
(264) 22
477
(957) 22
659
(1106) 22
500
(1080) 22
114
(306) 22
045
(147) 22
068
(234) 22
CA 068
(176) 22
136
(539) 22
262
(983) 21
167
(658) 21
227
(960) 22
045
(147) 22
114
(343) 22
091
(332) 22
Anxiety Males DE 407
(878)
27
426
(1291)
27
444
(684)
27
907
(3369)
27
537
(1386)
27
352
(1277)
27
074
(301)
27
074
(301)
27
CA 333
(650) 27
444
(984) 27
241
(447) 27
173
(423) 26
167
(367) 27
093
(393) 27
038
(196) 26
148
(770) 27
Females DE 227
(481) 22
364
(516) 22
614
(1243) 22
750
(1193) 22
886
(1654) 22
182
(451) 22
000
(000) 22
000
(000) 22
CA 773
(948) 22
523
(852) 22
524
(1279) 21
476
(782) 21
273
(551) 22
068
(234) 22
159
(473) 22
159
(543) 22
Lower
Respiratory
Males DE 074
(301)
27
111
(424)
27
315
(786)
27
611
(1188)
27
315
(942)
27
056
(212)
27
130
(328)
27
019
(098)
26
CA 148
(362)
27
148
(304)
27
148
(434)
27
212
(404)
26
111
(253)
27
019
(096)
27
077
(306)
26
019
(096)
27
Females DE 023
(107)
22
114
(343)
22
364
(710)
22
455
(999)
22
705
(1377)
22
068
(320)
22
091
(294)
22
091
(294)
22
CA 227
(767) 22
277
(752) 22
068
(320) 22
159
(473) 22
205
(667) 22
023
(107) 22
386
(1388) 22
136
(441) 22
T1 = Symptom severity reported at the start of the study session
T2 = Symptom severity reported at asymp25 min after the start of the study session
T3 = Symptom severity reported at asymp10 min after the start of the exposure T4 = Symptom severity reported at asymp40 min after the start of the exposure
T5 = Symptom severity reported at asymp55 min after the start of the exposure
T6 = Symptom severity reported at asymp10 min after the end of the exposure T7 = Symptom severity reported at asymp6 hrs after the end of the exposure
T8 = Symptom severity reported at asymp24 hrs after the end of the exposure
DE = Diesel Exhaust and CA = Clean Air
113
Table 45b Mean Total Symptom Severity Ratings by Category and the Time Reported (continued) T1 T2 T3 T4 T5 T6 T7 T8
Sex
Exp
Mean
(SD)
N
Mean
SD
N
Mean
SD
N
Mean
SD
N
Mean
SD
N
Mean
SD
N
Mean
SD
N
Mean
SD
N
Upper
Respiratory
Males DE 556
(1235) 27
222
(625) 27
1056
(2890) 27
833
(1065) 27
981
(1431) 27
148
(388) 27
204
(465) 27
160
(450) 25
CA 796
(1179) 27
315
(709) 27
481
(1079) 27
385
(941) 26
278
(751) 27
111
(349) 27
058
(163) 26
352
(617) 27
Females DE 295
(367) 22
318
(589) 22
795
(1054) 22
795
(1436) 22
886
(1414) 22
159
(358) 22
227
(456) 22
136
(316) 22
CA 682
(1086)
22
500
(1309)
22
400
(736)
20
429
(978)
21
318
(568)
22
114
(264)
22
205
(367)
22
455
(1122)
22
Central
Nervous
System
Males DE 019
(096) 27
115
(588) 26
667
(1256) 27
796
(1318) 27
870
(1237) 27
241
(656) 27
074
(267) 27
037
(193) 27
CA 111
(400) 27
056
(289) 27
148
(412) 27
058
(163) 26
130
(382) 27
074
(385) 27
000
(000) 26
074
(385) 27
Females DE 023
(107) 22
205
(454) 22
955
(1174) 22
1364
(2356) 22
1318
(2515) 22
159
(323) 22
045
(147) 22
023
(107) 22
CA 159
(419) 22
091
(332) 22
227
(429) 22
432
(1208) 22
455
(1344) 22
091
(332) 22
159
(419) 22
068
(234) 22
APR Males DE 881
(1725)
27
841
(2172)
27
1037
(1372)
27
1704
(2411)
27
1611
(2058)
27
778
(1553)
27
352
(897)
27
481
(1189)
27
CA 567
(1108) 27
907
(1352) 27
1333
(1653) 27
1154
(1355 26
1130
(1458) 27
426
(938) 27
462
(999) 26
481
(1355) 27
Females DE 886
(1164) 22
1864
(2189) 22
2341
(1809) 21
2477
(2495) 21
1886
(1812) 22
614
(801) 22
477
(587) 22
318
(524) 22
CA 1500
(1648) 22
2045
(2540) 22
3214
(3258) 22
1952
(3041) 22
1477
(2027) 22
818
(1064) 22
977
(1592) 22
636
(1104) 22
No Load Males DE 130
(472)
27
074
(301)
27
241
(777)
27
426
(988)
26
315
(992)
27
037
(193)
27
019
(096)
26
037
(133)
27
CA 204
(639)
27
130
(407)
27
111
(487)
27
096
(284)
27
093
(341)
27
056
(289)
27
000
(000)
27
000
(000)
27
Females DE 091
(332)
22
114
(343)
22
205
(480)
22
182
(363)
22
182
(395)
22
068
(234)
22
000
(000)
22
000
(472)
22
CA 273
(752) 22
295
(549) 22
250
(482) 22
273
(631) 22
250
(551) 22
182
(451) 22
182
(451) 22
136
(441) 22
T1 = Symptom severity reported at the start of the study session
T2 = Symptom severity reported at asymp25 min after the start of the study session
T3 = Symptom severity reported at asymp10 min after the start of the exposure T4 = Symptom severity reported at asymp40 min after the start of the exposure
T5 = Symptom severity reported at asymp55 min after the start of the exposure
T6 = Symptom severity reported at asymp10 min after the end of the exposure T7 = Symptom severity reported at asymp6 hrs after the end of the exposure
T8 = Symptom severity reported at asymp24 hrs after the end of the exposure
DE = Diesel Exhaust and CA = Clean Air
114
Tests of the three interactions were conducted using Type 3 score tests (Liang and
Zeger 1986) of the interaction between exposure time and sex Contrasts were used to
test whether males and females differed with respect to the effect of exposure on changes
in the symptom severity ratings from baseline to each subsequent time point Contrasts
were also used to test whether within males and within females changes in the symptom
severity ratings from baseline to each subsequent time point differed between exposures
All statistical analysis for this paper were done using SAS software Version 91
of the SAS System for Windows (SAS Institute Inc Cary NC USA) and SPSS
software Version 170 (SPSS inc Chicago IL) Also some graphs were created using
Microsoft Excel 2007 P-values less than or equal to 005 were considered to be
significant
45 Results
Interaction Effect of Exposure Time and Sex on Symptoms
The results of the analysis showed that out of the eight symptom categories that
were assessed there was a statistically significant three way exposuretimesexlsquo
interaction effect on somatic (p = 00501) and lower respiratory symptom severity ratings
(p lt00001) Upper respiratory and acute phase reaction did not show a significant three
way exposuretimesexlsquo interaction effect (see table 6)
115
Table 46 Three Way Interaction Results ExposureTimeSex
Variables DF Chi Square p Value
Somatic 7 1406 00501
Eye Irritation ndash ndash ndash Anxiety ndash ndash ndash
Lower Respiratory 7 157215 lt00001 Upper Respiratory 7 273 091
CNS ndash ndash ndash APR 7 910 025
No Load ndash ndash ndash - = No results due to lack of convergence
E = Exposure (Diesel Exhaust and Clean Air) T = Time (1 ndash 8)
S = Sex (Females and Males) ple 005 is significant
Graph 41a-b Line Graph of Mean Self reported Somatic and Lower Respiratory Symptoms by Sex
116
For the remaining four symptom clusters (eye irritation anxiety central nervous
system and no load) the majority of subjects had a zero severity rating and therefore there
was very little variability between the groups to analyze Therefore the four clusters could
not converge in the model and so did not produce results (see tables 7a ndash 7d)
Table 47a Count of Reported Eye Irritation Symptoms (NY) by Sex Exposure and Time
Females Males
Clean Air Diesel Exhaust Clean Air Diesel Exhaust
Time NY Freq Freq Freq Freq
T1 N 19 864 19 864 21 778 22 815
Y 3 136 3 136 6 222 5 185
T2 N 20 909 18 818 27 1000 27 1000
Y 2 91 4 182 22 815 22 815
T3 N 18 818 15 682 5 185 5 185
Y 4 182 7 318 27 1000 27 1000
T4 N 19 864 12 545 23 852 17 630
Y 3 136 10 455 4 148 10 370
T5 N 20 909 13 591 27 1000 27 1000
Y 2 91 9 409 21 778 16 593
T6 N 20 909 19 864 6 222 11 407
Y 2 91 3 136 27 1000 27 1000
T7 N 19 864 20 909 25 926 14 519
Y 3 136 2 91 2 74 13 481
T8 N 20 909 20 909 27 1000 27 1000
Y 2 91 2 91 26 963 23 852
N = Symptom severity rating of ―0 Y = Symptom severity rating gt ―0 Freq = Frequency and = Percent
Table 47b Count of Reported Anxiety Symptoms (NY) by Sex Exposure and Time
Females Males
Clean Air Diesel Exhaust Clean Air Diesel Exhaust
Time NY Freq Freq Freq Freq
T1 N 9 409 17 773 19 704 20 741
Y 13 591 5 227 8 296 7 259
T2 N 12 545 13 591 18 667 21 778
Y 10 455 9 409 9 333 6 222
T3 N 14 636 13 591 20 741 16 593
Y 8 364 9 409 7 259 11 407
T4 N 13 591 13 591 22 815 20 741
Y 9 409 9 409 5 185 7 259
T5 N 17 773 14 636 22 815 21 778
Y 5 227 8 364 5 185 6 222
T6 N 20 909 18 818 25 926 23 852
Y 2 91 4 182 2 74 4 148
T7 N 19 864 22 1000 25 926 25 926
Y 3 136 0 00 2 74 2 74
T8 N 19 864 22 1000 26 963 25 926
Y 3 136 0 00 1 37 2 74
N = Symptom severity rating of ―0 Y = Symptom severity rating gt ―0 Freq = Frequency and = Percent
117
Table 47c Count of Reported Central Nervous System Symptoms (NY) by Sex Exposure and Time Females Males
Clean Air Diesel Exhaust Clean Air Diesel Exhaust
Time NY Freq Freq Freq Freq
T1 N 19 864 21 955 25 926 26 963
Y 3 136 1 45 2 74 1 37
T2 N 20 909 16 727 26 963 25 926
Y 2 91 6 273 1 37 2 74
T3 N 16 727 8 364 23 852 16 593
Y 6 273 14 636 4 148 11 407
T4 N 17 773 10 455 23 852 18 667
Y 5 227 12 545 4 148 9 333
T5 N 18 818 10 455 24 889 15 556
Y 4 182 12 545 3 111 12 444
T6 N 20 909 17 773 26 963 22 815
Y 2 91 5 227 1 37 5 185
T7 N 19 864 20 909 26 963 25 926
Y 3 136 2 91 1 37 2 74
T8 N 20 909 21 955 26 963 26 963
Y 2 91 1 45 1 37 1 37
N = Symptom severity rating of ―0 Y = Symptom severity rating gt ―0 Freq = Frequency and = Percent
Table 47d Count of Reported No Load (General) Symptoms (NY) by Sex Exposure and Time Females Males
Clean Air Diesel Exhaust Clean Air Diesel Exhaust
Time NY Freq Freq Freq Freq
T1 N 19 864 20 909 23 852 25 926
Y 3 136 2 91 4 148 2 74
T2 N 16 727 19 864 23 852 25 926
Y 6 273 3 136 4 148 2 74
T3 N 16 727 18 818 25 926 21 778
Y 6 273 4 182 2 74 6 222
T4 N 17 773 17 773 23 852 19 704
Y 5 227 5 227 4 148 8 296
T5 N 17 773 17 773 25 926 21 778
Y 5 227 5 227 2 74 6 222
T6 N 18 818 20 909 26 963 26 963
Y 4 182 2 91 1 37 1 37
T7 N 18 818 22 1000 26 963 26 963
Y 4 182 0 00 1 37 1 37
T8 N 20 909 22 1000 27 1000 25 926
Y 2 91 0 00 0 00 2 74
N = Symptom severity rating of ―0 Y = Symptom severity rating gt ―0 Freq = Frequency and = Percent
The results of the contrast analysis showed that between males and females with
respect to the effect of diesel exhaust on somatic symptom severity ratings reported after
baseline there was a statistically significant change in symptoms reported at time T5 (55
minutes after the start of diesel exhaust exposure p = 00036) and time T6 (10 minutes
118
after the end of the exposure to diesel exhaust p = 00139) with females having higher
mean severity ratings than males
For lower respiratory symptom severity ratings the contrast analysis showed that
diesel exhaust had a borderline significant effect on severity ratings at time T3 (10
minutes after the start of the exposure p =00925) and time T5 (55 minutes after the start
of diesel exhaust exposure p = 00762) between the sexes (see table 8) after controlling
for baseline ratings with females having higher mean severity ratings than males
Table 48 Contrast Between Sex (Males vs Females) Test Results Exposure
by Sex
Effect On
T2Δ
Exposure
by Sex
Effect On
T3Δ
Exposure
by Sex
Effect On
T4Δ
Exposure
by Sex
Effect On
T5Δ
Exposure
by Sex
Effect On
T6Δ
Exposure
by Sex
Effect On
T7Δ
Exposure
by Sex
Effect On
T8Δ
Variables
Exp
Chi
Square
(SE)
p-Value
Chi
Square
(SE)
p-Value
Chi
Square
(SE)
p-Value
Chi
Square
(SE)
p-Value
Chi
Square
(SE)
p-Value
Chi
Square
(SE)
p-Value
Chi
Square
(SE)
p-Value
Somatic DE vs CA 035
(102)
055
016
(112)
069
200
(081)
016
846
(089)
00036
606
(079)
00139
000
(143)
100
000
(089)
096
Lower
Respiratory
DE vs CA 132
(105)
025
283
(150)
00925
163
(124)
020
315
(102)
00762
071
(192)
040
011
(121)
074
048
(152)
049
Upper
respiratory
DE vs CA 020
(084)
066
034
(060)
056
016
(085)
069
009
(079)
076
028
(100)
060
053
(101)
046
000
(083)
099
APR DE vs CA 366
(050)
00556
301
(054)
00830
300
(046)
00831
271
(052
010
002
(056)
089
074
(064)
039
012
(078)
072
ΔT2 = Change from baseline (T1) in symptom severity reported at t asymp25 min after the start of the study session ΔT3 = Change from baseline (T1) in symptom severity reported at asymp10 min after the start of the exposure
ΔT4 = Change from baseline (T1) in symptom severity reported at asymp40 min after the start of the exposure
ΔT5 = Change from baseline (T1) in symptom severity reported at asymp55 min after the start of the exposure ΔT6 = Change from baseline (T1) in symptom severity reported at asymp10 min after the end of the exposure
ΔT7 = Change from baseline (T1) in symptom severity reported asymp6 hrs after the end of the exposure
ΔT8 = Change from baseline (T1) in symptom severity reported at asymp24 hrs after the end of the exposure APR = Acute Phase Reaction DE = Diesel Exhaust CA = Clean Air
Signt = Significant Effect of Sex (Males vs Females) = the effect of sex on the diesel exhaust induced changes in symptom severity reported
from baseline = statistically significant at p = 005 = borderline statistically significant at p = 005
Within females the contrast analysis showed that there was a significant increase
in the somatic and lower respiratory symptom severity ratings from baseline for all time
points except T7 (6 hrs after the end of the exposure) and T8 (24 hrs after the end of the
exposure) (Table 7) due to the main effect of diesel exhaust
119
Within males the contrast analysis showed that there was a significant increase in
somatic severity ratings from baseline to T2 (25 minutes after the start of the study
session) and there was a significant increase in lower respiratory severity ratings from
baseline to T4 (40 minutes after the start of diesel exhaust exposure) through to T6 (10
minutes after the end of the exposure to diesel exhaust) due to the main effect of diesel
exhaust
Table 49 Contrast Within Sex Test Results Exposure
Main
Effect On
On T2 Δ
Exposure
Main
Effect On
T3 Δ
Exposure
Main
Effect On
T4 Δ
Exposure
Main
Effect On
T5 Δ
Exposure
Main
Effect On
T6 Δ
Exposure
Main
Effect On
T7 Δ
Exposure
Main
Effect On
T8 Δ
Variables
Sex
Chi
Square
(SE)
p-Value
Chi
Square
(SE)
p-Value
Chi
Square
(SE)
p-Value
Chi
Square
(SE)
p-Value
Chi
Square
(SE)
p-Value
Chi
Square
(SE)
p-Value
Chi
Square
(SE)
p-Value
Somatic Males 578
(089)
0016
061
(093)
043
196
(060)
016
003
(074)
086
027
(063)
060
093
(011)
034
337
(060)
0066
Females 878
(051)
00003
368
(061)
0055
1324
(054)
00003
3014
(049)
lt00001
2245
(048)
lt00001
139
(090)
024
253
(066)
011
Lower
Respiratory
Males 020
(091)
066
243
(093)
012
389
(090)
00487
633
(069)
00119
345
(096)
0063
178
(094)
018
083
(093)
036
Females 996
(051)
00016
1129
(118)
00008
1572
(085)
lt00001
2237
(075)
lt00001
422
(166)
00399
126
(076)
026
250
(120)
011
Upper
respiratory
Males 000
(053)
098
706
(043)
00079
482
(052)
00281
747
(059)
00063
080
(072)
037
487
(076)
0027
038
(058)
054
Females 035
(065)
056
1308
(041)
00003
503
(067)
00249
1257
(052)
00004
293
(068)
00867
197
(067)
016
038
(060)
054
APR Males 221
(035)
014
225
(046)
013
002
(035)
090
004
(045)
085
012
(047)
073
217
(050)
014
069
(053)
041
Females 149
(035)
022
075
(027)
039
631
(030)
0012
865
(026)
00003
060
(031)
044
023
(039)
063
009
(057)
077
ΔT2 = Change from baseline (T1) in symptom severity reported at t asymp25 min after the start of the study session
ΔT3 = Change from baseline (T1) in symptom severity reported at asymp10 min after the start of the exposure
ΔT4 = Change from baseline (T1) in symptom severity reported at asymp40 min after the start of the exposure ΔT5 = Change from baseline (T1) in symptom severity reported at asymp55 min after the start of the exposure
ΔT6 = Change from baseline (T1) in symptom severity reported at asymp10 min after the end of the exposure
ΔT7 = Change from baseline (T1) in symptom severity reported asymp6 hrs after the end of the exposure ΔT8 = Change from baseline (T1) in symptom severity reported at asymp24 hrs after the end of the exposure
Signt = Significant
= statistically significant at p = 005 = borderline statistically significant at p = 005
In general looking at the mean change in the difference in somatic symptom
severity ratings after both exposures (diesel exhaust ndash clean air ratings) relative to
baseline for the remaining seven time points it was observed that females showed a
120
higher increase in somatic symptom severity ratings While males showed a mixed
response with some increased severity ratings and some decreased severity ratings during
this time (see table 10a)
Table 410a Mean Change (DE-CA) from Baseline in Symptom Severity Ratings for Males and Females
T1 ΔT2 ΔT3 ΔT4 ΔT5 ΔT6 ΔT7 ΔT8
Symptoms
Sex
Mean
(SD)
N
Mean
(SD)
N
Mean
(SD)
N
Mean
(SD)
N
Mean
(SD)
N
Mean
(SD)
N
Mean
(SD)
N
Mean
(SD)
N
Somatic Males -111
(610)
27
278
(954)
27
037
(784)
27
038
(859)
26
-130
(779)
27
-019
(580)
27
115
(637)
26
111
(467)
27
Females -273
(612)
22
295
(684)
22
205
(701)
22
477
(1085)
22
841
(1189)
22
432
(745)
22
205
(766)
22
182
(853)
22
Eye
Irritation
Males -074 (885)
27
074 (793)
27
259 (1375)
27
346 (936)
26
370 (792)
27
185 (761)
27
077 (880)
26
077 (783)
26
Females 023
(243) 22
-045
(510) 22
214
(1393) 21
476
(1134) 21
250
(401) 22
045
(263) 22
-091
(549) 22
-045
(461) 22
Anxiety Males 074
(1199)
27
-093
(1019)
27
130
(873)
27
673
(2953)
26
296
(933)
27
185
(1111)
27
-038
(1174)
26
-148
(1300)
27
Females -545 (950)
22
386 (770)
22
667 (1469)
21
762 (1231)
21
1159 (1815)
22
659 (1189)
22
386 (999)
22
386 (1234)
22
Lower
Respiratory
Males -074
(494) 27
037
(518) 27
241
(881) 27
500
(1200) 26
278
(698) 27
111
(376) 27
135
(521) 26
077
(417) 26
Females -205
(667)
22
091
(294)
22
500
(1012)
22
500
(1263)
22
705
(1469)
22
250
(632)
22
-091
(648)
22
159
(585)
22
T1 = Symptom severity reported at the start of the study session (Baseline)
ΔT2 = Change from baseline (T1) in symptom severity reported at t asymp25 min after session start to DE relative to CA
ΔT3 = Change from baseline (T1) in symptom severity reported at asymp10 min after exposure to DE relative to CA ΔT4 = Change from baseline (T1) in symptom severity reported at asymp40 min after exposure to DE relative to CA
ΔT5 = Change from baseline (T1) in symptom severity reported at asymp55 min after exposure to DE relative to CA
ΔT6 = Change from baseline (T1) in symptom severity reported at asymp10 min after exposure to DE relative to CA
ΔT7 = Change from baseline (T1) in symptom severity reported asymp6 hrs after exposure to DE relative to CA
ΔT8 = Change from baseline (T1) in symptom severity reported at asymp24 hrs after exposure to DE relative to CA
DE = Diesel exhaust CA = Clean air
121
Graph 42 Changes in Mean Somatic Symptoms Severity Ratings
For lower respiratory symptoms within males and females there was an increase
in the mean change in the difference in severity ratings after both exposures relative to
baseline with females tending to have higher severity ratings than males relative to
baseline
Graph 43 Changes in Mean Lower Respiratory Symptoms Severity Ratings
Similar observations were made for acute phase reaction and anxiety symptom
severity ratings but none of these observations were statistically significant
-4
-2
0
2
4
6
8
10
12
T1 ΔT2 ΔT3 ΔT4 ΔT5 ΔT6 ΔT7 ΔT8
Males 0 278 037 038 -13 -019 115 111
Females 0 295 205 477 841 432 205 182
Ch
ange
s in
Me
an S
eve
rity
Rat
ings
(+
-1
SE
)
Somatic Symptoms
-4
-2
0
2
4
6
8
10
12
T1 ΔT2 ΔT3 ΔT4 ΔT5 ΔT6 ΔT7 ΔT8
Males 0 037 241 5 278 111 135 077
Females 0 091 5 5 705 25 -091 159
Ch
ange
s in
Me
an S
eve
rity
Rat
ings
(+
-1
SE
)
Lower Respiratory Symptoms
122
Graph 44 Changes in Mean Acute Phase Reaction Symptoms Severity Ratings
Graph 45 Changes in Mean Anxiety Symptoms Severity Ratings
Although the no load (general) symptom severity ratings did not show a
significant exposuretimesexlsquo three way interaction effect they did show an opposite
sex difference in response to diesel exhaust compared to clean air than was observed in
somatic symptoms It was observed that males primarily tended to show a mean higher
increase in general symptom severity ratings than females after diesel exhaust exposure
-15
-10
-5
0
5
10
15
20
T1 ΔT2 ΔT3 ΔT4 ΔT5 ΔT6 ΔT7 ΔT8
Males 0 -381 -611 288 167 037 -346 -315
Females 0 431 -119 1071 1023 409 114 295
Ch
ange
s in
Me
an S
eve
rity
rat
ings
(+
-1
SE
)
Acute Phase Reaction Symptoms
-5
0
5
10
15
20
T1 ΔT2 ΔT3 ΔT4 ΔT5 ΔT6 ΔT7 ΔT8
Males 0 -093 13 673 296 185 -038 -148
Females 0 386 667 762 1159 659 386 386
Ch
ange
s in
Me
an S
eve
rity
rat
ings
(+
-1
SE
)
Anxiety Symptoms
123
compared to clean air and relative to baseline (see table 10b) although none of these
observations were statistically significant
Table 410b Mean Change (DE-CA) from Baseline in Symptom Severity Ratings for
Males and Females (continued) T1 ΔT2 ΔT3 ΔT4 ΔT5 ΔT6 ΔT7 ΔT8
Mean
(SD)
N
Mean
(SD)
N
Mean
(SD)
N
Mean
(SD)
N
Mean
(SD)
N
Mean
(SD)
N
Mean
(SD)
N
Mean
(SD)
N
Upper
Respiratory
Males -241
(1013)
27
148
(886)
27
815
(2531)
27
635
(1375)
26
944
(1613)
27
278
(994)
27
404
(1010)
26
160
(943)
25
Females -386 (1133)
22
205 (1377)
22
750 (11750
20
810 (1990)
21
955 (1752)
22
432 (1178)
22
409 (1342)
22
068 (1116)
22
Central
Nervous
System
Males -093
(417) 27
154
(704) 26
611
(1212) 27
865
(1425) 26
833
(1394) 27
259
(610) 27
173
(565) 26
056
(376) 27
Females -136
(441) 22
250
(720) 22
864
(1146) 22
1068
(1834) 22
1000
(2093) 22
205
(504) 22
023
(523) 22
091
(526) 22
Acute
Phase
Reaction
Males 315
(1693)
27
-381
(1319)
27
-611
(2169)
27
288
(1751)
26
167
(2319)
27
037
(1628)
27
-346
(1814)
26
-315
(1985)
27
Females -614
(1838) 22
431
(2876) 22
-119
(2423) 21
1071
(2293) 21
1023
(1783) 22
409
(1241) 22
114
(1825) 22
295
(2004) 22
No Load Males -074
(781)
27
019
(353)
27
204
(639)
27
423
(857)
26
296
(880)
27
056
(525)
27
096
(762)
26
111
(712)
27
Females -182
(716)
22
000
(512)
22
136
(384)
22
091
(718)
22
114
(739)
22
068
(417)
22
000
(598)
22
045
(575)
22
T1 = Symptom severity reported at the start of the study session
ΔT2 = Change from baseline (T1) in symptom severity reported at t asymp25 min after session start to DE relative to CA ΔT3 = Change from baseline (T1) in symptom severity reported at asymp10 min after exposure to DE relative to CA
ΔT4 = Change from baseline (T1) in symptom severity reported at asymp40 min after exposure to DE relative to CA
ΔT5 = Change from baseline (T1) in symptom severity reported at asymp55 min after exposure to DE relative to CA ΔT6 = Change from baseline (T1) in symptom severity reported at asymp10 min after exposure end to DE relative to CA
ΔT7 = Change from baseline (T1) in symptom severity reported asymp6 hrs after exposure to DE relative to CA
ΔT8 = Change from baseline (T1) in symptom severity reported at asymp24 hrs after exposure to DE relative to CA
DE = Diesel exhaust CA = Clean air
124
Graph 46 Changes in Mean No Load (General) Symptoms Severity Ratings
For the rest of the symptom categories there was an observed tendency of an
increase in symptom severity ratings starting at about 25 minutes after the start of the
study session to 10 minutes after the end of the exposure with negligible differences by
sex that were not statistically significant
-2
-1
0
1
2
3
4
5
6
7
T1 ΔT2 ΔT3 ΔT4 ΔT5 ΔT6 ΔT7 ΔT8
Males 0 01852 2037 42308 2963 05556 09615 11111
Females 0 0 13636 09091 11364 06818 0 04545
Ch
ange
s in
Me
an S
eve
rity
Rat
ings
(+-
1 S
E)
No Load (General) Symptoms
125
Graph 47a-h Distribution of Mean Symptom Severity ratings by Exposure Time and Sex
126
46 Discussion
The results showed that there was a significant three way (exposuretimesex)
interaction effect on the somatic and lower respiratory symptoms that were reported by
males and females after a 1hour controlled human environmental exposure to a known
concentration of diesel exhaust (300microgm3)
The results of this study are similar to what has been observed in other studies
that have found a difference in the reporting of somatic symptoms between males and
females (Kroenke and Spitzer 1998 and Barsky et al 2001) In this study we found that
during the 1 hour exposure to diesel exhaust and immediately after the 1 hour exposure to
diesel exhaust (time T2 to T6) females had statistically significant higher somatic
severity ratings when compared to clean air exposure (p le 000)
After controlling for baseline lower respiratory symptom severity ratings it was
observed that the difference in lower respiratory symptom severity ratings by exposure
(diesel exhaust ratings ndash clean air ratings) tended to be higher in females than in males
Previously in a review of gender differences in airway behavior done by Becklake and
Kauffmann they observed that shortness of breath (one of the lower respiratory
symptoms) was more frequently reported by females than males in population based
studies (1999) This observation can be attributed to gender related differences in
socialization which leads to a variation in the perception and reporting of symptoms ie
women feel more comfortable complaining about shortness of breath (Becklake and
Kauffmann 1999 and Barsky et al 2001) On the other hand Becklake and Kauffmann
also observed that in the population studies that they reviewed for a given deficit in
forced expiratory volume in 1 second (FEV1) the rates of reporting of shortness of breath
127
was consistently higher in females as opposed to males Thus proving evidence of a
possible biological (sex) difference in the reporting of shortness of breath and therefore
by inference a possible sex difference in the perception of lower respiratory symptoms in
general
This significant increase in self reported lower respiratory symptoms in females
correlates with the observed higher concentration of cytokines in the fluid of the lungs of
a subset of study females compared to a subset of study males after exposure to diesel
exhaust relative to clean air Although these observations in the fluid of the lungs were
not statistically significant they do suggest a biological basis for the significant sex
difference in self reported lower symptom severity ratings that was observed
In this study although not statistically significant females also tended to have
higher severity ratings for acute phase reaction and anxiety symptoms This could point
to a difference by gender especially since ―self reported generalized psychological
distress has been found to be greater in women (Barsky et al 2001) Despite this acute
phase reaction and anxiety symptoms do share a non-gender related biological (sex) link
in that psychological stress can modulate or initiate acute phase reactions in people
through the interaction of glucocorticoids with sex hormones on the immune system
(Sapolsky et al 2000 and Rohleder et al 2001)
An interesting observation was that although the no load (general symptoms) did
not show a statistically significant sex interaction effect (exposuretimesex) they did
show an opposite trend to what was observed with the somatic and lower respiratory
symptoms A trend of higher symptom severity ratings was observed in males after
exposure to diesel exhaust when compared to clean air and relative to baseline values
128
This trend may indicate a difference by sex in the types of self reported symptoms that
males and females will report after exposure to diesel exhaust similar to what has been
previously proposed by other studies that have looked at other symptom causing agents
but which still needs to be investigated further in relation to diesel exhaust exposure
461 Study Limitations
For the ascertainment of symptoms the main study relied on self administered
questionnaires and the data provided from them is based on subjective instead of
objective measures of health effects (Dimich-Wald et al 2006) There is also the concern
that by grouping the 37 individual symptoms into 8 categories important information
about the severity ratings of the individual symptoms by sex could be lost
Lastly since subjects were able to differentiate between clean air and diesel
exhaust exposure this might have affected the perception representation and reporting of
symptoms
47 Conclusions
In healthy volunteers acute exposure to 300microgm3 of diesel exhaust for an hour in
a controlled environmental study resulted in statistically significant changes in self
reported somatic and lower respiratory symptoms by sex relative to clean air exposure
with females having a tendency of higher mean somatic and lower respiratory symptom
severity ratings than males This suggests that females may be more sensitive than males
to the effects of diesel exhaust exposure
129
Finally although not significant there was also an observed trend of males having
higher mean no load (general) symptom severity ratings than females after the diesel
exhaust exposure compared to clean air exposure suggesting that there may also be a
variation by sex in the types of symptoms that are reported following diesel exhaust
exposure relative to clean air
130
Appendix C
Table C1a Mean Difference (DE-CA) in Symptom Severity Ratings for
Males and Female
T1 T2 T3 T4 T5 T6 T7 T8
Variables Sex
Mean
(SD)
N
Mean
(SD)
N
Mean
(SD)
N
Mean
(SD)
N
Mean
(SD)
N
Mean
(SD)
N
Mean
(SD)
N
Mean
(SD)
N
Somatic Males -111 (610)
27
167 (844)
27
-074 (583)
27
-077 (1036)
26
-241 (848)
27
-130 (742)
27
000 (316)
26
000 (392)
27
Females -273 (612)
22
023 (243)
22
-068 (821)
22
205 (812)
22
568 (1015)
22
159 (390)
22
-068 (835)
22
-091 (971)
22
Eye Irritation Males -074
(885) 27
000
(1047) 27
185
(1048) 27
269
(941) 26
296
(800) 27
111
(424) 27
000
(141) 26
-077
(306) 26
Females 023 (243)
22
023 (393)
22
238 (1310)
21
524 (1089)
21
273 (369)
22
068 (176)
22
-068 (387)
22
-023 (326)
22
Anxiety Males 074
(1199)
27
-019
(1712)
27
204
(869)
27
769
(3505)
26
370
(1405)
27
259
(1361)
27
019
(098)
26
-074
(494)
27
Females -545
(950)
22
-159
(892)
22
119
(1274)
21
310
(782)
21
614
(1511)
22
114
(533)
22
-159
(473)
22
-159
(543)
22
Lower
Respiratory
Males -074
(494)
27
-037
(553)
27
167
(920)
27
423
(1278)
26
204
(880)
27
037
(237)
27
058
(258)
26
000
(141)
26
Females -205
(667) 22
-114
(461) 22
295
(611) 22
295
(868) 22
500
(988) 22
045
(342) 22
-295
(1192) 22
-045
(554) 22
T1 = Symptom severity reported at the start of the study session
T2 = Symptom severity reported at asymp25 min after the start of the study session T3 = Symptom severity reported at asymp10 min after the start of the exposure
T4 = Symptom severity reported at asymp40 min after the start of the exposure
T5 = Symptom severity reported at asymp55 min after the start of the exposure T6 = Symptom severity reported at asymp10 min after the end of the exposure
T7 = Symptom severity reported at asymp6 hrs after the end of the exposure
T8 = Symptom severity reported at asymp24 hrs after the end of the exposure
131
Table C1b Mean Difference (DE-CA) in Symptom Severity Ratings for
Males and Females (continued) T1 T2 T3 T4 T5 T6 T7 T8
Mean
(SD)
N
Mean
(SD)
N
Mean
(SD)
N
Mean
(SD)
N
Mean
(SD)
N
Mean
(SD)
N
Mean
(SD)
N
Mean
(SD)
N
Upper
Respiratory
Males -240 (1013)
27
-093 (855)
27
574 (2209)
27
423 (1419)
26
704 (1583)
27
037 (479)
27
154 (505)
26
-160 (688)
25
Females -386
(1133)
22
-182
(1444)
22
375
(872)
20
405
(1261)
21
568
(1294)
22
045
(406)
22
023
(475)
22
-318
(1119)
22
Central
Nervous
System
Males -093
(417)
27
058
(668)
26
519
(1096)
27
769
(1380)
26
741
(1266)
27
167
(392)
27
077
(272)
26
-037
(437)
27
Females -136
(441)
22
114
(576)
22
727
(1020)
22
932
(1635)
22
864
(1774)
22
068
(320)
22
-114
(406)
22
-045
(263)
22
Acute
Phase
Reaction
Males 315
(1693) 27
-067
(1575) 27
-296
(1689) 27
615
(2036) 27
481
(2195) 27
352
(1433) 27
-096
(448) 26
000
(784) 27
Females -614 (1838)
22
-182 (3411)
22
-762 (3239)
21
571 (2175)
21
409 (1540)
22
-205 (1324)
22
-500 (1551)
22
-318 (1220)
22
No Load Males -074 (781)
27
-056 (525)
27
130 (947)
27
346 (1075)
26
222 (1059)
27
-019 (353)
27
019 (098)
26
037 (133)
27
Females -182
(716)
22
-182
(424)
22
-045
(532)
22
-091
(453)
22
-068
(623)
22
-114
(510)
22
-182
(451)
22
-136
(441)
22
T1 = Symptom severity reported at the start of the study session
T2 = Symptom severity reported at asymp25 min after the start of the study session T3 = Symptom severity reported at asymp10 min after the start of the exposure
T4 = Symptom severity reported at asymp40 min after the start of the exposure
T5 = Symptom severity reported at asymp55 min after the start of the exposure T6 = Symptom severity reported at asymp10 min after the end of the exposure
T7 = Symptom severity reported at asymp6 hrs after the end of the exposure
T8 = Symptom severity reported at asymp24 hrs after the end of the exposure
132
Graph C1andashh Line Graph of Mean Symptom Severity Ratings by Sex
133
References
Arbuckle TE 2006 Are there sex and gender differences in acute exposure to
chemicals in the same setting Environmental Research101 pg 195-204
Barsky AJ Heli MP Borus JF 2001 Somatic Symptom Reporting in Women and
Men Journal of General Internal Medicine 16 pg 266-275
Becklake MR and Kauffmann F 1999 Gender differences in airway behavior over
the human life span Thorax 54 pg 1119-1138
Carlsten C Kaufman JD Peretz A Trenga CA Sheppard L and Sullivan JH
2007 Coagulation Markers in Healthy Human Subjects Exposed to Diesel Exhaust
Thrombosis Research 120 pg 849-855
Christian MS 2001 IntroductionOverview Gender-Based Differences in
Pharmacologic and Toxicologic Responses International Journal of Toxicology 20
pg 145-148
Czerniak R Gender-Based Differences in Pharmacokinetics in Laboratory Animal
Models 2001 International Journal of Toxicology 20 pg 161-163
Da Silva JA 1995 Sex Hormones Glucocorticoids and Autuimmunity facts and
hypotheses Annals of the Rheumatic Disease 54 pg 6-16
Dimich-Warda H Campa PG and Kennedy SM 2006 Gender differences in
respiratory symptomsmdashDoes occupation matter Environmental Research 101 pg
175ndash183
Diaz-Sanchez D and Riedl M 2005 Diesel effects on human health a question of
stress American Journal of Physiology ndash Lung Cellular and Molecular Physiology
289 pg L722-L723
Diaz-Sanchez D Tsien A Casillas A Dotson AR and Saxon A 1996 Enhanced
nasal cytokine production in human beings after in vivo challenge with diesel exhaust
particles Journal of Allergy and Clinical Immunology 98 pg114-123
Diez Roux AV Auchincloss AH Astor B Barr RG Cushman M Dvonch T
Jacobs Jr DR Kaufman J Lin X and Samson P 2006 Recent Exposure to
Particulate Matter and C-reactive Protein Concentration in the Multi-Ethnic Study of
Atherosclerosis American Journal of Epidemiology 164 pg 437-448
Donaldson K Stone V Seaton A and MacNee W 2001 Ambient Particle Inhalation
and the Cardiovascular System Potential Mechanisms Environmental Health
Perspectives 109(supplement 4) pg 523-527
134
Ersntgard L Gullstrand E and Johanson G 2002 Are women more sensitive than
men to 2-propanol and m-Xylene vapours Occupational and Environmental
Medicine 59 pg 759-767
Ersntgard L Sjogren B Warholm M and Johanson G 2003 Sex differences in
toxicokinetics of inhaled solvent vapors in humans m-Xylene Toxicology and
Applied Pharmacology 193 pg 147-157
Fairweather D and Rose NR 2004 Women and Autoimmune Disease Emerging
Infectious Disease [Serial on the internet] November Available from
httpwwwcdcgovncidodEIDvol10no1104-0367htm
Faustman E and Omenn G Risk Assessment in Klaassen CD (eds) Casarett and
Doulllsquos Toxicology The Basic Science of Poisons 6th
ed New York Macmillan
2001 pg 83-104
Fortoul TI Moncada-Henandez S Saldivar-Osorio L Espejel-Maya G Mussali-
Galante P Avila-Casado MC Colin-Barenque L Hernandez-Serrato MI and
Avila-Costa MR 2005 Sex differences in bronchiolar epithelium response after the
inhalation of lead acetate (Pb) Toxicology 207 pg 323-330
Frumkin H and Thun MJ 2001 Diesel Exhaust Environmental Carcinogens 51 pg
193-198
Furuyama A Hirano S Koike E and Kobayashi T 2006 Induction of oxidative
stress and inhibition of plasminogen activator inhibitor-1 production in endothelial
cells following exposure to organic extracts of diesel exhaust particles and urban fine
particles Archives of Toxicology 80 pg 154-162
Gabay C and Kushner J 1999 Acute phase proteins and other systemic responses to
inflammation New England Journal of Medicine 340 pg 448ndash54
Gijsbers Van Wijk CMT and Kolk AM 1997 Sex Differences in Physical
Symptoms The Contribution of Symptom Perception Theory Social Science and
Medicine 45 pg 231-246
Green HG Dalton P Cowart B Shaffer G Rankin K Higgins J 1996 Evaluating
the labeled magnitude scale for measuring sensations of taste and smell Chemical
Senses 21 pg 323 -334
Gochfeld M 2007 Framework for gender differences in human and animal
toxicology Environmental Research 104 pg 4-21
Kritchevsky S Cesari M and Pahor M 2005 Inflammatory markers and
cardiovascular health in older adults Cardiovascular Research 66 pg 265ndash 275
135
Kroenke K and Spitzer RL 1998 Gender differences in the reporting of physical
and somatoform symptoms Psychosomatic Medicine 60 pg 150-155
Lamason R Zhao P Rawat R Davis A Hall JC Chae JJ Agarwal R Cohen
P Rosen A Hoffman EP and Nagaraju K 2006 Sexual dimorphism in immune
response genes as a function of puberty BMC Immunology 7 pg 2
Liang KY and Zeger LL 1986 Longitudinal Data Analysis Using Generalized Linear
Models Biometrika 73 pg 13 ndash 22
Lucking AJ Lundback M Mills NL Faratian D Barath SL Pourazar J Cassee
FR Donaldson K Boon NA Badimon JJ Sandstrom T Blomberg A and
Newby DE 2008 Diesel Exhaust Inhalation Increases Thrombus Formation In Man
European Heart Journal 29 pg 3043-3051
Messing K and Stellman JM 2006 Sex gender and womenlsquos occupational health
The importance of considering mechanism Environmental Research 101 pg 149-
162
Mills NL Tornqvist H Robinson SD Gonzalez M Darnley K MacNee W
Boon NA Donaldson K Blomberg A Sandstrom T and Newby DE 2005 Diesel
Exhaust Inhalation Causes Vascular Dysfunction and Impaired Endogenous
Fibrinolysis American Heart Association 112 pg 3930-3936
Mills NL Tornqvist H Gonzalez MC Vink E Robinson SD Soderberg S
Boon NA Donaldson K Sandstrom T Blomberg A and Newby DE 2007
Ischemic and Thrombotic Effects of Dilute Diesel-Exhaust Inhalation in Men with
Coronary Heart Disease The New England Journal of Medicine 357 pg 1075-1082
Nightingale JA Maggs R Cullinan Donnelly LE Rodgers DF Kinnersley R
Chung KF Barnes PJ Ashmore M and Newman-Taylor A 2000 Airway
Inflammation after Controlled Exposure to Diesel Exhaust Particles American
Journal of Respiratory and Critical Care Medicine 162 pg 161-166
Nordenhall C Pourazar J Blomberg A Levin J-O Sandstrom T and Adelroth E
2000 Airway inflammation following exposure to diesel exhaust a study of time
kinetics using induced sputum European Respiratory Journal 15 pg 1046-1051
Peters A Frouml hlich M Douml ring A Immervoll T Wichmann HE Hutchinson
WL Pepys MB and Koenig W 2001 Particulate Air Pollution is Associated with
an Acute Phase Response in Men Results from the MONICAndashAugsburg Study
European Heart Journal 22 pg 1198ndash1204
136
Pourazar J Mudway IS Samet JM Helleday R Blomberg A Wilson S Frew
AJ Kelly FJ and Sandstrom T 2005 Diesle Exhaust activates redox-sensitive
transcription factors and kinases in human airways American Journal of Physiology ndash
Lung Cellular and Molecular Physiology 289 pg L724-L730
Riedl M and Diaz-Sanchez D 2005 Biology of diesel exhaust effects on respiratory
function Journal of Allergy and Clinical Immunology 115 pg 221-8
Robert B Gender-Specific Aspects of Cardiovascular Disease 2005 Womenlsquos Heart
Foundation RI Medicine and Health Article
Rogers A and Davies B 2005 Diesel Particles ndash Recent Progress on an Old Issue
Annals of Occupational Hygiene 49 pg 453-456
Rohleder N Schommer NC Hellhammer DH Engel R and Kirschbaum C 2001
Sex Differences in Glucocorticoid Sensitivity of Proinflammatory Cytokine
Production After Psychosocial Stress Psychosomatic Medicine 63 pg 966-972
Salvi S Blomberg A Rudell B Kelly F Sandstrom T Holgate ST and Frew A
1999 Acute Inflammatory Responses in the Airway and Peripheral Blood After
Short-Term Exposure to Diesel Exhaust in Healthy Human Volunteers American
Journal of Respiratory and Critical Care Medicin 159 pg 702-709
Salvi S and Holgate ST 1999 Mechanisms of particulate matter toxicity Clinical
and Experimental Allergy 29 pg 1187-1194
Salvi S Nordenhall C Blomberg A Rudell B Pourazar J Kelly F Wilson S
Sandstrom T Holgate ST and Frew A 2000 Acute Exposure to Diesel Exhaust
increase IL-8 and GRO-α Production in Healthy Human Airways American Journal
of Respiratory and Critical Care Medicine 161 pg 550-557
Samet JM Dominici F Curriero FC Coursac I and Zeger SL 2000 Fine
Particulate Air Pollution and Mortality in 20 US Cities 1987-1994 The New
England Journal of Medicine 343 pg 1742-1749
Sapolsky RM Romero LM and Munck AU 2000 How Do Glucocorticoids
Influence Stress Responses Integrating Permissive Suppressive Stimulatory and
Preparative Actions Endocrine Reviews 21 pg 55-89
Saxton A and Diaz-Sanchez D 2000 Diesel exhaust as a model xenobiotic in
allergic inflammation Immunophamacology 48 pg 325-327
Schwartz J 2001 Air Pollution and Blood Markers of Cardiovascular Risk
Environmental Health Perspectives 109(supplement 3) pg 405ndash409
137
Sydbom A Bomberg A Parnia S Stenfors N Sandstrom T and Dah en SE 2001
Health Effects of Diesel Exhaust Emissions European Respiratory Journal 17 pg
733-746
The American Heritage Dictionary 1994 3rd
Edition Dell Publishing
Tornqvist H Mills NL Gonzalez M Miller MR Robinson SD Megson IL
MacNee W Donaldson K Soderberg S Newby DE Sandstrom T and Blomberg
A 2007 Persistent endothelial dysfunction following diesel exhaust inhalation in
man American Journal of Respiratory and Critical Care Medicine 176 pg 395-400
US EPA 2002 Health assessment document for diesel engine exhaust US
Environmental Protection Agency Document EPA6008-90057F
Vahter M Gochfeld M Casati B Thiruchelvam M Falk-Filippson A Kavlock R
Marafante E and Cory-Slechta D 2007 Implications of gender differences for
human health risk assessment and toxicology Environmental research 104 pg 70-84
Van Eeden SF Tan WC Suwa T Mukae H Terashima T Fujii T Qui D
Vincent R and Hogg JC 2001 Cytokines Involved in Systemic Inflammatory
Response Induced by Exposure to Particulate Matter Air Pollutants (PM10) American
Journal of Respiratory and Critical Care Medicine 164 pg 826-830
Zeka A Sullivan JR Vokonas PS Sparrow D Schwartz J 2006 Inflammatory
Markers and Particulate Air Pollution characterizing the pathway to disease
International Journal of Epidemiology 35 pg 1347ndash1354
138
Chapter 5
Analysis of Sex Differences in the Urinary Concentration of 1-
Aminopyrene after Acute Exposure to Diesel Exhaust
139
51 Abstract
52 Introduction
521 1-Nitropyrene
5211 Metabolism of 1-Nitropyrene
522 Sex Differences in Physiology
53 Materials and Methods
531 Data Collection
532 Subjects
533 Exposure Conditions and Experimental Design
534 Urine Sample Collection
535 Urine Sample Analysis
536 Creatinine Measurements
537 Exclusion of Invalid Data and calculation of Time Weighted Average
Concentrations
538 Exclusion of Baseline Values
539 Calculation of Response Measure
5310 Body Mass Index
54 Statistical Methods
55 Results
551 Aim 1
552 Aim 2
56 Discussion
561 Study Limitations
57 Conclusions
Appendix C
140
References
141
51 Abstract
Background 1-Nitropyrene is one of the primary nitro-polycyclic aromatic
hydrocarbons found in diesel exhaust Therefore it along with its metabolites
such as 1-aminopyrene are thought of as potentially good specific biomarkers for
diesel exhaust exposure Physiological differences due to sex may affect the
metabolism and excretion of 1-nitropyrene
Aims To investigate whether there are sex differences in metabolism of 1-
nitropyrene as indicated by potential variations in the urinary levels of 1-
aminopyrene excreted as a product of the nitro-reduction of 1-nitropyrene after a
controlled environmental exposure to diesel exhaust
Method In a randomized crossover study healthy human subjects were exposed
to 300microgm3 of diesel exhaust and to clean for 1 hour each in a controlled
environmental exposure chamber on two different days (ge1 week washout)
Subjects were asked to collect 24 hour spot urine samples which were then
analyzed for 1-aminopyrene using an HPLC-fluorescence Primary statistical
analysis was done using an analysis of variance
Results There was no statistically significant difference in the concentration of
urinary 1-aminopyrene post exposure to diesel exhaust relative to clean air
between males and females although females did show about a 12 mean
increase in the time weighted average concentration of 1-aminopyrene compared
to about a 0004 increase that was observed in males after exposure to diesel
exhaust relative to clean air exposure
Conclusion Although not statistically significant we observed a difference by
sex in the levels of urinary 1-aminopyrene 24 hours after acute exposure to
300microgm3 of diesel exhaust relative to clean air exposure Females tended to
secrete a higher concentration of diesel exhaust attributable 1- aminopyrene in
urine than males indicating that females may metabolize 1-nitropyrene via nitro-
reduction more actively than males
52 Introduction
Diesel exhaust is made up of a complex mixture of many chemicals including
polycyclic aromatic hydrocarbons (PAHs) and nitro-PAHs in either gaseous or particulate
form (CECBP 2008 USEPA HAD 2002) The particles are collectively called diesel
exhaust particles (DEPs) and they are the largest single source of airborne particulate
matter (PM) in many urban areas (Riedl and Diaz-Sanchez 2005) This means that for the
general population non-occupational exposure to diesel exhaust occurs frequently but
142
varies in concentration and length of exposure Relatively high ambient exposures to
diesel exhaust occur in ports freeway intersections and on school buses (CECBP 2008)
521 1-Nitropyrene
1-Nitropyrene (1-NP) is a nitro-PAH that is formed as a by-product of combustion
and is the predominant nitrated polycyclic aromatic hydrocarbon emitted in diesel engine
exhaust 1-NP is also formed as a result of gas phase radical initiated atmospheric
formation (USEPA HAD 2002) and is found in coal combustion cigarette smoke cooked
meat products wood burning gas burner and kerosene heater emissions and airplane
exhaust (WHO 2003) Despite these other sources the major route of exposure to 1-NP
is through the inhalation of complex mixtures (eg diesel exhaust) and polluted urban air
(USEPA HAD 2002) In many studies the absorption and metabolism of 1-NP has been
shown to occur rapidly with 1-NP mainly being metabolized by cytochrome P450
mediated ring oxidation and nitro reduction followed by the conjugation and excretion of
metabolites in urine and feces (Silvers et al 1994 WHO 2003)
Since 1-NP is one of the primary nitro-PAHs found in diesel exhaust and also due
to its strong association with diesel exhaust it along with its metabolites such as 1-
aminopyrene (1-APY) are thought of as potentially good specific biomarkers for DEPs
exposure (Toriba et al 2007) This is important because 1-NP has been shown to have
mutagenic properties and it is thought to be the main contributor of the direct acting
mutagenicity of DEPs It has been suggested that 1-NP in the body is mainly detoxified to
1-APY by nitro reduction (NTP 1996) but studies that have been done to date have
shown mixed results about the urinary levels of 1-APY in relation to 1-NP exposure
143
(Seidel et al 2002 and Toriba et al 2007) Still there remains the possibility that 1-APY
could be a potentially good biomarker for 1-NP exposure and thus diesel exhaust
exposure
5211 Metabolism of 1-Nitropyrene
The metabolism of 1-NP can occur via nitro-reduction or cytochrome P450 mediated ring
oxidation (Silvers et al 1997 and Chae et al 1999) The human Cytochrome P450 family
of enzymes in particular the P450 3A3 and 3A4 isomers are the predominant enzymes
involved in the oxidative metabolism of 1-NP (Silvers et al 1997 and Chae et al 1999) In
the mammalian system 1-NP is metabolized by xanthine oxidase DT-diaphorase or
aldehyde oxidase (NTP 1996)
522 Sex Differences in Physiology
Many studies to date have shown that there is a large inter-individual variation in
the excretion of nitro-PAHs and their metabolites and that this may be due to differences
in the uptake and metabolism of these compounds and also the potential influence of
confounders like age environmental tobacco smoke intake of charcoal broiled meat and
residential area (USEPA HAD 2002 Nielsen et al 1996)
Males and females differ substantially with respect to physiology and these
differences may have significant effects on the toxicity of any xenobiotic like nitro-PAHs
and thus may affect how vulnerable males and females are to the effects of a xenobiotic
and other environmental stressors (Gochfeld 2007) Specifically sex may influence the
uptake and also the type and function of metabolizing enzymes that either become
144
activated or deactivated upon exposure to nitro-PAHs This may translate into differences
in the rate of metabolism of nitro-PAHs the types and severity of toxicity and the amount
of nitro-PAHs metabolites that are excreted after exposure to diesel exhaust In drug
studies female sex has been shown to be a risk factor for clinically relevant adverse drug
reactions due to sex differences in pharmacokinetics in pharmacodynamics
immunology hormonal factors and differences in the dose (mgkg) that was administered
(Anderson 2008 Rademaker 2001)
Sex differences in the activity of the cytochrome P450 (CYP) and uridine
diphosphate glucuronosyltransferase (UGT) enzymes and renal excretion also result in
differences in clearance (Anderson 2008) Also frequent and sometimes clinically
relevant sex differences can possibly be identified for drug elimination processes and
have predominantly been linked to the sex-specific expression of the metabolic enzyme
systems eg CYP3A4 and CYP1A2 (Beierle et al 1999)
The CYP3A gene subfamily is the most abundant P450 enzyme in human liver
microsomes the level of which can vary enormously (gt10 fold) among individuals
(Casarett and Doulls 2001) They (in particular CYP3A3 and CYP3A4) seem to be the
enzymes involved in the human oxidative metabolism of 1-NP (WHO 2003) There is
evidence of females having lower activity of CYP1A2 CYP2E1 and UGT higher
activity of CYP3A4 CYP2A6 and CYP2B6 and no differences in CPY2C9 and
CYP2D6 activity (Anderson 2008) As mentioned before in the mammalian system 1-
NP is metabolized by xanthine oxidase DT-diaphorase or aldehyde oxidase (NTP 1996)
via nitro-reduction and in 1992 Relling et al showed that females had a higher activity of
xanthine oxidase than males after exposure to a low dose of caffeine Therefore there is
145
the possibility that there may be a variation by sex in the concentration of 1-NP
metabolites that are produced regardless of the metabolic pathway that is used
To summarize with regards to physiology women generally have a lower lean
body mass reduced hepatic clearance differences in activity of cytochrome P450 (CYP)
enzymes (40 increase in CYP3A4 varied decrease in CYP2D6 CYP2C19 and
CYP1A2) metabolize drugs at different rates compared with men (Rademaker 2001) and
have been shown to have a higher xanthine oxidase activity (Relling et al 1992) Other
important factors include conjugation absorption protein binding and renal elimination
which may all have some sex-based differences (Rademaker 2001)
Sex differences have also been observed in baseline characteristics as well as in
drug response which might both at least in part be the consequence of modulation by
sex hormones (Beierle et al 1999) All of these potential factors may affect the way that
males and females react physiologically to a xenobiotic like diesel exhaust thereby
influencing the rates and types of metabolism and excretion of the xenobiotic in males
and females making one group either slow intermediate or fast metabolizers (WHO
2003) of the xenobiotic thus influencing the levels and types of metabolites excreted
The aim of the present study is to investigate whether there are sex differences in
the metabolism of diesel exhaust as indicated by the potential variation in the amount of
urinary 1-APY excreted as a product of the nitro reduction of 1-NP following diesel
exhaust exposure If there are variations in the amount of urinary 1-APY excreted
following diesel exhaust exposure between males and females a second aim of the paper
is to determine if sex is a significant predictor of the amount of 1-APY that is excreted in
urine
146
53 Materials and Methods
531 Data Collection
The data used for this dissertation research are part of the datasets generated from
a study of diesel exhaust effects and a subsequent add-on study of diesel exhaust
exposure biomarkers The parent study was funded by the Department of Defense (DOD)
through a grant to the University of Medicine and Dentistry of New jersey (UMDNJ)
(Grant DAMD17-03-1-0537 Principal Investigator Dr Nancy Fiedler) and the add-on
project was funded by the Environmental Protection Agency (EPA) through a STAR
grant to UMDNJ (Grant R832097 Principal Investigator Dr Junfeng Zhang)
532 Subjects
110 healthy non-smoking men and women between the ages of 18 and 50 were
recruited from the local community in Piscataway New Jersey based on the established
study criteria 100 subjects completed the study Out of these subjects 55 subjects
consented to provide urine samples as part of the add-on study (see table 1)
Table 51 Subject Characteristics by Sex Females Males
N Min Max Mean SD N Min Max Mean SD
AGE (years) 21 19 44 2519 724 29 19 43 2497 670
Height (inches) 21 5950 6750 6325 189 29 595 75 6880 312
Weight(lb) 21 106 200 14167 3017 29 137 236 17119 2505
BMI (kgm2) 21 1908 3717 2494 552 29 2128 3435 2541 320
Respiration 20 M 14 20 1610 165 29 10 20 1593 210
Temperature oF 19M 9730 9940 9834 041 28 M 975 991 9830 043
Pulse 20 M 54 94 6850 868 29 52 86 6862 923
Log TWA 1-APY 21 -056 821 236 199 29 -330 583 191 217
Race Frequency () Frequency ()
Asian 10 (4762) 12 (4138)
Black 2 (952) 1 (345)
Hispanic 3 (1429) 6 (2069)
Other 0 (0) 1 (345)
White 6 (2857) 9 (3103)
BMI = (weightheight2) 703 M = some subjects had missing data
147
533 Exposure Conditions and Experimental Design
A randomized crossover design was used in which each subject underwent two
exposure conditions one was to diluted diesel exhaust normalized to PM10 concentration
of 300microgm3 and the other was to filtered clean ambient air of Busch campus in
Piscataway a suburban campus of Rutgers University Both exposure conditions were 1
hour in duration and took place at the Environmental and Occupational Health Sciences
Instituteslsquo (EOHSI) Controlled Environmental Facility (CEF) Each exposure condition
was presented with and without an acute psychological stressor to two groups of subjects
high and low in self reported chemical intolerance (CI) Subjects were also asked to fast
overnight the day before the study until after each exposure session and to also abstain
from any exercise
There were no significant differences in the exposure conditions for all subjects
Overall the concentration of PM10 that the subjects were exposed to was 276plusmn13microgm3
which was close to the target concentration of 300microgm3
Table 52 Mean Air Characteristics and Composition Diesel Exhaust Clean Air
PM10 (microgm3) 276 plusmn 13 6 plusmn 5 NOX (ppm) 363 plusmn 090 002 plusmn 002
CO (ppm) 379 plusmn 076 091 plusmn 021
1 Nitropyrene (ngm3) 268 plusmn 051 lt006
534 Urine Sample Collection
Subjects were asked to collect 24 hour spot urine samples beginning on the
morning of the day of exposure through to the following morning after exposure They
were provided with a cooler containing a dozen 50-ml bottles and they were instructed to
use an empty and clean bottle to collect each urine sample Each bottle had a label with
the subjectlsquos identification number and the subjects were asked to write the sample
148
collection time on the labels Along with the labels the subjects were also given a simple
timeactivity diary with which to document potential sources of nitro-PAHs within the
sampling period Upon return to the laboratory all the urine samples were stored at -40degC
and protected from light before sample analysis
535 Urine Sample Analysis
The urine samples were analyzed for 1-APY using an HPLC-fluorescence
technique that was developed and described previously by Laumbach et al 2009 Briefly
the acetylated urinary 1-APY conjugate was hydrolyzed with concentrated HCl at 80ordmC in
a shaking bath for 1 hour before extraction During the extraction the pH of the mixture
was first adjusted to 7 ndash 8 by adding about 11 ml of 10 M NaOH and a small quantity of
concentrated acetic acid The resulting solution was then centrifuged at 2500 g for 10 min
with 5 ml of dichloromethane and extracted twice The two dichloromethane extracts
were then combined in a glass tube and evaporated to near dryness using nitrogen at
room temperature The residue was rinsed from the glass tube wall and made into a final
solution of 1 ml with acetonitrile Using a 02 microm PVDF liquid filter the final solution
was filtered through into a 18 ml amber vial that was sealed with a Teflon septum for
HPLC analysis
The HPLC system used for the 1-APY analysis included a 600E system
controller a 717 auto sampler and a 2474 fluorescence detector (Waters Co Milford
MA) An Ascentis RP-Amide column (46mm x 250mm) (Supelco Co Bellefonte PA)
was used to separate analytes The mobile phase involved the use of two solutions
Solution A = 50 acetonitrile in water and Solution B = 100 acetonitrile with a linear
gradient from 100 A to 100 B in 30 min at a flow rate of 10 mlmin The injection
149
volume was 20microL The fluorescence detector was set at an excitation wavelength of 254
nm and an emission wavelength of 425 nm An external standard of 1-APY (97 purity
Aldrich Co St Louis MO) was used to generate calibration curves for quantifying 1-
APY concentrations All calibration curves had a near zero intercept and a R2 gt 099
This method had a detection limit of 002 ngml expressed as 3 times the standard
deviation of a low concentration calibration standard (N = 8) The coefficient spiked into
real urine sample (with concentration in the original urine subtracted) the method
recovery was 883
536 Creatinine Measurement
Creatinine concentrations were measured spectrophotometrically and were used to
normalize 1-APY concentrations Since subjects were asked to collect spot urine samples
the whole urine output per void was not collected and so the mass of 1-APY excreted in
urine voids could not be determined Therefore creatinine adjusted concentrations were
used in an attempt to account for differences in the dilution of the spot urine samples
537 Exclusion of Invalid Data and Calculation of Time Weighted Average
Concentrations
The total number of subjects that provided samples for the study was 55 the total
number of spot urine samples collected following diesel exhaust (DE) exposure was 373
and the total number of spot urine samples collected following clean air (CA) exposure
was 359
After excluding all invalid samples (those samples for which the creatinine levels
were out of the valid range ie lt30 and gt 300 mgdl (Barr et al 2005 ACGIH 199)) and
150
any urine samples that did not have a corresponding creatinine measurement the total
number of subjects left with valid samples was 50 (21 Females and 29 Males) leaving
249 Clean Air exposure sample measurements and 249 Diesel exhaust exposure sample
measurements
After the creatinine correction the time weighted average (TWA) of 1-APY
concentration per subject was calculated using the formula below
Source Laumbach et al 2009
Ci Exp = Time weighted average concentration after exposure j
TijExp = time that the concentration was measured for an exposure j in minutes
Cij = Concentration measured at time i for exposure j
Table 53 TWA 1-APY Concentrations for All Subjects and by Sex All Females Males
DE CA DE CA DE CA
Mean 3573 2108 3787 299 3419 3419
SD 5146 8508 5541 327 4934 11062
Max 23746 50385 21540 1213 23746 50385 Median 1702 234 1288 209 1886 296
Min 165 003 165 006 173 003
Total 50 50 21 21 29 29
1-APY = 1 ndash Aminopyrene Concentrations as presented above are in ngml
538 Exclusion of Baseline Values
There was a difference between the mean baseline 1-APY concentrations for all
subjects with subjects having a higher mean baseline 1-APY concentration prior to diesel
exhaust exposure than prior to clean air exposure (710 ngml vs 282 ngml) This trend
continued when looked at by sex with males having a higher mean baseline 1-APY
iExp
iExp
J
j
ijExp
J
j
ijExpijExp
Expi
t
Ct
C
1
1
151
concentration than females both prior to diesel exhaust exposure (751 ngml vs 649
ngml) and prior to clean air exposure (309 ngml vs 249 ngml)
Table 54 Baseline 1-APY Concentrations All Subjects Females Male
DE CA DE CA DE CA
Mean 710 282 649 249 751 309 SD 1447 430 1218 448 1603 422
Max 7457 1540 4783 1540 7457 1520
Median 060 065 037 032 134 107 Min 002 001 002 001 002 003
Total 47 43 19 19 28 24
Some subjects were missing baseline measurements Concentrations as presented above are in ngml 1-APY = 1 ndash Aminopyrene DE = Diesel Exhaust CA = Clean Air
Since every subject did not have a baseline 1-APY sample (concentration of 1-
APY measured in urine that was collected on the morning of exposure prior to the start of
exposure) all baseline 1-APY samples were excluded from the dataset Prior to their
exclusion a sensitivity analysis was done using a 2 by 2 between group analysis of
covariance (ANCOVA) to assess whether mean TWA 1-APY concentrations for diesel
exhaust and clean air were significantly different for males and females after the baseline
1-APY values were controlled for This was done to determine if the baseline 1-APY
concentrations had an effect on the amount of TWA 1-APY that was secreted by
exposure and by sex The TWA 1-APY and the baseline 1-APY values were log
transformed prior to the ANCOVA analysis due to the fact that their distributions were
right skewed
In the ANCOVA analysis the independent variables were exposure (DE CA) and
sex (males females) The dependent variable was the log transformed 24 hour TWA 1-
APY concentrations measured following exposure to diesel exhaust and clean air The
log transformed baseline values were used as a covariate in the analysis
152
Table 55a Results of the ANCOVA Sensitivity Analysis Source Type III SS Mean Square F Value p Value
Exposure type 10118 10118 3874 lt0001 SEX 397 397 152 022
Log Baseline 688 688 264 011
Exposure type x SEX 108 108 041 052
Concentrations as presented above are in ngml SS = Sum of squares 1-APY = 1 ndash Aminopyrene TWA = Time Weighted Average
Table 55b Mean and Adjusted Mean Concentrations of Baseline TWA 1-APY by Sex
Log
TWA 1-APY
N
Mean
Adjusted
Mean
Females
Clean Air 19 024 030
Diesel Exhaust 19 268 268
Males
Clean Air 24 098 095 Diesel Exhaust 28 290 288
Means adjusted for by log baseline values Concentrations as presented above are in ngml
1-APY = 1 ndash Aminopyrene TWA = Time Weighted Average
Since the significance level of the main effect of the log baseline covariate and the
exposure type by sex interaction were both greater than 005 (p = 011 and p = 052
respectively) it indicated that there was no significant relationship between the log
baseline 1-APY concentrations (covariate) and the log TWA 1-APY concentrations
(dependent variable) by exposure and by sex and therefore it was appropriate to exclude
the baseline 1-APY concentrations from the main analysis
539 Calculation of Response Measure
Urinary creatinine concentration and specific gravity are two of the accepted
methods for adjusting for dilution of a spot urine sample (Barr et al 2005) With regards
to sex it has been shown that sex plays a role in the concentration-dilution of spot urine
samples thereby influencing both the urinary concentration of creatinine and specific
gravity that are used to correct these spot samples (Carrieri et al 2001)
This means that there is the potential that the use of creatinine concentrations to
control for the effect of hydration in this study might skew the results because creatinine
concentration is influenced by muscle mass which in turn differs by sex with women
153
generally having lower lean body mass (Ernstgard et al 2003 Rademaker 2001)
Therefore in an attempt to remove the potential sex based bias of creatinine correction on
the concentrations of 1-APY secreted the ratio of the creatinine corrected TWA 1-APY
concentrations secreted after exposure to diesel exhaust (DE) and the creatinine corrected
TWA 1-APY concentrations secreted after exposure to clean air (CA) was calculated and
used as the study response measure in an attempt to cancel out the influence of the effect
of creatinine variation by sex
TWA 1-APYDETWA 1-APYCA = TWA 1-APY DECA = Relative Δ (Response measure)
Figure 51 Distribution of the TWA 1-APY DECA by Sex
TWA = Time Weighted Average
DECA = ratio of the TWA concentration of 1-Aminopyrene measured after DE exposure to the concentration of 1-Aminopyrene measures after CA exposure
Table 56 Mean TWA 1-APY DECA for All Subjects and by Sex 1-APY All Females Males
Mean 10128 19717 3184
SD 51879 79778 6710
Max 367375 367375 34150 Median 826 859 823
Min 004 057 004
Total 50 21 29
1-APY = 1 ndash Aminopyrene TWA = Time Weighted Average DECA = ratio of the TWA concentration of 1-APY measured after DE exposure
to the concentration of 1-APY measures after CA exposure
154
5310 Body Mass Index
Along the same lines another factor which also had the potential to skew the
results of the analysis was body mass index (BMI) Although it is not clear whether sex
has a causal association with BMI meaning that BMI is one mechanism by which sex
modifies health outcomes or whether BMI functions independent of sex BMI is still
known to vary by sex Therefore BMI was calculated using height and weight and was
then stratified by sex in order to evaluate the mean BMI by sex The mean BMI for
females (Mean = 2494 and SD = 552) and the mean BMI for males (Mean = 2541 and
SD = 320) were about the same for the study population so there was no need to control
for BMI in this analysis
54 Statistical Methods
Descriptive statistical analysis histograms and box plots were used to evaluate the
distribution of the variables The distribution of the response measure TWA 1-APY DECA
was right skewed and so the final variable on which all subsequent statistical analysis was
performed was log transformed (log TWA 1-APY DECA)
Table 57 Mean Log TWA 1-APY DECA 1-APY DECA All Females Males
Mean 210 236 191 SD 209 199 217
Max 821 821 583
Median 211 215 210 Min -330 -056 -330
Total 50 21 29
1-APY = 1 ndash Aminopyrene TWA = Time Weighted Average
DECA = log of the ratio of the TWA concentration of 1-APY measured after DE exposure to the concentration of 1-APY measures after CA exposure
155
Figure 52a Distribution of the Concentration of Log TWADECA by Sex
TWA = Time Weighted Average
Log DECA = log of the ratio of the TWA concentration of 1-Aminopyrene measured after
DE exposure to the concentration of 1-Aminopyrene measures after CA exposure
Figure 52b Box Plot of the Mean Concentration of Log TWA 1-APY DECA by Sex
1-APY = 1 ndash Aminopyrene TWA = Time Weighted Average
Log DECA = ratio of the TWA concentration of 1-Aminopyrene measured after DE exposure to the concentration of 1-Aminopyrene measures after CA exposure
Three one sample t-tests were done to confirm the main effect of diesel exhaust
exposure on the concentration of log TWA 1-APY DECA for all subjects (t-value = 710
156
df = 49 p lt 00001) within females (t-value = 544 df = 20 p lt 00001) and also within
males (t-value = 473 df = 28 p lt 00001) relative to clean air exposure
To address the first aim of the paper a analysis of variance (ANOVA) was
performed to determine if there was a significant difference in log TWA 1-APY DECA
concentrations between sex groups (male females) As mentioned before since some
subjects were also exposed to stress (a potential confounder) stress (stress no stress) was
initially included in the model to analyze the sexstresslsquo interaction The interaction was
not significant so stress was excluded and the final model that was used contained sex as
the independent classification variable and log TWA 1-APY DECA as the dependent
variable
To address the second aim of the paper a backward regression analysis was done
to determine if sex was the greatest predictor of log TWA 1-APY DECA excreted in urine
Based on similar studies that have been done so far age body mass index (BMI) pulse
respiration temperature and race were included as potential independent predictors along
with sex into the initial regression model with log TWA 1-APY DECA as the dependent
variable At each stage of the subsequent analysis the independent predictors that showed
the least contribution to the model were excluded from the model Leaving a final model
that contained only those independent predictors that were significant at the 010 level
For all tests where appropriate the variables were log transformed prior to analysis in
an attempt to give them a more normal distribution
All statistical analysis for this paper were done using SAS software Version 91
of the SAS System for Windows (SAS Institute Inc Cary NC USA) and SPSS software
157
Version 170 (SPSS inc Chicago IL) Also some graphs were created using Microsoft
Excel 2007 P-values less than or equal to 005 were considered to be significant
55 Results
551 Aim 1 Are there sex differences in urinary levels of 1-aminopyrene (Log TWA
1-APY DECA) post exposure to diesel exhaust
The ANOVA analysis showed no statistically significant difference (F value =
058 df = 1 48 p = 0452) between the mean log TWA 1-APY DECA concentrations for
females (236) and the mean log TWA 1-APY DECA concentrations for males (191)
Table 58 ANOVA Results
Source
Type III Sum of
Squares Df Mean Square F p-Value
Partial Eta
Squared
Corrected Model 254a 1 254 058 045 001
Intercept 22238 1 22238 5044 000 051
SEX 254 1 254 058 0452 001
Error 21162 48 441
Total 43464 50
Corrected Total 21416 49 a R Squared = 012 (Adjusted R Squared = -009)
Although not significant there was a sex difference in the mean TWA 1-APY
concentrations that were observed after exposure to diesel exhaust when compared to the
mean TWA 1-APY concentrations that were observed after exposure to clean air With
females showing about a 12 overall mean increase in TWA 1-APY excretion following
diesel exhaust exposure relative to clean air while males showed a very slight overall
mean increase in TWA 1-APY excretion of about 0004 following diesel exhaust
exposure relative to clean air
158
Figure 53 Mean TWA 1-APY Concentrations Secreted by Exposure and by Sex
159
552 Aim 2 Can sex predict urinary levels of 1-aminopyrene (Log TWA 1-APY
DECA) post exposure to diesel exhaust
At the 010 significance level none of the proposed predictor variables were
retained in the final regression model indicating that none of them (including sex) were
significant independent predictors of log TWA 1-APY DECA
Table 59 Summary of Backward Elimination Regression of TWA 1-APY DECA
Step
Variable
Removed
of Variables in
Model
Partial
R-Square
Model
R-Square
C(p)
F value
p Value
1 Age 6 000 015 614 014 071
2 Pulse 5 001 015 448 035 056
3 Sex 4 002 013 333 088 035
4 Respiration 3 002 011 233 105 031
5 Temperature 2 004 007 208 182 018
6 BMI 1 003 003 167 162 021
7 Race 0 003 000 124 158 022
56 Discussion
The most striking result of this study was the sex difference in the observed
concentrations of TWA 1-APY measured in urine after exposure to diesel exhaust
relative to clean air even though these observed differences were not statistically
significant This lack of significance between the sex groups may be due to the small
sample size of the two groups Most studies that have been done so far looking at urinary
levels of 1-APY in humans have been occupational exposure studies and these studies did
not look at sex differences as we did in this study so there is nothing to compare our
current findings to
Previously Ernstgard et al in 2003 looked at sex differences in the toxicokinetics
of m-Xylene under controlled environmental conditions and they found that overall males
had a significantly higher cumulative excretion of m-methyhippuric acid in urine (p =
0005) and that this was consistent with their higher net uptake of m-xylene They
concluded that the results indicated slight differences between women and men which
160
were consistent with anatomical sex differences and thus body size and body composition
(physical constitution) seemed to be more important determinants than sex in the
toxicokinetics of m-xylene
In this study we found opposite results with females showing about a 12 overall
mean increase in TWA 1-APY excretion following diesel exhaust exposure while males
showed a very slight overall mean increase of about 0004 (see Figure 3) Although
none of these observations were statistically significant they do highlight a trend of a sex
difference in the excretion of TWA 1-APY and indicate the possibility of an underlying
mechanism that may influence the metabolism of 1-nitropyrene by sex and not
anatomical differences If this trend that was observed by sex was due to anatomical
differences and males did indeed inhale a higher amount of DEPs than females then
based on the previous study by Ernstgard et al we would expect to see the opposite of
what we found with males excreting a larger amount of TWA 1-APY in urine than
females after exposure to diesel exhaust which was not the case in this study
The metabolism of 1-NP can occur via nitro-reduction or cytochrome P450
mediated ring oxidation (Silvers et al 1997 and Chae et al 1999) 1-APY is one of the
major nitro-reduction metabolites of 1-NP so the observed differences in the urinary
concentrations of 1-APY after diesel exhaust exposure between males and females could
indicate that females may metabolize 1-NP via nitro-reduction more actively than in
males where the oxidative metabolic pathways may be more active Since the urinary
concentration of the oxidative metabolites of 1-NP were not measured in this study it is
hard to definitively hypothesize if this is the case
161
561 Study Limitations
This possible trend needs to be studied with larger balanced populations
especially since the sample size used for this study was small and unbalanced A power
analysis using the observed mean and standard deviations of this study indicates that with
the study sample size (21 for females and 29 for males) the likelihood to detect a 5 sex
difference in urinary 1-aminopyrene is 012 This means that at the observed effect size
(022) a total sample size of 514 subjects will be needed to achieve an acceptable power
of 070 to detect sex differences in urinary 1-aminopyrene excretion
Also since creatinine excretion is influenced by muscle mass (Masi et al 2004) a
different method for correcting for dilution of the urine samples should be used instead of
creatinine when looking at sex differences because muscle mass is also influenced by sex
and thus the use of creatinine correction in such a study could potentially lead to the
skewing of the data
In addition a potential source of error that was not investigated was the potential
additional exposure of subjects to DEPs or 1-nitropyrene outside of the exposure chamber
during their diverse daily activities This might be a potential source of error as indicated
by both the baseline pre-exposure levels of 1-APY and also the within subject variability
in the 1-AP secreted after exposure to diesel exhaust and clean air
Lastly there is the possibility that the length and intensity of the study exposure
was not adequate enough to produce statistically significant changes
162
57 Conclusions
Although not statistically significant the results of this study showed a trend of a
difference by sex in the metabolism of 1-NP following acute exposure to diesel exhaust
relative to clean air as indicated by differences in the urinary concentrations of TWA 1-
APY between males and females after exposure to diesel exhaust relative to clean air
Females tended to secrete a higher concentration of TWA 1-APY after diesel exhaust
exposure relative to clean air exposure than males This observation was not statistically
significant however the results suggest that females may metabolize 1-nitropyrene via
nitro-reduction more actively than males
163
Appendix D
Table D1 One Sample t-test results of Log TWA 1-APY by Stress for All Subjects and also by Sex
Log TWA 1-APY DECA Mean SE t Value p-Value
All -004 060 -007 095
F -109 091 -119 024
M 045 083 054 059
Figure D1 Profile Plot of Log TWA 1-APY by Stress for All Subjects and also by Sex
Sex Stress Mean SE
F N 200 056
Y 309 080
M N 217 061
Y 172 051
164
References
American Conference of Government Industrial Hygienists Threshold Limit
Values for Chemical Substances and Physical Agents and Biological Exposure
Indices Cincinnati American Conference of Government Industrial Hygienists
1999
Anderson GD 2008 Chapter 1 Gender Differences in Pharmacological Response
International Review of Neurobiology 83 pg 1-10
Barr DB Wilder LC Caudill SP Gonzalez AJ Needham LL and Pirkle JL
2005 Urinary Creatinine Concentrations in the US Population Implications for
Urinary Biologic Monitoring Measurements Environmental Health Perspectives
113 pg 192-200
Beierle I Meibohm B and Derendorf H 1999 Gender Differences in
Pharmacokinetics and Pharmacodynamics International Journal of Clinical
Pharmacology and Therapeutics 37 pg 529-547
California Environmental Protection Agency Office of Environmental Health
Hazard Assessment Air Toxicology and Epidemiology Section Part B Health Risk
Assessment for Diesel Exhaust
Carrieri M Trevisan A and Battista GB 2001 Adjustment to concentration-
dilution of spot urine samples correlation between specific gravity and Creatinine
International Archives of Occupational and Environmental Health 74 pg 63 ndash pg
67
Casarett and Doulllsquos 2001 Toxicology The Basic Science of Poisons 6th
Edition
New York McGraw-Hill pg 159-194
Chae YH Thomas T Guengerich P Fu PP and El-Bayoumy K 1999
Comparative Metabolism of 1- 2- and 4-Nitropyrene by Human Hepatic and
Pulmonary Microsomes Cancer Research 59 pg 1473-1480
Ersntgard L Sjogren B Warholm M and Johanson G 2003 Sex differences in
toxicokinetics of inhaled solvent vapors in humans 1 m-Xylene Toxicology and
Applied Pharmacology 193 pg 147-157
Faul F and Erdfelder E 1992 GPower A priori Post-hoc and Compromise Power
Analysis for MS DOS [Computer Program] Bonn FRG Bonn University
Department of Psychology
Graphpad 2007
Gochfeld M 2007 Framework for Gender Differences in Human and Animal
Toxicology Environmental Research 104 pg 4-21
165
Laumbach R Tong J Zhang L Ohman-Strickland P Stern A Fiedler N Kipen
H Kelly-McNeil K Lioy P and Zhang J 2009 Quantification of 1-Aminopyrene
in Human Urine After a Controlled Exposure to Diesel Exhaust Journal of
Environmental Monitoring 11 pg 153-159
Masi CM Rickett EM Hawkley LC and Cacioppo JT 2004 Gender
Differences in Urinary Stress Hormones The population-based Chicago Health
Aging and Social Relations Study Journal of Applied Physiology 97 pg 941-947
Meeting of the California Environmental Contaminant Biomonitoring Program
(CECBP) Scientific Guidance Panel (SGP) 2008 Diesel Exhaust
National Toxicology Program Toxicity Report Series Number 34 1-Nitropyrene
Administered by Inhalation to F344N Rats NIH Publication 96-3383 1996
Nermell B Lindberg AL Rahman M Berglund M Persson LA Arifeen SE
and Vahter M 2008 Urinary Arsenic Concentration Adjustment Factors and
Malnutrition Environmental Research 106 pg 212-218
Nielsen PS Andreassen A Farmer PB Ovrebo S and Autrup H 1996
Biomonitoring of Diesel Exhaust-Exposed Workers DNA and Hemoglobin
Adducts and Urinary 1-Hydroxypyrene as Markers of Exposure Toxicology
Letters 86 pg 27-37
Rademaker M 2001 Do Women Have More Adverse Drug Reactions American
Journal of Clinical Dermatology 2 pg 349-351
Relling MV Lin JS Ayers GD and Evans WE 1992 Racial and gender differences
in N-acetyltransferase xanthine oxidase and CYP1A2 activities Clinical
Pharmacology and Therapeutics 52 pg 643 ndash 58
Riedl M and Diaz-Sanchez D 2005 Biology of diesel exhaust effects on
respiratory function Journal of Allergy and Clinical Immunology 115 pg 221-8
Saito K Kamataki T and Kato R 1984 Participation of Cytochrome P-450 in
Reductive Metabolism of 1-Nitropyrene by Rat Liver Microsomes Cancer
Research 44 pg 3169-3173
Silvers KJ Eddy EP McCoy EC Rosenkranz HS and Howard PC 1994
Pathways for the Mutagenesis of 1-Nitropyrene and Dinitropyrenes in the Human
Hepatoma Cell Line HepG2 Environmental Health Perspectives 102 pg 195-200
Silvers KJ Couch LH Rorke EA and Howard PC 1997 Role of nitroreductases but
not cytochromes P450 in the metabolic activation of 1-nitropyrene in the HepG2
human hepatoblastoma cell line Biochemical Pharmacology 54 pg 927 ndash 936
166
Toriba A Kitaoka H Dills RL Mizukami S Tanabe K Takeuchi N Ueno M
Kameda T Tang N Hayakawa k and Simpson CD 2007 Identification and
Quantification of 1-Nitropyrene Metabolites in Human Urine as a Proposed
Biomarker for Exposure to Diesel Exhaust Chemical Research in Toxicology 20
pg 99-1007
US Environmental Protection Agency (EPA) (2002) Health assessment document
for diesel engine exhaust Prepared by the National Center for Environmental
Assessment Washington DC for the Office of Transportation and Air Quality
EPA6008-90057F Available from National Technical Information Service
Springfield VA PB2002-107661 and lthttpwwwepagovnceagt
World Health Organization (WHO) 2003 Environmental Health Criteria 229
Selected Nitro- And Nitrooxy-Polycyclic Aromatic Hydrocarbons
167
Chapter 6
Summary Implications and Future Research Directions
168
61 Summary of Results
611 Local Immune and Inflammatory Responses
612 Systemic and acute Phase Reactions
613 Self Reported Symptoms
614 Metabolism of 1-Nitropyrene
615 Integration of Study Results
62 Implications
63 Future Research Directions
64 Uncertainties
169
61 Summary of Results
The findings from this study on sex differences in response to acute exposure to
300microgm3 of diesel exhaust in a controlled environment can be summarized as follows
611 Local Airway Immune and Inflammatory Responses
In nasal lavage significant sex differences were observed in tumor necrosis factor
ndash α concentrations with males having a mean higher concentration than females
twenty four hours after diesel exhaust exposure relative to clean air Although not
significant males also tended to have higher mean concentrations of other upper
airway inflammatory markers than females twenty four hours after diesel exhaust
exposure relative to clean air
In sputum it was observed that females tended to have mean higher
concentrations of lower airway inflammatory markers eg tumor necrosis factor ndash
α and interleukin 6 than males six hours after exposure to diesel exhaust relative
to clean air None of these observations were statistically significant
The observed differences in the sites of the suggested inflammatory response
between males and females could indicate that males are more sensitive to the
effects of the fine particles of diesel exhaust which tend to deposit in the upper
airways while females are more sensitive to the effects of the ultra fine particles
of diesel exhaust which tend to deposit in the lungs
612 Systemic and Acute Phase Reactions
There was a statistically significant effect of sex on platelet count Six hours after
exposure to diesel exhaust there was a statistically significant difference in
170
platelet count levels between males and females with males showing a mean
decrease in platelet count following exposure to diesel exhaust relative to clean
air after subtracting baseline counts compared to an observed mean increase in
platelet count in females
Within males twenty four hours after exposure to diesel exhaust there was a
statistically significant mean decrease in platelet count relative to clean air
The rest of the systemic and acute phase response markers showed a mixed
response trend with no clear cut significant sex difference
613 Self reported Symptoms
There was a statistically significant effect of sex on self reported somatic and
lower respiratory symptoms severity ratings with females tending to have higher
mean severity ratings than males after exposure to diesel exhaust relative to clean
air after subtracting baseline severity ratings
Although not statistically significant mean acute phase reaction and anxiety
symptoms severity ratings tended to be higher in females than in males following
exposure to diesel exhaust relative to clean air after subtracting baseline severity
ratings
General symptoms were observed to show an opposite trend with males tending to
have higher mean symptom severity ratings than females following exposure to
diesel exhaust relative to clean air after subtracting baseline severity ratings This
observation was not statistically significant
171
614 Metabolism of 1-Nitropyrene
Sex differences were observed in the time weighted average urinary concentration
of 1-aminopyrene following exposure to diesel exhaust relative to clean air
Females had a higher mean increase in the time weighted average urinary
concentration of 1-aminopyrene than males However this observed difference
was not statistically significant
Despite the above observation using a backward regression analysis model sex
did not appear to be a significant predictor of the time weighted average urinary
concentration of 1-aminopyrene
615 Integration of Study Results
Overall the observations of this study were in the direction of the study
hypothesis with females appearing to be more sensitive to the effect of inhaled diesel
exhaust (ultra fine) particles than males as hypothesized Upon exposure to diesel exhaust
females had a stronger inflammatory response in the lower airway (as suggested by the
observed cytokine concentrations in sputum which were not statistically significant) This
was accompanied by a stronger systemic inflammatory response in females (as indicated
by the significant sex difference in platelet counts at 6 hours) and a reporting of higher
symptom severity ratings by females (as indicated by the significant sex difference in
somatic and lower respiratory symptom severity ratings)
Also as hypothesized there was an observed difference by sex in the
concentration of 1-aminopyrene in urine with females tending to secrete more 1-
aminopyrene in urine than males Although this observation was not statistically
172
significant it does suggest that the nitro-reduction metabolic pathway is may be more
active in females than in males
Contrary to the study hypothesis males had a stronger inflammatory response in
the upper airway (as indicated by the significant increase in TNF-α concentrations in the
nasal lavage of males compared to a decrease in females) This could highlight the fact
that males may be more sensitive to the effects of inhaled diesel exhaust (fine) particles
in the upper airway
62 Implications
Although not all the sex differences observed in this study were statistically
significant they do have important research and clinical implications
The study observations suggest that there may be a sex difference in the
toxicokinetics of diesel exhaust This means that for a similar exposure event the
difference in the internal physiology of females and males due to sex could cause a
difference in the toxicological profile and effect of diesel exhaust ultimately affecting
which symptoms appear or fail to appear
This potential sex driven difference in the toxicokinetics of diesel exhaust was
highlighted by the following significant study findings
The fact that TNF-α concentrations in nasal lavage and platelet counts in blood
were significantly different between males and females
The fact that somatic and lower respiratory symptoms were significantly different
between males and females
173
The research implications of this potential sex driven difference in the
toxicokinetics of diesel exhaust include the following areas
Subject Selection ndash Depending on the subject composition by sex in an
experimental study looking at diesel exhaust inducible physiological effects the
results have the potential to be underestimated or overestimated if this sex driven
difference in the toxicokinetics diesel exhaust holds true
Diesel Exhaust Composition ndash Variations in the particle size composition of
diesel exhaust used in studies may lead to differences in the observed effects due
to the suggested sensitivity of males to fine particles and females to ultra fine
particles of diesel exhaust
Biomarkers ndash If there is a difference by sex in the metabolic pathways used to
metabolize 1-nitropyrene then this could lead to variations in the urinary
concentration of 1-nitropyrene metabolites and so this has to be taken into
consideration when trying to select an appropriate biomarker of exposure to diesel
exhaust based on 1-nitropyrene metabolites
Health Assessment Tools ndash With respect to self reported health symptoms since
there may be a sex difference in the types and severity of symptoms reported after
diesel exhaust exposure which may be linked to the proposed sex driven
difference in the toxicokinetics of diesel exhaust it is important to consider sex
when planning to use self reported symptom questionnaires as a data collection
tool in the analysis of diesel exhaust attributable health effects
174
Overall regarding research the observations from this study provides further support for
not just controlling for sex as has been historically done in environmental exposure
studies but actually including sex as part of the analysis
The clinical implication of the observed tendency of females in this study to
generally report higher symptom severity ratings than males after a controlled exposure
to the same external concentrations of diesel exhaust could indicate that females may be
more physiologically sensitive to diesel exhaust exposure and thus females may be more
susceptible to diesel exhaust exposure
Along those lines the public health implications of the females potentially being
more physiologically sensitive to diesel exhaust exposure include the following areas
Risk Assessment ndash If this hypothesis holds true then female as a whole (not just
pregnant women) may be another sensitive population that has to be considered
when risk assessments of environmental pollutants like diesel exhaust are done
especially with regards to occupational settings and exposure
Policy Measures ndash Also the standard inter-individual uncertainty factor of 10
used to come up with acceptable exposure levels of environmental air pollutants
like diesel exhaust may not be protective enough if females really are more
sensitive than males This means that an additional uncertainty factor may need to
be used but more data is needed which would provide more evidence in support of
this potential sex difference as well as provide more information about the
potential magnitude of variation in the response of females compared to males
These data are needed for the proper evaluation of whether the current uncertainty
factors that are used are adequate
175
63 Future Research Directions
More studies should be done using larger and balanced sample sizes to try to
further elucidate the possible sex differences in response to diesel exhaust exposure that
was suggested by this study
Further research on the pro-inflammatory nature of diesel exhaust should take into
account the possible sex difference in the sensitivity and toxicokinetics of diesel
exhaust during study design
Also other possible non-study related environmental exposures to diesel exhaust
should be controlled for if feasible in order to prevent the potential confounding
of results
Studies should be done to help clarify the potential mechanism involved in the
diesel exhaust attributable reduction in platelet count that was observed in males
in this study versus an observed increase in females
Studies should be done to further evaluate the sex difference in somatic and lower
respiratory symptoms that were seen in this study to see how the individual
symptoms that make up the two symptom categories (somatic and lower
respiratory) vary between males and females
Studies should also be done to see if these self reported somatic and lower
respiratory health symptom cans be correlated with other objective physiological
measures of diesel exhaust induced health effects
Lastly a study should be done to look at the concentrations of the major
metabolites of oxidation and reduction of diesel exhaust in order to ascertain
whether there are sex differences in the concentration of metabolites based on the
176
metabolic pathway used This will help to better understand if there is a difference
by sex in the metabolic pathways that are activated upon diesel exhaust exposure
and if these are correlated with sex linked genetic polymorphisms This could
possibly have important ramifications for the selection of biomarkers of exposure
to diesel exhaust
64 Uncertainties
There are some uncertainties regarding the study design and the mechanism of
diesel exhaust toxicity that has to be kept in mind when reviewing and interpreting the
results and observations of this study These include the following
Since the study subjects consisted of volunteers there is the possibility that only
those people who were not bothered by diesel exhaust participated in the study If
true this would introduce a possible selection bias into the study and might
account for the greater number of males in the study than females (64 versus 36
respectively) especially if females are more sensitive to effects of diesel exhaust
and so are not as willing to volunteer for such studies Therefore the results of the
study may be different if conducted in a different population
The composition of diesel exhaust may not be similar to those used in other
studies Therefore this has to be considered when comparing the effect seen in this
study to those seen in other studies
Despite all the studies that have been done so far there is still a general lack of
consensus about the underlying mechanism by which diesel exhaust causes the
health effects that have been observed Although this study is based on the
hypothesis of diesel exhaust induced inflammation related health effects there is
177
also the possibility that the observed health effects could be due to the direct
systemic effect of translocated diesel exhaust particles which has also been
hypothesized as a potential mechanism of diesel exhaust toxicity
The effects of diesel exhaust could be additive or synergistic depending on
whether its exposure is simultaneous with other air pollutants (USEPA HAD
2002)
The toxicity of diesel exhaust is not only dependent on individual physiology but
also on the individual internal exposure which is a function of both the variable
concentration of diesel exhaust in the environment and the individual breathing
and particle retention patterns (USEPA HAD 2002)
Lastly since this is an exploratory study we chose not to correct for multiple
comparisons but this is still a potential issue and so the results from this study
should be interpreted with caution
178
Curriculum Vitae
Chizoba U Nwankwo
EDUCATION
2005 ndash 2010 University of Medicine and Dentistry of New Jersey School of
Public Health Piscataway NJ
PhD in Public Health
2002 ndash 2004 University of Medicine and Dentistry of New Jersey School of
Public Health Piscataway NJ
MPH in Public Health
2000 ndash 2002 Rutgers University Newark NJ
MS in Biology
1995 ndash 1999 Rutgers University New Brunswick NJ
BA Biology
EXPERIENCE
2006 ndash 2009 University of Medicine and Dentistry of New Jersey Piscataway NJ
Research Teaching Assistant
2005 ndash 2006 GlaxoSmithKline Parsippany NJ
Asset Manager Analyst
2002 ndash 2005 GlaxoSmithKline Parsippany NJ
Data Management Coordinator
2001 ndash 2002 GlaxoSmithKline Parsippany NJ
Consultant Data Entry Manager
2000 ndash 2001 GlaxoSmithKline Parsippany NJ
Consultant Clinical Data Associate

ii
ABSTRACT OF THE DISSERTATION
Sex Differences in Response to Acute Diesel Exhaust Exposure
By Chizoba Nwankwo
Dissertation Directors
Dr Junfeng (Jim) Zhang
And
Dr Nancy Fiedler
Introduction Diesel exhaust is ubiquitous and has been shown to cause a variety of
health effects related to innate immune response in the airways that leads to a cascade of
local and systemic health effects Sex is known to influence variations in immune
responses and many other aspects of the internal physiological environment
Aims The primary aim of this dissertation research is to evaluate whether there are sex
differences in the symptomatic local and systemic inflammation and acute-phase
responses that have been attributed to acute diesel exhaust exposure The secondary aim
is to see if sex differences exist in the rates of metabolism of diesel exhaust and its
metabolites
Methods In a crossover design study healthy subjects were exposed to 300microgm3 of
diesel exhaust and clean air for 1 hour each in a controlled environmental exposure
chamber on two different days (ge1 week washout) in random order Nasal lavage and
sputum samples were collected and analyzed for cytokines and soluble proteins in
relation to local inflammation Blood samples were collected and analyzed for cytokines
acute phase reaction proteins neutrophils and cell blood counts in relation to systemic
inflammation Questionnaires were used to collect self-reported symptoms Spot urine
iii
samples were collected within 24 hours of exposure to analyze the levels of 1-
aminopyrene a metabolite of 1-nitropyrene which is the most abundant nitro-polycyclic
aromatic hydrocarbons in diesel exhaust
Results There was a statistically significant sex difference in self reported somatic and
lower respiratory symptom severity ratings with females having higher symptom severity
ratings than males after exposure to diesel exhaust relative to clean air There was also a
statistically significant sex difference in the concentration of tumor necrosis factor ndash α in
nasal lavage samples and platelet count in peripheral blood with males having higher
tumor necrosis factor ndash α concentrations than females and lower platelet counts than
females after exposure to diesel exhaust relative to clean air
Conclusion Sex is a significant effect modifier for certain health effects of acute diesel
exhaust exposure with females tending to show greater lower respiratory and systemic
effects and males tending to show greater upper respiratory effects
iv
Acknowledgement
It gives me great pleasure to thank all those who made this dissertation possible
by providing me with strength wisdom moral and financial support throughout the entire
process
I would like to express the deepest appreciation to my committee chairs Dr
Junfeng (Jim) Zhang and Dr Nancy Fiedler Without their combined guidance and their
available and persistent help this dissertation would not have been possible
I would like to thank Dr Pamela Ohman-Strickland for her time and patience in
providing me with the knowledge and help that I needed to successfully conduct and
interpret the required statistical analysis I am very grateful to Dr Mark Robson for all
his constant support and encouragement throughout the entire project I would also like to
thank my other committee members Dr Alan Stern and Dr Robert Laumbach for their
insightful critique and comments on my dissertation
I would like acknowledge the staff at the Environmental and Occupational Health
Sciences Institute for all the help that they provided to me with the creation of the
datasets that were used In addition I would like to thank the student members of my
doctoral journal club for their friendship and support
I would like to sincerely thank my family for all their tremendous love
encouragement support and all the sacrifices that they made on my behalf to help me to
successfully complete my dissertation
Lastly I offer my regards and blessings to all of those who supported me in any
respect during the completion of the project
v
Dedication
To My Wonderful Family
vi
Table of Contents
Abstract helliphelliphelliphelliphelliphelliphelliphelliphelliphelliphelliphelliphelliphelliphelliphelliphelliphelliphelliphelliphelliphelliphelliphelliphelliphelliphelliphelliphelliphelliphellip ii
Acknowledgement helliphelliphelliphelliphelliphelliphelliphelliphelliphelliphelliphelliphelliphelliphelliphelliphelliphelliphelliphelliphelliphelliphelliphelliphelliphellip iv
Dedication helliphelliphelliphelliphelliphelliphelliphelliphelliphelliphelliphelliphelliphelliphelliphelliphelliphelliphelliphelliphelliphelliphelliphelliphelliphelliphelliphelliphelliphellip v
1 Introduction helliphelliphelliphelliphelliphelliphelliphelliphelliphelliphelliphelliphelliphelliphelliphelliphelliphelliphelliphelliphelliphelliphelliphelliphelliphelliphelliphellip 1
11 Background helliphelliphelliphelliphelliphelliphelliphelliphelliphelliphelliphelliphelliphelliphelliphelliphelliphelliphelliphelliphelliphelliphellip 4
12 Diesel Exhaust helliphelliphelliphelliphelliphelliphelliphelliphelliphelliphelliphelliphelliphelliphelliphelliphelliphelliphelliphelliphelliphelliphelliphellip 5
121 Exposure to Diesel Exhaust helliphelliphelliphelliphelliphelliphelliphelliphelliphelliphelliphelliphelliphelliphellip 5
122 Composition of Diesel Exhaust helliphelliphelliphelliphelliphelliphelliphelliphelliphelliphelliphelliphelliphellip 6
123 Overall Health Effects of Diesel Exhaust helliphelliphelliphelliphelliphelliphelliphelliphelliphellip 7
124 Hypothesized Mechanisms of Diesel Exhaust Induced Health Effects
helliphelliphelliphelliphelliphelliphelliphelliphelliphelliphelliphelliphelliphelliphelliphelliphelliphelliphelliphelliphelliphelliphelliphelliphelliphelliphelliphelliphellip 8
125 Diesel Exhaust and Cytokine Release helliphelliphelliphelliphelliphelliphelliphelliphelliphelliphellip 10
126 Diesel Exhaust and Oxidative Stress helliphelliphelliphelliphelliphelliphelliphelliphelliphelliphellip 11
127 Respiratory and Cardiovascular Effects of Diesel Exhaust Exposure
helliphelliphelliphelliphelliphelliphelliphelliphelliphelliphelliphelliphelliphelliphelliphelliphelliphelliphelliphelliphelliphelliphelliphelliphelliphelliphelliphellip 13
13 Sex helliphelliphelliphelliphelliphelliphelliphelliphelliphelliphelliphelliphelliphelliphelliphelliphelliphelliphelliphelliphelliphelliphelliphelliphelliphelliphelliphellip 14
131 Definition of Sex and Gender helliphelliphelliphelliphelliphelliphelliphelliphelliphelliphelliphelliphelliphellip 14
132 Sex and Toxicity helliphelliphelliphelliphelliphelliphelliphelliphelliphelliphelliphelliphelliphelliphelliphelliphelliphelliphellip 16
133 Sex and the Effects of Diesel Exhaust Exposure helliphelliphelliphelliphelliphelliphellip 17
134 Sex and the Metabolism of Diesel Exhaust helliphelliphelliphelliphelliphelliphelliphellip 18
1341 1-Nitropyrene helliphelliphelliphelliphelliphellip 18
1342 Sex and the Metabolism of 1-Nitropyrene helliphelliphelliphelliphellip 20
vii
14 Dissertation Research helliphelliphelliphelliphelliphelliphelliphelliphelliphelliphelliphelliphelliphelliphelliphelliphelliphelliphelliphelliphellip 20
141 Aims helliphelliphelliphelliphelliphelliphelliphelliphelliphelliphelliphelliphelliphelliphelliphelliphelliphelliphelliphelliphelliphelliphelliphellip 20
15 Research Design and Data helliphelliphelliphelliphelliphelliphelliphelliphelliphelliphelliphelliphelliphelliphelliphelliphelliphellip 21
151 Data Collection helliphelliphelliphelliphelliphelliphelliphelliphelliphelliphelliphelliphelliphelliphelliphelliphelliphelliphellip 21
152 Original Study Data helliphelliphelliphelliphelliphelliphelliphelliphelliphelliphelliphelliphelliphelliphelliphelliphellip 21
153 Subjects Demographic Data helliphelliphelliphelliphelliphelliphelliphelliphelliphelliphelliphelliphelliphelliphellip 23
16 Hypothesis and research Questions helliphelliphelliphelliphelliphelliphelliphelliphelliphelliphelliphelliphelliphelliphellip 24
161 Overall Hypothesis helliphelliphelliphelliphelliphelliphelliphelliphelliphelliphelliphelliphelliphelliphelliphelliphelliphellip 24
162 Research Question 1 helliphelliphelliphelliphelliphelliphelliphelliphelliphelliphelliphelliphelliphelliphelliphelliphellip 25
163 Research Question 2 helliphelliphelliphelliphelliphelliphelliphelliphelliphelliphelliphelliphelliphelliphelliphelliphellip 26
164 Research Question 3 helliphelliphelliphelliphelliphelliphelliphelliphelliphelliphelliphelliphelliphelliphelliphelliphellip 26
165 Research Question 4 helliphelliphelliphelliphelliphelliphelliphelliphelliphelliphelliphelliphelliphelliphelliphelliphellip 27
References helliphelliphelliphelliphelliphelliphelliphelliphelliphelliphelliphelliphelliphelliphelliphelliphelliphelliphelliphelliphelliphelliphelliphelliphelliphelliphellip 28
2 Analysis of Sex Differences in Acute Diesel Exhaust Exposure Induced Airway
Inflammatory Response helliphelliphelliphelliphelliphelliphelliphelliphelliphelliphelliphelliphelliphelliphelliphelliphelliphelliphelliphelliphelliphellip 34
21 Abstract helliphelliphelliphelliphelliphelliphelliphelliphelliphelliphelliphelliphelliphelliphelliphelliphelliphelliphelliphelliphelliphelliphelliphelliphelliphellip 34
22 Introduction helliphelliphelliphelliphelliphelliphelliphelliphelliphelliphelliphelliphelliphelliphelliphelliphelliphelliphelliphelliphelliphelliphelliphelliphellip 34
23 Toxicokinetics of Diesel Exhaust in Human Nasal and Airway Passages 35
231 Hypothesized Mechanism of Adverse Reaction to Inhaled Diesel
Exhaust helliphelliphelliphelliphelliphelliphelliphelliphelliphelliphelliphelliphelliphelliphelliphelliphelliphelliphelliphelliphelliphelliphellip 36
24 Nasal Lavage and Sputum Induction Studies helliphelliphelliphelliphelliphelliphelliphelliphelliphelliphellip 38
25 Sex Differences in Innate Immune Response helliphelliphelliphelliphelliphelliphelliphelliphelliphelliphelliphellip 39
26 Materials and Methods helliphelliphelliphelliphelliphelliphelliphelliphelliphelliphelliphelliphelliphelliphelliphelliphelliphelliphelliphellip 41
261 Data Collection helliphelliphelliphelliphelliphelliphelliphelliphelliphelliphelliphelliphelliphelliphelliphelliphelliphelliphellip 41
viii
262 Subjects Demographic Data helliphelliphelliphelliphelliphelliphelliphelliphelliphelliphelliphelliphelliphelliphellip 41
263 Exposure Conditions and Experimental Design helliphelliphelliphelliphelliphellip 42
264 Nasal Lavage Sample Collection helliphelliphelliphelliphelliphelliphelliphelliphelliphelliphelliphelliphellip 43
265 Nasal Lavage Sample Analysis helliphelliphelliphelliphelliphelliphelliphelliphelliphelliphelliphelliphellip 43
266 Sputum Sample Collection helliphelliphelliphelliphelliphelliphelliphelliphelliphelliphelliphelliphelliphelliphellip 43
267 Sputum Sample analysis helliphelliphelliphelliphelliphelliphelliphelliphelliphelliphelliphelliphelliphelliphellip 44
268 Airway Markers of Inflammation helliphelliphelliphelliphelliphelliphelliphelliphelliphelliphelliphellip 45
27 Statistical Methods helliphelliphelliphelliphelliphelliphelliphelliphelliphelliphelliphelliphelliphelliphelliphelliphelliphelliphelliphelliphellip 46
271 Calculation of Response Measure helliphelliphelliphelliphelliphelliphelliphelliphelliphelliphelliphellip 46
28 Results helliphelliphelliphelliphelliphelliphelliphelliphelliphelliphelliphelliphelliphelliphelliphelliphelliphelliphelliphelliphelliphelliphelliphelliphelliphelliphellip 48
281 Study Aim Interaction Effect of Diesel Exhaust Exposure and Sex
helliphelliphelliphelliphelliphelliphelliphelliphelliphelliphelliphelliphelliphelliphelliphelliphelliphelliphelliphelliphelliphelliphelliphelliphelliphelliphelliphellip 48
29 Discussion helliphelliphelliphelliphelliphelliphelliphelliphelliphelliphelliphelliphelliphelliphelliphelliphelliphelliphelliphelliphelliphelliphelliphelliphellip 51
291 Study Limitations helliphelliphelliphelliphelliphelliphelliphelliphelliphelliphelliphelliphelliphelliphelliphelliphelliphelliphellip 55
210 Conclusions helliphelliphelliphelliphelliphelliphelliphelliphelliphelliphelliphelliphelliphelliphelliphelliphelliphelliphelliphelliphelliphelliphelliphellip 56
Appendix A helliphelliphelliphelliphelliphelliphelliphelliphelliphelliphelliphelliphelliphelliphelliphelliphelliphelliphelliphelliphelliphelliphelliphelliphelliphellip 57
References helliphelliphelliphelliphelliphelliphelliphelliphelliphelliphelliphelliphelliphelliphelliphelliphelliphelliphelliphelliphelliphelliphelliphelliphelliphelliphellip 61
3 Analysis of Sex Differences in Systemic Inflammation and Acute Phase response
Markers after Acute Exposure to Diesel Exhaust helliphelliphelliphelliphelliphelliphelliphelliphelliphelliphelliphellip 64
31 Abstract helliphelliphelliphelliphelliphelliphelliphelliphelliphelliphelliphelliphelliphelliphelliphelliphelliphelliphelliphelliphelliphelliphelliphelliphellip 66
32 Introduction helliphelliphelliphelliphelliphelliphelliphelliphelliphelliphelliphelliphelliphelliphelliphelliphelliphelliphelliphelliphelliphelliphelliphelliphellip 66
321 Cytokines helliphelliphelliphelliphelliphelliphelliphelliphelliphelliphelliphelliphelliphelliphelliphelliphelliphelliphelliphelliphellip 67
322 Acute Phase Response helliphelliphelliphelliphelliphelliphelliphelliphelliphelliphelliphelliphelliphelliphelliphellip 68
323 Platelets and Other Blood Cells helliphelliphelliphelliphelliphelliphelliphelliphelliphelliphelliphelliphellip 68
ix
324 Sex Differences in Immune Response helliphelliphelliphelliphelliphelliphelliphelliphelliphelliphellip 69
33 Materials and Methods helliphelliphelliphelliphelliphelliphelliphelliphelliphelliphelliphelliphelliphelliphelliphelliphelliphelliphelliphellip 70
331 Data Collection helliphelliphelliphelliphelliphelliphelliphelliphelliphelliphelliphelliphelliphelliphelliphelliphelliphelliphellip 70
332 Subjects Demographic Data helliphelliphelliphelliphelliphelliphelliphelliphelliphelliphelliphelliphelliphelliphellip 71
333 Exposure Conditions and Experimental Design helliphelliphelliphelliphelliphellip 72
334 Systemic Inflammation and Acute Phase Response Markers hellip 73
335 Blood Sample Collection helliphelliphelliphelliphelliphelliphelliphelliphelliphelliphelliphelliphelliphelliphellip 73
336 Blood Sample Analysis helliphelliphelliphelliphelliphelliphelliphelliphelliphelliphelliphelliphelliphelliphelliphellip 73
34 Statistical Methods helliphelliphelliphelliphelliphelliphelliphelliphelliphelliphelliphelliphelliphelliphelliphelliphelliphelliphelliphelliphellip 73
35 Results helliphelliphelliphelliphelliphelliphelliphelliphelliphelliphelliphelliphelliphelliphelliphelliphelliphelliphelliphelliphelliphelliphelliphelliphelliphelliphellip 75
36 Discussion helliphelliphelliphelliphelliphelliphelliphelliphelliphelliphelliphelliphelliphelliphelliphelliphelliphelliphelliphelliphelliphelliphelliphelliphellip 81
361 Study Limitations helliphelliphelliphelliphelliphelliphelliphelliphelliphelliphelliphelliphelliphelliphelliphelliphelliphelliphellip 86
37 Conclusions helliphelliphelliphelliphelliphelliphelliphelliphelliphelliphelliphelliphelliphelliphelliphelliphelliphelliphelliphelliphelliphelliphelliphelliphellip 87
Appendix B helliphelliphelliphelliphelliphelliphelliphelliphelliphelliphelliphelliphelliphelliphelliphelliphelliphelliphelliphelliphelliphelliphelliphelliphelliphellip 89
References 94
4 Analysis of Sex Differences in Self Reported Symptoms after Acute Exposure to
Diesel Exhaust helliphelliphelliphelliphelliphelliphelliphelliphelliphelliphelliphelliphelliphelliphelliphelliphelliphelliphelliphelliphelliphelliphelliphelliphelliphelliphellip 99
41 Abstract helliphelliphelliphelliphelliphelliphelliphelliphelliphelliphelliphelliphelliphelliphelliphelliphelliphelliphelliphelliphelliphelliphelliphelliphelliphellip 101
42 Introduction helliphelliphelliphelliphelliphelliphelliphelliphelliphelliphelliphelliphelliphelliphelliphelliphelliphelliphelliphelliphelliphelliphelliphellip 101
421 Symptoms of Diesel Exhaust Exposure helliphelliphelliphelliphelliphelliphelliphelliphelliphellip 102
422 Sex Gender and Symptoms helliphelliphelliphelliphelliphelliphelliphelliphelliphelliphelliphelliphelliphellip 103
423 Sex and Respiratory Related Symptoms helliphelliphelliphelliphelliphelliphelliphelliphellip 105
43 Materials and Methods helliphelliphelliphelliphelliphelliphelliphelliphelliphelliphelliphelliphelliphelliphelliphelliphelliphelliphelliphellip 107
431 Data Collection helliphelliphelliphelliphelliphelliphelliphelliphelliphelliphelliphelliphelliphelliphelliphelliphelliphelliphellip 107
x
432 Exposure Conditions and Experimental Design helliphelliphelliphelliphelliphellip 107
433 Subject Selection and Demographic Data helliphelliphelliphelliphelliphelliphelliphelliphellip 108
434 Symptom Questionnaire helliphelliphelliphelliphelliphelliphelliphelliphelliphelliphelliphelliphelliphelliphelliphellip 109
435 Questionnaire Administration Protocol helliphelliphelliphelliphelliphelliphelliphelliphellip 110
44 Statistical Methods helliphelliphelliphelliphelliphelliphelliphelliphelliphelliphelliphelliphelliphelliphelliphelliphelliphelliphelliphelliphellip 110
441 Calculation of Response Measures helliphelliphelliphelliphelliphelliphelliphelliphelliphelliphellip 111
45 Results helliphelliphelliphelliphelliphelliphelliphelliphelliphelliphelliphelliphelliphelliphelliphelliphelliphelliphelliphelliphelliphelliphelliphelliphelliphellip 114
46 Discussion helliphelliphelliphelliphelliphelliphelliphelliphelliphelliphelliphelliphelliphelliphelliphelliphelliphelliphelliphelliphelliphelliphelliphelliphellip 126
461 Study Limitations helliphelliphelliphelliphelliphelliphelliphelliphelliphelliphelliphelliphelliphelliphelliphelliphelliphellip 128
47 Conclusions helliphelliphelliphelliphelliphelliphelliphelliphelliphelliphelliphelliphelliphelliphelliphelliphelliphelliphelliphelliphelliphelliphelliphellip 128
Appendix C helliphelliphelliphelliphelliphelliphelliphelliphelliphelliphelliphelliphelliphelliphelliphelliphelliphelliphelliphelliphelliphelliphelliphelliphelliphellip 130
References helliphelliphelliphelliphelliphelliphelliphelliphelliphelliphelliphelliphelliphelliphelliphelliphelliphelliphelliphelliphelliphelliphelliphelliphelliphellip 133
5 Analysis of Sex Differences in the Urinary Concentration of 1-Aminopyrene after
Acute Exposure to Diesel Exhaust helliphelliphelliphelliphelliphelliphelliphelliphelliphelliphelliphelliphelliphelliphelliphelliphelliphellip 138
51 Abstract helliphelliphelliphelliphelliphelliphelliphelliphelliphelliphelliphelliphelliphelliphelliphelliphelliphelliphelliphelliphelliphelliphelliphelliphelliphellip 141
52 Introduction helliphelliphelliphelliphelliphelliphelliphelliphelliphelliphelliphelliphelliphelliphelliphelliphelliphelliphelliphelliphelliphelliphelliphellip 141
521 1-Nitropyrene helliphelliphelliphelliphelliphelliphelliphelliphelliphelliphelliphelliphelliphelliphelliphelliphelliphelliphelliphellip 142
5211 Metabolism of 1-Nitropyrene helliphelliphelliphelliphelliphelliphelliphelliphelliphellip 143
522 Sex Differences in Physiology helliphelliphelliphelliphelliphelliphelliphelliphelliphelliphelliphelliphellip 143
53 Materials and Methods helliphelliphelliphelliphelliphelliphelliphelliphelliphelliphelliphelliphelliphelliphelliphelliphelliphelliphelliphellip 146
531 Data Collection helliphelliphelliphelliphelliphelliphelliphelliphelliphelliphelliphelliphelliphelliphelliphelliphelliphelliphellip 146
532 Subjects helliphelliphelliphelliphelliphelliphelliphelliphelliphelliphelliphelliphelliphelliphelliphelliphelliphelliphelliphelliphelliphellip 146
533 Exposure Conditions and Experimental Design helliphelliphelliphelliphelliphellip 147
534 Urine Sample Collection helliphelliphelliphelliphelliphelliphelliphelliphelliphelliphelliphelliphelliphelliphellip 147
xi
535 Urine Sample Analysis helliphelliphelliphellip 148
536 Creatinine Measurements helliphelliphelliphelliphelliphelliphelliphelliphelliphelliphelliphelliphelliphelliphellip 149
537 Exclusion of Invalid Data and calculation of Time Weighted
Average Concentrations helliphelliphelliphelliphelliphelliphelliphelliphelliphelliphelliphelliphelliphelliphelliphellip 149
538 Exclusion of Baseline Values helliphelliphelliphelliphelliphelliphelliphelliphelliphelliphelliphelliphellip 150
539 Calculation of Response Measure helliphelliphelliphelliphelliphelliphelliphelliphelliphelliphelliphellip 152
5310 Body Mass Index helliphelliphelliphelliphelliphelliphelliphelliphelliphelliphelliphelliphelliphelliphelliphelliphelliphellip 154
54 Statistical Methods helliphelliphelliphelliphelliphelliphelliphelliphelliphelliphelliphelliphelliphelliphelliphelliphelliphelliphelliphelliphellip 154
55 Results helliphelliphelliphelliphelliphelliphelliphelliphelliphelliphelliphelliphelliphelliphelliphelliphelliphelliphelliphelliphelliphelliphelliphelliphelliphellip 154
551 Aim 1 helliphelliphelliphelliphelliphelliphelliphelliphelliphelliphelliphelliphelliphelliphelliphelliphelliphelliphelliphelliphelliphelliphellip 157
552 Aim 2 helliphelliphelliphelliphelliphelliphelliphelliphelliphelliphelliphelliphelliphelliphelliphelliphelliphelliphelliphelliphelliphelliphellip 159
56 Discussion helliphelliphelliphelliphelliphelliphelliphelliphelliphelliphelliphelliphelliphelliphelliphelliphelliphelliphelliphelliphelliphelliphelliphelliphellip 159
561 Study Limitations helliphelliphelliphelliphelliphelliphelliphelliphelliphelliphelliphelliphelliphelliphelliphelliphelliphellip 161
57 Conclusions helliphelliphelliphelliphelliphelliphelliphelliphelliphelliphelliphelliphelliphelliphelliphelliphelliphelliphelliphelliphelliphelliphelliphellip 162
Appendix D helliphelliphelliphelliphelliphelliphelliphelliphelliphelliphelliphelliphelliphelliphelliphelliphelliphelliphelliphelliphelliphelliphelliphelliphellip 163
References helliphelliphelliphelliphelliphelliphelliphelliphelliphelliphelliphelliphelliphelliphelliphelliphelliphelliphelliphelliphelliphelliphelliphelliphelliphellip 164
6 Summary Implications and Future Research Directions helliphelliphelliphelliphelliphelliphelliphelliphellip 167
61 Summary of Results helliphelliphelliphelliphelliphelliphelliphelliphelliphelliphelliphelliphelliphelliphelliphelliphelliphelliphelliphelliphellip 169
611 Local Immune and Inflammatory Responses helliphelliphelliphelliphelliphelliphellip 169
612 Systemic and acute Phase Reactions helliphelliphelliphelliphelliphelliphelliphelliphelliphelliphellip 169
613 Self Reported Symptoms helliphelliphelliphelliphelliphelliphelliphelliphelliphelliphelliphelliphelliphelliphellip 170
614 Metabolism of 1-Nitropyrene helliphelliphelliphelliphelliphelliphelliphelliphelliphelliphelliphelliphellip 171
615 Integration of Study Results helliphelliphelliphelliphelliphelliphelliphelliphelliphelliphelliphelliphelliphellip 171
62 Implications helliphelliphelliphelliphelliphelliphelliphelliphelliphelliphelliphelliphelliphelliphelliphelliphelliphelliphelliphelliphelliphelliphelliphellip 172
xii
63 Future Research Directions helliphelliphelliphelliphelliphelliphelliphelliphelliphelliphelliphelliphelliphelliphelliphelliphelliphellip 175
64 Uncertainties helliphelliphelliphelliphelliphelliphelliphelliphelliphelliphelliphelliphelliphelliphelliphelliphelliphelliphelliphelliphelliphelliphelliphellip 176
Curriculum Vitae helliphelliphelliphelliphelliphelliphelliphelliphelliphelliphelliphelliphelliphelliphelliphelliphelliphelliphelliphelliphelliphelliphelliphelliphellip 178
xiii
List of Tables
Table 11 Summary of In-Vitro and In-Vivo Responses to Diesel Exhaust Diesel
Exhaust Particles Exposure helliphelliphelliphelliphelliphelliphelliphelliphelliphelliphelliphelliphelliphelliphelliphelliphellip 12
Table 12 Controlled Environmental Exposure Study of Diesel Exhaust Outcome
Variables helliphelliphelliphelliphelliphelliphelliphelliphelliphelliphelliphelliphelliphelliphelliphelliphelliphelliphelliphelliphelliphelliphelliphellip 23
Table 13 Original Study Data Collection Protocol helliphelliphelliphelliphelliphelliphelliphelliphelliphelliphelliphelliphellip 23
Table 14 Total Subject Demographic Information helliphelliphelliphelliphelliphelliphelliphelliphelliphelliphelliphelliphellip 24
Table 21 Demographic and Baseline Subject Characteristics for Nasal Lavage
Subjects helliphelliphelliphelliphelliphelliphelliphelliphelliphelliphelliphelliphelliphelliphelliphelliphelliphelliphelliphelliphelliphelliphelliphelliphellip 41
Table 22 Demographic and Baseline Subject Characteristics for Sputum Induction
Subjects helliphelliphelliphelliphelliphelliphelliphelliphelliphelliphelliphelliphelliphelliphelliphelliphelliphelliphelliphelliphelliphelliphelliphelliphellip 42
Table 23 Mean Air Characteristics and Composition helliphelliphelliphelliphelliphelliphelliphelliphelliphelliphelliphellip 42
Table 24 Difference in Soluble Proteins and Cytokines Measured in the Nasal Lavage
Analyte 24 Hours after Exposure to Clean Air and Diesel Exhaust helliphellip 47
Table 25 Difference in Soluble Proteins and Cytokines Measured in Sputum 6 Hours
after Exposure to Clean Air and Diesel Exhaust helliphelliphelliphelliphelliphelliphelliphelliphellip 47
Table 26a Two Way Interaction Significance Test Results and Nasal Analyte
Concentrations for the Difference in the Concentrations of Proteins and
Cytokines Measured in Nasal Lavage Samples 24 Hours after Exposure to
Diesel Exhaust and Clean Air helliphelliphelliphelliphelliphelliphelliphelliphelliphelliphelliphelliphelliphelliphelliphellip 49
Table 26b Mean Ranks for TNF-α DE-CA Measured in Nasal Lavage Samples 24 Hours
after Exposure to Diesel Exhaust and Clean Air helliphelliphelliphelliphelliphelliphelliphelliphellip 49
Table 27 Two Way Interaction Significance Test Results and Sputum Analyte
Concentrations for the Difference in the Concentrations of Proteins and
Cytokines Measured in Sputum Induction Samples 6 Hours after Exposure
to Diesel Exhaust and Clean Air helliphelliphelliphelliphelliphelliphelliphelliphelliphelliphelliphelliphelliphelliphellip 50
Table A1 Nasal Analyte Concentration of Soluble Proteins and Cytokines 24 Hours
after Exposure to Clean Air and Diesel Exhaust helliphelliphelliphelliphelliphelliphelliphelliphelliphellip 57
Table A2 Sputum Concentration of Soluble Proteins and Cytokines 6 Hours after
Exposure to Clean Air and Diesel Exhaust helliphelliphelliphelliphelliphelliphelliphelliphelliphelliphellip 57
xiv
Table A3 Nasal Lavage Median and Percentiles for Diesel Exhaust and Clean Air for
All Subjects helliphelliphelliphelliphelliphelliphelliphelliphelliphelliphelliphelliphelliphelliphelliphelliphelliphelliphelliphelliphelliphelliphellip 58
Table A4 Nasal Lavage Median and Percentiles for Diesel Exhaust and Clean Air for
Females helliphelliphelliphelliphelliphelliphelliphelliphelliphelliphelliphelliphelliphelliphelliphelliphelliphelliphelliphelliphelliphelliphelliphelliphellip 58
TableA5 Nasal Lavage Median and Percentiles for Diesel Exhaust and Clean Air for
Males helliphelliphelliphelliphelliphelliphelliphelliphelliphelliphelliphelliphelliphelliphelliphelliphelliphelliphelliphelliphelliphelliphelliphelliphelliphellip 58
Table A6 Sputum Median and Percentiles for Diesel Exhaust and Clean Air for All
Subjects helliphelliphelliphelliphelliphelliphelliphelliphelliphelliphelliphelliphelliphelliphelliphelliphelliphelliphelliphelliphelliphelliphelliphelliphellip 58
Table A8 Sputum Median and Percentiles for Diesel Exhaust and Clean Air for Males
helliphelliphelliphelliphelliphelliphelliphelliphelliphelliphelliphelliphelliphelliphelliphelliphelliphelliphelliphelliphelliphelliphelliphelliphelliphelliphelliphelliphelliphelliphelliphelliphelliphellip 59
Table A9 Nasal Lavage Median and Percentiles for the the Difference in the
Concentrations of Proteins and Cytokines For Females and Males Measured
in Nasal Lavage Samples helliphelliphelliphelliphelliphelliphelliphelliphelliphelliphelliphelliphelliphelliphelliphelliphelliphelliphellip 59
Table A10 Sputum Lavage Median and Percentiles for the the Difference in the
Concentrations of Proteins and Cytokines For Females and Males Measured
in Nasal Lavage Samples helliphelliphelliphelliphelliphelliphelliphelliphelliphelliphelliphelliphelliphelliphelliphelliphelliphelliphellip 60
Table A11 Mann-Whitney U Test Results Showing the Ranks of the Difference in the
Concentrations of Proteins and Cytokines For Females and Males Measured
in Nasal Lavage Samples helliphelliphelliphelliphelliphelliphelliphelliphelliphelliphelliphelliphelliphelliphelliphelliphelliphelliphellip 60
Table A12 Mann-Whitney U Test Results Showing the Ranks of the Difference in the
Concentrations of Proteins and Cytokines For Females and Males Measured
in Sputum Induction Samples helliphelliphelliphelliphelliphelliphelliphelliphelliphelliphelliphelliphelliphelliphelliphelliphellip 60
Table 31a CBC Subjects Demographic Information helliphelliphelliphelliphelliphelliphelliphelliphelliphelliphelliphellip 71
Table 31b IL-6 Subjects Demographic Information helliphelliphelliphelliphelliphelliphelliphelliphelliphelliphelliphellip 71
Table 31c C - reactive protein Subjects Demographic Information helliphelliphelliphelliphelliphelliphellip 71
Table 31d Fibrinogen Subject Demographics helliphelliphelliphelliphelliphelliphelliphelliphelliphelliphelliphelliphelliphellip 72
Table 32 Mean Air Characteristics and Composition helliphelliphelliphelliphelliphelliphelliphelliphelliphelliphelliphellip 72
Table 33 Three Way Interaction Results helliphelliphelliphelliphelliphelliphelliphelliphelliphelliphelliphelliphelliphelliphelliphelliphellip 76
Table 34a Mean Log Blood Cell Values (Absolute) and Contrast Test Results helliphellip 78
xv
Table 34b Mean Log Blood Cell Blood Count Values (Absolute) and Contrast Test
Results (continued) helliphelliphelliphelliphelliphelliphelliphelliphelliphelliphelliphelliphelliphelliphelliphelliphelliphelliphelliphelliphellip 79
Table 34c Mean Log Cell Blood Count Values (Percentage) and Contrast Test Results
helliphelliphelliphelliphelliphelliphelliphelliphelliphelliphelliphelliphelliphelliphelliphelliphelliphelliphelliphelliphelliphelliphelliphelliphelliphelliphelliphelliphelliphelliphelliphelliphelliphellip 80
Table 34d Mean Log Mediators Values and Contrast Test Results helliphelliphelliphelliphelliphellip 81
Table 34e Mean Log Coagulation Factor Values and Contrast Test Results helliphelliphellip 81
Table 35 Difference in Platelet Counts by Exposure and Sex helliphelliphelliphelliphelliphelliphelliphellip 83
Table B1 Systemic Inflammation Markers helliphelliphelliphelliphelliphelliphelliphelliphelliphelliphelliphelliphelliphelliphellip 89
Table B2 CRP Mean Values helliphelliphelliphelliphelliphelliphelliphelliphelliphelliphelliphelliphelliphelliphelliphelliphelliphelliphelliphelliphellip 89
Table B3 IL-6 Mean Values helliphelliphelliphelliphelliphelliphelliphelliphelliphelliphelliphelliphelliphelliphelliphelliphelliphelliphelliphelliphellip 90
Table B4 WBC Mean Values helliphelliphelliphelliphelliphelliphelliphelliphelliphelliphelliphelliphelliphelliphelliphelliphelliphelliphelliphellip 90
Table B5 Cell Blood Counts Means (Absolute Values) helliphelliphelliphelliphelliphelliphelliphelliphelliphellip 91
Table B6 Cell Blood Counts (Percent Values) helliphelliphelliphelliphelliphelliphelliphelliphelliphelliphelliphelliphelliphellip 92
Table B7 Fibrinogen Mean Values helliphelliphelliphelliphelliphelliphelliphelliphelliphelliphelliphelliphelliphelliphelliphelliphelliphellip 93
Table B8 Mean Platelet Counts (x10e3microl) helliphelliphelliphelliphelliphelliphelliphelliphelliphelliphelliphelliphelliphelliphellip 93
Table 41 Proposed Determinants of Self Reported Symptoms helliphelliphelliphelliphelliphelliphellip 105
Table 42 Mean Air Characteristics and Composition helliphelliphelliphelliphelliphelliphelliphelliphelliphelliphellip 108
Table 43 Demographic Information and Baseline Subject Characteristics helliphelliphellip 108
Table 44 Description of Symptom Categories and The Creation of the Summary
Severity Scores helliphelliphelliphelliphelliphelliphelliphelliphelliphelliphelliphelliphelliphelliphelliphelliphelliphelliphelliphelliphelliphellip 111
Table 45a Mean Total Symptom Severity Ratings by Category and the Time Reported
helliphelliphelliphelliphelliphelliphelliphelliphelliphelliphelliphelliphelliphelliphelliphelliphelliphelliphelliphelliphelliphelliphelliphelliphelliphelliphelliphelliphelliphelliphelliphelliphelliphellip 112
Table 45b Mean Total Symptom Severity Ratings by Category and the Time Reported
(continued) helliphelliphelliphelliphelliphelliphelliphelliphelliphelliphelliphelliphelliphelliphelliphelliphelliphelliphelliphelliphelliphelliphellip 113
Table 46 Three Way Interaction Results helliphelliphelliphelliphelliphelliphelliphelliphelliphelliphelliphelliphelliphelliphelliphellip 115
xvi
Table 47a Count of Reported Eye Irritation Symptoms (NY) by Sex Exposure and
Time helliphelliphelliphelliphelliphelliphelliphelliphelliphelliphelliphelliphelliphelliphelliphelliphelliphelliphelliphelliphelliphelliphelliphelliphelliphellip 116
Table 47b Count of Reported Anxiety Symptoms (NY) by Sex Exposure and Time
helliphelliphelliphelliphelliphelliphelliphelliphelliphelliphelliphelliphelliphelliphelliphelliphelliphelliphelliphelliphelliphelliphelliphelliphelliphelliphelliphelliphelliphelliphelliphelliphelliphellip 116
Table 47c Count of Reported Central Nervous System Symptoms (NY) by Sex
Exposure and Time helliphelliphelliphelliphelliphelliphelliphelliphelliphelliphelliphelliphelliphelliphelliphelliphelliphelliphelliphellip 117
Table 47d Count of Reported No Load (General) Symptoms (NY) by Sex Exposure
and Time helliphelliphelliphelliphelliphelliphelliphelliphelliphelliphelliphelliphelliphelliphelliphelliphelliphelliphelliphelliphelliphelliphelliphellip 117
Table 48 Contrast Between Sex (Males vs Females) Test Results helliphelliphelliphelliphellip 118
Table 49 Contrast Within Sex Test Results helliphelliphelliphelliphelliphelliphelliphelliphelliphelliphelliphellip 119
Table 410a Mean Change (DE-CA) from Baseline in Symptom Severity Ratings for
Males and Females helliphelliphelliphelliphelliphelliphelliphelliphelliphelliphelliphelliphelliphelliphelliphelliphelliphelliphelliphellip 120
Table 410b Mean Change (DE-CA) from Baseline in Symptom Severity Ratings for
Males and Females (continued) helliphelliphelliphelliphelliphelliphelliphelliphelliphelliphelliphelliphelliphelliphellip 123
Table C1a Mean Difference (DE-CA) in Symptom Severity Ratings for Males and
Female helliphelliphelliphelliphelliphelliphelliphelliphelliphelliphelliphelliphelliphelliphelliphelliphelliphelliphelliphelliphelliphelliphelliphelliphellip 130
Table C1b Mean Difference (DE-CA) in Symptom Severity Ratings for Males and
Females (continued) helliphelliphelliphelliphelliphelliphelliphelliphelliphelliphelliphelliphelliphelliphelliphelliphelliphelliphellip 131
Table 51 Subject Characteristics by Sex helliphelliphelliphelliphelliphelliphelliphelliphelliphelliphelliphelliphelliphelliphellip 146
Table 52 Mean Air Characteristics and Composition helliphelliphelliphelliphelliphelliphelliphelliphelliphellip 147
Table 53 TWA 1-APY Concentrations for All Subjects and by Sex helliphelliphelliphelliphellip 150
Table 54 Baseline 1-APY Concentrations helliphelliphelliphelliphelliphelliphelliphelliphelliphelliphelliphelliphelliphellip 151
Table 55a Results of the ANCOVA Sensitivity Analysis helliphelliphelliphelliphelliphelliphelliphelliphellip 152
Table 55b Mean and Adjusted Mean Concentrations of Baseline TWA 1-APY by
Sex helliphelliphelliphelliphelliphelliphelliphelliphelliphelliphelliphelliphelliphelliphelliphelliphelliphelliphelliphelliphelliphelliphelliphelliphelliphellip 152
Table 56 Mean TWA 1-APY DECA for All Subjects and by Sex helliphelliphelliphelliphelliphellip 153
Table 57 Mean Log TWA 1-APY DECA helliphelliphelliphelliphelliphelliphelliphelliphelliphelliphelliphelliphelliphelliphelliphellip 154
xvii
Table 58 ANOVA Results helliphelliphelliphelliphelliphelliphelliphelliphelliphelliphelliphelliphelliphelliphelliphelliphelliphelliphelliphelliphellip 157
Table 59 Summary of Backward Elimination Regression of TWA 1-APY DECA
helliphelliphelliphelliphelliphelliphelliphelliphelliphelliphelliphelliphelliphelliphelliphelliphelliphelliphelliphelliphelliphelliphelliphelliphelliphelliphelliphelliphelliphelliphelliphelliphelliphellip 159
Table D1 One Sample t-test results of Log TWA 1-APY by Stress for All Subjects
and also by Sex helliphelliphelliphelliphelliphelliphelliphelliphelliphelliphelliphelliphelliphelliphelliphelliphelliphelliphelliphelliphellip 163
xviii
List of Illustrations and Graphs
Figure 11 Typical Chemical Compositions for Diesel Particulate Matter PM25 (US
EPA 2002) helliphelliphelliphelliphelliphelliphelliphelliphelliphelliphelliphelliphelliphelliphelliphelliphelliphelliphelliphelliphelliphellip 7
Figure 12 Hypothesized Diesel Exhaust Effects Model Used in this Dissertation
helliphelliphelliphelliphelliphelliphelliphelliphelliphelliphelliphelliphelliphelliphelliphelliphelliphelliphelliphelliphelliphelliphelliphelliphelliphelliphelliphelliphelliphelliphelliphelliphelliphellip 15
Figure 13 Possible roles of gender and sex in shaping observed relationships
between air pollution and health (Clougherty 2010) helliphelliphelliphelliphelliphellip 16
Figure 14 Metabolites of 1-Nitropyerene in-vivo (Howard et al 1995) helliphelliphellip 19
Figure 21 The Human Respiratory System helliphelliphelliphelliphelliphelliphelliphelliphelliphelliphelliphelliphelliphelliphellip 36
Graph 21 Difference in Proteins Measured in Nasal Lavage Post Clean Air and
Diesel Exhaust Exposure helliphelliphelliphelliphelliphelliphelliphelliphelliphelliphelliphelliphelliphelliphelliphelliphellip 47
Graph 22 Difference in TNF-α Measured in Nasal Lavage Post Clean Air and
Diesel Exhaust Exposure helliphelliphelliphelliphelliphelliphelliphelliphelliphelliphelliphelliphelliphelliphelliphelliphellip 48
Graph 23 TNF-α in Nasal Lavage from Healthy Subjects at 24 Hours (N = 17)
after Exposure to Clean Air and Diesel Exhaust helliphelliphelliphelliphelliphelliphelliphellip 49
Graph 24 Boxplot of Median TNF-α Concentrations by Sex and Exposure hellip 50
Graph 31 Plot of Mean Platelet Count Difference by Exposure by Sex and Time
helliphelliphelliphelliphelliphelliphelliphelliphelliphelliphelliphelliphelliphelliphelliphelliphelliphelliphelliphelliphelliphelliphelliphelliphelliphelliphelliphelliphelliphelliphelliphelliphelliphellip 76
Graph 32 Graph of Mean Percent Change in Platelet Counts Measured in Diesel
Exhaust Relative to Clean Air by Sex helliphelliphelliphelliphelliphelliphelliphelliphelliphelliphelliphelliphellip 77
Graph B1 Mean Platelet Count by Sex helliphelliphelliphelliphelliphelliphelliphelliphelliphelliphelliphelliphelliphelliphelliphellip 93
Figure 41 Intersetion of Sex and Gender and Self Reported Symptom
Determinants helliphelliphelliphelliphelliphelliphelliphelliphelliphelliphelliphelliphelliphelliphelliphelliphelliphelliphelliphelliphellip 104
Figure 42 Labeled Magnitude Scale (Green et al 1996) helliphelliphelliphelliphelliphelliphelliphelliphellip 109
Figure 43 Questionnaire Study Protocol helliphelliphelliphelliphelliphelliphelliphelliphelliphelliphelliphelliphelliphelliphellip 110
Graph 41a-b Line Graph of Mean Self reported Somatic and Lower Respiratory
Symptoms by Sex helliphelliphelliphelliphelliphelliphelliphelliphelliphelliphelliphelliphelliphelliphelliphelliphelliphelliphellip 115
xix
Graph 42 Changes in Mean Somatic Symptoms Severity Ratings helliphelliphelliphelliphellip 121
Graph 43 Changes in Mean Lower Respiratory Symptoms Severity Ratings hellip 121
Graph 44 Changes in Mean Acute Phase Reaction Symptoms Severity Ratings
helliphelliphelliphelliphelliphelliphelliphelliphelliphelliphelliphelliphelliphelliphelliphelliphelliphelliphelliphelliphelliphelliphelliphelliphelliphelliphelliphelliphelliphelliphelliphelliphelliphellip 122
Graph 45 Changes in Mean Anxiety Symptoms Severity Ratings helliphelliphelliphelliphellip 122
Graph 46 Changes in Mean No Load (General) Symptoms Severity Ratings hellip 124
Graph 47a-h Distribution of Mean Symptom Severity ratings by Exposure Time and
Sex helliphelliphelliphelliphelliphelliphelliphelliphelliphelliphelliphelliphelliphelliphelliphelliphelliphelliphelliphelliphelliphelliphellip 124 - 125
Graph C1andashh Line Graph of Mean Symptom Severity Ratings by Sex helliphellip 131 - 132
Figure 51 Distribution of the TWA 1-APY DECA by Sex helliphelliphelliphelliphelliphelliphelliphelliphelliphellip 153
Figure 52a Distribution of the Concentration of Log TWADECA by Sex helliphelliphelliphellip 155
Figure 52b Box Plot of the Mean Concentration of Log TWA 1-APY DECA by Sex
helliphelliphelliphelliphelliphelliphelliphelliphelliphelliphelliphelliphelliphelliphelliphelliphelliphelliphelliphelliphellip 155
Figure 53 Mean TWA 1-APY Concentrations Secreted by Exposure and by Sex
helliphelliphelliphelliphelliphelliphelliphelliphelliphelliphelliphelliphelliphelliphelliphelliphelliphelliphelliphelliphelliphelliphelliphelliphelliphelliphelliphelliphelliphelliphelliphelliphelliphellip 158
Figure D1 Profile Plot of Log TWA 1-APY by Stress for All Subjects and also by Sex
helliphelliphelliphelliphelliphelliphelliphelliphelliphelliphelliphelliphelliphelliphelliphelliphelliphelliphelliphelliphelliphelliphelliphelliphelliphelliphelliphelliphelliphelliphelliphelliphelliphellip 163
1
Chapter 1
Introduction
2
11 Background
12 Diesel Exhaust
121 Exposure to Diesel Exhaust
122 Composition of Diesel Exhaust
123 Overall Health Effects of Diesel Exhaust
124 Hypothesized Mechanisms of Diesel Exhaust Induced Health Effects
125 Diesel Exhaust and Cytokine Release
126 Diesel Exhaust and Oxidative Stress
127 Respiratory and Cardiovascular Effects of Diesel Exhaust Exposure
13 Sex
131 Definition of Sex and Gender
132 Sex and Toxicity
133 Sex and the Effects of Diesel Exhaust Exposure
134 Sex and the Metabolism of Diesel Exhaust
1341 1-Nitropyrene
1342 Sex and the Metabolism of 1-Nitropyrene
14 Dissertation Research
141 Aims
15 Research Design and Data
151 Data Collection
152 Original Study Data
153 Subjects Demographic Data
16 Hypothesis and research Questions
161 Overall Hypothesis
162 Research Question 1
3
163 Research Question 2
164 Research Question 3
165 Research Question 4
4
11 Background
Diesel exhaust is produced from the combustion of diesel fuel The superior
energy efficiency and endurance of diesel engines have led to a rapid rise in the use of
diesel fuel worldwide to power vehicles and other machineries (USEPA HAD 2002)
This has made diesel exhaust a significant contributor to ambient air pollution and the
largest single source of airborne particulate matter (PM) in many urban areas (Riedl and
Diaz-Sanchez 2005) Across populations exposures may be acute or chronic and the
exposure amounts may be either high or low depending on the temporal and spatial
distribution of diesel exhaust sources Due to the ubiquitous nature of diesel exhaust and
the potential for the high exposure of certain populations like workers using diesel-
powered machinery and people who live close to diesel traffic diesel exhaust has been
one of the most studied environmental pollutants in an attempt to determine its
toxicological effects in humans and rodents
Toxicology is the study of the adverse effects of a xenobiotic (Casarett and
Doulllsquos 2001) on a target population or species This involves understanding the nature of
the xenobiotic as well as the host or target factors that may make it more or less
susceptible to the xenobiotic Such factors include genetic traits sex age pre-existing
conditions behavioral traits and coexisting exposures to other xenobiotics (Casarett and
Doulllsquos 2001) When making inferences from animal studies or from epidemiological
studies some of these factors are usually handled as uncertainty factors and are
mathematically used in the calculation of acceptable exposure levels and for policy
measures
5
In particular sex is often considered to be a confounder or a modifying variable
and is usually controlled for by the choice of design or by some standardization or
multivariate procedure (Gochfeld 2007) This has led to the fact that in the toxicology of
environmental xenobiotics especially with regards to non-cancerous health outcomes
differences in susceptibility by sex have not received adequate attention in human and
animal toxicology nor in epidemiology and generalizations are often made about species
response without data or consideration of sex differences (Gochfeld et al 2007)
Why is this important It is important because males and females differ
substantially with respect to physiology and biology and these differences may have
significant effects on the toxicity of any xenobiotic and thus may affect how vulnerable
males and females are to the effects of xenobiotics and other environmental stressors
(Gochfeld 2007) Along the continuum from exposure to absorption to metabolism to
excretion to systemic effects and to overall health outcomes every step may be
potentially influenced by sex
12 Diesel Exhaust
121 Exposure to Diesel Exhaust
Most acute exposure to very high levels of diesel exhaust and chronic exposure to
low levels of diesel exhaust occur via occupational exposures either by accident or as a
routine part of the job Toll workers truck drivers bridge and tunnel workers mine
workers forklift drivers railroad and dock drivers and garage workers usually have the
highest occupational exposure Exposure to the general public is not as frequent as seen
in the occupational setting and it is usually to lower levels of diesel exhaust The highest
6
exposure to the public occurs along highways and in cities or anywhere diesel traffic is
heaviest (Frumkin and Thun 2001) Children are also thought to have one of the highest
opportunities for exposure to diesel exhaust fumes due to the use of diesel powered
school buses
Inhalation of diesel exhaust is the primary route of exposure therefore
experimental studies have often been done to examine the association between diesel
exhaust exposure and respiratory and cardiovascular effects
122 Composition of Diesel Exhaust
Diesel exhaust is made up of a complex mixture of hundreds of constituents in
either a gaseous or particulate form Gaseous components of diesel exhaust include
carbon dioxide oxygen nitrogen water vapor carbon monoxide nitrogen compounds
sulfur compounds and numerous low-molecular-weight hydrocarbons
Figure 11 Typical Chemical Compositions for Diesel Particulate Matter PM25
Source Health Assessment Document for Diesel Engine Exhaust US EPA 2002
Elemental Carbon
75
Organic Carbon19
Sulfate Nitrate1
Minerals2
Unknown3
7
The particles produced by diesel exhaust fuel combustion are composed of a
center core of elemental carbon and absorbed organic compounds as well as small
amounts of sulfate nitrate metals and other trace elements (Figure 1) (USEPA HAD
2002) These particles are collectively called diesel exhaust particles (DEPs) and they are
primarily made up of fine (25 - 01 microm) and ultra-fine (lt01 microm) particles These
primary DEPs can also coalesce to form aggregates of varying size ranges (Riedl and
Diaz-Sanchez 2005) Both the gaseous and particulate fractions of diesel exhaust contain
polycyclic aromatic hydrocarbons (PAHs) which are produced as pyrolytic products
during the combustion of diesel exhaust and any fossil fuel (Frumkin and Thun 2001)
Due to these characteristics of diesel exhaust as well as its vast use in society
diesel exhaust accounts for a significant source of ambient PM25 (especially in urban
environments) For this reason many experimental studies use diesel exhaust as a model
for PM pollution (Torqvist et al 2007)
123 Overall Health Effects of Diesel Exhaust Exposure
In 1988 the National Institute for Occupational Safety and Health (NIOSH)
proposed a potential link between occupational exposure to diesel exhaust and lung
cancer based on the consistency of toxicological studies in rats and mice and the limited
epidemiological evidence which was mainly from railroad workers at the time (Rogers
and Davies 2005)
Overall chronic inhalation exposure to diesel exhaust is likely to pose a lung
cancer hazard to humans as well as damage the lungs in other ways depending on the
length and intensity of the exposure While acute exposure to diesel exhaust can cause
8
acute irritation (eg eye nose throat bronchial) neurophysiological symptoms (eg
lightheadedness nausea) inflammatory responses in the airway and the lungs respiratory
symptoms (cough phlegm) there is also evidence for an immunologic effect (the
exacerbation of allergenic responses to known allergens and asthma-like symptoms) and
cardiovascular effects (USEPA HAD 2002 Donaldson et al 2001) such as impaired
vascular function and increase in blood coagulation
Normally the lungs are able to deal with the isolation neutralization and removal
of inhaled diesel exhaust and other xenobiotics or air pollutants via various mechanisms
but these natural defense mechanisms can often become overwhelmed for a variety of
reasons including illness or high burden of pollutants and this can then lead to the adverse
health effects mentioned above (Salvi and Holgate 1999)
124 Hypothesized Mechanisms of Diesel Exhaust Induced Health Effects
The mechanism by which diesel exhaust and other air pollutants cause these
adverse health effects are not well known Currently there are two leading hypotheses
about the mechanisms by which diesel exhaust and other air pollutants cause the health
effects that have been observed In particular diesel exhaust (or other particulate matter)
induced effects on the cardiovascular system lung and blood receptors are hypothesized
to occur either via the direct action of DEPs or other particulate matter on these endpoints
(Brook et al 2004 and Shimada et al 2006) or indirectly via mediators released in
response to DEPs (or other particulate matter) initiated pulmonary oxidative stress and
inflammatory responses in the airway and lungs (Brook et al 2004 and Shimada et al
2006)
9
The direct effect of DEPs (or other particulate matter) on cardiovascular system
lung and blood receptors are hypothesized to happen due to the translocation of ultra fine
DEPs (or other ultra fine particulate matter) transition metals and gases from the lungs to
systemic circulation Under this hypothesis the translocated DEPs or other particulate
matter directly influence homeostasis and other cardiovascular endpoints
(Kaewamatawong et al 2008 and Shimada et al 2006) leading to cardiovascular effects
An alternative hypothesis upon which this dissertation research is based is that
exposure to diesel exhaust (or other air pollutants) causes an inflammation reaction in the
airways and lungs via oxidative stress which results in the systemic release of cytokines
which influence the heart coagulation factors and other cardiovascular endpoints and
leads to cardiovascular symptoms (Kaewamatawong et al 2008 and Shimada et al 2006)
The exact mechanism (s) of the anatomical translocation of inhaled ultra fine
DEPs (or other ultra fine particulate matter) across the air-blood barrier at the alveolar
wall are not fully understood (Shimada et al 2006) but the alternative inflammation
induced systemic effect of DEPs (or other particulate matter) is hypothesized to take
place when the previously mentioned overload or hindrance of the lunglsquos natural defenses
occurs When this happens it sets off a variety of cascading adverse systemic reactions
involving and mediated by multiple cell lines cytokines and acute phase proteins All of
these may contribute to the overall adverse respiratory and cardiovascular health effects
that have so far been linked with exposure to diesel exhaust and other air pollutants The
consensus amongst the diesel exhaust studies that have been done is that diesel exhaust is
capable of causing pro-inflammatory and pro-allergenic effects which cause marked
pulmonary and systemic inflammatory responses involving a variety of cell types (Diaz
10
and Riedl 2005 Salvi et al 1999) that include epithelial cells macrophages neutrophils
mast cells and lymphocytes
As with the actions of the different components of air pollution it is very hard to
tease apart the effect of the two fractions of diesel exhaust because despite their distinct
nature it appears that both the particulate and gaseous fractions of air pollutants and
diesel exhaust alike share the ability to initiate and heighten these cellular inflammation
in the upper and lower airways
125 Diesel Exhaust and Cytokine Release
It is hypothesized that the cascading events that follow diesel exhaust exposure
are heavily influenced by the pro-inflammatory cytokines and chemokines released from
affected cells in response to diesel exhaust induced local inflammation Furthermore
these cytokines are also hypothesized to have an added inflammatory effect on the
surrounding cells and to modify the production of acute phase proteins by the liver
thereby leading to adverse cardiovascular effects
Cytokines are intercellular signaling polypeptides produced by activated cells
(Gabay C et all 1999) Of particular interest in diesel exhaust exposure are those
cytokines that are produced during inflammation and which also participate and
contribute to the inflammatory process because they are the chief stimulant of the acute
phase proteins Macrophages and monocytes are the most important sources of these
cytokines at the sites of inflammation although they are also produced by a number of
other different cells These pro-inflammatory cytokines include interleukin 6 (IL-6)
11
interleukin 1β (IL-1β) Tumor necrosis factor - α (TNF-α) interferon γ (IFN-γ)
transforming growth factor β2 interleukin 8 (IL-8) (Gabay C et all 1999)
126 Diesel Exhaust and Oxidative Stress
The roles of these pro-inflammatory cytokines in increasing inflammation in
response to diesel exhaust exposure has been well documented (van Eeden et al 2001)
but the initial cause of the inflammatory process which stimulates the release of these
cytokines is still under debate One leading thought is that the inflammation is instigated
by oxidative stress (Furuyama et al 2006 Diaz-Sanchez and Riedl 2005 Salvi and
Holgate1999) caused by the subsequent prolonged contact of the metals PAHs and
quinines contained in diesel exhaust with the epithelial and macrophage cells when the
natural lung safety mechanisms become overwhelmed The epithelial and macrophage
cells are the initial target cells for particle interaction and deposition and thus are thought
to be the initial site of toxicity (Salvi et all 1999) This theory has been supported by the
fact that antioxidants can block the effects of DEPs in animal models and in in-vitro
models (Diaz-Sanchez and Riedl 2005) Diesel exhaust has also been demonstrated to
activate redox-sensitive transcription factors in the bronchial epithelium of healthy
subjects consistent with oxidative stress triggering the increased synthesis of cytokines
(Pourazar et al 2005)
This oxidative stress initiated inflammation is thought to either directly or
indirectly cause or trigger other mechanisms that are behind the effects that have been
seen in in-vitro and in-vivo studies (Table 1)
12
Table 11 Summary of In-Vitro and In-Vivo Responses to Diesel Exhaust Diesel Exhaust particles
Exposure Summary of In-Vitro Cell responses
Summary of Responses by Cell Types Sources
1 In bronchial and nasal epithelial and endothelial cells ndash
Increase expression of chemokines and cytokines IL-8 eotaxin
RANTES GM-CSF and IL-6 Up regulation of the expression of histamine H-1 receptor mRNA and
enhanced inducement of histamine induced increase in IL-8 and GM-
CSF production 2 In Eosinophils - Enhanced adhesion of to nasal epithelial cells and induced
eosinophil degranulation
3 In Mast cells ndash Enhanced IgE mediated release histamine release
Increase in the production of IL-4 and IL-6
4 In Basophils ndash Induced histamine release in the absence of IgE and enhanced cytokine production of IL-4
5 In PMDCs ndash Inducement of chemokine production of IL-8 and RANTES and
combining with allergen to increase IL-8 RANTES and TNF-α production 6 In B cells ndash Enhancement of IgE production in the presence of co-stimulatory
molecules such as after IL-4 and CD40
7 In Monocytes and Macrophages ndash Impaired Phagocytosis
Induction of oxidative stress
Stimulation of the release of TNF-α and IL-6 Modulation of cytokine production by inhibition of IL-12p40
production
Inhibition of prostaglandin E2 release Increase in phase 2 enzyme expression
Saxton and Diaz 2000 Riedl and Diaz-
Sanchez 2005
Salvi and Holgate 1999Salvi et al
1999 Pourazar et al 2005 Saxton and
Diaz-Sanchez 2000 Diaz- Sanchez et al
1996
Summary of In-Vivo responses
Summary of Responses in Animals Sources
1 Damage to alveolar macrophage membranes and depressed phagocytic activity
2 Damage to ciliated epithelial cells lining the trachea and large airways
3 Activation of Macrophages and release of IL-1 IL-6 and TNF-α 4 Release of neutrophils into the blood from the bone marrow
5 Increase levels of cytoplasmic and lysosomal enzymes and total proteins in
response to chronic exposure 6 Increased synthesis and deposition of collagen producing thickening of the
alveolar septa and blood vessels and the development of interstitial fibrosis
7 Increased levels of mRNA for IL-2 IL-4 and GM-CSF in airway tissue
Saxton and Diaz 2000 Riedl and Diaz-
Sanchez 2005
Salvi and Holgate 1999Salvi et al
1999 Pourazar et al 2005 Saxton and
Diaz-Sanchez 2000 Diaz- Sanchez et al
1996 Salvi et al 2000 Nightingale et
al 2000
Summary of Responses in Humans Subjects
1 Increase in the number of neutrophils B cells T cells and mast cells
(inflammatory cells) in the airways
2 Increase in circulating neutrophils and platelets 3 Increase in histamine fibronectin neutrophils and B lymphocytes levels in
the airway lumen
4 Up regulation of the expression of adhesion molecules on the capillary endothelial cells and leucocytes cell surfaces
5 Increase of gene transcription and expression of IL-8 and GRO-α protein
and an accompanying trend towards an increase in IL-5 mRNA gene transcripts in the bronchial epithelium
6 Decrease in macrophage function
7 Increase in airway resistance 8 Up-regulation of redox sensitive transcription factors and cell signaling
pathways in the bronchial epithelium
9 Enhanced local mucosal IgE production 10 Increase in nasal cytokine expression following DEP exposure ie IL-2 IL-
4 IL-5 IL-6 IL-10 IL-13 and Interferon γ
13
127 Respiratory and Cardiovascular Health Effects of Diesel Exhaust Exposure
The respiratory and cardiovascular effects of diesel exhaust are thought to be
connected via oxidative stress initiated inflammation because inflammation is known to
cause a large number of changes far from the initial site of the local inflammation and
potentially involving many organ systems More specifically changes in the levels of
acute phase proteins in response to inflammation and mediated by pro-inflammatory
cytokines are believed to cause the corresponding adverse cardiovascular effects that are
often seen following the inhalation of diesel exhaust especially in compromised
populations
Acute phase proteins are proteins that are produced by the liver and whose plasma
concentrations increase or decrease by at least 25 during an inflammatory disorder
(Gabay et al 1999) Of particular interest are fibrinogen and C-reactive proteins
Fibrinogen can cause endothelial cell adhesion spreading and proliferation while C-
reactive proteins have been shown to be a cardiovascular risk factor in both healthy
subjects and those with coronary heart disease (Peter et al 2001) C-reactive proteins are
tightly regulated and their plasma concentrations can increase by over 1000 fold during
an acute phase response to inflammation or other forms of tissue damage or infection
(Peter et al 2001)
Acute phase changes reflect the presence and intensity of inflammation (Gabay et
al 1999) so it is hypothesized that in response to the injury caused by diesel exhaust
induced oxidative stress the local inflammatory cells ie neutrophils monocytes and
macrophages secrete a number of cytokines (IL-6 IL1β IL-8 and TNF-α) into the blood
stream These cytokines ate thought to act as a cascade and as a network in stimulating
14
the production of C-reactive proteins and other acute phase proteins in the liver (Gabay et
al1999) This leads to the presentation of acute phase symptoms which include fever and
lethargy (Gabay et al 1999)
In summary the activation and mobilization of inflammatory cells by oxidative
stress the production of pro-inflammatory cytokines the production of acute phase
proteins and the production of circulating inflammatory mediators all characterize the
systemic inflammatory response (van Eeden et al 2001) that is hypothesized to cause
adverse cardiovascular effects (Figure 3)
13 Sex
131 Definition of Sex and gender
In public health terms sex can be thought to determine genetically based
sensitivity to health determinants and gender can be thought to express some social forces
that could influence exposure and responses to health determinants (Messing and
Stellman 2006)
The effects of sex and gender on the adverse health effects of a xenobiotic often
complement each other Gender often has a big influence on the types and levels of a
xenobiotic that men and women get exposed to especially in the occupational setting and
sex often has a big effect on how men and women absorb distribute metabolize and
excrete the xenobiotic once the exposure has taken place (Figure 4) (Arbuckle 2006 and
Dimich-Wald et al 2006)
15
Diesel Exhaust Exposure
Subject
Oxidative Stress
Local Inflammation
(Macrophages and Epithelial Cells)
Activation of inflammatory cells
(Neutrophils)
Production of pro-inflammatory cytokines and chemokines
(IL-6 IL-1 IL-8 TNF-α and IFN-γ)
Peripheral blood
(Platelets increase)
Liver
Production of Acute Phase Proteins
(C - reactive protein and Fibrinogen)
Acute Phase Symptoms
(Fever and Lethargy)
Figure 12 Hypothesized Diesel Exhaust Effects Model Used in this Dissertation
16
Figure 13 Possible roles of gender and sex in shaping observed relationships between air pollution and
health Source Clougherty 2010 (Reproduced with permission from Environmental Health Perspectives)
132 Sex and Toxicity
With regards to the toxicity of environmental air pollution there is little
information on environmentally related health effects that manifest differently in females
compared with males and in experimental animal toxicological studies male animals have
almost exclusively been used (Vahter et al 2007) Some studies have been done to look
at the differences in the reaction to different xenobiotics by sex and a lot of these studies
have focused on form and structural differences between males and females rather than
on functional differences (eg Becklake and Kauffmann 1999) These studies have
looked at differences in lung capacity ventilation rates and so on in an attempt to
identify how these morphological differences affect the rates of absorption of the inhaled
xenobiotic The fact remains that once a xenobiotic reaches the lungs there are many
local interactions involving macrophages and cytokines which can lead to inflammation
17
or other local pulmonary effects which are unrelated to the rates of systemic absorption
(Gochfeld 2007)
Recently some epidemiological studies have been done to examine gender and
sex differences in health effects in relation to residential exposure to air pollution (Kan et
al 2007 Kan et al 2008 Franklin et al Luginaah et al 2005 Sunyer et al 2006) These
studies together suggest stronger sex linked associations among women in response to air
pollution such as lower forced respiratory volume in 1 second (FEV1) increased phlegm
production and increased respiratory mortality (Clougherty 2010) Physiological
explanations that have been suggested to explain these observed susceptibility of women
to respiratory hazards include the possibility that females have differential rates of
absorption kinetics and metabolism of xenobiotics that affect their dose for the average
male or female (Dimich-Ward et al 2006)
133 Sex and the Effects of Diesel Exhaust Exposure
It is hypothesized that sex hormones (estrogens and testosterone) play an essential
role in the different susceptibilities between males and females to xenobiotics
Differences in xenobiotic particle clearance oxidative stress handling cytokine pathway
activation and cytochrome P450 enzymes activity are all influenced by sex hormones
(Fortoul et al 2005) There is also evidence that sex hormones have an influence on many
aspects of airway behavior especially in females which may be unrelated to the gender
related socioeconomic determinants of exposure for example it has been suggested that
the airways of girls (and women) may be more sensitive to the effects of tobacco smoke
than those of boys and men (Becklake and Kauffmann 1999) This raises the question of
18
whether this increased susceptibility to tobacco smoke is unique or whether it may be
applicable to other environmental exposures like diesel exhaust
134 Sex and the Metabolism of Diesel Exhaust
Not all differences between male and female susceptibility can be attributed to
hormones (Vahter et al 2007) For example the metabolism and excretion of a
xenobiotic and its metabolites is something that is highly influenced by differences in
morphology and other internal metabolic processes The rate and type of metabolism and
the rate of excretion of a xenobiotic and its subsequent metabolites can have a big effect
on the differences in susceptibly of males and females Exposure to diesel exhaust is
known to increase urinary levels of oxidative stress by-products and urinary metabolites
of diesel exhaust components but so far no one has examined whether a difference exists
between males and females in the levels of metabolites excreted in urine This is
important because the clearance rate of diesel exhaust and other inhaled xenobiotics may
differ by sex depending on whether they are metabolized via conjugation oxidative
mechanisms or reduction (Arbuckle et al 2006) in the airway lungs and subsequently in
the liver These potential differences in clearance rates may also produce sex related
differences in response to diesel exhaust exposure and other xenobiotics
1341 1-Nitropyrene
1-Nitropyrene (1-NP) is the most abundant nitro-PAH contained in diesel exhaust
and so it along with its metabolites (Figure 5) are thought to be good specific biomarkers
of diesel exhaust exposure (Toriba et al 2007)
19
Figure 14 Metabolites of 1-Nitropyerene in-vivo Source Howard et al 1995 (Reproduced with permission from Chemico-Biological Interactions)
20
1-NP is also a main contributor of the direct acting mutagenicity that has been observed
in DEPs (Toriba et al 2007) The metabolism of 1-NP can occur via nitro-reduction or
cytochrome P450 mediated ring oxidation (Silvers et al 1997 and Chae et al 1999) but
nitro-reduction appears to be a principal pathway by which 1-NP is activated resulting in
the formation of DNA adducts (Silvers et al 1997)
1342 Sex and the Metabolism of 1-Nitropyrene
The human Cytochrome P450 family of enzymes in particular the P450 3A3 and
3A4 isomers are the predominant enzymes involved in the oxidative metabolism of 1-NP
(Silvers et al 1997 and Chae et al 1999) In the mammalian system 1-NP is metabolized
by xanthine oxidase DT-diaphorase or aldehyde oxidase (NTP 1996)
There are known variations by sex in the function and activity of the P450 isomers in
particular CYP 3A4 with females having a higher activity than males (Anderson 2008)
Also in 1992 Relling et al showed that females had a higher activity of xanthine oxidase
than males after exposure to a low dose of caffeine Therefore there is the possibility that
there may be a variation by sex in the concentration of 1-NP metabolites that are
produced regardless of the metabolic pathway that is used
14 Dissertation Research
141 Aims
The primary aim of this dissertation research is to investigate the potential effect
of sex on local airway and systemic inflammation acute phase responses and self
reported symptomatic responses that have been attributed to acute diesel exhaust
exposure The secondary aim of this dissertation research is to examine whether there is a
21
sex difference in the metabolism of 1-nitropyrene a diesel exhaust specific compound
and a potent mutagen and carcinogen
15 Research Design and Data
151 Data Collection
The data used for this dissertation research are part of the datasets generated from
a study of diesel exhaust effects and a subsequent add-on study of diesel exhaust
exposure biomarkers The parent study was funded by the Department of Defense (DOD)
through a grant to the University of Medicine and Dentistry of New Jersey (UMDNJ)
(Grant DAMD17-03-1-0537 Principal Investigator Dr Nancy Fiedler) and the add-on
project was funded by the Environmental Protection Agency (EPA) through a STAR
grant to UMDNJ (Grant R832097 Principal Investigator Dr Junfeng Zhang)
The parent study and the add-on project were done using human subject protocols that
were HIPAA compliant and approved by the UMDNJ Institutional Review Board
152 Original Study Data
The main objective of the original parent study was to assess the effects of an
interaction between acute psychological stress and airway inflammation due to diesel
exhaust exposure One hundred and ten healthy men and women between the ages of 18
and 50 were recruited from the community based on the established study criteria Each
subject underwent two exposure conditions one was to diluted exhaust normalized to
PM10 concentration of 300 microgm3 and the other was to filtered clean ambient air of Busch
campus in Piscataway a suburban campus of Rutgers University Both exposure
22
conditions were 1 hour in duration and took place at the Environmental and Occupational
Health Sciences Instituteslsquo (EOHSI) Controlled Environmental Facility (CEF) Each
exposure condition was presented with and without an acute psychological stressor to two
groups of subjects high and low in self reported chemical intolerance (CI)
Study Design 2 (CI) X S (Stress) x 2 (Exposure)
= CI and psychological stress were between subjects factors and exposure was a within subjects factor
The outcome variables of the original study are listed in table 2 For both the diesel
exhaust and clean air exposures the data for the outcome variables were collected as
described in Table 3
The aim of the add-on study was to test the hypothesis that exposure to diesel
exhaust leads to increases in urinary levels of amino-PAHs To test this hypothesis urine
samples were collected from 55 out of the 110 subjects and analyzed for concentrations
of 1-aminopyrene 3-aminobenzanthrone 1-aminonaphthalene and 2-aminonaphthalene
which are metabolites of 1-nitropyrene 3-nitrobenzanthrone 1-nitronaphthalene and 2-
nitronaphthalene respectively
1-aminopyrene is the main metabolite produced via the nitro-reduction of 1-
nitropyrene (NTP 1996) making it a potentially good biomarker of diesel exhaust
exposure and susceptibility Therefore this dissertation research will only use the data
collected on urinary levels of 1-aminopyrene from the add-on study
23
Table 12 Controlled Environmental Exposure Study of Diesel Exhaust Outcome Variables
Outcomes Outcome Variables Time Measured
Respiratory Tract Inflammation
Local inflammation in the nasal mucosa
(upper respiratory tract)
Local inflammation in the lower
respiratory tract
Nasal Lavage
Concentration of proteins TNF-α IL-6
and IL-8
Induced Sputum
Concentration of proteins TNF-α IL-6
and IL-8
24 hours post exposure
6 hours post exposure
Acute Phase Response
Peripheral Blood
Absolute number and relative percentage
of neutrophils and blood cells number of
platelets and the concentration of IL-6
levels of C-reactive protein and
fibrinogen
Baseline (pre exposure) 6 and
24 hours post exposure
Symptoms
Symptoms
8 Symptom questionnaires
Baseline (2) during exposure
(3) post expousre (3)
Table 13 Original Study Data Collection Protocol
Time Activity
Pre Exposure 1 Complete symptom questionnaire ndash Qu-1
ExposureStress 1 Complete another symptom questionnaire ndash Qu-2 2 Baseline blood sample ndash B1
3 Baseline CO2 measurement
4 Complete another symptom questionnaire ndash Qu-3
5 Average Heart rate ndash HR-1
6 Pre stress blood ndash B2
7 Complete symptom questionnaire ndash Qu-4 8 Post stress blood ndash B3
9 Average Heart rate ndash HR-2
10 Complete symptom questionnaire ndash Qu-5 11 Complete symptom questionnaire ndash Qu-6
6 hours post exposure 1 Complete symptom questionnaire ndash Qu-7
2 Post exposure blood sample ndash B4 3 Induced sputum
24 hours post
exposure
1 Complete symptom questionnaire ndash Qu-8
2 Post exposure blood sample ndash B5
3 Post exposure Nasal lavage
153 Subjects Demographic Data
The total number of subjects that completed the parent study out of the 110
subjects that were enrolled was 100 and table 4 below gives a demographic summary of
the subjects
24
Table 14 Total Subject Demographic Information Females Males
N Min Max Mean SD N Min Max Mean SD
AGE (years) 36 18 44 2378 596 64 18 43 2408 574
Education (Years) 36 12 22 1542 232 64 12 25 1600 271
Height (inches) 36 58 73 6368 262 64 60 75 6893 272
Weight(lb) 36 100 200 13625 2632 64 125 239 17343 2526
BMI (kgm2) 36 1757 3717 2365 468 64 2080 3586 2566 346
Race Frequency () Frequency ()
Asian Pacific Islander 23 3594 15 4167
Black not Hispanic 5 781 2 556
Hispanic or Latino 11 1719 7 1944
OtherUnknown 1 156 1 277
White not Hispanic 24 3750 11 3056
Education Calculated as High school (12 years) + Years of college or other BMI = (weightheight2) 703
16 Hypothesis and Research Questions
161 Overall Hypothesis
The overall hypothesis of this dissertation research is that sex has an effect on the
occurrence and intensity of diesel exhaust induced local airway and systemic
inflammation acute phase responses and self reported symptomatic responses and also on
the metabolism of 1-nitropyrene with females expected to be responsive to diesel exhaust
exposure than males
The proposed formula of the overall hypothesis is shown as follows
Null Hypothesis Ho = micro(ΔMales) = micro(ΔFemales)
Alternate Hypothesis Hi = micro(ΔMales) ne micro(ΔFemales)
Where micro(ΔMales) is the mean change in the outcome variables of male subjects measured
after exposure to diesel exhaust relative to clean air and micro(ΔFemales) is mean change in the
outcome variables of female subjects measured after exposure to diesel exhaust relative
to clean air
25
162 Research Question 1
Do sex differences exist in the occurrence and intensity of local airway
inflammation between males and females as indicated by differences in the change in the
concentrations of pro-inflammatory cytokines and protein mediators in the cells of the
nasal mucosa and the lower respiratory tract after exposure to diesel exhaust relative to
clean air
a Are there sex differences in the incidence and intensity of nasal inflammation
as indicated by differences in the mean changes in the concentrations of IL-6
IL-8 TNF-α and proteins measured in nasal lavage 24 hours post exposure to
diesel exhaust relative to clean air between males and females
Hypothesis 11 There is a difference in the expression of cytokines and protein
mediators by the nasal mucosal cells of males and females after exposure to diesel
exhaust relative to clean air with females showing a greater local inflammatory response
in the nasal epithelium than males
b Are there sex differences in the incidence and intensity of inflammation in the
lower respiratory tract as indicated by differences in the mean changes in the
concentrations of IL-6 IL-8 TNF-α and proteins measured in induced sputum
6 hours post exposure to diesel exhaust relative to clean air between males and
females
Hypothesis 12 There is a difference in the expression of cytokines and protein
mediators by the cells of the lower respiratory tract of males and females after exposure
to diesel exhaust relative to clean air with females showing a greater local inflammatory
response in the lungs than males
26
163 Research Question 2
Do sex differences exist in the occurrence and intensity of systemic inflammation
and acute phase responses between males and females as indicated by differences in the
changes in the concentrations of pro-inflammatory cytokines mediators and acute phase
proteins in peripheral blood after exposure to diesel exhaust relative to clean air
a Are there sex differences in the incidence and intensity of systemic
inflammation as indicated by differences in the mean changes of the levels of
c-reactive proteins fibrinogen the absolute number and relative percentage of
blood cells number of platelets and the mean change in the concentration IL-6
in peripheral blood post exposure to diesel exhaust and relative to clean air
between males and females
Hypothesis 21 There is a difference in the expression of cytokines blood cells c-
reactive protein and fibrinogen in peripheral blood after exposure to diesel exhaust
relative to clean air between males and females with females showing a greater systemic
inflammatory response than males
164 Research Question 3
Do sex differences exist in self reported health symptoms collected after acute exposure
to diesel exhaust relative to clean air between males and females
a Are there sex differences in self reported symptoms collected post exposure to
diesel exhaust relative to clean air between males and females
27
Hypothesis 31 There is a difference in self reported symptoms collected post diesel
exhaust exposure relative to clean air between males and females with females reporting
higher symptoms than males
165 Research Question 4
Do sex differences exist in the metabolism of 1-nitropyrene as indicated by changes in
the concentration of urinary 1-aminopyrene levels following diesel exhaust exposure
relative to clean air between males and females
a Are there sex differences in urinary levels of 1-aminopyrene post exposure to
diesel exhaust relative to clean air between males and females
Hypothesis 41 There is a difference in the concentration of urinary levels of 1-
aminopyrene after diesel exhaust exposure relative to clean air between males and
females with females excreting a higher concentration of 1-aminopyrene than males
28
References
Arbuckle TE 2006 Are there sex and gender differences in acute exposure to
chemicals in the same setting Environmental Research101 pg 195-204
Becklake MR and Kauffmann F 1999 Gender differences in airway behavior over
the human life span Thorax 54 pg 1119-1138
Brook RD Franklin B Cascio W Hong Y Howard G Lipsett M Luepker R
Mittleman M Samet J Smith SC Tager I 2004 Air Pollution and Cardiovascular
Disease A Statement for Healthcare Professionals From the Expert Panel on
Population and Prevention Science of the American Heart Association Circulation
109 pg 2655 ndash 2671
Chae YH Thomas T Guengerich P Fu PP and El-Bayoumy K 1999
Comparative Metabolism of 1- 2- and 4-Nitropyrene by Human Hepatic and
Pulmonary Microsomes Cancer Research 59 pg 1473-1480
Christian MS 2001 IntroductionOverview Gender-Based Differences in
Pharmacologic and Toxicologic Responses International Journal of Toxicology 20
pg 145-148
Clougherty JE 2010 A Growing Role for Gender Analysis in Air Pollution
Epidemiology Environmental Health Perspectives 118 pg 167 ndash 176
Czerniak R Gender-Based Differences in Pharmacokinetics in Laboratory Animal
Models 2001 International Journal of Toxicology 20 pg 161-163
Diaz-Sanchez D and Riedl M 2005 Diesel effects on human health a question of
stress American Journal of Physiology ndash Lung Cellular and Molecular Physiology
289 pg L722-L723
Diaz-Sanchez D Tsien A Casillas A Dotson AR and Saxon A 1996 Enhanced
nasal cytokine production in human beings after in vivo challenge with diesel exhaust
particles Journal of Allergy and Clinical Immunology 98 pg114-123
Dimich-Warda H Campa PG and Kennedy SM 2006 Gender differences in
respiratory symptomsmdashDoes occupation matter Environmental Research 101 pg
175ndash183
Donaldson K Stone V Seaton A and MacNee W 2001 Ambient Particle Inhalation
and the Cardiovascular System Potential Mechanisms Environmental Health
Perspectives 109(supplement 4) pg 523-527
Ersntgard L Sjogren B Warholm M and Johanson G 2003 Sex differences in
toxicokinetics of inhaled solvent vapors in humans 1 m-Xylene Toxicology and
Applied Pharmacology 193 pg 147-157
29
Faustman E and Omenn G Risk Assessment in Klaassen CD (eds) Casarett and
Doulllsquos Toxicology The Basic Science of Poisons 6th
ed New York Macmillan
2001 pg 83-104
Fortoul TI Moncada-Henandez S Saldivar-Osorio L Espejel-Maya G Mussali-
Galante P Avila-Casado MC Colin-Barenque L Hernandez-Serrato MI and
Avila-Costa MR 2005 Sex differences in bronchiolar epithelium response after the
inhalation of lead acetate (Pb) Toxicology 207 pg 323-330
Franklin M Zeka A Schwartz J 2007 Association between PM25 and all-cause and
specific-cause mortality in 27 US communities Journal of Exposure Science and
Environmental Epidemiology17 pg 279 ndash 287
Frumkin H and Thun MJ 2001 Diesel Exhaust Environmental Carcinogens 51 pg
193-198
Furuyama A Hirano S Koike E and Kobayashi T 2006 Induction of oxidative
stress and inhibition of plasminogen activator inhibitor-1 production in endothelial
cells following exposure to organic extracts of diesel exhaust particles and urban fine
particles Archives of Toxicology 80 pg 154-162
Gabay C and Kushner J 1999 Acute phase proteins and other systemic responses to
inflammation New England Journal of Medicine 340 pg 448ndash54
Gochfeld M 2007 Framework for gender differences in human and animal
toxicology Environmental Research 104 pg 4-21
Howard PC Consolo MC Dooley KL and Beland FA 1995 Metabolism of 1-
nitropyrene in mice Transport across the placenta and mammary tissues Chemico-
Biological Interactions 95 pg 309 ndash 325
Kaewamatawong T Banlunara W Bintvihok A Morita T and Shimada A 2008 Acute
and Subacute Pulmonary effects of Low Dose of Diesel Exhaust Particles in Mice
Pathological Changes and Translocation Pathways to the Circulation Proceedings
the 15th Congress of FAVA 27-30 October FAVA -OIE Joint Symposium on
Emerging Diseases Bangkok Thailand pg 371 ndash 374
Kan H Heiss G Rose KM 2007 Traffic exposure and lung function in adults the
Atherosclerosis in Communities study Thorax 62 pg 873 ndash 879
Kan H London SJ Chen G Zhang Y Song G Zhao N et al 2008 Season sex age and
education as modifiers of the effects of outdoor air pollution on daily mortality in
Shanghai China the Public Health and Air Pollution in Asia (PAPA) study Environ
Health Perspectives 116 pg 1183 ndash 1188
30
Luginaah IN Fung KY Gorey KM Webster G Wills C 2005 Association of
ambient air pollution with respiratory hospitalization in a government-designated
―area of concern the case of Windsor Ontario Environ Health Perspectives 113
pg 290 ndash 296
Messing K and Stellman JM 2006 Sex gender and womenlsquos occupational health
The importance of considering mechanism Environmental Research 101 pg 149-
162
National Toxicology Program Toxicity Report Series Number 34 1-Nitropyrene
Administered by Inhalation to F344N Rats NIH Publication 96-3383 1996
Nightingale JA Maggs R Cullinan Donnelly LE Rodgers DF Kinnersley R
Chung KF Barnes PJ Ashmore M and Newman-Taylor A 2000 Airway
Inflammation after Controlled Exposure to Diesel Exhaust Particles American
Journal of Respiratory and Critical Care Medicine 162 pg 161-166
Nordenhall C Pourazar J Blomberg A Levin J-O Sandstrom T and Adelroth E
2000 Airway inflammation following exposure to diesel exhaust a study of time
kinetics using induced sputum European Respiratory Journal 15 pg 1046-1051
Peters A Frohlich M Doring A Immervoll T Wichmann H-E Hutchinson WL
Pepys MB and Koening W 2001 Particulate air pollution is associated with an
acute phase response in men European Heart Journal 22 pg 1198-1204
Pourazar J Mudway IS Samet JM Helleday R Blomberg A Wilson S Frew
AJ Kelly FJ and Sandstrom T 2005 Diesle Exhaust activates redox-sensitive
transcription factors and kinases in human airways American Journal of Physiology ndash
Lung Cellular and Molecular Physiology 289 pg L724-L730
Relling MV Lin JS Ayers GD and Evans WE 1992 Racial and gender differences
in N-acetyltransferase xanthine oxidase and CYP1A2 activities Clinical
Pharmacology and Therapeutics 52 pg 643 ndash 58
Riedl M and Diaz-Sanchez D 2005 Biology of diesel exhaust effects on respiratory
function Journal of Allergy and Clinical Immunology 115 pg 221-8
Rogers A and Davies B 2005 Diesel Particles ndash Recent Progress on an Old Issue
Annals of Occupational Hygiene 49 (6) pg 453-456
Salvi S Blomberg A Rudell B Kelly F Sandstrom T Holgate ST and Frew A
1999 Acute Inflammatory Responses in the Airway and Peripheral Blood After
Short-Term Exposure to Diesel Exhaust in Healthy Human Volunteers American
Journal of Respiratory and Critical Care Medicine 159 pg 702-709
31
Salvi S and Holgate ST 1999 Mechanisms of particulate matter toxicity Clinical
and Experimental Allergy 29 pg 1187-1194
Salvi S Nordenhall C Blomberg A Rudell B Pourazar J Kelly F Wilson S
Sandstrom T Holgate ST and Frew A 2000 Acute Exposure to Diesel Exhaust
increase IL-8 and GRO-α Production in Healthy Human Airways American Journal
of Respiratory and Critical Care Medicine 161 pg 550-557
Saxton A and Diaz-Sanchez D 2000 Diesel exhaust as a model xenobiotic in
allergic inflammation Immunophamacology 48 pg 325-327
Shimada A Kawamura N Okajima M Kaewamatawong T Inoue H and Morita T
2006 Translocation Pathway of the Intratracheally Instilled Ultrafine Particles from
the Lung into the Blood Circulation in the Mouse Toxicologic Pathology 34 pg 949
ndash 957
Silvers KJ Couch LH Rorke EA and Howard PC 1997 Role of nitroreductases but
not cytochromes P450 in the metabolic activation of 1-nitropyrene in the HepG2
human hepatoblastoma cell line Biochemical Pharmacology 54 pg 927 ndash 936
Sunyer J Jarvis D Gotschi T Garcia-Esteban R Jacquemin B Aguilera I Ackerman
U de Marco R Forsberg B Gislason T Heinrich J Norbaumlck D Villani S Kuumlnzli
N 2006 Chronic bronchitis and urban air pollution in an international study
Occupational and Environmental Medicine 63 pg 836 ndash 843
Tornqvist H Mills NL Gonzalez M Miller MR Robinson SD Megson IL
MacNee W Donaldson K Soderberg S Newby DE Sandstrom T and Blomberg
A 2007 Persistent endothelial dysfunction following diesel exhaust inhalation in
man American Journal of Respiratory and Critical Care Medicine 176 pg 395 ndash pg
400
US EPA 2002 Health assessment document for diesel engine exhaust US
Environmental Protection Agency Document EPA6008-90057F
Vahter M Gochfeld M Casati B Thiruchelvam M Falk-Filippson A Kavlock R
Marafante E and Cory-Slechta D 2007 Implications of gender differences for
human health risk assessment and toxicology Environmental research 104 pg 70-84
Van Eeden SF Tan WC Suwa T Mukae H Terashima T Fujii T Qui D
Vincent R and Hogg JC 2001 Cytokines Involved in Systemic Inflammatory
Response Induced by Exposure to Particulate Matter Air Pollutants (PM10) American
Journal of Respiratory and Critical Care Medicine 164 pg 826-830
32
Chapter 2
Analysis of Sex Differences in Airway Inflammatory Response
after Acute Diesel Exhaust Exposure
33
21 Abstract
22 Introduction
23 Toxicokinetics of Diesel Exhaust in Human Nasal and Airway Passages
231 Hypothesized Mechanism of Adverse Reaction to Inhaled Diesel Exhaust
24 Nasal Lavage and Sputum Induction Studies
25 Sex Differences in Innate Immune Response
26 Materials and Methods
261 Data Collection
262 Subjects Demographic Data
263 Exposure Conditions and Experimental Design
264 Nasal Lavage Sample Collection
265 Nasal Lavage Sample Analysis
266 Sputum Sample Collection
267 Sputum Sample analysis
268 Airway Markers of Inflammation
27 Statistical Methods
271 Calculation of Response Measure
28 Results
281 Study Aim Interaction Effect of Diesel Exhaust Exposure and Sex
29 Discussion
291 Study Limitations
210 Conclusions
Appendix A
References
34
21 Abstract
Background Inhalation of diesel exhaust in humans has been associated with
local immune and inflammatory responses in the upper and lower respiratory
airways Studies have shown that there is a sexual dimorphism in immune
response with females having a stronger immune reactivity than males
Aims To evaluate possible differences between females and males in local
immune and inflammatory responses in the upper and lower respiratory airways
after a controlled environmental exposure to diesel exhaust
Methods In a crossover design study healthy human subjects were exposed to
300microgm3 of diesel exhaust and to clean air in random order for 1 hour each in a
controlled environmental exposure chamber on two different days (ge1 week
washout) Fluid from the lungs were collected from subjects via sputum induction
6 hours after each exposure and nasal mucosal cells and fluid were collected from
subjects via nasal lavage 24 hours after each exposure Cytokines (TNF-α IL-6
and IL-8) and total protein were measured in sputum and nasal lavage Statistical
analysis was done using Mann-Whitney U Test
Results There was a difference between males and females in the concentrations
of cytokines and total protein in the nasal lavage analyte and sputum after
exposure to diesel exhaust relative to clean air exposure but except for TNF-α (p
= 0051) in the nasal lavage analyte these observed sex differences were not
statistically significant In the nasal lavage analyte males showed a diesel exhaust
attributable mean increase in TNF-α concentration compared to a mean decrease
in females
Conclusion Our results suggest that 24 hours after acute exposure to 300microgm3
of diesel exhaust males have a stronger inflammatory response in the upper
airway than females as indicated by a statistically significant difference in nasal
TNF-α concentration between males and females with males showing a mean
increase in TNF-α concentrations compared to a mean decrease in females
22 Introduction and Background
Air pollution is a major source of nasal and airway irritation Diesel exhaust is a
significant contributor to ambient air pollution and the largest single source of airborne
particulate matter (PM) in many urban areas (Riedl and Diaz-Sanchez 2005) Across
populations exposures may be acute or chronic and the exposure amounts may be either
high or low depending on the temporal and spatial distribution of diesel exhaust sources
Inhalation of diesel exhaust is the primary route of exposure and has been shown
to cause various health effects Overall chronic inhalation exposure to diesel exhaust is
35
likely to pose a lung cancer hazard to humans as well as damage the lungs in other ways
depending on the length and intensity of the exposure (USEPA HAD 2002 Donaldson et
al 2001) While acute exposure to diesel exhaust can cause acute irritation (eg eye
nose throat bronchial) neurophysiological symptoms (eg lightheadedness nausea)
inflammatory responses in the airway and the lungs respiratory symptoms (cough
phlegm) there is also evidence for an immunologic effect (the exacerbation of allergenic
responses to known allergens and asthma-like symptoms) and cardiovascular effects
(USEPA HAD 2002 Donaldson et al 2001)
23 Toxicokinetics of Diesel Exhaust in Human Nasal and Airway Passages
The biological effects of diesel exhaust particles (DEPs) are a function of their
deposition and clearance in the airway (USEPA HAD 2002) DEPs are made up of fine
particles (diameter lt25microm) including a subgroup with a large number of ultrafine
particles (diameter lt01 microm) (USEPA HAD 2002) In humans inhalation can occur via
the nose mouth or both and upon inhalation the deposition of DEPs will occur
throughout the respiratory tract (see figure 1 below) Primarily the deposition pattern of
DEPs in the airway is influenced by particle size but there are other factors that can alter
the deposition of DEPs in humans including sex age particle size and pre-existing
respiratory tract disease (USEPA HAD 2002)
Following deposition the subsequent clearance of DEPs is affected by the
solubility of the particles DEPs are poorly soluble particles and so they are primarily
cleared by non absorptive process which involves the removal of the intact particles This
means that when there is an override of the clearance mechanisms of the nasal and airway
36
passages this will lead to not only prolonged contact between the cells and the DEPlsquos but
also to other organic compounds that are adsorbed onto the large surface area of DEPs as
well as small amounts of sulfate nitrate metals and other trace elements (USEPA HAD
2002)
Figure 21 The Human Respiratory System
Source httpwwwecgccacleanair-airpurdefaultasplang=Enampn=FCAFC364-1 (Reproduced with permission from Environment
Canada)
231 Hypothesized Mechanism of Adverse Reactions to Inhaled Diesel Exhaust
It is hypothesized that this prolonged contact between DEPs and the cells of the
airway gives rise to the cascading events that follow diesel exhaust exposure and which
leads to the adverse health effects that have been observed These cascading events are
thought to be heavily influenced by pro-inflammatory cytokines and chemokines which
are released from affected cells in response to the immune and local inflammation
response caused by diesel exhaust and that these cytokines also have an added
37
inflammatory effect on the surrounding cells and that they also modify the production of
acute phase proteins by the liver thereby leading to adverse cardiovascular effects
Some studies that have been done to date have confirmed that inhalation of diesel
exhaust does produce a local immune and inflammatory response (Nightingale et al 2000
Diaz et al 1996 and Nordenhall et al 2000) in the upper and lower respiratory airways
Also the roles of pro-inflammatory cytokines in increasing inflammation in response to
diesel exhaust exposure has been well documented (van Eeden et al 2001) but the initial
cause of the inflammatory process which stimulates the release of these cytokines is still
under debate
One leading thought is that the inflammation is instigated by oxidative stress
(Furuyama et al 2006 Diaz-Sanchez and Riedl 2005 Salvi and Holgate1999) caused by
the subsequent prolonged contact of the metals PAHs and quinines contained in diesel
exhaust particles (DEPs) with the epithelial and macrophage cells of the nose and lungs
when the natural lung safety mechanisms become overwhelmed
Normally the lungs are able to deal with the isolation neutralization and removal
of inhaled diesel exhaust and other xenobiotics or air pollutants via various mechanisms
but these natural defense mechanisms can often become overwhelmed for a variety of
reasons including illness or high burden of pollutants and this can then lead to the adverse
health effects mentioned above (Salvi and Holgate 1999) The epithelial and macrophage
cells are the initial target cells for particle interaction and deposition and thus are thought
to be the initial site of toxicity (Salvi et all 1999)
This breakdown in the safety mechanism then leads to the generation of reactive
oxygen species (ROS) that activate and mobilize immune and inflammatory cells via
38
oxidative stress causing the activation of redox-sensitive transcription factors and thus
changing the expression of many pro-inflammatory cytokines (Ritz et al 2005 van Eeden
et al 2001) These pro-inflammatory cytokines include interleukin 6 (IL-6) interleukin 1β
(IL-1β) Tumor necrosis factor α (TNF-α) interferon γ (IFN-γ) transforming growth
factor β2 interleukin 8 (IL-8) (Gabay C et all 1999) This oxidative stress initiated
inflammation is thought to either directly cause or trigger other mechanisms that are
behind the effects that have been seen in in-vitro and in-vivo studies
Usually the cells of the airway are able to effectively reduce the cycle of ROS
generation and inflammation using the cells natural defenses but the oxidative stress that
leads to the immune and inflammatory response usually happens when these defenses are
overwhelmed (Riedl and Diaz-Sanchez 2005) for a variety of reasons including illness or
high burden of pollutants and as mentioned before these can cause an override of the
clearance mechanisms of the nasal and airway passages thus leading to inflammation and
other adverse health effects (Salvi and Holgate 1999)
24 Nasal Lavage and Sputum Induction Studies
In humans experimental and clinical evidence from diesel exhaust exposure
studies that have been done so far to look at the ability of inhaled DEPs to initiate
inflammation in the nasal and airway passages have shown varying responses Studies
done using high concentrations of DEPs have provided evidence of airway inflammation
and studies done using lower concentrations of DEPs have provided less clear-cut
inflammatory responses (Behndig et al 2006 Diaz-Sanchez et al 1996 Salvi et al 2000
39
Nightingale et al 2000 Nordenhall et al 2000 Sydbom et al 2001 and Takizawa et al
2000)
Particularly with regards to the mechanism of diesel exhaust induced airway
inflammation these studies have also helped to confirm that acute cell mediator and
cytokine responses along with the enhanced expression of vascular adhesion molecules in
the airway mucosa could represent an early stage in the inflammatory response following
diesel exhaust exposure (Sydbom et al 2001) This mechanism also might be important in
the development of the diesel exhaust induced airway inflammation (Sydbom et al 2001)
This early stage local inflammatory response is part of the bodylsquos innate immune
response to irritation or injury caused by inhaled foreign particles like DEPs
25 Sex Differences in Innate Immune Response
Innate immunity is the bodylsquos non-specific first active line of defense to harmful
foreign agents It is designed to eliminate or control the injury or infection caused by
these agents by phagocytosis the release of enzymes to degrade these agents and the
activation of the adaptive immune response via cytokine release and cell to cell
interactions which results in a more specific and robust immune response (Bird et al
2008 and Casarett and Doulls 2001) There is an established sexual dimorphism in
immune response with females having a stronger immune reactivity than males (Da Silva
1995) This suggests that sex is an important determinant of the amplitude of the innate
immune response especially since the effects of cytokines can be inhibited or enhanced
by sex hormones (Gabay et al 1999)
40
In-vitro sex hormones have been shown to modulate the production of different
pro-inflammatory cytokines that are involved in immune responses like IL-6 thus
indicating the potential role of sex hormones in the sexual dimorphism of the immune
system (Da Silva 1995) While in-vivo the interactions between sex hormones and other
immunomodulatory factors like glucocorticoids are thought to mediate an indirect action
of sex hormones on the immune system (Da Silva 1995) Therefore they have the
potential to cause variations by sex on the onset of local inflammation as part of the
bodylsquos initial innate immune response that has been demonstrated to happen in response
to diesel exhaust exposure For example in-vivo estrogen has a rapid non-genomic effect
that protects organs from damage and attenuates physiological insult induced
inflammation (Bullard et al 2010)
So with regards to airway induced inflammation either via the direct modulation
(suppression or expression) of cytokines or via the indirect modulation of the immune
system it can be hypothesized that sex hormones have the potential to cause a variation
in the local airway immune and inflammatory response of females and males in response
to diesel exhaust exposure
Therefore the purpose of this study is to determine whether there are sex
differences in the occurrence and intensity of local airway inflammation of females and
males as indicated by the potential variation in the levels of soluble proteins and pro-
inflammatory cytokines in nasal lavage and sputum induction samples collected after
exposure to diesel exhaust relative to clean air
41
26 Materials and Methods
261 Data Collection
The data that were used for this study are part of the datasets generated from a
previous study of diesel exhaust effects The study was funded by the Department of
Defense (DOD) through a grant to the University of Medicine and Dentistry of New
Jersey (UMDNJ) (Grant DAMD17-03-1-0537 Principal Investigator Dr Nancy
Fiedler) The study was done using a human subject protocol that was HIPAA compliant
and approved by the UMDNJ Institutional Review Board
262 Subjects Demographic Data
110 healthy non-smoking men and women between the ages of 18 and 50 were
recruited from the local community in Piscataway New Jersey based on the established
study criteria 100 subjects completed the study Out of these subjects 18 subjects
consented and provided viable nasal lavage samples and 36 subjects consented and
provided viable sputum samples for analysis
Table 21 Demographic and Baseline Subject Characteristics for Nasal Lavage Subjects Females N = 7 Males N = 10
Min Max Mean SD Min Max Mean SD
AGE (years) 19 43 2571 824 18 33 2390 502
Height (inches) 62 65 6350 135 65 73 6805 246
Weight(lb) 104 200 15857 3800 125 192 15950 2122
Education (years) 12 17 15 183 12 20 16 267
Respiration 14 20 1629 180 14 20 1680 235
Temperature oF M 979 994 9852 054 981 991 9838 031
Pulse 60 88 72 924 60 92 6960 1049
Race Frequency () Frequency ()
Asian Pacific
Islander
1 (1429) 5 (50)
Black not Hispanic 1 (1429) 1 (10)
OtherUnknown 1 (1429) 0 (0)
White not Hispanic 4 (5713) 4 (40) One subject had an incomplete dataset and so was excluded for the analysis so Total N = 17 M = some subjects had missing data N = 6 for Females and N = 9 for Males
Education Calculated as High school (12 years) + Years of college or other
42
Table 22 Demographic and Baseline Subject Characteristics for Sputum Induction Subjects Females N = 9 Males N = 27
Min Max Mean SD Min Max Mean SD
AGE (years) 18 44 2589 1007 18 41 2293 460
Height (inches) 60 66 6292 218 64 73 6907 262
Weight(lb) 112 200 13822 3342 140 236 18080 2879
Education (years) 12 16 1422 130 12 20 1589 212
Respiration M 14 20 16 20 12 40 1674 503
Temperature oF M 98 99 9843 064 96 99 9800 081
Pulse M 54 76 6743 789 48 84 6830 949
Race Frequency () Frequency ()
Asian Pacific
Islander
3 (3334) 12 (4444)
Black not Hispanic 1 (1111) 1 (370)
Hispanic or Latino 1 (1111) 5 (1852)
OtherUnknown 0 (0) 1 (370)
White not Hispanic 4 (4444) 8 (2963) M = some subjects had missing data For Temperature N = 6 for Females and N = 26 for Males For Pulse and Respiration
N = 6 for Females
Education Calculated as High school (12 years) + Years of college or other
263 Exposure Conditions and Experimental Design
A crossover study design was used in which each subject acted as their own
controls and underwent two exposure conditions at two separate times in random order
with a minimum one week wash out period between exposures one was to diluted diesel
exhaust normalized to PM10 concentration of 300microgm3 and the other was to filtered clean
ambient air of Busch campus in Piscataway a suburban campus of Rutgers University
Both exposure conditions were 1 hour in duration and took place at the Environmental
and Occupational Health Sciences Instituteslsquo (EOHSI) Controlled Environmental Facility
(CEF)
There were no significant differences in the exposure conditions for all subjects
Overall the concentration of PM10 that the subjects were exposed to was 276plusmn13microgm3
which was close to the target concentration of 300microgm3
Table 23 Mean Air Characteristics and Composition Diesel Exhaust Clean Air
PM10 (microgm3) 276 plusmn 13 6 plusmn 5
NOX (ppm) 363 plusmn 090 002 plusmn 002 CO (ppm) 379 plusmn 076 091 plusmn 021
1 Nitropyrene (ngm3) 268 plusmn 051 lt006
43
264 Nasal Lavage Sample Collection
The nasal lavage procedure was adapted from Koren amp Devlin (1992) and was
performed 24 hours after each exposure While seated the subjects were asked to tilt their
heads backwards at an approximate 45 degree angle Using a sterile needle-less syringe
with a blunt plastic tip 5 ml of warmed (body temperature 37 degree centigrade) sterile
normal saline was instilled into one nostril Subjects were asked to hold their breath and
perform a partial swallow in order to raise the soft palate and hold the fluid in the nasal
cavity After retaining the saline for 10 seconds the subjects were then asked to tilt their
heads forward and allow the fluid to drain passively into a sterile collection cup for 30
seconds This procedure was repeated in the other nostril Each nostril was washed two
times
265 Nasal Lavage Sample Analysis
After collection a portion of the sample was run through syringe-mounted filters
to remove mucous and cell debris This resulting filtrate was frozen immediately on dry
ice in aliquots and then stored at -80 C for subsequent soluble protein and cytokine
analysis using a commercially available enzyme-linked immunosorbent assay (ELISA)
kits This was done consistent with the work of Diaz-Sanchez et al in 1996
266 Sputum Sample Collection
Sputum induction was performed at about 6 hours post-exposure Subjects were
pre-medicated with an inhaled salbutamol (200 microg) to inhibit possible airway constriction
during the sputum induction Using the method described by Pin et al (1992) and
modified by Pizzichini (1996) subjects inhaled increasing concentrations of saline (3 4
44
and 5) for 7 minutes each through a mouthpiece without a valve or nose clip The
aerosol was generated by an Ultraneb 99 ultrasonic nebulizer with an output of 087
mlmin and aerodynamic mass median diameter of 558 um After each period of
inhalation a forced expiratory volume after 1 second (FEV1) was measured for safety
Then subjects were asked to rinse their mouths swallow some water and blow their nose
in order to minimize contamination by saliva or post nasal drip Subjects were then asked
to cough sputum into a sterile container for sample collection
267 Sputum Sample Analysis
Sputum samples were processed as soon as possible usually within 2 hours after
expectoration Sputum was poured into a petri dish Using blunt forceps all portions
that appeared to be free of salivary contamination (up to 1 gm) were placed in a tared 15
ml polystyrene tube and weighed Four times the volume of 01 dithiotheitol (DTT) in
distilled water was added to dissociate disulfide bonds in the mucous The mixture was
vortexed for 15 sec and then rocked on a platform for 15 minutes to ensure mixing To
terminate the reaction 4 volumes of phosphate buffered saline (PBS) were added and the
mixture was rocked for 5 additional minutes The suspension was filtered through a 48
microm nylon gauze to remove cell debris and mucus The resulting clear suspension was
then centrifuged at 790 x g for 10 min and the supernatant was aspirated and stored in six
Eppindorf tubes at ndash70 C for later assay
The pellet was re-suspended in a volume of PBS 200 to 600 microl depending on
macroscopic size and the total cell counts were determined using a hemocytometer Cell
viability was determined with the trypan blue exclusion method The total and absolute
45
number of cells per milligram processed sputum was calculated Three samples of 75 microL
of the cell suspension adjusted to 1 x 10⁶
ml were cytospun at 150 x g for 6 min Slides
were air dried and stained with Wrightlsquos Giemsa stain Nonsquamous cells (n = 400)
were counted The results were expressed as percentage of total nonsquamous cells The
levels of soluble proteins IL-6 IL-8 and TNF-α in the induced sputum were measured
using commercially available ELISA plates (RampD Systems UK)
268 Airway Markers of Inflammation
Only 17 out of the 18 subjects that consented for nasal lavage had a complete set
of samples that were collected 24 hours after both exposures Therefore the subject with
the missing sample was excluded from the analysis All 36 subjects that consented for
sputum induction had a complete set of samples and so they were all included in the
analysis Total protein and cytokine (IL-6 IL-8 and TNF-α) concentrations as measured
from the nasal lavage and sputum induction samples were used as markers of local upper
and lower airway inflammation
In an attempt to control for the possible dilution of the nasal lavage and sputum
samples the cytokine concentrations were normalized using the total protein
concentration Since this is not yet an established method all analysis was done using the
actual concentrations of cytokines measured in nasal lavage and sputum analytes and the
normalized concentrations
46
27 Statistical Methods
Descriptive statistical analysis histograms and box plots were used to evaluate the
distribution of the airway inflammatory marker variables (soluble proteins and cytokines)
and the results indicated that the variables were not normally distributed so non
parametric statistical methods were used for all further analysis
271 Calculation of Response Measures
The main objective of this study is to look at sex differences in the occurrence and
intensity of local airway inflammation as indicated by the potential variation in the levels
of upper and lower airway markers of inflammation (soluble proteins and cytokines) after
exposure to diesel exhaust relative to clean air Therefore for the protein and cytokines
the response measure was the difference between the concentrations measured in nasal
lavage and sputum samples post diesel exhaust exposure and post clean air exposure
Response Measure = ProteinCytokine DE-CA = ProteinCytokine DE - ProteinCytokine CA
The inflammatory response measures were not normally distributed Therefore to address
the aim of the paper the non parametric Mann-Whitney U Test was performed to see if
there was a significant difference in the inflammatory response measures between sex
groups (male females) in nasal lavage and sputum induction samples
All statistical analysis for this paper were done using SPSS software
Version 170 (SPSS inc Chicago IL) and SAS software Version 91 of the SAS System
for Windows (SAS Institute Inc Cary NC USA) Also some graphs were created using
Microsoft Excel 2007 P-values less than or equal to 005 were considered to be
significant
47
Table 24 Difference in Soluble Proteins and Cytokines Measured in the Nasal Lavage Analyte 24
Hours after Exposure to Clean Air and Diesel Exhaust
Females N = 7 Males N = 10
Variables Min Max Mean SD Min Max Mean SD
Protein -13879 8221 -1942 7123 -32777 68970 5829 26832
TNF-α -5535 4896 -380 3316 -582 12096 3413 3496
IL-6 -885 103 -165 348 -710 9880 900 3172
IL-8 -4475 5169 845 3261 -5602 13653 3093 5828
TNF-αProtein 015 196 0685 061 011 062 039 020
IL-6Protein -008 002 -0024 004 -006 028 002 010
IL-8Protein -031 044 -004 029 -086 026 -011 038
Data as presented = Concentrations measured after DE ndash Concentrations measured after CA Protein concentrations are presented as
microgml The cytokines concentrations are presented as pgml and Normalized cytokine concentrations are presented as mgg of total
protein
Table 25 Difference in Soluble Proteins and Cytokines Measured in Sputum 6 Hours after Exposure
to Clean Air and Diesel Exhaust
Females N = 9 Males N = 27
Variables Min Max Mean SD Min Max Mean SD
Protein -714300 207073 -88086 261421 -816692 4974300 133433 1048781
TNF-α -15247 43934 5249 16516 -55488 33318 1420 15464
IL-6 -7195 7877 2477 4470 -6201 16953 307 4514
IL-8 -2803 24268 9361 8100 -34574 46912 1329 17952
TNF-αProtein 000 005 001 002 -007 004 000 002
IL-6Protein 000 001 000 000 000 003 000 001
IL-8Protein 000 002 001 001 -003 005 000 002
Data as presented = Concentrations measured after DE ndash Concentrations measured after CA Protein concentrations are presented as
microgml The cytokines concentrations are presented as pgml and Normalized cytokine concentrations are presented as mgg of total
protein
Graph 21
48
Graph 22
28 Results
281 Study Aim Interaction Effect of Diesel Exhaust Exposure and Sex
Nasal Lavage Analytes
With the exception of TNF-αDE-CA the Mann-Whitney test of the effect of diesel
exhaust exposure by sex (males vs females) revealed no statistically significant two way
interaction effect (exposuresex) on the concentrations of the upper airway inflammatory
response measures (see table 6a below) There was a statistically significant two way
interaction (exposuresex) effect on the concentration of TNF-αDE-CA (p = 0051) between
females (Md = -120 N = 7) and males (Md = 3193 N = 10) The results indicated that
diesel exhaust caused a mean decrease in TNF-α concentrations in females (TNF-αDE-CA
= -127) and a mean increase in TNF-α concentrations in males (TNF-αDE-CA = 3193)
relative to clean air
49
Table 26a Two Way Interaction Significance Test Results and Nasal Analyte Concentrations for the
Difference in the Concentrations of Proteins and Cytokines Measured in Nasal Lavage Samples 24 Hours
after Exposure to Diesel Exhaust and Clean Air
Females Males
Variables Mean Median Mean Median Mann-Whitney U p-value r
Protein -1942 -214 5829 2989 2800 050 -017
TNF-α -380 -120 3413 3193 1500 0051 -047
IL-6 -165 000 900 114 2250 022 -030
IL-8 845 960 3093 2667 3000 063 -012
TNF-αProtein 0685 062 039 041 2200 021 -031
IL-6Protein -0024 000 002 000 2400 028 -026
IL-8Protein -004 -010 -011 -000 3500 100 000
Protein concentrations are presented as microgml The Cytokines concentrations are presented as pgml and normalized cytokine
concentrations are presented as mgg of total protein r = Effect size calculated as z score square root of N (Cohen 1988)
DE = diesel exhaust and CA = Clean air
Table 26b Mean Ranks for TNF-α DE-CA Measured in Nasal Lavage Samples 24 Hours
after Exposure to Diesel Exhaust and Clean Air
Sex Mean Rank Sum of Ranks
TNF-α Females 614 4300
Males 1100 11000
Total
Mean ranks calculated using Mann U Whitney statistical procedure
Graph 23
The horizontal Lines connect TNF-α concentrations from
Nasal Lavage samples collected from each subject after both exposures by sex (Females N = 7 and Males N = 10)
50
Graph 24 Boxplot of Median TNF-α Concentrations by Sex and Exposure
For most of the remaining cytokines and the total protein although not statistically
significant the mean difference (eg IL-8DE-CA) was lower for females than in males after
diesel exhaust exposure relative to clean air
Sputum Analytes
The Mann-Whitney test of the effect of diesel exhaust exposure by sex (males vs
females) showed no statistically significant two way interaction effect (exposuresex) on
the concentrations of the lower airway inflammatory response measures
Table 27 Two Way Interaction Significance Test Results and Sputum Analyte Concentrations for the
Difference in the Concentrations of Proteins and Cytokines Measured in Sputum Induction Samples 6
Hours after Exposure to Diesel Exhaust and Clean Air Females Males
Variables Mean Median Mean Median Mann-Whitney U Z score p-value r
Protein -88086 -17065 133433 -48108 11800 -013 090 -002 TNF-α 5249 696 1420 371 11200 -035 073 -006 IL-6 2477 2934 307 480 7800 -159 011 -026 IL-8 9361 8687 1329 348 7100 -185 0065 -031 TNF-αProtein 001 000 000 000 10700 -053 060 -009 IL-6Protein 000 000 000 000 7800 -159 011 -026 IL-8Protein 001 001 000 000 8800 -122 022 -020
Protein concentrations are presented as microgml The Cytokines concentrations are presented as pgml and normalized cytokine
concentrations are presented as mgg of total protein r = Effect size calculated as z score square root of N (Cohen 1988)
DE = diesel exhaust and CA = Clean air
Although not statistically significant for almost all of the cytokines and the total protein
measured in sputum the mean difference (eg IL-8DE-CA) was higher in females than in
males after diesel exhaust exposure relative to clean air
51
29 Discussion
Inflammation is a complex biological response to numerous stimuli like
xenobiotics and is marked by vasodilatation and increased capillary permeability (first
phase of inflammation) leukocytic and phagocytic cell infiltration (second phase of
inflammation) and tissue degeneration and fibrosis (third phase of inflammation) all of
which serve as a mechanism to initiate the elimination of the xenobiotic and of any
damaged tissue (Suzer 2007)
Airway epithelial cells which are made up of nasal and bronchial epithelium are
the first cells that come into contact with a variety of xenobiotics such as DEPlsquos Apart
from acting as a physicochemical barrier they also play an important role in initiating and
enhancing host defense mechanisms by producing and releasing a variety of
inflammatory mediators like pro-inflammatory cytokines chemokines and other
inflammatory mediators that are involved in airway inflammatory responses (Purokivi et
al 2001 and Takizawa et al 2000)
Cytokines are soluble glycoproteins that are released by living cells to help
regulate cell functions (lsquoStvrtinovaacute et al 1995) The central role of cytokines is to regulate
immune response by controlling the direction amplitude and duration of immune
responses and they also help to control the remodeling of tissues (lsquoStvrtinovaacute et al 1995)
TNF-α and IL-1szlig are the principal first order pro-inflammatory mediators as they initiate
the amplification and release of other cytokines and they are also involved in the repair of
processes in the nasal mucosa (Ertan et al 2007 and Purokivi et al 2001)
Cytokines are mostly produced by activated macrophages and can cause a cascade
of secondary cytokines like chemokines that attract leukocytes like neutrophils and other
white blood cells to areas of inflammation or immune response as part of the second
52
phase of inflammation (Ganong 1999 and Suzer 2007) There are two main groups of
chemokines ie α and β and the α chemokines eg IL-8 act to attract and activate
neutrophils and are mainly involved in the acute inflammatory response (Suzer 2007 and
lsquoStvrtinovaacute et al 1995) such as has been shown to occur in the airway after exposure to
diesel exhaust
This diesel exhaust induced airway inflammation is time dependent (Nordenhall
et al 2000) meaning that in a controlled environmental study the levels of these
cytokines and mediators will depend on when the sampling is done in relation to the
exposure event One thing that could potentially have an effect on the time kinetics of
diesel exhaust induced airway inflammation is sex This is because sex hormones are
known to regulate immunity creating a dichotomy in immune response to injury between
the sexes leading to differences in immune cell activation infiltration and cytokine
production during and after injury (Bird et al 2008)
Female sex hormones especially estrogen stimulate immune response and male
sex hormones especially testosterone are immunosuppressive (Ertan et al 2007 and
Kovacs et al 2002) thus implying that sex is an important determinant in the amplitude
and intensity of the innate immune response (Imahara et al 2005) that is involved in the
initiation of inflammation in response to diesel exhaust exposure This means that in
addition to seeing a variation in the expression of the inflammatory mediators and
markers by time one could also expect to see a variation in them by sex as well
The lung is the main target organ of diesel exhaust and so it can then be
hypothesized that in response to diesel exhaust exposure (depending on the concentration
and duration of the exposure) upon initiation of the cells of the lungs females will show
53
a stronger and faster up-regulation of the creation and secretion of pro-inflammatory
cytokines This is turn will stimulate the synthesis and release of chemokines leading to
the infiltration of leukocytes and hopefully the isolation removal or degradation of the
DEPs in order to prevent tissue damage So in a controlled environmental study this
stronger and faster response in females would most likely enable them to move quickly
from one phase of inflammation to the other ahead of males possibly leading to the
variation in the amplitude and intensity of inflammatory markers by sex that was seen in
this study
After subtracting the concentration of the pro-inflammatory markers measured in
sputum 6 hours post clean air exposure from those measured 6 hours after diesel exhaust
exposure there was a mean increase in inflammatory cytokines (TNF-α and IL-6) and
chemokines (IL-8) for both females and males with females having higher mean
difference levels of TNF-α DE-CA (p = 073) IL-6 DE-CA (p = 011) and IL-8 DE-CA (p =
0065) than males although these observations were not statistically significant Despite
this lack of statistical significance the fact that all three of these cytokines were observed
to be much higher in females than in males (eg IL-8 DE-CA was approximately seven
times higher in females) could reflect a stronger and faster response of females in
response to diesel exhaust exposure relative to males However due to the fact that
sputum samples were only measured at one time point (6 hours after exposure) we cannot
accurately speculate about whether the observed differences are a reflection of kinetic
differences in response to diesel exhaust exposure between males and females
Diesel exhaust particles range from fine to ultrafine particles (UFPs) and upon
inhalation it is the UFPs that are thought to penetrate the lung and elicit the effects
54
observed above in the lungs while the larger particles are thought to induce upper
respiratory effects Therefore the observed higher increase in cytokine concentrations in
females relative to males after diesel exhaust exposure relative to clean air could also
indicate that females are more sensitive to UFPs of diesel exhaust than males This is
similar to what was observed by Franklin et al in 2007 They looked at the association
between UFPs in the environment and both all-cause and specific cause mortality in 27
US communities between 1997 and 2002 and found suggestive evidence that women may
be more susceptible to UFPs effects than men (Franklin et al 2007)
On the other hand the significant increase in TNF-α in nasal fluid and the
observed higher increase in the other cytokines in males compared to females (which
were not statistically significant) 24 hours after diesel exhaust exposure relative to clean
air suggests that males may be more sensitive than females to the fine particles of diesel
exhaust in the upper airways This is probably due to a greater diesel exhaust induced
oxidative stress damage to the nasal epithelial cells of males relative to females owing to
the potential protective effects of estrogen in females reducing leukocyte activity and
exerting antioxidant effects on the nasal epithelial cells (Fortoul et al 2004) This idea is
plausible because in 2004 Fortoul et al observed genotoxic damage to nasal epithelium
and leukocytes which was more severe in males compared with females exposed to air
pollution that was high in ozone The potential antioxidant effect of estrogen in the upper
airway needs to be studied further in order to better elucidate its mechanism of action
especially with regards to the airwaylsquos epithelium
55
291 Study limitations
The observations of this study need to be studied with larger populations of
females and males especially since the sample size used for this study was relatively
small and uneven As an example a power analysis using the observed mean and
standard deviations of this study indicates that with the study sample size (9 for females
and 27 for males) the likelihood to detect a 5 sex difference in IL-6 in sputum is
approximately 010 This means that at the observed effect sizes a total sample size of
368 subjects will be needed to achieve an acceptable power of 070 to detect sex
differences in IL-6 concentrations in sputum at an alpha level of 005
In addition a potential source of error that was not investigated was the possible
additional exposure of subjects to DEPs outside of the exposure chamber during their
diverse daily activities
Although these findings need to be further investigated for confirmation they do
have an important implication for the selection of subjects for diesel exhaust controlled
environmental studies Raising the question of whether sex should be controlled for in
such studies Combining the sexes and not controlling for their potential effect could be
one of the reasons why as previously mentioned there have been some contrasting results
in some studies that have been done so far especially to lower exposures levels of diesel
exhaust So when interpreting the data from these studies the influence of sex needs to be
taken into account
56
210 Conclusions
In healthy volunteers inhalation of 300microgm3 of diesel exhaust for an hour in a
controlled environmental study showed a variation by sex in the occurrence and intensity
of local airway inflammation as indicated by differences in the concentrations of airway
inflammatory markers measured in nasal lavage fluid and induced sputum after diesel
exhaust exposure compared to clean air Six hours after the exposure to diesel exhaust
relative to clean air females tended to show a higher increase in lower airway
inflammatory markers compared to males Twenty four hours after exposure to diesel
exhaust relative to clean air males showed a significant increase in TNF-α concentration
in nasal lavage compared to a decrease in females Males also tended to have higher
concentrations of other upper airway inflammatory markers in nasal lavage compared to
females twenty four hours after exposure to diesel exhaust relative to clean air
Although not statistically significant (except for TNF-α) the observations of this
study suggests a sex difference in the initial site of diesel exhaust toxicity (upper airway
in males versus lower airway in females) that may be due to the possibility that males
may be more sensitive to effects of the fine particles of diesel exhaust which tend to
deposit in the upper airways while females may be more sensitive to the effects of the
ultra fine particles of diesel exhaust which tend to deposit in the lower airways
57
Appendix A
Table A1 Nasal Analyte Concentration of Soluble Proteins and Cytokines 24 Hours after Exposure to
Clean Air and Diesel Exhaust Clean Air Diesel Exhaust
Females N = 7
Variables Min Max Mean SD Min Max Mean SD
Protein 3148 50978 18278 16533 6137 37099 16336 10294
TNF-α 4539 14132 9045 3891 3773 16543 8665 4598
IL-6 000 885 444 371 000 949 279 337
IL-8 3565 16148 8628 4810 4525 20145 9473 6589
TNF-αProtein 010 449 1132 150 018 205 073 063
IL6 Protein 000 010 004 004 000 005 002 002
IL8Protein 032 128 065 033 031 097 061 026
Males N = 10
Variables Min Max Mean SD Min Max Mean SD
Protein 9661 58131 25078 14020 13291 84289 30907 20138
TNF-α 3337 12270 7073 3157 5095 16527 10486 4128
IL-6 009 1114 418 407 000 10234 1318 3142
IL-8 3186 17989 10527 5264 5041 28402 13620 7926
TNF-αProtein 019 047 030 010 018 064 041 019
IL6Protein 000 007 002 003 000 032 004 020
IL 8Protein 012 153 058 051 025 089 047 022
Protein concentrations are presented as microgml Cytokines concentrations presented
as pgml and Soluble Protein concentrations presented as mgg of total protein
Table A2 Sputum Concentration of Soluble Proteins and Cytokines 6 Hours after Exposure to
Clean Air and Diesel Exhaust Clean Air Diesel Exhaust
Females N = 9
Variables Min Max Mean SD Min Max Mean SD
Protein 10475 19178 1401824 3089524 9925 16813 1313738 239489
TNF-α 12962 77002 26174 21117 14081 67332 31422 23191
IL-6 8584 36003 14172 8747 10977 38938 16649 8757
IL-8 42088 101314 62364 002 43384 106649 71725 002
TNF-αProtein 001 006 002 002 001 007 003 002
IL-6Protein 0007 003 001 001 001 003 001 001
IL-8Protein 002 007 005 001 004 008 005 002
Males N = 27
Variables Min Max Mean SD Min Max Mean SD
Protein 8126 26428 1331592 7917 76171 1465025 1276417 4417169
TNF-α 13789 103914 38879 11534 71790 40299 19726 20116
IL-6 8520 18672 12762 8248 29832 13068 4021 3041
IL-8 13936 126006 59052 23661 119685 60382 024 003
TNF-αProtein 001 010 003 001 007 003 002 002
IL-6Protein 000 002 001 000 004 001 001 000
IL-8Protein 001 011 005 000 010 005 002 002
Protein concentrations are presented as microgml Cytokines concentrations presented as pgml and Soluble Protein concentrations presented as mgg of total protein
58
Table A3 Nasal Lavage Median and Percentiles for Diesel Exhaust and Clean Air for All Subjects
Clean Air Diesel Exhaust
Variables 25th Median 75th 25th Median 75th
Protein 11903 17988 29198 14091 21938 30159
TNF-α 4702 7332 11696 6676 8334 14058
il_6 077 354 760 064 318 533
il_8 4607 9064 14081 5726 11044 16571
TNF-αProtein 023 035 063 022 045 063
IL-6Protein 000 002 006 000 001 002
IL-8Protein 030 043 098 037 043 075
Protein concentrations are presented as microgml Cytokines concentrations presented
as pgml and Soluble Protein concentrations presented as mgg of total protein
Table A4 Nasal Lavage Median and Percentiles for Diesel Exhaust and Clean Air for Females
Clean Air Diesel Exhaust
Variables 25th Median 75th 25th Median 75th
Protein 6564 14145 25462 7098 14785 19020
TNF-α 4866 9076 12685 4419 7151 12592
IL6 000 405 846 000 318 334
IL8 4023 7651 12666 4657 6539 17835
TNF-αProtein 046 064 097 026 062 087
IL-6Protein 000 003 009 000 002 005
IL-8Protein 037 054 079 040 054 094
Protein concentrations are presented as microgml Cytokines concentrations presented
as pgml and Soluble Protein concentrations presented as mgg of total protein
TableA5 Nasal Lavage Median and Percentiles for Diesel Exhaust and Clean Air for Males
Clean Air Diesel Exhaust
Variables 25th Median 75th 25th Median 75th
Protein 15025 21725 31601 20017 25995 33389
TNF-α 4261 7149 9302 7303 9029 15540
IL6 084 339 772 132 310 613
IL8 6240 10407 15284 8843 11170 18144
TNF-αProtein 022 028 038 018 045 060
IL-6Protein 000 001 004 001 001 002
IL-8Protein 018 039 118 034 040 055
Protein concentrations are presented as microgml Cytokines concentrations presented
as pgml and Soluble Protein concentrations presented as mgg of total protein
Table A6 Sputum Median and Percentiles for Diesel Exhaust and Clean Air for All Subjects
Clean Air Diesel Exhaust
Variables 25th Median 75th 25th Median 75th
Protein 1068317 1237217 1524077 1042172 1168779 1443032
TNF-α 18457 36054 47676 16687 40299 56781
IL6 9931 11918 14161 10891 12357 15273
IL8 44461 49821 85865 45568 52452 81116
TNF-αProtein 001 003 004 001 003 005
IL-6Protein 001 001 001 001 001 001
IL-8Protein 003 004 005 004 005 006
Protein concentrations are presented as microgml Cytokines concentrations presented
as pgml and Soluble Protein concentrations presented as mgg of total protein
59
Table A7 Sputum Median and Percentiles for Diesel Exhaust and Clean Air for Females
Clean Air Diesel Exhaust
Variables 25th Median 75th 25th Median 75th
Protein 1089757 1345983 1675241 1141263 1254705 1569193
TNF-α 13232 17691 32767 16188 16650 59549
IL6 9306 10499 16045 11616 13576 17748
IL8 45230 55181 82623 48138 76201 95303
TNF-αProtein 001 001 003 001 001 005
IL-6Protein 001 001 001 001 001 002
IL-8Protein 004 004 006 004 005 007
Protein concentrations are presented as microgml Cytokines concentrations presented
as pgml and Soluble Protein concentrations presented as mgg of total protein
Table A8 Sputum Median and Percentiles for Diesel Exhaust and Clean Air for Males
Clean Air Diesel Exhaust
Variables 25th Median 75th 25th Median 75th
Protein 1057336 1225451 1396103 1019687 1140124 1422919
TNF-α 20331 38823 50276 18568 46573 55092
IL6 10213 12077 14178 10498 12290 14388
IL8 44357 49753 87553 44687 52297 80574
TNF-αProtein 001 003 005 001 003 005
IL-6Protein 001 001 001 001 001 001
IL-8Protein 003 004 005 004 005 006
Protein concentrations are presented as microgml Cytokines concentrations presented
as pgml and Soluble Protein concentrations presented as mgg of total protein
Table A9 Nasal Lavage Median and Percentiles for the the Difference in the Concentrations of
Proteins and Cytokines For Females and Males Measured in Nasal Lavage Samples
Females Males
Variables 25th Median 75th 25th Median 75th
Protein -6442 -214 2989 -9582 2989 13586
TNF-α -2595 -120 1736 1259 3193 4041
IL6 -340 000 039 -374 114 192
IL8 -1111 960 3997 -1819 2668 8496
TNF-αProtein 018 062 084 017 041 060
IL-6Protein -006 000 000 -002 000 001
IL-8Protein -031 -010 023 -042 -000 024
Variables = Concentrations measured after DE ndash Concentrations measured after CA Protein concentrations are presented as
microgml The Cytokines concentrations are presented as pgml and normalized cytokine concentrations are presented as mgg of total protein
60
Table A10 Sputum Lavage Median and Percentiles for the the Difference in the Concentrations of
Proteins and Cytokines For Females and Males Measured in Nasal Lavage Samples
Females Males
Variables 25th Median 75th 25th Median 75th
Protein -161056 -17065 42663 -234263 -48108 152690
TNF-α -2018 696 9390 -4055 371 6654
IL6 448 2934 6192 -2850 480 2997
IL8 3454 8687 15040 -5682 348 10421
TNF-αProtein -000 000 001 -000 000 001
IL-6Protein -000 000 001 -000 000 000
IL-8Protein 000 001 002 -001 000 001
Variables = Concentrations measured after DE ndash Concentrations measured after CA Protein concentrations are presented as
microgml The Cytokines concentrations are presented as pgml and normalized cytokine concentrations are presented as mgg of total
protein
Table A11 Mann-Whitney U Test Results Showing the Ranks of the Difference in the Concentrations of
Proteins and Cytokines For Females and Males Measured in Nasal Lavage Samples
Females N = 7 Males N = 10
Variables Mean Rank Sum of Ranks Mean Rank Sum of Ranks
Protein 800 5600 970 9700
TNF-α 614 4300 1100 11000
IL6 721 5050 1025 10250
IL8 829 5800 950 9500
TNF-αProtein 1086 7600 770 7700
IL-6Protein 743 5200 1010 10100
IL-8Protein 900 6300 900 9000
Variables = Concentrations measured after DE ndash Concentrations measured after CA Protein concentrations are presented as microgml The Cytokines concentrations are presented as pgml and normalized cytokine concentrations are presented as mgg of total
protein
Table A12 Mann-Whitney U Test Results Showing the Ranks of the Difference in the Concentrations of
Proteins and Cytokines For Females and Males Measured in Sputum Induction Samples
Females N = 9 Males N = 27
Variables Mean Rank Sum of Ranks Mean Rank Sum of Ranks
Protein 1811 16300 1863 50300
TNF-α 1956 17600 1815 49000
IL6 2333 21000 1689 45600
IL8 2411 21700 1663 44900
TNF-αProtein 2011 18100 1796 48500
IL-6Protein 2333 21000 1689 45600
IL-8Protein 2222 20000 1726 46600
Variables = Concentrations measured after DE ndash Concentrations measured after CA Protein concentrations are presented as microgml The Cytokines concentrations are presented as pgml and normalized cytokine concentrations are presented as mgg of total
protein
61
References
Behndig AF Mudway IS Brown JL Stenfors N Helleday R Duggan ST
Wilson SJ Boman C Cassee1 FR Frew AJ Kelly FJ Sandstrom T and
Blomberg A 2006 Airway antioxidant and inflammatory responses to diesel exhaust
exposure in healthy humans European Respiratory Journal 27 pg 359 ndash pg 365
Bird M Karavitis J and Kovacs EJ 2008 Sex differences and estrogen modulation
of the cellular immune response after injury Cellular Immunology 252 pg 57 ndash pg
67
Bullard MK Bir N Kwan R Cureton E Knudson P and Harken A Women rule
Surgery 147 pg 134-137
Casarett and Doulllsquos 2001 Toxicology The Basic Science of Poisons 6th
Edition
New York McGraw-Hill pg 159-194 419-430
Cohen JW 1988 Statistical Power Analysis for the Behavioral Sciences 2nd
Edition
Hillsdale NJ Lawrence Erlbaum Associates
Croston G Biocarta httpwwwbiocartacompathfilesh_inflamPathwayasp
Da Silva JA 1995 Sex Hormones Glucocorticoids and Autoimmunity facts and
hypotheses Annals of the Rheumatic Disease 54 pg 6-16
Diaz-Sanchez D Tsien A Casillas A Dotson AR and Saxon A 1996 Enhanced
nasal cytokine production in human beings after in vivo challenge with diesel exhaust
particles Journal of Allergy and Clinical Immunology 98 pg114-123
Donaldson K Stone V Seaton A and MacNee W 2001 Ambient Particle Inhalation
and the Cardiovascular System Potential Mechanisms Environmental Health
Perspectives 109(supplement 4) pg 523-527
Ertan T Keskek M Kilic M Gocmen E Oguz H Aksaray S and Koc M Effects
of Gender Difference in Early Cytokine Levels in Trauma Patinets Bratisl Lek Listy
108 pg 128-132
Faul F and Erdfelder E 1992 GPower A priori Post-hoc and Compromise Power
Analysis for MS DOS [Computer Program] Bonn FRG Bonn University
Department of Psychology
Fortoul TI Valverde M Lopez MC Avila-Costa MR Avila-Casado MC
Mussali-Galante P Gonzalez-Villalva A Rojas E and Ostrosky-Shejet P 2004
Genotoxic differences by sex in nasal epithelium and blood leukocytes in subjects
residing in a highly polluted area Environmental Research 94 pg 243 ndash 248
62
Furuyama A Hirano S Koike E and Kobayashi T 2006 Induction of oxidative
stress and inhibition of plasminogen activator inhibitor-1 production in endothelial
cells following exposure to organic extracts of diesel exhaust particles and urban fine
particles Archives of Toxicology 80 pg 154-162
Gabay C and Kushner J 1999 Acute phase proteins and other systemic responses to
inflammation New England Journal of Medicine 340 pg 448ndash54
Ganong W F Lange J and Lange D 1999 Review of Medical Physiology 19th
Edition Stamford CT Appleton and Lange pg 500
Imahara SDJelacic S Junker CE and OlsquoKeefe GE The influence of gender on
human innate immunity Surgery138 pg 275 ndash pg 82
Koren HS and Devlin RB Human Upper Respiratory Tract Responses to Inhaled
Pollutants with Emphasis on Nasal Lavage Annals New York academy of Sciences
641 pg 215 ndash pg 224
Kovacs E J Messingham KAN Influence of Alcohol and Gender on Immune
Response Alcohol Research and Health 27 pg 257 ndash 263
Matthay MA and Clements JA 2004 Coagulation-dependent mechanisms and asthma
The Journal of Clinical Investigation 114 pg 20 ndash 23
Merriam Webster Dictionary 2010 Online Edition
Nightingale JA Maggs R Cullinan Donnelly LE Rodgers DF Kinnersley R
Chung KF Barnes PJ Ashmore M and Newman-Taylor A 2000 Airway
Inflammation after Controlled Exposure to Diesel Exhaust Particles American
Journal of Respiratory and Critical Care Medicine 162 pg 161-166
Nordenhall C Pourazar J Blomberg A Levin J-O Sandstrom T and Adelroth E
2000 Airway inflammation following exposure to diesel exhaust a study of time
kinetics using induced sputum European Respiratory Journal 15 pg 1046-1051
Pallant J 2007 SPSS Survival Manual 3rd
Edition McGraw-Hill pg 210-232
Pin I Freitag AP OByrne PM Girgis-Gabardo A Watson RM Dolovich J 1992
Changes in the cellular profile of induced sputum after allergen-induced asthmatic
responses The American Review of Respiratory Disease 145 pg 1265 ndash 1269
Pizzichini E Pizzichini MMM Efthimiadis A Evans S Morris MM Squillace D
1996 Indices of airway inflammation in induced sputum reproducibility and validity
of cell and fluid-phase measurements American Journal of Respiratory and Critical
Care Medicine 154 pg 308 ndash 317
Rand and Dales Pharmacology 2007 6th
Edition Grune and Stratton Inc
63
Riedl M and Diaz-Sanchez D 2005 Biology of diesel exhaust effects on respiratory
function Journal of Allergy and Clinical Immunology 115 pg 221-8
Ritz SA Wan J and Diaz-Sanchez D 2007 Sulforaphane-stimulated phase II
enzyme induction inhibits cytokine production by airway epithelial cells stimulated
with diesel extract American Journal of Physiology ndash Lung Cellular and Molecular
Physiology 292 L 33 ndash L 39
Salvi S and Holgate ST 1999 Mechanisms of particulate matter toxicity Clinical
and Experimental Allergy 29 pg 1187-1194
lsquoStvrtinovaacute V Jakubovskyacute J and Huliacuten I 1995 Inflammation and Fever
Comenius University Bratislava Slovak Republic Retrieved January 23rd
2010 from
httpnicsavsklogosbooksscientificzhtml
Suzer O 2007 Cytokine Slides Retrieved on January 23rd
2010 from
httpwwwctfedutrfarmaonersuzerpdfing11_Cytokinespdf
Sydbom A Bomberg A Parnia S Stenfors N Sandstrom T and Dah en SE 2001
Health Effects of Diesel Exhaust Emissions European Respiratory Journal 17 pg
733-746
Takizawa H Ohtoshi T Kawasaki S Abe S Sugawara I Nakahara K
Matsushima K and Kudoh S 2000 Diesel Exhaust Particles Activate Human
Bronchial Epithelial Cells to Express Inflammatory Mediators in Airways A Review
5 pg 197 ndash pg 203
Tornqvist H Mills NL Gonzalez M Miller MR Robinson SD Megson IL
MacNee W Donaldson K Soderberg S Newby DE Sandstrom T and Blomberg
A 2007 Persistent endothelial dysfunction following diesel exhaust inhalation in
man American Journal of Respiratory and Critical Care Medicine 176 pg 395-400
ToxProbe Inc Diesel Exhaust in Toronto
US Environmental Protection Agency (EPA) (2002) Health assessment document
for diesel engine exhaust Prepared by the National Center for Environmental
Assessment Washington DC for the Office of Transportation and Air Quality
EPA6008-90057F Available from National Technical Information Service
Springfield VA PB2002-107661 and lthttpwwwepagovnceagt
Van Eeden SF Tan WC Suwa T Mukae H Terashima T Fujii T Qui D
Vincent R and Hogg JC 2001 Cytokines Involved in Systemic Inflammatory
Response Induced by Exposure to Particulate Matter Air Pollutants (PM10) American
Journal of Respiratory and Critical Care Medicine 2001 164 pg 826-830
64
Chapter 3
Analysis of Sex Differences in Systemic Inflammation and
Acute Phase Response Markers after Acute Diesel Exhaust
Exposure
65
31 Abstract
32 Introduction
321 Cytokines
322 Acute Phase Response
323 Platelets and Other Blood Cells
324 Sex Differences in Immune Response
33 Materials and Methods
331 Data Collection
332 Subjects Demographic Data
333 Exposure Conditions and Experimental Design
334 Systemic Inflammation and Acute Phase Response Markers
335 Blood Sample Collection
336 Blood Sample Analysis
34 Statistical Methods
35 Results
36 Discussion
361 Study Limitations
37 Conclusions
Appendix B
References
66
31 Abstract
Background Epidemiological studies have linked ambient levels of particulate
matter to adverse cardiovascular outcomes but the mechanisms that govern this
link are poorly understood There is a general consensus that one potential
mechanism for this link is inflammation Inflammation is part of the bodylsquos innate
(nonspecific) immune response and there is an established sex dimorphism in
immune response
Aims To evaluate possible sex differences in the occurrence and intensity of
systemic inflammation and acute phase response in females and males after a
controlled environmental exposure to diesel exhaust
Methods In a crossover design study healthy human subjects were exposed to
300microgm3 of diesel exhaust and clean air in random order for 1 hour each on two
different days (ge1 week washout) Blood cell counts platelets pro-inflammatory
cytokines mediators and acute phase proteins were measured in peripheral blood
that was collected from subjects three times during the study at baseline six hours
and twenty four hours post exposure Statistical analysis was done using a linear
mixed model with repeated measures and contrast to investigate the three way
interaction effect (exposure typesampling timesex) on the measured variables
Results Overall there was a statistically significant three way interaction effect
on platelet count (p = 0050) The contrast analysis showed that between males
and females after controlling for baseline there was a statistically significant
difference in platelet counts (p = 00145) six hours after diesel exhaust exposure
relative to clean air with females having a mean higher platelet count than males
Within males the contrast analysis showed a statistically significant decrease in
platelet counts (p = 0045) twenty four hours after diesel exhaust exposure relative
to clean air Within the other markers of inflammation and acute phase reaction
proteins mixed results were observed but none of them were statistically
significant
Conclusion Our results suggest that there was a statistically significant effect of
sex on platelet counts after a controlled human environmental exposure to a
known concentration of diesel exhaust (300microgm3) relative to clean air Females
had a stronger systemic inflammatory response than males as there was a
statistically significant increase in platelet count in females 6 hours after diesel
exhaust exposure compared to a decrease in males
32 Introduction
Air pollutants such as diesel exhaust have been shown to cause adverse health
events and to be associated with increased cardiovascular morbidity but the mechanisms
by which they do so are not well known It has been hypothesized that the inhalation of
67
these pollutants over a period of time causes an overload or hindrance of the lungs
natural defenses which then sets off a variety of cascading adverse systemic reactions
involving and mediated by multiple cell lines (epithelial cells macrophages neutrophils
mast cells and lymphocytes) cytokines and acute phase proteins all of which may
contribute to the overall adverse respiratory and cardiovascular health effects that have so
far been linked with exposure to diesel exhaust and other air pollutants
321 Cytokines
Cytokines are intercellular signaling polypeptides produced by activated cells
(Gabay C et all 1999) in response to local inflammation caused by xenobiotics like diesel
exhaust They have an added inflammatory effect on the surrounding cells and they also
modify the production of acute phase proteins by the liver thereby leading to adverse
cardiovascular outcomes Of particular interest in diesel exhaust exposure are those
cytokines that are produced during inflammation and which also participate and
contribute to the inflammatory process because they are the chief stimulant of the acute
phase proteins These pro-inflammatory cytokines include interleukin 6 (IL-6)
interleukin 1β (IL-1β) Tumor necrosis factor α (TNF-α) interferon γ (IFN-γ)
transforming growth factor β2 interleukin 8 (IL-8) (Gabay C et all 1999) Macrophages
and monocytes are the most important sources of these cytokines at the sites of
inflammation although they are also produced by a number of other different cells
It is hypothesized that diesel exhaust induced inflammation is instigated by
oxidative stress (Furuyama et al 2006 Diaz-Sanchez and Riedl 2005 Salvi and
Holgate1999) caused by the subsequent prolonged contact of the metals PAHs and
68
quinines contained in diesel exhaust with the epithelial and macrophage cells when the
natural lung safety mechanisms become overwhelmed This oxidative stress initiated
inflammation is thought to either directly cause or trigger other mechanisms that are
behind the effects that have been seen in in-vitro and in-vivo studies
322 Acute Phase Response
The respiratory and cardiovascular effects of diesel exhaust are thus thought to be
connected via an oxidative-stress initiated inflammation because inflammation is known
to cause a large number of changes far from the initial site of the local inflammation and
potentially involving many organ systems More specifically changes in the levels of
acute phase proteins in response to inflammation and mediated by pro-inflammatory
cytokines are believed to be one of the possible causes of the corresponding adverse
cardiovascular effects that are often seen following the inhalation of diesel exhaust
Acute phase proteins are proteins that are produced by the liver and whose plasma
concentrations increase or decrease by at least 25 during an inflammatory disorder
(Gabay et al 1999) Of particular interest are fibrinogen and c-reactive proteins
Fibrinogen can cause endothelial cell adhesion spreading and proliferation and is also a
factor of the coagulation cascade when clotting occurs while c-reactive proteins have
been shown to be a cardiovascular risk factor in both healthy subjects and those with
coronary heart disease (Peter et al 2001)
323 Platelets and Other Blood Cells
Cascading adverse systemic reactions such as changes in acute phase reaction
proteins mentioned above are mediated by multiple cell lines in the blood like platelets
69
Platelets are unique anucleate mammalian blood cells that are involved in haemostasis
and in the innate inflammatory response to xenobiotics They act both directly and
indirectly via the secretion of chemokines and they help to attract other blood cells like
leukocytes to sites of inflammation as part of the innate inflammatory response (Weyrich
et al 2004) Activated platelets also secrete key components of coagulation (Weyrich et al
2004) and so may also be involved in the adverse cardiovascular effects that have been
seen following diesel exhaust exposure
To summarize the activation and mobilization of inflammatory cells and platelets
by oxidative stress the production of pro-inflammatory cytokines the production of
acute phase proteins and the production of circulating inflammatory mediators all
characterize the systemic inflammatory response (van Eeden et al 2001) to diesel exhaust
that is hypothesized to cause adverse cardiovascular effects
324 Sex Differences in Immune Response
This systemic inflammatory response to inhaled diesel exhaust particles is part of
the bodylsquos innate (nonspecific) immune response which is the bodylsquos first line of defense
against potentially harmful foreign agents that have entered the body through the
respiratory system or other routes such as the gut or genitourinary tract (Casarett and
Doulls 2001) There is an established sex dimorphism in immune response with females
having a stronger immune reactivity (humoral and cellular mediated immune) than males
(Da Silva 1995)
The effects of cytokines can be inhibited or enhanced by hormones (Gabay et al
1999) In-vitro sex hormones have been shown to modulate the production of different
70
cytokines that are involved in immune responses like IL-6 thus indicating the potential
role of sex hormones in the sexual dimorphism of the immune system (Da Silva 1995)
While in-vivo the interactions between sex hormones and other immunomodulatory
factors like glucocorticoids are thought to mediate an indirect action of sex hormones on
the immune system (Da Silva 1995) and therefore have the potential to cause variations
by sex in the systemic inflammation and acute phase responses that have been
demonstrated in response to diesel exhaust exposure
Therefore the purpose of this study is to determine whether there are sex
differences in the occurrence and intensity of systemic inflammation and acute phase
response in males and females as indicated by the potential variation in the levels of
blood cells platelets pro-inflammatory cytokines mediators and acute phase proteins in
peripheral blood after acute exposure to diesel exhaust relative to clean air
33 Materials and Methods
331 Data Collection
The data that were used for this study are part of the datasets generated from a
previous study of diesel exhaust effects The study was funded by the Department of
Defense (DOD) through a grant to the University of Medicine and Dentistry of New
Jersey (UMDNJ) (Grant DAMD17-03-1-0537 Principal Investigator Dr Nancy
Fiedler) The parent study was done using a human subject protocol that was HIPAA
compliant and approved by the UMDNJ Institutional Review Board
71
332 Subjects Demographic Data
110 healthy non-smoking men and women between the ages of 18 and 50 were
recruited from the local community in Piscataway New Jersey based on the established
study criteria 100 subjects completed the study Due to problems with blood sample
collection at various study time points all the subjects did not have complete sets of
samples collected at the three sampling time points Therefore depending on the sampling
time and the measure being analyzed the total analysis sample size was different (see
tables 1a to 1d below)
Table 31a CBC Subjects Demographic Information Females
N = 35
Males
N = 60
Min Max Mean SD Min Max Mean SD
AGE (years) 18 44 2389 601 18 43 2382 581
Education (years) 12 22 1546 234 12 23 1567 236
Race Frequency () Frequency ()
Asian Pacific Islander 14 (40) 22 (3667)
Black not Hispanic 2 (571) 5 (833)
Hispanic or Latino 7 (20) 10 (1667)
OtherUnknown 1 (286) 1 (166)
White not Hispanic 11 (3143) 22 (3667)
Table 31b IL-6 Subjects Demographic Information Females
N = 27
Males
N = 53
Min Max Mean SD Min Max Mean SD
AGE (years) 18 44 2393 658 18 43 2449 604
Education (years) 12 20 1522 176 12 23 1604 259
Race Frequency () Frequency ()
Asian Pacific Islander 12 (4444) 21 (3962)
Black not Hispanic 1 (370) 4 (755)
Hispanic or Latino 3 (1111) 8 (1509)
OtherUnknown 1 (370) 0 (0)
White not Hispanic 10 (3705) 20 (3774)
Table 31c C - reactive protein Subjects Demographic Information Females
N = 32
Males
N = 57
Min Max Mean SD Min Max Mean SD
AGE (years) 18 44 2412 621 18 43 2398 557
Education (years) 12 22 1563 232 12 23 1596 252
Race Frequency () Frequency ()
Asian Pacific Islander 15 (4687) 22 (3860)
Black not Hispanic 2 (625) 4 (702)
Hispanic or Latino 5 (1563) 10 (1754)
OtherUnknown 1 (312) 0 (0)
White not Hispanic 9 (2813) 21 (3684)
72
Table 31d Fibrinogen Subject Demographics Females
N = 31
Males
N = 61
Min Max Mean SD Min Max Mean SD
AGE (years) 18 44 2400 610 18 43 2407 578
Education (years) 12 22 1545 236 12 23 1589 251
Race Frequency () Frequency ()
Asian Pacific Islander 12 (3871) 23 (3770)
Black not Hispanic 2 (645) 5 (820)
Hispanic or Latino 5 (1613) 10 (1639)
OtherUnknown 1 (323) 1 (164)
White not Hispanic 11 (3548) 22 (3607)
333 Exposure Conditions and Experimental Design
A crossover design was used in which each subject underwent two exposure
conditions in random order on two separate days one was to a diluted diesel exhaust
normalized to PM10 concentration of 300microgm3 and the other was to filtered clean
ambient air of Busch campus in Piscataway a suburban campus of Rutgers University
Both exposure conditions were 1 hour in duration and took place at the Environmental
and Occupational Health Sciences Instituteslsquo (EOHSI) Controlled Environmental Facility
(CEF) Each exposure condition was presented with and without an acute psychological
stressor to two groups of subjects high and low in self reported chemical intolerance (CI)
Subjects were also asked to fast overnight the day before the study until after each
exposure session and to also abstain from any exercise
There were no significant differences in the exposure conditions for all subjects
Overall the concentration of PM10 that the subjects were exposed to was 276plusmn13microgm3
which was close to the target concentration of 300microgm3
Table 32 Mean Air Characteristics and Composition Diesel Exhaust Clean Air
PM10 (microgm3) 276 plusmn 13 6 plusmn 5 NOX (ppm) 363 plusmn 090 002 plusmn 002
CO (ppm) 379 plusmn 076 091 plusmn 021
1 Nitropyrene (ngm3) 268 plusmn 051 lt006
73
334 Systemic Inflammation and Acute Phase Response Markers
The following variables were measured in peripheral blood as systemic
inflammation and acute phase response markers based on similar studies that have been
done so far white blood cell count (WBC) red blood cell count (RBC) platelet count
cell blood count measures (neutrophils lymphocytes monocytes eosinophils and
basophils) c-reactive protein IL-6 and fibrinogen concentrations
335 Blood Sample Collection
Peripheral venous blood was collected from subjects at about the same time of
day 3 times during the study before exposure six hours after exposure and 24 hours
after exposure
336 Blood Sample Analysis
Blood was sent to Quest diagnostics laboratories for neutrophil count platelet
count and cell blood count (CBC) measurements Peripheral blood IL-6 and c-reactive
protein concentrations were analyzed using commercially available ELISAs while the
peripheral blood fibrinogen content was measured using functional assay at the Robert
Wood Johnson University hematology laboratory
34 Statistical Methods
Descriptive statistical analysis histograms and box plots were used to evaluate the
distribution of all the variables Based on the results of the descriptive analysis all the
values of the raw systematic inflammation and acute phase response outcome variables
74
were log transformed in order to normalize their distribution before use in further
analysis
A potential confounder which could have skewed the results of the analysis was
body mass index (BMI) Therefore BMI was calculated for all the study subjects using
height and weight and was then stratified by sex in order to evaluate the mean BMI by
sex The mean BMI for females (Mean = 2365 and SD = 468) and the mean BMI for
males (Mean = 2566 and SD = 340) were about the same for the study population so
there was no need to control for BMI in this analysis
To address the aim of the paper a linear mixed model with repeated analysis was
used to examine if there was a significant three way interaction among exposure type
(diesel exhaust and clean air) sampling time (Baseline 6 hours and 24 hours) and sex
(males and females) on the log transformed outcome variables
Since some subjects were also exposed to an acute psychological stressor (a
potential effect modifier) an initial stress stratified linear mixed model with repeated
analysis was done on those subjects who were exposed to stress and those subjects who
were not exposed to stress in order to determine if there was a stress effect on the
concentrations of the outcome variables The effect sizes of the stratified analyses were
compared and it was determined that there was no stress effect Therefore the final
model contained sex as a between subjects variable exposure and time as within subjects
variables with the log transformed outcome variables as the dependent variables The
exposuretimesexlsquo three way interaction was examined to assess the hypothesis of
interest
75
Tests of the three interactions were conducted using Type 3 score tests (Liang and
Zeger 1986) of the interaction between exposure time and sex Contrasts were used to
test whether males and females differed with respect to the effect of exposure on changes
in the concentration of systemic inflammation markers from baseline to each subsequent
time point Contrasts were also used to test whether within males and within females
changes in the concentration of systemic inflammation markers from baseline to each
subsequent time point differed between exposures
All statistical analysis for this paper were done using SAS software Version 91
of the SAS System for Windows (SAS Institute Inc Cary NC USA) and SPSS
software Version 170 (SPSS inc Chicago IL) Also some graphs were created using
Microsoft Excel 2007 P-values less than or equal to 005 were considered to be
significant
35 Results
Three Way Interaction Effect of Exposure Time and Sex on Systemic Inflammation
and Acute Phase Response Markers
With the exception of platelets the linear mixed model with repeated analysis of
the exposuretimesexlsquo three way interaction revealed no statistically significant three
way interaction effect on the concentrations of the systemic inflammation and acute
phase reaction markers (see table 3)
76
Table 33 Three Way Interaction Results E x T x S
Variables F Value P Value
Platelet 302 0050
WBC 017 085
RBC 181 017
Absolute CBC Values
Neutrophils 047 062
Lymphocytes 028 075
Monocytes 035 071
Eosinophils 027 077
Basophils 005 095
Percent CBC Values
Neutrophils 077 046
Lymphocytes 097 038 Monocytes 090 041
Eosinophils 031 074
Basophils 004 096
Mediators
CRP 147 023
Il6 007 093
Coagulation Factors
Fibrinogen 045 050
E = Exposure (Diesel Exhaust and Clean Air) T = Time (6 hrs and 24 hrs)
S = Sex (Females and Males) WBC = White Blood Cells RBC = Red Blood Cells CRP = C - reactive protein IL6 = Interleukin 6 and CBC = Cell Blood Count
Units of WBC and Platelets = 10e3microL Units of RBC = 10e6microL Units of absolute
CBC variables 10e3microL Units of percent CBC variables = Unit of CRP = mgl Unit of IL6 = pgml and Unit of Fibrinogen = mgdl p le 005 is significant
There was a statistically significant three way interaction effect on platelet count (p =
0050 for exposuretimesex) The contrast analysis showed that males differed from
females with respect to the effect of diesel exhaust on changes in platelet counts from
baseline to 6 hours (p = 00145) with males showing a mean decrease in platelet count
compared to a mean increase in females (see table 4a and graph 1)
Graph 31 Plot of Mean Platelet Count Difference by Exposure by Sex and Time
Baseline 6 Hrs 24 Hrs
Males 0 -915 -773
Females 0 347 261
-15
-10
-5
0
5
10
15
Me
an P
late
let
Dif
fere
nce
10
e3micro
L (+
-1
SE
)
Mean Platelet Difference From Baseline by Sex
77
Within males the contrast analysis showed a statistically significant effect of diesel
exhaust on the change in platelet counts at 24 hours (p = 0045) while a significant effect
at 24 hours was not seen within females (see table 4a and graph 2) However these
effects were also not significantly different between males and females at 24 hours
Graph 32 Graph of Mean Percent Change in Platelet Counts Measured in Diesel Exhaust Relative to
Clean Air by Sex
78
Table 34a Mean Log Blood Cell Values (Absolute) and Contrast Test Results Baseline 6hr 24hr 6hr Δ
24hr Δ
Exposure
Main
Effect On
6hr Δ
Exposure
Main
Effect On
24hr Δ
Exposure
by Sex
Effect
On 6hr Δ
Exposure
by Sex
Effect On
24hr Δ
Variables
Sex
Exp
Mean
(SD)
N
Mean
(SD)
N
Mean
(SD)
N
Mean
(SD)
N
Mean
(SD)
N
t-Value
(SE)
p-Value
t-Value
(SE)
p-Value
t-Value
(SE)
p-Value
t-Value
(SE)
p-Value
Log
Platelet
(x10e3microl)
Males DE 550
(021)
60
556
(021)
60
552
(021)
60
006
(008)
60
002
(007)
60
-174
(001)
0082
-201
(001)
0045
-245
(002)
00145
-142
(002)
016
CA 549
(020)
59
557
(020)
56
553
(020)
60
008
(008)
55
004
(009)
59
Females DE 550
(024)
32
557
(021)
33
553
(024)
34
009
(011)
31
005
(012)
31
175
(002)
0081
027
(002)
078
CA 555
(022)
35
560
(020)
35
560
(022)
33
005
(006)
35
003
(005)
33
Log
WBC
(x10e3microl)
Males DE 173
(022)
60
186
(024)
60
169
(026)
60
013
(018)
60
-004
(013)
60
-014
(003)
089
032
(003)
075
-058
(005)
056
-031
(005)
076
CA 173
(024)
58
187
(022)
55
168
(022)
60
012
(016)
54
-004
(014)
58
Females DE 167
(029)
32
182
(027)
33
161
(025)
34
015
(022)
31
-005
(014)
31
062
(004)
054
063
(004)
053
CA 172
(028)
35
184
(026)
34
164
(025)
33
012
(018)
34
-009
(014)
33
Log
RBC
(x10e6microl)
Males DE 160
(007)
60
159
(007)
60
160
(007)
60
-000
(003)
60
001
(003)
60
-015
(001)
088
-079
(001)
043
-189
(002)
0060
-073
(002)
047
CA 159
(006)
59
159
(007)
56
160
(007)
60
000
(003)
55
001
(003)
59
Females DE 139
(015)
32
142
(009)
33
142
(009)
34
003
(014)
31
004
(013)
31
225
(001)
0024
032
(001)
075
CA 141
(008)
35
142
(008)
35
144
(008)
33
001
(004)
35
003
(004)
33
Exp = Exposure DE = Diesel Exhaust CA = Clean Air Δ = Change from baseline SD = Standard deviation and SE = Standard Error WBC = White
Blood Cells and RBC = Red Blood Cells Signt = Significant = statistically significant at p = 005
= borderline statistically significant at p = 005
79
Table 34b Mean Log Blood Cell Blood Count Values (Absolute) and Contrast Test Results (continued) Baseline 6hr 24hr 6hr Δ
24hr Δ
Exposure
Main
Effect On
6hr Δ
Exposure
Main
Effect On
24hr Δ
Exposure
by Sex
Effect On
6hr Δ
Exposure
by Sex
Effect On
24hr Δ
Variables
Sex
Exp
Mean
(SD)
N
Mean
(SD)
N
Mean
(SD)
N
Mean
(SD)
N
Mean
(SD)
N
t-Value
(SE)
p-Value
t-Value
(SE)
p-Value
t-Value
(SE)
p-Value
t-Value
(SE)
p-Value
Log
Neutrophils
(cellsmicrol)
Males DE 807
(030)
60
822
(031)
60
803
(034)
60
016
(022)
60
-004
(017)
60
-023
(004)
082
013
(004)
089
-096
(007)
034
-059
(007)
055
CA 806
(034)
59
822
(032)
56
801
(029)
60
014
(022)
55
-004
(021)
59
Females DE 801
(037)
32
815
(039)
33
793
(035)
34
013
(029)
31
-007
(021)
31
103
(006)
030
084
(006)
040
CA 807
(040)
35
814
(039)
35
795
(034)
33
007
(024)
35
-013
(022)
33
Log
Lymphocytes
(cellsmicrol)
Males DE 747
(025)
60
757
(026)
60
745
(029)
60
010
(021)
60
-003
(017)
60
001
(003)
099
-018
(003)
085
071
(006)
048
057
(006)
057
CA 747
(018)
59
756
(022)
56
745
(025)
60
010
(017)
55
-002
(018)
59
Females DE 745
(032)
32
760
(030)
33
741
(030)
34
016
(020)
31
-003
(016)
31
-088
(004)
038
-085
(005)
040
CA 744
(028)
35
764
(027)
35
744
(029)
33
019
(016)
35
-000
(013)
33
Log
Monocytes
(cellsmicrol)
Males DE 604
(032)
60
621
(026)
60
602
(032)
60
017
(027)
60
-003
(027)
60
082
(004)
041
162
(004)
010
044
(007)
066
084
(007)
040
CA 609
(031)
59
621
(024)
56
599
(030)
60
013
(026)
55
-010
(021)
59
Females DE 587
(028)
32
606
(029)
33
581
(029)
34
-019
(026)
31
-008
(029)
31
007
(006)
095
019
(006)
085
CA 593
(028)
35
610
(029)
35
586
(026)
33
018
(024)
35
-008
(018)
33
Log
Eosinophils
(cellsmicrol)
Males DE 489
(069)
60
482
(076)
60
476
(076)
60
-008
(047)
60
-014
(028)
60
059
(008)
056
026
(007)
080
008
(013)
094
-059
(013)
056
CA 498
(060)
59
482
(089)
56
479
(074)
60
-010
(045)
55
-016
(035)
59
Females DE 460
(082)
32
455
(087)
33
451
(080)
34
-002
(036)
31
-003
(032)
31
035
(010)
073
093
(010)
036
CA 465
(073)
35
458
(085)
35
451
(075)
33
-007
(052)
35
-013
(026)
33
Log
Basophils
(cellsmicrol)
Males DE 305
(052)
60
329
(045)
60
304
(046)
60
023
(059)
60
-004
(055)
59
-147
(009)
014
-110
(009)
027
-012
(016)
091
019
(016)
085
CA 301
(052)
59
337
(039)
56
309
(045)
60
038
(054)
55
010
(046)
59
Females DE 307
(053)
32
331
(035)
33
301
(048)
33
030
(056)
31
-008
(048)
30
-096
(013)
034
-106
(013)
029
CA 309
(053)
35
351
(043)
34
318
(055)
33
040
(045)
35
034
(059)
33
Exp = Exposure DE = Diesel Exhaust CA = Clean Air Δ = Change from baseline SD = Standard deviation and SE = Standard Error Signt =
Significant ple 005 is significant
80
Table 34c Mean Log Cell Blood Count Values (Percentage) and Contrast Test Results Baseline 6hr 24hr 6hr Δ
24hr
Δ
Exposure
Main
Effect On
6hr Δ
Exposure
Main
Effect On
24hr Δ
Exposure
by Sex
Effect
On 6hr Δ
Exposure
by Sex
Effect On
24hr Δ
Variables
Sex
Exp
Mean
(SD)
N
Mean
(SD)
N
Mean
(SD)
N
Mean
(SD)
N
Mean
(SD)
N
t-Value
(SE)
p-Value
t-Value
(SE)
p-Value
t-Value
(SE)
p-Value
t-Value
(SE)
p-Value
Log
Neutrophils
()
Males DE 404
(013)
60
406
(013)
60
403
(014)
60
002
(010)
60
-001
(008)
60
-046
(002)
065
-023
(002)
081
-123
(003)
022
-078
(003)
044
CA 403
(014)
58
406
(013)
55
403
(014)
60
002
(010)
54
000
(013)
58
Females DE 403
(015)
32
402
(018)
33
402
(018)
34
-002
(011)
31
-002
(011)
31
120
(003)
023
080
(003)
043
CA 405
(017)
35
400
(018)
34
401
(016)
33
-005
(010)
34
-004
(010)
33
Log
Lymphocytes
()
Males DE 344
(022)
60
340
(023)
60
345
(025)
60
-004
(016)
60
001
(015)
60
015
(003)
088
-055
(003)
058
137
(005)
017
090
(005)
037
CA 344
(021)
58
340
(021)
55
346
(021)
60
-003
(015)
54
002
(017)
58
Females DE 348
(024)
32
347
(028)
33
350
(226)
34
001
(015)
31
002
(015)
31
-160
(004)
011
-153
(004)
013
CA 342
(029)
35
350
(027)
34
350
(026)
33
008
(016)
34
009
(016)
33
Log
Monocytes
()
Males DE 201
(026)
60
205
(021)
60
202
(023)
60
004
(018)
60
001
(021)
60
110
(004)
027
171
(004)
009
102
(006)
031
127
(006)
021
CA 206
(027)
58
205
(021)
55
200
(022)
60
001
(021)
54
-005
(021)
58
Females DE 190
(021)
32
193
(024)
33
190
(026)
34
005
(020)
31
-002
(022)
31
-045
(005)
065
-031
(005)
076
CA 191
(027)
35
196
(029)
34
192
(025)
33
006
(018)
34
001
(015)
33
Log
Eosinophils
()
Males DE 086
(063)
60
065
(069)
60
076
(067)
60
-021
(046)
60
-010
(027)
60
069
(008)
049
012
(008)
090
034
(013)
073
-044
(013)
066
CA 093
(058)
58
063
(086)
55
081
(067)
60
-023
(047)
54
-011
(038)
58
Females DE 063
(075)
32
043
(084)
33
059
(075)
34
-017
(032)
31
002
(027)
31
009
(010)
093
064
(010)
052
CA 063
(070)
35
043
(082)
34
056
(069)
33
-019
(054)
34
-005
(025)
33
Log
Basophils
()
Males DE -098
(046)
60
-088
(044)
60
-096
(047)
59
010
(056)
60
-000
(054)
59
-141
(009)
016
-119
(009)
023
015
(015)
088
028
(015)
078
CA -103
(056)
58
-080
(037)
55
-090
(044)
60
026
(054)
54
014
(047)
58
Females DE -091
(046)
32
-077
(037)
33
-089
(046)
33
014
(053)
31
-003
(046)
30
-125
(012)
021
-124
(012)
022
CA -093
(046)
35
-063
(039)
33
-076
(050)
33
030
(044)
33
013
(057)
33
Exp = Exposure DE = Diesel Exhaust CA = Clean Air Δ = Change from baseline SD = Standard deviation and SE = Standard Error Signt = =
statistically significant at p = 005 = borderline statistically significant at p = 005
81
Table 34d Mean Log Mediators Values and Contrast Test Results Baseline 6hr 24hr 6hr Δ
24hr Δ
Exposure
Main
Effect
On 6hr Δ
Exposure
Main
Effect On
24hr Δ
Exposure
by Sex
Effect
On 6hr Δ
Exposure
by Sex
Effect On
24hr Δ
Variables
Sex
Exp
Mean
(SD)
N
Mean
(SD)
N
Mean
(SD)
N
Mean
(SD)
N
Mean
(SD)
N
t-Value
(SE)
p-Value
t-Value
(SE)
p-Value
t-Value
(SE)
p-Value
t-Value
(SE)
p-Value
Log
CRP
(mgl)
Males DE -032
(129)
55
-040
(127)
49
-042
(149)
55
002
(044)
48
-015
(052)
53
-076
(010)
045
120
(009)
023
-126
(016)
021
-163
(015)
010
CA -046
(136)
56
-047
(145)
48
-047
(135)
57
009
(043)
48
-002
(055)
56
Females DE -030
(164)
32
-026
(153)
30
-020
(155)
32
008
(039)
30
010
(055)
32
100
(012)
032
114
(012)
025
CA -006
(134)
31
-022
(147)
30
-019
(153)
31
-004
(039)
29
-004
(034)
30
Log
IL-6
(pgml)
Males DE 241
(173)
49
232
(178)
48
294
(185)
26
-002
(089)
45
026
(105)
25
049
(023)
062
074
(026)
046
036
(041)
072
003
(046)
097
CA 253
(184)
48
241
(164)
45
300
(190)
27
-007
(118)
44
023
(152)
25
Females DE 170
(094)
21
139
(103)
21
144
(118)
13
-030
(083)
19
-019
(112)
11
-011
(035)
091
047
(038)
064
CA 160
(135)
20
106
(123)
20
108
(086)
14
-012
(054)
18
-011
(150)
10
Exp = Exposure DE = Diesel Exhaust CA = Clean Air Δ = Change from baseline SD = Standard deviation and SE = Standard Error CRP = C -
reactive protein and IL-6 = Interleukin 6 Signt = Significant = statistically significant at p = 005
= borderline statistically significant at p = 005
Table 34e Mean Log Coagulation Factor Values and Contrast Test Results Baseline 24hr 24hr Δ
Exposure Main
Effect On 24hr Δ
Exposure by Sex
Effect On 24hr Δ
Variables
Sex
Exp
Mean
(SD)
N
Mean
(SD)
N
Mean
(SD)
N
t-Value
(SE)
p-Value
t-Value
(SE)
p-Value
Log
Fibrinogen
(mgdl)
Males DE 549
(023)
57
550
(025)
58
001
(020)
55
008
(004)
094
-067
(007)
050
CA 548
(024)
53
548
(022)
54
002
(020)
49
Females DE 562
(020)
24
561
(020)
22
003
(018)
20
084
(006)
040
CA 564
(021)
22
562
(023)
27
-003
(026)
22
Exp = Exposure DE = Diesel Exhaust CA = Clean Air Δ = Change from baseline SD = Standard deviation and SE =
Standard Error Signt = Significant ple 005 is significant
36 Discussion
The results showed that there was a statistically significant exposuretimesex
three way interaction effect on platelet count after a 1-hour controlled human
environmental exposure to a known concentration of diesel exhaust (300microgm3) This
82
means that for platelets sex was a significant modifier of the effect of diesel exhaust
exposure relative to clean air depending on the time that the platelet sample was
measured
For the other systemic inflammatory and acute phase response markers that were
analyzed no other statistically significant differences in concentration were observed
between males and females These results are similar to results seen in other controlled
exposure studies that have been done (Lucking et al 2008 Carlsten et al 2007 Mills et al
2007 Tornqvist et al 2007 and Mills et al 2005) except that these studies did not examine
sex differences and they also had subjects engaging in some form of exercise during
exposure (Lucking et al 2008 Mills et al 2007 Tornqvist et al 2007 and Mills et al 2005)
Between males and females there was a statistically significant diesel exhaust
attributable difference in platelet count from baseline to 6 hours with females having a
mean higher platelet count than males Platelets are hypothesized to have an early role in
systemic surveillance and information transfer similar to macrophages (Weyrich et al
2009) Activated platelets are rapidly deployed through neutrophils to sites of
inflammation and can modulate inflammatory processes by the secretion of chemokines
which interact with leukocytes causing the secretion of cytokines and other inflammatory
mediators (Weyrich et al 2004 and Semple et al 2010) Therefore the observed significant
difference in platelet counts between males and females could be an indication of a diesel
exhaust induced systemic inflammatory response in females This is somewhat supported
by the fact that within females there was also an observed mean increase in platelet count
at 24 hours after exposure to diesel exhaust relative to clean air although this observation
was not statistically significant While within males there was an observed mean
83
decrease at 6 hours and 24 hours after exposure to diesel exhaust relative to clean air
although only the decrease at 24 hours was statistically significant
Table 35 Difference in Platelet Counts by Exposure and Sex
Sex Exposure 6 hr Δ 24 hr Δ
Males DEΔ ndash CAΔ -915 -773
SE 323 385
Females DEΔ ndash CAΔ 347 261
SE 542 705 Δ = Change from baseline
This observed mean decrease in platelet count within males could be due to the potential
suppressive effect of male hormones on the innate immune inflammatory response to
diesel exhaust exposure thereby causing a reduction in platelet count in an attempt to
hinder any ensuing inflammatory response to the DEPs in diesel exhaust
Another factor that could have contributed to the increase in platelets that was
observed in females is psychological stress which some subjects were exposed to
simultaneously with diesel exhaust This is because psychological stress has been shown
to modify hemostasis and thrombosis by causing a decrease in plasma volume thereby
leading to hemoconcentration (Deepa et al 2001) and an increase in the plasma
concentrations of blood cells like platelets and blood lipids like cholesterol
In contrast to this there is also the possibility that the mean decrease in platelet
count that was observed in males could be due to platelet aggregation in response to
oxidative stress induced injury Since the mechanism by which testosterone inhibits the
immune system is poorly understood and due to the fact that platelet aggregation
oxidative stress and hemoconcentration were not measured in this study there is no way
to directly evaluate either of the three possible alternate explanations for the observations
seen in males and females
84
Regardless the fact that there was a statistically significant mean decrease in
platelet count within males 24 hours after exposure to diesel exhaust relative to clean air
does help to further highlight the possibility that there is an underlying mechanism that
could be protective in males (hormonal suppression of inflammation) or harmful (platelet
aggregation) that needs to be further investigated for clarification
Epidemiological studies (Diez Roux et al 2006 Zeka et al 2006 Peters et al 2001
Samet et al 2000 and Schwartz 2001 ) have linked ambient levels of particulate matter to
adverse cardiovascular outcomes but the mechanisms that govern this link are poorly
understood (Riedl and Diaz Sanchez 2005) There is a general consensus that one
potential mechanism for this link is inflammation
Diesel exhaust is the largest single source of airborne combustion derived
particulate matter in many urban areas (Mills et al 2005 Riedl and Diaz Sanchez 2005)
and so it is one of the most studied environmental pollutants Epidemiological animal
and in-vitro studies that have examined the effects of exposure to diesel exhaust particles
have been able to demonstrate its pro-inflammatory nature via oxidative stress (Tornqvist
et al 2007) but the inflammation process itself is complex and remains incompletely
understood
Based on this for all subjects we expected to see diesel exhaust attributable
changes from baseline that exceeded those seen after exposure to clean air but this was
not observed In some instances there were equivalent or greater clean air attributable
changes than those seen after exposure to diesel exhaust Overall we observed a mixed
response trend in all the outcome variables between the sex groups which is different
85
from what has been observed in other studies where subject responses have often been in
one direction
Since both the diesel exhaust and clean air exposure conditions were monitored
and found to be similar for all subjects and also due to the fact that there was no
significant difference in baseline values between the two sex groups the observed results
could imply the following
that the study exposure was not long or intense enough or
that the observations could be due to the fact that the subjects were
relatively young and healthy or
the possibility of the effect of potential exposure to ambient DEPs to
subjects after the controlled exposures or
that the observations could be due to an interaction effect of one or more
study interventions which included a stress exercise for some subjects a
prolonged fast and repeated blood sampling (Tornqvist et al 2007)
Consequently the results do point to the possible presence of an underlying factor or
factors that needs to be investigated further for clarity
With the exception of platelets even though this study did not find a significant
difference in systemic inflammation and acute phase response markers between males
and females it still warrants further investigation because of the established link between
particulate matter exposure and cardiovascular disease and also due to the pro-
inflammatory nature of diesel exhaust This is because recent studies have emerged to
show inflammation as a strong independent risk indicator for cardiovascular disease
(Kritchevsky et al 2005) so this particulate matter induced inflammation poses a threat to
86
certain vulnerable populations and may increase the likelihood of adverse cardiovascular
outcomes
Also there are gender specific differences in the burden of cardiovascular disease
the prevalence of cardiovascular disease risk factors and the clinical presentation of
cardiovascular disease (Roberts 2005) which all point to a potential sex driven
mechanism that may be modifying the gender related differences that have been
observed For example in the United States cardiovascular disease is the leading cause
of death in adult women and also a leading cause of disability (Bedinghaus et al 2001 and
American Heart Association 2009) The observed increase in platelet concentration
following diesel exhaust exposure relative to clean air is one of the first steps that is
thought to give rise to the ambient air pollution inflammation induced cardiovascular
effects (Brooks et al 2004) that have been observed This observed platelet increase in
females whether in response to diesel exhaust induced systemic inflammation or due to
hemoconcentration both represent a potential risk factor and a potential modification by
sex which needs to be further investigated
361 Study Limitations
Due to issues with blood collection not all subjects had blood samples for all time
points and there was an imbalance in the number of males and females that were
analyzed with a higher ratio of males to females for all the outcome variables that were
analyzed Both of these could potentially have influenced the results that were seen
through the potential increase in variability between the groups (males and females)
being analyzed
87
In addition a potential source of error that was not investigated was the possible
additional exposure of subjects to DEPs and other types of pollution outside of the
exposure chamber during their diverse daily activities This might be a potential critical
confounder as indicated by the mixed response trend that was seen after exposure to
diesel exhaust and especially after exposure to clean air
Lastly since stress is a potential modifier of the response by sex due to the effect
of glucocorticoids on the cell mediated immune response the acute psychological
stressor that was used in this study may have masked any potential sex differences
Consequently further investigation using a larger more balanced study excluding any
additional acute stressors (psychological or physiological) may help to better elucidate
the potential modifying effect of sex on the systemic inflammation and acute phase
response to acute diesel exhaust exposure
37 Conclusions
Using a controlled human environmental exposure to a known concentration of
DE (300microgm3) with the exception of platelet count we observed a mixed response trend
in identified systemic inflammation and acute phase response markers by sex that was not
statistically significant Platelet count was statistically significantly different between
males and females at 6 hours after diesel exhaust exposure relative to clean air with
females having a mean higher platelet count than males There was also a statistically
significant decrease in mean plate count within males at 24 hours after diesel exhaust
exposure relative to clean air The significant sex difference in platelet count at 6 hours
88
indicates that females had a stronger systemic inflammatory response to diesel exhaust
exposure than males relative to clean air
89
Appendix B
Table B1 Systemic Inflammation Markers
Blood Cell Values
Variables Times Measured
Platelet 1 Baseline 2 6hrs Post exposure
3 24hrs Post Exposure WBC RBC
MPV
Variables Times Measured
Neutrophils 1 Baseline
2 6hrs Post exposure
3 24hrs Post Exposure Lymphocytes
Monocytes
Eosinophils
Basophils
Variables Times Measured
Neutrophils 1 Baseline
2 6hrs Post exposure
3 24hrs Post Exposure
Lymphocytes
Monocytes
Eosinophils
Basophils
Variables Times Measured
CRP 1 Baseline
2 6hrs Post exposure 3 24hrs Post Exposure
Il-6
Variables Times Measured
Fibrinogen 1 Baseline
2 24hrs Post Exposure WBC = White Blood Cells and RBC = Red Blood Cells
Units of RBC = 10e6microL
Units of WBC and Cell Blood Count absolute variables 10e3microL Units of percent variables =
Unit of CRP = mgl Unit of IL-6 = pgml and Unit of Fibrinogen = mgdl
Table B2 CRP Mean Values
Sex Exposure Time N Min Max Mean SD
Males DE 1 55 002 750 132 144
6 49 002 669 127 147
24 55 000 626 127 128
CA 1 56 001 847 120 145
6 48 000 999 127 169
24 57 001 530 114 111
Females DE 1 32 001 704 165 193
6 30 001 677 161 186
24 32 001 820 175 210
CA 1 31 001 616 162 148
6 30 001 543 148 135
24 31 001 796 170 185
90
Table B3 IL-6 Mean Values
SEX Exposure Time N Min Max Mean SD
Males DE 1 49 017 52777 5267 11644
6 48 017 50999 5423 12265
24 26 102 53043 8675 14782
CA 1 48 019 52715 5961 12443
6 45 065 52220 5064 11027
24 27 067 52807 8936 14958
Females DE 1 21 080 4337 829 916
6 21 033 1499 600 467
24 13 120 7758 1005 2055
CA 1 20 033 9964 1166 2159
6 20 017 1233 475 385
24 14 059 1094 402 327
Table B4 WBC Mean Values
SEX Exposure Time N Min Max Mean SD
Males
DE 1 WBC 60 370 1000 577 126
6 WBC 60 380 990 661 154
24 WBC 60 290 980 563 153
CA 1 WBC 58 310 940 581 132
6 WBC 55 440 1040 663 149
24 WBC 60 320 830 550 118
Females DE 1 WBC 32 260 930 553 154
6 WBC 33 360 1150 641 179
24 WBC 34 260 810 514 120
CA 1 WBC 35 250 1040 578 162
6 WBC 34 350 1090 652 170
24 WBC 33 280 960 531 135
91
Table B5 Cell Blood Counts Means (Absolute Values) SEX Exposure Time N Min Max Mean SD
Males DE 1 Neutrophils 60 1410 6230 332848 94811
6 Neutrophils 60 1733 7108 390300 121108
24 Neutrophils 60 1505 7614 324340 116424
CA 1 Neutrophils 59 1081 6420 333627 105980
6 Neutrophils 56 1989 6753 390350 121943
24 Neutrophils 60 1284 5312 314038 87644
Females DE 1 Neutrophils 32 1427 6408 319672 112304
6 Neutrophils 33 1698 7613 371600 144311
24 Neutrophils 34 1161 5190 293218 95793
CA 1 Neutrophils 35 1263 7363 345626 137562
6 Neutrophils 35 1425 7281 367751 144616
24 Neutrophils 33 1627 6739 301861 111583
Males DE 1 Lymphocytes 60 761 2643 180962 40484
6 Lymphocytes 60 975 3258 200280 50966
24 Lymphocytes 60 765 3420 177748 48015
CA 1 Lymphocytes 59 1240 2647 178181 33298
6 Lymphocytes 56 1334 3115 196938 42931
24 Lymphocytes 60 838 2770 176558 41664
Females DE 1 Lymphocytes 32 892 3054 180938 56817
6 Lymphocytes 33 1001 3396 208142 60855
24 Lymphocytes 34 924 2643 171659 49895
CA 1 Lymphocytes 35 973 3191 177740 51295
6 Lymphocytes 35 1139 3394 214223 54878
24 Lymphocytes 33 885 2950 178233 51878
Males DE 1 Monocytes 60 176 860 44250 13636
6 Monocytes 60 279 833 51640 13379
24 Monocytes 60 184 892 43207 14141
CA 1 Monocytes 59 232 979 46215 14940
6 Monocytes 56 285 878 51439 12093
24 Monocytes 60 188 730 41703 12834
Females DE 1 Monocytes 32 165 559 36766 94371
6 Monocytes 33 234 733 44388 12879
24 Monocytes 34 188 558 34756 9783
CA 1 Monocytes 35 170 771 39026 11231
6 Monocytes 35 233 796 46620 13348
24 Monocytes 33 190 608 36273 9564
Males DE 1 Eosinophils 60 19 618 16592 11711
6 Eosinophils 60 14 583 15988 11597
24 Eosinophils 60 11 644 15108 11400
CA 1 Eosinophils 59 31 630 18003 13176
6 Eosinophils 56 8 624 16923 13129
24 Eosinophils 60 17 592 15622 12086
Females DE 1 Eosinophils 32 14 524 13341 10977
6 Eosinophils 33 14 542 13455 12407
24 Eosinophils 34 16 400 12021 9287
CA 1 Eosinophils 35 17 464 13403 10116
6 Eosinophils 35 17 661 13903 13758
24 Eosinophils 33 17 363 11730 86858
Males DE 1 Basophils 60 5 61 2380 1072
6 Basophils 60 9 72 2958 1421
24 Basophils 60 0 70 2282 1168
CA 1 Basophils 59 6 59 2290 1079
6 Basophils 56 13 64 3125 1226
24 Basophils 60 8 89 2453 1279
Females DE 1 Basophils 32 5 47 2416 1088
6 Basophils 33 12 55 3052 1018
24 Basophils 34 0 53 2182 1114
CA 1 Basophils 35 6 64 2511 1308
6 Basophils 35 0 90 3537 1702
24 Basophils 33 8 108 2809 1866
92
Table B6 Cell Blood Counts (Percent Values) SEX Exposure Time N Min Max Mean SD
Males DE 1 Neutrophils 60 3810 7310 5707 729
6 Neutrophils 60 4550 7290 5836 735
24 Neutrophils 60 4180 8100 5683 793
CA 1 Neutrophils 58 3180 7120 5669 750
6 Neutrophils 55 4270 7340 5852 747
24 Neutrophils 60 3470 7570 5665 755
Females DE 1 Neutrophils 32 4380 7380 5704 819
6 Neutrophils 33 3790 7950 5682 991
24 Neutrophils 34 3500 7300 5632 935
CA 1 Neutrophils 35 4050 7570 5829 982
6 Neutrophils 34 4020 7610 5564 974
24 Neutrophils 33 3910 7360 5595 891
Males DE 1 Lymphocytes 60 1410 5500 3198 703
6 Lymphocytes 60 1650 4750 3087 686
24 Lymphocytes 60 1500 5240 3238 753
CA 1 Lymphocytes 58 1580 5150 3176 645
6 Lymphocytes 55 1760 4640 3054 639
24 Lymphocytes 60 1710 5350 3256 677
Females DE 1 Lymphocytes 32 1830 4870 3331 798
6 Lymphocytes 33 1450 5460 3346 870
24 Lymphocytes 34 2020 5530 3402 875
CA 1 Lymphocytes 35 1670 5070 3194 882
6 Lymphocytes 34 1690 5050 3415 860
24 Lymphocytes 33 2010 5250 3429 859
Males DE 1 Monocytes 60 380 1160 771 185
6 Monocytes 60 400 1240 793 157
24 Monocytes 60 350 1240 775 166
CA 1 Monocytes 58 390 1530 810 221
6 Monocytes 55 440 1240 796 169
24 Monocytes 60 470 1270 758 164
Females DE 1 Monocytes 32 450 900 681 137
6 Monocytes 33 45 106 709 167
24 Monocytes 34 36 91 690 169
CA 1 Monocytes 35 35 164 699 211
6 Monocytes 34 40 171 744 242
24 Monocytes 33 46 156 704 202
Males DE 1 Eosinophils 60 3 95 283 176
6 Eosinophils 60 3 81 238 157
24 Eosinophils 60 3 99 263 174
CA 1 Eosinophils 58 8 107 304 211
6 Eosinophils 55 1 99 250 186
24 Eosinophils 60 4 101 276 191
Females DE 1 Eosinophils 32 3 84 239 179
6 Eosinophils 33 2 95 214 205
24 Eosinophils 34 3 75 232 166
CA 1 Eosinophils 35 3 83 235 176
6 Eosinophils 34 3 112 221 233
24 Eosinophils 33 4 74 219 154
Males DE 1 Basophils 60 1 9 041 016
6 Basophils 60 1 13 046 021
24 Basophils 60 0 14 042 021
CA 1 Basophils 58 1 10 041 019
6 Basophils 55 2 10 048 017
24 Basophils 60 2 11 045 019
Females DE 1 Basophils 32 1 10 044 019
6 Basophils 33 2 10 050 019
24 Basophils 34 0 9 044 019
CA 1 Basophils 35 1 8 043 017
6 Basophils 34 0 17 056 031
24 Basophils 33 2 19 053 033
93
Table B7 Fibrinogen Mean Values
SEX Exposure Time N Min Max Mean SD
Males DE 1 Fibrinogen 57 14860 42840 24841 5842
24 Fibrinogen 58 15570 50600 25381 7090
CA 1 Fibrinogen 53 12060 37910 24523 5491
24 Fibrinogen 54 13450 45020 24555 5549
Females DE 1 Fibrinogen 24 18250 43250 28010 5666
24 Fibrinogen 22 19810 43870 27846 5825
CA 1 Fibrinogen 22 22220 45170 28776 6754
24 Fibrinogen 27 15450 44470 28265 6321
Table B8 Mean Platelet Counts (x10e3microl)
SEX Exposure Time N Min Max Mean SD
Males DE 1 60 151 399 25053 55610
6 60 164 421 26458 56046
24 60 163 376 25417 54061
CA 1 59 171 362 24636 51001
6 56 174 382 26693 53311
24 60 174 387 25707 52106
Females DE 1 32 152 358 25066 58975
6 33 181 364 26791 56363
24 34 152 370 25947 59703
CA 1 35 167 381 26329 56414
6 35 181 363 27689 53421
24 33 169 373 27576 58314
DE = Diesel Exhaust CA = Clean Air SD = Standard deviation
Graph B1 Mean Platelet Count by Sex
94
References
American Heart Association 2010 Women and Cardiovascular Disease ndash Statistics
httpwwwamericanheartorgdownloadableheart1260905040318FS10WM10pdf
Becklake MR and Kauffmann F 1999 Gender differences in airway behavior over
the human life span Thorax 54 pg 1119-1138
Bedinghaus J Leshan L and Diehr S 2001 CoronaryArtery Disease Prevention Whatlsquos
Different for Women American Family Physician 63 pg 1393 ndash 1400
Brook RD Franklin B Cascio W Hong Y Howard G Lipsett M Luepker R
Mittleman M Samet J Smith SC Tager I 2004 Air Pollution and Cardiovascular
Disease A Statement for Healthcare Professionals From the Expert Panel on
Population and Prevention Science of the American Heart Association Circulation
109 pg 2655 ndash 2671
Carlsten C Kaufman JD Peretz A Trenga CA Sheppard L and Sullivan JH
2007 Coagulation Markers in Healthy Human Subjects Exposed to Diesel Exhaust
Thrombosis Research 120 pg 849-855
Christian MS 2001 IntroductionOverview Gender-Based Differences in
Pharmacologic and Toxicologic Responses International Journal of Toxicology 20
pg 145-148
Czerniak R Gender-Based Differences in Pharmacokinetics in Laboratory Animal
Models 2001 International Journal of Toxicology 20 pg 161-163
Da Silva JA 1995 Sex Hormones Glucocorticoids and Autoimmunity facts and
hypotheses Annals of the Rheumatic Disease 54 pg 6-16
Diaz-Sanchez D and Riedl M 2005 Diesel effects on human health a question of
stress American Journal of Physiology ndash Lung Cellular and Molecular Physiology
289 pg L722-L723
Deepa R Pradeep R and Mohan V 2001 Role of Psychological stress in Cardiovascular
Disease International Journal of Diabetes in Developing Countries 21 pg 121 ndash 123
Diaz-Sanchez D Tsien A Casillas A Dotson AR and Saxon A 1996 Enhanced
nasal cytokine production in human beings after in vivo challenge with diesel exhaust
particles Journal of Allergy and Clinical Immunology 98 pg114-123
Diez Roux AV Auchincloss AH Astor B Barr RG Cushman M Dvonch T
Jacobs Jr DR Kaufman J Lin X and Samson P 2006 Recent Exposure to
Particulate Matter and C-reactive Protein Concentration in the Multi-Ethnic Study of
Atherosclerosis American Journal of Epidemiology 164 pg 437-448
95
Donaldson K Stone V Seaton A and MacNee W 2001 Ambient Particle Inhalation
and the Cardiovascular System Potential Mechanisms Environmental Health
Perspectives 109(supplement 4) pg 523-527
Ersntgard L Sjogren B Warholm M and Johanson G 2003 Sex differences in
toxicokinetics of inhaled solvent vapors in humans 1 m-Xylene Toxicology and
Applied Pharmacology 193 pg 147-157
Fairweather D and Rose NR 2004 Women and Autoimmune Disease Emerging
Infectious Disease [Serial on the internet] 2004 November Available from
httpwwwcdcgovncidodEIDvol10no1104-0367htm
Faustman E and Omenn G Risk Assessment in Klaassen CD (eds) Casarett and
Doulllsquos Toxicology The Basic Science of Poisons 6th
ed New York Macmillan
2001 pg 83-104
Fortoul TI Moncada-Henandez S Saldivar-Osorio L Espejel-Maya G Mussali-
Galante P Avila-Casado MC Colin-Barenque L Hernandez-Serrato MI and
Avila-Costa MR 2005 Sex differences in bronchiolar epithelium response after the
inhalation of lead acetate (Pb) Toxicology 207 pg 323-330
Frumkin H and Thun MJ 2001 Diesel Exhaust Environmental Carcinogens 51 pg
193-198
Furuyama A Hirano S Koike E and Kobayashi T 2006 Induction of oxidative
stress and inhibition of plasminogen activator inhibitor-1 production in endothelial
cells following exposure to organic extracts of diesel exhaust particles and urban fine
particles Archives of Toxicology 80 pg 154-162
Gabay C and Kushner J 1999 Acute phase proteins and other systemic responses to
inflammation New England Journal of Medicine 340 pg 448ndash54
Gochfeld M 2007 Framework for gender differences in human and animal
toxicology Environmental Research 104 pg 4-21
Kritchevsky S Cesari M and Pahor M 2005 Inflammatory markers and
cardiovascular health in older adults Cardiovascular Research 66 pg 265ndash 275
Lamason R Zhao P Rawat R Davis A Hall JC Chae JJ Agarwal R Cohen
P Rosen A Hoffman EP and Nagaraju K 2006 Sexual dimorphism in immune
response genes as a function of puberty BMC Immunology 7 pg 2
Liang KY and Zeger LL 1986 Longitudinal Data Analysis Using Generalized Linear
Models Biometrika 73 pg 13 ndash 22
Lucking AJ Lundback M Mills NL Faratian D Barath SL Pourazar J Cassee
96
FR Donaldson K Boon NA Badimon JJ Sandstrom T Blomberg A and
Newby DE 2008 Diesel Exhaust Inhalation Increases Thrombus Formation In Man
European Heart Journal 29 pg 3043-3051
Messing K and Stellman JM 2006 Sex gender and womenlsquos occupational health
The importance of considering mechanism Environmental Research 101 pg 149-
162
Mills NL Tornqvist H Robinson SD Gonzalez M Darnley K MacNee W
Boon NA Donaldson K Blomberg A Sandstrom T and Newby DE 2005 Diesel
Exhaust Inhalation Causes Vascular Dysfunction and Impaired Endogenous
Fibrinolysis American Heart Association 112 pg 3930-3936
Mills NL Tornqvist H Gonzalez MC Vink E Robinson SD Soderberg S
Boon NA Donaldson K Sandstrom T Blomberg A and Newby DE 2007
Ischemic and Thrombotic Effects of Dilute Diesel-Exhaust Inhalation in Men with
Coronary Heart Disease The New England Journal of Medicine 357 pg 1075-1082
Nightingale JA Maggs R Cullinan Donnelly LE Rodgers DF Kinnersley R
Chung KF Barnes PJ Ashmore M and Newman-Taylor A 2000 Airway
Inflammation after Controlled Exposure to Diesel Exhaust Particles American
Journal of Respiratory and Critical Care Medicine 162 pg 161-166
Nordenhall C Pourazar J Blomberg A Levin J-O Sandstrom T and Adelroth E
2000 Airway inflammation following exposure to diesel exhaust a study of time
kinetics using induced sputum European Respiratory Journal 15 pg 1046-1051
Peters A Frouml hlich M Douml ring A Immervoll T Wichmann HE Hutchinson
WL Pepys MB and Koenig W 2001 Particulate Air Pollution is Associated with
an Acute Phase Response in Men Results from the MONICAndashAugsburg Study
European Heart Journal 22 pg 1198ndash1204
Pourazar J Mudway IS Samet JM Helleday R Blomberg A Wilson S Frew
AJ Kelly FJ and Sandstrom T 2005 Diesle Exhaust activates redox-sensitive
transcription factors and kinases in human airways American Journal of Physiology ndash
Lung Cellular and Molecular Physiology 289 pg L724-L730
Riedl M and Diaz-Sanchez D 2005 Biology of diesel exhaust effects on respiratory
function Journal of Allergy and Clinical Immunology 115 pg 221-8
Robert B Gender-Specific Aspects of Cardiovascular Disease 2005 Womenlsquos Heart
Foundation RI Medicine and Health Article
Rogers A and Davies B 2005 Diesel Particles ndash Recent Progress on an Old Issue
Annals of Occupational Hygiene 49 pg 453-456
97
Salvi S Blomberg A Rudell B Kelly F Sandstrom T Holgate ST and Frew A
1999 Acute Inflammatory Responses in the Airway and Peripheral Blood After
Short-Term Exposure to Diesel Exhaust in Healthy Human Volunteers American
Journal of Respiratory and Critical Care Medicine 159 pg 702-709
Salvi S and Holgate ST 1999 Mechanisms of particulate matter toxicity Clinical
and Experimental Allergy 29 pg 1187-1194
Salvi S Nordenhall C Blomberg A Rudell B Pourazar J Kelly F Wilson S
Sandstrom T Holgate ST and Frew A 2000 Acute Exposure to Diesel Exhaust
increase IL-8 and GRO-α Production in Healthy Human Airways American Journal
of Respiratory and Critical Care Medicine 161 pg 550-557
Samet JM Dominici F Curriero FC Coursac I and Zeger SL 2000 Fine
Particulate Air Pollution and Mortality in 20 US Cities 1987-1994 The New
England Journal of Medicine 343 pg 1742-1749
Saxton A and Diaz-Sanchez D 2000 Diesel exhaust as a model xenobiotic in
allergic inflammation Immunophamacology 48 pg 325-327
Schwartz J 2001 Air Pollution and Blood Markers of Cardiovascular Risk
Environmental Health Perspectives 109(supplement 3) pg 405ndash409
Semple JW and Freedman J 2010 Platelets and innate immunity Cellular and
Molecular Life Sciences 67 pg 499ndash511
Sydbom A Bomberg A Parnia S Stenfors N Sandstrom T and Dah en SE 2001
Health Effects of Diesel Exhaust Emissions European Respiratory Journal 17 pg
733-746
Tornqvist H Mills NL Gonzalez M Miller MR Robinson SD Megson IL
MacNee W Donaldson K Soderberg S Newby DE Sandstrom T and Blomberg
A 2007 Persistent endothelial dysfunction following diesel exhaust inhalation in
man American Journal of Respiratory and Critical Care Medicine 176 pg 395-400
US EPA 2002 Health assessment document for diesel engine exhaust US
Environmental Protection Agency Document EPA6008-90057F
Vahter M Gochfeld M Casati B Thiruchelvam M Falk-Filippson A Kavlock R
Marafante E and Cory-Slechta D 2007 Implications of gender differences for
human health risk assessment and toxicology Environmental research 104 pg 70-84
Van Eeden SF Tan WC Suwa T Mukae H Terashima T Fujii T Qui D
Vincent R and Hogg JC 2001 Cytokines Involved in Systemic Inflammatory
Response Induced by Exposure to Particulate Matter Air Pollutants (PM10) American
Journal of Respiratory and Critical Care Medicine 164 pg 826-830
98
Weyrich AS and Zimmerman GA 2004 Platelets signaling cells in the immune
continuum Trends in Immunology 25 pg 489 ndash 495
Zeka A Sullivan JR Vokonas PS Sparrow D Schwartz J 2006 Inflammatory
Markers and Particulate Air Pollution characterizing the pathway to disease
International Journal of Epidemiology 35 pg 1347ndash1354
99
Chapter 4
Analysis of Sex Differences in Self Reported Symptoms after
Acute Exposure to Diesel Exhaust
100
41 Abstract
42 Introduction
421 Symptoms of Diesel Exhaust Exposure
422 Sex Gender and Symptoms
423 Sex and Respiratory Related Symptoms
43 Materials and Methods
431 Data Collection
432 Exposure Conditions and Experimental Design
433 Subject Selection and Demographic Data
434 Symptom Questionnaire
435 Questionnaire Administration Protocol
44 Statistical Methods
441 Calculation of Response Measures
45 Results
46 Discussion
461 Study Limitations
47 Conclusions
Appendix C
References
101
41 Abstract
Background Inhalation of diesel exhaust has been associated with range of
health effects from eye irritation to cardiovascular effects Sex differences have
been observed in self reported somatic symptoms after exposure to an injurious
substance
Aims To evaluate possible sex differences in self reported health symptoms after
acute exposure to diesel exhaust in a controlled environmental facility
Method In a crossover design study healthy subjects were exposed to 300microgm3
of diesel exhaust and clean air in random order for 1 hour each in a controlled
environmental exposure chamber on two different days (ge1 week washout)
Subjects completed eight symptom questionnaires during the study session which
were analyzed using a generalized linear equation model
Results There were statistically significant diesel exhaust induced sex
differences in somatic (p = 00501) and lower respiratory (p lt00001) symptoms
with females primarily having higher mean symptom severity ratings than males
Conclusion In healthy volunteers acute exposure to 300microgm3 of diesel exhaust
for an hour in a controlled environmental study resulted in females having
statistically significantly higher self reported somatic and lower respiratory
symptom severity ratings than males relative to clean air exposure This indicates
that females may be more sensitive to the effects of diesel exhaust exposure than
males
42 Introduction
Diesel exhaust is produced from the combustion of diesel fuel Due to the superior
performance characteristics of the diesel engine it has been widely used to power
vehicles and other machineries (USEPA HAD 2002) Compared to gasoline engines
diesel exhaust engines emit more particulate matter per mile driven (Tox Probe) This
along with its wide use has made diesel exhaust a significant contributor to ambient air
pollution and the largest single source of airborne particulate matter (PM) in many urban
areas (Riedl and Diaz-Sanchez 2005)
Due to the ubiquitous nature of diesel exhaust and the potential for the high
exposure of certain populations like workers using diesel-powered machinery and people
who live close to diesel traffic diesel exhaust has been one of the most studied
102
environmental pollutants in an attempt to determine its toxicological effects in humans
and rodents Inhalation of diesel exhaust is the primary route of exposure therefore
experimental studies have often been done to examine the association between diesel
exhaust exposure and respiratory and cardiovascular effects The measures that have been
used to assess these effects include cell changes (in-vivo and in-vitro) biomarkers
physiological changes and self reported symptoms following diesel exhaust exposure
421 Symptoms of Diesel Exhaust Exposure
Epidemiological and clinical studies that have been done to date have shown that
there are a range of symptoms that can occur after exposure to diesel exhaust via
inhalation Depending on the concentration of the exposure acute exposure to diesel
exhaust has been shown to cause the following symptoms and effects acute irritation
(eg eye nose throat bronchial) neurophysiological symptoms (eg lightheadedness
nausea) respiratory symptoms (cough phlegm) there is also evidence for an
immunologic effect (the exacerbation of allergenic responses to known allergens and
asthma-like symptoms) and cardiovascular effects (USEPA HAD 2002 Donaldson et al
2001)
Following inhalation of diesel exhaust not everyone will report the same types
frequency and severity of symptoms This is because there are many determinants that
affect the type frequency and severity of self reported symptoms following the inhalation
of a harmful substance like diesel exhaust A broad definition of a symptom can be gotten
from Gijsberlsquos model of physical symptom perception where a symptom is defined as ―an
aversely perceived internal state (Gijsbers et al 1997) By adapting this model to self
103
reported symptoms following an inhalation exposure and incorporating Becklake and
Kauffmans (1999) definition of determinants of airway behavior within this modified
model a determinant of a self reported symptom can be seen as anything that causes or
does not cause a change in the occurrence and perception of a symptom and anything
that may increase or decrease the risk of perceiving the symptom This definition
encompasses a ―biopsychosocial (Gijsbers et al 1997) explanation of the factors that
contribute to the types frequency and severity of self reported symptoms following the
exposure to an inhaled air pollutant like diesel exhaust A key assumption of this model is
that a self reported symptom is ―the outcome of a perceptual process (Gijsbers et al
1997) Two individual factors where the biological psychological and environmental
aspects of self reported symptom perception intercept are sex and gender
422 Sex Gender and Symptoms
In public health terms sex can be thought to determine genetically based
sensitivity to health determinants and gender can be thought to express some social forces
that can influence exposure and responses to health determinants (Messing and Stellman
2006) The effects of sex and gender on the adverse health effects following the exposure
to a harmful substance or stimuli often complement each other Gender often has a big
influence on the context types and levels of the substance that males and females get
exposed to especially in the occupational setting and sex often has a big effect on how
males and females absorb distribute metabolize and excrete the xenobiotic once the
exposure has taken place (Arbuckle 2006 and Dimich-Wald et al 2006) Thus it is easy to
104
see how these two factors (sex and gender) are involved in the proposed biopsychosocial
model of self reported symptoms and where they intersect with each other (figure 1)
It follows therefore that determinants of self reported symptoms related to exposures can
be broadly grouped into biological determinants implicit in the word sex and
sociocultural determinants implicit in the word gender (Becklake and Kauffmann 1999)
Figure 41 Intersetion of Sex and Gender and Self Reported Symptom Determinants
This is especially so because sex differences with respect to symptoms are
thought to involve differences in neuroanatomical neurophysiological and
neurobiological pathways that are activated upon exposure to an injurious substance and
which produce differences in the perception processing and modulation of the resulting
symptoms (Barsky et al 2001) In contrast to that gender related differences in symptom
perception and sensitivity (Dimich et al 2006 and Barsky et al 2001) especially with
regards to somatic symptoms are thought to involve innate differences in somatic and
visceral perceptions differences in the socializing process and differences in symptom
labeling description and reporting (Barsky et al 2001) Thus males and females often
differ in the types frequency and severity of self reported symptoms with females having
been shown to report ―more intense more numerous and more frequent bodily symptoms
than men (Barsky et al 2001 and Kroenke et al 1990)
Environmental
Biological Psychological
Sex and
Gender
105
This observed gender difference with regards to somatic symptoms is one that has
been well established and is independent of the symptom measure response format the
time frame used and the population being studied in females (Gijsbers et al 1997)
Looking at the proposed biological and social factors that are thought to contribute to
both sex and gender differences (Table 1) in relation to reported somatic symptoms and
presentations it becomes obvious that it can be difficult to distinguish between the effects
of sex and gender as they often work together or modulate one another in the perception
and presentation of self reported symptoms
Table 41 Proposed Determinants of Self Reported Symptoms Determinants Examples
Biological Physiological
1 Dimensional ndash there are differences in airway dimensions relative to lung size eg women exhibit on average a higher flow rate in relation to lung size than men
2 Immunological ndash there are differences in total serum IgE levels
3 Hormonal ndash Sex hormones influence many aspects of airway behavior eg female airways are responsive to their sex hormones and cyclical fluctuations
4 Sensitivity ndash Laboratory and field studies have shown that women are more
sensitive to external environmental cues (including stress) and men to internal physiological stimuli in noticing defining and reacting to physical symptoms
Psychosocial and Environmental
1 Some psychosocial factors which are more prevalent in women are strongly associated with symptom reporting particularly depressive and anxiety disorders
as well as a history of sexual or physical abuse
2 Other psychosocial antecedents that have been hypothesized include cultural factors permitting less stoicism and greater expressiveness among women
amplification of somatic symptoms a lower threshold for seeking health care and
gender differences in social roles and responsibilities
Sources Barsky et al 2001 Kroenke et al 1990 and Becklake and Kauffmann 1999
423 Sex and Respiratory Related Symptoms
Overall there has been increasing evidence of the interaction of biological factors
with socio-environmental factors in the perception reporting and interpretation of
respiratory symptoms related to airway disease (Becklake and Kauffmann 1999) When
looking at self reported symptoms in relation to an inhaled air pollutant like diesel
exhaust one is usually interested in assessing both primary (eg cough and irritation of
the nose) and secondary (eg fatigue and body pain) respiratory related symptoms and
morbidity With regards to respiratory morbidity comparatively little attention has been
106
given in the scientific literature to the potential effect of sex and there is a tendency to
control for sex instead of examining sex based influences on health (Dimich-Wald et al
2006)
In 2006 Dimich-Ward et al looked at gender differences in respiratory morbidity
based on surveys of food service workers radiographers and respiratory therapists and
they found that across occupations women consistently had a greater respiratory
morbidity for symptoms associated with shortness of breath while men usually had a
higher prevalence of phlegm complaints
Ernstgard et al in 2002 examined differences between men and women in acute
health effects after a controlled chamber exposure to 2-propanol and m-xylene vapors
Within the self reported symptoms they found that the rating for throat or airway
discomfort increased more in women during exposure to 2-propanol or m-xylene and that
the rating for fatigue was more increased in men after a one hour exposure to 2-propanol
but more increased in women after a two hour exposure to 2-propanol (Ernstgard et al
2002)
This then raises the question of whether the observations of the studies above as
well as the sex differences observed in relation to somatic symptom reporting could be
present in self reported symptoms following diesel exhaust exposure and whether this
trend extends beyond somatic symptoms to other respiratory symptoms Therefore the
purpose of this study is to investigate whether there are sex differences in the self
reported symptoms of males and females after acute exposure to diesel exhaust
107
43 Materials and Methods
431 Data Collection
The data that were used for this study are part of the datasets generated from a
previous study of diesel exhaust effects The study was funded by the Department of
Defense (DOD) through a grant to the University of Medicine and Dentistry of New
Jersey (UMDNJ) (Grant DAMD17-03-1-0537 Principal Investigator Dr Nancy
Fiedler)
432 Exposure Conditions and Experimental Design
A crossover design was used in which each subject underwent two exposure
conditions on two separate days in random order one was to a diluted diesel exhaust
normalized to PM10 concentration of 300microgm3 and the other was to filtered clean
ambient air of Busch campus in Piscataway a suburban campus of Rutgers University
Both exposure conditions were 1 hour in duration and took place at the Environmental
and Occupational Health Sciences Instituteslsquo (EOHSI) Controlled Environmental Facility
(CEF) Each exposure condition was presented with and without an acute psychological
stressor to two groups of subjects high and low in self reported chemical intolerance (CI)
Subjects were also asked to fast overnight the day before the study until after each
exposure session and to also abstain from any exercise
There were no significant differences in the exposure conditions for all subjects
Overall the concentration of PM10 that the subjects were exposed to was 276plusmn13microgm3
which was close to the target concentration of 300microgm3
108
Table 42 Mean Air Characteristics and Composition Diesel Exhaust Clean Air
PM10 (microgm3) 276 plusmn 13 6 plusmn 5 NOX (ppm) 363 plusmn 090 002 plusmn 002
CO (ppm) 379 plusmn 076 091 plusmn 021
1 Nitropyrene (ngm3) 268 plusmn 051 lt006
433 Subject Selections and Demographic Data
110 healthy non-smoking men and women between the ages of 18 and 50 were
recruited from the local community in Piscataway New Jersey based on the established
study criteria 100 subjects completed the study
As mentioned previously some subjects were simultaneously exposed to a
psychological stressor and to diesel exhaust Due to the fact that we were analyzing self
reported symptoms which have the potential to be heavily influenced by psychological
stress therefore all subjects who were also exposed to the psychological stressor were
excluded from the analysis leaving 49 subjects
Table 43 Demographic Information and Baseline Subject Characteristics Females N = 22 Males N = 27
Min Max Mean SD Min Max Mean SD
AGE (years) 19 43 2409 567 18 34 2311 357
Education (Years) 12 22 1564 235 12 20 1591 226
Pulse M 50 94 7018 1081 56 86 6915 786
Respiration M 14 20 1636 201 10 20 1538 210
Temperature oF M 96 99 9820 065 96 99 9809 079
Height (inches) 60 73 6405 269 65 75 6906 267
Weight(lb) 104 200 13450 2579 136 236 17300 2506
Race Frequency () Frequency ()
Asian Pacific Islander 9 (4091) 10 (3704)
Black not Hispanic 1 (455) 4 (1481)
Hispanic or Latino 4 (1818) 6 (2222)
OtherUnknown 1 (455) 0 (0)
White not Hispanic 7 (3181) 7 (2593)
M = Some subjects had missing data For Pulse and Respiration N = 26 for Males For Temperature N = 19 for Females
and N = 25 for Males Education Calculated as High school (12 years) + Years of college or other
109
434 Symptom Questionnaire
A symptom questionnaire that consisted of 37 symptom questions that could be
grouped into the following symptom clusters 1) somatic 2) eye irritation 3) anxiety 4)
lower respiratory 5) upper respiratory 6) central nervous system (CNS) 7) acute phase
reaction (APR) and 8) no load (general symptoms) was used (see table 3 for a list of
individual symptoms)
Figure 42 Labeled Magnitude Scale
Source Green et al 1996 (Reproduced with permission from Chemical Senses)
These clusters were chosen because they represent categories of symptoms that
have been directly associated with either upstream responses to diesel exhaust exposure
such as upper and lower respiratory symptoms or which are thought to be an indirect
110
representation of downstream systemic changes in response to diesel exhaust exposure
such as acute phase reaction symptoms which reflect the presence and intensity of
systemic inflammation (Gabay et al 1999)
The symptoms were rated using a labeled magnitude scale that was developed by
Green et al (1996) and which ranged from 0 (barely detectable) to 100 (strongest
imaginable) (see Figure 2)
435 Questionnaire Administration Protocol
The questionnaire was administered at eight times before during and after the
experimental exposure to diesel exhaust and clean air (see figure 3)
Exposure
S1 S2 S3 S4 S5 S6 S7 S8
Baseline asymp25 min asymp10 min asymp40 min asymp55 min asymp10 min asymp6 hrs asymp24 hrs Pre- After After After After After After
Exposure Exposure Exposure Exposure Exposure Exposure Exposure
Start Start Start End End End
Figure 43 Questionnaire Study Protocol S = Symptom questionnaire
44 Statistical Methods
Descriptive statistical analysis histograms and box plots were used to evaluate the
distribution of all the variables and to check for outliers Based on the fact that the data
were right skewed a Poisson distribution was used in the final analysis
111
441 Calculation of Response Measures
The individual severity ratings for the 37 symptoms were added together within
the previously mentioned eight categories (see table 4) to give eight total summary
symptom severity response measures
Table 44 Description of Symptom Categories and The Creation of the Summary Severity Scores
Symptom Categories
Individual Symptoms
Range of Total
Summary Score
Somatic = Skin irritation + Ear ringing + Leg cramp +
Perspiration + Leg tingling + Back pain
0 - 600
Eye Irritation = Eye Irritation + Running Eyes 0 ndash 300
Anxiety = Jittery + Nervous + Palpitation + Tense + Worried 0 ndash 500
Lower Respiratory = Shortness of breath + Chest pain + Wheezing + Chest
tightness + Coughing + pain upon deep inspiration
0 ndash 800
Upper Respiratory = Nasal congestion + Sneezing + Choking + Throat
irritation + Nose irritation
0 ndash 500
Central Nervous System = Disoriented + Dizzy + Headache + Light headed 0 ndash 400
Acute Phase Reaction = Fatigue + Drowsy + Concentration + Nausea + Body
temperature + Body ache + Stomach ache
0 ndash 700
0 ndash 200 No Load = Bad taste + Facial temperature
To address the aim of the paper a Poisson regression using a generalized linear
model with repeated analysis and contrast was done to see if there was a significant three
way interaction between exposure (diesel exhaust and clean air) sampling time (Time 1
to Time 8) and sex (males and females) The final model contained sex as a between
subjects variable exposure and time as within subjects variables with the eight symptom
outcome variables as the dependent variables The exposuretimesexlsquo three way
interaction was examined to assess the hypothesis of interest
112
Table 45a Mean Total Symptom Severity Ratings by Category and the Time Reported T1 T2 T3 T4 T5 T6 T7 T8
Sex
Exp
Mean
(SD)
N
Mean
SD
N
Mean
SD
N
Mean
SD
N
Mean
SD
N
Mean
SD
N
Mean
SD
N
Mean
SD
N
Somatic Males DE 056
(160) 27
259
(801) 27
167
(416) 27
296
(763) 27
148
(496) 27
111
(406) 27
056
(212) 27
074
(267) 27
CA 167
(605) 27
093
(242) 27
241
(526) 27
385
(697) 26
389
(670) 27
241
(578) 27
058
(216) 26
074
(267) 27
Females DE 091
(251) 22
182
(395) 22
295
(630) 22
455
(987) 22
773
(1369) 22
273
(481) 22
182
(424) 22
227
(592) 22
CA 364
(693)
22
159
(358)
22
364
(727)
22
250
(572)
22
205
(527)
22
114
(343)
22
250
(798)
22
318
(749)
22
Eye
Irritation
Males DE 204
(542) 27
241
(641) 27
667
(1932) 27
463
(796) 27
444
(594) 27
130
(407) 27
019
(096) 27
000
(000) 26
CA 278
(684) 27
241
(870) 27
481
(1535) 27
212
(619) 26
148
(677) 27
019
(096) 27
019
(098) 26
148
(477) 27
Females DE 091
(251) 22
114
(264) 22
477
(957) 22
659
(1106) 22
500
(1080) 22
114
(306) 22
045
(147) 22
068
(234) 22
CA 068
(176) 22
136
(539) 22
262
(983) 21
167
(658) 21
227
(960) 22
045
(147) 22
114
(343) 22
091
(332) 22
Anxiety Males DE 407
(878)
27
426
(1291)
27
444
(684)
27
907
(3369)
27
537
(1386)
27
352
(1277)
27
074
(301)
27
074
(301)
27
CA 333
(650) 27
444
(984) 27
241
(447) 27
173
(423) 26
167
(367) 27
093
(393) 27
038
(196) 26
148
(770) 27
Females DE 227
(481) 22
364
(516) 22
614
(1243) 22
750
(1193) 22
886
(1654) 22
182
(451) 22
000
(000) 22
000
(000) 22
CA 773
(948) 22
523
(852) 22
524
(1279) 21
476
(782) 21
273
(551) 22
068
(234) 22
159
(473) 22
159
(543) 22
Lower
Respiratory
Males DE 074
(301)
27
111
(424)
27
315
(786)
27
611
(1188)
27
315
(942)
27
056
(212)
27
130
(328)
27
019
(098)
26
CA 148
(362)
27
148
(304)
27
148
(434)
27
212
(404)
26
111
(253)
27
019
(096)
27
077
(306)
26
019
(096)
27
Females DE 023
(107)
22
114
(343)
22
364
(710)
22
455
(999)
22
705
(1377)
22
068
(320)
22
091
(294)
22
091
(294)
22
CA 227
(767) 22
277
(752) 22
068
(320) 22
159
(473) 22
205
(667) 22
023
(107) 22
386
(1388) 22
136
(441) 22
T1 = Symptom severity reported at the start of the study session
T2 = Symptom severity reported at asymp25 min after the start of the study session
T3 = Symptom severity reported at asymp10 min after the start of the exposure T4 = Symptom severity reported at asymp40 min after the start of the exposure
T5 = Symptom severity reported at asymp55 min after the start of the exposure
T6 = Symptom severity reported at asymp10 min after the end of the exposure T7 = Symptom severity reported at asymp6 hrs after the end of the exposure
T8 = Symptom severity reported at asymp24 hrs after the end of the exposure
DE = Diesel Exhaust and CA = Clean Air
113
Table 45b Mean Total Symptom Severity Ratings by Category and the Time Reported (continued) T1 T2 T3 T4 T5 T6 T7 T8
Sex
Exp
Mean
(SD)
N
Mean
SD
N
Mean
SD
N
Mean
SD
N
Mean
SD
N
Mean
SD
N
Mean
SD
N
Mean
SD
N
Upper
Respiratory
Males DE 556
(1235) 27
222
(625) 27
1056
(2890) 27
833
(1065) 27
981
(1431) 27
148
(388) 27
204
(465) 27
160
(450) 25
CA 796
(1179) 27
315
(709) 27
481
(1079) 27
385
(941) 26
278
(751) 27
111
(349) 27
058
(163) 26
352
(617) 27
Females DE 295
(367) 22
318
(589) 22
795
(1054) 22
795
(1436) 22
886
(1414) 22
159
(358) 22
227
(456) 22
136
(316) 22
CA 682
(1086)
22
500
(1309)
22
400
(736)
20
429
(978)
21
318
(568)
22
114
(264)
22
205
(367)
22
455
(1122)
22
Central
Nervous
System
Males DE 019
(096) 27
115
(588) 26
667
(1256) 27
796
(1318) 27
870
(1237) 27
241
(656) 27
074
(267) 27
037
(193) 27
CA 111
(400) 27
056
(289) 27
148
(412) 27
058
(163) 26
130
(382) 27
074
(385) 27
000
(000) 26
074
(385) 27
Females DE 023
(107) 22
205
(454) 22
955
(1174) 22
1364
(2356) 22
1318
(2515) 22
159
(323) 22
045
(147) 22
023
(107) 22
CA 159
(419) 22
091
(332) 22
227
(429) 22
432
(1208) 22
455
(1344) 22
091
(332) 22
159
(419) 22
068
(234) 22
APR Males DE 881
(1725)
27
841
(2172)
27
1037
(1372)
27
1704
(2411)
27
1611
(2058)
27
778
(1553)
27
352
(897)
27
481
(1189)
27
CA 567
(1108) 27
907
(1352) 27
1333
(1653) 27
1154
(1355 26
1130
(1458) 27
426
(938) 27
462
(999) 26
481
(1355) 27
Females DE 886
(1164) 22
1864
(2189) 22
2341
(1809) 21
2477
(2495) 21
1886
(1812) 22
614
(801) 22
477
(587) 22
318
(524) 22
CA 1500
(1648) 22
2045
(2540) 22
3214
(3258) 22
1952
(3041) 22
1477
(2027) 22
818
(1064) 22
977
(1592) 22
636
(1104) 22
No Load Males DE 130
(472)
27
074
(301)
27
241
(777)
27
426
(988)
26
315
(992)
27
037
(193)
27
019
(096)
26
037
(133)
27
CA 204
(639)
27
130
(407)
27
111
(487)
27
096
(284)
27
093
(341)
27
056
(289)
27
000
(000)
27
000
(000)
27
Females DE 091
(332)
22
114
(343)
22
205
(480)
22
182
(363)
22
182
(395)
22
068
(234)
22
000
(000)
22
000
(472)
22
CA 273
(752) 22
295
(549) 22
250
(482) 22
273
(631) 22
250
(551) 22
182
(451) 22
182
(451) 22
136
(441) 22
T1 = Symptom severity reported at the start of the study session
T2 = Symptom severity reported at asymp25 min after the start of the study session
T3 = Symptom severity reported at asymp10 min after the start of the exposure T4 = Symptom severity reported at asymp40 min after the start of the exposure
T5 = Symptom severity reported at asymp55 min after the start of the exposure
T6 = Symptom severity reported at asymp10 min after the end of the exposure T7 = Symptom severity reported at asymp6 hrs after the end of the exposure
T8 = Symptom severity reported at asymp24 hrs after the end of the exposure
DE = Diesel Exhaust and CA = Clean Air
114
Tests of the three interactions were conducted using Type 3 score tests (Liang and
Zeger 1986) of the interaction between exposure time and sex Contrasts were used to
test whether males and females differed with respect to the effect of exposure on changes
in the symptom severity ratings from baseline to each subsequent time point Contrasts
were also used to test whether within males and within females changes in the symptom
severity ratings from baseline to each subsequent time point differed between exposures
All statistical analysis for this paper were done using SAS software Version 91
of the SAS System for Windows (SAS Institute Inc Cary NC USA) and SPSS
software Version 170 (SPSS inc Chicago IL) Also some graphs were created using
Microsoft Excel 2007 P-values less than or equal to 005 were considered to be
significant
45 Results
Interaction Effect of Exposure Time and Sex on Symptoms
The results of the analysis showed that out of the eight symptom categories that
were assessed there was a statistically significant three way exposuretimesexlsquo
interaction effect on somatic (p = 00501) and lower respiratory symptom severity ratings
(p lt00001) Upper respiratory and acute phase reaction did not show a significant three
way exposuretimesexlsquo interaction effect (see table 6)
115
Table 46 Three Way Interaction Results ExposureTimeSex
Variables DF Chi Square p Value
Somatic 7 1406 00501
Eye Irritation ndash ndash ndash Anxiety ndash ndash ndash
Lower Respiratory 7 157215 lt00001 Upper Respiratory 7 273 091
CNS ndash ndash ndash APR 7 910 025
No Load ndash ndash ndash - = No results due to lack of convergence
E = Exposure (Diesel Exhaust and Clean Air) T = Time (1 ndash 8)
S = Sex (Females and Males) ple 005 is significant
Graph 41a-b Line Graph of Mean Self reported Somatic and Lower Respiratory Symptoms by Sex
116
For the remaining four symptom clusters (eye irritation anxiety central nervous
system and no load) the majority of subjects had a zero severity rating and therefore there
was very little variability between the groups to analyze Therefore the four clusters could
not converge in the model and so did not produce results (see tables 7a ndash 7d)
Table 47a Count of Reported Eye Irritation Symptoms (NY) by Sex Exposure and Time
Females Males
Clean Air Diesel Exhaust Clean Air Diesel Exhaust
Time NY Freq Freq Freq Freq
T1 N 19 864 19 864 21 778 22 815
Y 3 136 3 136 6 222 5 185
T2 N 20 909 18 818 27 1000 27 1000
Y 2 91 4 182 22 815 22 815
T3 N 18 818 15 682 5 185 5 185
Y 4 182 7 318 27 1000 27 1000
T4 N 19 864 12 545 23 852 17 630
Y 3 136 10 455 4 148 10 370
T5 N 20 909 13 591 27 1000 27 1000
Y 2 91 9 409 21 778 16 593
T6 N 20 909 19 864 6 222 11 407
Y 2 91 3 136 27 1000 27 1000
T7 N 19 864 20 909 25 926 14 519
Y 3 136 2 91 2 74 13 481
T8 N 20 909 20 909 27 1000 27 1000
Y 2 91 2 91 26 963 23 852
N = Symptom severity rating of ―0 Y = Symptom severity rating gt ―0 Freq = Frequency and = Percent
Table 47b Count of Reported Anxiety Symptoms (NY) by Sex Exposure and Time
Females Males
Clean Air Diesel Exhaust Clean Air Diesel Exhaust
Time NY Freq Freq Freq Freq
T1 N 9 409 17 773 19 704 20 741
Y 13 591 5 227 8 296 7 259
T2 N 12 545 13 591 18 667 21 778
Y 10 455 9 409 9 333 6 222
T3 N 14 636 13 591 20 741 16 593
Y 8 364 9 409 7 259 11 407
T4 N 13 591 13 591 22 815 20 741
Y 9 409 9 409 5 185 7 259
T5 N 17 773 14 636 22 815 21 778
Y 5 227 8 364 5 185 6 222
T6 N 20 909 18 818 25 926 23 852
Y 2 91 4 182 2 74 4 148
T7 N 19 864 22 1000 25 926 25 926
Y 3 136 0 00 2 74 2 74
T8 N 19 864 22 1000 26 963 25 926
Y 3 136 0 00 1 37 2 74
N = Symptom severity rating of ―0 Y = Symptom severity rating gt ―0 Freq = Frequency and = Percent
117
Table 47c Count of Reported Central Nervous System Symptoms (NY) by Sex Exposure and Time Females Males
Clean Air Diesel Exhaust Clean Air Diesel Exhaust
Time NY Freq Freq Freq Freq
T1 N 19 864 21 955 25 926 26 963
Y 3 136 1 45 2 74 1 37
T2 N 20 909 16 727 26 963 25 926
Y 2 91 6 273 1 37 2 74
T3 N 16 727 8 364 23 852 16 593
Y 6 273 14 636 4 148 11 407
T4 N 17 773 10 455 23 852 18 667
Y 5 227 12 545 4 148 9 333
T5 N 18 818 10 455 24 889 15 556
Y 4 182 12 545 3 111 12 444
T6 N 20 909 17 773 26 963 22 815
Y 2 91 5 227 1 37 5 185
T7 N 19 864 20 909 26 963 25 926
Y 3 136 2 91 1 37 2 74
T8 N 20 909 21 955 26 963 26 963
Y 2 91 1 45 1 37 1 37
N = Symptom severity rating of ―0 Y = Symptom severity rating gt ―0 Freq = Frequency and = Percent
Table 47d Count of Reported No Load (General) Symptoms (NY) by Sex Exposure and Time Females Males
Clean Air Diesel Exhaust Clean Air Diesel Exhaust
Time NY Freq Freq Freq Freq
T1 N 19 864 20 909 23 852 25 926
Y 3 136 2 91 4 148 2 74
T2 N 16 727 19 864 23 852 25 926
Y 6 273 3 136 4 148 2 74
T3 N 16 727 18 818 25 926 21 778
Y 6 273 4 182 2 74 6 222
T4 N 17 773 17 773 23 852 19 704
Y 5 227 5 227 4 148 8 296
T5 N 17 773 17 773 25 926 21 778
Y 5 227 5 227 2 74 6 222
T6 N 18 818 20 909 26 963 26 963
Y 4 182 2 91 1 37 1 37
T7 N 18 818 22 1000 26 963 26 963
Y 4 182 0 00 1 37 1 37
T8 N 20 909 22 1000 27 1000 25 926
Y 2 91 0 00 0 00 2 74
N = Symptom severity rating of ―0 Y = Symptom severity rating gt ―0 Freq = Frequency and = Percent
The results of the contrast analysis showed that between males and females with
respect to the effect of diesel exhaust on somatic symptom severity ratings reported after
baseline there was a statistically significant change in symptoms reported at time T5 (55
minutes after the start of diesel exhaust exposure p = 00036) and time T6 (10 minutes
118
after the end of the exposure to diesel exhaust p = 00139) with females having higher
mean severity ratings than males
For lower respiratory symptom severity ratings the contrast analysis showed that
diesel exhaust had a borderline significant effect on severity ratings at time T3 (10
minutes after the start of the exposure p =00925) and time T5 (55 minutes after the start
of diesel exhaust exposure p = 00762) between the sexes (see table 8) after controlling
for baseline ratings with females having higher mean severity ratings than males
Table 48 Contrast Between Sex (Males vs Females) Test Results Exposure
by Sex
Effect On
T2Δ
Exposure
by Sex
Effect On
T3Δ
Exposure
by Sex
Effect On
T4Δ
Exposure
by Sex
Effect On
T5Δ
Exposure
by Sex
Effect On
T6Δ
Exposure
by Sex
Effect On
T7Δ
Exposure
by Sex
Effect On
T8Δ
Variables
Exp
Chi
Square
(SE)
p-Value
Chi
Square
(SE)
p-Value
Chi
Square
(SE)
p-Value
Chi
Square
(SE)
p-Value
Chi
Square
(SE)
p-Value
Chi
Square
(SE)
p-Value
Chi
Square
(SE)
p-Value
Somatic DE vs CA 035
(102)
055
016
(112)
069
200
(081)
016
846
(089)
00036
606
(079)
00139
000
(143)
100
000
(089)
096
Lower
Respiratory
DE vs CA 132
(105)
025
283
(150)
00925
163
(124)
020
315
(102)
00762
071
(192)
040
011
(121)
074
048
(152)
049
Upper
respiratory
DE vs CA 020
(084)
066
034
(060)
056
016
(085)
069
009
(079)
076
028
(100)
060
053
(101)
046
000
(083)
099
APR DE vs CA 366
(050)
00556
301
(054)
00830
300
(046)
00831
271
(052
010
002
(056)
089
074
(064)
039
012
(078)
072
ΔT2 = Change from baseline (T1) in symptom severity reported at t asymp25 min after the start of the study session ΔT3 = Change from baseline (T1) in symptom severity reported at asymp10 min after the start of the exposure
ΔT4 = Change from baseline (T1) in symptom severity reported at asymp40 min after the start of the exposure
ΔT5 = Change from baseline (T1) in symptom severity reported at asymp55 min after the start of the exposure ΔT6 = Change from baseline (T1) in symptom severity reported at asymp10 min after the end of the exposure
ΔT7 = Change from baseline (T1) in symptom severity reported asymp6 hrs after the end of the exposure
ΔT8 = Change from baseline (T1) in symptom severity reported at asymp24 hrs after the end of the exposure APR = Acute Phase Reaction DE = Diesel Exhaust CA = Clean Air
Signt = Significant Effect of Sex (Males vs Females) = the effect of sex on the diesel exhaust induced changes in symptom severity reported
from baseline = statistically significant at p = 005 = borderline statistically significant at p = 005
Within females the contrast analysis showed that there was a significant increase
in the somatic and lower respiratory symptom severity ratings from baseline for all time
points except T7 (6 hrs after the end of the exposure) and T8 (24 hrs after the end of the
exposure) (Table 7) due to the main effect of diesel exhaust
119
Within males the contrast analysis showed that there was a significant increase in
somatic severity ratings from baseline to T2 (25 minutes after the start of the study
session) and there was a significant increase in lower respiratory severity ratings from
baseline to T4 (40 minutes after the start of diesel exhaust exposure) through to T6 (10
minutes after the end of the exposure to diesel exhaust) due to the main effect of diesel
exhaust
Table 49 Contrast Within Sex Test Results Exposure
Main
Effect On
On T2 Δ
Exposure
Main
Effect On
T3 Δ
Exposure
Main
Effect On
T4 Δ
Exposure
Main
Effect On
T5 Δ
Exposure
Main
Effect On
T6 Δ
Exposure
Main
Effect On
T7 Δ
Exposure
Main
Effect On
T8 Δ
Variables
Sex
Chi
Square
(SE)
p-Value
Chi
Square
(SE)
p-Value
Chi
Square
(SE)
p-Value
Chi
Square
(SE)
p-Value
Chi
Square
(SE)
p-Value
Chi
Square
(SE)
p-Value
Chi
Square
(SE)
p-Value
Somatic Males 578
(089)
0016
061
(093)
043
196
(060)
016
003
(074)
086
027
(063)
060
093
(011)
034
337
(060)
0066
Females 878
(051)
00003
368
(061)
0055
1324
(054)
00003
3014
(049)
lt00001
2245
(048)
lt00001
139
(090)
024
253
(066)
011
Lower
Respiratory
Males 020
(091)
066
243
(093)
012
389
(090)
00487
633
(069)
00119
345
(096)
0063
178
(094)
018
083
(093)
036
Females 996
(051)
00016
1129
(118)
00008
1572
(085)
lt00001
2237
(075)
lt00001
422
(166)
00399
126
(076)
026
250
(120)
011
Upper
respiratory
Males 000
(053)
098
706
(043)
00079
482
(052)
00281
747
(059)
00063
080
(072)
037
487
(076)
0027
038
(058)
054
Females 035
(065)
056
1308
(041)
00003
503
(067)
00249
1257
(052)
00004
293
(068)
00867
197
(067)
016
038
(060)
054
APR Males 221
(035)
014
225
(046)
013
002
(035)
090
004
(045)
085
012
(047)
073
217
(050)
014
069
(053)
041
Females 149
(035)
022
075
(027)
039
631
(030)
0012
865
(026)
00003
060
(031)
044
023
(039)
063
009
(057)
077
ΔT2 = Change from baseline (T1) in symptom severity reported at t asymp25 min after the start of the study session
ΔT3 = Change from baseline (T1) in symptom severity reported at asymp10 min after the start of the exposure
ΔT4 = Change from baseline (T1) in symptom severity reported at asymp40 min after the start of the exposure ΔT5 = Change from baseline (T1) in symptom severity reported at asymp55 min after the start of the exposure
ΔT6 = Change from baseline (T1) in symptom severity reported at asymp10 min after the end of the exposure
ΔT7 = Change from baseline (T1) in symptom severity reported asymp6 hrs after the end of the exposure ΔT8 = Change from baseline (T1) in symptom severity reported at asymp24 hrs after the end of the exposure
Signt = Significant
= statistically significant at p = 005 = borderline statistically significant at p = 005
In general looking at the mean change in the difference in somatic symptom
severity ratings after both exposures (diesel exhaust ndash clean air ratings) relative to
baseline for the remaining seven time points it was observed that females showed a
120
higher increase in somatic symptom severity ratings While males showed a mixed
response with some increased severity ratings and some decreased severity ratings during
this time (see table 10a)
Table 410a Mean Change (DE-CA) from Baseline in Symptom Severity Ratings for Males and Females
T1 ΔT2 ΔT3 ΔT4 ΔT5 ΔT6 ΔT7 ΔT8
Symptoms
Sex
Mean
(SD)
N
Mean
(SD)
N
Mean
(SD)
N
Mean
(SD)
N
Mean
(SD)
N
Mean
(SD)
N
Mean
(SD)
N
Mean
(SD)
N
Somatic Males -111
(610)
27
278
(954)
27
037
(784)
27
038
(859)
26
-130
(779)
27
-019
(580)
27
115
(637)
26
111
(467)
27
Females -273
(612)
22
295
(684)
22
205
(701)
22
477
(1085)
22
841
(1189)
22
432
(745)
22
205
(766)
22
182
(853)
22
Eye
Irritation
Males -074 (885)
27
074 (793)
27
259 (1375)
27
346 (936)
26
370 (792)
27
185 (761)
27
077 (880)
26
077 (783)
26
Females 023
(243) 22
-045
(510) 22
214
(1393) 21
476
(1134) 21
250
(401) 22
045
(263) 22
-091
(549) 22
-045
(461) 22
Anxiety Males 074
(1199)
27
-093
(1019)
27
130
(873)
27
673
(2953)
26
296
(933)
27
185
(1111)
27
-038
(1174)
26
-148
(1300)
27
Females -545 (950)
22
386 (770)
22
667 (1469)
21
762 (1231)
21
1159 (1815)
22
659 (1189)
22
386 (999)
22
386 (1234)
22
Lower
Respiratory
Males -074
(494) 27
037
(518) 27
241
(881) 27
500
(1200) 26
278
(698) 27
111
(376) 27
135
(521) 26
077
(417) 26
Females -205
(667)
22
091
(294)
22
500
(1012)
22
500
(1263)
22
705
(1469)
22
250
(632)
22
-091
(648)
22
159
(585)
22
T1 = Symptom severity reported at the start of the study session (Baseline)
ΔT2 = Change from baseline (T1) in symptom severity reported at t asymp25 min after session start to DE relative to CA
ΔT3 = Change from baseline (T1) in symptom severity reported at asymp10 min after exposure to DE relative to CA ΔT4 = Change from baseline (T1) in symptom severity reported at asymp40 min after exposure to DE relative to CA
ΔT5 = Change from baseline (T1) in symptom severity reported at asymp55 min after exposure to DE relative to CA
ΔT6 = Change from baseline (T1) in symptom severity reported at asymp10 min after exposure to DE relative to CA
ΔT7 = Change from baseline (T1) in symptom severity reported asymp6 hrs after exposure to DE relative to CA
ΔT8 = Change from baseline (T1) in symptom severity reported at asymp24 hrs after exposure to DE relative to CA
DE = Diesel exhaust CA = Clean air
121
Graph 42 Changes in Mean Somatic Symptoms Severity Ratings
For lower respiratory symptoms within males and females there was an increase
in the mean change in the difference in severity ratings after both exposures relative to
baseline with females tending to have higher severity ratings than males relative to
baseline
Graph 43 Changes in Mean Lower Respiratory Symptoms Severity Ratings
Similar observations were made for acute phase reaction and anxiety symptom
severity ratings but none of these observations were statistically significant
-4
-2
0
2
4
6
8
10
12
T1 ΔT2 ΔT3 ΔT4 ΔT5 ΔT6 ΔT7 ΔT8
Males 0 278 037 038 -13 -019 115 111
Females 0 295 205 477 841 432 205 182
Ch
ange
s in
Me
an S
eve
rity
Rat
ings
(+
-1
SE
)
Somatic Symptoms
-4
-2
0
2
4
6
8
10
12
T1 ΔT2 ΔT3 ΔT4 ΔT5 ΔT6 ΔT7 ΔT8
Males 0 037 241 5 278 111 135 077
Females 0 091 5 5 705 25 -091 159
Ch
ange
s in
Me
an S
eve
rity
Rat
ings
(+
-1
SE
)
Lower Respiratory Symptoms
122
Graph 44 Changes in Mean Acute Phase Reaction Symptoms Severity Ratings
Graph 45 Changes in Mean Anxiety Symptoms Severity Ratings
Although the no load (general) symptom severity ratings did not show a
significant exposuretimesexlsquo three way interaction effect they did show an opposite
sex difference in response to diesel exhaust compared to clean air than was observed in
somatic symptoms It was observed that males primarily tended to show a mean higher
increase in general symptom severity ratings than females after diesel exhaust exposure
-15
-10
-5
0
5
10
15
20
T1 ΔT2 ΔT3 ΔT4 ΔT5 ΔT6 ΔT7 ΔT8
Males 0 -381 -611 288 167 037 -346 -315
Females 0 431 -119 1071 1023 409 114 295
Ch
ange
s in
Me
an S
eve
rity
rat
ings
(+
-1
SE
)
Acute Phase Reaction Symptoms
-5
0
5
10
15
20
T1 ΔT2 ΔT3 ΔT4 ΔT5 ΔT6 ΔT7 ΔT8
Males 0 -093 13 673 296 185 -038 -148
Females 0 386 667 762 1159 659 386 386
Ch
ange
s in
Me
an S
eve
rity
rat
ings
(+
-1
SE
)
Anxiety Symptoms
123
compared to clean air and relative to baseline (see table 10b) although none of these
observations were statistically significant
Table 410b Mean Change (DE-CA) from Baseline in Symptom Severity Ratings for
Males and Females (continued) T1 ΔT2 ΔT3 ΔT4 ΔT5 ΔT6 ΔT7 ΔT8
Mean
(SD)
N
Mean
(SD)
N
Mean
(SD)
N
Mean
(SD)
N
Mean
(SD)
N
Mean
(SD)
N
Mean
(SD)
N
Mean
(SD)
N
Upper
Respiratory
Males -241
(1013)
27
148
(886)
27
815
(2531)
27
635
(1375)
26
944
(1613)
27
278
(994)
27
404
(1010)
26
160
(943)
25
Females -386 (1133)
22
205 (1377)
22
750 (11750
20
810 (1990)
21
955 (1752)
22
432 (1178)
22
409 (1342)
22
068 (1116)
22
Central
Nervous
System
Males -093
(417) 27
154
(704) 26
611
(1212) 27
865
(1425) 26
833
(1394) 27
259
(610) 27
173
(565) 26
056
(376) 27
Females -136
(441) 22
250
(720) 22
864
(1146) 22
1068
(1834) 22
1000
(2093) 22
205
(504) 22
023
(523) 22
091
(526) 22
Acute
Phase
Reaction
Males 315
(1693)
27
-381
(1319)
27
-611
(2169)
27
288
(1751)
26
167
(2319)
27
037
(1628)
27
-346
(1814)
26
-315
(1985)
27
Females -614
(1838) 22
431
(2876) 22
-119
(2423) 21
1071
(2293) 21
1023
(1783) 22
409
(1241) 22
114
(1825) 22
295
(2004) 22
No Load Males -074
(781)
27
019
(353)
27
204
(639)
27
423
(857)
26
296
(880)
27
056
(525)
27
096
(762)
26
111
(712)
27
Females -182
(716)
22
000
(512)
22
136
(384)
22
091
(718)
22
114
(739)
22
068
(417)
22
000
(598)
22
045
(575)
22
T1 = Symptom severity reported at the start of the study session
ΔT2 = Change from baseline (T1) in symptom severity reported at t asymp25 min after session start to DE relative to CA ΔT3 = Change from baseline (T1) in symptom severity reported at asymp10 min after exposure to DE relative to CA
ΔT4 = Change from baseline (T1) in symptom severity reported at asymp40 min after exposure to DE relative to CA
ΔT5 = Change from baseline (T1) in symptom severity reported at asymp55 min after exposure to DE relative to CA ΔT6 = Change from baseline (T1) in symptom severity reported at asymp10 min after exposure end to DE relative to CA
ΔT7 = Change from baseline (T1) in symptom severity reported asymp6 hrs after exposure to DE relative to CA
ΔT8 = Change from baseline (T1) in symptom severity reported at asymp24 hrs after exposure to DE relative to CA
DE = Diesel exhaust CA = Clean air
124
Graph 46 Changes in Mean No Load (General) Symptoms Severity Ratings
For the rest of the symptom categories there was an observed tendency of an
increase in symptom severity ratings starting at about 25 minutes after the start of the
study session to 10 minutes after the end of the exposure with negligible differences by
sex that were not statistically significant
-2
-1
0
1
2
3
4
5
6
7
T1 ΔT2 ΔT3 ΔT4 ΔT5 ΔT6 ΔT7 ΔT8
Males 0 01852 2037 42308 2963 05556 09615 11111
Females 0 0 13636 09091 11364 06818 0 04545
Ch
ange
s in
Me
an S
eve
rity
Rat
ings
(+-
1 S
E)
No Load (General) Symptoms
125
Graph 47a-h Distribution of Mean Symptom Severity ratings by Exposure Time and Sex
126
46 Discussion
The results showed that there was a significant three way (exposuretimesex)
interaction effect on the somatic and lower respiratory symptoms that were reported by
males and females after a 1hour controlled human environmental exposure to a known
concentration of diesel exhaust (300microgm3)
The results of this study are similar to what has been observed in other studies
that have found a difference in the reporting of somatic symptoms between males and
females (Kroenke and Spitzer 1998 and Barsky et al 2001) In this study we found that
during the 1 hour exposure to diesel exhaust and immediately after the 1 hour exposure to
diesel exhaust (time T2 to T6) females had statistically significant higher somatic
severity ratings when compared to clean air exposure (p le 000)
After controlling for baseline lower respiratory symptom severity ratings it was
observed that the difference in lower respiratory symptom severity ratings by exposure
(diesel exhaust ratings ndash clean air ratings) tended to be higher in females than in males
Previously in a review of gender differences in airway behavior done by Becklake and
Kauffmann they observed that shortness of breath (one of the lower respiratory
symptoms) was more frequently reported by females than males in population based
studies (1999) This observation can be attributed to gender related differences in
socialization which leads to a variation in the perception and reporting of symptoms ie
women feel more comfortable complaining about shortness of breath (Becklake and
Kauffmann 1999 and Barsky et al 2001) On the other hand Becklake and Kauffmann
also observed that in the population studies that they reviewed for a given deficit in
forced expiratory volume in 1 second (FEV1) the rates of reporting of shortness of breath
127
was consistently higher in females as opposed to males Thus proving evidence of a
possible biological (sex) difference in the reporting of shortness of breath and therefore
by inference a possible sex difference in the perception of lower respiratory symptoms in
general
This significant increase in self reported lower respiratory symptoms in females
correlates with the observed higher concentration of cytokines in the fluid of the lungs of
a subset of study females compared to a subset of study males after exposure to diesel
exhaust relative to clean air Although these observations in the fluid of the lungs were
not statistically significant they do suggest a biological basis for the significant sex
difference in self reported lower symptom severity ratings that was observed
In this study although not statistically significant females also tended to have
higher severity ratings for acute phase reaction and anxiety symptoms This could point
to a difference by gender especially since ―self reported generalized psychological
distress has been found to be greater in women (Barsky et al 2001) Despite this acute
phase reaction and anxiety symptoms do share a non-gender related biological (sex) link
in that psychological stress can modulate or initiate acute phase reactions in people
through the interaction of glucocorticoids with sex hormones on the immune system
(Sapolsky et al 2000 and Rohleder et al 2001)
An interesting observation was that although the no load (general symptoms) did
not show a statistically significant sex interaction effect (exposuretimesex) they did
show an opposite trend to what was observed with the somatic and lower respiratory
symptoms A trend of higher symptom severity ratings was observed in males after
exposure to diesel exhaust when compared to clean air and relative to baseline values
128
This trend may indicate a difference by sex in the types of self reported symptoms that
males and females will report after exposure to diesel exhaust similar to what has been
previously proposed by other studies that have looked at other symptom causing agents
but which still needs to be investigated further in relation to diesel exhaust exposure
461 Study Limitations
For the ascertainment of symptoms the main study relied on self administered
questionnaires and the data provided from them is based on subjective instead of
objective measures of health effects (Dimich-Wald et al 2006) There is also the concern
that by grouping the 37 individual symptoms into 8 categories important information
about the severity ratings of the individual symptoms by sex could be lost
Lastly since subjects were able to differentiate between clean air and diesel
exhaust exposure this might have affected the perception representation and reporting of
symptoms
47 Conclusions
In healthy volunteers acute exposure to 300microgm3 of diesel exhaust for an hour in
a controlled environmental study resulted in statistically significant changes in self
reported somatic and lower respiratory symptoms by sex relative to clean air exposure
with females having a tendency of higher mean somatic and lower respiratory symptom
severity ratings than males This suggests that females may be more sensitive than males
to the effects of diesel exhaust exposure
129
Finally although not significant there was also an observed trend of males having
higher mean no load (general) symptom severity ratings than females after the diesel
exhaust exposure compared to clean air exposure suggesting that there may also be a
variation by sex in the types of symptoms that are reported following diesel exhaust
exposure relative to clean air
130
Appendix C
Table C1a Mean Difference (DE-CA) in Symptom Severity Ratings for
Males and Female
T1 T2 T3 T4 T5 T6 T7 T8
Variables Sex
Mean
(SD)
N
Mean
(SD)
N
Mean
(SD)
N
Mean
(SD)
N
Mean
(SD)
N
Mean
(SD)
N
Mean
(SD)
N
Mean
(SD)
N
Somatic Males -111 (610)
27
167 (844)
27
-074 (583)
27
-077 (1036)
26
-241 (848)
27
-130 (742)
27
000 (316)
26
000 (392)
27
Females -273 (612)
22
023 (243)
22
-068 (821)
22
205 (812)
22
568 (1015)
22
159 (390)
22
-068 (835)
22
-091 (971)
22
Eye Irritation Males -074
(885) 27
000
(1047) 27
185
(1048) 27
269
(941) 26
296
(800) 27
111
(424) 27
000
(141) 26
-077
(306) 26
Females 023 (243)
22
023 (393)
22
238 (1310)
21
524 (1089)
21
273 (369)
22
068 (176)
22
-068 (387)
22
-023 (326)
22
Anxiety Males 074
(1199)
27
-019
(1712)
27
204
(869)
27
769
(3505)
26
370
(1405)
27
259
(1361)
27
019
(098)
26
-074
(494)
27
Females -545
(950)
22
-159
(892)
22
119
(1274)
21
310
(782)
21
614
(1511)
22
114
(533)
22
-159
(473)
22
-159
(543)
22
Lower
Respiratory
Males -074
(494)
27
-037
(553)
27
167
(920)
27
423
(1278)
26
204
(880)
27
037
(237)
27
058
(258)
26
000
(141)
26
Females -205
(667) 22
-114
(461) 22
295
(611) 22
295
(868) 22
500
(988) 22
045
(342) 22
-295
(1192) 22
-045
(554) 22
T1 = Symptom severity reported at the start of the study session
T2 = Symptom severity reported at asymp25 min after the start of the study session T3 = Symptom severity reported at asymp10 min after the start of the exposure
T4 = Symptom severity reported at asymp40 min after the start of the exposure
T5 = Symptom severity reported at asymp55 min after the start of the exposure T6 = Symptom severity reported at asymp10 min after the end of the exposure
T7 = Symptom severity reported at asymp6 hrs after the end of the exposure
T8 = Symptom severity reported at asymp24 hrs after the end of the exposure
131
Table C1b Mean Difference (DE-CA) in Symptom Severity Ratings for
Males and Females (continued) T1 T2 T3 T4 T5 T6 T7 T8
Mean
(SD)
N
Mean
(SD)
N
Mean
(SD)
N
Mean
(SD)
N
Mean
(SD)
N
Mean
(SD)
N
Mean
(SD)
N
Mean
(SD)
N
Upper
Respiratory
Males -240 (1013)
27
-093 (855)
27
574 (2209)
27
423 (1419)
26
704 (1583)
27
037 (479)
27
154 (505)
26
-160 (688)
25
Females -386
(1133)
22
-182
(1444)
22
375
(872)
20
405
(1261)
21
568
(1294)
22
045
(406)
22
023
(475)
22
-318
(1119)
22
Central
Nervous
System
Males -093
(417)
27
058
(668)
26
519
(1096)
27
769
(1380)
26
741
(1266)
27
167
(392)
27
077
(272)
26
-037
(437)
27
Females -136
(441)
22
114
(576)
22
727
(1020)
22
932
(1635)
22
864
(1774)
22
068
(320)
22
-114
(406)
22
-045
(263)
22
Acute
Phase
Reaction
Males 315
(1693) 27
-067
(1575) 27
-296
(1689) 27
615
(2036) 27
481
(2195) 27
352
(1433) 27
-096
(448) 26
000
(784) 27
Females -614 (1838)
22
-182 (3411)
22
-762 (3239)
21
571 (2175)
21
409 (1540)
22
-205 (1324)
22
-500 (1551)
22
-318 (1220)
22
No Load Males -074 (781)
27
-056 (525)
27
130 (947)
27
346 (1075)
26
222 (1059)
27
-019 (353)
27
019 (098)
26
037 (133)
27
Females -182
(716)
22
-182
(424)
22
-045
(532)
22
-091
(453)
22
-068
(623)
22
-114
(510)
22
-182
(451)
22
-136
(441)
22
T1 = Symptom severity reported at the start of the study session
T2 = Symptom severity reported at asymp25 min after the start of the study session T3 = Symptom severity reported at asymp10 min after the start of the exposure
T4 = Symptom severity reported at asymp40 min after the start of the exposure
T5 = Symptom severity reported at asymp55 min after the start of the exposure T6 = Symptom severity reported at asymp10 min after the end of the exposure
T7 = Symptom severity reported at asymp6 hrs after the end of the exposure
T8 = Symptom severity reported at asymp24 hrs after the end of the exposure
132
Graph C1andashh Line Graph of Mean Symptom Severity Ratings by Sex
133
References
Arbuckle TE 2006 Are there sex and gender differences in acute exposure to
chemicals in the same setting Environmental Research101 pg 195-204
Barsky AJ Heli MP Borus JF 2001 Somatic Symptom Reporting in Women and
Men Journal of General Internal Medicine 16 pg 266-275
Becklake MR and Kauffmann F 1999 Gender differences in airway behavior over
the human life span Thorax 54 pg 1119-1138
Carlsten C Kaufman JD Peretz A Trenga CA Sheppard L and Sullivan JH
2007 Coagulation Markers in Healthy Human Subjects Exposed to Diesel Exhaust
Thrombosis Research 120 pg 849-855
Christian MS 2001 IntroductionOverview Gender-Based Differences in
Pharmacologic and Toxicologic Responses International Journal of Toxicology 20
pg 145-148
Czerniak R Gender-Based Differences in Pharmacokinetics in Laboratory Animal
Models 2001 International Journal of Toxicology 20 pg 161-163
Da Silva JA 1995 Sex Hormones Glucocorticoids and Autuimmunity facts and
hypotheses Annals of the Rheumatic Disease 54 pg 6-16
Dimich-Warda H Campa PG and Kennedy SM 2006 Gender differences in
respiratory symptomsmdashDoes occupation matter Environmental Research 101 pg
175ndash183
Diaz-Sanchez D and Riedl M 2005 Diesel effects on human health a question of
stress American Journal of Physiology ndash Lung Cellular and Molecular Physiology
289 pg L722-L723
Diaz-Sanchez D Tsien A Casillas A Dotson AR and Saxon A 1996 Enhanced
nasal cytokine production in human beings after in vivo challenge with diesel exhaust
particles Journal of Allergy and Clinical Immunology 98 pg114-123
Diez Roux AV Auchincloss AH Astor B Barr RG Cushman M Dvonch T
Jacobs Jr DR Kaufman J Lin X and Samson P 2006 Recent Exposure to
Particulate Matter and C-reactive Protein Concentration in the Multi-Ethnic Study of
Atherosclerosis American Journal of Epidemiology 164 pg 437-448
Donaldson K Stone V Seaton A and MacNee W 2001 Ambient Particle Inhalation
and the Cardiovascular System Potential Mechanisms Environmental Health
Perspectives 109(supplement 4) pg 523-527
134
Ersntgard L Gullstrand E and Johanson G 2002 Are women more sensitive than
men to 2-propanol and m-Xylene vapours Occupational and Environmental
Medicine 59 pg 759-767
Ersntgard L Sjogren B Warholm M and Johanson G 2003 Sex differences in
toxicokinetics of inhaled solvent vapors in humans m-Xylene Toxicology and
Applied Pharmacology 193 pg 147-157
Fairweather D and Rose NR 2004 Women and Autoimmune Disease Emerging
Infectious Disease [Serial on the internet] November Available from
httpwwwcdcgovncidodEIDvol10no1104-0367htm
Faustman E and Omenn G Risk Assessment in Klaassen CD (eds) Casarett and
Doulllsquos Toxicology The Basic Science of Poisons 6th
ed New York Macmillan
2001 pg 83-104
Fortoul TI Moncada-Henandez S Saldivar-Osorio L Espejel-Maya G Mussali-
Galante P Avila-Casado MC Colin-Barenque L Hernandez-Serrato MI and
Avila-Costa MR 2005 Sex differences in bronchiolar epithelium response after the
inhalation of lead acetate (Pb) Toxicology 207 pg 323-330
Frumkin H and Thun MJ 2001 Diesel Exhaust Environmental Carcinogens 51 pg
193-198
Furuyama A Hirano S Koike E and Kobayashi T 2006 Induction of oxidative
stress and inhibition of plasminogen activator inhibitor-1 production in endothelial
cells following exposure to organic extracts of diesel exhaust particles and urban fine
particles Archives of Toxicology 80 pg 154-162
Gabay C and Kushner J 1999 Acute phase proteins and other systemic responses to
inflammation New England Journal of Medicine 340 pg 448ndash54
Gijsbers Van Wijk CMT and Kolk AM 1997 Sex Differences in Physical
Symptoms The Contribution of Symptom Perception Theory Social Science and
Medicine 45 pg 231-246
Green HG Dalton P Cowart B Shaffer G Rankin K Higgins J 1996 Evaluating
the labeled magnitude scale for measuring sensations of taste and smell Chemical
Senses 21 pg 323 -334
Gochfeld M 2007 Framework for gender differences in human and animal
toxicology Environmental Research 104 pg 4-21
Kritchevsky S Cesari M and Pahor M 2005 Inflammatory markers and
cardiovascular health in older adults Cardiovascular Research 66 pg 265ndash 275
135
Kroenke K and Spitzer RL 1998 Gender differences in the reporting of physical
and somatoform symptoms Psychosomatic Medicine 60 pg 150-155
Lamason R Zhao P Rawat R Davis A Hall JC Chae JJ Agarwal R Cohen
P Rosen A Hoffman EP and Nagaraju K 2006 Sexual dimorphism in immune
response genes as a function of puberty BMC Immunology 7 pg 2
Liang KY and Zeger LL 1986 Longitudinal Data Analysis Using Generalized Linear
Models Biometrika 73 pg 13 ndash 22
Lucking AJ Lundback M Mills NL Faratian D Barath SL Pourazar J Cassee
FR Donaldson K Boon NA Badimon JJ Sandstrom T Blomberg A and
Newby DE 2008 Diesel Exhaust Inhalation Increases Thrombus Formation In Man
European Heart Journal 29 pg 3043-3051
Messing K and Stellman JM 2006 Sex gender and womenlsquos occupational health
The importance of considering mechanism Environmental Research 101 pg 149-
162
Mills NL Tornqvist H Robinson SD Gonzalez M Darnley K MacNee W
Boon NA Donaldson K Blomberg A Sandstrom T and Newby DE 2005 Diesel
Exhaust Inhalation Causes Vascular Dysfunction and Impaired Endogenous
Fibrinolysis American Heart Association 112 pg 3930-3936
Mills NL Tornqvist H Gonzalez MC Vink E Robinson SD Soderberg S
Boon NA Donaldson K Sandstrom T Blomberg A and Newby DE 2007
Ischemic and Thrombotic Effects of Dilute Diesel-Exhaust Inhalation in Men with
Coronary Heart Disease The New England Journal of Medicine 357 pg 1075-1082
Nightingale JA Maggs R Cullinan Donnelly LE Rodgers DF Kinnersley R
Chung KF Barnes PJ Ashmore M and Newman-Taylor A 2000 Airway
Inflammation after Controlled Exposure to Diesel Exhaust Particles American
Journal of Respiratory and Critical Care Medicine 162 pg 161-166
Nordenhall C Pourazar J Blomberg A Levin J-O Sandstrom T and Adelroth E
2000 Airway inflammation following exposure to diesel exhaust a study of time
kinetics using induced sputum European Respiratory Journal 15 pg 1046-1051
Peters A Frouml hlich M Douml ring A Immervoll T Wichmann HE Hutchinson
WL Pepys MB and Koenig W 2001 Particulate Air Pollution is Associated with
an Acute Phase Response in Men Results from the MONICAndashAugsburg Study
European Heart Journal 22 pg 1198ndash1204
136
Pourazar J Mudway IS Samet JM Helleday R Blomberg A Wilson S Frew
AJ Kelly FJ and Sandstrom T 2005 Diesle Exhaust activates redox-sensitive
transcription factors and kinases in human airways American Journal of Physiology ndash
Lung Cellular and Molecular Physiology 289 pg L724-L730
Riedl M and Diaz-Sanchez D 2005 Biology of diesel exhaust effects on respiratory
function Journal of Allergy and Clinical Immunology 115 pg 221-8
Robert B Gender-Specific Aspects of Cardiovascular Disease 2005 Womenlsquos Heart
Foundation RI Medicine and Health Article
Rogers A and Davies B 2005 Diesel Particles ndash Recent Progress on an Old Issue
Annals of Occupational Hygiene 49 pg 453-456
Rohleder N Schommer NC Hellhammer DH Engel R and Kirschbaum C 2001
Sex Differences in Glucocorticoid Sensitivity of Proinflammatory Cytokine
Production After Psychosocial Stress Psychosomatic Medicine 63 pg 966-972
Salvi S Blomberg A Rudell B Kelly F Sandstrom T Holgate ST and Frew A
1999 Acute Inflammatory Responses in the Airway and Peripheral Blood After
Short-Term Exposure to Diesel Exhaust in Healthy Human Volunteers American
Journal of Respiratory and Critical Care Medicin 159 pg 702-709
Salvi S and Holgate ST 1999 Mechanisms of particulate matter toxicity Clinical
and Experimental Allergy 29 pg 1187-1194
Salvi S Nordenhall C Blomberg A Rudell B Pourazar J Kelly F Wilson S
Sandstrom T Holgate ST and Frew A 2000 Acute Exposure to Diesel Exhaust
increase IL-8 and GRO-α Production in Healthy Human Airways American Journal
of Respiratory and Critical Care Medicine 161 pg 550-557
Samet JM Dominici F Curriero FC Coursac I and Zeger SL 2000 Fine
Particulate Air Pollution and Mortality in 20 US Cities 1987-1994 The New
England Journal of Medicine 343 pg 1742-1749
Sapolsky RM Romero LM and Munck AU 2000 How Do Glucocorticoids
Influence Stress Responses Integrating Permissive Suppressive Stimulatory and
Preparative Actions Endocrine Reviews 21 pg 55-89
Saxton A and Diaz-Sanchez D 2000 Diesel exhaust as a model xenobiotic in
allergic inflammation Immunophamacology 48 pg 325-327
Schwartz J 2001 Air Pollution and Blood Markers of Cardiovascular Risk
Environmental Health Perspectives 109(supplement 3) pg 405ndash409
137
Sydbom A Bomberg A Parnia S Stenfors N Sandstrom T and Dah en SE 2001
Health Effects of Diesel Exhaust Emissions European Respiratory Journal 17 pg
733-746
The American Heritage Dictionary 1994 3rd
Edition Dell Publishing
Tornqvist H Mills NL Gonzalez M Miller MR Robinson SD Megson IL
MacNee W Donaldson K Soderberg S Newby DE Sandstrom T and Blomberg
A 2007 Persistent endothelial dysfunction following diesel exhaust inhalation in
man American Journal of Respiratory and Critical Care Medicine 176 pg 395-400
US EPA 2002 Health assessment document for diesel engine exhaust US
Environmental Protection Agency Document EPA6008-90057F
Vahter M Gochfeld M Casati B Thiruchelvam M Falk-Filippson A Kavlock R
Marafante E and Cory-Slechta D 2007 Implications of gender differences for
human health risk assessment and toxicology Environmental research 104 pg 70-84
Van Eeden SF Tan WC Suwa T Mukae H Terashima T Fujii T Qui D
Vincent R and Hogg JC 2001 Cytokines Involved in Systemic Inflammatory
Response Induced by Exposure to Particulate Matter Air Pollutants (PM10) American
Journal of Respiratory and Critical Care Medicine 164 pg 826-830
Zeka A Sullivan JR Vokonas PS Sparrow D Schwartz J 2006 Inflammatory
Markers and Particulate Air Pollution characterizing the pathway to disease
International Journal of Epidemiology 35 pg 1347ndash1354
138
Chapter 5
Analysis of Sex Differences in the Urinary Concentration of 1-
Aminopyrene after Acute Exposure to Diesel Exhaust
139
51 Abstract
52 Introduction
521 1-Nitropyrene
5211 Metabolism of 1-Nitropyrene
522 Sex Differences in Physiology
53 Materials and Methods
531 Data Collection
532 Subjects
533 Exposure Conditions and Experimental Design
534 Urine Sample Collection
535 Urine Sample Analysis
536 Creatinine Measurements
537 Exclusion of Invalid Data and calculation of Time Weighted Average
Concentrations
538 Exclusion of Baseline Values
539 Calculation of Response Measure
5310 Body Mass Index
54 Statistical Methods
55 Results
551 Aim 1
552 Aim 2
56 Discussion
561 Study Limitations
57 Conclusions
Appendix C
140
References
141
51 Abstract
Background 1-Nitropyrene is one of the primary nitro-polycyclic aromatic
hydrocarbons found in diesel exhaust Therefore it along with its metabolites
such as 1-aminopyrene are thought of as potentially good specific biomarkers for
diesel exhaust exposure Physiological differences due to sex may affect the
metabolism and excretion of 1-nitropyrene
Aims To investigate whether there are sex differences in metabolism of 1-
nitropyrene as indicated by potential variations in the urinary levels of 1-
aminopyrene excreted as a product of the nitro-reduction of 1-nitropyrene after a
controlled environmental exposure to diesel exhaust
Method In a randomized crossover study healthy human subjects were exposed
to 300microgm3 of diesel exhaust and to clean for 1 hour each in a controlled
environmental exposure chamber on two different days (ge1 week washout)
Subjects were asked to collect 24 hour spot urine samples which were then
analyzed for 1-aminopyrene using an HPLC-fluorescence Primary statistical
analysis was done using an analysis of variance
Results There was no statistically significant difference in the concentration of
urinary 1-aminopyrene post exposure to diesel exhaust relative to clean air
between males and females although females did show about a 12 mean
increase in the time weighted average concentration of 1-aminopyrene compared
to about a 0004 increase that was observed in males after exposure to diesel
exhaust relative to clean air exposure
Conclusion Although not statistically significant we observed a difference by
sex in the levels of urinary 1-aminopyrene 24 hours after acute exposure to
300microgm3 of diesel exhaust relative to clean air exposure Females tended to
secrete a higher concentration of diesel exhaust attributable 1- aminopyrene in
urine than males indicating that females may metabolize 1-nitropyrene via nitro-
reduction more actively than males
52 Introduction
Diesel exhaust is made up of a complex mixture of many chemicals including
polycyclic aromatic hydrocarbons (PAHs) and nitro-PAHs in either gaseous or particulate
form (CECBP 2008 USEPA HAD 2002) The particles are collectively called diesel
exhaust particles (DEPs) and they are the largest single source of airborne particulate
matter (PM) in many urban areas (Riedl and Diaz-Sanchez 2005) This means that for the
general population non-occupational exposure to diesel exhaust occurs frequently but
142
varies in concentration and length of exposure Relatively high ambient exposures to
diesel exhaust occur in ports freeway intersections and on school buses (CECBP 2008)
521 1-Nitropyrene
1-Nitropyrene (1-NP) is a nitro-PAH that is formed as a by-product of combustion
and is the predominant nitrated polycyclic aromatic hydrocarbon emitted in diesel engine
exhaust 1-NP is also formed as a result of gas phase radical initiated atmospheric
formation (USEPA HAD 2002) and is found in coal combustion cigarette smoke cooked
meat products wood burning gas burner and kerosene heater emissions and airplane
exhaust (WHO 2003) Despite these other sources the major route of exposure to 1-NP
is through the inhalation of complex mixtures (eg diesel exhaust) and polluted urban air
(USEPA HAD 2002) In many studies the absorption and metabolism of 1-NP has been
shown to occur rapidly with 1-NP mainly being metabolized by cytochrome P450
mediated ring oxidation and nitro reduction followed by the conjugation and excretion of
metabolites in urine and feces (Silvers et al 1994 WHO 2003)
Since 1-NP is one of the primary nitro-PAHs found in diesel exhaust and also due
to its strong association with diesel exhaust it along with its metabolites such as 1-
aminopyrene (1-APY) are thought of as potentially good specific biomarkers for DEPs
exposure (Toriba et al 2007) This is important because 1-NP has been shown to have
mutagenic properties and it is thought to be the main contributor of the direct acting
mutagenicity of DEPs It has been suggested that 1-NP in the body is mainly detoxified to
1-APY by nitro reduction (NTP 1996) but studies that have been done to date have
shown mixed results about the urinary levels of 1-APY in relation to 1-NP exposure
143
(Seidel et al 2002 and Toriba et al 2007) Still there remains the possibility that 1-APY
could be a potentially good biomarker for 1-NP exposure and thus diesel exhaust
exposure
5211 Metabolism of 1-Nitropyrene
The metabolism of 1-NP can occur via nitro-reduction or cytochrome P450 mediated ring
oxidation (Silvers et al 1997 and Chae et al 1999) The human Cytochrome P450 family
of enzymes in particular the P450 3A3 and 3A4 isomers are the predominant enzymes
involved in the oxidative metabolism of 1-NP (Silvers et al 1997 and Chae et al 1999) In
the mammalian system 1-NP is metabolized by xanthine oxidase DT-diaphorase or
aldehyde oxidase (NTP 1996)
522 Sex Differences in Physiology
Many studies to date have shown that there is a large inter-individual variation in
the excretion of nitro-PAHs and their metabolites and that this may be due to differences
in the uptake and metabolism of these compounds and also the potential influence of
confounders like age environmental tobacco smoke intake of charcoal broiled meat and
residential area (USEPA HAD 2002 Nielsen et al 1996)
Males and females differ substantially with respect to physiology and these
differences may have significant effects on the toxicity of any xenobiotic like nitro-PAHs
and thus may affect how vulnerable males and females are to the effects of a xenobiotic
and other environmental stressors (Gochfeld 2007) Specifically sex may influence the
uptake and also the type and function of metabolizing enzymes that either become
144
activated or deactivated upon exposure to nitro-PAHs This may translate into differences
in the rate of metabolism of nitro-PAHs the types and severity of toxicity and the amount
of nitro-PAHs metabolites that are excreted after exposure to diesel exhaust In drug
studies female sex has been shown to be a risk factor for clinically relevant adverse drug
reactions due to sex differences in pharmacokinetics in pharmacodynamics
immunology hormonal factors and differences in the dose (mgkg) that was administered
(Anderson 2008 Rademaker 2001)
Sex differences in the activity of the cytochrome P450 (CYP) and uridine
diphosphate glucuronosyltransferase (UGT) enzymes and renal excretion also result in
differences in clearance (Anderson 2008) Also frequent and sometimes clinically
relevant sex differences can possibly be identified for drug elimination processes and
have predominantly been linked to the sex-specific expression of the metabolic enzyme
systems eg CYP3A4 and CYP1A2 (Beierle et al 1999)
The CYP3A gene subfamily is the most abundant P450 enzyme in human liver
microsomes the level of which can vary enormously (gt10 fold) among individuals
(Casarett and Doulls 2001) They (in particular CYP3A3 and CYP3A4) seem to be the
enzymes involved in the human oxidative metabolism of 1-NP (WHO 2003) There is
evidence of females having lower activity of CYP1A2 CYP2E1 and UGT higher
activity of CYP3A4 CYP2A6 and CYP2B6 and no differences in CPY2C9 and
CYP2D6 activity (Anderson 2008) As mentioned before in the mammalian system 1-
NP is metabolized by xanthine oxidase DT-diaphorase or aldehyde oxidase (NTP 1996)
via nitro-reduction and in 1992 Relling et al showed that females had a higher activity of
xanthine oxidase than males after exposure to a low dose of caffeine Therefore there is
145
the possibility that there may be a variation by sex in the concentration of 1-NP
metabolites that are produced regardless of the metabolic pathway that is used
To summarize with regards to physiology women generally have a lower lean
body mass reduced hepatic clearance differences in activity of cytochrome P450 (CYP)
enzymes (40 increase in CYP3A4 varied decrease in CYP2D6 CYP2C19 and
CYP1A2) metabolize drugs at different rates compared with men (Rademaker 2001) and
have been shown to have a higher xanthine oxidase activity (Relling et al 1992) Other
important factors include conjugation absorption protein binding and renal elimination
which may all have some sex-based differences (Rademaker 2001)
Sex differences have also been observed in baseline characteristics as well as in
drug response which might both at least in part be the consequence of modulation by
sex hormones (Beierle et al 1999) All of these potential factors may affect the way that
males and females react physiologically to a xenobiotic like diesel exhaust thereby
influencing the rates and types of metabolism and excretion of the xenobiotic in males
and females making one group either slow intermediate or fast metabolizers (WHO
2003) of the xenobiotic thus influencing the levels and types of metabolites excreted
The aim of the present study is to investigate whether there are sex differences in
the metabolism of diesel exhaust as indicated by the potential variation in the amount of
urinary 1-APY excreted as a product of the nitro reduction of 1-NP following diesel
exhaust exposure If there are variations in the amount of urinary 1-APY excreted
following diesel exhaust exposure between males and females a second aim of the paper
is to determine if sex is a significant predictor of the amount of 1-APY that is excreted in
urine
146
53 Materials and Methods
531 Data Collection
The data used for this dissertation research are part of the datasets generated from
a study of diesel exhaust effects and a subsequent add-on study of diesel exhaust
exposure biomarkers The parent study was funded by the Department of Defense (DOD)
through a grant to the University of Medicine and Dentistry of New jersey (UMDNJ)
(Grant DAMD17-03-1-0537 Principal Investigator Dr Nancy Fiedler) and the add-on
project was funded by the Environmental Protection Agency (EPA) through a STAR
grant to UMDNJ (Grant R832097 Principal Investigator Dr Junfeng Zhang)
532 Subjects
110 healthy non-smoking men and women between the ages of 18 and 50 were
recruited from the local community in Piscataway New Jersey based on the established
study criteria 100 subjects completed the study Out of these subjects 55 subjects
consented to provide urine samples as part of the add-on study (see table 1)
Table 51 Subject Characteristics by Sex Females Males
N Min Max Mean SD N Min Max Mean SD
AGE (years) 21 19 44 2519 724 29 19 43 2497 670
Height (inches) 21 5950 6750 6325 189 29 595 75 6880 312
Weight(lb) 21 106 200 14167 3017 29 137 236 17119 2505
BMI (kgm2) 21 1908 3717 2494 552 29 2128 3435 2541 320
Respiration 20 M 14 20 1610 165 29 10 20 1593 210
Temperature oF 19M 9730 9940 9834 041 28 M 975 991 9830 043
Pulse 20 M 54 94 6850 868 29 52 86 6862 923
Log TWA 1-APY 21 -056 821 236 199 29 -330 583 191 217
Race Frequency () Frequency ()
Asian 10 (4762) 12 (4138)
Black 2 (952) 1 (345)
Hispanic 3 (1429) 6 (2069)
Other 0 (0) 1 (345)
White 6 (2857) 9 (3103)
BMI = (weightheight2) 703 M = some subjects had missing data
147
533 Exposure Conditions and Experimental Design
A randomized crossover design was used in which each subject underwent two
exposure conditions one was to diluted diesel exhaust normalized to PM10 concentration
of 300microgm3 and the other was to filtered clean ambient air of Busch campus in
Piscataway a suburban campus of Rutgers University Both exposure conditions were 1
hour in duration and took place at the Environmental and Occupational Health Sciences
Instituteslsquo (EOHSI) Controlled Environmental Facility (CEF) Each exposure condition
was presented with and without an acute psychological stressor to two groups of subjects
high and low in self reported chemical intolerance (CI) Subjects were also asked to fast
overnight the day before the study until after each exposure session and to also abstain
from any exercise
There were no significant differences in the exposure conditions for all subjects
Overall the concentration of PM10 that the subjects were exposed to was 276plusmn13microgm3
which was close to the target concentration of 300microgm3
Table 52 Mean Air Characteristics and Composition Diesel Exhaust Clean Air
PM10 (microgm3) 276 plusmn 13 6 plusmn 5 NOX (ppm) 363 plusmn 090 002 plusmn 002
CO (ppm) 379 plusmn 076 091 plusmn 021
1 Nitropyrene (ngm3) 268 plusmn 051 lt006
534 Urine Sample Collection
Subjects were asked to collect 24 hour spot urine samples beginning on the
morning of the day of exposure through to the following morning after exposure They
were provided with a cooler containing a dozen 50-ml bottles and they were instructed to
use an empty and clean bottle to collect each urine sample Each bottle had a label with
the subjectlsquos identification number and the subjects were asked to write the sample
148
collection time on the labels Along with the labels the subjects were also given a simple
timeactivity diary with which to document potential sources of nitro-PAHs within the
sampling period Upon return to the laboratory all the urine samples were stored at -40degC
and protected from light before sample analysis
535 Urine Sample Analysis
The urine samples were analyzed for 1-APY using an HPLC-fluorescence
technique that was developed and described previously by Laumbach et al 2009 Briefly
the acetylated urinary 1-APY conjugate was hydrolyzed with concentrated HCl at 80ordmC in
a shaking bath for 1 hour before extraction During the extraction the pH of the mixture
was first adjusted to 7 ndash 8 by adding about 11 ml of 10 M NaOH and a small quantity of
concentrated acetic acid The resulting solution was then centrifuged at 2500 g for 10 min
with 5 ml of dichloromethane and extracted twice The two dichloromethane extracts
were then combined in a glass tube and evaporated to near dryness using nitrogen at
room temperature The residue was rinsed from the glass tube wall and made into a final
solution of 1 ml with acetonitrile Using a 02 microm PVDF liquid filter the final solution
was filtered through into a 18 ml amber vial that was sealed with a Teflon septum for
HPLC analysis
The HPLC system used for the 1-APY analysis included a 600E system
controller a 717 auto sampler and a 2474 fluorescence detector (Waters Co Milford
MA) An Ascentis RP-Amide column (46mm x 250mm) (Supelco Co Bellefonte PA)
was used to separate analytes The mobile phase involved the use of two solutions
Solution A = 50 acetonitrile in water and Solution B = 100 acetonitrile with a linear
gradient from 100 A to 100 B in 30 min at a flow rate of 10 mlmin The injection
149
volume was 20microL The fluorescence detector was set at an excitation wavelength of 254
nm and an emission wavelength of 425 nm An external standard of 1-APY (97 purity
Aldrich Co St Louis MO) was used to generate calibration curves for quantifying 1-
APY concentrations All calibration curves had a near zero intercept and a R2 gt 099
This method had a detection limit of 002 ngml expressed as 3 times the standard
deviation of a low concentration calibration standard (N = 8) The coefficient spiked into
real urine sample (with concentration in the original urine subtracted) the method
recovery was 883
536 Creatinine Measurement
Creatinine concentrations were measured spectrophotometrically and were used to
normalize 1-APY concentrations Since subjects were asked to collect spot urine samples
the whole urine output per void was not collected and so the mass of 1-APY excreted in
urine voids could not be determined Therefore creatinine adjusted concentrations were
used in an attempt to account for differences in the dilution of the spot urine samples
537 Exclusion of Invalid Data and Calculation of Time Weighted Average
Concentrations
The total number of subjects that provided samples for the study was 55 the total
number of spot urine samples collected following diesel exhaust (DE) exposure was 373
and the total number of spot urine samples collected following clean air (CA) exposure
was 359
After excluding all invalid samples (those samples for which the creatinine levels
were out of the valid range ie lt30 and gt 300 mgdl (Barr et al 2005 ACGIH 199)) and
150
any urine samples that did not have a corresponding creatinine measurement the total
number of subjects left with valid samples was 50 (21 Females and 29 Males) leaving
249 Clean Air exposure sample measurements and 249 Diesel exhaust exposure sample
measurements
After the creatinine correction the time weighted average (TWA) of 1-APY
concentration per subject was calculated using the formula below
Source Laumbach et al 2009
Ci Exp = Time weighted average concentration after exposure j
TijExp = time that the concentration was measured for an exposure j in minutes
Cij = Concentration measured at time i for exposure j
Table 53 TWA 1-APY Concentrations for All Subjects and by Sex All Females Males
DE CA DE CA DE CA
Mean 3573 2108 3787 299 3419 3419
SD 5146 8508 5541 327 4934 11062
Max 23746 50385 21540 1213 23746 50385 Median 1702 234 1288 209 1886 296
Min 165 003 165 006 173 003
Total 50 50 21 21 29 29
1-APY = 1 ndash Aminopyrene Concentrations as presented above are in ngml
538 Exclusion of Baseline Values
There was a difference between the mean baseline 1-APY concentrations for all
subjects with subjects having a higher mean baseline 1-APY concentration prior to diesel
exhaust exposure than prior to clean air exposure (710 ngml vs 282 ngml) This trend
continued when looked at by sex with males having a higher mean baseline 1-APY
iExp
iExp
J
j
ijExp
J
j
ijExpijExp
Expi
t
Ct
C
1
1
151
concentration than females both prior to diesel exhaust exposure (751 ngml vs 649
ngml) and prior to clean air exposure (309 ngml vs 249 ngml)
Table 54 Baseline 1-APY Concentrations All Subjects Females Male
DE CA DE CA DE CA
Mean 710 282 649 249 751 309 SD 1447 430 1218 448 1603 422
Max 7457 1540 4783 1540 7457 1520
Median 060 065 037 032 134 107 Min 002 001 002 001 002 003
Total 47 43 19 19 28 24
Some subjects were missing baseline measurements Concentrations as presented above are in ngml 1-APY = 1 ndash Aminopyrene DE = Diesel Exhaust CA = Clean Air
Since every subject did not have a baseline 1-APY sample (concentration of 1-
APY measured in urine that was collected on the morning of exposure prior to the start of
exposure) all baseline 1-APY samples were excluded from the dataset Prior to their
exclusion a sensitivity analysis was done using a 2 by 2 between group analysis of
covariance (ANCOVA) to assess whether mean TWA 1-APY concentrations for diesel
exhaust and clean air were significantly different for males and females after the baseline
1-APY values were controlled for This was done to determine if the baseline 1-APY
concentrations had an effect on the amount of TWA 1-APY that was secreted by
exposure and by sex The TWA 1-APY and the baseline 1-APY values were log
transformed prior to the ANCOVA analysis due to the fact that their distributions were
right skewed
In the ANCOVA analysis the independent variables were exposure (DE CA) and
sex (males females) The dependent variable was the log transformed 24 hour TWA 1-
APY concentrations measured following exposure to diesel exhaust and clean air The
log transformed baseline values were used as a covariate in the analysis
152
Table 55a Results of the ANCOVA Sensitivity Analysis Source Type III SS Mean Square F Value p Value
Exposure type 10118 10118 3874 lt0001 SEX 397 397 152 022
Log Baseline 688 688 264 011
Exposure type x SEX 108 108 041 052
Concentrations as presented above are in ngml SS = Sum of squares 1-APY = 1 ndash Aminopyrene TWA = Time Weighted Average
Table 55b Mean and Adjusted Mean Concentrations of Baseline TWA 1-APY by Sex
Log
TWA 1-APY
N
Mean
Adjusted
Mean
Females
Clean Air 19 024 030
Diesel Exhaust 19 268 268
Males
Clean Air 24 098 095 Diesel Exhaust 28 290 288
Means adjusted for by log baseline values Concentrations as presented above are in ngml
1-APY = 1 ndash Aminopyrene TWA = Time Weighted Average
Since the significance level of the main effect of the log baseline covariate and the
exposure type by sex interaction were both greater than 005 (p = 011 and p = 052
respectively) it indicated that there was no significant relationship between the log
baseline 1-APY concentrations (covariate) and the log TWA 1-APY concentrations
(dependent variable) by exposure and by sex and therefore it was appropriate to exclude
the baseline 1-APY concentrations from the main analysis
539 Calculation of Response Measure
Urinary creatinine concentration and specific gravity are two of the accepted
methods for adjusting for dilution of a spot urine sample (Barr et al 2005) With regards
to sex it has been shown that sex plays a role in the concentration-dilution of spot urine
samples thereby influencing both the urinary concentration of creatinine and specific
gravity that are used to correct these spot samples (Carrieri et al 2001)
This means that there is the potential that the use of creatinine concentrations to
control for the effect of hydration in this study might skew the results because creatinine
concentration is influenced by muscle mass which in turn differs by sex with women
153
generally having lower lean body mass (Ernstgard et al 2003 Rademaker 2001)
Therefore in an attempt to remove the potential sex based bias of creatinine correction on
the concentrations of 1-APY secreted the ratio of the creatinine corrected TWA 1-APY
concentrations secreted after exposure to diesel exhaust (DE) and the creatinine corrected
TWA 1-APY concentrations secreted after exposure to clean air (CA) was calculated and
used as the study response measure in an attempt to cancel out the influence of the effect
of creatinine variation by sex
TWA 1-APYDETWA 1-APYCA = TWA 1-APY DECA = Relative Δ (Response measure)
Figure 51 Distribution of the TWA 1-APY DECA by Sex
TWA = Time Weighted Average
DECA = ratio of the TWA concentration of 1-Aminopyrene measured after DE exposure to the concentration of 1-Aminopyrene measures after CA exposure
Table 56 Mean TWA 1-APY DECA for All Subjects and by Sex 1-APY All Females Males
Mean 10128 19717 3184
SD 51879 79778 6710
Max 367375 367375 34150 Median 826 859 823
Min 004 057 004
Total 50 21 29
1-APY = 1 ndash Aminopyrene TWA = Time Weighted Average DECA = ratio of the TWA concentration of 1-APY measured after DE exposure
to the concentration of 1-APY measures after CA exposure
154
5310 Body Mass Index
Along the same lines another factor which also had the potential to skew the
results of the analysis was body mass index (BMI) Although it is not clear whether sex
has a causal association with BMI meaning that BMI is one mechanism by which sex
modifies health outcomes or whether BMI functions independent of sex BMI is still
known to vary by sex Therefore BMI was calculated using height and weight and was
then stratified by sex in order to evaluate the mean BMI by sex The mean BMI for
females (Mean = 2494 and SD = 552) and the mean BMI for males (Mean = 2541 and
SD = 320) were about the same for the study population so there was no need to control
for BMI in this analysis
54 Statistical Methods
Descriptive statistical analysis histograms and box plots were used to evaluate the
distribution of the variables The distribution of the response measure TWA 1-APY DECA
was right skewed and so the final variable on which all subsequent statistical analysis was
performed was log transformed (log TWA 1-APY DECA)
Table 57 Mean Log TWA 1-APY DECA 1-APY DECA All Females Males
Mean 210 236 191 SD 209 199 217
Max 821 821 583
Median 211 215 210 Min -330 -056 -330
Total 50 21 29
1-APY = 1 ndash Aminopyrene TWA = Time Weighted Average
DECA = log of the ratio of the TWA concentration of 1-APY measured after DE exposure to the concentration of 1-APY measures after CA exposure
155
Figure 52a Distribution of the Concentration of Log TWADECA by Sex
TWA = Time Weighted Average
Log DECA = log of the ratio of the TWA concentration of 1-Aminopyrene measured after
DE exposure to the concentration of 1-Aminopyrene measures after CA exposure
Figure 52b Box Plot of the Mean Concentration of Log TWA 1-APY DECA by Sex
1-APY = 1 ndash Aminopyrene TWA = Time Weighted Average
Log DECA = ratio of the TWA concentration of 1-Aminopyrene measured after DE exposure to the concentration of 1-Aminopyrene measures after CA exposure
Three one sample t-tests were done to confirm the main effect of diesel exhaust
exposure on the concentration of log TWA 1-APY DECA for all subjects (t-value = 710
156
df = 49 p lt 00001) within females (t-value = 544 df = 20 p lt 00001) and also within
males (t-value = 473 df = 28 p lt 00001) relative to clean air exposure
To address the first aim of the paper a analysis of variance (ANOVA) was
performed to determine if there was a significant difference in log TWA 1-APY DECA
concentrations between sex groups (male females) As mentioned before since some
subjects were also exposed to stress (a potential confounder) stress (stress no stress) was
initially included in the model to analyze the sexstresslsquo interaction The interaction was
not significant so stress was excluded and the final model that was used contained sex as
the independent classification variable and log TWA 1-APY DECA as the dependent
variable
To address the second aim of the paper a backward regression analysis was done
to determine if sex was the greatest predictor of log TWA 1-APY DECA excreted in urine
Based on similar studies that have been done so far age body mass index (BMI) pulse
respiration temperature and race were included as potential independent predictors along
with sex into the initial regression model with log TWA 1-APY DECA as the dependent
variable At each stage of the subsequent analysis the independent predictors that showed
the least contribution to the model were excluded from the model Leaving a final model
that contained only those independent predictors that were significant at the 010 level
For all tests where appropriate the variables were log transformed prior to analysis in
an attempt to give them a more normal distribution
All statistical analysis for this paper were done using SAS software Version 91
of the SAS System for Windows (SAS Institute Inc Cary NC USA) and SPSS software
157
Version 170 (SPSS inc Chicago IL) Also some graphs were created using Microsoft
Excel 2007 P-values less than or equal to 005 were considered to be significant
55 Results
551 Aim 1 Are there sex differences in urinary levels of 1-aminopyrene (Log TWA
1-APY DECA) post exposure to diesel exhaust
The ANOVA analysis showed no statistically significant difference (F value =
058 df = 1 48 p = 0452) between the mean log TWA 1-APY DECA concentrations for
females (236) and the mean log TWA 1-APY DECA concentrations for males (191)
Table 58 ANOVA Results
Source
Type III Sum of
Squares Df Mean Square F p-Value
Partial Eta
Squared
Corrected Model 254a 1 254 058 045 001
Intercept 22238 1 22238 5044 000 051
SEX 254 1 254 058 0452 001
Error 21162 48 441
Total 43464 50
Corrected Total 21416 49 a R Squared = 012 (Adjusted R Squared = -009)
Although not significant there was a sex difference in the mean TWA 1-APY
concentrations that were observed after exposure to diesel exhaust when compared to the
mean TWA 1-APY concentrations that were observed after exposure to clean air With
females showing about a 12 overall mean increase in TWA 1-APY excretion following
diesel exhaust exposure relative to clean air while males showed a very slight overall
mean increase in TWA 1-APY excretion of about 0004 following diesel exhaust
exposure relative to clean air
158
Figure 53 Mean TWA 1-APY Concentrations Secreted by Exposure and by Sex
159
552 Aim 2 Can sex predict urinary levels of 1-aminopyrene (Log TWA 1-APY
DECA) post exposure to diesel exhaust
At the 010 significance level none of the proposed predictor variables were
retained in the final regression model indicating that none of them (including sex) were
significant independent predictors of log TWA 1-APY DECA
Table 59 Summary of Backward Elimination Regression of TWA 1-APY DECA
Step
Variable
Removed
of Variables in
Model
Partial
R-Square
Model
R-Square
C(p)
F value
p Value
1 Age 6 000 015 614 014 071
2 Pulse 5 001 015 448 035 056
3 Sex 4 002 013 333 088 035
4 Respiration 3 002 011 233 105 031
5 Temperature 2 004 007 208 182 018
6 BMI 1 003 003 167 162 021
7 Race 0 003 000 124 158 022
56 Discussion
The most striking result of this study was the sex difference in the observed
concentrations of TWA 1-APY measured in urine after exposure to diesel exhaust
relative to clean air even though these observed differences were not statistically
significant This lack of significance between the sex groups may be due to the small
sample size of the two groups Most studies that have been done so far looking at urinary
levels of 1-APY in humans have been occupational exposure studies and these studies did
not look at sex differences as we did in this study so there is nothing to compare our
current findings to
Previously Ernstgard et al in 2003 looked at sex differences in the toxicokinetics
of m-Xylene under controlled environmental conditions and they found that overall males
had a significantly higher cumulative excretion of m-methyhippuric acid in urine (p =
0005) and that this was consistent with their higher net uptake of m-xylene They
concluded that the results indicated slight differences between women and men which
160
were consistent with anatomical sex differences and thus body size and body composition
(physical constitution) seemed to be more important determinants than sex in the
toxicokinetics of m-xylene
In this study we found opposite results with females showing about a 12 overall
mean increase in TWA 1-APY excretion following diesel exhaust exposure while males
showed a very slight overall mean increase of about 0004 (see Figure 3) Although
none of these observations were statistically significant they do highlight a trend of a sex
difference in the excretion of TWA 1-APY and indicate the possibility of an underlying
mechanism that may influence the metabolism of 1-nitropyrene by sex and not
anatomical differences If this trend that was observed by sex was due to anatomical
differences and males did indeed inhale a higher amount of DEPs than females then
based on the previous study by Ernstgard et al we would expect to see the opposite of
what we found with males excreting a larger amount of TWA 1-APY in urine than
females after exposure to diesel exhaust which was not the case in this study
The metabolism of 1-NP can occur via nitro-reduction or cytochrome P450
mediated ring oxidation (Silvers et al 1997 and Chae et al 1999) 1-APY is one of the
major nitro-reduction metabolites of 1-NP so the observed differences in the urinary
concentrations of 1-APY after diesel exhaust exposure between males and females could
indicate that females may metabolize 1-NP via nitro-reduction more actively than in
males where the oxidative metabolic pathways may be more active Since the urinary
concentration of the oxidative metabolites of 1-NP were not measured in this study it is
hard to definitively hypothesize if this is the case
161
561 Study Limitations
This possible trend needs to be studied with larger balanced populations
especially since the sample size used for this study was small and unbalanced A power
analysis using the observed mean and standard deviations of this study indicates that with
the study sample size (21 for females and 29 for males) the likelihood to detect a 5 sex
difference in urinary 1-aminopyrene is 012 This means that at the observed effect size
(022) a total sample size of 514 subjects will be needed to achieve an acceptable power
of 070 to detect sex differences in urinary 1-aminopyrene excretion
Also since creatinine excretion is influenced by muscle mass (Masi et al 2004) a
different method for correcting for dilution of the urine samples should be used instead of
creatinine when looking at sex differences because muscle mass is also influenced by sex
and thus the use of creatinine correction in such a study could potentially lead to the
skewing of the data
In addition a potential source of error that was not investigated was the potential
additional exposure of subjects to DEPs or 1-nitropyrene outside of the exposure chamber
during their diverse daily activities This might be a potential source of error as indicated
by both the baseline pre-exposure levels of 1-APY and also the within subject variability
in the 1-AP secreted after exposure to diesel exhaust and clean air
Lastly there is the possibility that the length and intensity of the study exposure
was not adequate enough to produce statistically significant changes
162
57 Conclusions
Although not statistically significant the results of this study showed a trend of a
difference by sex in the metabolism of 1-NP following acute exposure to diesel exhaust
relative to clean air as indicated by differences in the urinary concentrations of TWA 1-
APY between males and females after exposure to diesel exhaust relative to clean air
Females tended to secrete a higher concentration of TWA 1-APY after diesel exhaust
exposure relative to clean air exposure than males This observation was not statistically
significant however the results suggest that females may metabolize 1-nitropyrene via
nitro-reduction more actively than males
163
Appendix D
Table D1 One Sample t-test results of Log TWA 1-APY by Stress for All Subjects and also by Sex
Log TWA 1-APY DECA Mean SE t Value p-Value
All -004 060 -007 095
F -109 091 -119 024
M 045 083 054 059
Figure D1 Profile Plot of Log TWA 1-APY by Stress for All Subjects and also by Sex
Sex Stress Mean SE
F N 200 056
Y 309 080
M N 217 061
Y 172 051
164
References
American Conference of Government Industrial Hygienists Threshold Limit
Values for Chemical Substances and Physical Agents and Biological Exposure
Indices Cincinnati American Conference of Government Industrial Hygienists
1999
Anderson GD 2008 Chapter 1 Gender Differences in Pharmacological Response
International Review of Neurobiology 83 pg 1-10
Barr DB Wilder LC Caudill SP Gonzalez AJ Needham LL and Pirkle JL
2005 Urinary Creatinine Concentrations in the US Population Implications for
Urinary Biologic Monitoring Measurements Environmental Health Perspectives
113 pg 192-200
Beierle I Meibohm B and Derendorf H 1999 Gender Differences in
Pharmacokinetics and Pharmacodynamics International Journal of Clinical
Pharmacology and Therapeutics 37 pg 529-547
California Environmental Protection Agency Office of Environmental Health
Hazard Assessment Air Toxicology and Epidemiology Section Part B Health Risk
Assessment for Diesel Exhaust
Carrieri M Trevisan A and Battista GB 2001 Adjustment to concentration-
dilution of spot urine samples correlation between specific gravity and Creatinine
International Archives of Occupational and Environmental Health 74 pg 63 ndash pg
67
Casarett and Doulllsquos 2001 Toxicology The Basic Science of Poisons 6th
Edition
New York McGraw-Hill pg 159-194
Chae YH Thomas T Guengerich P Fu PP and El-Bayoumy K 1999
Comparative Metabolism of 1- 2- and 4-Nitropyrene by Human Hepatic and
Pulmonary Microsomes Cancer Research 59 pg 1473-1480
Ersntgard L Sjogren B Warholm M and Johanson G 2003 Sex differences in
toxicokinetics of inhaled solvent vapors in humans 1 m-Xylene Toxicology and
Applied Pharmacology 193 pg 147-157
Faul F and Erdfelder E 1992 GPower A priori Post-hoc and Compromise Power
Analysis for MS DOS [Computer Program] Bonn FRG Bonn University
Department of Psychology
Graphpad 2007
Gochfeld M 2007 Framework for Gender Differences in Human and Animal
Toxicology Environmental Research 104 pg 4-21
165
Laumbach R Tong J Zhang L Ohman-Strickland P Stern A Fiedler N Kipen
H Kelly-McNeil K Lioy P and Zhang J 2009 Quantification of 1-Aminopyrene
in Human Urine After a Controlled Exposure to Diesel Exhaust Journal of
Environmental Monitoring 11 pg 153-159
Masi CM Rickett EM Hawkley LC and Cacioppo JT 2004 Gender
Differences in Urinary Stress Hormones The population-based Chicago Health
Aging and Social Relations Study Journal of Applied Physiology 97 pg 941-947
Meeting of the California Environmental Contaminant Biomonitoring Program
(CECBP) Scientific Guidance Panel (SGP) 2008 Diesel Exhaust
National Toxicology Program Toxicity Report Series Number 34 1-Nitropyrene
Administered by Inhalation to F344N Rats NIH Publication 96-3383 1996
Nermell B Lindberg AL Rahman M Berglund M Persson LA Arifeen SE
and Vahter M 2008 Urinary Arsenic Concentration Adjustment Factors and
Malnutrition Environmental Research 106 pg 212-218
Nielsen PS Andreassen A Farmer PB Ovrebo S and Autrup H 1996
Biomonitoring of Diesel Exhaust-Exposed Workers DNA and Hemoglobin
Adducts and Urinary 1-Hydroxypyrene as Markers of Exposure Toxicology
Letters 86 pg 27-37
Rademaker M 2001 Do Women Have More Adverse Drug Reactions American
Journal of Clinical Dermatology 2 pg 349-351
Relling MV Lin JS Ayers GD and Evans WE 1992 Racial and gender differences
in N-acetyltransferase xanthine oxidase and CYP1A2 activities Clinical
Pharmacology and Therapeutics 52 pg 643 ndash 58
Riedl M and Diaz-Sanchez D 2005 Biology of diesel exhaust effects on
respiratory function Journal of Allergy and Clinical Immunology 115 pg 221-8
Saito K Kamataki T and Kato R 1984 Participation of Cytochrome P-450 in
Reductive Metabolism of 1-Nitropyrene by Rat Liver Microsomes Cancer
Research 44 pg 3169-3173
Silvers KJ Eddy EP McCoy EC Rosenkranz HS and Howard PC 1994
Pathways for the Mutagenesis of 1-Nitropyrene and Dinitropyrenes in the Human
Hepatoma Cell Line HepG2 Environmental Health Perspectives 102 pg 195-200
Silvers KJ Couch LH Rorke EA and Howard PC 1997 Role of nitroreductases but
not cytochromes P450 in the metabolic activation of 1-nitropyrene in the HepG2
human hepatoblastoma cell line Biochemical Pharmacology 54 pg 927 ndash 936
166
Toriba A Kitaoka H Dills RL Mizukami S Tanabe K Takeuchi N Ueno M
Kameda T Tang N Hayakawa k and Simpson CD 2007 Identification and
Quantification of 1-Nitropyrene Metabolites in Human Urine as a Proposed
Biomarker for Exposure to Diesel Exhaust Chemical Research in Toxicology 20
pg 99-1007
US Environmental Protection Agency (EPA) (2002) Health assessment document
for diesel engine exhaust Prepared by the National Center for Environmental
Assessment Washington DC for the Office of Transportation and Air Quality
EPA6008-90057F Available from National Technical Information Service
Springfield VA PB2002-107661 and lthttpwwwepagovnceagt
World Health Organization (WHO) 2003 Environmental Health Criteria 229
Selected Nitro- And Nitrooxy-Polycyclic Aromatic Hydrocarbons
167
Chapter 6
Summary Implications and Future Research Directions
168
61 Summary of Results
611 Local Immune and Inflammatory Responses
612 Systemic and acute Phase Reactions
613 Self Reported Symptoms
614 Metabolism of 1-Nitropyrene
615 Integration of Study Results
62 Implications
63 Future Research Directions
64 Uncertainties
169
61 Summary of Results
The findings from this study on sex differences in response to acute exposure to
300microgm3 of diesel exhaust in a controlled environment can be summarized as follows
611 Local Airway Immune and Inflammatory Responses
In nasal lavage significant sex differences were observed in tumor necrosis factor
ndash α concentrations with males having a mean higher concentration than females
twenty four hours after diesel exhaust exposure relative to clean air Although not
significant males also tended to have higher mean concentrations of other upper
airway inflammatory markers than females twenty four hours after diesel exhaust
exposure relative to clean air
In sputum it was observed that females tended to have mean higher
concentrations of lower airway inflammatory markers eg tumor necrosis factor ndash
α and interleukin 6 than males six hours after exposure to diesel exhaust relative
to clean air None of these observations were statistically significant
The observed differences in the sites of the suggested inflammatory response
between males and females could indicate that males are more sensitive to the
effects of the fine particles of diesel exhaust which tend to deposit in the upper
airways while females are more sensitive to the effects of the ultra fine particles
of diesel exhaust which tend to deposit in the lungs
612 Systemic and Acute Phase Reactions
There was a statistically significant effect of sex on platelet count Six hours after
exposure to diesel exhaust there was a statistically significant difference in
170
platelet count levels between males and females with males showing a mean
decrease in platelet count following exposure to diesel exhaust relative to clean
air after subtracting baseline counts compared to an observed mean increase in
platelet count in females
Within males twenty four hours after exposure to diesel exhaust there was a
statistically significant mean decrease in platelet count relative to clean air
The rest of the systemic and acute phase response markers showed a mixed
response trend with no clear cut significant sex difference
613 Self reported Symptoms
There was a statistically significant effect of sex on self reported somatic and
lower respiratory symptoms severity ratings with females tending to have higher
mean severity ratings than males after exposure to diesel exhaust relative to clean
air after subtracting baseline severity ratings
Although not statistically significant mean acute phase reaction and anxiety
symptoms severity ratings tended to be higher in females than in males following
exposure to diesel exhaust relative to clean air after subtracting baseline severity
ratings
General symptoms were observed to show an opposite trend with males tending to
have higher mean symptom severity ratings than females following exposure to
diesel exhaust relative to clean air after subtracting baseline severity ratings This
observation was not statistically significant
171
614 Metabolism of 1-Nitropyrene
Sex differences were observed in the time weighted average urinary concentration
of 1-aminopyrene following exposure to diesel exhaust relative to clean air
Females had a higher mean increase in the time weighted average urinary
concentration of 1-aminopyrene than males However this observed difference
was not statistically significant
Despite the above observation using a backward regression analysis model sex
did not appear to be a significant predictor of the time weighted average urinary
concentration of 1-aminopyrene
615 Integration of Study Results
Overall the observations of this study were in the direction of the study
hypothesis with females appearing to be more sensitive to the effect of inhaled diesel
exhaust (ultra fine) particles than males as hypothesized Upon exposure to diesel exhaust
females had a stronger inflammatory response in the lower airway (as suggested by the
observed cytokine concentrations in sputum which were not statistically significant) This
was accompanied by a stronger systemic inflammatory response in females (as indicated
by the significant sex difference in platelet counts at 6 hours) and a reporting of higher
symptom severity ratings by females (as indicated by the significant sex difference in
somatic and lower respiratory symptom severity ratings)
Also as hypothesized there was an observed difference by sex in the
concentration of 1-aminopyrene in urine with females tending to secrete more 1-
aminopyrene in urine than males Although this observation was not statistically
172
significant it does suggest that the nitro-reduction metabolic pathway is may be more
active in females than in males
Contrary to the study hypothesis males had a stronger inflammatory response in
the upper airway (as indicated by the significant increase in TNF-α concentrations in the
nasal lavage of males compared to a decrease in females) This could highlight the fact
that males may be more sensitive to the effects of inhaled diesel exhaust (fine) particles
in the upper airway
62 Implications
Although not all the sex differences observed in this study were statistically
significant they do have important research and clinical implications
The study observations suggest that there may be a sex difference in the
toxicokinetics of diesel exhaust This means that for a similar exposure event the
difference in the internal physiology of females and males due to sex could cause a
difference in the toxicological profile and effect of diesel exhaust ultimately affecting
which symptoms appear or fail to appear
This potential sex driven difference in the toxicokinetics of diesel exhaust was
highlighted by the following significant study findings
The fact that TNF-α concentrations in nasal lavage and platelet counts in blood
were significantly different between males and females
The fact that somatic and lower respiratory symptoms were significantly different
between males and females
173
The research implications of this potential sex driven difference in the
toxicokinetics of diesel exhaust include the following areas
Subject Selection ndash Depending on the subject composition by sex in an
experimental study looking at diesel exhaust inducible physiological effects the
results have the potential to be underestimated or overestimated if this sex driven
difference in the toxicokinetics diesel exhaust holds true
Diesel Exhaust Composition ndash Variations in the particle size composition of
diesel exhaust used in studies may lead to differences in the observed effects due
to the suggested sensitivity of males to fine particles and females to ultra fine
particles of diesel exhaust
Biomarkers ndash If there is a difference by sex in the metabolic pathways used to
metabolize 1-nitropyrene then this could lead to variations in the urinary
concentration of 1-nitropyrene metabolites and so this has to be taken into
consideration when trying to select an appropriate biomarker of exposure to diesel
exhaust based on 1-nitropyrene metabolites
Health Assessment Tools ndash With respect to self reported health symptoms since
there may be a sex difference in the types and severity of symptoms reported after
diesel exhaust exposure which may be linked to the proposed sex driven
difference in the toxicokinetics of diesel exhaust it is important to consider sex
when planning to use self reported symptom questionnaires as a data collection
tool in the analysis of diesel exhaust attributable health effects
174
Overall regarding research the observations from this study provides further support for
not just controlling for sex as has been historically done in environmental exposure
studies but actually including sex as part of the analysis
The clinical implication of the observed tendency of females in this study to
generally report higher symptom severity ratings than males after a controlled exposure
to the same external concentrations of diesel exhaust could indicate that females may be
more physiologically sensitive to diesel exhaust exposure and thus females may be more
susceptible to diesel exhaust exposure
Along those lines the public health implications of the females potentially being
more physiologically sensitive to diesel exhaust exposure include the following areas
Risk Assessment ndash If this hypothesis holds true then female as a whole (not just
pregnant women) may be another sensitive population that has to be considered
when risk assessments of environmental pollutants like diesel exhaust are done
especially with regards to occupational settings and exposure
Policy Measures ndash Also the standard inter-individual uncertainty factor of 10
used to come up with acceptable exposure levels of environmental air pollutants
like diesel exhaust may not be protective enough if females really are more
sensitive than males This means that an additional uncertainty factor may need to
be used but more data is needed which would provide more evidence in support of
this potential sex difference as well as provide more information about the
potential magnitude of variation in the response of females compared to males
These data are needed for the proper evaluation of whether the current uncertainty
factors that are used are adequate
175
63 Future Research Directions
More studies should be done using larger and balanced sample sizes to try to
further elucidate the possible sex differences in response to diesel exhaust exposure that
was suggested by this study
Further research on the pro-inflammatory nature of diesel exhaust should take into
account the possible sex difference in the sensitivity and toxicokinetics of diesel
exhaust during study design
Also other possible non-study related environmental exposures to diesel exhaust
should be controlled for if feasible in order to prevent the potential confounding
of results
Studies should be done to help clarify the potential mechanism involved in the
diesel exhaust attributable reduction in platelet count that was observed in males
in this study versus an observed increase in females
Studies should be done to further evaluate the sex difference in somatic and lower
respiratory symptoms that were seen in this study to see how the individual
symptoms that make up the two symptom categories (somatic and lower
respiratory) vary between males and females
Studies should also be done to see if these self reported somatic and lower
respiratory health symptom cans be correlated with other objective physiological
measures of diesel exhaust induced health effects
Lastly a study should be done to look at the concentrations of the major
metabolites of oxidation and reduction of diesel exhaust in order to ascertain
whether there are sex differences in the concentration of metabolites based on the
176
metabolic pathway used This will help to better understand if there is a difference
by sex in the metabolic pathways that are activated upon diesel exhaust exposure
and if these are correlated with sex linked genetic polymorphisms This could
possibly have important ramifications for the selection of biomarkers of exposure
to diesel exhaust
64 Uncertainties
There are some uncertainties regarding the study design and the mechanism of
diesel exhaust toxicity that has to be kept in mind when reviewing and interpreting the
results and observations of this study These include the following
Since the study subjects consisted of volunteers there is the possibility that only
those people who were not bothered by diesel exhaust participated in the study If
true this would introduce a possible selection bias into the study and might
account for the greater number of males in the study than females (64 versus 36
respectively) especially if females are more sensitive to effects of diesel exhaust
and so are not as willing to volunteer for such studies Therefore the results of the
study may be different if conducted in a different population
The composition of diesel exhaust may not be similar to those used in other
studies Therefore this has to be considered when comparing the effect seen in this
study to those seen in other studies
Despite all the studies that have been done so far there is still a general lack of
consensus about the underlying mechanism by which diesel exhaust causes the
health effects that have been observed Although this study is based on the
hypothesis of diesel exhaust induced inflammation related health effects there is
177
also the possibility that the observed health effects could be due to the direct
systemic effect of translocated diesel exhaust particles which has also been
hypothesized as a potential mechanism of diesel exhaust toxicity
The effects of diesel exhaust could be additive or synergistic depending on
whether its exposure is simultaneous with other air pollutants (USEPA HAD
2002)
The toxicity of diesel exhaust is not only dependent on individual physiology but
also on the individual internal exposure which is a function of both the variable
concentration of diesel exhaust in the environment and the individual breathing
and particle retention patterns (USEPA HAD 2002)
Lastly since this is an exploratory study we chose not to correct for multiple
comparisons but this is still a potential issue and so the results from this study
should be interpreted with caution
178
Curriculum Vitae
Chizoba U Nwankwo
EDUCATION
2005 ndash 2010 University of Medicine and Dentistry of New Jersey School of
Public Health Piscataway NJ
PhD in Public Health
2002 ndash 2004 University of Medicine and Dentistry of New Jersey School of
Public Health Piscataway NJ
MPH in Public Health
2000 ndash 2002 Rutgers University Newark NJ
MS in Biology
1995 ndash 1999 Rutgers University New Brunswick NJ
BA Biology
EXPERIENCE
2006 ndash 2009 University of Medicine and Dentistry of New Jersey Piscataway NJ
Research Teaching Assistant
2005 ndash 2006 GlaxoSmithKline Parsippany NJ
Asset Manager Analyst
2002 ndash 2005 GlaxoSmithKline Parsippany NJ
Data Management Coordinator
2001 ndash 2002 GlaxoSmithKline Parsippany NJ
Consultant Data Entry Manager
2000 ndash 2001 GlaxoSmithKline Parsippany NJ
Consultant Clinical Data Associate