by muhammad zul fayyadh bin azizo rahman · uv-visible metabolomics approach for the determination...
TRANSCRIPT

i
UV-VISIBLE METABOLOMICS APPROACH FOR THE DETERMINATION
OF SELECTED ADULTERANTS IN CLAIMED PREMIXED COFFEE.
By
MUHAMMAD ZUL FAYYADH BIN AZIZO RAHMAN
Thesis submitted in partial fulfilment of the requirements for Master of Sciences
(Health Toxicology)
2015

ii
ACKNOWLEDGEMENTS
Bismillahirrahmanirrahim,
Alhamdulillah. First of all, I am grateful to Allah for the strengths and His blessing in
completing this thesis entitled “UV-Vis metabolomics approach for the determination of
selected adulterants in claimed premixed coffee”. I would like to express my deepest
appreciation to Dr. Lim Vuanghao, for his supervision, constructive comments and constant
support throughout the laboratory work and thesis writing that have contributed to the
success of this research. Special appreciation also goes to my family for their abiding love
and supports.
Deepest thanks and appreciation to all laboratory staffs especially those in
Integrative Medicine cluster for their expertise guidance and moral support from the
beginning till the end of this research. In addition, thanks to my friends for their advice and
moral support.
Last but not least, my deepest gratitude to Advanced Medical and Dental Institute,
Universiti Sains Malaysia (USM), the place where I conducted my research and for the
sponsorship given to me.
________________
Muhammad Zul Fayyadh Bin Azizo Rahman

iii
ABSTRACT
Adulterated premixed coffees have becoming an issue in Malaysia lately and has
caught the eye of authorities due to death reports related to these products. The major cause
of this issue reported that these premixed coffee passed the food inspection test and
eventually released to the market for public. The coffee was claimed to be spiked with
several sexual enhancers like sildenafil, tadalafil and vardenafill which are common drugs
for treating erectile dysfunction. Metabolomics approach using UV-Vis spectroscopy was
developed to detect the selected sexual enhancer drugs in the coffee commercial by
employing SIMCA-P software version 13.0. Seven brands of coffee samples were
purchased from local supermarket, 30 sachet each was tested totaling to 210 sample. Each
sample were named H, J, G, W, N, T and K respectively. Three multivariate models were
generated namely PCA, OPLS-DA and PLS-DA. OPLS-DA was chosen as the best model
for overall results as it has minimal discriminate. Sildenafil, tadalafil and vardenafil were
detected sample in H, vardenafil in brand J and none in sample G, W, N, T and K. The UV-
Vis spectroscopy method had proven to be reliable and efficient in the determination of the
selected drugs, as well as in saving time and cost.

iv
ABSTRAK
Kopi pracampuran yang dicemari telah menjadi isu di Malaysia sejak kebelakangan
ini dan telah menarik perhatian pihak berkuasa akan kerana laporan kematian yang
berkaitan dengan produk-produk ini. Puncanya adalah kerana kopi ini melepasi
pemeriksaan pemakanaan dan dipasarkan kepada awam secara berleluasa. Kopi ini telah
didakwa bercampur dengan beberapa perangsang seks seperti sildenafil, tadalafil dan
vardenafill adalah ubat yang sama untuk merawat mati pucuk. Kaedah metabolomics
menggunakan UV-Vis spektroskopi diguna pakai untuk mengesan dadah yang disyaki
dalam kopi dengan menggunakan perisian SIMCA-P versi 13.0. Tujuh jenama kopi
diperoleh secara komersial, 30 bungkus setiap satu diuji yang berjumlah 210 sampel. Setiap
jenama masing-masing dinamakan sebagai H, J, G, W, N, T dan K. Tiga model multivariat
telah dihasilkan iaitu PCA, OPLS-DA dan PLS-DA. OPLS-DA diambil sebagai modal
yang terbaik untuk hasil keseluruhan kerana ia mempunyai diskriminasi yang kurang.
Sildenafil, tadalafil dan vardenafil hadir dikesan di dalam sample dalam H, vardenafil di
dalam sample J dan tiada dalam sample G, W, N, T dan K. Kaedah UV-Vis spektroskopi
telah terbukti akan keupayaan dan cekap dalam pengesanan dan juga dalam penjimatkan
masa dan kos.

v
TABLE OF CONTENTS
CHAPTER Page
ACKNOWLEDGEMENT ii
ABSTRACT iii
ABSTRAK iv
TABLE OF CONTENTS v
LIST OF FIGURES viii
LIST OF ABBREVIATIONS xi
LIST OF SYMBOLS xii
LIST OF APPENDICES xiii
CHAPTER 1 INTRODUCTION 1
1.1 Objectives 4
1.2 Hypothesis 4
CHAPTER 2 LITERATURE REVIEW
2.1 Coffee 5
2.2 Sildenafil 9
2.3 Tadalafil 11
2.4 Vardenafil 13
2.5 UV-Visible Spectroscopy 14
2.6 Chemometrics 16
CHAPTER 3 METHODOLOGY

vi
3.1 Materials and method 19
3.2 Sample Preparation 19
3.3 UV-Vis 19
3.4 Multivariate Data Analysis 20
CHAPTER 4 RESULTS AND DISCUSSIONS 21
4.1 PCA Model 24
4.1.1 Summary of Fit 24
4.1.2 X/Y Overview 25
4.1.3 DModX line plot 26
4.1.4 Hotelling's T2 Range 26
4.1.5 Score Scatter Plot 27
4.1.6 Biplot 28
4.2 OPLS-DA Model 31
4.2.1 Summary of Fit 31
4.2.2 X/Y Overview 32
4.2.3 DmodX line plot 32
4.2.4 Hotelling's T2 Range 33
4.2.5 VIP value 34
4.2.6 Score Scatter Plot 35
4.2.7 Loading column and scatter plot 36

vii
4.2.8 Biplot 38
4.3 PLS-DA Model 40
4.3.1 Summary of Fit 40
4.3.2 X/Y overview 41
4.3.3 DmodX line plot 41
4.3.4 Hotelling's T2 Range 42
4.3.5 VIP Value 43
4.3.6 Score scatter plot 44
4.3.7 Loading column and scatter plot 46
4.3.8 Permutation 47
4.3.9 Biplot 48
4.4 Overall Discussion 50
CHAPTER 5 CONCLUSIONS
5.1 Study conclusion 52
5.2 Future planning/studies 52
5.3 Limitation and recommendation 53
REFERENCES 54
APPENDIX 58

viii
LIST OF FIGURES
FIGURE
NO.
TITLE PAGE
2.1 Sildenafil molecular structure. 10
2.2 Tadalafil molecular structure. 12
2.3 Vardenafil molecular structure. 14
2.4 Coordinates formed by the PCA , and samples may be defined by the
PC 1, PC 2 or PC 3 besides the x, y and z normally used. PC 3 is
considered a noise in the data.
18
4.1 4 PCA score scatter plot models with different types of X axis
ranging from a) t[2] , b) t[1] , c) t [3] , d) t[4].
24
4.2 The summary of fit for PCA where Q² does not exceed R². 24
4.3 X/Y overview of the PCA. For PCA model the X/Y overview is in
the form of an overall data for each and every sample done and the
components of each substances used to be identify is readily inserted
in the table provided before interpretation.
25
4.4 PCA of DModX line plot showing the outliers of each model. 26
4.5 Hotelling's T2 range for PCA with great outliers for H, J and W.
While the others are below the range of the moderate outliers while
those in the moderate oulier zone are still acceptable.
in the table provided before interpretation.
27

ix
4.6 Score scatter plot mapping of all 210 samples in the PCA model with
outliers.
28
4.7 Biplot of PCA model, showing discriminant over the plot. 30
4.8 The summary of fit for OPLS-DA where Q² does not exceed R². 31
4.9 X/Y models for OPLS-DA which shows a different reading from one
another even though the samples are from the same source.
32
4.10 OPLS-DA of DModX line plot showing the outliers of each model. 33
4.11 Hotelling's T2 range for OPLS-DA with great outliers for H, J and
W. While the others are below the range of the moderate outliers
while those in the moderate oulier zone are still acceptable.
33
4.12 The VIP value of OPLS-DA with the components of vardenafil,
sildenafil and tadalafil.
34
4.13 Score scatter plot for OPLS-DA with a better group clustering. 35
4.14 a) Loading column plot b) Loading scatter plot of OPLS-DA
showing the red marked area from the column as a corresponding
coordinate on the score loading plot as shown which in this case is
the group N.
37
4.15 Biplot of OPLS-DA with low discriminant. 39
4.16 The summary of fit for PLS-DA without removing the Q² < 0.5 and
where Q² does not exceed R².
40

x
4.17 X/Y models for PLS-DA respectively. Each bar graph shows a
different reading from one another even though the samples are from
the same source.
41
4.18 PLS-DA of DModX line plot showing the outliers of each model. 42
4.19 Hotelling's T2 range for PLS-DA with great outliers for H, J and W.
While the others are below the range of the moderate outliers while
those in the moderate oulier zone are still acceptable.
43
4.20 Displays the VIP value of PLS-DA showing the components of
vardenafil, sildenafil and tadalafil in different positions as to those of
the OPLS-DA above.
44
4.21 Scatter plot of PLS-DA with moderate to high outliers. 45
4.22 a) Loading column plot b) Loading scatter plot of PLS-DA showing
the red marked area from the column as a corresponding coordinate
on the score loading plot as shown which in this case is the group G.
46
4.23 Permutation plot of PLS-DA model, where the 2 points meet in a
perfect manner and the rule of thumb is followed.
48
4.24 PLS-DA biplot with high discriminant. 49

xi
LIST OF ABBREVIATIONS
cGMP Cyclic guanosine monophosphate
PDE 5 Phosphodiesterase type 5
PDE 1 Phosphodiesterase type 1
PDE 6 Phosphodiesterase type 6
BPH Benign prostatic hyperplasia
NAION Nonarteritic anterior ischemic optic neuropathy
CYP3A4 Cytochrome p450 3A4
UV Ultraviolet
λmax Maximum Absorption
PCA Principal component analysis
PC Principal component
PLS Partial least squares regression
PLS-DA Partial least squares Discriminant Analysis
OPLS-DA Orthogonal partial least squares Discriminant Analysis
MVDA Multivariate Data Analysis
RSD Residual standard deviation
VIP Variable Influence on Projection
HPLC High Performance Liquid Chromatography
NMR Nuclear Magnetic Resonance

xii
LIST OF SYMBOLS
ºC Degree Celsius
% Percent
λ Lambda
X, Y and Z Spatial coordinate
ml Milliliter
mg Milligram
nm Nanometer
R² Goodness of fit
Q² Goodness of prediction
vs. Versus
n² Square

xiii
LIST OF APPENDICES
APPENDIX A 58
APPENDIX B 59
APPENDIX C 61

1
CHAPTER 1
INTRODUCTION
Coffee gives the feeling of friendliness and daily stimulant for most people and working
environment (Gracia et al., 2009). It is a standout amongst the most consumed refreshments
on the planet (Gracia et al., 2009). Coffee is a special type of beverage made from coffee
beans roasted to perfection. These bean comes from coffee berry's seed from the coffee
plant. Equatorial regions of the world are the best spot for coffee to be cultivated especially
in Southeast Asia, India, Africa, and America. Arabica and Robusta are the most common
coffee selected by farmers to be grown as they are easy to be taken care of and are highly
sought after. Once ripe, the berries are picked and only the seeds are taken under the
process of drying. Coffee beans are very high in the market value and ranked top spot in
agriculture trading around the world (Gracia et al. 2009). Once sold, the beans are roasted
to different degrees, which give rise to different aromas, taste and flavour desired by the
buyers.
Coffee is known to be mildly acidic with the pH value of 5-6. Unlike tea they also have
caffeine which has a very positive and stimulating effect to humans booster. Coffee itself
can also be used for other industries such as insect repellent, fertilizer, and medicine.
However, coffee during the present days have been mixed with adulteration to enhance the
coffee in different ways. "Enhancement Coffee" or "Herbal Coffee" is widely used by the
people of South East Asia especially Malaysia. These coffees are in high demand due to the
ability in enhancing their libido, vitality and overall health . The claimed coffee is also

2
consumed as beauty product amongst women. These products contain the mixture of either
Tongkat Ali (Eurycoma longifolia), Kacip Fatimah (Labisa Pumila) and/or Ginseng
(Panax). These mixed coffees posses good properties in boosting our immune system.
To avoid contaminated coffee from being price as the same as genuine coffee, the coffee
quality is checked thoroughly before being released into the market and contaminated
coffee will always be rejected (Prodolliet et al., 1995). Most coffee dealers in Malaysia
abused the property of coffee by spiking adulterants (libido drug) into the original coffee.
There were reports on health issues when consuming the coffee. This issue is rising since
the production of illegal coffee in the black market which claims to have the same effect as
'Tongkat Ali", "Kacip Fatimah" and "Ginseng". In most cases, these illegal coffees were
spiked with certain drug such as sildenafil, vardenafil, and tadalafil. These drugs were used
as sexual enhancer in humans as they contain active pharmaceutical ingredients found in
viagra (Vardi and Nini, 2007 and Bischoff, 2004)
Therefore the main objective of this research is to detect various types of adulterants in the
premixed coffees which claimed to be sexual booster, wellness and vitality based on the
information on the product packaging. The critical issue regarding these adulterated coffees
has caught the attention of authority with reports on the drug content in the spiked coffee.
Until recently, late last year the authorities have apprehended several companies selling
contaminated coffee due to reported death cases in Malaysia and the products have been
banned. The Health Ministry of Malaysia has been alerted on this issue due to the loose
inspection of the permit approval system.

3
In this project, UV-Visible spectroscopy (Perkin Elmer, Waltham, Massachusetts, United
States of America) and multivariate data analysis software, SIMCA-P version 13.0
(Umetrics, Umeå, Sweden) were employed to determine the presence of adulterant in 7
claimed coffee samples. Highly conjugated organic compounds which consist of sildenafil,
tadalafil and vardenafil, which normally contain chromophores can be analyzed by the UV-
Vis spectroscopy. Colors of the chemicals involved are directly perceived by the affected
visible range by the absorption or reflectance. They undergo an electronic transition which
mimics that of fluorescence directly which deals with transitions from the excited state to
the ground state, while absorption is vice versa (Skoog et al., 2007). Chemometrics on the
other hand, is the science which deal in extracting the information from chemical systems
by data-driven means. This method is used to test whether it is viable to detect adulterants
in premixed claimed coffee and to test the effectiveness of the method used.

4
1.1 Objectives
1) To determine the adulterants (sildenafil, tadalafil, and verdabafil) in coffee by using the
metabolomics approach.
2) To demonstrate that UV-Vis method can be used as a rapid and effective method for the
characterization of coffee.
1.2 Hypothesis
1) Adulterant drugs such as sildenafil , vardenafil and tadalafil are present in the claimed
coffee.
2) Adulterant drugs are not present in the claimed coffee sold in the market.

5
CHAPTER 2
LITERATURE REVIEW
2.1 Coffee
The word coffee derived from many languages which dated as early as the 15th century
where the Ottoman empire at that time called it as "kahve" (Gracia et al., 2009). Whereas
the Arabic named was "qahwah" which came from the word "quwwa" meaning energy or
power (Gracia et al., 2009). Most of the people where coffee was originated called it as
dark wine and the exact language for it is hard to pin point to these day as nobody know
where the word truly originated (Anonymous, 1999). The most credible evidence to date
where coffee was first found was exactly in the 15th century in Yemen (Hopkins, 2006) .
The Arabia coffee was originated from Yemen where the seeds are roasted to perfection
and brewed. The same process takes place in the future as well nothing changed. Coffee got
famous and started to spread out from the Middle East to Venice and North Africa where
traders of old would brought coffee form the Middle Eastern sides to those shores for trade
and it expanded far beyond that of Venice to the far reaches of Europe itself and then
moving it way all around the world (Villaneuva et al., 2006).
Coffee is categorized under the class Magnoliopsida, the order of Gentianales. They are in
the Rubiaceae family, of which it is sub into the family of Ixoroideae and originated from
the genus Coffea (Allison and Mellissa, 2013). They are considered shrubs which usually
grow less than 5 meter, leaves dark green with a glossy touch, wide, different layers and a
bit oval in shape (Allison and Mellissa, 2013). The petioles fuse at the base which forms an
interpetiolar stipules. Their flower are clusters in white with a fragrant odor. The berries
6
colour changes from green when immature, yellow to crimson when ripe and black when
drying. Most of the berries usually contains two seed rarely one seed (Allison and Mellissa,
2013). Two most notable and prized coffee around the world is coffea arabica and coffea
canephora which make up most of the coffee trade markets. The coffee produce are usually
from the seed of the berries which they extract and roast it to a degree before brewing.
Coffee plant prefer a climate which is humid and hot all year round and this makes the
countries around the equatorial belt favorable for these plants.
The process of coffee berries before being made into the coffee is an exciting one. It all
starts from being handpicked or harvested overall by a machine. They then undergo either a
drying process or a less hassle method which is known as the wet strip pick. The coffee still
needs to be dried to expel all the humidity. After drying process has been completed they
undergo roasting, where the dried coffee beans called green beans. They are subjugated to a
temperature of 200 ºC when roasting is taking place (Cornelis and El-Sohemy, 2007).
During this intense roasting process the sucrose in the beans are rapidly lost which gives
rise to the brown caramel looking colour of the coffee. Next comes the brewing where the
coffee has to be grounded and mixed with hot water long enough for the beans to give out
the flavor enclosed in the beans. The ideal temperatures for the beans to be fully optimized
are within the range of 90 ºC to 100 ºC. There are many methods in brewing which includes
boiled, steeped or pressurized. Cold method of brewing coffee is also eligible but the taste
and acidity differs from those of the other 3 methods mentioned and true coffee enthusiast
prefer hot over cold.
This century we have seen an increase in the coffee industry, where more types of bizarre
ways of coffee being made and produced such as the Nespresso produced by Nestle which
7
the coffee is grounded in a capsule and by using the Nespresso machine it can produce
coffee in a unique way which taste even better and yields more coffee than normal
grounded coffee. The cost on the other hand is expensive so that is why Nespresso has not
been a phenomenal thing as a capsule is very costly. Other than that, adulterated coffee
mixed are being an issue of concern now as many of these coffee are being spiked with
drugs ranging from types of sexual enhancers to those of herbal beauty products. Many of
this coffee can be found mainly on the South East Asia side and it is widely used in
Thailand, Malaysia and Indonesia.
An adulterant is a substance found inside different substances for instance nourishment
refreshments and ointment, in spite of the fact that not took into account lawful or different
reasons (Coley, 2005). The expansion of adulterants is called adulteration. An adulterant is
different from, for instance, allowed sustenance added substances. There can be a scarce
difference in the middle of adulterant and added substance; chicory may be added to coffee
to decrease the expense, this is adulteration if not announced, however may be tested on the
label (Coley, 2005). The term tainting can be utilized as this sorts of items are defiled with
abundance drugs over the safety level. Adulterants added to decrease the measure of
extravagant item in illegal medications are called cutting executors. Intentional expansion
of lethal adulterants to sustenance or different items for human utilization is dangerous
(Coley, 2005).
Eurycoma longifolia aslo known as "Tongkat Ali” from the family Simaroubaceae is a
flowering plant, found in South East Asia only from the extent of Loas till Indonesia. It is
found in abundance in Malaysia and is one of the famous plants for its medicinal purposes
especially in the boostage of a man's libido (Abdullah et al., 2004). In Malaysia the usage

8
of E. longifolia are usually found in beverages especially coffee called "Power Root". Since
many herbs have similar effect and the rarity of E. loangifolia, many products claim to have
its properties are sold throughout the market (Abdullah et al., 2004) . Now days many have
claimed that Tongkat Ali is being abused with other types of synthetic drugs which are
added into these coffees and claimed to be Tongkat Ali. Many have reported being ill and
having side effects by consuming this types of coffee. Due to its lower cost compared to the
original Tongkat Ali it is popular among the people in the rural areas.
Abisia pumila also known as kacip fatimah, from the family Primulaceae which originated
from Malaysia (Wan Hassan, 2006).They are herbaceous plant and grow under shades of
the rainforest. Labisia Pumila var alata, L. pumila var pumila, and L.pumila var Ianceolata
are the 3 species found to be thriving in Malaysia (Wan Hassan, 2006). Each has a different
usage and each usage has their own personal beneficial properties and it is advisable each is
used to its full potential at the right way. The plant is believed by the locals to give boost to
a woman's inner and outer beauty (Wan Hassan, 2006). Before utilization back in the days,
the whole plant will be boiled for the extract which is consumed or used during bathing.
Traditional usage of the plant for centuries in the Malay cultures had been used by a variety
of women for after birth treatment and menstrual pain relief of irregularity (Kuah Guan Oo,
2014). Now they are made into tablets and it is closely related to Tongkat Ali.
Ginseng is any of 11 types of moderate developing lasting plants with perennial roots. They
thrive in cooler atmosphere (Baeg et al., 2013). Panax vietnamensis, found in Vietnam, is
the southernmost ginseng known. Ginseng is portrayed by the vicinity of ginsenosides
(Baeg et al., 2013). Siberian ginseng Eleutherococcus senticosus is in the same family,
however not variety, as genuine ginseng. Like ginseng, it is thought to be an adaptogenic

9
herb (Baeg et al., 2013).. The dynamic mixes in Siberian ginseng are eleutherosides, not
ginsenosides. Rather than a perennial root, Siberian ginseng has a woody root. Only a
certain amount but it's getting lesser and lesser that ginseng is used in coffee these days as
they are very expensive and hard to come by. Other than that some ginsengs are said to
give a bit of a side effect such as nosebleed, diarrhea, nuasea, headache, high and low blood
pressure and breast pain (Keifer and Pantuso, 2003). White blood cells, T cells as well as
cytotixc T cells benefits greatly if daily intake of the root is practised (Keifer and Pantuso,
2003).
2.2 Sildenafil
Sildenafil also known as the famous 'Viagra' is mainly used in the treatment of erectile
dysfunction and pulmonary arterial hypertension (Vardi and Nini, 2007). Diabetes mellitus
patient are often being prescribe sildenafil as a primary source of erectile dysfunction
(Vardi and Nini, 2007). Sildenafil citrate on the other hand is also used in the treatment of
the rare disease of pulmonary hypertension which relaxes the arterial wall leading to the
low pressure resistance of the wall. This may lead to heart failure but sildenafil helps by
acting on the walls of the smooth muscle of not only the penis but the arterial wall as well
without causing any vasodilation (Bolell et al., 1996). Sadly, sildenafil have been said to
have many side effects including headache, heartburn and flushed skin. Some have been
known to have prolonged erection which last for hours and leads to the damage of the penis
and some have been reported to have hearing loss and a weak heart once the effect wears
off. Sildenafil also disrupts patient undergoing HIV treatment with protease inhibitor as it
prolongs the plasma half-life (Vardi and Nini, 2007). Sildenafil can be detected in the body

10
if any fatal overdose case ever happens by assessing the whole blood, serum or plasma of
the victim by the pharmocokinetic status.
Figure 2.1: Sildenafil molecular structure (Vardi and Nini, 2007).
The system of activity of this drug includes the insurance of cyclic guanosine
monophosphate (cGMP) from debasement by cGMP-specific phosphodiesterase sort 5
(PDE5) in the corpus cavernosum (Vardi and Nini, 2007). Nitric oxide (NO) in the corpus
cavernosum of the penis ties to guanylate cyclase receptors, which brings about expanded
levels of cGMP, prompting smooth muscle vasodilation of the intimal pads of the helicine
veins. This lead to unwinding prompts relaxation thus expanded flow of red fluids into the
supple parts, bringing on an erection (Vardi and Nini, 2007). Sildenafil is an intense and
particular inhibitor of cGMP- PDE5, which is in charge of debasement of cGMP in the
corpus cavernosum (Vardi and Nini, 2007). The molecular structure of sildenafil is like that
of cGMP and goes about as an aggressive tying specialist of PDE5 in the corpus
cavernosum, bringing about more cGMP and better erections. Without sexual incitement,

11
and in this manner absence of actuation of the NO/cGMP framework, sildenafil ought not
bring about an erection. Different medications that work by the same system include those
of tadalafil and vardenafil. Sildenafil is metabolise in the liver by hepatic digestion system
utilizing cytochrome p450 3A4 (CYP3A4) chemicals, primarily CYP3A4, additionally by
CYP2C9 minor course hepatic isoenzymes. The real result of metabolisation by these
catalysts is N-desmethylated sildenafil, which is metabolized further. This metabolite
additionally has a natural affinity for the PDE receptors, around 40% of that of sildenafil.
Consequently, the metabolite is in charge of around 20% of sildenafil's activity (Web et al.,
1999) . Sildenafil is discharged as metabolites overwhelmingly in the excrement and to a
lesser degree in the urine. In the event that brought with a high-fat feast, ingestion is
decreased; the time taken to achieve the most extreme plasma focus increments by around
60 minutes, and the greatest fixation itself is diminished by about one-third (Webb et al.,
1999).
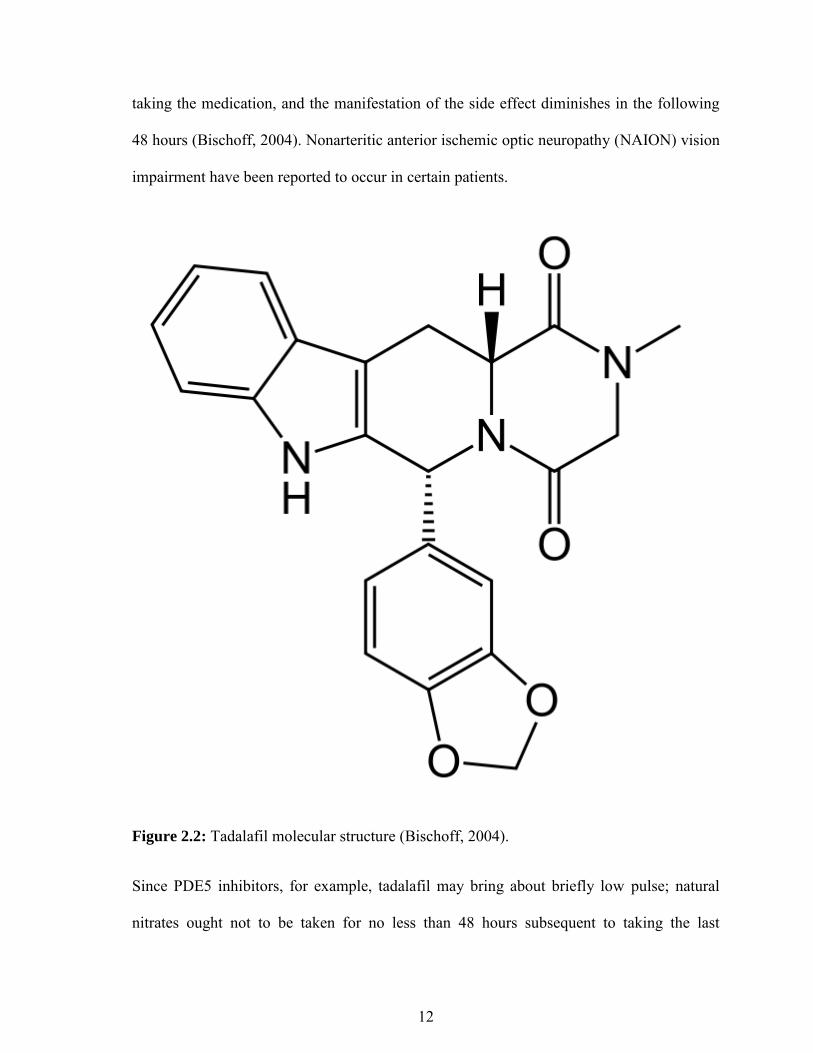
2.3 Tadalafil
Tadalafil as its counterpart sildenafil and vardenafil and works the same in treating erectile
dysfunction and the treatment of pulmonary arterial hypertension. Besides that it also treats
the sign and symptoms of benign prostatic hyperplasia (BPH) (Bischoff, 2004). Tadalafil
has been utilized as a part of pretty nearly 15,000 men taking an interest in clinical trials,
and more than eight million men overall. The most well-known reactions when utilizing
tadalafil are cerebral pain, stomach distress or agony, acid reflux, burping, heartburn, back
pain, muscle throbs, flushing, and stuffy or runny nose. These symptoms mirror the
capacity of PDE5 hindrance to bring about vasodilation, and ordinarily go away following
a couple of hours. Back pain and muscle aches can happen 12 to 24 hours in the wake of
12
taking the medication, and the manifestation of the side effect diminishes in the following
48 hours (Bischoff, 2004). Nonarteritic anterior ischemic optic neuropathy (NAION) vision
impairment have been reported to occur in certain patients.
Figure 2.2: Tadalafil molecular structure (Bischoff, 2004).
Since PDE5 inhibitors, for example, tadalafil may bring about briefly low pulse; natural
nitrates ought not to be taken for no less than 48 hours subsequent to taking the last

13
measurement of tadalafil (Bischoff, 2004). Utilizing natural nitrites inside of this timeline
may expand the danger of life-debilitating hypotension. Since individuals who have taken
tadalafil inside of the previous 48 hours can't take natural nitrates to calm angina, these
patients has to look for prompt restorative consideration in the event that they encounter
anginal chest pain (Daugan et al., 2003). In the occasion of a therapeutic crisis, paramedics
and medicinal work force are advised to be told forth of any late dosages of tadalafil.
Tadalafil is metabolized directly by the hepatic CYP3A4 catalyst framework (Daugan et
al., 2003). The vicinity of different medications which effect this framework can shorten
tadalafil half-life and decrease serum levels, and henceforth adequacy, of the medication.
Tadalafil longer half life compared to vardenafil and sildenafil which results in more lasting
hours of action. This long half-life leads to the usage of tadalafil as a good source of
medicine for the treatment of heart disease. Erection of the penis occurs by the blood flow
from the relaxation of the smooth muscle. This helps in the release of nitric oxide which
promotes the cyclic guanosine monophosphate (GMP/cGMP) in the penile smooth muscle
cells (Daugan et al., 2003). Erectile function are enhanced by increasing the amount of
cGMP but at the same time the inhibition of PDE5 and sexual stimulation is a must for the
nitric oxide to be released or else tadalafil would not take effect (Daugan et al., 2003).
2.4 Vardenafil
Same as its counterpart, vardenafil is similar in function in inhibiting the PDE5 enzyme for
the usage of erectile dysfunction patients. Trade names for vardenafil are "Levitra",
"Staxyn", and "Vivanza". Tadalafil, sildenafil, and vardenafil all demonstrate by hindering
the PDE5 enzyme. These medications additionally hinder other chemicals. Both sildenafil
and vardenafil are effective even more than tadalafil in hindering PDE6 as well as PDE

14
1(Bischoff, 2004).Some reported to be more sensitive to light and to be able to see a bluish
tint. PDE1 is found in the cerebrum and parts of the cardiovascular system (Bischoff,
2004). Positioning of the nitrogen molecule at the piperazine methly ring is what
contradicts vardenafil and sildenafil citrate. Tadalafil is usually exclusive in regards to both
sildenafil and vardenafil. Vardenafil's reasonably brief highly effective time is just like
however pretty more than sildenafil's. Beyond its information for sex ineffectiveness,
vardenafil may be effective in the therapy of beginning ejaculation, where it might basically
develop time from transmitting to ejaculation (Bischoff, 2004).
Figure 2.3: Vardenafil molecular structure (Bischoff, 2004).
Nausea, abdominal pain, back pain, photosensitivity, abnormal vision, eye pain, facial
edema, hypotension, palpitation, tachycardia, arthralgia, myalgia, rash, itch and priapism
are the side adverse effect of common vardenafil. Same as the other counterparts this drug
cannot be consumed with nitrate based medication as it might lead to the invocation of life
threatening hypotension (Daugan et al., 2003).

15
2.5 UV-Visible spectroscopy
It is the reflecting and absorbing action on a unseen plane the ultraviolet-visible (UV)
which means light in the range of UV and near infrared ranges which is visible and adjacent
ranges (Tatzer et al., 2005). The chemicals involved undergo electronic transition in the
region of spectrum which mimics the technique of the fluorescence spectroscopy but rather
than the excited state to the ground state it is actually the opposite from the ground state to
the excited state (Skoog et al., 2007).
Ion of metal transition are able to be shaded which must absorbs visible light on the
grounds that d electrons inside of the metal molecules can be energized starting with one
electronic state then onto the next. The shading of metal particle arrangements is firmly
influenced by the vicinity of different species, for example, certain anions or ligands
(Boggia et al., 2013) . This means, maximum absorption (λmax) can be obtained when
adding another component to increase the shade and wavelength (Skoog et al., 2007).
Whereas for organic compounds, assimilation with high level of light with conjugation on
the range. Solvent plays a role in the factor of compounds which are water soluble or only
soluble in certain compounded solution as they are greater when exposed to UV absorbance
but not all are usable only a certain few. The absorbance spectrum of an organic compound
is affected by the pH and polarity will as well (Ozaki et al., 2007). The solution will always
be directly proportional to concentration of the absorbance of the solution and the length of
path by abiding the Beer-Lambert law (Skoog et al., 2007) hence the machine identifies the
concentration of absorbance in the particular solution. Besides that the machine method can
be used in the determination of the kinetics rate constant of that to the chemical reaction.
During the reaction in the solution the colour present must shift from reactants to the
16
product in order for the UV-Visible spectroscopy to be viable for this method. Other than
that, rate constants of a particular reaction can be obtained by this method at specific time
intervals giving the example of mercury dithizonate, the solution can be turned blue when a
light is shine to it and after that run the UV-Visible test to observe the change state of the
solution from blue to yellow solution over the interval of 10 sec to see how the absorbance
work (Sertova, 2000).
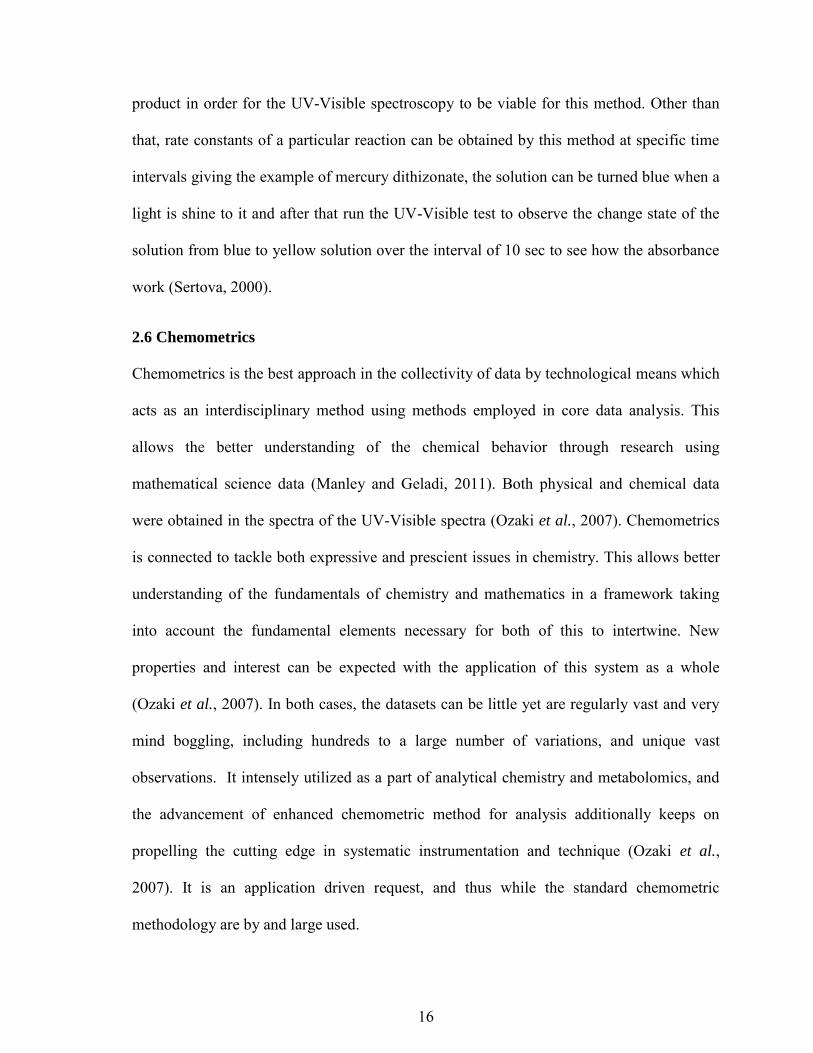
2.6 Chemometrics
Chemometrics is the best approach in the collectivity of data by technological means which
acts as an interdisciplinary method using methods employed in core data analysis. This
allows the better understanding of the chemical behavior through research using
mathematical science data (Manley and Geladi, 2011). Both physical and chemical data
were obtained in the spectra of the UV-Visible spectra (Ozaki et al., 2007). Chemometrics
is connected to tackle both expressive and prescient issues in chemistry. This allows better
understanding of the fundamentals of chemistry and mathematics in a framework taking
into account the fundamental elements necessary for both of this to intertwine. New
properties and interest can be expected with the application of this system as a whole
(Ozaki et al., 2007). In both cases, the datasets can be little yet are regularly vast and very
mind boggling, including hundreds to a large number of variations, and unique vast
observations. It intensely utilized as a part of analytical chemistry and metabolomics, and
the advancement of enhanced chemometric method for analysis additionally keeps on
propelling the cutting edge in systematic instrumentation and technique (Ozaki et al.,
2007). It is an application driven request, and thus while the standard chemometric
methodology are by and large used.

17
Principal component analysis (PCA) is an unsupervised clustering data technique used in
visualization and pattern recognition (Cozzolino et al., 2009). It reduces the multivariate
sets of data dimensionally. New variables which are the principal components (PC) are the
original variables which are linear functions and each consecutive PC acts at a random
notion since they are in perpendicular to another (Manley and Geladi, 2011). Every PC
consists of scores and loading counterpart, where it indicates the relation between samples
and the loadings shows how these variables relate to one another. Each PC loading are
shown as a line plot and the scores as the scatter plot and the successful interpretation of
measured spectroscopic data.
At the point when exceedingly collinear variables exist in an information set frequently
utilizing another direction framework permits better perception of the accessible data
(Geladi et al., 2004; Lavine & Workman, 2005). Mean-focusing can likewise be connected
to the information network, to guarantee ideal depiction of the investigated specimens by
new PCs. With mean-focusing the normal of the information network is subtracted from
every individual example. PCA is a bilinear displaying procedure, in this way before PCA
can be used to multivariate images such as the 3D square of information modelling the
hypercube must be developed into a two dimensional information set or table (Geladi et al.,
2007). A multivariate picture comprises of three dimensions, where the initial two are
spatial (x,y) and the third is a spectral measurement (λ).
Partial least squares regression (PLS) is closely related to component regression but is a
new statistical method which is in relation with one another. Instead of hyperplanes of
lowest difference between the reaction and separate factors, a straight line regression design
is acquired by predicting the expected factors and the visible factors to a new area (Amigo

18
et al., 2009).They are known as bilinear factor models where the both axis lies onto new
planes. Partial least squares Discriminant Analysis (PLS-DA) is a variable used when the Y
is explicit (Amigo et al., 2009). PLS-DA creation came to be when a conventional PLS
model was built on the variable group indicator. This is further explained by predicting that
the X spectral space data for each new sample and by identifying how the predicted data
belonged to the class Y (Liu et al., 2008).
Figure 2.4: Coordinates formed by the PCA, and samples may be defined by the PC 1, PC
2 or PC 3 besides the x, y and z normally used. PC 3 is considered a noise in the data.

19
CHAPTER 3
METHODOLOGY
3.1 Materials and method
Seven products of premixed coffee were chosen from various brands with three claimed to
be adulterated and the other four to be normal coffee and two out of the five were claimed
to be containing special herbal properties. Each material was purchased from various shops
located all around Malaysia. Absolute ethanol (VMR Chemicals, France) was used as the
solvent to dissolve the coffee premix.
3.2 Sample Preparation
All the premixed coffees were in the powdered form; therefore extraction process is not
required. The premixed coffee was readily dissolved in ethanol and the suspended particles
were filtered. They were mixed in a centrifuge tube (2ml) and shaken steadily for a minute.
The concentration of sample was 3mg of coffee in 1 ml of ethanol. 30 replicates of each
premixed coffee were taken from each brand totaling to 210 samples.
3.3 UV-Vis
The method used for the experiment was performed using a UV-Visible Spectroscopy
(Perkin Elmer, Waltham, Massachusetts, United States of America) that comes with
software included (Lambda 25) for the range of 0 nm - 600 nm with 1 nm resolution. The
cells used were rectangular cuvette measuring 2mm (UVette ® 220-1600nm disposable
single sealed cuvettes, Eppendorf, Germany). Absolute ethanol was used as blank.
20
3.4 Multivariate Data Analysis
All the spectra were baseline corrected and smoothed before conversion to ASCII format
and then converted into a single table of Microsoft Excel (2007-2013). The processed data
were then imported into SIMCA-P version 13.0 (Umetrics, Umeå, Sweden) for multivariate
statistical analysis in a scaling parameter of unit variance (UV). PCA was adopted for the
initial exploratory data analysis whereby the scores plot reflected separation among the
samples. However, orthogonal partial least squares discriminant analysis (OPLS-DA) and
PLS-DA was preferably employed due to the clearly observed discrimination of the
samples in accordance with their contents or adulterants. The employed model was
described by the criteria of R², which indicated the goodness of fit, and Q², the goodness of
prediction(Yusof et al., 2014). The variables influences on projection (VIP) values
exceeding 1.0 were selected and not removed as when removing any values exceeding 1.0
will alter the plot of each scatter plot (Yusof et al., 2014). Moreover, the significance of
each model established was validated by P value (P <0.05) of CV-ANOVA as the
supporting information.

21
CHAPTER 4
RESULTS & DISCUSSION
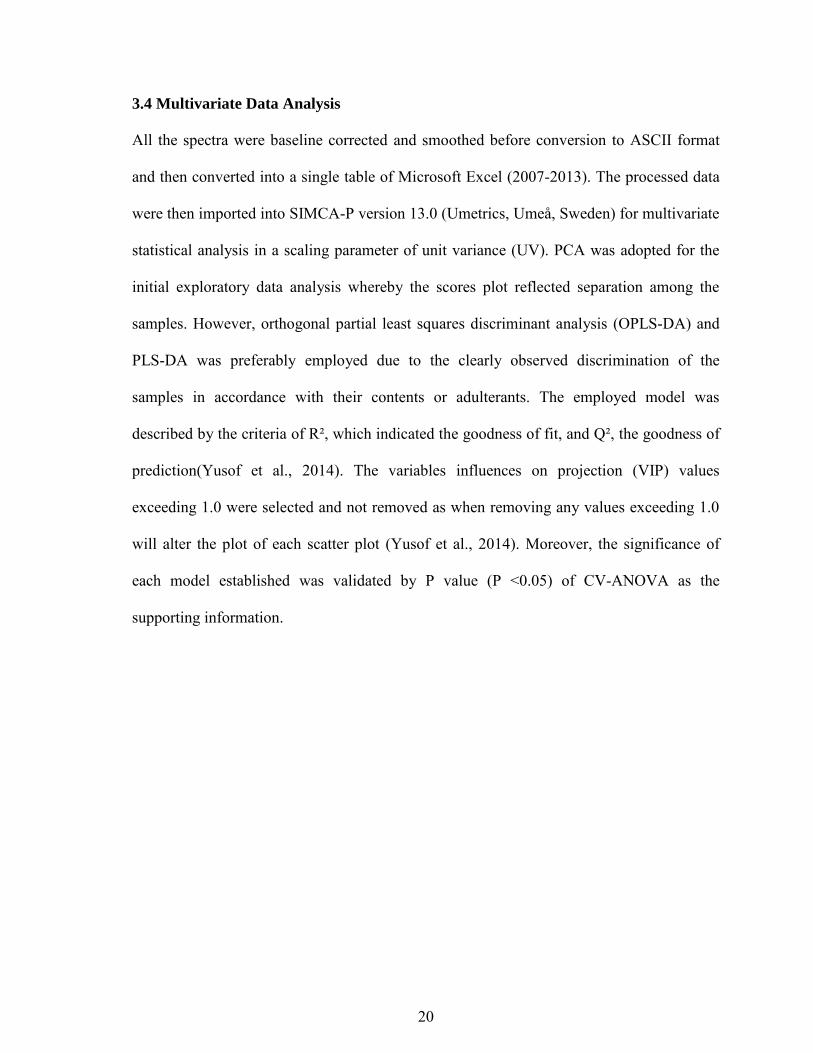
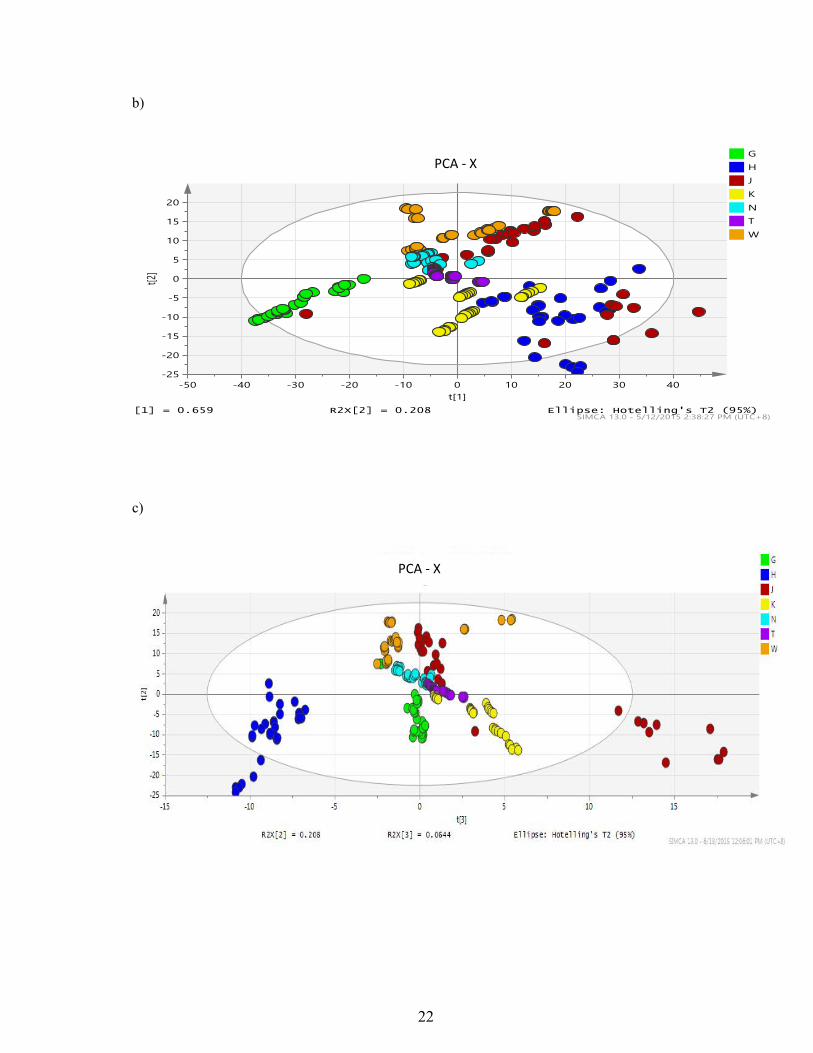
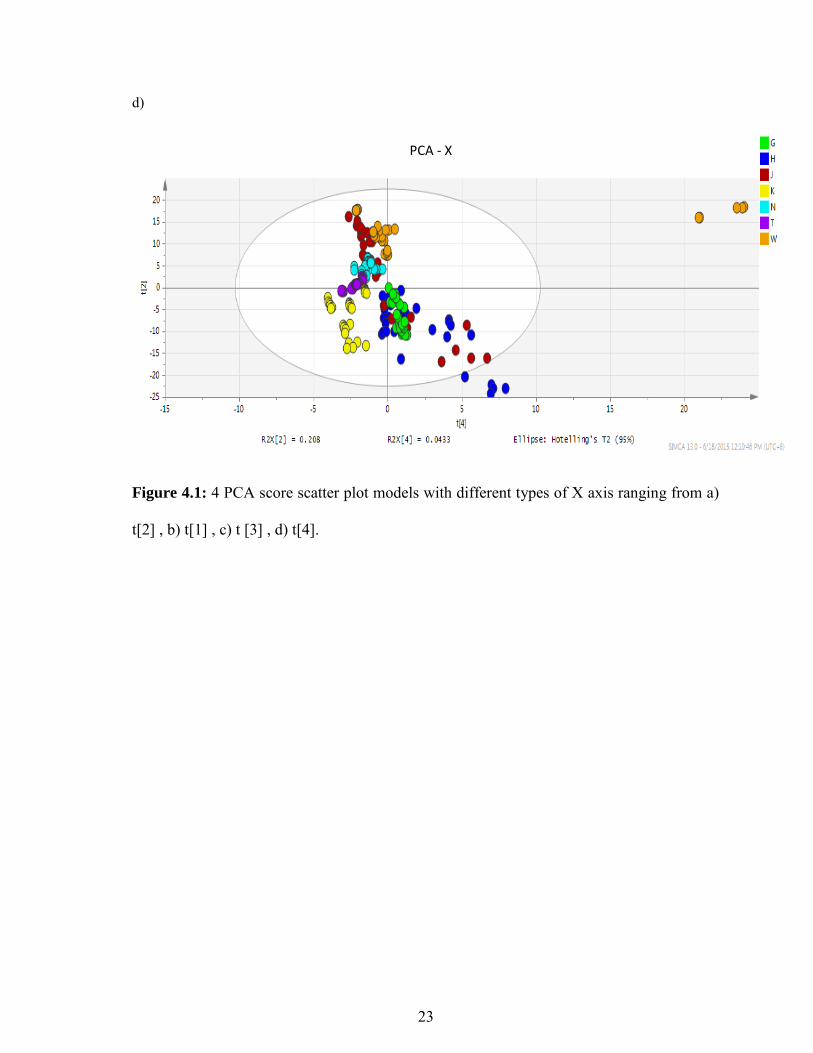
The figures below represent the same scatter score plot for a PCA model but differs as the
X axis was changed to consider which scatter score plot gives out the best clustering and it
is seen by that, Figure 4.1 b) is the most acceptable clustering model as we can see below
the groups has the lowest discriminant. Figure 4.1 a) shows a straight line of the group
clustering indicating the score plot X and Y axis correlates with each other. From this given
types of model the most acceptable is Figure 4.1 b) as it is the best chosen by the program
after processing the data as the clustering of each of the data on the scatter score plot are
clustered within the vicinity of their group, with the exception of some outliers. Therefore
the chosen model for PCA, OPLS-DA and PLS-DA subplot.
a)
PCA - X
22
b)
c)
PCA - X
PCA - X
23
d)
Figure 4.1: 4 PCA score scatter plot models with different types of X axis ranging from a)
t[2] , b) t[1] , c) t [3] , d) t[4].
PCA - X

24
4.1 PCA Model
4.1.1 Summary of Fit
R² or also known as fit estimates the goodness of fit and it explains the variation of the data.
As shown in the figure below, R² is the percentage of set for PCA as well as how well the
data accepts the model. A good model have a R² of nearly to 1 but it still does not suffice as
is having unpredictable models which are poor models with a large R² still generates much
noise (Manley and Geladi, 2011).
Figure 4.2: The summary of fit for PCA where Q² does not exceed R².
Q² is known as predictive ability which estimates the goodness of prediction by cross
validation. Q² is the percentage of variation determined by the cross validation for PCA. It
dictates on how well the information is predicted. A large Q² (Q² > 0.5) indicates good
predictivity. When noise is present, an unquality Q² is obtained, or when the model is
dominated by few scattered outliers (Manley and Geladi, 2011).
Summary of fit PCA