by may 2009 yangbo du and john e. parsons update on the cost
TRANSCRIPT

by
May 2009
Yangbo Du and John E. Parsons
Update on the Cost of Nuclear Power
09-004


Update on the Cost of Nuclear Power
Yangbo Du* and John E. Parsons**
May 2009
We update the cost of nuclear power as calculated in the MIT (2003) Future of
Nuclear Power study. Our main focus is on the changing cost of construction of new plants. The MIT (2003) study provided useful data on the cost of then recent builds in Japan and the Republic of Korea. We provide similar data on later builds in Japan and the Republic of Korea as well as a careful analysis of the forecasted costs on some recently proposed plants in the US. Using the updated cost of construction, we calculate a levelized cost of electricity from nuclear power. We also update the cost of electricity from coal- and gas-fired power plants and compare the levelized costs of nuclear, coal and gas. The results show that the cost of constructing a nuclear plant have approximately doubled. The cost of constructing coal-fired plants has also increased, although perhaps just as importantly, the cost of the coal itself spiked dramatically, too. Capital costs are a much smaller fraction of the cost of electricity from gas, so it is the recent spike in the price of natural gas that have contributed to the increased cost of electricity. These results document changing prices leading up to the current economic and financial crisis, and do not incorporate how this crisis may be currently affecting prices.
* MIT, 77 Massachusetts Ave., Cambridge, MA 02139 USA, E-mail: [email protected]. ** Corresponding author: MIT Sloan School of Management, MIT Center for Energy and Environmental Policy Research, and MIT Joint Program on the Science and Policy of Global Change, E40-435, 77 Massachusetts Ave., Cambridge, MA 02139 USA, E-mail: [email protected] We appreciate the helpful comments of participants in the MIT Nuclear Fuel Cycle Study, the MIT EPPA Seminar, the NEI, EPRI, Paul Joskow, Gib Metcalf, Howard Herzog and several of the Associates of the MIT Center for Energy and Environmental Policy Research.

Page 2
INTRODUCTION
One of the contributions in the MIT (2003) Future of Nuclear Power study was an
estimate of the levelized cost of electricity generated using a new nuclear power plant,
and a comparison against the levelized cost from new coal or gas plants. For nuclear
power, the cost of constructing a new plant accounts for the major portion of this
levelized cost, and so estimating the overnight cost of construction is key. Since no
nuclear plants had recently been built in the US, the MIT (2003) study provided useful
data on the cost of recent builds in Japan and the Republic of Korea. This paper updates
the calculations in the MIT (2003) study, primarily by adding further data on more recent
builds in Japan and Korea, and by a careful analysis of the forecasted costs on some
recently proposed plants in the US. We place this data in the context of the recent cost
escalations for many commodities and engineering projects, and compare the levelized
cost for nuclear against similar calculations for coal and gas plants.
The results show that the overnight cost of building a nuclear power plant has
approximately doubled—see Table 1. Where the MIT (2003) study considered a base
case overnight cost of $2,000/kW, denominated in 2002 dollars, we find a range of
overnight costs around $4,000/kW, denominated in 2007 dollars. The overnight cost of
building coal- and gas-fired plants has also increased, although perhaps not quite to the
same extent. Where the MIT (2003) study considered a base case overnight cost for a
coal-fired plant of $1,300/kW, denominated in 2002 dollars, we find a range of overnight
costs centered around $2,300/kW. Where the MIT (2003) study considered a base case
overnight cost for a gas-fired plant of $500/kW, denominated in 2002 dollars, we find a
range of overnight costs around $850/kW. Although we calculate a 100% increase in the

Page 3
overnight cost for nuclear and only a 77% increase in the overnight cost for coal and 70%
for gas, the large range of uncertainty around the estimates for each technology – nuclear,
coal and gas – make it arguable whether there has been a relative shift in the capital costs
among the alternatives.
Incorporating all cost elements, we find that the levelized cost of electricity from
nuclear power is 8.4¢/kWh, denominated in 2007 dollars. The levelized cost of electricity
from coal, exclusive of any carbon charge, is 6.2¢/kWh, denominated in 2007 dollars.
The levelized cost of electricity from gas, exclusive of any carbon charge, is 6.5¢/kWh,
denominated in 2007 dollars. In its base case, the MIT (2003) study had applied a higher
cost of capital to nuclear power that it applied to either coal- or gas-fired power. The MIT
(2003) study also reported results with this risk premium removed so that a comparable
cost of capital was applied to both nuclear and coal-fired power, and we repeat that
calculation here: removing this risk premium from our calculations lowers the levelized
cost of electricity from nuclear power to 6.6¢/kWh. Adding a $25/tCO2 charge to coal-
and gas-fired power raises the levelized cost of electricity from coal to 8.3¢/kWh and the
levelized cost of electricity from gas to 7.4¢/kWh. These results are summarized in Table
1 and Figure 1.
2. NUCLEAR POWER PLANT CONSTRUCTION COSTS
A Consistent Method for Quoting the Cost of Construction at Different Plants
Published estimates for the cost of constructing a new nuclear plant can vary
greatly, sometimes by a factor of two or more. For example, in August 2007, the Reuters
news service reported that two 1,350 MW reactors to be built for the company NRG at its
Page 4
South Texas site would cost between $6 and $7 billion. That translates to between $2,200
and $2,600/kW of capacity. In January 2008, the St. Petersburg Times newspaper
reported that two 1,100 MW reactors being planned for Florida Power & Light (FPL)
would cost between $12 and $18 billion. That translates to between $5,500 and
$8,200/kW of capacity. Based only on these reported figures, it would appear as if the
nuclear units planned for Florida were forecasted to cost as much as three times the units
planned for Texas! However, this would be an erroneous conclusion. The Texas figure
only covers the price NRG would pay to Toshiba for the plant, i.e., it is the price of the
engineering, procurement and construction (EPC) contract. It excludes a large number of
other costs that NRG would have to cover in order to complete the plant – so called
owner’s costs. The Florida figure not only includes these owner’s costs, but also includes
expenditures on transmission system upgrades unrelated to the specific plant being built.
Also, the Texas figure is an overnight cost, which is the cost of all the parts and labor
required over several years of construction, but denominated in current dollars. The
Florida figure includes the effect of inflation on the total dollars spent over the projected
construction period. Finally, the Florida figure includes charges made to cover the
utility’s cost of capital during the period of construction – financing costs – while the
Texas figure does not.
Each of the Texas and Florida figures reflects a traditional method for quoting the
cost of a nuclear plant, but the quotation methods are so different that a raw comparison
of the two figures against one another is worse than useless. When working with publicly
reported figures, it is essential to exercise great care to put the figures on the same terms.
In fact, as we shall see below, the actual cost estimates for the Texas and Florida nuclear
Page 5
plants do not differ very significantly at all once appropriate care is given to make the
figures comparable.
In order to clarify the problem and to help explain some steps that are necessary
in order to make differently quoted cost estimates comparable, we have constructed the
illustrative example shown in Table 2. The illustration provides cost data on the
construction of a hypothetical nuclear power plant, and lays out a few standard, but very
different methods for quoting these same costs. The illustration gives a measure of how
large a disparity one can expect for the different methods, even when the underlying plant
and cost data are the same.
For the hypothetical nuclear plant, construction is planned to occur over a five
year period running from 2009 through 2013, so that the plant is ready to begin
production at the end of 2013 and the start of 2014. The future owner and operator of the
plant orders it from a vendor who will construct the reactor and power generation unit
under an EPC contract. Lines [3] and [4] show how the cost is typically quoted by the
vendor. The vendor’s total EPC overnight cost quoted in 2007 dollars is $3,333/kW.
Assuming that the nuclear plant’s capacity is 1,000 MW, this translates to $3.333 billion.
These figures represent the cost of the relevant parts and services were those services to
be provided immediately once the EPC contract negotiations are completed, i.e.,
overnight. In fact, these parts and services will be delivered according to a construction
schedule which is shown in Line [3]: 10% of these parts and services will be provided in
2009, 25% in 2010, 31% in 2011, and so on. Line [4] shows the corresponding dollar
figures apportioned across these years, but still quoted in 2007 dollars.

Page 6
Lines [5]-[11] show how the cost for the same plant is typically quoted by a
regulated utility as it submits filings seeking approval for the plant. Line [5] is the
vendor’s EPC cost, but these figures have been adjusted for inflation so that each year’s
figure reflects the expected nominal expenditure in that year. Line [6] shows the owner’s
costs, i.e., costs that the utility will have to cover out of its own pocket, in addition to the
vendor EPC costs. The figures shown in line [6] are 20% of the figures shown in line [5].
A 20% figure is a reasonable assumption absent specific information for a given plant.
Line [7] shows the cost of transmission system upgrades which are scheduled in concert
with the construction of the new generation capacity. There is no standard ratio for this
item, as it depends significantly on the specific situation within each transmission
territory including the regulatory rules in operation, so the figures shown are simply
given. Line [8] shows the total of lines [5], [6] and [7]. This total cost, which is exclusive
of financing costs, is $4,706/kW. The regulated utility will be allowed to recover this
total cost through customer charges. It will also be allowed to recover capital costs or
financing charges. These are calculated in line [9], assuming an effective capital charge
of 11.5%.1 Line [10] shows the total costs as expended, inclusive of this capital charge.
Line [11] cumulates this total cost, which is a step in calculating the allowed annual
capital charge. By the end of 2013, when the plant is complete and ready to start
producing power, this total cost, inclusive of capital charges, is $5,837/kW. This is 75%
more than the vendor’s EPC overnight cost of $3,333/kW, although the difference 1 What capital or financing charges are recoverable depends entirely on the regulatory rules in place. Financing charges are often denoted using specialized terminology unique to the particular regulatory rules applicable to the particular plant. A common terminology in the U.S. is AFUDC which stands for Allowance for Funds Used During Construction. Different regulatory procedures allow different calculations of what financing charges may be included, so there are multiple ways of calculating line [9], and our hypothetical illustration is just meant to capture the general idea. This same proviso applies to how non-regulated firms record the cost of a plant in their financial statements, although in this case it is accounting standards that govern the calculation.

Page 7
between the two estimates is purely a question of the method of quotation, i.e., of what is
in and what is out and how the dollar expenditures are denominated, whether in 2007
dollars or dollars as expended.
We have boxed a number of the figures shown in the table: line [4F], line [8F],
line [10F] and line [14F]. The first three figures reflect the quotation methods most often
encountered in published reports. Line [4F] is the total vendor EPC overnight cost quoted
in 2007 dollars, and it is the lowest of all the figures. Lines [8F] and [10F] are two
alternative figures often reported in utility filings. Both are total costs, inclusive of
owner’s costs and of transmission costs. The former excludes financing costs and the
latter includes them.
Line [14F] represents the standard basis for quoting comparable costs across
different plants as described in the MIT (2003) Future of Nuclear Power study. It reflects
the “busbar” cost, including only transmission costs related to connecting the plant to the
grid, and excluding the costs of expanding the overall transmission network to handle the
growing power needs which are independent of the specific plant generating the power.
Therefore it excludes the costs from line [7] in our illustration. It is inclusive of owner’s
costs – line [6] in our illustration. Therefore, we take line [5] + [6] = [8]. Unfortunately, it
makes little sense to add up the different annual expenditures in line [8] since these are
denominated in dollars for different years, incorporating different amounts of inflation.
Therefore, the industry convention is to quote the total expenditures as an “overnight
cost” using a single year as the baseline. Lines [14] and [15] show this overnight cost
quoted in $2007 figures, when the plant is being contemplated, and in $2013 figures,
when the plant is scheduled to be completed and ready to start producing power. The

Page 8
terminology and calculations shown in lines [12]-[15] are those used in the MIT (2003)
Future of Nuclear Power study Appendix 5, Table A-5.A.2, although the costs have been
adjusted upward.
In the hypothetical example shown in Table 2, our overnight cost figure is 20%
more than the overnight cost reflecting only vendor EPC costs, 15% less than the utility’s
total cost as reported in regulatory filings, exclusive of financing charges, and 31% less
than the utility’s total cost as reported in regulatory filings, inclusive of financing
charges. These results help benchmark reported figures that do not provide a complete
breakdown of all elements, but which do describe the quotation method. With this
analysis of methodology in hand, we are ready to turn to an analysis of new information
about the cost of constructing a nuclear power plant.
Recent Japanese and Korea Builds: 2004-2006
The MIT (2003) Future of Nuclear Power study provided useful data on the cost
of recent builds of 7 reactor units in Japan and the Republic of Korea completed between
1994 and 2002. Translated into US figures, the costs of these units ranged from
$1,790/kW to $2,818/kW. Table 3A shows these figures in column [H]. The overnight
cost would be slightly lower, excluding as it does the effect of inflation, and this
adjustment is made in columns [I] and [J]. This yields a range of overnight costs between
$1,611/kW and $2,536/kW in 2002 dollars. Of course, for this data to be meaningful
today, one needs to escalate these figures to 2007 dollars. For this calculation, we apply a
15% per annum nuclear power capital cost inflation factor to put these figures into 2007
dollars. We discuss the choice of this escalation factor below. Therefore, these costs

Page 9
would range from $3,222/kW to $5,072/kW expressed in 2007 dollars. The average is
$4,000/kW, expressed in 2007 dollars.
Since the publication of the MIT (2003) study, over the years 2004-2006, five
additional units have been completed in Japan and Korea. Table 3B reports the cost
figures for these later builds. Column [F] shows the costs as reported by the respective
plant owners in press releases and company annual reports. The Japanese figures are
reported in Yen and the Korean figures in Won. Consistent with the MIT (2003) study, in
columns [G] and [H] we convert these to US dollar figures applying a purchasing power
parity (PPP) conversion factor corresponding to the country and year in which the plant
went into commercial operation. The costs shown in column [H] are totaled as expended,
and so reflect inflation through time. To arrive at an overnight cost, we apply an
adjustment factor as shown in column [I], yielding overnight costs shown in column [J].
These costs are denominated in the various years in which each plant was completed, and
so we apply the 15% inflation rate, as shown in column [K], to arrive at an overnight cost
denominated in 2007 dollars, as shown in column [L]. The overnight costs on these units
range between $2,357/kW and $3,357/kW, expressed in 2007 dollars. The average is just
under $3,000/kW, expressed in 2007 dollars. This more recent range is lower than the
range for the earlier Japanese and Korean builds, perhaps reflecting continuing
improvements in construction or other design factors.
Other Builds Outside the US
Besides these 5 Japanese and Korean units, several other plants have recently
been constructed in the world.

Page 10
Some of these plants have been built in China. An important caution must be
applied, however, in considering whether to use construction costs in a country like
China that is at a very different level of development as an indication of the possible cost
of construction in a country such as the US. Even extrapolating construction costs from
Japan and Korea to the US context is fraught with dangers. The use of purchasing power
parity conversion ratios is one attempt to cope with these dangers, but a highly imperfect
one.2 Extrapolation from a country such as China, is likely to lead to erroneous
conclusions unless great care is given to adjust the figures accordingly. We are not sure
whether the results would be worth the effort and be broadly accepted by others. In any
case, the task is beyond the aspirations of this paper.
A new plant is still under construction at Olkiluoto in Finland. It is to be the first
using Areva’s EPR design. The original estimate for the cost was €3.2 billion ($4.5
billion) with a completion date in 2009. This translates to $2,800/kW, which is low when
compared to the earlier set of Japanese and Korean builds, but in the range of the more
recent Japanese and Korean builds. This is surprising, since one would normally expect
the figure to incorporate interest costs and therefore need to be reduced somewhat.
However, there is no detail on what is included in this figure, and so it must be handled
carefully. In any case, the reactor is now far behind schedule and over budget. The
construction schedule has been lengthened to 7 years with a revised completion date of
2012. The revised cost estimate is €4.5 billion ($6.3 billion), which raises the calculated
overnight cost to just under $4,000/kW, raw, i.e., without appropriate adjustments for
what may have been included or excluded. The delay and cost overruns serve as a 2 Had we used market exchange rates, the Japanese construction costs would have been much higher and the Korean construction costs much lower.
Page 11
reminder that some of the other forecasted cost numbers discussed in this paper are
optimistic when averaged together with troublesome builds such as this one.
A second EPR is under construction at Flamanville in France, to be operated by
EDF. It is to have a capacity of 1,650 MW. Construction began in December 2007 and
was scheduled to take 54 months with commercial operation beginning in 2012.
Construction and engineering costs, exclusive of owner’s costs, were originally
forecasted to be €3.3 billion ($4.8 billion) according to EDF. Construction has run into
some problems that seem similar to the situation at the Olkiluoto site, but EDF claims it
will still be able to meet the 2012 in service target date. The cost estimate has since risen
to €4.0 billion, including an adjustment from 2005 € to 2008 €.
Planned Plants in the US
Although no new plants have been built in the US in recent years, several have
been proposed. In a couple of instances, detailed estimates have been submitted to state
regulatory authorities. In other instances, only summary numbers have been reported,
whether in official filings or in press statements. It bears repeating, however, that none of
the figures reported for these plants represent actual costs. No concrete has been poured.
These are all estimates of what it would cost if construction were to begin. They are not
evidence of actual costs as executed. Nevertheless, each of these represents a serious
effort to project the costs under the then current situation, and so long as they are taken
with an appropriate measure of salt, they provide some useful insights.

Page 12
The figures for each plant are presented in Table 4. In the paragraphs that follow,
we discuss each plant, the source data and how we produced our standardized overnight
cost estimate.
The first entry is TVA’s cost estimate for construction of an ABWR unit at its
Bellefonte site. This estimate was made in 2005 in cooperation with the DOE, Toshiba,
GE, Bechtel and others to help advance the general public discussion about new nuclear
builds. The estimate was not produced in connection with the actual, imminent
construction of a new unit at Bellefonte.3 The design examined is similar to the design
used for a number of the Japanese plants shown in Tables 3A and 3B: the Kashiwazaki
Kariwa Unit 6 built for Tokyo Electric Power Corporation (TEPCO), the Hamaoka Unit 5
built for Chubu Electric, and the Shika Unit 2 built for Hokuriku Electric. The cost
estimate was published by Tennessee Valley Authority (2005). The published figure of
$1,611/kW, however, is for EPC overnight costs only, and does not include owners’ cost.
Therefore, we add 20% to the reported figure in order to produce a full overnight cost of
$1,933/kW as reported in 2004 dollars. Escalated to 2007 dollars using our 15% rate, the
overnight cost is $2,930/kW.
The second entry is FPL’s cost estimate for construction of two ESBWR units at
its Turkey Point site on Biscayne Bay south of Miami. This estimate was made in FPL’s
petition with the Florida Public Service Commission in October 2007 asking for a
determination of need for the units. Construction of the units could begin as early as
2013, with generation starting in 2018 at the earliest for the first unit and 2020 for the
3 However, in October 2007, TVA did submit an application for a Combined Operating License to the Nuclear Regulatory Commission for two new AP1000 units at Bellefonte, units 3 & 4.

Page 13
second. FPL’s application included two alternative designs: the GE ESBWR with a 1,520
MW capacity for each unit, and the Westinghouse AP1000 with a 1,100 MW capacity for
each unit. FPL constructed its cost estimate relying heavily on the estimate produced by
TVA for its Bellefonte site using GE’s ABWR design. FPL claims that the unit cost
estimate from the TVA study is nevertheless informative for both the ESBWR and the
AP1000 designs it was considering. The cost estimate included adjustments from the
TVA Bellefonte study made to fit the specifics of the FPL proposal and to account for
inflation since the TVA estimate was made. The widely cited figure from this filing of
$3,800/kW in 2007 dollars includes the cost of transmission upgrades to FPL’s regional
network. And the widely cited total project figure of $12.1 to $17.8 billion includes
capital charges. However, the filings give us sufficient information to back out these
components and arrive at a full overnight cost of $3,530/kW in 2007 dollars. The
corresponding full project overnight cost would be $10.7 billion for the two units.
The third entry is Progress Energy’s cost estimate for construction of two AP1000
units at a new site in Levy County, Florida on the Gulf of Mexico just south of the
panhandle. This estimate was also made in a petition for determination of need filed with
the Florida Public Service Commission. Progress Energy filed the petition in March 2008
looking to generation starting in 2016 for the first unit and 2017 for the second.
Excluding capital and other charges, the total project cost is $9.304 billion for both units
expressed in 2007 dollars. This translates to $4,206/kW in 2007 dollars. Progress Energy
(2009) recently announced that it had successfully signed an EPC contract with
Westinghouse and Shaw for $7.65 billion. The figures in this recent press release appear
to match those in the petition filed last year.

Page 14
The fourth entry is South Carolina Electric & Gas Company’s (SCE&G) cost
estimate for construction of two AP1000 units at the V.C. Summer Nuclear Station site
near Jenkinsville, South Carolina. SCE&G’s partner in the project would be Santee-
Cooper, with the respective shares being 55% and 45%. The total capacity of the two
units is expected to be 2,234 MW. The cost estimate was made in a combined
environmental application and petition for a determination of need filed by SCE&G with
the Public Service Commission of South Carolina in May 2008. Costs were projected
based on construction beginning soon and looking to generation starting in 2016 for the
first unit and 2019 for the second. Total project costs of $6.313 billion for SCE&G’s 55%
share have been reported. This translates to a total project cost of $11.479 billion.
However, once again this includes transmission upgrades and capital charges. Other
reports have given a $9.8 billion total that excludes the transmission upgrades and capital
charges, but this sums together expenditures made in different years including inflation
projected over the various horizons. We use the detailed filing to exclude capital and
other charges and to denominate the costs in 2007 dollars. We calculate a total project
cost of $8.459 billion for both units expressed in 2007 dollars. This translates to
$3,787/kW in 2007 dollars.
The fifth entry is Georgia Power’s cost estimate for construction of two AP1000
units at its Plant Vogtle site in Burke County, Georgia. These would be Units 3 & 4 at the
site. Georgia Power is a subsidiary of Southern Company. The total capacity of 2,200
MW would be shared with Oglethorpe, MEAG and Dalton Utilities, with the shares being
45.7% for Georgia Power and 30%, 22.7% and 1.6%, respectively, for each of the other
owners. Georgia Power’s cost estimate was produced in its application for certification of

Page 15
the units and its updated integrated resource plan, filed with the Georgia Public Service
Commission in August 2008. The two units are proposed to come on-line in 2016 and
2017. The total in service cost is forecasted to be $6.447 billion for Georgia Power’s
share, or $14.107 billion in total and $6,412/kW. Unfortunately, all detailed information
about this cost figure is redacted in Georgia Power’s filing, and so it is impossible to
exclude transmission and capital charges and also impossible to put the figure into
constant 2007 dollars using Georgia Power’s assumption. However, if we assume that
these components are the same proportion of Georgia Power’s filings as they are for
SCE&G, then the total project cost should be reduced to 74% of the reported figure, i.e.,
to an overnight cost of $10.439 billion or $4,745/kW in 2007 dollars. This leaves the
Vogtle units with the highest forecasted overnight cost of the four newly planned sets.
The sixth entry is NRG’s cost estimate for the two new units at its South Texas
Project, units 3 & 4. The units would be GE’s ABWR design with a combined capacity of
2,660 MW. The projected construction schedule is six years for the pair. The existing
South Texas Project units are co-owned with CPS Energy, San Antonio’s municipal
power authority, and with Austin Energy, the municipal authority for the city of Austin.
In 2006, an NRG press release announced the cost for the two units at $5.2 billion, or
$1,900/kW. In August 2007 Reuters reported the value of the contract between NRG and
Toshiba for building the units at between $6 and $7 billion, or between $2,200 and
$2,600/kW. In September 2007, NRG’s CEO, David Crane, in an interview with the Wall
Street Journal discussed a cost of between $2,000 and $2,250/kW. In early 2008, the City
of Austin chose not to participate in the project, citing the overly optimistic cost estimate
and construction schedule. In March, 2008, when NRG announced a partnership with

Page 16
Toshiba for the development of new nuclear plants in the US, NRG produced a
presentation by its CEO displaying its updated cost estimates for construction of the
ABWR design. The EPC contract overnight cost was estimated at $2,900/kW. Owner’s
cost was estimated at $300/kW, approximately 10%, which is surprisingly low.
Typically, owner’s cost is in the neighborhood of 20%, although it can vary depending
upon whether a unit is being built in a greenfield site and other factors. Transmission
costs are separate and not included in NRG’s figure, as are interest during construction.
Adding another 10% for owner’s costs, brings the total cost to $3,480/kW, the lowest
among the estimates, but very close to the estimate of $3,530 for FPL’s Turkey Point
units.
The overnight cost of the proposed units – i.e. excluding the TVA estimate as it
was not an actual build proposal and was for an earlier year – lie between $3,500 and
$4,800/kW, denominated in 2007 dollars. This is still a large range. None of the values in
this range represent the actual cost of plants built. All of these assume construction goes
on schedule with modest allowances for contingency. They forswear delays and overruns
like those that plagued the US industry in an earlier era and that are plaguing the
Olkiluoto plant currently under construction in Finland. Based on this data, and in light of
the experience of actual builds in Japan and Korea, for the rest of this paper we choose to
use $4,000/kW in 2007 dollars as a central value for our comparisons.
Escalating Costs
One of the most important reasons for updating the overnight cost figures from
the MIT (2003) study is the sharp escalation in costs experienced in the last few years,
especially for major engineering projects. Between 2002 and 2007, the GDP deflator
Page 17
index grew by 15% in total, which averages to a little less than 3% per annum. However,
the price of key commodities used in construction of a power plant grew much faster. For
example, the price of fabricated structural metal increased by more than 36% over these 5
years, the price of high alloy and stainless steel castings increased by more than 46%, and
the price of cement increased by more than 37%. The price of engineering services
increased as well. The combined effect has been a dramatic increase in the price of
building new electricity generating plants of all kinds. The consulting firm IHS-CERA
index of capital costs for power plants shows an increase of 60% for non-nuclear power
plant construction between 2002 and 2007 – an annual increase of 9.9% –and an increase
of 276% or 22.5% per annum for nuclear power plants.
Using the MIT (2003) estimate of $2,000/kW in 2002 dollars, and a central
estimate of $4,000/kW in 2007 dollars, our results suggest an annual rate of increase in
overnight costs of approximately 15% during this period. This represents a sizeable
premium to the general rate of inflation – the 3% per annum mentioned above for the
GDP deflator.
Even as prices were climbing steeply, the difficult task was to understand what
fraction of the price increases represented a new, long-lasting change, and what fraction
represented the temporary pressures of rapidly escalating demand outstripping the
development of new supply capacity. Since mid-2008, commodity prices have reversed
themselves and moved sharply downward. The cost of engineering services has probably
declined sharply as well. Much of this reversal is due to the faltering levels of economic
activity in the US and worldwide. Now the question is how much of this recent decline in
prices will be translated into a lastingly lower cost of new construction, and how much

Page 18
represents just a temporary respite from the higher level of costs that had been reached. It
is impossible to predict the true impact of these developments at the time of writing this
report, and we focus simply on reporting the available data on costs as generated in the
last few years. The cost data we report in Table 4 would appear to represent results just at
the peak of the recent escalation.
Figure 2 shows the data for the newer Japanese and Korean builds from Table 3B
and the data for the planned US plants from Table 4. Also shown is the base case figure
from the MIT (2003) study and an extrapolation of this figure at both a 3% rate (i.e., GDP
deflator) a 15% escalation rate (actual plant cost escalation rate).
3. LEVELIZED COST OF ELECTRICITY FROM NUCLEAR POWER
Using this revised estimated overnight cost of a new nuclear reactor, we apply the
methodology from the MIT (2003) study to calculate a levelized cost of electricity.4 The
assumptions made to calculate a levelized cost of electricity are displayed in Table 5.
These are in general the same as those used for the Base Case of the MIT (2003) study:
compare our Table 5 to the MIT (2003) study’s Table A-5.A.4 “Base Case Input
Parameters”. Since our primary objective is to update the capital cost used in the MIT
(2003) study, we do not revisit every element of the original inputs. We model a plant
with a capacity of 1,000 MW, a capacity factor of 85%, and a life of 40 years. The heat
rate is 10,400 Btu/kWh. Based on the results of the previous analysis, we assume that this
plant has an overnight cost in 2007 dollars of $4,000. We set the incremental capital
4 The spreadsheet model for calculating levelized costs is available at the website of the MIT Center for Energy and Environmental Policy Research: web.mit.edu/ceepr/www/workingpapers.html.

Page 19
expenditures to maintain the same ratio of incremental capital cost to overnight cost as
was used in the MIT (2003) study, giving us $40/kW/year. We adjust the fixed and
variable O&M costs from the MIT (2003) study to reflect the 10% decline in reported
O&M costs between 2002 and 2007 documented by the US Energy Information
Administration (US EIA), so that our fixed O&M cost is $56/kW/year and our variable
O&M cost is 0.42 mills/kWh.
We adjust the fuel cost from the MIT (2003) study to reflect most importantly a
higher price for uranium – $80/kgHM – and a higher price for SWUs – $160/SWU – both
measured in 2007 dollars. We also assume a price of $6/kgHM for yellow cake
conversion and $250/kgHM for fabrication of uranium-oxide fuel. We assume 0.2% loss
at each of the stages of conversion, enrichment and fabrication. Using the methodology
described in Appendix 5 of the MIT (2003) study, we derive an optimum tails assay of
0.24%, an initial uranium feed of 9.08 kgU and a requirement of 6.99 SWUs. We assume
the plant is operated at a burn-up of 50 MWd/kgHM. This yields a fuel cost of 6.97
mil/kWh or $0.67/mmBtu.
For the cost of disposal of the spent fuel waste, we follow the MIT (2003) study
and use the statutory fee of 1 mill/kWh currently charged under the Nuclear Waste Policy
Act of 1982. The MIT (2003) study had assumed a $350 million cost to decommission
the plant at the end of its life. We adjust this to maintain the same ratio of
decommissioning cost to overnight cost as was used in the MIT (2003) study, giving us
the figure of $700 million, expressed in 2007 dollars. Consistent with the MIT (2003)
study, we assume a 3% general inflation rate and that real non-fuel O&M costs escalate at
1% while real fuel costs escalate at 0.5%. The tax rate assumed is 37%.

Page 20
To be consistent with the MIT (2003) study, we calculate present values using a
50/50 debt/equity ratio, an 8% cost of debt, and a 15% cost of equity. These imply a 10%
weighted average cost of capital (WACC) which should be applied to the project’s
unlevered after-tax cash flows to yield the net present value.5 It is important to
understand that these costs of capital are meant to reflect a “merchant model” in which
the nuclear plant delivers power into a competitive wholesale market without any assured
rate of return. A nuclear plant built by a regulated utility, with the construction costs
approved and passed along to customers with greater certainty could probably be
financed at a lower cost of capital. This would reflect the fact that some of the
construction, completion, operating and price risks are being shared between the
shareholders in the regulated utility and the customers of the regulated utility. The total
risks are the same, but in the merchant model the shareholders bear all of the risk. Our
calculation also does not include any of the benefits from the production tax credits or
loan guarantees provided to the first new builds under the Energy Policy Act of 2005.
The MIT (2003) study applied a lower capital cost to evaluate coal-fired and gas-
fired generation, assuming a 60/40 debt/equity ratio, an 8% cost of debt, and a 12% cost
of equity, implying a 7.8% weighted average cost of capital (WACC). As a variation on
its base case, the MIT (2003) study evaluated the cost of nuclear applying to nuclear this
5 There is one important difference between our calculations and those of the MIT (2003) study relating to how the cost of capital is employed. The MIT (2003) study applied the cost of debt to the debt cash flows and the cost of equity to equity cash flows. The debt and equity cash flows were calculated assuming a given amortization schedule over the life of the project. Unfortunately, this means that a constant cost of equity capital was applied despite a changing debt-to-equity ratio and therefore a changing level of risk in the debt. Implicitly, this implied an increasing risk premium applied through time for the total nuclear cash flows. This raised the levelized cost of electricity, and accounts for a significant portion of the discrepancy between the levelized cost of electricity calculated in the MIT (2003) study and the cost calculated in other studies—see Osouf (2007). In our calculations, the WACC is applied directly to the unlevered after-tax cash flows, so that the risk premium is effectively held constant through the life of the project. Were all of the inputs held constant, this change in methodology would lower the calculated levelized cost of electricity.
Page 21
lower cost of capital, and we do so as well here. Also consistent with the MIT (2003)
study, we assume the 5-year construction schedule and the 15-year MACRS depreciation
schedule as shown in Table 5.
Table 6A shows how these assumptions generate the time profile of itemized pre-
tax cost cash flows, as well as depreciation, over the full life of the plant. These values
are nominal in the years expended, so that they incorporate the different escalation
factors. Table 6B shows the after-tax cash flows. We have summed the cost of
construction together with the associated depreciation tax shield. We have summed the
incremental capital cost together with the decommissioning cost, and we have calculated
the after-tax cost for these items as if they were immediately expensed – i.e., without
fully accounting for the time profile of the associated depreciation tax shields. We have
summed the cost of fuel together with the waste fee, i.e., the cost of disposing of the fuel,
producing a full fuel cycle charge. The final column displays the total of these various
after-tax costs. Table 6C shows the present value of each of these after-tax cost items.
Consistent with the MIT (2003) study, we have made the year of completion, 2013, date
0 and all present value calculations are made accordingly so that net present values are
measured to 2013. It is a trivial matter to recalculate them to 2007 as is done at the
bottom of the table for the convenience of the reader. The present value of the total costs
is $6,381 million. The 2013 present value of the overnight construction cost net of
depreciation tax shields equal $4,603 million, or 72% of the total cost. Adding in the
incremental capital cost over the life of the plant, plus the decommissioning cost makes
the total after-tax capital cost $5,051 million, or 79% of the total after-tax cost. Non-fuel
operating and maintenance costs total $699 million, or just 11% of the total cost. Fuel
Page 22
costs, inclusive of the waste disposal charge, total $631 million, or just 10% of the total
cost.
Table 6D calculates the levelized cost of electricity from nuclear power. Setting a
price of 8.4¢/kWh in 2007 dollars, column [D] shows the price through time, column [E]
shows the after-tax revenue from the sale of electricity expressed in nominal dollars as
earned. Column [F] calculates the present value of this revenue. Column [G] shows the
present value of the total costs, taken from Table 6C, and column [H] shows the present
value of the net cash flow. A price of 8.4¢/kWh yields a present value of after-tax
revenues equal to the present value of after-tax costs, and so 8.4¢/kWh is the levelized
cost of electricity from nuclear power measured in 2007 dollars. Applying the
percentages derived at the bottom of Table 6C, we have that capital costs account for
79% of this levelized cost of electricity, or 6.6¢/kWh, non-fuel O&M costs account for
11%, or 0.9¢/kWh, and fuel costs, inclusive of waste disposal, account for 10%, or
0.8¢/kWh.
As mentioned earlier, we consider a variation on the cost of capital for nuclear,
setting the inputs for the cost of capital equal to those for coal. Using this lower cost of
capital and repeating the steps shown in Tables 6A-6D lowers the levelized cost of
electricity by approximately 1.7¢/kWh, bringing the total cost of nuclear power down to
6.6¢/kWh (¢/kWh figures do not sum due to rounding).
4. COMPARISON TO COAL- AND GAS-FIRED GENERATION COSTS
While the focus of this study is an update of the cost of building nuclear power
plants, it is important to see the escalation in the cost of nuclear plants in comparison
with the escalation in the cost of other power plants. The MIT (2003) study compared the
Page 23
levelized cost of electricity from nuclear plants against the levelized cost of electricity
from pulverized coal plants and from combined cycle gas turbine plants. In this section
we develop the revised estimates for the constructing coal- and gas-fired plants, and we
calculate the corresponding levelized cost of electricity.
Updated Coal Plant Costs
The MIT (2003) Future of Nuclear Power study estimated a $1,300/kW capital
cost, denominated in 2002 dollars, for a 1,000 MW pulverized coal burning power plant.
The MIT (2007) Future of Coal study evaluated a broader set of coal-fired designs,
including sub-critical pulverized coal, supercritical and ultra-supercritical pulverized
coal, as well as circulating fluid-bed, with capital costs ranging from $1,280/kW to
$1,360/kW, denominated in 2005 dollars. How have capital costs changed since then? To
answer this question, we look to a small sample of proposed plants for which it was
possible to obtain a minimal amount of detail on what was included in the cost estimate
and in which year’s dollars it was denominated. We limit our focus to super- and ultra-
supercritical pulverized coal plants. Table 7 shows our estimate of the standardized
overnight cost at each plant, denominated in 2007 dollars. In the paragraphs that follow,
we discuss each plant, the source data and how we produced our standardized overnight
cost estimate.
The reported cost of constructing a coal-fired power plant can suffer from the
same ambiguity that we earlier identified for the reported cost of nuclear power plants.
Because the construction time for a coal-fired plant is typically shorter than for a nuclear
power plant, the impact of inflation and of financing costs results in a smaller
discrepancy between some of the quotation methods, but otherwise the problems are the

Page 24
same. Assuming a four-year construction schedule, our overnight cost figure for a coal-
fired plant is 20% more than the overnight cost reflecting only vendor costs, 14% less
than the utility’s total cost as reported in regulatory filings, exclusive of financing
charges, and 27% less than the utility’s total cost as reported in regulatory filings,
inclusive of financing charges.
Shortly before FPL filed for approval of its Turkey Point nuclear units, it had
proposed a pair of ultra-supercritical pulverized coal plants to be built at a new Glades
Power Park. Although the Florida Public Service Commission ultimately rejected the
proposed plant, the cost estimate made is, nevertheless a useful indicator of what the
plant was believed to cost at the time the estimate was made. And the fact that FPL’s
Glades coal plant estimate and its Turkey Point nuclear plant estimate were made at
approximately the same time and by the same company gives the coal plant estimate
added interest. FPL’s Determination of Need filing for the coal units was made in
February 2007. Each unit would have a capacity of 980 MW. The units were to be
designed to burn bituminous coal, although up to 20% of the fuel supplied could be
petroleum coke. The first unit was to be constructed over a 52 month schedule ending
with commercial operation in June 2013. As with the Turkey Point nuclear units, the total
estimated cost of $5.7 billion includes major transmission network upgrades and
financing costs, and the figure is denominated in a combination of 2013 and 2014 dollars.
We back out one-half the transmission costs and all of the financing costs, which yields a
total cost as expended of $4.424 billion. Backing out the effect of the 3% estimated
inflation yields an overnight cost denominated in 2007 of $3,804 billion, or $1,941/kW.

Page 25
In May 2005, Duke Power announced its intention to build one or two
supercritical pulverized coal units of 800 MW capacity each at its Cliffside station in
North Carolina. The units were planned for bituminous coal. Construction on the first
unit was originally tentatively projected to begin September 2006 with commercial
operation starting as soon as 2010, although in updated filings Duke estimated a
construction schedule for the first unit of approximately 50 months. Duke Power’s
original press release estimated the total cost at $2 billion. Ultimately, only one unit was
approved and, according to Duke’s latest filing in February 2008, the cost for the single
unit had climbed to $1.8 billion, exclusive of $550-600 million in financing charges. This
figure, too, needs to be adjusted to convert it to an overnight cost denominated in 2007
dollars by backing out inflation, which yields us an estimated overnight cost of $1.548
billion, or $1,935/kW. Construction on this unit began early in 2008.
In October 2005, American Municipal Power-Ohio (AMP-Ohio) had first
announced plans to build a new pulverized coal project in Meigs County, Ohio. AMP-
Ohio is a non-profit corporation organized to own and operate electric power plants and
other facilities on behalf of its members which are public power entities in Ohio,
Pennsylvania, Michigan, Virginia, West Virginia and Kentucky. The project is actually
composed of two 480 MW units – i.e., a total capacity of 960 MW – operating at an
annual capacity factor of 85%. The units are designed to burn a blend of bituminous and
sub-bituminous coals. In May 2007, it submitted a detailed application for a certification
of need to build the combined plant, including an estimated cost of $2.3 billion. This
figure was inclusive of owner’s costs and transmission upgrades, but exclusive of
financing costs. Financing costs would add an additional $400 million or 17% to the
Page 26
costs. Subsequently, the construction schedule and cost figures were significantly revised.
In January 2008, its contractor, R.W. Beck, produced a Project Feasibility Study Update
which revised the cost to $2.95 billion. In October 2008, the contractor produced a new
Update with a revised construction schedule and cost estimate: the total cost is now
estimated at $3.257 billion, exclusive of financing costs. The financing costs are
estimated at an additional $683 million or 21% of the costs. This most recent estimate
assumes construction begins in October 2009 and the first unit begins commercial
operation in March 2014, 54 months later, while the second unit begins commercial
operation in September 2014. The estimate is for a supercritical boiler. Although the
plant will have the capability to handle both bituminous and sub-bituminous (Powder
River Basin) coals, the plant is being optimized for bituminous coals and the cost
estimate reflects this. This cost estimate appears to be a total of dollars denominated in
the years actually expended, reflecting a forecasted 2.3% inflation rate. A comparable
overnight cost denominated in 2007 dollars needs to back out the effect of this inflation
in the total cost reported. Also, this cost estimate includes an unknown quantity of
transmission system upgrades, some of which are arguably unrelated to the busbar cost.
Unfortunately, the actual amount of transmission system costs is not itemized, and it is
impossible to determine what fraction should be backed out of the figure. Therefore, we
arrive at an estimated total overnight cost in 2007 dollars of $2.866 billion, or
$2,986/kW. This is probably a high estimate due to the unknown extra transmission
related costs included.
The Southwestern Electric Power Company (SWEPCO) is a unit of American
Electric Power Company (AEP) operating in Louisiana, Arkansas and Texas. In late

Page 27
2006, the company announced its plan to build a 600 MW ultra-supercritical pulverized
coal plant in Hempstead County, Arkansas. It would burn Powder River Basin coal, i.e.,
sub-bituminous. Construction time is estimated at 48 months. The estimated cost of the
plant was originally $1.343 billion, although the estimate has since risen to $1.558
billion. These estimates exclude financing charges and include only those transmission
expenses necessary for connection. However the dollars summed are denominated in the
years expended, and so require an adjustment to be expressed in 2007 dollars. Assuming
a 2.3% inflation rate gives us an estimated overnight cost expressed in 2007 dollars of
$1.371 billion, or $2,285/kW. The plant has received approvals from the three state
utilities commissions, as well as the environmental permits it requires, and SWEPCO is
moving forward targeting commercial operation in 2012.
Across the four plants, the overnight cost estimates range from just under
$2,000/kW to just over $3,000/kW. This is a large range. As a central value for our
comparisons, we choose to use $2,300/kW in 2007 dollars. Compared to the MIT (2003)
figure of $1,300/kW in 2002 dollars, this represents an annual inflation rate of 12% in the
capital cost for a coal-fired power plant – slightly less than the 15% rate for nuclear
capital costs. Figure 3 shows the original MIT (2003) estimate together with an escalation
at the 3% per annum that matches the GDP deflator and an escalation at the 15% per
annum corresponding to the escalation of nuclear costs. Of the four plants, only one had a
cost higher than implied by this 15% escalation. The others lie below this level, but
clearly above the cost implied by escalation at the GDP deflator. Even the lowest of our
four plant costs is higher than the figure given by the EIA for the overnight cost of a
“Scrubbed Coal New” plant, which for 2007 is $1,534/kW in 2006 dollars. Assuming an
Page 28
increase of 12% to bring it to 2007 dollars, the EIA figure would be $1,719/kW.
However, our central estimate is very close to the EPRI (2008) figure of $2,450/kW for a
conventional supercritical pulverized coal plant.
Updated Cost of Coal
The MIT (2003) Future of Nuclear Power had assumed a $1.20/mmBtu price for
coal delivered to the plant, measured in 2002 dollars. Assuming 12,500 Btu coal (e.g.,
Central Appalachian coal), this translates to $30/short ton. Since 2002, the price of coal
has escalated tremendously. Figure 4 shows a graph of the spot price of coal from 1984
through year-end 2008. Between 2002 and 2007, the average annual spot price increased
by 59% in total or nearly 10% per annum. The price of coal delivered to electric utilities
showed a slightly smaller rise of 46%. This smaller increase probably reflects the fact
that much of the coal is delivered under contracts which delay the impact of sharp prices
rises, meaning that the full impact of rising fuel cost is yet to be seen in the delivered
price data. It may also reflect the fact that the portion of the delivered price attributable to
transportation costs did not increase as much. It may also reflect the different rates of
price increases for different types of coal that are averaged together in producing this
delivered price statistic. In 2008, the average spot price of coal nearly doubled again,
exhibiting the same spike and collapse that occurred in the oil, natural gas and other
commodity markets.
Clearly the future price of coal is highly uncertain. Global economic growth and
competition for supplies probably contributed to the secular run-up in prices over the last
few years. The current recession has caused prices to collapse, probably below their long-
run level. Reasonable people will differ on their forecast of the future price, although

Page 29
there should be a consensus that the confidence bounds on the forecast should be large.
As is often done with natural gas, it is probably wise to analyze how the levelized cost of
electricity varies over a broad range of possible future coal prices. As our central estimate
for the price of coal, we use the figure of $2.60/mmBtu or $65/short ton of Central
Appalachian coal delivered to the plant. This is far below the peak 2008 spot price which
was above $130/short ton, but also above the current spot price which has fallen close to
$50/ton. We also calculate how the levelized cost of electricity from coal varies with the
price of coal.
The Levelized Cost of Electricity from Coal
The assumptions for our calculation of the levelized cost of electricity from coal
are displayed in Table 5. We assume the heat rate of 8,870Btu/kW, which is the value
assumed in the MIT (2007) Future of Coal study for supercritical pulverized coal plants.
This value is near the low end of the range for the plants mentioned in Table 7. It is also
at the low end of the EPRI (2008) range for conventional supercritical pulverized coal
plants. This heat rate is lower than the 9,300Btu/kW assumed in the MIT (2003) Future
of Nuclear study, and so we are recognizing some technical performance improvements
associated with the evolving capital costs. We assume that incremental capital
expenditures made during the life of the project will total $27/kW/year. This is the same
ratio of incremental capital cost to overnight cost as was used in the MIT (2003) study.
We adjusted the MIT (2003) study fixed and variable non-fuel O&M costs in the same
fashion as we did earlier for the nuclear plant. According to the US EIA, coal plant O&M
costs increased between 2002 and 2007 by a little less than 6%. Therefore, we applied
this change to the MIT (2003) fixed O&M cost of $23/kW/yr and arrived at a figure of
Page 30
$24/kW/year, and we applied this change to the MIT (2003) variable O&M cost of 3.38
mills/kWh and arrived at a figure of 3.57 mills/kWh.
To be consistent with the MIT (2003) study, we calculate present values using a
60/40 debt/equity ratio, an 8% cost of debt, and a 12% cost of equity. These imply a 7.8%
weighted average cost of capital (WACC) which should be applied to the project’s
unlevered after-tax cash flows to yield the net present value. Also consistent with the
MIT (2003) study, we assume the 4-year construction schedule shown in Table 5. We
apply a twenty-year MACRS depreciation schedule.6
Tables 8A, 8B, 8C and 8D calculate the levelized cost of electricity from the coal-
fired power plant. As shown at the bottom of Table 8C, the 2013 present value of total
costs is $6,226 million. The present value of the overnight construction cost net of
depreciation tax shields equal $2,446 million, or 39% of the total cost. Adding in the
incremental capital cost over the life of the plant makes the total after-tax capital cost
$2,804 million, or 45% of the total after-tax cost. Non-fuel operating and maintenance
costs total $849 million, or 12% of the total cost. Fuel costs total $2,574 million, or 41%
of the total cost.
As shown in Table 8D, these results imply a levelized cost of electricity from coal
of 6.2¢/kWh, measured in 2007 dollars. Capital costs account for 45% of this, or
2.8¢/kWh, non-fuel O&M costs account for 14%, or 0.8¢/kWh, and fuel costs account for
41%, or 2.6¢/kWh.
6 The MIT (2003) study had applied a 15-year schedule to the coal plant. Our understanding is that coal plants are typically depreciated using the longer 20-year schedule.

Page 31
We also calculate the additional cost for coal-fired electricity in the event that
carbon is priced. As shown in Table 5, we assume the coal used has a carbon intensity of
25.8 kg-C/mmBtu, which is identical to what was assumed in the MIT (2003) study.
Given our heat rate assumption, this translates to a CO2 intensity per unit of electricity
produced of 0.839 kgCO2/kWh, which is approximately equal to the figure given in the
MIT (2007) Future of Coal study for a supercritical pulverized coal plant. As a
benchmark we choose a carbon price of $25/tCO2, denominated in 2007 dollars. This
translates to a 2.1¢/kWh additional cost to coal-fired electricity, bringing the total cost
from 6.2¢/kWh up to 8.3¢/kWh.
Every $1/mmBtu change in the initial fuel price translates into slightly less than a
0.98¢/kWh change in the levelized cost of electricity. This is equivalent to saying every
$10/short ton change in the delivered price of coal translates into slightly less than a
0.39¢/kWh change in the levelized cost of electricity. Therefore, if we had assumed a
$50/short ton cost of coal, then our total levelized cost of electricity from coal would
have been 5.6¢/kWh. If we had assumed an $80/short ton cost of coal, then our total
levelized cost of electricity from coal would have been 6.8¢/kWh.
Updated Gas Plant Costs
The MIT (2003) Future of Nuclear Power study estimated a $500/kW capital cost,
denominated in 2002 dollars, for a 1,000 MW gas-fired combined cycle (CCGT) power
plant with a heat rate of 7,200Btu/kW. Earlier, we estimated that the overnight costs for
nuclear had escalated at approximately 15% between 2002 and 2007, and that the
overnight costs for coal-fired power plants had escalated at approximately 12% over the
same time period. These two escalation rates are approximately equal given the types of

Page 32
errors and uncertainties in such estimates. Were a 12% escalation rate to be applied to the
cost of gas, an updated 2007 figure would equal $885/kW.
Since 2002 a number of CCGT plants have been built and a large number have
recently been proposed. One might hope that the greater number of data points would
make an update of the overnight cost for a gas plant a simpler exercise than for nuclear or
for coal, where the data is much sparser. Unfortunately, the range of cost figures
produced for these built plants and for recently proposed plants is very large. A number
of difficulties arise that make it difficult to reduce the range of these figures. First, many
CCGT plants are built as merchant plants, and the detailed information provided in
regulatory filings is often missing. Therefore it can be difficult to scrutinize what has
been included and what has been excluded from reported figures. It is also difficult to be
determine how inflation is factored into the figure. Second, even where regulatory filings
are made, quite often the detail provided is much less for a CCGT plant than for the
larger scale nuclear and coal plants. Where the plants are purchased under relatively fixed
price contracts, the price is considered confidential information and not included in the
regulatory filings. Third, and perhaps most importantly, the range of designs is very wide,
and significant effort must be put into making all of the estimates comparable with one
another.
We reviewed the cost data for the following completed plants: Progress Energy
Florida’s 461MW Hines Energy Complex Unit 4, which was proposed in 2004 for an in-
service date in 2007, the Caithness Energy LLC’s 520MW Blythe Energy Project II in
California, for which a formal cost estimate was filed in 2005 for an in-service date in
2007, Portland General Electric’s 414MW Port Westward plant, which in its final form

Page 33
reported a cost estimate in 2005, for an in-service date of 2007, and Sierra Pacific
Power’s 514MW Tracy, Nevada unit, for which a formal cost estimate was filed in 2005
for an in-service date in 2008. We also reviewed filings for these proposed plants:
PG&E’s 660MW Colusa plant in California, for which an application was filed in 2006
for an in-service date of 2010, Reliant Energy’s 656MW San Gabriel plant in California,
for which an application was filed in 2007 for an in-service date in 2010, Progress Energy
Carolina’s 570MW Richmond plant, for which filings were made in 2008 for an in-
service date in 2011, the Northern California Power Agency’s 255MW Lodi plant, for
which an application was filed in 2008 for an in-service date in 2012, the Competitive
Power Venture’s 660MW Vacaville plant in California, for which an application was
filed in 2008 for an in-service date in 2013, Macquarie’s 600MW Avenal Energy Project
in California, for which an application was filed in 2008 for an in-service date in 2012,
Sierra Pacific Power’s 484MW Harry Allen plant in Nevada, for which filings were made
in 2008 for an in-service date in 2012, and Florida Power & Light’s 1,219 West County
Energy Center Unit 3 plant, for which filings were made in 2008 for an in-service date in
2011.
As mentioned, the designs of these plants vary widely as do the estimated
overnight costs. Table 9 lists each plant, with some of the important information about
plant design. We calculate a raw overnight cost for each plant, escalated to 2007 dollars.
We then make plant specific adjustments for identifiable components that add to the cost
– such as duct firing or dry cooling – and some deductions – for example due to
collocation of the new unit with existing facilities. Unfortunately, these adjustments only
marginally reduce the large disparity in reported costs.

Page 34
As a central estimate for our comparisons, we have chosen an updated overnight
cost for a CCGT plant of $850/kW in 2007 dollars with a heat rate of 6,800. This reflects
a slightly lower level of inflation than for the coal-fired power plant discussed earlier –
11% vs. 12% – and recognizes improvements in technological performance. Three of the
most recently proposed plants have estimated costs above $1,000/kW: Sierra Pacific’s
484MW Harry Allen plant in Nevada with an estimated overnight cost of $1,187/kW, the
Northern California Power Agency’s 255MW Lodi plant with an estimated overnight
cost of $1,069/kW, and Progress Energy Carolina’s 570MW Richmond plant with an
estimated overnight cost of $1,257/kW. NV Energy’s 514MW Tracy plant has an
estimated cost of $999/kW. All of the other recently proposed plants have estimated costs
below $1,000/kW. Our central estimate is slightly above the $800/kW figure that EPRI
(2008) reports for state of the art heavy-duty combustion turbine combined cycle plants,
and indeed even above their $820 figure for advanced designs. This is true despite the
fact that most of the plants we surveyed would not be using the advanced designs – for
example, many of them are based on the GE 7F turbines, and EPRI (2008) categorizes
this as the state-of the art unit with the 7H class being the advanced. Our central estimate
is almost exactly equal to the $847 figure reported by the California Energy Commission
(2007) for comparably designed units. The EIA (2008) reports an overnight cost of
$717/kW for a conventional combined cycle gas plant with a heat rate of 7,196Btu/kW,
and an overnight cost of $706/kW for an advanced combined cycle gas plant with a heat
rate of 6,752Btu/kW, although the document does not clarify the types of units
incorporated under these two designations.

Page 35
The Levelized Cost of Electricity from Gas
The assumptions for our calculation are displayed in Table 5. Many of the
assumptions are identical to those made for the nuclear case, and we won’t comment any
more on these: plant capacity and capacity factor, inflation and real escalation rates, tax
rate and depreciation schedule. We assume that incremental capital expenditures made
during the life of the project will total $10/kW/year. This is the same ratio of incremental
capital cost to overnight cost as was used in the MIT (2003) study. We adjusted the MIT
(2003) study fixed and variable non-fuel O&M costs in the same fashion as we did earlier
for the nuclear and coal plants. According to the US EIA, gas plant O&M costs decreased
between 2002 and 2007 to 79% of their 2002 level. Therefore, we applied this change to
the MIT (2003) fixed O&M cost of $16/kW/yr and arrived at a figure of $13/kW/year,
and we applied this change to the MIT (2003) variable O&M cost of 0.52 mills/kWh and
arrived at a figure of 0.41 mills/kWh.
The price of natural gas fluctuated between 2002 and today, largely in sync with
movements in the crude oil price, but also showing its characteristic additional volatility.
We updated the MIT (2003) base case from $3.50/mmBtu in 2002 dollars to
$7.00/mmBtu in 2007 dollars, which is roughly consistent with what the current level of
futures prices suggest. We discuss how changes in the price of natural gas change the
levelized cost of electricity so that the reader can make his or her own adjustment to the
reported figure according to his or her own views about the future of natural gas prices.
To be consistent with the MIT (2003) study, we calculate present values using a
60/40 debt/equity ratio, an 8% cost of debt, and a 12% cost of equity. These are the same
assumptions as for coal, and they imply a 7.8% weighted average cost of capital

Page 36
(WACC). Also consistent with the MIT (2003) study, we assume the 2-year construction
schedule shown in Table 5. We apply a fifteen-year MACRS depreciation schedule.
Tables 10A, 10B, 10C and 10D calculate the levelized cost of electricity from the
gas-fired power plant. As shown at the bottom of Table 10C, the present value of total
costs at the start of commercial operations at the end of 2013 is $6,482 million. The 2013
present value of the overnight construction cost net of depreciation tax shields equal $822
million, or 13% of the total cost. Adding in the incremental capital cost over the life of
the plant makes the total after-tax capital cost $960 million, or 15% of the total after-tax
cost. Non-fuel operating and maintenance costs total $211 million, or 3% of the total
cost. Fuel costs total $5,312 million, or 82% of the total cost.
As shown in Table 10D, these results imply a levelized cost of electricity from
gas of 6.5¢/kWh, measured in 2007 dollars. Capital costs account for 15% of this, or
1.0¢/kWh, non-fuel O&M costs account for 3%, or 0.2¢/kWh, and fuel costs account for
82%, or 5.3¢/kWh.
We also calculate the additional cost for gas-fired electricity in the event that
carbon is priced. As shown in Table 5, we assume the natural gas used has a carbon
intensity of 14.5 kg-C/mmBtu, which is identical to what was assumed in the MIT (2003)
study. Given our heat rate assumption, this translates to a CO2 intensity per unit of
electricity produced of 0.361 kgCO2/kWh. Using our benchmark carbon price of
$25/tCO2, denominated in 2007 dollars, this translates to a 0.9¢/kWh additional cost to
gas-fired electricity, bringing the total cost from 6.5¢/kWh up to 7.4¢/kWh.
Every $1/mmBtu change in the price of natural gas translates to a 0.76¢/kWh
addition to the levelized cost of electricity. So, for example, if we had assumed a price of
Page 37
natural gas of $8.00/mmBtu, then the levelized cost of electricity from gas would be
7.2¢/kWh.
Page 38
REFERENCES
American Municipal Power-Ohio, Inc., 2007, Application for a Certificate of Environmental Compatibility and Public Need for an Electric Generating Station, Ohio Power Siting Board filing, Case No. 06-1358-EL-BGN, May 4.
California Energy Commission, 2007, Comparative Costs of California Central Station
Electricity Generation Technologies (Cost of Generation Model), presentation by Joel Klein, October 15.
Chubu Electric Power Co., Inc., 2005, Resuming the Commercial Operation of Unit 5 at
the Hamaoka Nuclear Power Plant, January 18. Dow Jones International News, 2006, Japan Starts 55th Electricity-Generating Nuclear
Reactor, 15 March. Duke Power, 2005, News Release: Duke Power Lays Groundwork For Upgraded Power
Portfolio To Meet Growing Customer Demand, May 11. Duke Power, 2005, Preliminary Application for Certificate of Public Convenience and
Necessity, Cliffside Project, North Carolina Utilities Commission filing, Docket No. E-7, Sub 790, May 11.
Duke Power, 2008, Duke Energy Carolina’s Advanced Clean Coal Cliffside Unit 6 Cost
Estimate Report, North Carolina Utilities Commission filing, Docket No. E-7, Sub 790, February 29.
EIA, 2008, Electricity Market Module, DOE/EIA-0554, June. EPRI, 2008, Program on Technology Innovation: Power Generation (Central Station)
Technology Options – Executive Summary, 1017443, Technical Update, July. Florida Power & Light, 2007a, Need Study for Electrical Power, in re: Petition to
Determine Need for FPL Glades Power Park Units 1 and 2 Electrical Power Plant, Florida Public Service Commission filing, Docket No. 07-0098-EI, February 1.
Florida Power & Light, 2007b, Petition to Determine Need for Turkey Point Nuclear
Units 6 and 7 Electrical Power Plant, Florida Public Service Commission filing, Docket No. 07-0650-EI, October 16.
Georgia Power, 2008, Georgia Power’s Application for The Certification of Units 3 and 4
At Plant Vogtle And Updated Integrated Resource Plan, Georgia Public Service Commission filing, Docket No. 27800-U, August 1.
Hokoriku Electric Power Company, 2006, Annual Report for the Year Ending March 31,
2006.

Page 39
IRS, 2007, How to Depreciate Property, Publication 946. Kyodo News, 2004, Tohoku Electric begins test run of 1st reactor at Higashidori plant,
23 December. MIT, 2003, Future of Nuclear Power. MIT, 2007, Future of Coal. NRG, 2008, NRG and Toshiba: EmPowering Nuclear Development in US, presentation
by David Crane, CEO and Chief Executive Officer, March 26. Osouf, Nicolas, 2007, The Potential for a Nuclear Renaissance: The Development of
Nuclear Power Under Climate Change Mitigation Policies, Thesis for Master of Science in Technology and Policy and Master of Science in Nuclear Science and Engineering MIT.
Power in Asia, 2005, KHNP inaugurates Ulchin reactors, 18 August. Progress Energy, 2008, Petition for Determination of Need for Levy Units 1 and 2
Nuclear Power Plants on behalf of Progress Energy Florida, Florida Public Service Commission filing, Docket No. 08-0148-EI, March 11.
Progress Energy, 2009, News Release: Progress Energy Florida Signs Contract for New,
Advanced-Design Nuclear Plant, January 5. R.W. Beck, 2008a, American Municipal Power Generating Station Initial Project
Feasibility Study Update, American Municipal Power-Ohio, Inc., January. Confidential data redacted by AMP-Ohio.
R.W. Beck, 2008b, American Municipal Power Generating Station Initial Project
Feasibility Study October 2008 Update, American Municipal Power-Ohio, Inc., October. Public Version.
SCE&G, 2008, Combined Application for Certificate of Environmental Compatibility,
Public Convenience and Necessity And For a Base Load Review Order, Public Service Commission of South Carolina filing, Docket No. 2008-196-E, May 30.
Southwestern Electric Power Company, 2006a, Application of Southwestern Electric
Power Company for a Certificate of Environmental Compatibility and Public Need for the Construction, Ownership, Operation and Maintenance of a Coal-Fired Baseload Generating Facility in Hempstead County, Arkansas, Arkansas Public Service Commission filing, Docket No. 06-154-U, December.
Page 40
Southwestern Electric Power Company, 2006b, Direct Testimony of James A. Kobyra, P.E. for Southwestern Electric Power Company, Arkansas, Arkansas Public Service Commission filing, Docket No. 06-154-U, December.
Southwestern Electric Power Company, 2008, Supplemental Direct Testimony on
Commissioners’ Issue of James Kobyra, P.E., Public Utilities Commission of Texas filing, Docket No. 33891, April 22.
Tennessee Valley Authority, 2005, New Nuclear Power Plant Licensing Demonstration
Project, ABWR Cost/Schedule/COL Project at TVA’s Bellefonte Site, DE-AI07-04ID14620, August.
Tohoku Electric Power Co., Inc., 2006, Annual Report for the Year Ending March 31,
2006.
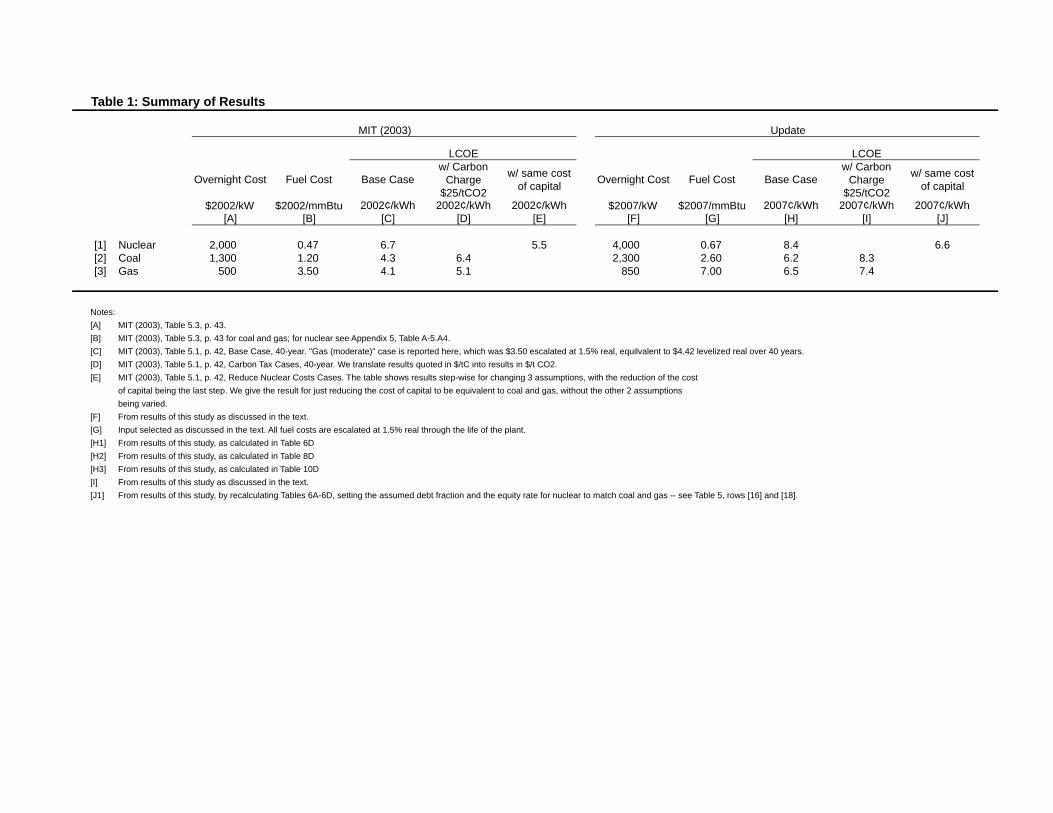
Table 1: Summary of Results
MIT (2003) Update
LCOE LCOE
Overnight Cost Fuel Cost Base Casew/ Carbon
Charge $25/tCO2
w/ same cost of capital
Overnight Cost Fuel Cost Base Casew/ Carbon
Charge $25/tCO2
w/ same cost of capital
$2002/kW $2002/mmBtu 2002¢/kWh 2002¢/kWh 2002¢/kWh $2007/kW $2007/mmBtu 2007¢/kWh 2007¢/kWh 2007¢/kWh[A] [B] [C] [D] [E] [F] [G] [H] [I] [J]
[1] Nuclear 2,000 0.47 6.7 5.5 4,000 0.67 8.4 6.6[2] Coal 1,300 1.20 4.3 6.4 2,300 2.60 6.2 8.3[3] Gas 500 3.50 4.1 5.1 850 7.00 6.5 7.4
Notes:
[A] MIT (2003), Table 5.3, p. 43.
[B] MIT (2003), Table 5.3, p. 43 for coal and gas; for nuclear see Appendix 5, Table A-5.A4.
[C] MIT (2003), Table 5.1, p. 42, Base Case, 40-year. "Gas (moderate)" case is reported here, which was $3.50 escalated at 1.5% real, equilvalent to $4.42 levelized real over 40 years.
[D] MIT (2003), Table 5.1, p. 42, Carbon Tax Cases, 40-year. We translate results quoted in $/tC into results in $/t CO2.
[E] MIT (2003), Table 5.1, p. 42, Reduce Nuclear Costs Cases. The table shows results step-wise for changing 3 assumptions, with the reduction of the cost
of capital being the last step. We give the result for just reducing the cost of capital to be equivalent to coal and gas, without the other 2 assumptions
being varied.
[F] From results of this study as discussed in the text.
[G] Input selected as discussed in the text. All fuel costs are escalated at 1.5% real through the life of the plant.
[H1] From results of this study, as calculated in Table 6D
[H2] From results of this study, as calculated in Table 8D
[H3] From results of this study, as calculated in Table 10D
[I] From results of this study as discussed in the text.
[J1] From results of this study, by recalculating Tables 6A-6D, setting the assumed debt fraction and the equity rate for nuclear to match coal and gas -- see Table 5, rows [16] and [18].

Table 2: Alternative Cost Quotation Methods for Nuclear Power Plants Illustrated with a Hypothetical Example
[A] [B] [C] [D] [E] [F]
[1] Project Period (relative to start) -4 -3 -2 -1 0[2] Year 2009 2010 2011 2012 2013 Total
[3] Construction Schedule as a Fraction of EPC Cost, $2007 10% 25% 31% 25% 10% 100%
[4] Vendor EPC Overnight Cost, $2007 318 833 1,030 833 318 3,333
[5] Vendor EPC Cost, Nominal Dollars as Expended @ 3% Inflation 337 911 1,160 966 380 3,753[6] Owner's Costs, Nominal Dollars as Expended 67 182 232 193 76 751[7] Transmission System Upgrades, Nominal Dollars as Expended 145 57 202
[8] Total Cost, excl. Capital Recovery Charge, Nominal Dollars as Expended 405 1,093 1,391 1,304 513 4,706
[9] Capital Recovery Charge @ 11.5% 47 178 358 549 1,131
[10] Total Cost, incl. Capital Recovery Charge 405 1,139 1,569 1,662 1,062 5,837
[11] Total Cost, incl. Capital Recovery Charge, Cumulative 405 1,544 3,113 4,775 5,837
[12] Total Outlay, Nominal Dollars as Expended 405 1,093 1,391 1,159 456 4,504[13] Total Cost (incl. capital charge), $2013 626 1,515 1,730 1,292 456 5,619
[14] Overnight Cost, $2007 382 1,000 1,236 1,000 382 4,000
[15] Overnight Cost, $2013 456 1,194 1,476 1,194 456 4,776
Notes:
All figures in $/kW.
Example assumes a total EPC overnight cost of $3,333, an inflation rate of 3%, a 20% factor for owner's cost and an allowed capital recovery charge of 11.5%.
Columns [A]-[E]
[3] Rate of expenditures is given.
[4] =$3,333*[3].
[5] =[4]*(1.03)^([2]-2007)
[6] =20%*[5]
[7] Transmission expenditures are given.
[8] =[5]+[6]+[7].
[9] [9B]=[11A]*11.5%, and so on.
[10] =[8]+[9]
[11] [11B]=[11A]+[8B]+[9B].
[12] =[5]+[6]
[13] =[12]*(1.115)^(2013-[2])
[14] =[12]*(1.03)^(2007-[2])
[15] =[12]*(1.03)^(2013-[2])

Table 3A: Overnight Costs for Actual Builds in Japan and Korea 1994-2002, per MIT (2003) Future of Nuclear Power Study
Total Project Cost Overnight Cost
Owner Name of Plant Design Capacity Commercial Domestic Currency PPP US Equivalent Overnight Cost US 2002 Inflation US 2007MW Operation Date millions Factor $/kW Factor $/kW Factor $/kW
[A] [B] [C] [D] [E] [F] [G] [H] [I] [J] [K] [L]
[1] Tohoku Electric Onagawa 3 BWR 825 2002 314 158 2,409 90% 2,168 2.00 4,336[2] Kyusyu Electric Genkai 3 PWR 1,180 1994 525 158 2,818 90% 2,536 2.00 5,072[3] Kyusyu Electric Genkai 4 PWR 1,180 1997 427 158 2,288 90% 2,059 2.00 4,118[4] TEPCO Kashiwazaki-Kariwa 6 ABWR 1,356 1996 433 158 2,020 90% 1,818 2.00 3,636[5] TEPCO Kashiwazaki-Kariwa 7 ABWR 1,356 1997 384 158 1,790 90% 1,611 2.00 3,222[6] KHNP Yonggwang 5&6 PWR 2,000 2001-2002 3,988 867 2,300 78% 1,800 2.00 3,600
Notes:
Data is taken from the MIT Future of Nuclear Power study, Appendix 5.B Nuclear Power Plant Construction Costs, except adjustment to 2007 dollars, columns [K] and [L] and overnight cost factor for Japan, column [I], rows [1]-[5].
[H] =[F]*1,000,000/[D]/[G].
[I] This adjusts for the inflation embedded in total project costs which sum expenditures made in different years. See Table 2 and related discussion. Overnight cost factor for Japan is our estimate as the MIT Future of Nuclear Power
study does not provide this. Overnight cost factor for Korea is implicitly provided in the MIT Future of Nuclear Study since both the total cost and the overnight cost are reported: 78%=1,800/2,300.
[J] =[H]*[I].
[K] Inflation factor is approx. 15% per annum, based on results in this paper.
[L] =[J]*[K].
Table 3B: Overnight Costs for Actual Builds in Japan and Korea 2004-2006
Total Project Cost Overnight Cost
Owner Name of Plant Design Capacity Commercial Domestic Currency PPP US Equivalent Overnight Cost US var. yrs. Inflation US 2007MW Operation Date millions Factor $/kW Factor $/kW Factor $/kW
[A] [B] [C] [D] [E] [F] [G] [H] [I] [J] [K] [L]
[7] Chubu Electric Hamaoka-5 ABWR 1,325 2004 360 134 2,023 90% 1,820 1.52 2,759[8] Tohoku Electric Higashidori-1 BWR 1,067 2005 390 130 2,821 90% 2,539 1.32 3,351[9] Hokuriku Electric Shika-2 ABWR 1,304 2006 370 124 2,280 90% 2,052 1.15 2,357[10] KHNP Ulchin-5 OPR 995 2004 2,236 794 2,830 78% 2,215 1.52 3,357[11] KHNP Ulchin-6 OPR 994 2005 2,234 789 2,849 78% 2,229 1.32 2,942
Notes:
[A]-[F] are assembled from corporate press releases and annual reports as described in the text.
Hamaoka 5 cost figure is taken from Chubu Electric Power website.
Higashidori 1 cost figure is from Kyodo News (2004), which was corroborated against the Tohoku Electric Annual Report for 2006, p. 41, change in account for Nuclear power plant and equipment.
Shika 2 cost figure is from Dow Jones International News (2006), which was corroborated against the Hokoriku Electric Power Company Annual Report for 2006, p. 20, change in account for Nuclear power plant and equipment.
Ulchin 5&6 figures are from press report: Power in Asia (2005). Costs are reported in aggregate for units 5&6 combined (4.47 trillion Won), and we have allocated the costs according to capacity.
[G] PPP factors are from the OECD for the respective countries and the commercial operation dates. See www.oecd.org/std/ppp.
[H] =[F]*1,000,000/[D]/[G].
[I] Overnight cost factors from Table 3A.
[J] =[H]*[I].
[K] Inflation factor is approx. 15% per annum, based on results in this paper.
[L] =[J]*[K].

Table 4: Overnight Costs for Some Proposed Nuclear Plants in the US
Owner Name of Plant Design Capacity
Projected Commercial
Operation DateOvernight Cost
in 2007MW US $/kW
[A] [B] [C] [D] [E] [F]
[1] TVA study Bellefonte ABWR 1,371 N/A 2,930[2] FPL Turkey Point 5 & 6 ESBWR 3,040 2018-2020 3,530[3] Progress Energy Levy County 1 & 2 AP1000 2,212 2016-2017 4,206[4] SCEG/Santee-Cooper V.C. Summer 2 & 3 AP1000 2,234 2016-2019 3,787[5] Southern Plant Vogtle 2 units AP1000 2,200 2016-2017 4,745[6] NRG South Texas 3 & 4 ABWR 2,700 2014-2015 3,480
Sources for columns [A]-[E]:
[1] Tennessee Valley Authority (2005), pp. 1-6.
[2] Florida Power & Light (2007b), p. 81, Table V.A.5.1.
FPL's proposal leaves open the option of building either 2 AP100s or 2 EBWRs. The overnight cost estimate shown for the
two designs is the same. However, the estimate was constructed starting from the TVA study which used the ABWR
design, and it was based on adjustments from that design to the ESBWR.
[3] Progress Energy (2008).
[4] SCE&G (2008) Exhibit F, Chart A.
[5] Georgia Power (2008), pp. 14 and 57.
[6] NRG (2008) and NRG fact sheet for South Texas Project Unit 3 & 4 Expansion.
Notes for column [F]:
[1] EPC overnight cost of $1,611denominated in 2004 dollars.
The $1,611 figure is incremented by 20% for owner's cost and for inflation @15% per year: $2,930=$1,611 * (1.2) * (1.52)
[2] The average across cases A-C, exclusive of transmission costs is
$3,530/kW. The figure is an overnight cost denominated in 2007 dollars, so no additional adjustment is made.
[3] Appendix last page, "New Nuclear Plant Modeling Information, Capital Cost Estimate for
Strategist Modeling." "Unit Overnight Total Cost" shown is $9,303,579. $4,206=$9,303,579/2,212.
The figure is an overnight cost denominated in 2007 dollars, so no additional adjustment is made.
[4] Anticipated Construction Schedule shows anticipated plants costs as incurred, as well as transmission and financing
charges. We take only the plant costs, which total $5,411,067 in nominal dollars inflated as expended. We back out
the approx. 2.81% annual inflation to arrive at a an overnight cost in 2007$ of $4,652,551. This represents only SCE&G's
55% share of the total plant cost, so we calculate the total to be $8,459,184. Then, $3,787=$8,459,184/2,234.
[5] Estmated in-service cost of $6,446,564,927. This is the cost for Georgia Power's 45.7% share.
The total cost for the project is therefore $14.107=$6.447/0.457. This is a total cost as incurred which
reflects inflation. We back this out assuming the same schedule and inflation assumptions as for SCE&G, and therefore
estimate the overnight cost in 2007 dollars as 74% of this total cost as incurred: $10.439=$14.107 * 74%.
Then, $4,745=$10,439,344/2,200.
[6] $3,480=$2,900 * (1.2).

Table 5: Base Case Assumptions and Inputs for the Levelized Cost of Electricity
Input Units Nuclear Coal Gas
[A] [B] [C]
[1] Capacity MW 1,000 1,000 1,000[2] Capacity Factor 85% 85% 85%[3] Heat rate Btu/kWh 10,400 8,870 6,800[4] Overnight Cost $/kW 4,000 2,300 850[5] Incremental capital costs $/kW/year 40 27 10[6] Fixed O&M Costs $/kW/year 56 24 13[7] Variable O&M Costs mills/kWh 0.42 3.57 0.41[8] Fuel Costs $/mmBtu 0.67 2.60 7.00[9] Waste fee $/kWh 0.001[10] Decommissioning cost $ million 700[11] Carbon intensity kg-C/mmBtu 25.8 14.5
[12] Inflation Rate 3.0% 3.0% 3.0%[13] O&M real escalation 1.0% 1.0% 1.0%[14] Fuel real escalation 0.5% 0.5% 0.5%
[15] Tax Rate 37% 37% 37%[16] Debt fraction 50% 60% 60%[17] Debt rate 8% 8% 8%[18] Equity rate 15% 12% 12%[19] WACC (weighted avg cost of capital) 10.0% 7.8% 7.8%
[20] Construction ScheduleYear -5Year -4 10%Year -3 25% 15%Year -2 31% 35%Year -1 25% 35% 50%Year 0 10% 15% 50%
[21] Depreciation ScheduleYear 1 5.00% 3.750% 5.000%Year 2 9.50% 7.219% 9.500%Year 3 8.55% 6.677% 8.550%Year 4 7.70% 6.177% 7.700%Year 5 6.93% 5.713% 6.930%Year 6 6.23% 5.285% 6.230%Year 7 5.90% 4.888% 5.900%Year 8 5.90% 4.522% 5.900%Year 9 5.91% 4.462% 5.910%Year 10 5.90% 4.461% 5.900%Year 11 5.91% 4.462% 5.910%Year 12 5.90% 4.461% 5.900%Year 13 5.91% 4.462% 5.910%Year 14 5.90% 4.461% 5.900%Year 15 5.91% 4.462% 5.910%Year 16 2.95% 4.461% 2.950%Year 17 4.462%Year 18 4.461%Year 19 4.462%Year 20 4.461%Year 21 2.231%
[22] Plant Life 40 years 40 years 40 years

Table 5: Base Case Assumptions and Inputs for the Levelized Cost of Electricity (cont.)
Notes:
Compare to Table A-5.A.4 “Base Case Input Parameters” in the MIT (2003) Future of Nuclear Power study.
[1] Given as in MIT (2003).
[2] Given as in MIT (2003).
[3A] Given as in MIT (2003).
[3B] Input selected based on results in this paper--see text.
[3C] Input selected based on results in this paper--see text.
[4] Input selected based on results in this paper--see text.
[5] Sets the incremental capital costs to the same ratio with the overnight cost as in the MIT (2003) study.
[5A] =(20/2,000)*[4A].
[5B] =(15/1,300)*[4B].
[5C] =(6/500)*[4C].
[6] Adjusts the fixed O&M costs from the MIT (2003) study to reflect the general trend in O&M cost
between 2002 and 2007 as documented by the US Energy Information Administration.
[6A] =63*(1.29/1.44).
[6B] =23*(0.56/0.53).
[6C] =16*(0.49/0.62).
[7] Adjusts the variable O&M costs from the MIT (2003) study to reflect the general trend in O&M cost
between 2002 and 2007 as documented by the US Energy Information Administration.
[7A] =0.47*(1.29/1.44).
[7B] =3.38*(0.56/0.53).
[7C] =0.52*(0.49/0.62).
[8] Input selected based on results in this paper--see text.
[9A] Given as in MIT (2003), consistent with statutory fees.
[10A] Sets the decommissioning cost to the same ratio with the overnight cost as in the MIT (2003) study.
=(350/2,000)*[4A].
[11] Given as in MIT (2003).
[12] Given as in MIT (2003).
[13] Given as in MIT (2003).
[14] Given as in MIT (2003).
[15] Given as in MIT (2003).
[16] Given as in MIT (2003).
[17] Given as in MIT (2003).
[18] Given as in MIT (2003).
[19] =[15]*(1-[14])*[16]+(1-[15])*[17]
[20] Given as in MIT (2003).
[21] Modified Accelerated Cost Recovery System, half-year convention as listed in IRS (2007), Table A-1, p. 71
[21A] 15-year schedule.
[21B] 20-year schedule.
[21C] 15-year schedule.
[22] Given as in MIT (2003).

Table 6A: Cost Cash Flows and Depreciation at a Nuclear Power Plant ($ millions)
Incremental Capital Costs +
PeriodCalendar
Year Construction
Costs Depreciation Decomm.
Cost Non-fuel O&M
costs Fuel Costs Waste fee
[A] [B] [C] [D] [E] [F] [G] [H]
[1] -4 2009 403[2] -3 2010 1093[3] -2 2011 1396[4] -1 2012 1159[5] 0 2013 454[6] 1 2014 225 49 74 66 7[7] 2 2015 428 51 77 68 7[8] 3 2016 385 52 81 71 7[9] 4 2017 347 54 84 73 7[10] 5 2018 312 55 87 76 7[11] 6 2019 281 57 91 79 7[12] 7 2020 266 59 94 81 7[13] 8 2021 266 61 98 84 7[13] 9 2022 266 62 102 87 7[14] 10 2023 266 64 106 90 7[15] 11 2024 266 66 110 93 7[16] 12 2025 266 68 115 97 7[17] 13 2026 266 70 120 100 7[18] 14 2027 266 72 124 104 7[19] 15 2028 266 74 129 107 7[20] 16 2029 133 77 135 111 7[21] 17 2030 79 140 115 7[22] 18 2031 81 146 119 7[23] 19 2032 84 152 123 7[24] 20 2033 86 158 128 7[25] 21 2034 89 164 132 7[26] 22 2035 92 171 137 7[27] 23 2036 94 177 141 7[28] 24 2037 97 185 146 7[29] 25 2038 100 192 152 7[30] 26 2039 103 200 157 7[31] 27 2040 106 208 162 7[32] 28 2041 109 216 168 7[33] 29 2042 113 225 174 7[34] 30 2043 116 234 180 7[35] 31 2044 119 243 186 7[36] 32 2045 123 253 193 7[37] 33 2046 127 263 200 7[38] 34 2047 130 274 207 7[39] 35 2048 134 285 214 7[40] 36 2049 138 297 222 7[41] 37 2050 143 309 229 7[42] 38 2051 147 321 237 7[43] 39 2052 151 334 246 7[44] 40 2053 2882 347 254 7
Notes:
[C] =overnight cost * capacity * construction schedule(t) * inflation factor(t).
[D] =sum of [C] * depreciation schedule(t).
[E] =incremental capital cost * capacity * inflation factor(t). In the last year the decommissioning cost * inflation factor is added.
[F] = (fixed O&M cost * capacity + variable O&M cost * output) * inflation factor(t).
[G] = fuel cost * heat rate * output * inflation factor(t).
[H] = waste disposal cost * output. This is not inflated, as the nominal value is fixed by statute.
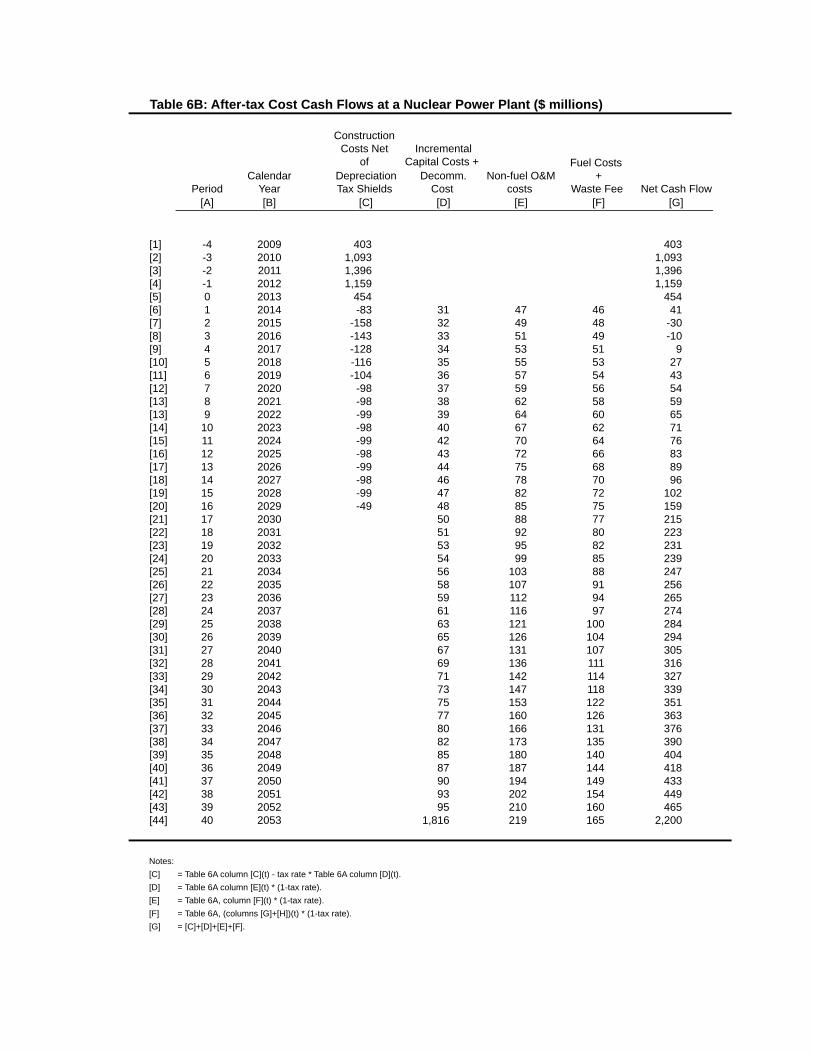
Table 6B: After-tax Cost Cash Flows at a Nuclear Power Plant ($ millions)
Construction Costs Net
of Incremental
Capital Costs + Fuel Costs
PeriodCalendar
Year Depreciation Tax Shields
Decomm. Cost
Non-fuel O&M costs
+ Waste Fee Net Cash Flow
[A] [B] [C] [D] [E] [F] [G]
[1] -4 2009 403 403[2] -3 2010 1,093 1,093[3] -2 2011 1,396 1,396[4] -1 2012 1,159 1,159[5] 0 2013 454 454[6] 1 2014 -83 31 47 46 41[7] 2 2015 -158 32 49 48 -30[8] 3 2016 -143 33 51 49 -10[9] 4 2017 -128 34 53 51 9[10] 5 2018 -116 35 55 53 27[11] 6 2019 -104 36 57 54 43[12] 7 2020 -98 37 59 56 54[13] 8 2021 -98 38 62 58 59[13] 9 2022 -99 39 64 60 65[14] 10 2023 -98 40 67 62 71[15] 11 2024 -99 42 70 64 76[16] 12 2025 -98 43 72 66 83[17] 13 2026 -99 44 75 68 89[18] 14 2027 -98 46 78 70 96[19] 15 2028 -99 47 82 72 102[20] 16 2029 -49 48 85 75 159[21] 17 2030 50 88 77 215[22] 18 2031 51 92 80 223[23] 19 2032 53 95 82 231[24] 20 2033 54 99 85 239[25] 21 2034 56 103 88 247[26] 22 2035 58 107 91 256[27] 23 2036 59 112 94 265[28] 24 2037 61 116 97 274[29] 25 2038 63 121 100 284[30] 26 2039 65 126 104 294[31] 27 2040 67 131 107 305[32] 28 2041 69 136 111 316[33] 29 2042 71 142 114 327[34] 30 2043 73 147 118 339[35] 31 2044 75 153 122 351[36] 32 2045 77 160 126 363[37] 33 2046 80 166 131 376[38] 34 2047 82 173 135 390[39] 35 2048 85 180 140 404[40] 36 2049 87 187 144 418[41] 37 2050 90 194 149 433[42] 38 2051 93 202 154 449[43] 39 2052 95 210 160 465[44] 40 2053 1,816 219 165 2,200
Notes:
[C] = Table 6A column [C](t) - tax rate * Table 6A column [D](t).
[D] = Table 6A column [E](t) * (1-tax rate).
[E] = Table 6A, column [F](t) * (1-tax rate).
[F] = Table 6A, (columns [G]+[H])(t) * (1-tax rate).
[G] = [C]+[D]+[E]+[F].

Table 6C: Valuation of Cost Cash Flows at a Nuclear Power Plant ($ millions)
Construction Costs Net
of
Incremental Capital Costs
+ Fuel Costs
PeriodCalendar
YearDiscount Factor
Depreciation Tax Shields
Decomm. Cost
Non-fuel O&M costs
+ Waste Fee
Net Cost Cash Flow
[A] [B] [C] [D] [E] [F] [G] [H]
[1] -4 2009 1.465 591 591[2] -3 2010 1.332 1,455 1,455[3] -2 2011 1.210 1,689 1,689[4] -1 2012 1.100 1,275 1,275[5] 0 2013 1.000 454 454[6] 1 2014 0.909 -76 28 43 42 37[7] 2 2015 0.826 -131 26 40 40 -25[8] 3 2016 0.751 -107 25 38 37 -7[9] 4 2017 0.683 -88 23 36 35 6[10] 5 2018 0.620 -72 22 34 33 17[11] 6 2019 0.564 -59 20 32 31 24[12] 7 2020 0.513 -50 19 30 29 28[13] 8 2021 0.466 -46 18 29 27 28[13] 9 2022 0.423 -42 17 27 25 27[14] 10 2023 0.385 -38 16 26 24 27[15] 11 2024 0.350 -34 15 24 22 27[16] 12 2025 0.318 -31 14 23 21 26[17] 13 2026 0.289 -28 13 22 20 26[18] 14 2027 0.263 -26 12 21 18 25[19] 15 2028 0.239 -24 11 19 17 24[20] 16 2029 0.217 -11 10 18 16 34[21] 17 2030 0.197 10 17 15 42[22] 18 2031 0.179 9 16 14 40[23] 19 2032 0.163 9 16 13 38[24] 20 2033 0.148 8 15 13 35[25] 21 2034 0.135 8 14 12 33[26] 22 2035 0.122 7 13 11 31[27] 23 2036 0.111 7 12 10 29[28] 24 2037 0.101 6 12 10 28[29] 25 2038 0.092 6 11 9 26[30] 26 2039 0.084 5 11 9 25[31] 27 2040 0.076 5 10 8 23[32] 28 2041 0.069 5 9 8 22[33] 29 2042 0.063 4 9 7 21[34] 30 2043 0.057 4 8 7 19[35] 31 2044 0.052 4 8 6 18[36] 32 2045 0.047 4 8 6 17[37] 33 2046 0.043 3 7 6 16[38] 34 2047 0.039 3 7 5 15[39] 35 2048 0.035 3 6 5 14[40] 36 2049 0.032 3 6 5 13[41] 37 2050 0.029 3 6 4 13[42] 38 2051 0.027 2 5 4 12[43] 39 2052 0.024 2 5 4 11[44] 40 2053 0.022 40 5 4 48
[45] Total NPV (t=2013) 4,603 448 699 631 6,381[46] Item total as % of Project Total 72% 7% 11% 10%
[47] Total NPV (t=2007) 2,595 252 394 356 3,598
Notes:
[C] = 1/(1+WACC)^[A]. WACC is given in Table 5.
[D] = Table 6B column [C] * this Table column [C].
[E] = Table 6B column [D] * this Table column [C].
[F] = Table 6B column [E] * this Table column [C].
[G] = Table 6B column [F] * this Table column [C].
[H] = [D]+[E]+[F]+[G].
[45] = sum [1]-[44].
[46D] = [45D]/[45H], and so on.
[47] = [45]*1/(1+WACC)^(2013-2007). WACC is given in Table 5.

Table 6D: The Levelized Cost of Electricity for a Nuclear Power Plant
Present Value ($ millions)
Net Cost
PeriodCalendar
YearDiscount Factor
Price ($/MW)
After-Tax Revenue ($ millions)
After-Tax Revenue
After-Tax Cash Flow
Net Cash Flow
[A] [B] [C] [D] [E] [F] [G] [H]
[0] -6 2007 1.773 84
[1] -4 2009 1.465 89 591 -591[2] -3 2010 1.332 91 1,455 -1,455[3] -2 2011 1.210 94 1,689 -1,689[4] -1 2012 1.100 97 1,275 -1,275[5] 0 2013 1.000 100 454 -454[6] 1 2014 0.909 103 482 438 37 401[7] 2 2015 0.826 106 497 411 -25 435[8] 3 2016 0.751 109 512 384 -7 391[9] 4 2017 0.683 112 527 360 6 353[10] 5 2018 0.620 116 543 337 17 320[11] 6 2019 0.564 119 559 315 24 291[12] 7 2020 0.513 123 576 295 28 268[13] 8 2021 0.466 126 593 276 28 249[13] 9 2022 0.423 130 611 259 27 231[14] 10 2023 0.385 134 629 242 27 215[15] 11 2024 0.350 138 648 227 27 200[16] 12 2025 0.318 142 668 212 26 186[17] 13 2026 0.289 147 688 199 26 173[18] 14 2027 0.263 151 708 186 25 161[19] 15 2028 0.239 155 730 174 24 150[20] 16 2029 0.217 160 752 163 34 129[21] 17 2030 0.197 165 774 153 42 110[22] 18 2031 0.179 170 797 143 40 103[23] 19 2032 0.163 175 821 134 38 96[24] 20 2033 0.148 180 846 125 35 90[25] 21 2034 0.135 186 871 117 33 84[26] 22 2035 0.122 191 897 110 31 78[27] 23 2036 0.111 197 924 103 29 73[28] 24 2037 0.101 203 952 96 28 69[29] 25 2038 0.092 209 981 90 26 64[30] 26 2039 0.084 215 1,010 84 25 60[31] 27 2040 0.076 222 1,040 79 23 56[32] 28 2041 0.069 228 1,072 74 22 52[33] 29 2042 0.063 235 1,104 69 21 49[34] 30 2043 0.057 242 1,137 65 19 45[35] 31 2044 0.052 249 1,171 61 18 42[36] 32 2045 0.047 257 1,206 57 17 40[37] 33 2046 0.043 265 1,242 53 16 37[38] 34 2047 0.039 273 1,280 50 15 35[39] 35 2048 0.035 281 1,318 47 14 32[40] 36 2049 0.032 289 1,357 44 13 30[41] 37 2050 0.029 298 1,398 41 13 28[42] 38 2051 0.027 307 1,440 38 12 26[43] 39 2052 0.024 316 1,483 36 11 25[44] 40 2053 0.022 325 1,528 34 48 -15
0
[45] Total NPV (t=2013) 6,381 6,381 0
Notes:
Row [0] column [D] is chosen to set row [45] column [H] equal to zero.
[D] = row [0] column [D] * inflation factor(t).
[E] = price(t) * output * inflation factor(t) * (1-tax rate).
[F] = [C]*[E].
[G] = from Table 6C column [H].
[H] = [F]+[G].
[45] = sum [1]-[44].

Table 7: Overnight Costs for Some Planned Coal Plants in the US
Owner Name of Plant Design Fuel CapacityCost at
Completion
Projected Commercial
Operation DateOvernight Cost
in 2007MW million $ US $/kW
[A] [B] [C] [D] [E] [F] [G] [H]
[1] Florida Power & Light Glades USC PC bituminous 1,960 4,424 2013-2014 1,941[2] Duke Energy Cliffside SC PC bituminous 800 1,800 2012 1,935[3] AMP Ohio Meigs Co. SC PC blend 960 3,257 2014 2,986[4] AEP Swepco John W. Turk Jr. USC PC sub-bituminous 600 1,558 2012 2,285
Sources for columns [A]-[G]:
[1] Florida Power & Light (2007a), p. 37, Table III.F.1. .
[2] Duke Power (2005a), (2005b) and (2008).
[3] American Municipal Power-Ohio, Inc. (2007); R.W. Beck (2008a) and (2008b).
[4] Southwestern Electric Power Company (2006a); (2006b); and (2008), p. 20.
Definitions for column [C]:
[1]-[4] USC - ultra-supercritical, SC - supercritical, PC - pulverized coal combustion
Notes for column [H]:
[1] We start by summing the reported power plant costs (incl. land) and 1/2 of transmission costs, which equals $4.424 billion.
To back out the effect of inflation, we multiply by 86%, which is the ratio of this total cost as expended to the overnight cost in 2007 dollars given a 3% inflation rate.
The 3% rate is what FPL used in constructing its estimate, and the 86% figure is derived from the calculations shown in Table 2, with appropriate adjustments
made for the construction schedule of a coal plant.
Therefore the total overnight cost in billions 2007 $ is 3.804=4.424 * 86%. Per kW we have: $1,941/kW=$3,804,210/1,960kW.
[2] Starting with the reported $1.8 billion cost, we apply the same 86% ratio as used in [1] to back out inflation. $1.548=$1.800 * 86%. Then, $1,935=$1,548,000/800.
[3] We start with the reported cost of $3.257 billion. To back out the effect of inflation, we multiply by approx. 88%, which is the ratio of this total cost as expended to
the overnight cost in 2007 dollars given the 2.3% inflation rate used in the RW Beck study and calculated using a version of Table 2.
The result is: 2,866,160=3,257,000 * 88%. Then, $3,081=$2,866,160/960.
Although the unit is being designed for a blend of bituminous and sub-bituminous coals, the R.W.Beck study, when estimating
operating and maintenance costs, that bituminous coals are used.
[4] Starting with the reported cost of $1.558 billion, we apply an approx. 88% ratio to back out inflation: $1,371,040=$1,558,000 * 88%. Then, $2,352=$1,371,040/600.

Table 8A: Cost Cash Flows and Depreciation at a Coal-Fired Power Plant ($ millions)
PeriodCalendar
Year Construction
Costs Depreciation Incremental Capital Costs
Non-fuel O&M costs Fuel Costs
[A] [B] [C] [D] [E] [F] [G]
[1] -4 2009[2] -3 2010 367[3] -2 2011 916[4] -1 2012 944[5] 0 2013 401[6] 1 2014 99 33 67 219[7] 2 2015 190 34 70 227[8] 3 2016 175 35 73 235[9] 4 2017 162 36 76 243[10] 5 2018 150 37 79 251[11] 6 2019 139 38 82 260[12] 7 2020 128 39 85 269[13] 8 2021 119 40 89 279[13] 9 2022 117 41 92 289[14] 10 2023 117 43 96 299[15] 11 2024 117 44 100 309[16] 12 2025 117 45 104 320[17] 13 2026 117 47 108 331[18] 14 2027 117 48 112 343[19] 15 2028 117 49 117 355[20] 16 2029 117 51 121 367[21] 17 2030 117 52 126 380[22] 18 2031 117 54 131 394[23] 19 2032 117 56 137 408[24] 20 2033 117 57 142 422[25] 21 2034 59 59 148 437[26] 22 2035 61 154 452[27] 23 2036 63 160 468[28] 24 2037 64 167 484[29] 25 2038 66 173 501[30] 26 2039 68 180 519[31] 27 2040 70 188 537[32] 28 2041 73 195 556[33] 29 2042 75 203 576[34] 30 2043 77 211 596[35] 31 2044 79 220 617[36] 32 2045 82 228 639[37] 33 2046 84 238 661[38] 34 2047 87 247 684[39] 35 2048 89 257 708[40] 36 2049 92 268 733[41] 37 2050 95 278 759[42] 38 2051 97 290 786[43] 39 2052 100 301 813[44] 40 2053 103 313 842
Notes:
[C] =overnight cost * capacity * construction schedule(t) * inflation factor(t).
[D] =sum of [C] * depreciation schedule(t).
[E] =incremental capital cost * capacity * inflation factor(t).
[F] = (fixed O&M cost * capacity + variable O&M cost * output) * inflation factor(t).
[G] = fuel cost * heat rate * output * inflation factor(t).

Table 8B: After-tax Cost Cash Flows at a Coal-Fired Power Plant
Construction Costs Net
of
PeriodCalendar
Year Depreciation Tax Shields
Incremental Capital Costs
Non-fuel O&M costs Fuel Costs Net Cash Flow
[A] [B] [C] [D] [E] [F] [G]
[1] -4 2009[2] -3 2010 367 367[3] -2 2011 916 916[4] -1 2012 944 944[5] 0 2013 401 401[6] 1 2014 -36 21 42 138 164[7] 2 2015 -70 21 44 143 138[8] 3 2016 -65 22 46 148 150[9] 4 2017 -60 22 48 153 163[10] 5 2018 -56 23 50 158 175[11] 6 2019 -51 24 52 164 188[12] 7 2020 -48 25 54 170 200[13] 8 2021 -44 25 56 176 213[13] 9 2022 -43 26 58 182 222[14] 10 2023 -43 27 60 188 232[15] 11 2024 -43 28 63 195 242[16] 12 2025 -43 28 65 202 252[17] 13 2026 -43 29 68 209 263[18] 14 2027 -43 30 71 216 274[19] 15 2028 -43 31 74 224 285[20] 16 2029 -43 32 76 231 297[21] 17 2030 -43 33 80 240 309[22] 18 2031 -43 34 83 248 321[23] 19 2032 -43 35 86 257 335[24] 20 2033 -43 36 90 266 348[25] 21 2034 -22 37 93 275 384[26] 22 2035 38 97 285 420[27] 23 2036 39 101 295 435[28] 24 2037 41 105 305 451[29] 25 2038 42 109 316 467[30] 26 2039 43 114 327 484[31] 27 2040 44 118 339 501[32] 28 2041 46 123 350 519[33] 29 2042 47 128 363 538[34] 30 2043 48 133 375 557[35] 31 2044 50 138 389 577[36] 32 2045 51 144 402 598[37] 33 2046 53 150 416 619[38] 34 2047 55 156 431 641[39] 35 2048 56 162 446 664[40] 36 2049 58 169 462 688[41] 37 2050 60 175 478 713[42] 38 2051 61 182 495 739[43] 39 2052 63 190 512 765[44] 40 2053 65 197 530 793
Notes:
[C] = Table 8A column [C](t) - tax rate * Table 8A column [D](t).
[D] = Table 8A column [E](t) * (1-tax rate).
[E] = Table 8A, column [F](t) * (1-tax rate).
[F] = Table 8A, (columns [G]+[H])(t) * (1-tax rate).
[G] = [C]+[D]+[E]+[F].

Table 8C: Valuation of Cost Cash Flows at a Coal-Fired Power Plant
Construction Costs Net
of
PeriodCalendar
YearDiscount Factor
Depreciation Tax Shields
Incremental Capital Costs
Non-fuel O&M costs Fuel Costs
Net Cost Cash Flow
[A] [B] [C] [D] [E] [F] [G] [H]
[1] -4 2009 1.352[2] -3 2010 1.254 460 460[3] -2 2011 1.163 1,065 1,065[4] -1 2012 1.078 1,018 1,018[5] 0 2013 1.000 401 401[6] 1 2014 0.927 -34 19 39 128 152[7] 2 2015 0.860 -60 18 38 123 118[8] 3 2016 0.798 -52 17 37 118 120[9] 4 2017 0.740 -44 17 35 113 121[10] 5 2018 0.686 -38 16 34 109 120[11] 6 2019 0.636 -33 15 33 104 120[12] 7 2020 0.590 -28 14 32 100 118[13] 8 2021 0.547 -24 14 31 96 116[13] 9 2022 0.508 -22 13 29 92 113[14] 10 2023 0.471 -20 13 28 89 109[15] 11 2024 0.437 -19 12 27 85 106[16] 12 2025 0.405 -18 12 26 82 102[17] 13 2026 0.376 -16 11 26 78 99[18] 14 2027 0.348 -15 11 25 75 95[19] 15 2028 0.323 -14 10 24 72 92[20] 16 2029 0.300 -13 10 23 69 89[21] 17 2030 0.278 -12 9 22 67 86[22] 18 2031 0.258 -11 9 21 64 83[23] 19 2032 0.239 -10 8 21 61 80[24] 20 2033 0.222 -10 8 20 59 77[25] 21 2034 0.206 -4 8 19 57 79[26] 22 2035 0.191 7 18 54 80[27] 23 2036 0.177 7 18 52 77[28] 24 2037 0.164 7 17 50 74[29] 25 2038 0.152 6 17 48 71[30] 26 2039 0.141 6 16 46 68[31] 27 2040 0.131 6 15 44 66[32] 28 2041 0.121 6 15 43 63[33] 29 2042 0.113 5 14 41 60[34] 30 2043 0.104 5 14 39 58[35] 31 2044 0.097 5 13 38 56[36] 32 2045 0.090 5 13 36 54[37] 33 2046 0.083 4 12 35 52[38] 34 2047 0.077 4 12 33 50[39] 35 2048 0.072 4 12 32 48[40] 36 2049 0.066 4 11 31 46[41] 37 2050 0.062 4 11 29 44[42] 38 2051 0.057 4 10 28 42[43] 39 2052 0.053 3 10 27 41[44] 40 2053 0.049 3 10 26 39
[45] Total NPV (t=2013) 2,446 358 849 2,574 6,226[46] Item total as % of Project Total 39% 6% 14% 41%
[47] Total NPV (t=2007) 1,556 228 540 1,638 3,962
Notes:
[C] = 1/(1+WACC)^[A]. WACC is given in Table 5.
[D] = Table 8B column [C] * this Table column [C].
[E] = Table 8B column [D] * this Table column [C].
[F] = Table 8B column [E] * this Table column [C].
[G] = Table 8B column [F] * this Table column [C].
[H] = [D]+[E]+[F]+[G].
[45] = sum [1]-[44].
[46D] = [45D]/[45H], and so on.
[47] = [45]*1/(1+WACC)^(2013-2007). WACC is given in Table 5.

Table 8D: The Levelized Cost of Electricity for a Coal-Fired Power Plant
Present Value
Net Cost
PeriodCalendar
YearDiscount Factor Price
After-Tax Revenue
After-Tax Revenue
After-Tax Cash Flow
Net Cash Flow
[A] [B] [C] [D] [E] [F] [G] [H]
[0] -6 2007 1.571 62
[1] -4 2009 1.352 66[2] -3 2010 1.254 68 460 -460[3] -2 2011 1.163 70 1,065 -1,065[4] -1 2012 1.078 72 1,018 -1,018[5] 0 2013 1.000 74 401 -401[6] 1 2014 0.927 76 358 332 152 179[7] 2 2015 0.860 78 368 317 118 198[8] 3 2016 0.798 81 379 303 120 183[9] 4 2017 0.740 83 391 289 121 169[10] 5 2018 0.686 86 403 276 120 156[11] 6 2019 0.636 88 415 264 120 144[12] 7 2020 0.590 91 427 252 118 134[13] 8 2021 0.547 94 440 241 116 124[13] 9 2022 0.508 97 453 230 113 117[14] 10 2023 0.471 99 467 220 109 111[15] 11 2024 0.437 102 481 210 106 104[16] 12 2025 0.405 105 495 200 102 98[17] 13 2026 0.376 109 510 192 99 93[18] 14 2027 0.348 112 525 183 95 88[19] 15 2028 0.323 115 541 175 92 83[20] 16 2029 0.300 119 557 167 89 78[21] 17 2030 0.278 122 574 159 86 74[22] 18 2031 0.258 126 591 152 83 70[23] 19 2032 0.239 130 609 146 80 66[24] 20 2033 0.222 134 627 139 77 62[25] 21 2034 0.206 138 646 133 79 54[26] 22 2035 0.191 142 665 127 80 47[27] 23 2036 0.177 146 685 121 77 44[28] 24 2037 0.164 150 706 116 74 42[29] 25 2038 0.152 155 727 111 71 40[30] 26 2039 0.141 160 749 106 68 37[31] 27 2040 0.131 164 771 101 66 35[32] 28 2041 0.121 169 794 96 63 33[33] 29 2042 0.113 174 818 92 60 32[34] 30 2043 0.104 180 843 88 58 30[35] 31 2044 0.097 185 868 84 56 28[36] 32 2045 0.090 190 894 80 54 27[37] 33 2046 0.083 196 921 77 52 25[38] 34 2047 0.077 202 949 73 50 24[39] 35 2048 0.072 208 977 70 48 22[40] 36 2049 0.066 214 1,006 67 46 21[41] 37 2050 0.062 221 1,037 64 44 20[42] 38 2051 0.057 227 1,068 61 42 19[43] 39 2052 0.053 234 1,100 58 41 18[44] 40 2053 0.049 241 1,133 56 39 17
[45] Total NPV (t=2013) 6,226 6,226 0
Notes:
Row [0] column [D] is chosen to set row [45] column [H] equal to zero.
[D] = row [0] column [D] * inflation factor(t).
[E] = price(t) * output * inflation factor(t) * (1-tax rate).
[F] = [C]*[E].
[G] = from Table 8C column [H].
[H] = [F]+[G].
[45] = sum [1]-[44].
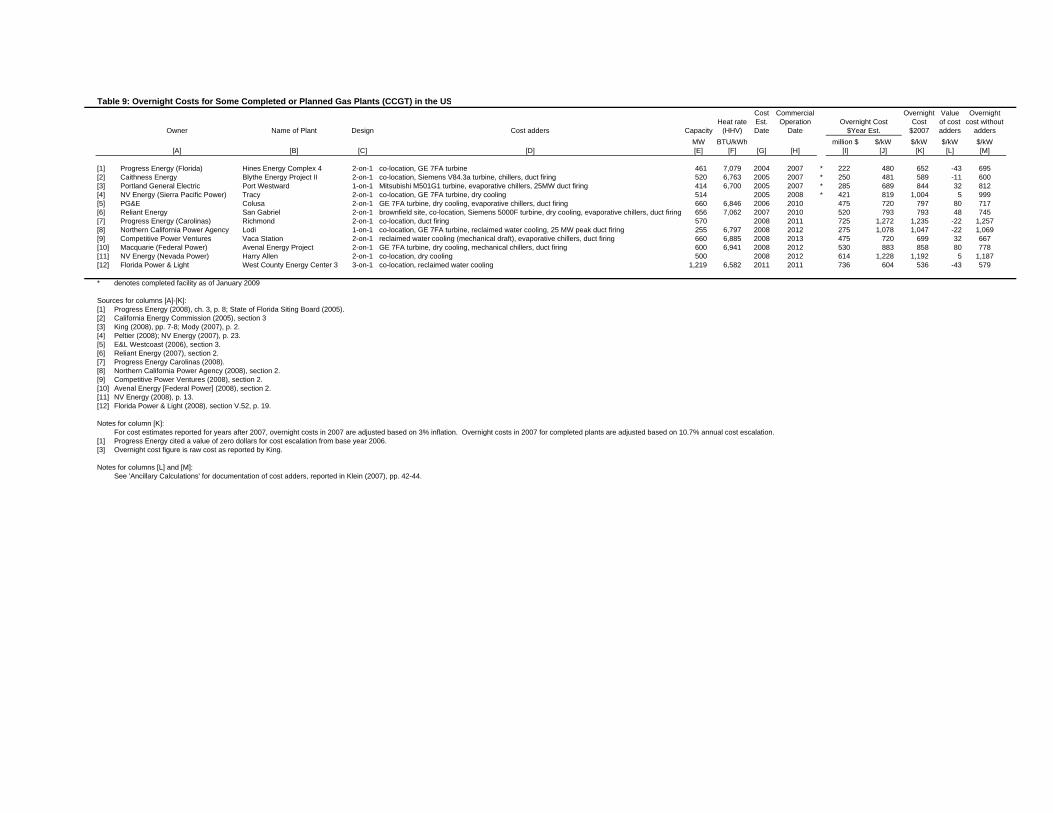
Table 9: Overnight Costs for Some Completed or Planned Gas Plants (CCGT) in the US
Owner Name of Plant Design Cost adders CapacityHeat rate
(HHV)
Cost Est. Date
Commercial Operation
DateOvernight Cost
$Year Est.
Overnight Cost
$2007
Value of cost adders
Overnight cost without
adders
MW BTU/kWh million $ $/kW $/kW $/kW $/kW[A] [B] [C] [D] [E] [F] [G] [H] [I] [J] [K] [L] [M]
[1] Progress Energy (Florida) Hines Energy Complex 4 2-on-1 co-location, GE 7FA turbine 461 7,079 2004 2007 * 222 480 652 -43 695[2] Caithness Energy Blythe Energy Project II 2-on-1 co-location, Siemens V84.3a turbine, chillers, duct firing 520 6,763 2005 2007 * 250 481 589 -11 600[3] Portland General Electric Port Westward 1-on-1 Mitsubishi M501G1 turbine, evaporative chillers, 25MW duct firing 414 6,700 2005 2007 * 285 689 844 32 812[4] NV Energy (Sierra Pacific Power) Tracy 2-on-1 co-location, GE 7FA turbine, dry cooling 514 2005 2008 * 421 819 1,004 5 999[5] PG&E Colusa 2-on-1 GE 7FA turbine, dry cooling, evaporative chillers, duct firing 660 6,846 2006 2010 475 720 797 80 717[6] Reliant Energy San Gabriel 2-on-1 brownfield site, co-location, Siemens 5000F turbine, dry cooling, evaporative chillers, duct firing 656 7,062 2007 2010 520 793 793 48 745[7] Progress Energy (Carolinas) Richmond 2-on-1 co-location, duct firing 570 2008 2011 725 1,272 1,235 -22 1,257[8] Northern California Power Agency Lodi 1-on-1 co-location, GE 7FA turbine, reclaimed water cooling, 25 MW peak duct firing 255 6,797 2008 2012 275 1,078 1,047 -22 1,069[9] Competitive Power Ventures Vaca Station 2-on-1 reclaimed water cooling (mechanical draft), evaporative chillers, duct firing 660 6,885 2008 2013 475 720 699 32 667[10] Macquarie (Federal Power) Avenal Energy Project 2-on-1 GE 7FA turbine, dry cooling, mechanical chillers, duct firing 600 6,941 2008 2012 530 883 858 80 778[11] NV Energy (Nevada Power) Harry Allen 2-on-1 co-location, dry cooling 500 2008 2012 614 1,228 1,192 5 1,187[12] Florida Power & Light West County Energy Center 3 3-on-1 co-location, reclaimed water cooling 1,219 6,582 2011 2011 736 604 536 -43 579
* denotes completed facility as of January 2009
Sources for columns [A]-[K]:[1] Progress Energy (2008), ch. 3, p. 8; State of Florida Siting Board (2005).[2] California Energy Commission (2005), section 3[3] King (2008), pp. 7-8; Mody (2007), p. 2. [4] Peltier (2008); NV Energy (2007), p. 23.[5] E&L Westcoast (2006), section 3. [6] Reliant Energy (2007), section 2. [7] Progress Energy Carolinas (2008).[8] Northern California Power Agency (2008), section 2.[9] Competitive Power Ventures (2008), section 2.[10] Avenal Energy [Federal Power] (2008), section 2.[11] NV Energy (2008), p. 13.[12] Florida Power & Light (2008), section V.52, p. 19.
Notes for column [K]:For cost estimates reported for years after 2007, overnight costs in 2007 are adjusted based on 3% inflation. Overnight costs in 2007 for completed plants are adjusted based on 10.7% annual cost escalation.
[1] Progress Energy cited a value of zero dollars for cost escalation from base year 2006.[3] Overnight cost figure is raw cost as reported by King.
Notes for columns [L] and [M]:See 'Ancillary Calculations' for documentation of cost adders, reported in Klein (2007), pp. 42-44.

Table 10A: Cost Cash Flows and Depreciation at a Gas-Fired Power Plant
PeriodCalendar
Year Construction
Costs Depreciation Incremental Capital Costs
Non-fuel O&M costs Fuel Costs
[A] [B] [C] [D] [E] [F] [G]
[1] -4 2009[2] -3 2010[3] -2 2011[4] -1 2012 493[5] 0 2013 507[6] 1 2014 50 13 17 452[7] 2 2015 95 13 17 468[8] 3 2016 86 13 18 484[9] 4 2017 77 14 19 501[10] 5 2018 69 14 20 519[11] 6 2019 62 15 20 537[12] 7 2020 59 15 21 556[13] 8 2021 59 15 22 575[13] 9 2022 59 16 23 595[14] 10 2023 59 16 24 616[15] 11 2024 59 17 25 638[16] 12 2025 59 17 26 661[17] 13 2026 59 18 27 684[18] 14 2027 59 18 28 708[19] 15 2028 59 19 29 733[20] 16 2029 30 20 30 758[21] 17 2030 20 31 785[22] 18 2031 21 33 813[23] 19 2032 21 34 841[24] 20 2033 22 35 871[25] 21 2034 23 37 901[26] 22 2035 23 38 933[27] 23 2036 24 40 966[28] 24 2037 25 41 1000[29] 25 2038 26 43 1035[30] 26 2039 26 45 1071[31] 27 2040 27 47 1109[32] 28 2041 28 48 1148[33] 29 2042 29 50 1188[34] 30 2043 30 52 1230[35] 31 2044 30 55 1273[36] 32 2045 31 57 1318[37] 33 2046 32 59 1364[38] 34 2047 33 61 1412[39] 35 2048 34 64 1462[40] 36 2049 35 66 1513[41] 37 2050 36 69 1567[42] 38 2051 37 72 1622[43] 39 2052 39 75 1679[44] 40 2053 40 78 1738
Notes:
[C] =overnight cost * capacity * construction schedule(t) * inflation factor(t).
[D] =sum of [C] * depreciation schedule(t).
[E] =incremental capital cost * capacity * inflation factor(t).
[F] = (fixed O&M cost * capacity + variable O&M cost * output) * inflation factor(t).
[G] = fuel cost * heat rate * output * inflation factor(t).

Table10B: After-tax Cost Cash Flows at a Gas-Fired Power Plant
Construction Costs Net
of
PeriodCalendar
Year Depreciation Tax Shields
Incremental Capital Costs
Non-fuel O&M costs Fuel Costs
Net Cash Flow
[A] [B] [C] [D] [E] [F] [G]
[1] -4 2009[2] -3 2010[3] -2 2011[4] -1 2012 493 493[5] 0 2013 507 507[6] 1 2014 -19 8 11 285 284[7] 2 2015 -35 8 11 295 278[8] 3 2016 -32 8 11 305 293[9] 4 2017 -28 9 12 316 308[10] 5 2018 -26 9 12 327 322[11] 6 2019 -23 9 13 338 337[12] 7 2020 -22 9 13 350 351[13] 8 2021 -22 10 14 362 364[13] 9 2022 -22 10 14 375 378[14] 10 2023 -22 10 15 388 392[15] 11 2024 -22 11 16 402 406[16] 12 2025 -22 11 16 416 421[17] 13 2026 -22 11 17 431 437[18] 14 2027 -22 12 18 446 453[19] 15 2028 -22 12 18 462 470[20] 16 2029 -11 12 19 478 498[21] 17 2030 13 20 495 527[22] 18 2031 13 21 512 546[23] 19 2032 13 21 530 565[24] 20 2033 14 22 549 585[25] 21 2034 14 23 568 605[26] 22 2035 15 24 588 627[27] 23 2036 15 25 609 649[28] 24 2037 16 26 630 672[29] 25 2038 16 27 652 695[30] 26 2039 17 28 675 720[31] 27 2040 17 29 699 745[32] 28 2041 18 31 723 771[33] 29 2042 18 32 749 799[34] 30 2043 19 33 775 827[35] 31 2044 19 34 802 856[36] 32 2045 20 36 830 886[37] 33 2046 20 37 860 917[38] 34 2047 21 39 890 949[39] 35 2048 22 40 921 983[40] 36 2049 22 42 953 1,018[41] 37 2050 23 44 987 1,053[42] 38 2051 24 45 1,022 1,091[43] 39 2052 24 47 1,058 1,129[44] 40 2053 25 49 1,095 1,169
Notes:
[C] = Table 10A column [C](t) - tax rate * Table 10A column [D](t).
[D] = Table 10A column [E](t) * (1-tax rate).
[E] = Table 10A, column [F](t) * (1-tax rate).
[F] = Table 10A, (columns [G]+[H])(t) * (1-tax rate).
[G] = [C]+[D]+[E]+[F].

Table 10C: Valuation of Cost Cash Flows at a Gas-Fired Power Plant
Construction Costs Net
of
PeriodCalendar
YearDiscount Factor
Depreciation Tax Shields
Incremental Capital Costs
Non-fuel O&M costs Fuel Costs
Net Cost Cash Flow
[A] [B] [C] [D] [E] [F] [G] [H]
[1] -4 2009 1.352[2] -3 2010 1.254[3] -2 2011 1.163[4] -1 2012 1.078 531 531[5] 0 2013 1.000 507 507[6] 1 2014 0.927 -17 7 10 264 264[7] 2 2015 0.860 -30 7 9 253 240[8] 3 2016 0.798 -25 7 9 243 234[9] 4 2017 0.740 -21 6 9 234 228[10] 5 2018 0.686 -18 6 8 224 221[11] 6 2019 0.636 -15 6 8 215 215[12] 7 2020 0.590 -13 6 8 207 207[13] 8 2021 0.547 -12 5 8 198 199[13] 9 2022 0.508 -11 5 7 190 192[14] 10 2023 0.471 -10 5 7 183 184[15] 11 2024 0.437 -10 5 7 176 177[16] 12 2025 0.405 -9 4 7 169 171[17] 13 2026 0.376 -8 4 6 162 164[18] 14 2027 0.348 -8 4 6 155 158[19] 15 2028 0.323 -7 4 6 149 152[20] 16 2029 0.300 -3 4 6 143 149[21] 17 2030 0.278 0 4 5 137 146[22] 18 2031 0.258 0 3 5 132 141[23] 19 2032 0.239 0 3 5 127 135[24] 20 2033 0.222 0 3 5 122 130[25] 21 2034 0.206 0 3 5 117 124[26] 22 2035 0.191 3 5 112 119[27] 23 2036 0.177 3 4 108 115[28] 24 2037 0.164 3 4 103 110[29] 25 2038 0.152 2 4 99 106[30] 26 2039 0.141 2 4 95 102[31] 27 2040 0.131 2 4 91 97[32] 28 2041 0.121 2 4 88 94[33] 29 2042 0.113 2 4 84 90[34] 30 2043 0.104 2 3 81 86[35] 31 2044 0.097 2 3 78 83[36] 32 2045 0.090 2 3 75 80[37] 33 2046 0.083 2 3 72 76[38] 34 2047 0.077 2 3 69 73[39] 35 2048 0.072 2 3 66 70[40] 36 2049 0.066 1 3 63 68[41] 37 2050 0.062 1 3 61 65[42] 38 2051 0.057 1 3 58 62[43] 39 2052 0.053 1 2 56 60[44] 40 2053 0.049 1 2 54 57
[45] Total NPV (t=2013) 822 138 211 5,312 6,482[46] Item total as % of Project Total 13% 2% 3% 82%
[47] Total NPV (t=2007) 523 88 134 3,380 4,125
Notes:
[C] = 1/(1+WACC)^[A]. WACC is given in Table 5.
[D] = Table 10B column [C] * this Table column [C].
[E] = Table 10B column [D] * this Table column [C].
[F] = Table 10B column [E] * this Table column [C].
[G] = Table 10B column [F] * this Table column [C].
[H] = [D]+[E]+[F]+[G].
[45] = sum [1]-[44].
[46D] = [45D]/[45H], and so on.
[47] = [45]*1/(1+WACC)^(2013-2007). WACC is given in Table 5.

Table 10D: The Levelized Cost of Electricity for a Gas-Fired Power Plant
Present Value
Net Cost
PeriodCalendar
YearDiscount Factor Price
After-Tax Revenue
After-Tax Revenue
After-Tax Cash Flow
Net Cash Flow
[A] [B] [C] [D] [E] [F] [G] [H]
[0] -6 2007 1.571 65
[1] -4 2009 1.352 68[2] -3 2010 1.254 70[3] -2 2011 1.163 73[4] -1 2012 1.078 75 531 -531[5] 0 2013 1.000 77 507 -507[6] 1 2014 0.927 79 372 345 264 82[7] 2 2015 0.860 82 384 330 240 90[8] 3 2016 0.798 84 395 315 234 81[9] 4 2017 0.740 87 407 301 228 73[10] 5 2018 0.686 89 419 288 221 66[11] 6 2019 0.636 92 432 275 215 60[12] 7 2020 0.590 95 445 262 207 55[13] 8 2021 0.547 98 458 251 199 51[13] 9 2022 0.508 100 472 239 192 48[14] 10 2023 0.471 104 486 229 184 44[15] 11 2024 0.437 107 500 219 177 41[16] 12 2025 0.405 110 515 209 171 38[17] 13 2026 0.376 113 531 199 164 35[18] 14 2027 0.348 116 547 190 158 33[19] 15 2028 0.323 120 563 182 152 30[20] 16 2029 0.300 124 580 174 149 25[21] 17 2030 0.278 127 598 166 146 20[22] 18 2031 0.258 131 616 159 141 18[23] 19 2032 0.239 135 634 152 135 17[24] 20 2033 0.222 139 653 145 130 15[25] 21 2034 0.206 143 673 138 124 14[26] 22 2035 0.191 148 693 132 119 13[27] 23 2036 0.177 152 714 126 115 11[28] 24 2037 0.164 157 735 121 110 10[29] 25 2038 0.152 161 757 115 106 9[30] 26 2039 0.141 166 780 110 102 8[31] 27 2040 0.131 171 803 105 97 8[32] 28 2041 0.121 176 827 100 94 7[33] 29 2042 0.113 182 852 96 90 6[34] 30 2043 0.104 187 878 92 86 5[35] 31 2044 0.097 193 904 87 83 5[36] 32 2045 0.090 198 931 84 80 4[37] 33 2046 0.083 204 959 80 76 3[38] 34 2047 0.077 210 988 76 73 3[39] 35 2048 0.072 217 1,017 73 70 2[40] 36 2049 0.066 223 1,048 70 68 2[41] 37 2050 0.062 230 1,079 66 65 2[42] 38 2051 0.057 237 1,112 64 62 1[43] 39 2052 0.053 244 1,145 61 60 1[44] 40 2053 0.049 251 1,179 58 57 1
[45] Total NPV (t=2013) 6,482 6,482 0
Notes:
Row [0] column [D] is chosen to set row [45] column [H] equal to zero.
[D] = row [0] column [D] * inflation factor(t).
[E] = price(t) * output * inflation factor(t) * (1-tax rate).
[F] = [C]*[E].
[G] = from Table 10C column [H].
[H] = [F]+[G].
[45] = sum [1]-[44].

0
1
2
3
4
5
6
7
8
9
Nuclear Coal Gas
Le
ve
lize
d C
os
t o
f E
lec
tric
ity
, ¢
/kW
h
Capital
O&M
Fuel
risk
premium
over
coal/gas
$25/tCO2
Figure 1: Summary Results for the Levelized Cost of Electricity from Alternative Sources
$25/tCO2

0
1,000
2,000
3,000
4,000
5,000
2001 2002 2003 2004 2005 2006 2007 2008
Ov
ern
igh
t C
os
t, $
/kW
MIT (2003) Japanese & Korean builds US proposed plants
Figure 2: Summary of Evolving Overnight Cost of Nuclear
15% escalation
3% escalation
(GDP deflator)

0
1,000
2,000
3,000
4,000
5,000
2001 2002 2003 2004 2005 2006 2007 2008
Ov
ern
igh
t C
os
t, $
/kW
MIT (2003) US proposed plants
Figure 3: Summary of Evolving Overnight Cost of Coal
15% escalation
3% escalation
(GDP deflator)

0
20
40
60
80
100
120
140
160
1/13/1984 10/9/1986 7/5/1989 3/31/1992 12/26/1994 9/21/1997 6/17/2000 3/14/2003 12/8/2005 9/3/2008
$/s
ho
rt t
on
Figure 4: Spot Price of Central Appalachian Coal, 1984-2008