by arun roongta editor & publisher your big marketing opportunity i n d i a
TRANSCRIPT

By Arun RoongtaEditor & Publisher
Your Big Marketing Opportunity
I N D I A

India a big market
•For Domestic Consumption•For Export Production•For Re-export (Trading)
India a big marketfor domestic consumption
Contd….
• Population - 1 Billion• Per capita domestic fabric consumption is 34 mtrs., one
of the lowest in the world.• Overall consumer spending grew by 12% p.a. • On Textile & clothing it grew by 48% in 2003.• One of the fastest growing economy, at the rate of 6%
p.a.• One of the lowest consumer of man-made textiles in the
world.(only 25% of total fiber consumption against the world consumption of 52%.)

India a big marketfor export production
• Garment Exports target is USD 25 billion against current export of USD 5.8 billion.This will need huge additional quantity of fabrics.
• Leading global buyers like GAP, JC Penney, Otto, Sarah Lee & Wal-Mart have set up new sourcing office in India with huge sourcing targets
• India’s image is acquiring the image of a superior quality and highly flexible supplier amongst European and American buyers.
• A gateway to large non-resident Indian population in the gulf countries, Africa, UK & rest of the world

India a big marketfor re - export production
• Increasing buying by traders of neighboring countries like Nepal, Sri Lanka, Bangladesh for their domestic consumption due to cultural similarities

Elements of market For Domestic Consumption
• Organised garment brands• Unorganised Garment manufacturers• Organised Garment manufacturers• Fabric Retail channels• Designers & Boutiques• Tailoring
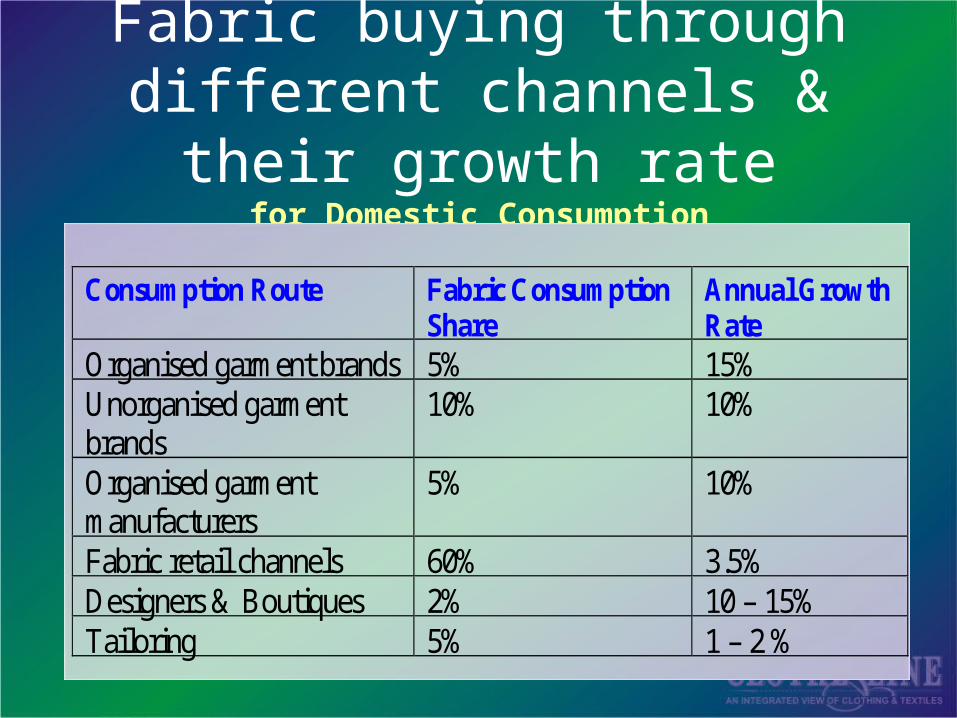
Fabric buying through different channels & their growth rate
for Domestic Consumption
Consumption Route Fabric ConsumptionShare
Annual GrowthRate
Organised garment brands 5% 15%Unorganised garmentbrands
10% 10%
Organised garmentmanufacturers
5% 10%
Fabric retail channels 60% 3.5%Designers & Boutiques 2% 10 – 15%Tailoring 5% 1 – 2 %
Organised garment brands• About 50 Global Brands Operating (Levi’s, Dockers,
Arrow, Van Huesan, Allen Solly, Louise Phillipe, Lee, Lacoste, Lee Cooper, Nike, Marks & Spencer)
• About 50 Indian Brands with over 10 million US dollar sales ( Park Avenue, Zodiac, Killer, Oxemberg, Blackberry’s)
• Mainly cater to men’s wear & Unisex Casual wear (Trousers, Shirts, Jeans , T -Shirts)
• Average daily Sales - 1000 - 4000 pieces.• Buy Fabrics directly from Mills/manufacturers
Elements of market for Domestic Consumption
Unorganised Garment manufacturers
Elements of market for Domestic Consumption
•Unbranded garment seller •Very large in numbers (About 1,00,000 units)•Disbursed all over the country•Average production 50 -2000 pieces per day•Mainly cater to kids wear & Women’s wear•Buy fabrics through traders/distributors
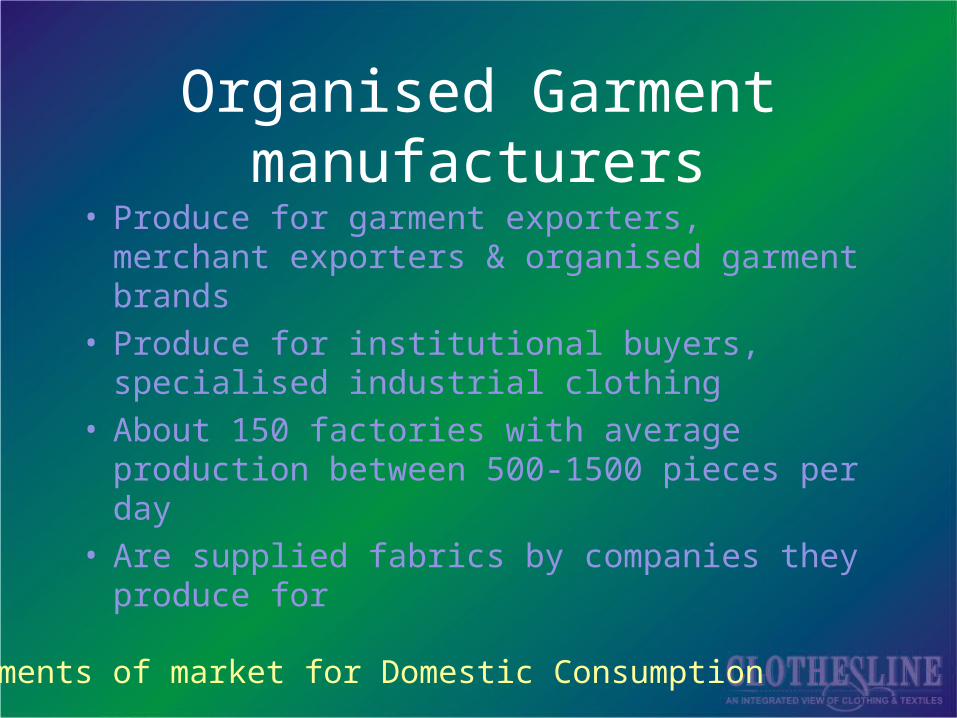
Organised Garment manufacturers
• Produce for garment exporters, merchant exporters & organised garment brands
• Produce for institutional buyers, specialised industrial clothing
• About 150 factories with average production between 500-1500 pieces per day
• Are supplied fabrics by companies they produce for
Elements of market for Domestic Consumption

Fabric Retail channels
• Consumers buying fabric length to get clothes from tailors(Trousers, suits, women’s dresses, blouses)
• There are 5 million retailers of which 20% cater to textiles
• Major retail chains and Shopping Malls are rapidly emerging in India catering to the Middle, Upper Middle and Upper class of the consumers.
• Shopper’s Stop, Westside, Lifestyle, Pantaloons, Globus, etc…
Elements of market for Domestic Consumption

Designers & Boutiques
• India is slowly developing its fashion industry.• Designs of Indian designers are being shown at the
major fashion centers of world like Milan, New York and Paris.
• The Designers do a annual business of USD 250 million
Elements of market for Domestic Consumption

Tailoring
• Reducing in urban India and metros (28% population) but growing in Semi-urban & rural(72% population) India
• Tailors are increasingly becoming fabric sellers as in Hong Kong, Taiwan and Thailand.
• Superior fabric manufacturers like Raymond, BSL & Grasim are increasing their market presence through this channel
• Can be reached through wholesalers & distributors only
Elements of market for Domestic Consumption

Traditional Women Wear - Sarees

IndianDesigner
Saree

Formal Women Wear - Churidars

Formal & Traditional
Men’s Wear

Formal Designer Wear - Churidars

Indian Urban Wear

Overall Per capita Textile Urban/Rural consumption

Indian Urban/Rural markets
• At the highest income level there are 2.3 million urban households as against 1.6 million households in rural areas.
• The money available to spend on FMCG (Fast Moving Consumer Goods) products by urban India is Rs. 49,500 crores (11 billion US$) as against is Rs. 63,500 crores (14 billion US$) in rural India.

Total Textile consumption

Per capita fiber consumption
• Fiber usage in India per person per year– 2.8 - 2.9 kg/person/year
• Manmade - 25%• Natural - 75%
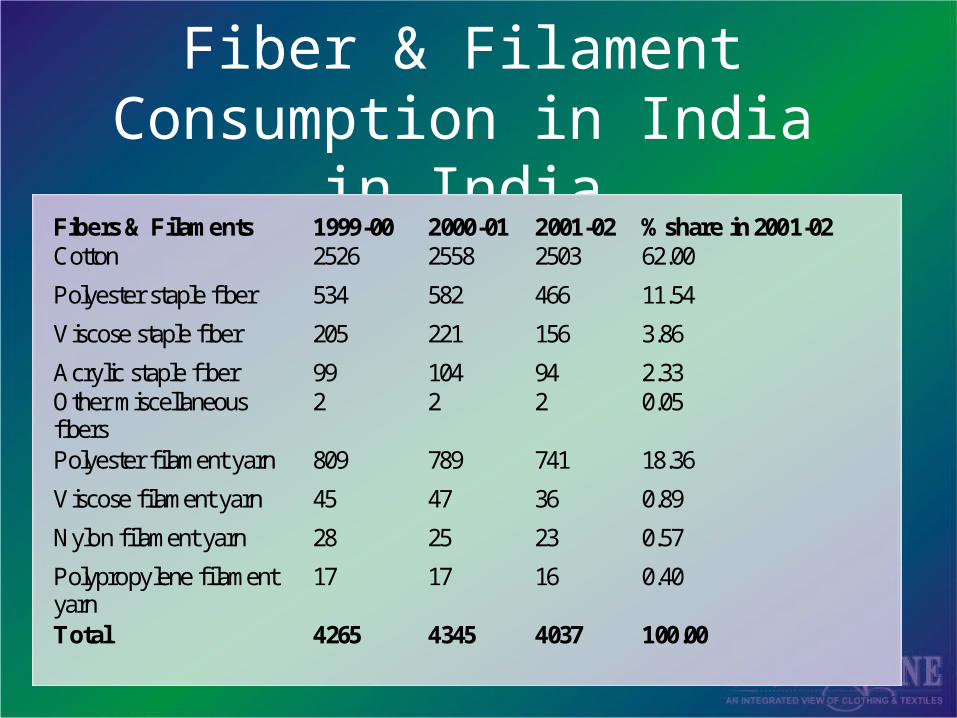
Fiber & Filament Consumption in India in India
Fibers & Filaments 1999-00 2000-01 2001-02 %share in 2001-02Cotton 2526 2558 2503 62.00
Polyester staple fiber 534 582 466 11.54
Viscose staple fiber 205 221 156 3.86
Acrylic staple fiber 99 104 94 2.33Other miscellaneousfibers
2 2 2 0.05
Polyester filament yarn 809 789 741 18.36
Viscose filament yarn 45 47 36 0.89
Nylon filament yarn 28 25 23 0.57
Polypropylene filamentyarn
17 17 16 0.40
Total 4265 4345 4037 100.00

Elements of market for Export Production
• Conventional Small Exporters, exporting fashion goods all over the world including Asia, to small semi - organised buyers - exports - below 2 million dollars p.a. - about 5000 in numbers
• Medium sized exporters catering to wholesalers, designers & smaller chain stores in Europe and US - 2 million to 8 million dollars p.a. - about 250 to 300 companies
• Large sized exporters catering to well known brands and stores like GAP, Macy’s, M&S, Wal-mart - 8 million to 50 million dollars p.a. - about 50 - 75 companies
• Very large sized exporters working with long run programs with biggest global buyers - 50 to 100 million dollars p.a. - 30 to 35 companies

Elements of market for Exports
• Made-up manufacturers
• Yarn exporters
• Processed apparel fabric exporters
• Grey fabric/sheetings exporters
• Furnishing fabrics exporters
• Fashion accessories & home accessories exporters

Elements of market for Re-exports
• Trade channels
• Merchant Exporters
• Garment factories in countries like Sri Lanka, Nepal, Bangladesh, Mauritius with Indian investments
Trade channels - markets/distribution• Indenting agents• Importers• Distributors• Wholesalers• Semi-wholesalers• Retailers

Indenting agents• Effective for developing markets and wholesalers• Cater to all types of demands• Very loyal to companies• Well connected• Work on margins between 3 - 5 %• Operate from larger cities with good infrastructure• Effective for supplies to big garment exporters &
domestic brands• Work for multiple companies
Trade channels - markets/distribution

Importers
• Stock & supply
• Work on higher margins
• Limited volumes
• Do not cater to Ready made garment demands but sell through trade channels
• Largely buy stock lots
• Require high working capital hence limited buying
Trade channels - markets/distribution
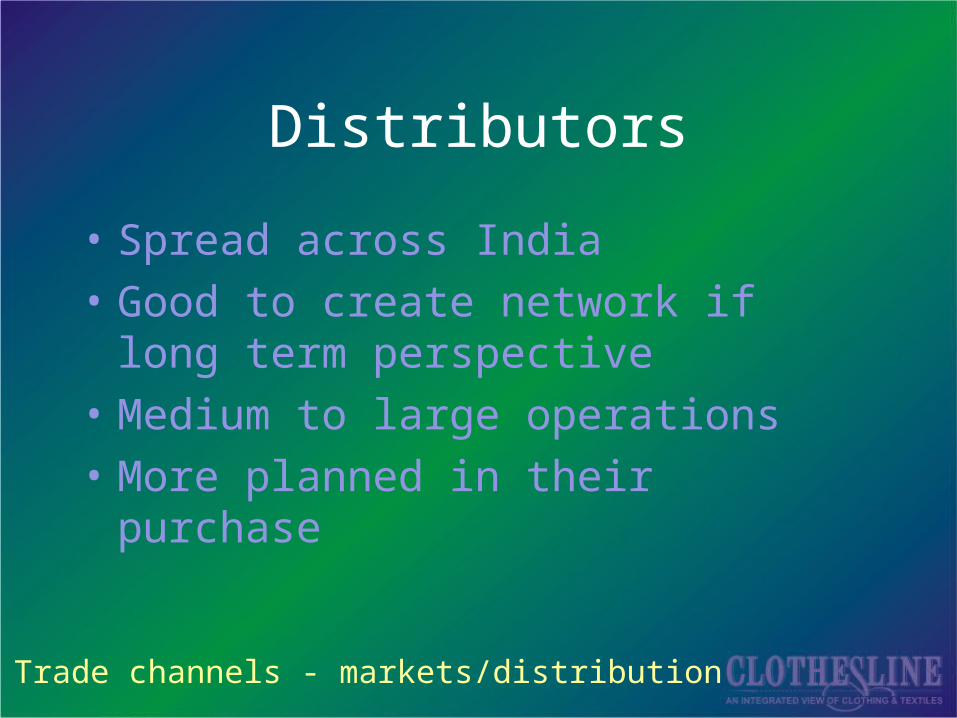
Distributors
• Spread across India
• Good to create network if long term perspective
• Medium to large operations
• More planned in their purchase
Trade channels - markets/distribution
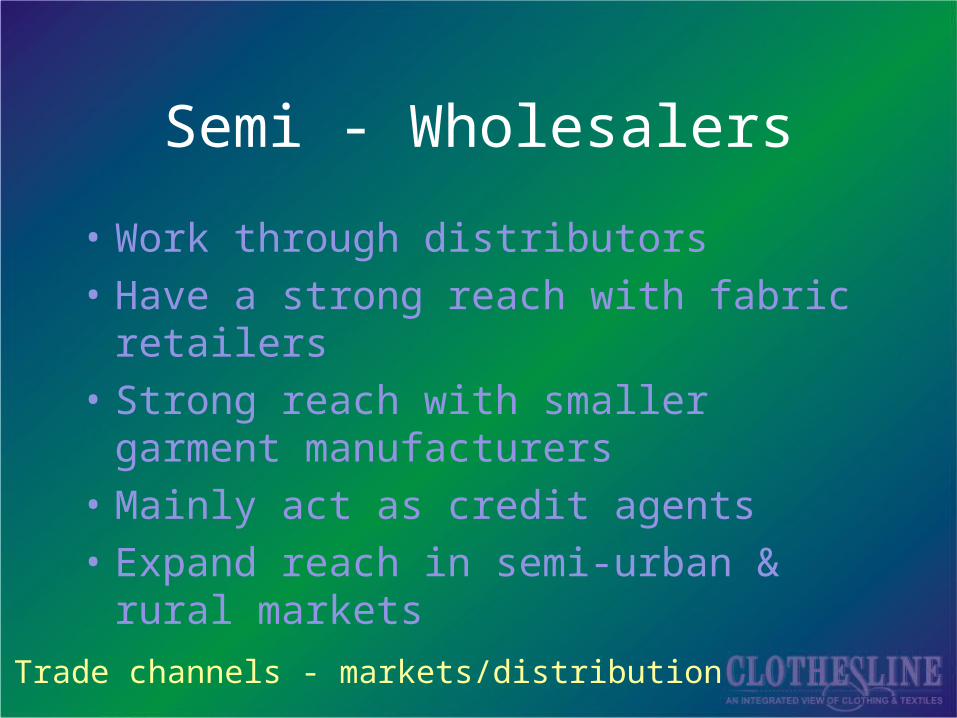
Semi - Wholesalers
• Work through distributors
• Have a strong reach with fabric retailers
• Strong reach with smaller garment manufacturers
• Mainly act as credit agents
• Expand reach in semi-urban & rural markets
Trade channels - markets/distribution

Retailers
• 5 million of which 20% deal with clothing and textiles
• Not possible to cater to retailers directly since they are highly scattered
• Changing over to ready made garments in cities like Mumbai, Delhi & Bangalore
Trade channels - markets/distribution

Distribution channels for reaching out to bigger users of
fabrics• Trade fairs
• Buyer Seller meets
• Indenting agents
Import of textile products in India
• Textile & Garment Import Scenario - India• Total imports into India• Countries-wise imports• Items-wise imports• Country-wise competitive perceptions• Country-wise qualitative perceptions• Import Duty structure • Detailed statistics

Textile Import Scenario - India
Imports were worth US$ 798.77 million during April-February 2002-2003.
Imports are growing slowly, but consistently. During April-February 2002-2003 grew by 23.16%.
Imports shifting in favour of more value-added products - from fiber to yarn to fabrics
The growth was highest in the low end products – cotton yarn and fabrics and man made filament yarns.
Contd...

Textile Import Scenario - India
The share of both these categories increased by around 4% at the cost of readymade garments whose share declined further.
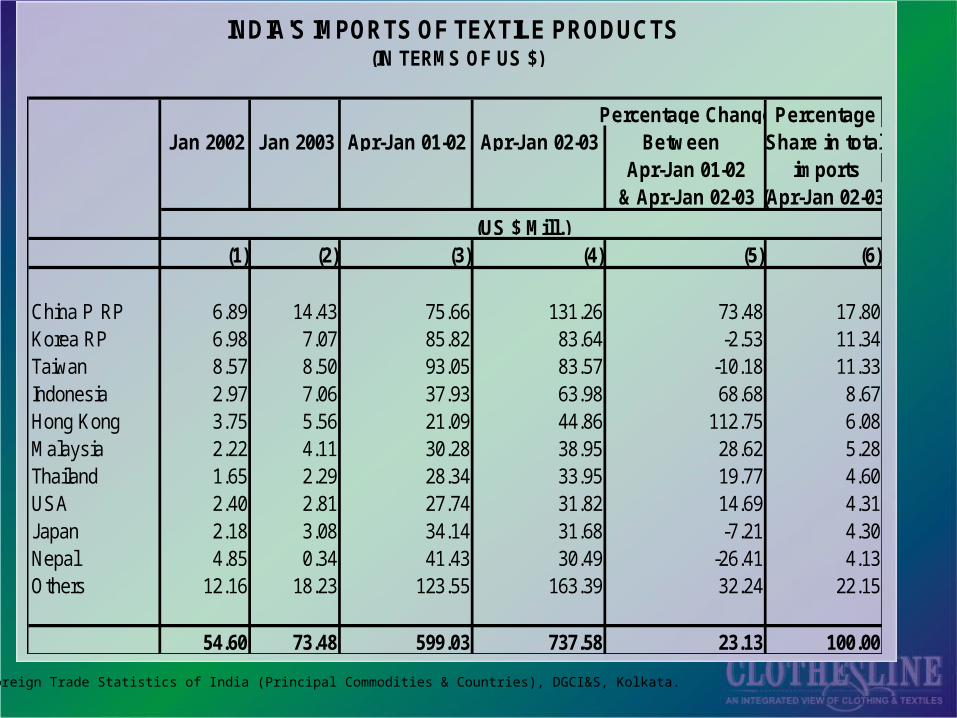
China continued to be the top supplier although their growth rate decelerated from 73.48 % during April-January 2002-2003 to 67.97% during April-February 2002-2003.

India’s Current Product/ Country import relationship
Italy - worsted, poly/wool, 100%wool Korea - Synthetics & specialty fabrics like flock,
velvets, jacquards in blends of man-made & natural fiber
China - coarse & medium synthetic & polyester cotton blends(basic fabrics), low end synthetics, silk yarn, low end worsted fabrics
Indonesia - 100% polyester Prints & Denims Taiwan - polyester filaments, menswear fabrics,
knitted fabrics(polar fleece)
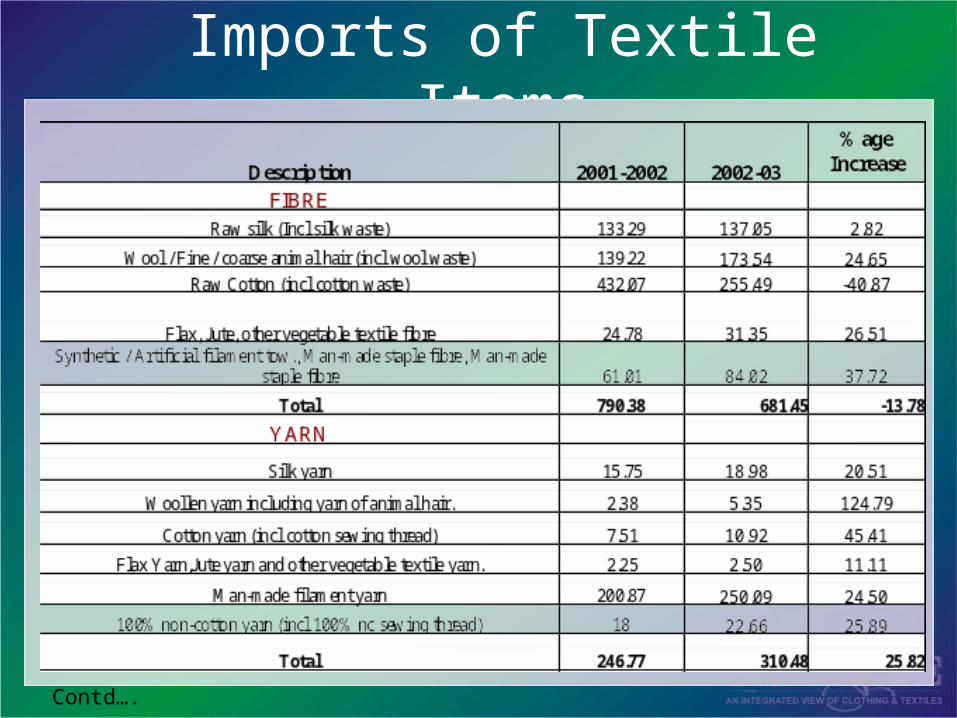
Imports of Textile Items
Contd….

Description 2001-2002 2002-03
%ageIncrease
FABRICSSilk fabrics 20.64 40.16 94.57
Woollen fabrics 1.95 18.31 838.97
Wooven fabrics of cotton 41.37 75.75 83.10Wooven fabrics of flax, Wooven fabrics of jute, other vegetable textile
fibres. 14.71 29.00 97.14
Man-made woven fabrics. 69.75 116.65 67.24
Pile fabrics 20.59 22.22 7.92
Other knitted or crocheted fabrics 23.4 21.47 -8.25Special woven fabrics; tufted textile fabrics; 'tapestries; trimmings;
embroidary 26.03 41.39 59.01
Total 218.44 364.95 67.07
RMG
Articles of apparel and clothing accessories 36.3 22.40 -38.29
Total 36.3 22.40 -38.29
MADEUPS / CARPETSOther made up textile articles; sets; worn textile 'articles; rags, Carpets
and other textile floor coverings. 69.26 67.89 -1.98
Total 69.26 67.89 -1.98
OTHER TEXTILE ITEMSImpregnated, coated & laminated textile fabrics; 'textile articles for
industrial use, Wadding, felt and nonwovens; special yarns;twine,'cordage, ropes and cables and articles thereof 175.95 188.67 7.23
Total 1,537.10 1635.84 6.42
Source : Foreign Trade Statistics of India (Principal Commodities & Countries), DGCI&S, Kolkata.
2002-03 2003-04
5644.88 3256.86
274.01 51.93
748.36 115.42
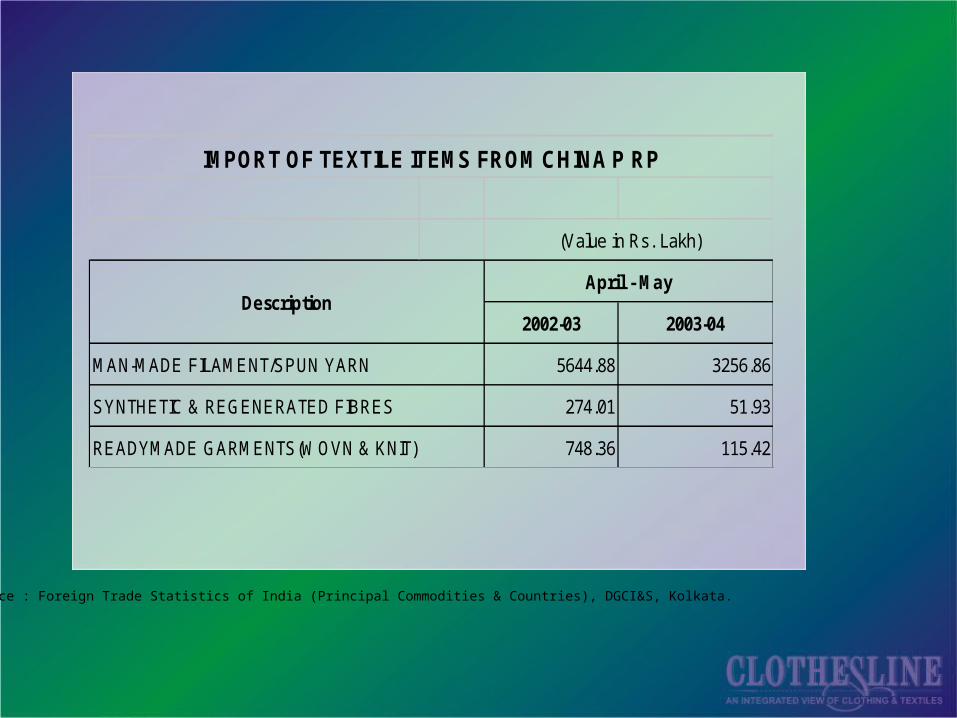
IMPORT OF TEXTILE ITEMS FROM CHINA P RP
MAN-MADE FILAMENT/SPUN YARN
READYMADE GARMENTS(WOVN & KNIT)
SYNTHETIC & REGENERATED FIBRES
(Value in Rs. Lakh)
DescriptionApril - May

Source : Foreign Trade Statistics of India (Principal Commodities & Countries), DGCI&S, Kolkata.
2002-03 2003-04
2729.85 3562.27
1145.35 532.02
16.07 34.77
IMPORT OF TEXTILE ITEMS FROM TAIWAN
(Value in Rs. Lakh)
DescriptionApril - May
MAN-MADE FILAMENT/SPUN YARN
READYMADE GARMENTS(WOVN & KNIT)
SYNTHETIC & REGENERATED FIBRES

Source : Foreign Trade Statistics of India (Principal Commodities & Countries), DGCI&S, Kolkata.
2002-03 2003-04
1331.62 1160.32
318.09 732.14
18.82 63.32
IMPORT OF TEXTILE ITEMS FROM THAILAND
MAN-MADE FILAMENT/SPUN YARN
READYMADE GARMENTS(WOVN & KNIT)
SYNTHETIC & REGENERATED FIBRES
(Value in Rs. Lakh)
DescriptionApril - May

2002-03 2003-04
31323.12 27098.99
4844.28 4651.97
1805.91 3114.03
MAN-MADE FILAMENT/SPUN YARN
READYMADE GARMENTS(WOVN & KNIT)
SYNTHETIC & REGENERATED FIBRES
Source : Foreign Trade Statistics of India (Principal Commodities & Countries), DGCI&S, Kolkata.
(Value in Rs. Lakh)
DescriptionApril - May
IMPORT OF TEXTILE ITEMS FROM ALL COUNTRIES
Source : Foreign Trade Statistics of India (Principal Commodities & Countries), DGCI&S, Kolkata.
Source : Foreign Trade Statistics of India (Principal Commodities & Countries), DGCI&S, Kolkata.
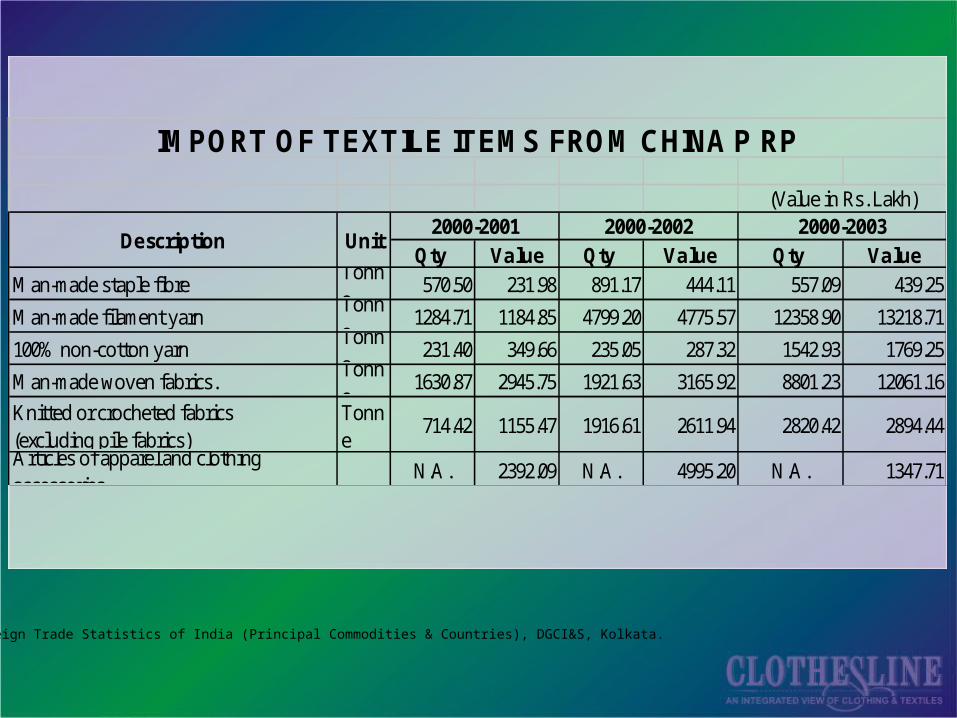
Qty Value Qty Value Qty Value
Man-made staple fibreTonne
570.50 231.98 891.17 444.11 557.09 439.25
Man-made filament yarnTonne
1284.71 1184.85 4799.20 4775.57 12358.90 13218.71
100% non-cotton yarnTonne
231.40 349.66 235.05 287.32 1542.93 1769.25
Man-made woven fabrics.Tonne
1630.87 2945.75 1921.63 3165.92 8801.23 12061.16
Knitted or crocheted fabrics (excluding pile fabrics)
Tonne
714.42 1155.47 1916.61 2611.94 2820.42 2894.44
Articles of apparel and clothing accessories
N.A. 2392.09 N.A. 4995.20 N.A. 1347.71
IMPORT OF TEXTILE ITEMS FROM CHINA P RP
(Value in Rs. Lakh)
Description Unit2000-2001 2000-2002 2000-2003

Source : Foreign Trade Statistics of India (Principal Commodities & Countries), DGCI&S, Kolkata.
Qty Value Qty Value Qty Value
Man-made staple fibreTonne
8496.77 3460.68 5400.07 2530.04 3734.07 1695.15
Man-made filament yarnTonne
13793.93 7924.43 18086.81 10813.70 20424.32 11868.78
100% non-cotton yarnTonne
219.35 137.73 178.92 641.09 26.47 55.94
Man-made woven fabrics.Tonne
2435.53 4426.81 2608.06 3691.63 4371.62 8024.84
Knitted or crocheted fabrics (excluding pile fabrics)
Tonne
3224.73 3592.86 4113.92 4530.94 1640.43 2301.16
Articles of apparel and clothing accessories N. A. 68.82 N. A. 858.10 N. A. 108.02
IMPORT OF TEXTILE ITEMS FROM TAIWAN
(Value in Rs. Lakh)
Description Unit2000-2001 2000-2002 2000-2003
Source : Foreign Trade Statistics of India (Principal Commodities & Countries), DGCI&S, Kolkata.
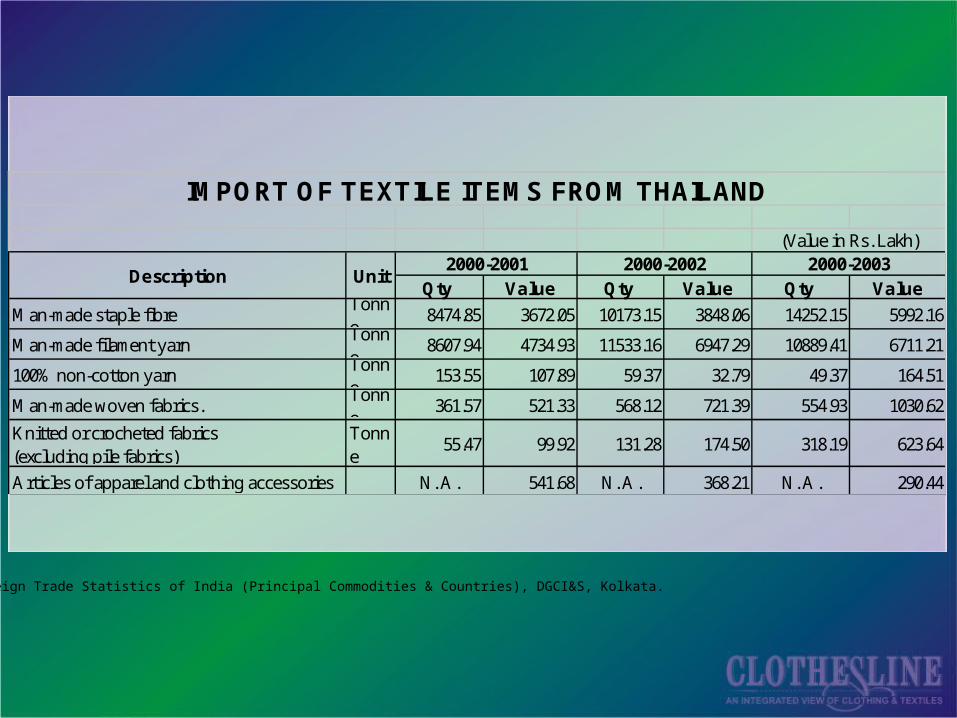
Qty Value Qty Value Qty Value
Man-made staple fibreTonne
8474.85 3672.05 10173.15 3848.06 14252.15 5992.16
Man-made filament yarnTonne
8607.94 4734.93 11533.16 6947.29 10889.41 6711.21
100% non-cotton yarnTonne
153.55 107.89 59.37 32.79 49.37 164.51
Man-made woven fabrics.Tonne
361.57 521.33 568.12 721.39 554.93 1030.62
Knitted or crocheted fabrics (excluding pile fabrics)
Tonne
55.47 99.92 131.28 174.50 318.19 623.64
Articles of apparel and clothing accessories N. A. 541.68 N. A. 368.21 N. A. 290.44
IMPORT OF TEXTILE ITEMS FROM THAILAND
(Value in Rs. Lakh)
Description Unit2000-2001 2000-2002 2000-2003

Source : Foreign Trade Statistics of India (Principal Commodities & Countries), DGCI&S, Kolkata.
Qty Value Qty Value Qty Value
Man-made staple fibreTonne
40357.23 17964.10 43443.77 19053.15 61516.74 27060.27
Man-made filament yarnTonne
95317.45 69092.39 121936.82 95474.88 159435.64 121720.01
100% non-cotton yarnTonne
4080.38 3523.49 11691.49 8556.22 11838.59 10548.42
Man-made woven fabrics.Tonne
18112.46 26004.20 32436.75 33153.19 37015.22 55664.80
Knitted or crocheted fabrics (excluding pile fabrics)
Tonne
6685.23 8198.94 9035.07 11119.67 7125.40 10034.61
Articles of apparel and clothing accessories N. A. 9893.58 N. A. 17252.82 N. A. 11593.30
IMPORT OF TEXTILE ITEMS FROM ALL COUNTRIES
(Value in Rs. Lakh)
Description Unit2000-2001 2000-2002 2000-2003
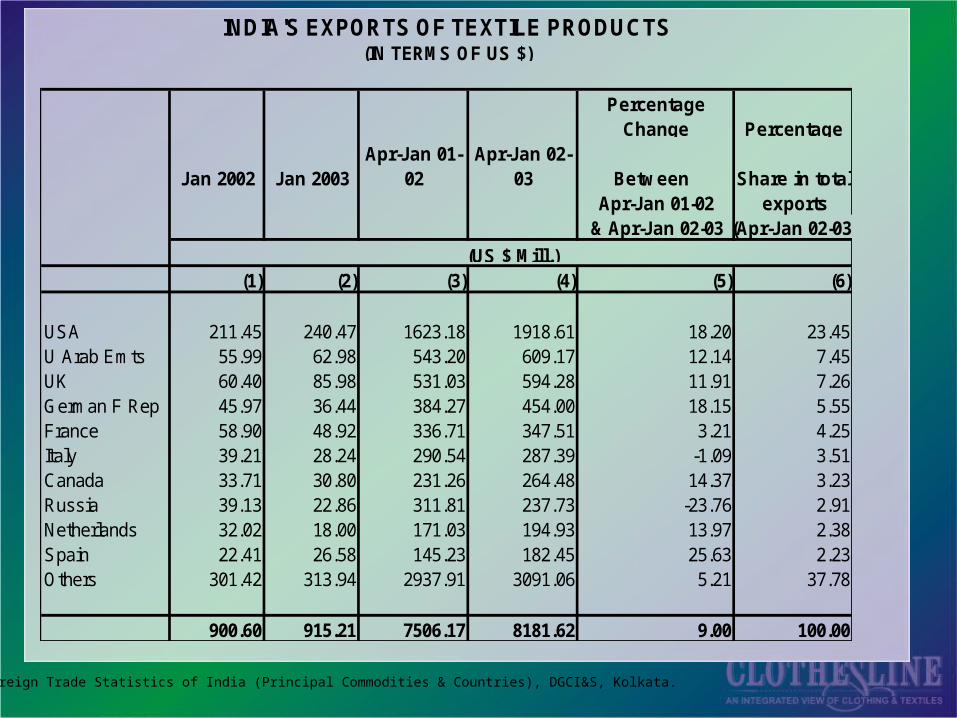
Percentage Change Percentage
Jan 2002 Jan 2003Apr-Jan 01-
02Apr-Jan 02-
03 Between Share in totalApr-Jan 01-02 exports
& Apr-Jan 02-03 (Apr-Jan 02-03)
(1) (2) (3) (4) (5) (6)
USA 211.45 240.47 1623.18 1918.61 18.20 23.45U Arab Emts 55.99 62.98 543.20 609.17 12.14 7.45UK 60.40 85.98 531.03 594.28 11.91 7.26German F Rep 45.97 36.44 384.27 454.00 18.15 5.55France 58.90 48.92 336.71 347.51 3.21 4.25Italy 39.21 28.24 290.54 287.39 -1.09 3.51Canada 33.71 30.80 231.26 264.48 14.37 3.23Russia 39.13 22.86 311.81 237.73 -23.76 2.91Netherlands 32.02 18.00 171.03 194.93 13.97 2.38Spain 22.41 26.58 145.23 182.45 25.63 2.23Others 301.42 313.94 2937.91 3091.06 5.21 37.78
900.60 915.21 7506.17 8181.62 9.00 100.00
INDIA'S EXPORTS OF TEXTILE PRODUCTS(IN TERMS OF US $)
(US $ Mill.)
Source : Foreign Trade Statistics of India (Principal Commodities & Countries), DGCI&S, Kolkata.

Percentage Change Percentage
Jan 2002 Jan 2003Apr-Jan 01-
02Apr-Jan 02-
03 Between Share in totalApr-Jan 01-02 exports
& Apr-Jan 02-03 (Apr-Jan 02-03)
(1) (2) (3) (4) (5) (6)
U Arab Emts 20.35 27.85 175.82 223.28 26.99 20.70Saudi Arabia 3.05 6.34 41.10 59.21 44.06 5.49Turkey 2.65 5.72 21.84 57.71 164.31 5.35USA 3.23 5.92 24.57 50.74 106.48 4.70UK 4.40 3.96 50.58 49.30 -2.53 4.57Singapore 1.37 7.12 20.33 46.34 127.97 4.30Italy 2.62 2.88 34.18 43.35 26.81 4.02Spain 3.64 5.28 39.60 40.70 2.79 3.77Belgium 1.83 2.69 20.38 29.10 42.81 2.70Sri Lanka 1.82 3.26 18.88 24.47 29.64 2.27Others 40.32 48.09 438.12 454.45 3.73 42.13
85.29 119.10 885.40 1078.67 21.83 100.00
(IN TERMS OF US $)INDIA'S EXPORTS OF MANMADE YARN, FABRICS, MADEUPS
(US $ Mill.)
Source : Foreign Trade Statistics of India (Principal Commodities & Countries), DGCI&S, Kolkata.
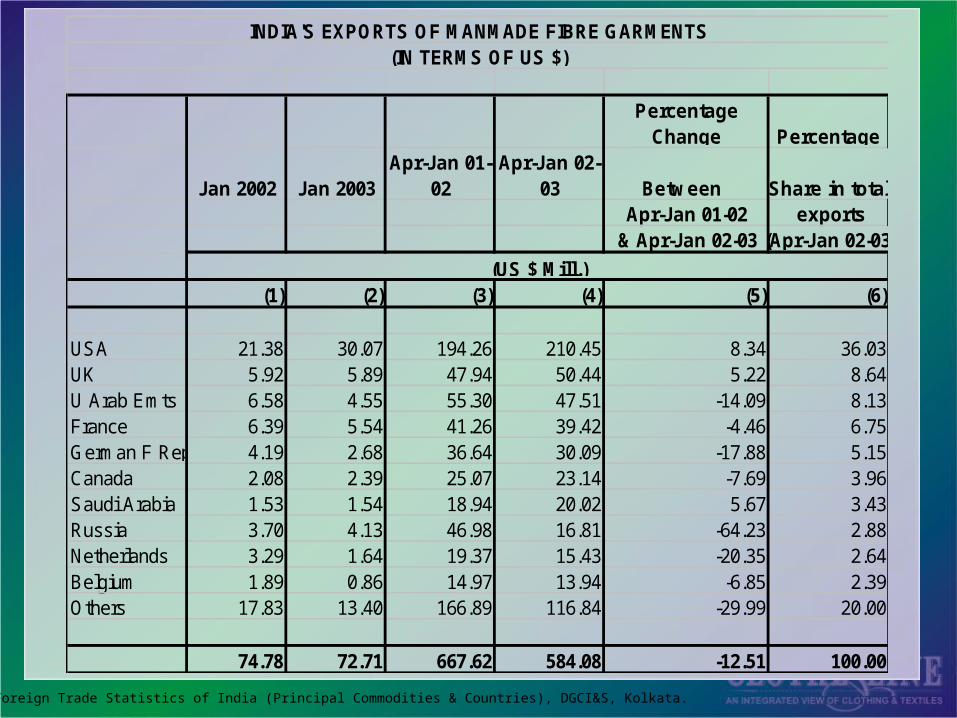
Percentage Change Percentage
Jan 2002 Jan 2003Apr-Jan 01-
02Apr-Jan 02-
03 Between Share in totalApr-Jan 01-02 exports
& Apr-Jan 02-03 (Apr-Jan 02-03)
(1) (2) (3) (4) (5) (6)
USA 21.38 30.07 194.26 210.45 8.34 36.03UK 5.92 5.89 47.94 50.44 5.22 8.64U Arab Emts 6.58 4.55 55.30 47.51 -14.09 8.13France 6.39 5.54 41.26 39.42 -4.46 6.75German F Rep 4.19 2.68 36.64 30.09 -17.88 5.15Canada 2.08 2.39 25.07 23.14 -7.69 3.96Saudi Arabia 1.53 1.54 18.94 20.02 5.67 3.43Russia 3.70 4.13 46.98 16.81 -64.23 2.88Netherlands 3.29 1.64 19.37 15.43 -20.35 2.64Belgium 1.89 0.86 14.97 13.94 -6.85 2.39Others 17.83 13.40 166.89 116.84 -29.99 20.00
74.78 72.71 667.62 584.08 -12.51 100.00
(IN TERMS OF US $)INDIA'S EXPORTS OF MANMADE FIBRE GARMENTS
(US $ Mill.)
Source : Foreign Trade Statistics of India (Principal Commodities & Countries), DGCI&S, Kolkata.

Percentage Change Percentage
Jan 2002 Jan 2003Apr-Jan 01-
02Apr-Jan 02-
03 Between Share in totalApr-Jan 01-02 exports
& Apr-Jan 02-03 (Apr-Jan 02-03)
(1) (2) (3) (4) (5) (6)
USA 6.90 6.64 73.92 70.89 -4.09 37.17France 1.53 1.01 13.04 14.63 12.22 7.67UK 1.31 1.48 10.49 12.55 19.65 6.58U Arab Emts 0.85 1.91 15.70 10.96 -30.16 5.75Russia 1.85 0.44 40.38 10.41 -74.23 5.46Ukraine 0.79 0.21 4.35 8.26 89.85 4.33German F Rep 0.96 0.48 6.54 7.45 13.93 3.91Netherlands 0.75 0.49 4.47 4.94 10.61 2.59Kyrghyzstan 0.39 0.30 3.76 4.79 27.49 2.51Malaysia 0.17 0.27 3.25 4.60 41.57 2.41Others 3.98 4.65 42.63 41.25 -3.24 21.63
19.48 17.88 218.52 190.75 -12.71 100.00
(IN TERMS OF US $)INDIA'S EXPORTS OF WOOL GARMENTS
(US $ Mill.)
Source : Foreign Trade Statistics of India (Principal Commodities & Countries), DGCI&S, Kolkata.
Percentage Change PercentageJan 2002 Jan 2003 Apr-Jan 01-02 Apr-Jan 02-03 Between Share in total
Apr-Jan 01-02 imports& Apr-Jan 02-03 (Apr-Jan 02-03)
(1) (2) (3) (4) (5) (6)
China P RP 6.89 14.43 75.66 131.26 73.48 17.80Korea RP 6.98 7.07 85.82 83.64 -2.53 11.34Taiwan 8.57 8.50 93.05 83.57 -10.18 11.33Indonesia 2.97 7.06 37.93 63.98 68.68 8.67Hong Kong 3.75 5.56 21.09 44.86 112.75 6.08Malaysia 2.22 4.11 30.28 38.95 28.62 5.28Thailand 1.65 2.29 28.34 33.95 19.77 4.60USA 2.40 2.81 27.74 31.82 14.69 4.31Japan 2.18 3.08 34.14 31.68 -7.21 4.30Nepal 4.85 0.34 41.43 30.49 -26.41 4.13Others 12.16 18.23 123.55 163.39 32.24 22.15
54.60 73.48 599.03 737.58 23.13 100.00
INDIA'S IMPORTS OF TEXTILE PRODUCTS (IN TERMS OF US $)
(US $ Mill.)
Source : Foreign Trade Statistics of India (Principal Commodities & Countries), DGCI&S, Kolkata.

Percentage Change Percentage
Jan 2002 Jan 2003Apr-Jan 01-
02Apr-Jan 02-
03 Between Share in
totalApr-Jan 01-02 imports
& Apr-Jan 02-03(Apr-Jan 02-
03)
(1) (2) (3) (4) (5) (6)
Hong Kong 0.48 1.91 4.60 17.39 277.62 24.24China P RP 0.82 1.74 11.92 13.80 15.79 19.25Switzerland 0.31 1.42 1.76 7.23 309.84 10.07Japan 0.30 0.83 0.74 5.61 659.31 7.82Korea RP 0.12 0.41 2.06 4.74 130.68 6.61Taiwan 0.32 0.63 4.32 4.46 3.14 6.22Indonesia 0.12 0.47 0.98 3.04 208.87 4.23Italy 0.07 0.30 1.44 2.52 74.98 3.52UK 0.03 1.44 0.29 1.96 577.42 2.73Malaysia 0.41 0.18 2.29 1.75 -23.29 2.45Others 1.18 0.68 7.82 9.23 17.97 12.87
4.16 10.01 38.23 71.72 87.61 100.00
(IN TERMS OF US $)
INDIA'S IMPORTS OF COTTON YARN & FABRICS FROM MAJOR SHIPPERS
(US $ Mill.)
Source : Foreign Trade Statistics of India (Principal Commodities & Countries), DGCI&S, Kolkata.

Percentage ChangePercentage
Jan 2002 Jan 2003Apr-Jan
01-02Apr-Jan
02-03 Between Share in totalApr-Jan 01-02 imports
& Apr-Jan 02-03(Apr-Jan 02-03)
(1) (2) (3) (4) (5) (6)
Indonesia 2.15 6.35 30.34 56.93 87.64 17.20Korea RP 4.53 4.48 39.70 53.21 34.02 16.07China P RP 0.93 5.09 12.15 45.51 274.64 13.75Taiwan 3.21 2.78 28.22 34.32 21.59 10.37Malaysia 1.43 3.71 24.81 31.62 27.46 9.55Japan 1.35 1.53 27.80 19.55 -29.68 5.91Nepal 3.26 0.00 28.72 17.35 -39.58 5.24Thailand 0.73 1.23 14.23 14.01 -1.54 4.23German F Rep 0.80 1.07 6.53 9.39 43.96 2.84Singapore 0.41 0.74 5.39 5.98 10.98 1.81Others 3.10 5.37 31.70 43.15 36.12 13.04
21.91 32.35 249.59 331.03 32.63 100.00
(IN TERMS OF US $)
INDIA'S IMPORTS OF MAN-MADE FILAMENTS/SPUN YARN (INC. WASTE)FROM MAJOR SHIPPERS
(US $ Mill.)
Source : Foreign Trade Statistics of India (Principal Commodities & Countries), DGCI&S, Kolkata.

Percentage ChangePercentage
Jan 2002 Jan 2003Apr-Jan 01-
02Apr-Jan 02-
03 Between Share in totalApr-Jan 01-02 imports
& Apr-Jan 02-03 (Apr-Jan 02-03)
(1) (2) (3) (4) (5) (6)
USA 0.70 0.85 6.98 9.90 41.82 30.07Canada 0.27 0.59 2.78 6.00 115.94 18.22China P RP 0.25 0.82 3.62 5.49 51.56 16.67Japan 0.10 0.28 0.66 1.92 190.15 5.83Korea RP 0.02 0.28 0.13 1.25 873.74 3.79Nepal 0.18 0.00 1.63 1.24 -23.78 3.77Malaysia 0.02 0.01 0.37 0.99 167.08 3.01U Arab Emts 0.08 0.05 1.01 0.60 -40.24 1.83Bangladesh 0.26 0.00 8.79 0.57 -93.53 1.73Australia 0.17 0.03 0.38 0.54 43.94 1.65Others 0.45 0.63 4.93 4.42 -10.35 13.43
2.49 3.54 31.28 32.93 5.28 100.00
(IN TERMS OF US $)
INDIA'S IMPORTS OF MADEUPS TEXTILE ARTICLESFROM MAJOR SHIPPERS
(US $ Mill.)
Source : Foreign Trade Statistics of India (Principal Commodities & Countries), DGCI&S, Kolkata.

Percentage ChangePercentage
Jan 2002 Jan 2003Apr-Jan 01-
02Apr-Jan 02-
03 Between Share in totalApr-Jan 01-02 imports
& Apr-Jan 02-03 (Apr-Jan 02-03)
(1) (2) (3) (4) (5) (6)
China P RP 4.82 6.56 38.83 63.95 64.68 22.57Taiwan 5.01 5.08 58.20 44.57 -23.42 15.73Korea RP 2.29 1.84 43.56 24.11 -44.65 8.51Hong Kong 2.78 2.58 12.74 20.92 64.25 7.38Thailand 0.85 1.03 12.59 18.74 48.86 6.61UK 1.02 1.77 6.32 17.10 170.77 6.04USA 1.37 1.09 13.98 14.88 6.42 5.25German F Rep 1.03 1.31 8.57 12.42 44.99 4.38Switzerland 0.93 0.79 2.22 10.55 375.71 3.72Nepal 0.89 0.00 5.41 10.30 90.45 3.63Others 4.00 4.01 45.12 45.84 1.60 16.18
25.00 26.06 247.52 283.37 14.49 100.00
(IN TERMS OF US $)
INDIA'S IMPORTS OF OTHER TEXTILE YARNS, FABRICS, MADEUP ARTICLESFROM MAJOR SHIPPERS
(US $ Mill.)
Source : Foreign Trade Statistics of India (Principal Commodities & Countries), DGCI&S, Kolkata.

Percentage ChangePercentage
Jan 2002 Jan 2003Apr-Jan 01-
02Apr-Jan 02-
03 Between Share in totalApr-Jan 01-02 imports
& Apr-Jan 02-03 (Apr-Jan 02-03)
(1) (2) (3) (4) (5) (6)
Malaysia 0.23 0.11 1.78 2.81 58.14 15.18China P RP 0.07 0.22 9.14 2.51 -72.53 13.56Bangladesh 0.01 0.00 1.59 1.72 8.22 9.30Nepal 0.35 0.34 5.49 1.59 -71.05 8.59Hong Kong 0.08 0.17 1.26 1.47 16.37 7.92UK 0.01 0.08 0.48 1.38 185.10 7.42Philippines 0.00 0.04 0.02 1.35 5626.65 7.28Italy 0.01 0.08 0.48 0.74 53.57 3.98Israel 0.00 0.00 0.01 0.55 9714.83 2.98Thailand 0.06 0.02 0.65 0.47 -27.77 2.53Others 0.23 0.45 11.50 3.94 -65.77 21.25
1.05 1.52 32.41 18.53 -42.84 100.00
(IN TERMS OF US $)
INDIA'S IMPORTS OF READYMADE GARMENTS (WOVEN & KNIT)FROM MAJOR SHIPPERS
(US $ Mill.)

Percentage ChangePercentage
April 2002 April 2003Apr'02-Apr-
02Apr'03-Apr'03 Between Share in total
Apr'02-Apr-02 imports& Apr'03-Apr'03 (Apr'03-Apr'03)
(1) (2) (3) (4) (5) (6)
China P RP 3.73 5.35 3.73 5.35 43.67 20.00Taiwan 4.52 3.62 4.52 3.62 -19.93 13.53Hong Kong 1.44 2.91 1.44 2.91 101.78 10.87Thailand 0.79 2.51 0.79 2.51 219.67 9.38German F Rep 0.78 2.20 0.78 2.20 182.99 8.22Korea RP 2.12 2.13 2.12 2.13 0.36 7.94USA 1.40 0.97 1.40 0.97 -30.19 3.64Indonesia 0.34 0.88 0.34 0.88 157.28 3.29UK 0.76 0.84 0.76 0.84 10.87 3.15Switzerland 0.45 0.78 0.45 0.78 70.87 2.90Others 4.27 4.57 4.27 4.57 7.05 17.07
20.59 26.76 20.59 26.76 29.97 100.00
(IN TERMS OF US $)
INDIA'S IMPORTS OF OTHER TEXTILE YARNS, FABRICS, MADEUP ARTICLESFROM MAJOR SHIPPERS
(US $ Mill.)

Percentage ChangePercentage
April 2002 April 2003Apr'02-Apr-
02Apr'03-Apr'03 Between Share in total
Apr'02-Apr-02 imports& Apr'03-Apr'03 (Apr'03-Apr'03)
(1) (2) (3) (4) (5) (6)
USA 0.02 1.60 0.02 1.60 6414.97 40.37China P RP 0.11 0.59 0.11 0.59 444.05 14.73Nepal 0.10 0.47 0.10 0.47 387.24 11.80Hong Kong 0.14 0.35 0.14 0.35 139.72 8.70Malaysia 0.17 0.19 0.17 0.19 14.97 4.83German F Rep 0.09 0.18 0.09 0.18 91.50 4.56Spain 0.00 0.09 0.00 0.09 151230.55 2.33Philippines 0.35 0.08 0.35 0.08 -77.00 2.04Italy 0.05 0.07 0.05 0.07 40.44 1.88Indonesia 0.02 0.06 0.02 0.06 258.65 1.47Others 0.82 0.29 0.82 0.29 -64.82 7.29
1.88 3.98 1.88 3.98 111.46 100.00
(IN TERMS OF US $)
INDIA'S IMPORTS OF READYMADE GARMENTS (WOVEN & KNIT)FROM MAJOR SHIPPERS
(US $ Mill.)

Popular price perceptions
Korea
China
Indonesia
Turkey
Taiwan
Italy
Thailand
Japan

Taiwan
China
Korea
Italy
Japan
Popular Quality Perception
Indian Import Duty to go Producers of cotton fabrics and garments would
also benefit due to lower prices. According to a textile ministry official, the move
to remove the import duty is prompted by the higher international prices. Global cotton prices for various varieties currently rule at 40-50% higher than last year.
Consumers of yarn, fabrics and garments are likely to support the government’s move.
• Chapter 52 - Cotton
• Chapter 54 - Man-Made Filaments
• Chapter 55 - Man-Made Staple Fibres
• Chapter 56 - Wedding, Felt and Nonwovens; Special Yarns; Twine, Cordage, Ropes and
Cables and Articles thereof
• Chapter 57 - Carpets and Other Textile Floor Coverings
• Chapter 58 - Special Woven Fabrics; Tufted Textile Fabrics; Lace; Tapestries; Trimmings;
Embroidery
India Customs Tariff with New Import Policies 2003 - 2004
Chapter wise headers
Contd….

• Chapter 59 - Impregnated, Coated, Covered or Laminated Textile Fabrics; Textile Articles of a kind suitable for Industrial Use
• Chapter 60 - Knitted or Crocheted Fabrics
• Chapter 6 - Articles of Apparel and Clothing Accessories, Knitted or Crocheted
• Chapter 62 - Articles of Apparel and Clothing Accessories, Not Knitted or Crocheted
• Chapter 63 - Other Made Up Textile Articles; Sets; Worn Clothing and Worn Textile Articles;
Rags

Competition In India - Surat Cost effective No Sophistication in designs No Sophistication in Colours Quick turnover

Suitable Taiwanese textile items to be marketed in Indian market
• Dyed fabrics• Polyester filaments• Blended Synthetic Fabrics

How to approach the Indian market?
• The mind set of a Buyer• How to negotiate with a buyer?• How to close a deal?• How to find a partner/Distributor?

The mind-set of the Indian buyer
• Very price conscious• Bargains a lot