buying stock market winners on warsaw stock exchange ... · ichimoku trend following strategy...
TRANSCRIPT

This paper focuses on one of the most popular issues in thePolish finance – is the ‘buying stock market winners’ profitableon the Warsaw Stock Exchange? This study tested whetherIchimoku trend following strategy performed better thansimple buy & hold benchmark. For automated backtestsWIG30 index components in the period 2012-12-28 to 2015-05-06 were used. The empirical results suggest that buying recent“winners” is very ineffective. These preliminary findings mayimply contrarian nature of the short-term Polish financialmarket.
I. INTRODUCTION
RADERS take many investing approaches. One ofthese tactics is to buy well-performing companies with
expectations the performance will continue. The decisioncan be made using either, among others: momentum, ortrend following strategies. These strategies may appearsimilar, but in reality they use different assumptions.
T
Trend following is an investment or trading strategy thattries to take advantage of long, medium or short-term pricemovements that seem to play out in various markets. Traderswho employ a trend following strategy do not aim to predictspecific price levels; they simply jump on the trend (whenthey perceive that a trend has established with their ownpeculiar reasons or rules) and ride it. A market "trend" is atendency of a financial market price to move in a particulardirection over time. If there is a turn contrary to the trend,they exit and wait until the turn establishes itself as a trendin the opposite direction. In cases their rules signal an exit,the trader closes long positions and re-enters when the trendis re-established [1, 2].
Momentum strategies rely on the assumption that pricesrespond (at least in part) to the strength of their supply anddemand inputs. Momentum takes many forms: the earningsreports for publicly traded companies, the relationshipbetween buyers and sellers in the market, the typical rate ofhistorical price rises and falls, etc. In a sense, momentumtrading can be paradoxically concerned with thefundamentals of technical analysis [3].
There are many trend following strategies [4]. Forinstance “Cross Exponential Moving Average (EMA)”enters the market when candle closes above 5-period EMAand exits when candle closes below 20-period EMA.“Simple Moving Average (SMA) and Moving Average
Convergence Divergence (MACD)” on the other hand, enterthe market when price crosses 20-period (this value can beadjusted) EMA and MACD oscillator is positive. Moststrategies are based on fairly simple indicators operating onshort-term historical prices. Due to that feature of trend-following strategies, authors have chosen Ichimoku method.This method sometimes is called trading system due to itscomplexity comparing to standard trend followingtechniques. Ichimoku is also a moving average-based trendidentification system, but it contains more data points thanstandard candlestick charts and provides a clearer picture ofpotential price action. Authors have chosen this techniquenot because it is better than the others, not because itperforms better or worse but because it takes intoconsideration much more aspects of price than otherstrategies. This feature of this technique is crucial forquantitative backtests performed in this paper.
This paper re-examines the profitability of a short-termtrend following strategy, which aims to buy stocks that haveperformed well in the past. These backtests do not includeshort-sale trades. It is not the author’s intention to prove ordisprove efficiency of Ichimoku technique. The mainquestion to be answered is: does buying recent winners fromthe WIG30 index pay off.
The question of profitability of the trend followingstrategy on the Warsaw Stock Exchange (WSE) is importantbecause existing evidence provides mixed results. Numerousscientists documented abnormal profits of the momentum ortrend following strategies. Rouwenhorst [5] finds it ontwelve European markets, and [6] for some stock emergingmarkets. Hameed and Yuanto [7] positively identify sixAsian markets. Schiereck, DeBondt and Weber [8] findmomentum profitable for intermediate-term German market.In contrast to these findings there are numerous examples ofcontrarian markets. For example Jagadeesh [9] andLehmann [10] find reversals in short-term horizons.DeBondt and Thaler [11, 12] report long-term pricereversals. Chang, McLeavey and Rhee [13] document short-term contrarian nature of Japan. Hameed and Ting [14] havesimilar findings about Malaysia. Finally Kang, Liu, and Ni[15] report the overreaction to firm-specific information asthe single most important source of the short-term contrarianprofit in China stock market. The state of short-term trendfollowing on Polish WSE lacks similar conclusions.
Buying stock market winners on Warsaw Stock Exchange -quantitative backtests of a short term trend following strategy
Aleksander FafułaWrocław University of Economics
ul. Komandorska 118/120 53-345 WrocławEmail: [email protected]
Krzysztof DrelczukWrocław University of Economics
ul. Komandorska 118/120 53-345 WrocławEmail: [email protected]
Proceedings of the Federated Conference on
Computer Science and Information Systems pp. 1361–1366
DOI: 10.15439/2015F338
ACSIS, Vol. 5
978-83-60810-66-8/$25.00 c©2015, IEEE 1361
II.METHOD
For the purpose of the backtests an automated trading-agent was implemented. Basically the agent buys and sellsstocks according to hard-coded Ichimoku rules. The testingframework is a part of the A-Trader system [16]. Presentedwork is an extension and follow-up of previous experimentsconducted using A-Trader. Technically, the presented systemis a multi-agent solution that supports the analysis of thetime series of high frequency, such as trading instruments.The main features are its openness for integration,development of new system functionality and ensuringadequate communication between the various agents. Theagents can act as data providers, indicators or final decisionmakers. The service orientated architecture and cloudcomputing solves the problem of computing power. Thiscould be an issue for higher than daily trading frequencies.The Ichimoku trading-agent consists of 6 elements (as inIchimoku trading system [17]).
Tenkan-sen calculation: (highest high + lowest low)/2 forthe last 9 periods. It is primarily used as a signal line and aminor support/resistance line. The Tenkan Sen is anindicator of the market trend. If the red line is moving up ordown, it indicates that the market is trending. If it moveshorizontally, it signals that the market is ranging. TheTenkan-sen Line is computed below.
s9 - time series created from last 9 periods.
Kijun-sen calculation: (highest high + lowest low)/2 forthe past 26 periods. This is a confirmation line, asupport/resistance line, and can also be used as a trailingstop line. The Kijun Sen acts as an indicator of future pricemovement. If the price is higher than the blue line, it couldcontinue to climb higher. If the price is below the blue line,it could keep dropping. The Kijun-sen Line is computedbelow.
s26 - time series created from last 26 periods.
Senkou span A calculation: (Tenkan-sen + kijun-sen)/2plotted 26 periods ahead. Also called leading span 1, thisline forms one edge of the kumo, or cloud if the price isabove the Senkou span, the top line serves as the firstsupport level while the bottom line serves as the secondsupport level. If the price is below the Senkou span, thebottom line forms the first resistance level while the top lineis the second resistance level. Span is computed below.
TS - tenkan-sen line,KS - tenkan-sen line.
Senkou span B calculation: (highest high + lowest low)/2calculated over the past 52 time periods and plotted 26
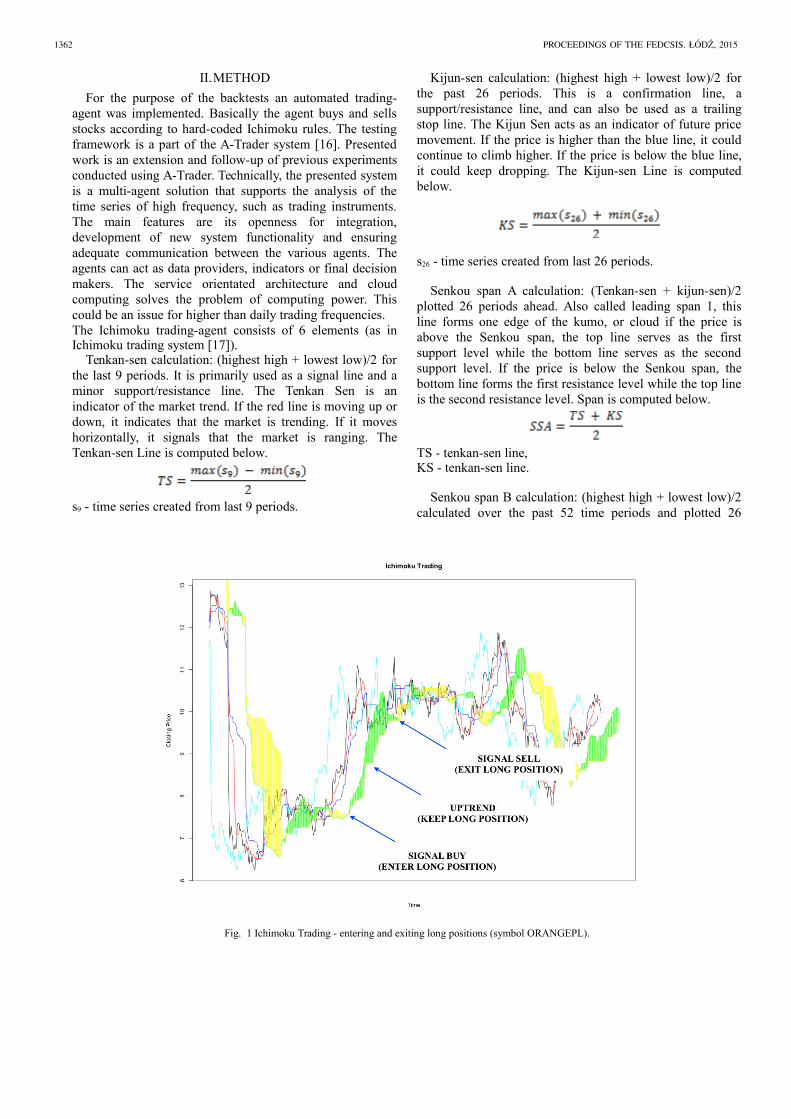
Fig. 1 Ichimoku Trading - entering and exiting long positions (symbol ORANGEPL).
1362 PROCEEDINGS OF THE FEDCSIS. ŁODZ, 2015

periods ahead. Also called leading span 2, this line forms theother edge of the kumo. Span is computed below.
s52 - time series created from last 26 periods.
Kumo cloud is the space between senkou span A and B.The cloud edges identify current and potential future supportand resistance points. The Kumo cloud changes in shape andheight based on price changes. The Kumo height representsvolatility as larger price movements form thicker clouds,which creates a stronger support and resistance. As thinnerclouds offer only weak support and resistance, prices canand tend to break through. Generally, markets are bullishwhen Senkou Span A is above Senkou Span B and viceversa. Traders often look for Kumo Twists in future clouds,where Senkou Span A and B exchange positions, a signal ofpotential trend reversals. In addition to thickness, thestrength of the cloud can also be ascertained by its angle;upwards for bullish and downwards for bearish. Any cloudsbehind price are also known as Kumo Shadows.
Chikou line calculation: today's closing price projectedback 26 days on the chart. Also called the lagging span it isused as a support/resistance aid. If the Chikou Span or thegreen line crosses the price in the bottom-up direction, thatis a buy signal. If the green line crosses the price from thetop-down, that is a sell signal. Visually the rulesimplemented in automated-strategy are presented on thefigure 1.
Figure 1 shows all Ichimoku elements with entry and exitpositions. The colors on the figure corresponds to listedbelow Ichimoku elements:
- red Tenka-sen line,- blue Kijun-sen line,- green Senkou span A,- yellow Senkou span B,- cyan Chikou line.
It is important to avoid biases related to backtesting buy-only strategies on uptrend markets only. Therefore thebacktests were conducted during diversified market periods.Fig. 2 shows corresponding WIG30 period (dailyobservations).
Fig. 2 WIG30, in backtested period, presenting non-monotonous trend.
During the backtested period the daily WIG30 returns hadmoderate skewness, with mean centered almost around zero.The weekly and monthly WIG30 returns were also slightlypositive, with no significant variance. The summary of basicstatistics is presented in table 1.
The backtests were performed in A-Trader withextensions written in R programming language. The reasonof choosing R is because it is well tested statisticalprogramming framework with wide variety of libraries andlarge community. This approach makes the backtests lessvulnerable to errors. The backtesting architecture, presentedin detail in [16], is shown at the fig. 3.
Fig. 3 A-Trader architecture.
TABLE I.
STATISTICS OF WIG30 RETURNS - VARIOUS TIME RESOLUTIONS
Returns # Obs Minimum Quartile 1 Median Mean Quartile 3 Maximum Stdev
Daily 581 -0.0527 -0.0054 0.0030 0.002 0.0057 0.0311 0.0097
Weekly 123 -0.0865 -0.0122 0.0019 0.007 0.0126 0.0578 0.0217
Monthly 29 -0.0877 -0.0189 0.0031 0.0028 0.0328 0.0818 0.0386
ALEKSANDER FAFUŁA, KRZYSZTOF DRELCZUK: BUYING STOCK MARKET WINNERS ON WARSAW STOCK EXCHANGE 1363
The following agents and components are distinguished inthe A-Trader architecture:
● Notify Agent (NA),● Historical Data Agent (HDA),● Cloud of Computing Agents (CCA),● Market Communication Agent (MCA),● User Communication Agent (UCA),● Supervisor (S),● Database System (DS).
The data was acquired from the brokerage department ofBOS Bank (the Polish Bank Ochrony Środowiska). Datawas aggregated to 1-day periods. As a middle storage layer,a HDFS distributed file system was used. Such approachenables huge improvements in computation time and allowsthe data to perform millions of simulation in real time. Theseextensions of the A-Trader built framework are easilycustomizable and can be used in a variety of tests withminimum programming work.
III. RESULTS
For the purpose of backtesting we took components ofWIG 30 index (as of 2015.05.07). The list of backtestedcompanies included: ALIOR, ASSECOPOL, BOGDANKA,BORYSZEW, BZWBK, CCC, CYFRPLSAT, ENEA,ENERGA, EUROCASH, GRUPAAZOTY, GTC,HANDLOWY, INGBSK, JSW, KERNEL, KGHM, LOTOS,LPP, MBANK, ORANGEPL, PEKAO, PGE, PGNIG,PKNORLEN, PKOBP, PZU, SYNTHOS, TAURONPE,TVN. Next, the data was trimmed to the earliest possiblepoint where the WIG30 index provides first observation(2012-12-28). Additionally the company quotes were shiftedby 52 trading days to prepare signals for trading since thefirst day of WIG30 (2012-10-12).
Each of the benchmarks produced a visual output ofIchimoku components with price. Additionally, cumulativereturns of the tested trend-following strategy were plottedalong the classical “Buy & Hold” benchmark.
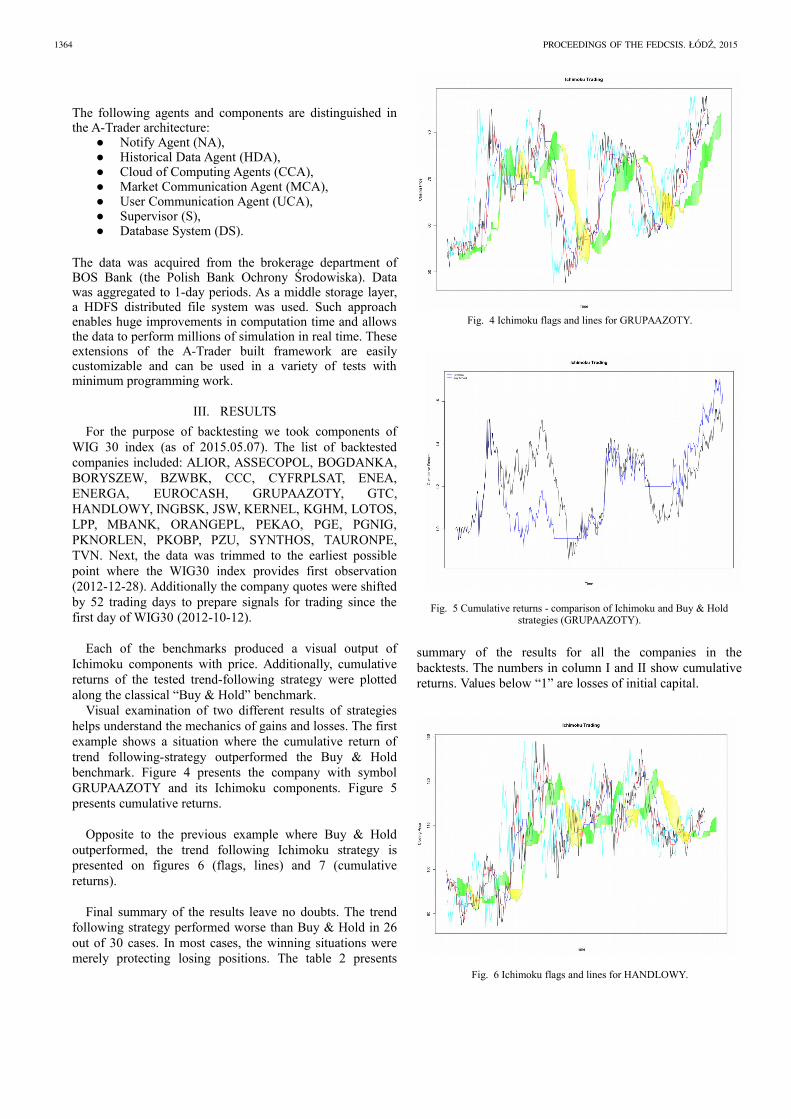
Visual examination of two different results of strategieshelps understand the mechanics of gains and losses. The firstexample shows a situation where the cumulative return oftrend following-strategy outperformed the Buy & Holdbenchmark. Figure 4 presents the company with symbolGRUPAAZOTY and its Ichimoku components. Figure 5presents cumulative returns.
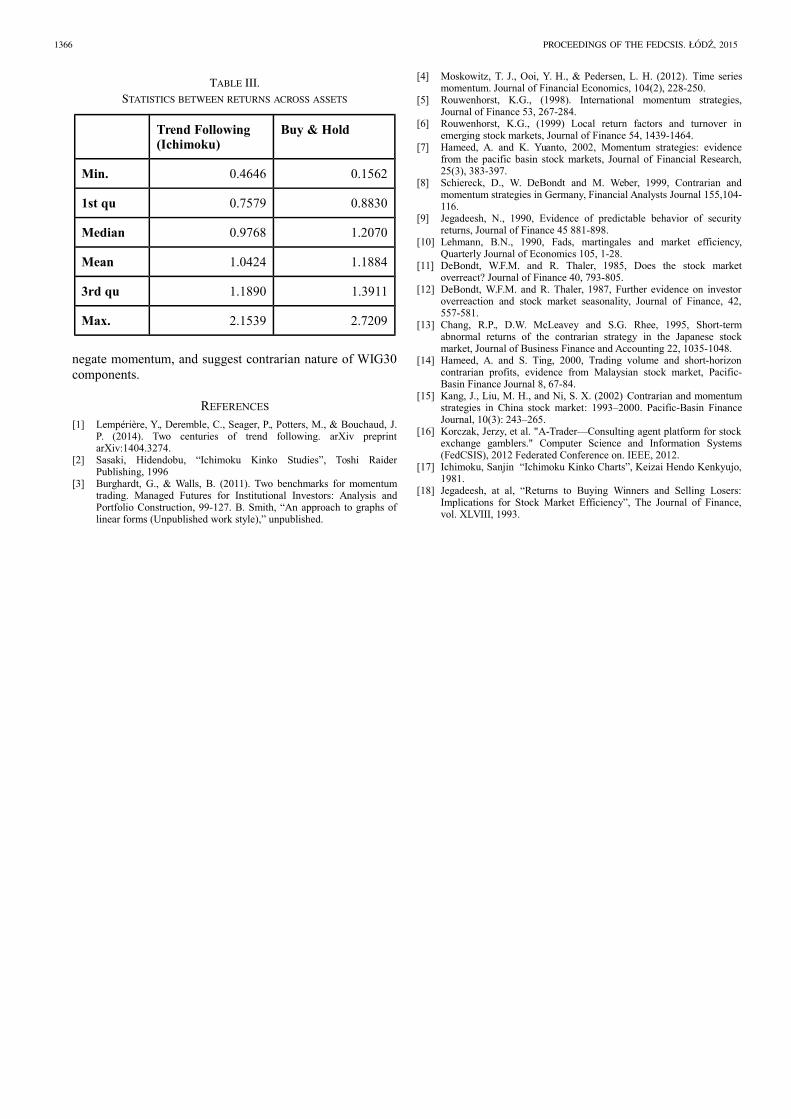
Opposite to the previous example where Buy & Holdoutperformed, the trend following Ichimoku strategy ispresented on figures 6 (flags, lines) and 7 (cumulativereturns).
Final summary of the results leave no doubts. The trendfollowing strategy performed worse than Buy & Hold in 26out of 30 cases. In most cases, the winning situations weremerely protecting losing positions. The table 2 presents
summary of the results for all the companies in thebacktests. The numbers in column I and II show cumulativereturns. Values below “1” are losses of initial capital.
Fig. 6 Ichimoku flags and lines for HANDLOWY.
Fig. 4 Ichimoku flags and lines for GRUPAAZOTY.
Fig. 5 Cumulative returns - comparison of Ichimoku and Buy & Holdstrategies (GRUPAAZOTY).
1364 PROCEEDINGS OF THE FEDCSIS. ŁODZ, 2015

The statistics of cumulative returns across backtests ispresented in table III.
IV. DISCUSSION
As shown in backtests buying winners on Warsaw StockExchange with Ichimoku short trend following strategy didnot perform well. There might be a few reasons for suchresults.
First is past-winners do not have enough strength to beatthe market in the future. Buy and hold benchmark seems toconfirm this thesis. This is not a typical situation on well-developed capital markets where buying winners usuallyoutperform the market [18]. The assets for the backtestswere taken from the WIG30 index component list. Perhapsthose assets were considered overpriced, due to the shortterm overreaction to the news, and therefore there was nosteady potential to outperform the market. Investigation intoother segments of the market might be helpful to verify thisstatement.
Second reason of the losses is the potential inefficiency ofIchimoku technique as the trend following strategy. There isa possibility that Ichimoku with used parameters does notfollow trend as intended. In such cases, further backtestswith different strategies might deny or confirm this thesis.However looking at the Buy & Hold strategy, it seems thatthe buying “winners” approach is the problem, not thechosen strategy itself. Nevertheless other strategies mightshed some additional light on this matter.
In general, trend following scored worse in almost everycase, except one: investment protection. The minimum Buy& Hold cumulative return is 0.1562, while, for trendfollowing, the protection shut the trading down at 0.4646.Although this additional protection limits losses, it also trimsgains.
Final conclusions are that joining recently establisheduptrends, in the case of WIG30 components in period 2012-12-28 to 2015-05-06, did not lead to excessive returns anddid not provide any other kind of improvements. Of course,the presented backtesting approach is very general: the
algorithms can be adjusted, additional variables can bespecified, and more sophisticated models can be used.However, the broad backtests performed in this research
Fig. 7 Cumulative returns - comparison of Ichimoku and Buy & Holdstrategies (HANDLOWY).
TABLE II.
STATISTICS OF WIG30 RETURNS - VARIOUS TIME RESOLUTIONS
TrendFollowing
Buy & Hold Symbol Result
0,95 1,32 ALIOR LOSS
1,38 1,39 ASSECOPOL LOSS
0,60 0,65 BOGDANKA LOSS
1,16 1,21 BORYSZEW LOSS
1,05 1,39 BZWBK LOSS
2,15 2,72 CCC LOSS
1,34 1,56 CYFRPLSAT LOSS
0,69 1,09 ENEA LOSS
1,18 1,31 ENERGA LOSS
0,68 0,78 EUROCASH LOSS
1,64 1,51 GRUPAAZOTY WIN
0,89 0,74 GTC WIN
0,94 1,22 HANDLOWY LOSS
1,52 1,62 INGBSK LOSS
0,61 0,16 JSW WIN
0,46 0,54 KERNEL LOSS
0,59 0,69 KGHM LOSS
0,73 0,84 LOTOS LOSS
1,32 1,42 LPP LOSS
1,19 1,48 MBANK LOSS
1,16 0,87 ORANGEPL WIN
0,78 1,21 PEKAO LOSS
1,00 1,22 PGE LOSS
1,13 1,20 PGNIG LOSS
1,00 1,38 PKNORLEN LOSS
0,84 1,06 PKOBP LOSS
0,80 1,18 PZU LOSS
0,75 0,94 SYNTHOS LOSS
0,85 1,11 TAURONPE LOSS
1,86 1,89 TVN LOSS
ALEKSANDER FAFUŁA, KRZYSZTOF DRELCZUK: BUYING STOCK MARKET WINNERS ON WARSAW STOCK EXCHANGE 1365
negate momentum, and suggest contrarian nature of WIG30components.
REFERENCES
[1] Lempérière, Y., Deremble, C., Seager, P., Potters, M., & Bouchaud, J.P. (2014). Two centuries of trend following. arXiv preprintarXiv:1404.3274.
[2] Sasaki, Hidendobu, “Ichimoku Kinko Studies”, Toshi RaiderPublishing, 1996
[3] Burghardt, G., & Walls, B. (2011). Two benchmarks for momentumtrading. Managed Futures for Institutional Investors: Analysis andPortfolio Construction, 99-127. B. Smith, “An approach to graphs oflinear forms (Unpublished work style),” unpublished.
[4] Moskowitz, T. J., Ooi, Y. H., & Pedersen, L. H. (2012). Time seriesmomentum. Journal of Financial Economics, 104(2), 228-250.
[5] Rouwenhorst, K.G., (1998). International momentum strategies,Journal of Finance 53, 267-284.
[6] Rouwenhorst, K.G., (1999) Local return factors and turnover inemerging stock markets, Journal of Finance 54, 1439-1464.
[7] Hameed, A. and K. Yuanto, 2002, Momentum strategies: evidencefrom the pacific basin stock markets, Journal of Financial Research,25(3), 383-397.
[8] Schiereck, D., W. DeBondt and M. Weber, 1999, Contrarian andmomentum strategies in Germany, Financial Analysts Journal 155,104-116.
[9] Jegadeesh, N., 1990, Evidence of predictable behavior of securityreturns, Journal of Finance 45 881-898.
[10] Lehmann, B.N., 1990, Fads, martingales and market efficiency,Quarterly Journal of Economics 105, 1-28.
[11] DeBondt, W.F.M. and R. Thaler, 1985, Does the stock marketoverreact? Journal of Finance 40, 793-805.
[12] DeBondt, W.F.M. and R. Thaler, 1987, Further evidence on investoroverreaction and stock market seasonality, Journal of Finance, 42,557-581.
[13] Chang, R.P., D.W. McLeavey and S.G. Rhee, 1995, Short-termabnormal returns of the contrarian strategy in the Japanese stockmarket, Journal of Business Finance and Accounting 22, 1035-1048.
[14] Hameed, A. and S. Ting, 2000, Trading volume and short-horizoncontrarian profits, evidence from Malaysian stock market, Pacific-Basin Finance Journal 8, 67-84.
[15] Kang, J., Liu, M. H., and Ni, S. X. (2002) Contrarian and momentumstrategies in China stock market: 1993–2000. Pacific-Basin FinanceJournal, 10(3): 243–265.
[16] Korczak, Jerzy, et al. "A-Trader—Consulting agent platform for stockexchange gamblers." Computer Science and Information Systems(FedCSIS), 2012 Federated Conference on. IEEE, 2012.
[17] Ichimoku, Sanjin “Ichimoku Kinko Charts”, Keizai Hendo Kenkyujo,1981.
[18] Jegadeesh, at al, “Returns to Buying Winners and Selling Losers:Implications for Stock Market Efficiency”, The Journal of Finance,vol. XLVIII, 1993.
TABLE III.
STATISTICS BETWEEN RETURNS ACROSS ASSETS
Trend Following (Ichimoku)
Buy & Hold
Min. 0.4646 0.1562
1st qu 0.7579 0.8830
Median 0.9768 1.2070
Mean 1.0424 1.1884
3rd qu 1.1890 1.3911
Max. 2.1539 2.7209
1366 PROCEEDINGS OF THE FEDCSIS. ŁODZ, 2015