buy - myirisbreport.myiris.com/hdfc/alepharm_20140321.pdf · initiating coverage 21 mar 2014 ......
TRANSCRIPT

INITIATING COVERAGE 21 MAR 2014
Alembic Pharma BUY
Gearing for a leap Alembic Pharma (ALPM) is a mid-size pharma company with a major chunk of revenues coming from domestic formulations (58%) Export formulations contribute ~18% and the rest comprises of APIs. ALPM’s interesting filings for US and increasing contribution from specialty portfolio (~60%) in domestic formulations segment will drive 26/39% CAGR in revenues/PAT over FY14-16E. With ROE/ROCE of >40% and consistent free cash flows (Rs 2.0-3.0bn) we see value in ALPM despite the sharp run-up in the stock.
Domestic formulations going steady : ALPM has emerged from a plain anti infective player in FY07 to a focused specialty company in FY14E. The specialty segment accounted for ~60% of revenues till 9MFY14 at Rs 4.0bn (from Rs 750mn in FY07) and posted a CAGR of >50% over last six years. With plans to expand the field force from 3,000 to ~3,500 and >20% growth (expected) in the specialty portfolio (led by product launches) will lead to 16% CAGR in the segment revenues over FY14-16E.
US – the growth engine : ALPM’s US revenue has grown at >70% YoY for the 9MFY14 and now accounts for ~20% of revenues (up from 10% in FY13). We expect strong growth in the US to continue as ALPM’s ~60% of ANDA pipeline (awaiting approval) (33 pending ANDA’s) fructifies. We expect ALPM to launch some limited competition opportunities like gToprol, gSular and gElmiron over FY15E-16E. ALPM’s DMF filings also indicate interesting opportunities like gTracleer and gMultaq which can translate into high
margin opportunities over the next 2/3 years. Interestingly ALPM’s recent DMF filing of Asenapine (Brand – Saphris, sublingual tablet) highlights increasing focus on complex drug deliveries. We expect ALPM’s US segment to post US$ 126mn revenues by FY16E, a 63% CAGR over FY14-16E.
Outlook and valuation ALPM has lagged its peers in the past decade in both
domestic as well as US markets but with enhanced R&D efforts, aggressive strategies for Domestic formulations and a strong balance sheet, the company is poised for a robust growth phase.
Although ALPM has witnessed P/E expansion from ~8-10x levels to 10-13x levels, we see enough room for further re-rating on the stock as its US pipeline unfolds. The stock still trades at an attractive valuation of 14.9x FY15E EPS and 11.1x FY16E EPS. We value ALPM at 15x FY16E EPS of Rs 26.1 and recommend BUY with a TP of Rs 392.
FINANCIAL SUMMARY YE Mar (Rs mn) FY13 FY14E FY15E FY16E Net Revenues 15,203 18,899 23,444 29,942 Growth (%) 3.7 24.3 24.1 27.7 EBIDTA 2,520 3,814 5,074 6,700 EBIDTA margin (%) 16.6 20.2 21.6 22.4 APAT 1,653 2,566 3,657 4,928 EPS (Rs.) 8.8 13.6 19.4 26.1 P/E (x) 33.1 21.3 14.9 11.1 EV/EBITDA 33.2 20.7 15.6 11.3 RoE (%) 36.8 43.8 46.4 46.2 Source : Company, HDFC sec Inst Research
INDUSTRY PHARMA CMP (as on 20 Mar 2014) Rs 290 Target Price Rs 392 Nifty 6,483
Sensex 21,740
KEY STOCK DATA
Bloomberg ALPM IN/ALEM.BO
No. of Shares (mn) 189
MCap (Rs bn) / ($ mn) 55/893
6m avg traded value (Rs mn) 68
STOCK PERFORMANCE (%)
52 Week high / low Rs 311/94
3M 6M 12M
Absolute (%) 37.1 112.0 206.5
Relative (%) 33.9 104.7 191.4
SHAREHOLDING PATTERN (%)
Promoters 74.13
FIs & Local MFs 1.46
FIIs 8.69
Public & Others 15.72
Source : BSE
Meeta Shetty, CFA [email protected] +91-22-6171-7338
HDFC securities Institutional Research is also available on Bloomberg HSLB <GO> & Thomson Reuters

ALEMBIC PHARMA : INITIATING COVERAGE
Company Background Alembic Pharma was established in 1907 as Alembic
Ltd for manufacturing of tinctures and alcohol at its Baroda plant. Starting 1940, Alembic Pharma transformed in to a Pharma focused company engaged in manufacturing of cough syrups, vitamins, tonics and sulphur drugs.
Until 2010 Alembic was a pure domestic focused company. Post demerger of company’s core Pharma business (now Alembic Pharma) from Alembic Ltd, ALPM transformed into an aggressive and focused company. Management started focusing
aggressively on export to regulated markets (US and Europe) and chronic therapies in the domestic market.
As on FY13, ALPM’s specialty segment contribution accounted for ~50% of the domestic formulations revenues (up from <25% in FY07) with presence across therapies like Ophthalmology, Cardiology, Diabetes, Gastro, Gynaec and Derma. Whereas the US markets accounted for ~10% of the revenues. Growth in high margin segment also led to increase in EBIDTA margins from ~13% in FY10 to ~17% in FY13.
Revenue break up – FY13
Source : Company, HDFC sec Inst Research
Revenues (100%)
Domestic
(66%)
Formulations (58.5%)
APIs (7.5%)
Exports (34%)
Formulations (18.5%)
APIs (15.5%)
Page | 2
ALEMBIC PHARMA : INITIATING COVERAGE
Domestic formulations ALPM’s appetite for the specialty segment can be
traced back to 2007, when it acquired non-oncology business of Dabur Pharma for Rs 1.7bn. Through this acquisition, ALPM stepped into the specialty space with 24 brands (revenues of Rs 750mn) in the CVS, Diabetes and Gastro therapies. Over the years ALPM has entered into various other specialty therapies like Opthal, Orthopedic, Nephrology, Respiratory, Derma and Gynecology. This has led to a robust >50% CAGR in ALPM’s specialty portfolio from FY07 to FY13. ALPM’s specialty portfolio stood at ~Rs 4.0bn in FY13 and accounted for ~60% of the domestic formulations revenues.
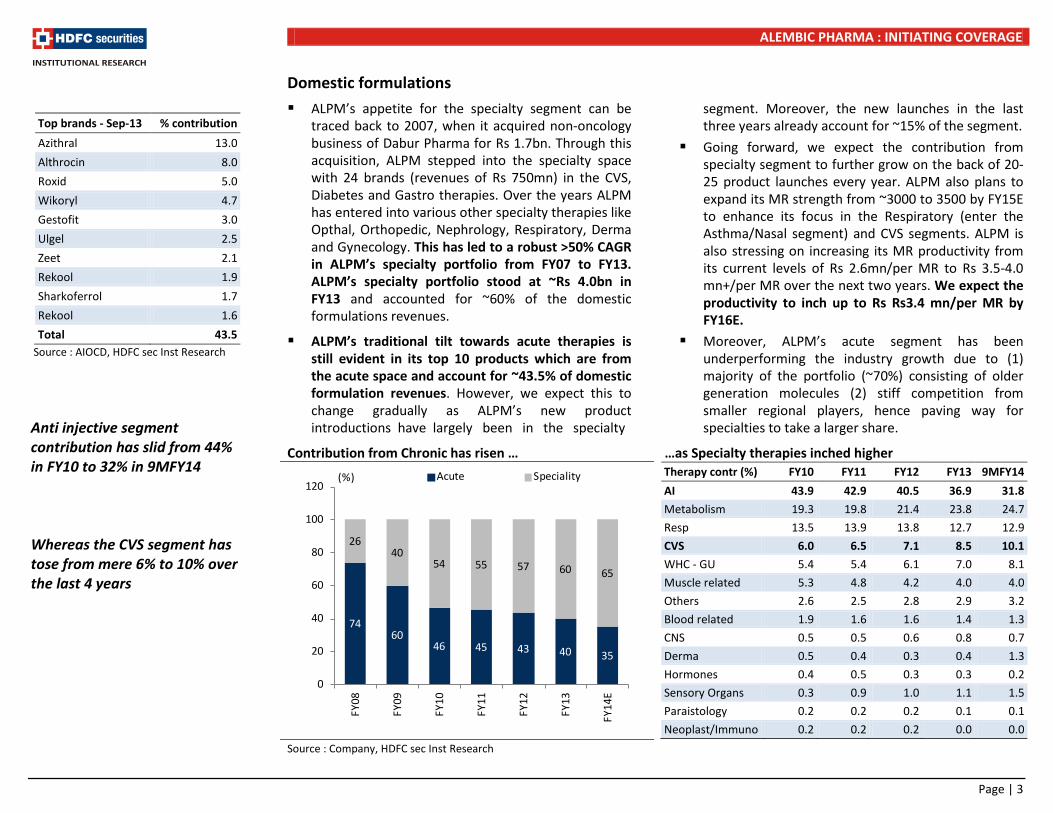
ALPM’s traditional tilt towards acute therapies is still evident in its top 10 products which are from the acute space and account for ~43.5% of domestic formulation revenues. However, we expect this to change gradually as ALPM’s new product introductions have largely been in the specialty
segment. Moreover, the new launches in the last three years already account for ~15% of the segment.
Going forward, we expect the contribution from specialty segment to further grow on the back of 20-25 product launches every year. ALPM also plans to expand its MR strength from ~3000 to 3500 by FY15E to enhance its focus in the Respiratory (enter the Asthma/Nasal segment) and CVS segments. ALPM is also stressing on increasing its MR productivity from its current levels of Rs 2.6mn/per MR to Rs 3.5-4.0 mn+/per MR over the next two years. We expect the productivity to inch up to Rs Rs3.4 mn/per MR by FY16E.
Moreover, ALPM’s acute segment has been underperforming the industry growth due to (1) majority of the portfolio (~70%) consisting of older generation molecules (2) stiff competition from smaller regional players, hence paving way for specialties to take a larger share.
Contribution from Chronic has risen … …as Specialty therapies inched higher
Therapy contr (%) FY10 FY11 FY12 FY13 9MFY14 AI 43.9 42.9 40.5 36.9 31.8 Metabolism 19.3 19.8 21.4 23.8 24.7 Resp 13.5 13.9 13.8 12.7 12.9 CVS 6.0 6.5 7.1 8.5 10.1 WHC - GU 5.4 5.4 6.1 7.0 8.1 Muscle related 5.3 4.8 4.2 4.0 4.0 Others 2.6 2.5 2.8 2.9 3.2 Blood related 1.9 1.6 1.6 1.4 1.3 CNS 0.5 0.5 0.6 0.8 0.7 Derma 0.5 0.4 0.3 0.4 1.3 Hormones 0.4 0.5 0.3 0.3 0.2 Sensory Organs 0.3 0.9 1.0 1.1 1.5 Paraistology 0.2 0.2 0.2 0.1 0.1 Neoplast/Immuno 0.2 0.2 0.2 0.0 0.0
Source : Company, HDFC sec Inst Research
Top brands - Sep-13 % contribution Azithral 13.0 Althrocin 8.0 Roxid 5.0 Wikoryl 4.7 Gestofit 3.0 Ulgel 2.5 Zeet 2.1 Rekool 1.9 Sharkoferrol 1.7 Rekool 1.6 Total 43.5
Source : AIOCD, HDFC sec Inst Research Anti injective segment contribution has slid from 44% in FY10 to 32% in 9MFY14 Whereas the CVS segment has tose from mere 6% to 10% over the last 4 years
7460
46 45 43 40 35
2640
54 55 57 60 65
0
20
40
60
80
100
120
FY08
FY09
FY10
FY11
FY12
FY13
FY14
E
(%) Acute Speciality
Page | 3

ALEMBIC PHARMA : INITIATING COVERAGE
We believe revival in the acute segment will remain an uphill task and expect growth to remain ~3-5%. However, growth in the specialty products would more than make up for the lower growth in the acute space driven by (1) new launches targeting existing specialty segment, (2) entering newer therapies and (3) increasing MR strength. We expect the domestic formulations segment to post 16% CAGR over FY15-16E.
ALPM’s monthly growth in the domestic formulations has outperformed the IPM consistently over the past 10-11 months. Higher growth was led by robust outperformance in the specialty segment compared to industry (refer fig – Growth in specialty therapies).
During 9MFY14, domestic formulations grew by ~11% YoY despite NLEM price cuts and trade margin
related issues. Growth was primarily driven by robust double digit growth in the specialty segment.
ALPM’s continued focus on increasing the specialty segment contribution through better penetration and newer launches will keep the momentum strong in the segment. Moreover, the price increase window available in April for the DPCO products will further cushion the growth. We expect ALPM to post 18% growth in FY15E (partly driven by price increase) and 15% in FY16E for the domestic formulations segment.
NLEM Impact : ALPM’s DPCO contribution prior to the new NLEM policy stood ~25%. Post the new proposed Pharma policy , NLEM, the price controlled products stand at 29% of the domestic formulation revenues. The total impact due to the NLEM is pegged at Rs 250mn (already factored in 1HFY14).
Monthly growth ALPM vs. IPM FY13 - Growth in Specialty therapies
(%) Alembic Industry
Ophthalmology 39 11
Cardio 37 13
Diabetes 41 23
Gastro 27 12
Gynecology 21 7
Nephrology 45 16
Orthopedic 9 8
Source : Company, HDFC sec Inst Research
Specialty therapies like Opthal, Cardio, Gyneac and Nephro have been key drivers for ALPM’s domestic formulations segment ALPM consistently outperformed the IPM for the past 10-11 months We expect ALPM to post 18% growth in FY15E (partly driven by price increase) and 15% in FY16E
-5
0
5
10
15
20
25
30
Apr-
13
May
-13
Jun-
13
Jul-1
3
Aug-
13
Sep-
13
Oct
-13
Nov
-13
Dec-
13
Jan-
14
Feb-
14
Alembic IPM %
Page | 4
ALEMBIC PHARMA : INITIATING COVERAGE
US formulations – the growth engine ALPM has seen its US revenues grow at 37% CAGR
over FY08-13. Growth was mainly driven by consistent product launches in the highly competitive generic space. As on Dec-13, ALPM markets 18 products in the US. Though ALPM’s US revenues are at a mere US$ 50mn (FY14E), its R&D capability has been far better compared to peers. ALPM is the first company to launch Desvenlafaxine (Pfizer’s Pristiq for treating major depressive disorder – market size US$550mn) through NDA route in Mar-13, way ahead of its patent expiry in Jul-22.
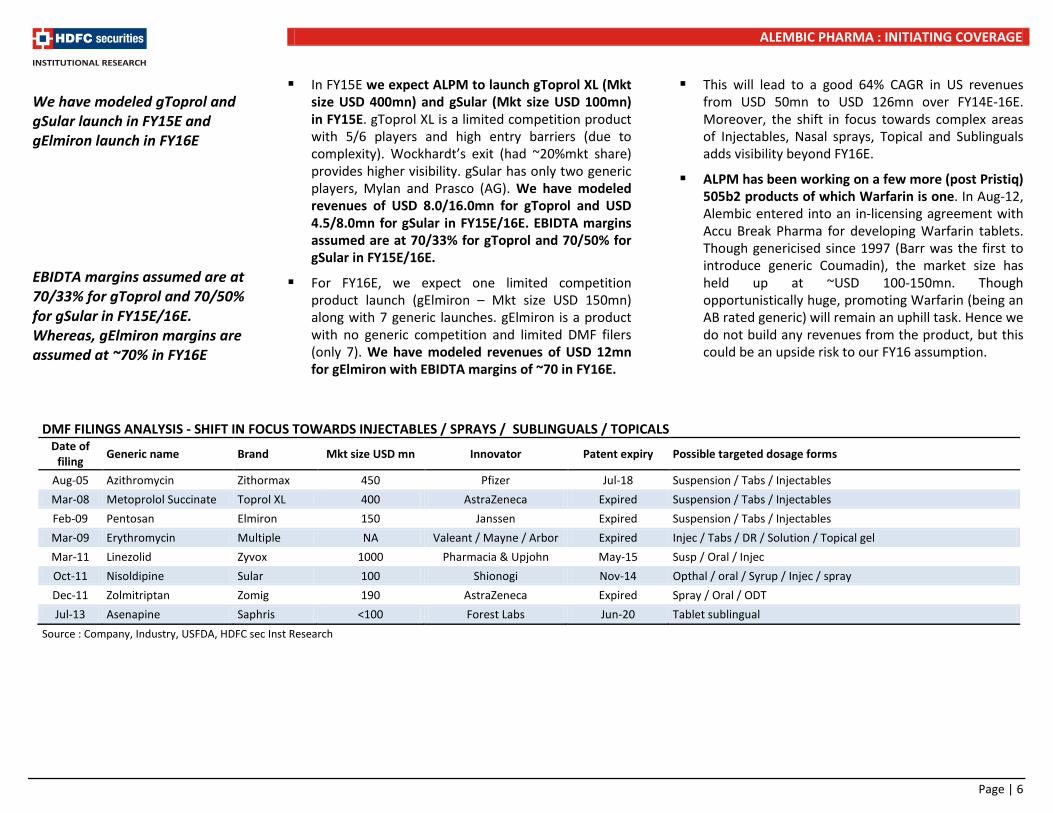
Alembic’s 33 pending ANDAs (of which 27 are Para IVs) as of 9MFY14 and increased R&D efforts towards complex products (evident in DMF filings analysis, refer table – Shift in DMF filings) will be a strong driver for US revenues.
ALPM has built a strong pipeline targeting Para IV opportunities and is incrementally targeting complex products. Post our analysis of the Alembic’s DMF filings we believe Injectables, Nasal sprays, Topical and Sublinguals could be prime areas of interest.
ALPM does not have a front end presence in the US and hence may or may not have filed an ANDA in its own name. Hence we dived into the DMF filings done by Alembic to get a better understanding of the product pipeline.
Our DMF filing analysis suggests ALPM will see a busy FY15/16E. Of the total 25 DMFs (that we felt were of importance) 12 DMF’s pertain to products where the patents have expired.
Moreover, the remaining 13 are the ones wherein the patent is set to expire over the next 2/3 years and hence adds to visibility on launch timelines.
We expect FY15E/16E to be eventful years for ALPM with launches in both generic as well as limited competitive areas. With limited clarity on partners (undisclosed), we go by the guidance of management of 7-8 launches per year. However, we envisage two limited competition launches in FY15E and one in FY16E along with 5-6 generic launches.
ALPM has seen its US revenues grow at 37% CAGR over FY08-13 33 Pending ANDA’s includes 27 Para IV filings Expect US revenues to post 64% CAGR over FY14E-16E from ~USD 52mn to ~USD 126mn
Page | 5
ALEMBIC PHARMA : INITIATING COVERAGE
In FY15E we expect ALPM to launch gToprol XL (Mkt size USD 400mn) and gSular (Mkt size USD 100mn) in FY15E. gToprol XL is a limited competition product with 5/6 players and high entry barriers (due to complexity). Wockhardt’s exit (had ~20%mkt share) provides higher visibility. gSular has only two generic players, Mylan and Prasco (AG). We have modeled revenues of USD 8.0/16.0mn for gToprol and USD 4.5/8.0mn for gSular in FY15E/16E. EBIDTA margins assumed are at 70/33% for gToprol and 70/50% for gSular in FY15E/16E.
For FY16E, we expect one limited competition product launch (gElmiron – Mkt size USD 150mn) along with 7 generic launches. gElmiron is a product with no generic competition and limited DMF filers (only 7). We have modeled revenues of USD 12mn for gElmiron with EBIDTA margins of ~70 in FY16E.
This will lead to a good 64% CAGR in US revenues from USD 50mn to USD 126mn over FY14E-16E. Moreover, the shift in focus towards complex areas of Injectables, Nasal sprays, Topical and Sublinguals adds visibility beyond FY16E.
ALPM has been working on a few more (post Pristiq) 505b2 products of which Warfarin is one. In Aug-12, Alembic entered into an in-licensing agreement with Accu Break Pharma for developing Warfarin tablets. Though genericised since 1997 (Barr was the first to introduce generic Coumadin), the market size has held up at ~USD 100-150mn. Though opportunistically huge, promoting Warfarin (being an AB rated generic) will remain an uphill task. Hence we do not build any revenues from the product, but this could be an upside risk to our FY16 assumption.
We have modeled gToprol and gSular launch in FY15E and gElmiron launch in FY16E EBIDTA margins assumed are at 70/33% for gToprol and 70/50% for gSular in FY15E/16E. Whereas, gElmiron margins are assumed at ~70% in FY16E DMF FILINGS ANALYSIS - SHIFT IN FOCUS TOWARDS INJECTABLES / SPRAYS / SUBLINGUALS / TOPICALS
Date of filing Generic name Brand Mkt size USD mn Innovator Patent expiry Possible targeted dosage forms
Aug-05 Azithromycin Zithormax 450 Pfizer Jul-18 Suspension / Tabs / Injectables Mar-08 Metoprolol Succinate Toprol XL 400 AstraZeneca Expired Suspension / Tabs / Injectables Feb-09 Pentosan Elmiron 150 Janssen Expired Suspension / Tabs / Injectables Mar-09 Erythromycin Multiple NA Valeant / Mayne / Arbor Expired Injec / Tabs / DR / Solution / Topical gel Mar-11 Linezolid Zyvox 1000 Pharmacia & Upjohn May-15 Susp / Oral / Injec Oct-11 Nisoldipine Sular 100 Shionogi Nov-14 Opthal / oral / Syrup / Injec / spray Dec-11 Zolmitriptan Zomig 190 AstraZeneca Expired Spray / Oral / ODT Jul-13 Asenapine Saphris <100 Forest Labs Jun-20 Tablet sublingual
Source : Company, Industry, USFDA, HDFC sec Inst Research
Page | 6
ALEMBIC PHARMA : INITIATING COVERAGE
ALPM’S DMF PIPELINE ANALYSIS - PRODUCTS WITH NO PATAENT PROTECTION Date of
DMF filing Generic name Brand Mkt size USD mn Innovator Patent
expiry Opportunity type Notes
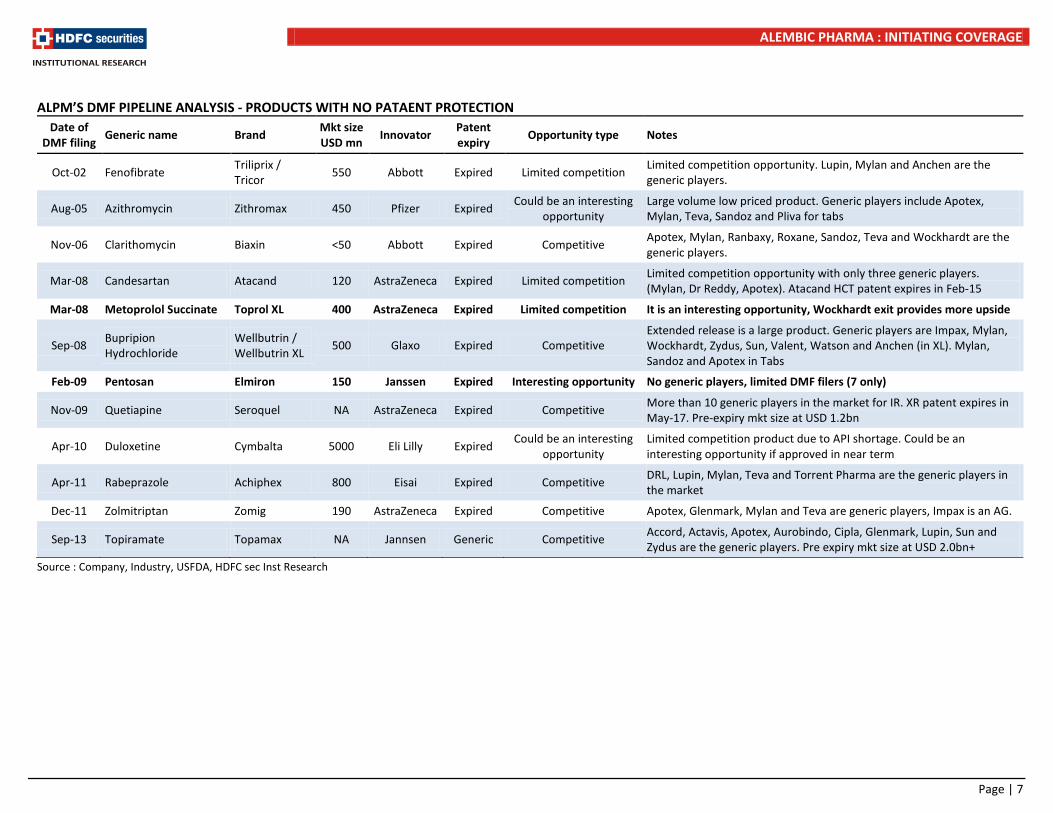
Oct-02 Fenofibrate Triliprix / Tricor 550 Abbott Expired Limited competition Limited competition opportunity. Lupin, Mylan and Anchen are the
generic players.
Aug-05 Azithromycin Zithromax 450 Pfizer Expired Could be an interesting opportunity
Large volume low priced product. Generic players include Apotex, Mylan, Teva, Sandoz and Pliva for tabs
Nov-06 Clarithomycin Biaxin <50 Abbott Expired Competitive Apotex, Mylan, Ranbaxy, Roxane, Sandoz, Teva and Wockhardt are the generic players.
Mar-08 Candesartan Atacand 120 AstraZeneca Expired Limited competition Limited competition opportunity with only three generic players. (Mylan, Dr Reddy, Apotex). Atacand HCT patent expires in Feb-15
Mar-08 Metoprolol Succinate Toprol XL 400 AstraZeneca Expired Limited competition It is an interesting opportunity, Wockhardt exit provides more upside
Sep-08 Bupripion Hydrochloride
Wellbutrin / Wellbutrin XL 500 Glaxo Expired Competitive
Extended release is a large product. Generic players are Impax, Mylan, Wockhardt, Zydus, Sun, Valent, Watson and Anchen (in XL). Mylan, Sandoz and Apotex in Tabs
Feb-09 Pentosan Elmiron 150 Janssen Expired Interesting opportunity No generic players, limited DMF filers (7 only)
Nov-09 Quetiapine Seroquel NA AstraZeneca Expired Competitive More than 10 generic players in the market for IR. XR patent expires in May-17. Pre-expiry mkt size at USD 1.2bn
Apr-10 Duloxetine Cymbalta 5000 Eli Lilly Expired Could be an interesting opportunity
Limited competition product due to API shortage. Could be an interesting opportunity if approved in near term
Apr-11 Rabeprazole Achiphex 800 Eisai Expired Competitive DRL, Lupin, Mylan, Teva and Torrent Pharma are the generic players in the market
Dec-11 Zolmitriptan Zomig 190 AstraZeneca Expired Competitive Apotex, Glenmark, Mylan and Teva are generic players, Impax is an AG.
Sep-13 Topiramate Topamax NA Jannsen Generic Competitive Accord, Actavis, Apotex, Aurobindo, Cipla, Glenmark, Lupin, Sun and Zydus are the generic players. Pre expiry mkt size at USD 2.0bn+
Source : Company, Industry, USFDA, HDFC sec Inst Research
Page | 7

ALEMBIC PHARMA : INITIATING COVERAGE
ALPM’S DMF PIPELINE ANALYSIS - PRODUCTS WITH PATENT EXPIRING IN NEXT THREE YEARS Date of
DMF filing Generic name Brand Mkt size USD mn Innovator Patent
expiry Opportunity type Notes
Nov-10 Celecoxib Celebrex 2200 GD Searle May-14 Competitive Teva, Mylan and Watson are early filers, already have tentative approval. Lupin is other known filer
Sep-12 Lacosamide Vimpat 550 UCB Aug-14 Competitive Multiple Para IV filers (13), including Alembic Pharma
Oct-11 Nisoldipine Sular 100 Shionogi Nov-14 Interesting opportunity Prasco is AG since Apr-12. Mylan is the only generic player to get approval
Mar-11 Linezolid Zyvox 1000 Pharmacia & Upjohn May-15 Competitive
Teva is the only generic player to have final approval. Roxane, Gate Pharma, Glenmark and Mylan have TA. Expect it to be competitive product
Sep-09 Memantine Hydrochloride Nameda 1800 Forest Apr-15 Competitive
Orchid, Apotex (TA), Unichem (TA), Torrent (TA), Teva, Wock (TA), Amneal (TA), Lupin (TA), Mylan (TA), DRL, Upper smith (TA) have approvals
Nov-09 Aripiprazole Abilify 6300 Otuska Apr-15 Competitive Shared FTF with Teva, Sun, Apotex (TA), Sandoz and Cadila (TA). Barr (TA). DRL and Synthon are non-FTF filers
Jun-11 Bosentan Tracleer 1500 Actelion Pharma Nov-15 Interesting opportunity No known Para IV filers, no ANDA approved
Mar-13 Dronedarone Multaq 100 Sanofi Jun-16 Interesting opportunity Para IV filed in Jul-13, 30 month expiry only post Dec-15. Could be an interesting opportunity
Feb-11 Olmesartan Azor / Benicar 2000 Daiichi Oct-16 Competitive More than 25 DMF filers, expected to be competitive
Apr-11 Iloperidone Fanapt <50 Novartis Nov-16 insignificant Small revenue size, 7 DMF filers
Nov-07 Valsartan Diovan 4500 Novartis Apr-17 Competitive Ranbaxy is FTF, no certainty on launch timelines due to ongoing regulatory issues at the plant of FTF player
Mar-12 Prasugrel Effient 400 Eli Lilly Apr-17 Competitive 14 DMF filers, would be a competitive market
Mar-09 Tadalafil Cialis 1000 Elli Lilly Nov-17 Competitive More than 15 DMF filers
Jun-12 Darifenacin Enablex 200 Warner Chilcott Aug-16 Competitive Teva, Anchen, Torrent and Actavis are known filers
Source : Company, Industry, USFDA, HDFC sec Inst Research
Page | 8
ALEMBIC PHARMA : INITIATING COVERAGE
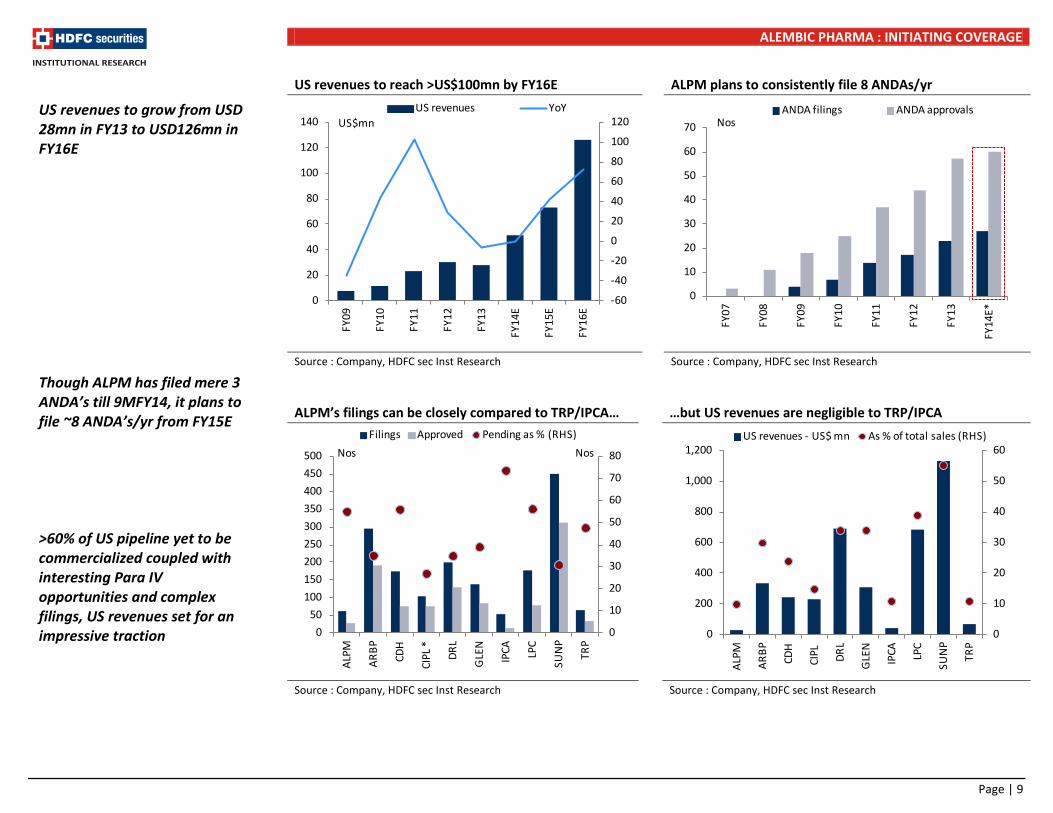
US revenues to reach >US$100mn by FY16E ALPM plans to consistently file 8 ANDAs/yr
Source : Company, HDFC sec Inst Research Source : Company, HDFC sec Inst Research
ALPM’s filings can be closely compared to TRP/IPCA… …but US revenues are negligible to TRP/IPCA
Source : Company, HDFC sec Inst Research Source : Company, HDFC sec Inst Research
US revenues to grow from USD 28mn in FY13 to USD126mn in FY16E Though ALPM has filed mere 3 ANDA’s till 9MFY14, it plans to file ~8 ANDA’s/yr from FY15E >60% of US pipeline yet to be commercialized coupled with interesting Para IV opportunities and complex filings, US revenues set for an impressive traction
0
10
20
30
40
50
60
0
200
400
600
800
1,000
1,200
ALPM
ARBP
CDH
CIPL
DRL
GLE
N
IPCA LP
C
SUN
P
TRP
US revenues - US$ mn As % of total sales (RHS)
0
10
20
30
40
50
60
70
80
050
100150200250300350400450500
ALPM
ARBP
CDH
CIPL
*
DRL
GLE
N
IPCA LP
C
SUN
P
TRP
NosNosFilings Approved Pending as % (RHS)
-60
-40
-20
0
20
40
60
80
100
120
0
20
40
60
80
100
120
140
FY09
FY10
FY11
FY12
FY13
FY14
E
FY15
E
FY16
E
US revenues YoYUS$mn
0
10
20
30
40
50
60
70
FY07
FY08
FY09
FY10
FY11
FY12
FY13
FY14
E*
ANDA filings ANDA approvalsNos
Page | 9

ALEMBIC PHARMA : INITIATING COVERAGE
QUARTERLY HIGHLIGHTS (Rs mn) 3QFY13 4QFY13 1QFY14 2QFY14 3QFY14 YoY (%) QoQ (%) Net Revenues 3,688 3,766 4,266 4,859 4,849 31.5 (0.2) Material Expenses 1,506 1,671 1,724 1,895 1,752 16.3 (7.5) Other Operating Expenses 1,028 929 1,261 1,395 1,433 39.5 2.7 Excise duty (30) 17 8 21 8 (125.2) (63.5) Employee expenses 495 508 564 593 642 29.6 8.2 Operating income 689 641 709 956 1,014 47.2 6.1 Other operating income 5 15 6 5 8 62.5 69.6 EBIDTA 694 656 715 960 1,022 47.3 6.4 Other Income 34 1 0 0 0 (99.4) - Depreciation 89 86 95 99 101 14.4 2.7 Interest expense 39 18 15 26 35 (10.3) 35.4 Exceptional items - - - - - PBT 601 552 605 836 886 47.5 6.0 Tax 118 115 139 189 229 93.7 21.5 RPAT 483 437 466 648 657 36.2 1.5 Adjustments - - - - - APAT 483 437 466 648 657 36.2 1.5 Margin Analysis 3QFY13 4QFY13 1QFY14 2QFY14 3QFY14 YoY (bps) QoQ (bps) Material Expenses as % of Net Sales 40.8 44.4 40.4 39.0 36.1 (471) (286) Other operating expenses as % of
27.9 24.7 24.3 22.3 23.6 (429) 129
Employee expenses as % of Net sales 13.4 13.5 13.2 12.2 13.2 (19) 103 Operating Margin (%) 18.7 17.0 21.9 26.1 26.9 821 81 EBIDTA Margin (%) 18.8 17.3 22.0 26.2 27.0 823 86 APAT Margin (%) 0.0 0.0 0.0 0.0 0.0 0 0 Tax Rate (%) 19.7 20.9 16.7 16.4 19.5 (20) 305 QUARTERLY - SEGMENTAL MIX (Rs mn) 3QFY13 4QFY13 1QFY14 2QFY14 3QFY14 YoY (%) QoQ (%) Domestic revenues 2,527 2,325 2,414 2,866 2,749 8.8 (4.1) Domestic formulations 2,277 2,075 2,212 2,748 2,570 12.9 (6.5) Domestic APIs 250 250 202 118 179 (28.3) 52.5 Export revenues 1,181 1,442 1,845 1,946 2,118 79.4 8.9 Exports formulations - Branded 150 129 122 144 197 31.3 36.8 Exports formulations - Generic 611 777 855 1,137 1,296 112.1 14.0 Exports APIs 420 536 868 665 577 37.3 (13.2) Export incentives 13 17 29 66 48 258.2 (27.3) Gross revenues 3,721 3,783 4,288 4,877 4,915 32.1 0.8 Source : Company, HDFC sec Inst Research
EBIDTA increased by 47% YoY vs. Revenues growth of 31.5% in 3QFY14 at Rs 1,022 led by higher margins Consistent increase improvement in raw material/other operating expenses led by better product mix drove EBIDTA margin expansion Revenue growth was driven by voluminous growth in export generic segment due to higher US traction
Page | 10

ALEMBIC PHARMA : INITIATING COVERAGE
Strong balance sheet/Healthy return ratios ALPM’s policy to outsource ~40-45% of its domestic
formulation requirements paves way for best in class asset turns (Gross block turnover of ~3.0x). ALPM has also been able to halve its working capital days from ~90 levels in FY11 to ~60 in FY14E.
Simultaneously the robust margin expansion over the last 2/3 years (>700bps increase in EBIT/NP margins) have led a whooping 2,000bps increase in RoCE (from ~20% in FY11 to ~43% in FY14E) and ~1000bps increase in RoE (from 29% in FY11 to ~38% in FY14E).
Restricted Capex (GB grew at a mere 8% CAGR FY11-
13) and tight working capital cycle has led to a healthy and consistent free cash flow generation (Rs 2.0bn in FY13). This in turn has helped to significantly lower debt from Rs 3.3bn in FY11 to Rs 1.65bn in 9MFY14. The net debt to equity stands at a healthy 0.2x (as at 1HFY14) from 1.1x in FY11.
We expect ALM to consistently generate free cash flows (Rs 2.5+) owing to restricted capex (guided for Rs 5.0bn in FY15E/16E) and controlled working capital cycle (~60 days). We also envisage the RoCE/RoE to remain best in class at ~40% levels.
DU-PONT ANALYSIS
FY11 FY12 FY13 FY14E FY15E FY16E EBIT margin 11% 13% 15% 18% 20% 20% GB TO 2.75 3.17 3.01 3.41 3.86 4.21 GB / CE 0.69 0.60 0.70 0.69 0.60 0.52 RoCE 20.7% 24.2% 30.6% 43.0% 45.9% 44.0% NPM 7% 9% 11% 14% 15% 16% Asset TO 1.3 1.9 2.1 2.4 2.3 2.2 Equity X 3.1 2.0 1.4 1.2 1.1 1.1 RoE 29% 33% 33% 38% 40% 37% Source : Company, HDFC sec Inst Research
Consistent positive free cash flow Improving working capital cycle
Source : Company, HDFC sec Inst Research Source : Company, HDFC sec Inst Research
350523
2,0132,174
1,922
2,789
0
500
1,000
1,500
2,000
2,500
3,000
FY11
FY12
FY13
FY14
E
FY15
E
FY16
E
Rs mn
0
20
40
60
80
100
120
01020304050607080
FY11
FY12
FY13
FY14
E
FY15
E
FY16
E
Inventory days Debtor daysPayable days Working capital days (RHS)
Page | 11

ALEMBIC PHARMA : INITIATING COVERAGE
Outlook and Valuation ALPM’s strong US pipeline and steady growth in the
domestic market gives us strong visibility over the next two years. We expect revenues to post 26% CAGR in overall revenues led by 16% CAGR in domestic formulations revenues and 56% CAGR in export generic segment (driven by multiple new launches including limited competition products like Trilipix, Sular, Elmiron and Toprol XL).
Limited competition launches in the US, increasing contribution of specialty therapies in the domestic revenues coupled with lower growth in (low margin) acute therapies gives strong visibility on margin expansion. However, front end expansion in developed markets like US/EU and increasing R&D expenses would restrict the EBIDTA margin expansion at ~200bps (from 20.2% in FY14E to 22.4% in FY16E). Sliding interest outgo will lead to 39% CAGR in PAT over the next two years.
Over the past two years Alembic posted ~40% CAGR in PAT driven by sharp expansion in EBIDTA margins from 13.2% in FY11 to ~20% in 9MFY14. The expansion was led by increase in the US revenue contribution and swelling chronic basket in the domestic formulations franchise. This robust performance led to a whooping 4.0x increase in the stock price from ~Rs60 levels to CMP of ~Rs 250-280 levels.
In spite of this sharp run-up we believe there is still value in the stock purely due to the impressive US pipeline. Proven R&D capabilities, swelling chronic contribution in the domestic franchise gives us further comfort.
We initiate coverage on Alembic Pharma. We value ALPM at 15x FY16E EPS of Rs 26.1 and recommend BUY with a TP of Rs 392, an upside of 35% from current levels.
Risks and concerns Margin stability : Alembic Pharma is putting up a
front end presence in developed markets like US and EU, simultaneously it is also working on complex products. Though modeled in our assumption any outgo beyond our expectations would be a risk to our earnings. However, we believe key launches in US and expanding chronic portfolio in domestic segment would cushion the margins against higher expenses.
Regulatory delays or compliance issues : US being the key driver, any delays in product approvals or non compliance issues from the regulatory authorities can impact our earnings estimates significantly.
Adverse currency movements : ALPM derives ~30% of its revenues from exports and does not actively hedge its exposure. Any adverse currency movements may impact our earnings significantly.
Page | 12
ALEMBIC PHARMA : INITIATING COVERAGE
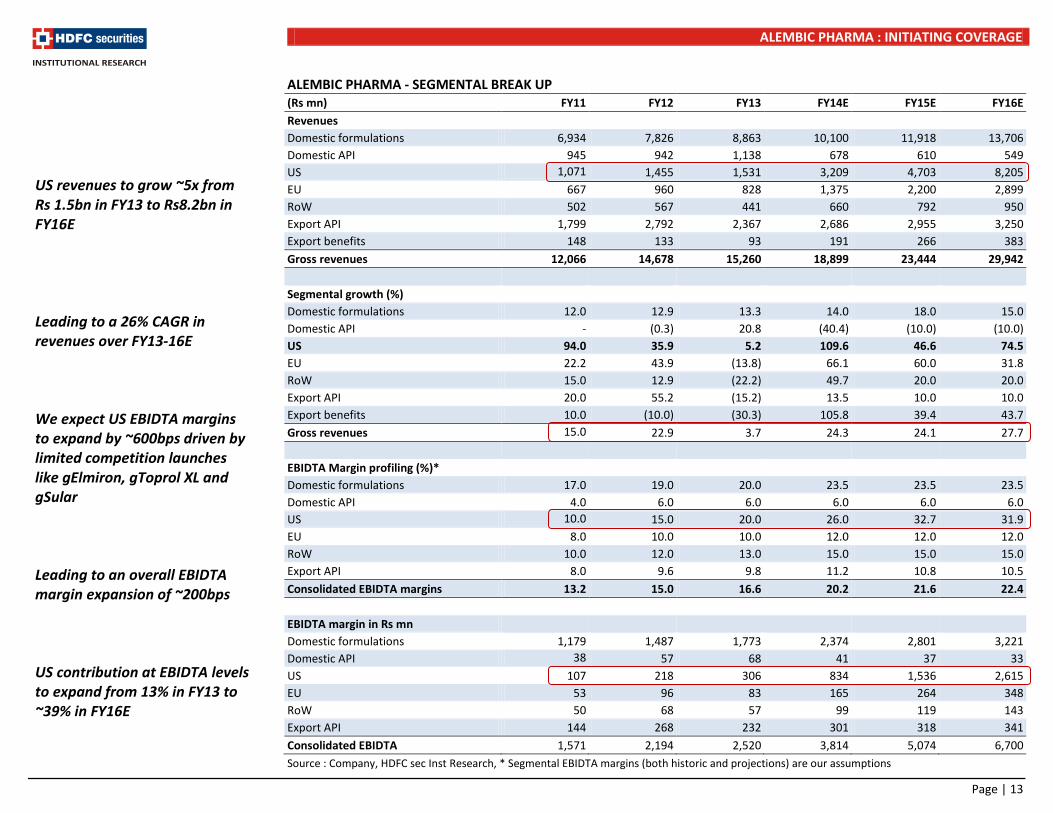
ALEMBIC PHARMA - SEGMENTAL BREAK UP (Rs mn) FY11 FY12 FY13 FY14E FY15E FY16E Revenues Domestic formulations 6,934 7,826 8,863 10,100 11,918 13,706 Domestic API 945 942 1,138 678 610 549 US 1,071 1,455 1,531 3,209 4,703 8,205 EU 667 960 828 1,375 2,200 2,899 RoW 502 567 441 660 792 950 Export API 1,799 2,792 2,367 2,686 2,955 3,250 Export benefits 148 133 93 191 266 383 Gross revenues 12,066 14,678 15,260 18,899 23,444 29,942
Segmental growth (%) Domestic formulations 12.0 12.9 13.3 14.0 18.0 15.0 Domestic API - (0.3) 20.8 (40.4) (10.0) (10.0) US 94.0 35.9 5.2 109.6 46.6 74.5 EU 22.2 43.9 (13.8) 66.1 60.0 31.8 RoW 15.0 12.9 (22.2) 49.7 20.0 20.0 Export API 20.0 55.2 (15.2) 13.5 10.0 10.0 Export benefits 10.0 (10.0) (30.3) 105.8 39.4 43.7 Gross revenues 15.0 22.9 3.7 24.3 24.1 27.7
EBIDTA Margin profiling (%)* Domestic formulations 17.0 19.0 20.0 23.5 23.5 23.5 Domestic API 4.0 6.0 6.0 6.0 6.0 6.0 US 10.0 15.0 20.0 26.0 32.7 31.9 EU 8.0 10.0 10.0 12.0 12.0 12.0 RoW 10.0 12.0 13.0 15.0 15.0 15.0 Export API 8.0 9.6 9.8 11.2 10.8 10.5 Consolidated EBIDTA margins 13.2 15.0 16.6 20.2 21.6 22.4
EBIDTA margin in Rs mn Domestic formulations 1,179 1,487 1,773 2,374 2,801 3,221 Domestic API 38 57 68 41 37 33 US 107 218 306 834 1,536 2,615 EU 53 96 83 165 264 348 RoW 50 68 57 99 119 143 Export API 144 268 232 301 318 341 Consolidated EBIDTA 1,571 2,194 2,520 3,814 5,074 6,700 Source : Company, HDFC sec Inst Research, * Segmental EBIDTA margins (both historic and projections) are our assumptions
US revenues to grow ~5x from Rs 1.5bn in FY13 to Rs8.2bn in FY16E Leading to a 26% CAGR in revenues over FY13-16E We expect US EBIDTA margins to expand by ~600bps driven by limited competition launches like gElmiron, gToprol XL and gSular Leading to an overall EBIDTA margin expansion of ~200bps US contribution at EBIDTA levels to expand from 13% in FY13 to ~39% in FY16E
Page | 13

ALEMBIC PHARMA : INITIATING COVERAGE
PEER VALUATION
CMP (Rs)
Mcap (Rs bn)
EPS P/E EV/EBIDTA RoE (%) FY12 FY13 FY14E FY15E FY12 FY13 FY14E FY15E FY12 FY13 FY14E FY15E FY12 FY13 FY14E FY15E
Alembic Pharma 290 55 8.8 13.6 19.4 26.1 33.1 21.3 14.9 11.1 32.8 20.4 15.4 11.2 36.8 43.8 46.4 46.2 Biocon 431 87 15.3 20.1 24.1 27.9 28.1 21.4 17.9 15.5 14.0 10.9 10.0 8.6 12.9 14.8 15.9 16.4 Indoco 139 12 5.7 6.0 9.1 11.0 24.6 23.2 15.3 12.6 15.0 12.8 9.3 7.1 13.1 12.7 17.0 17.8 IPCA 828 104 29.2 40.9 49.3 57.5 28.3 20.2 16.8 14.4 17.7 13.2 10.6 9.0 26.3 29.7 28.3 26.0 Torrent Pharma 541 92 27.3 33.5 36.0 41.0 19.8 16.1 15.0 13.2 6.0 5.0 7.6 8.2 35.4 34.8 29.3 26.6
Source : Company, HDFC sec Inst Research ASSUMPTIONS Growth for key segments (%) FY12 FY13 FY14E FY15E FY16E
Domestic formulations 12.9 13.3 14.0 18.0 15.0
US generics (in $ terms) 30.3 28.4 51.8 73.5 126.2
Currency
USD/Rs 48.0 54.0 61.0 64.0 65.0 Source : HDFC sec Inst Research Alembic Pharma - One yr fwd PE chart
Source : Company, BSE, HDFC sec Inst Research
0
50
100
150
200
250
300
350
400
Sep-
11O
ct-1
1N
ov-1
1De
c-11
Jan -
12Fe
b-12
Mar
-12
Apr-
12M
ay-1
2Ju
n-12
Jul-1
2Au
g-12
Sep-
12O
ct-1
2N
ov-1
2De
c-12
Jan-
13Fe
b-13
Mar
-13
Apr-
13M
ay-1
3Ju
n-13
Jul-1
3Au
g-13
Sep-
13O
ct-1
3N
ov-1
3De
c-13
Jan-
14Fe
b-14
Mar
-14
20x
15x
10x
5x
Page | 14
ALEMBIC PHARMA : INITIATING COVERAGE
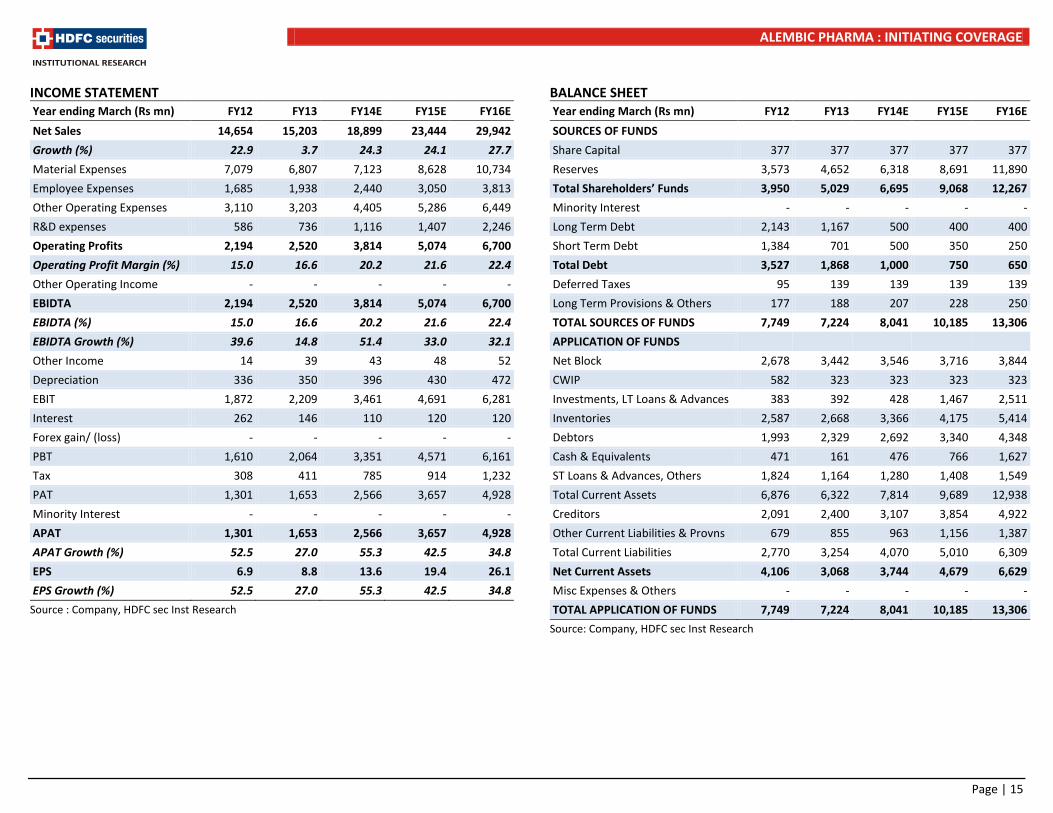
INCOME STATEMENT Year ending March (Rs mn) FY12 FY13 FY14E FY15E FY16E Net Sales 14,654 15,203 18,899 23,444 29,942 Growth (%) 22.9 3.7 24.3 24.1 27.7 Material Expenses 7,079 6,807 7,123 8,628 10,734 Employee Expenses 1,685 1,938 2,440 3,050 3,813 Other Operating Expenses 3,110 3,203 4,405 5,286 6,449 R&D expenses 586 736 1,116 1,407 2,246 Operating Profits 2,194 2,520 3,814 5,074 6,700 Operating Profit Margin (%) 15.0 16.6 20.2 21.6 22.4 Other Operating Income - - - - - EBIDTA 2,194 2,520 3,814 5,074 6,700 EBIDTA (%) 15.0 16.6 20.2 21.6 22.4 EBIDTA Growth (%) 39.6 14.8 51.4 33.0 32.1 Other Income 14 39 43 48 52 Depreciation 336 350 396 430 472 EBIT 1,872 2,209 3,461 4,691 6,281 Interest 262 146 110 120 120 Forex gain/ (loss) - - - - - PBT 1,610 2,064 3,351 4,571 6,161 Tax 308 411 785 914 1,232 PAT 1,301 1,653 2,566 3,657 4,928 Minority Interest - - - - - APAT 1,301 1,653 2,566 3,657 4,928 APAT Growth (%) 52.5 27.0 55.3 42.5 34.8 EPS 6.9 8.8 13.6 19.4 26.1 EPS Growth (%) 52.5 27.0 55.3 42.5 34.8
Source : Company, HDFC sec Inst Research
BALANCE SHEET Year ending March (Rs mn) FY12 FY13 FY14E FY15E FY16E SOURCES OF FUNDS Share Capital 377 377 377 377 377 Reserves 3,573 4,652 6,318 8,691 11,890 Total Shareholders’ Funds 3,950 5,029 6,695 9,068 12,267 Minority Interest - - - - - Long Term Debt 2,143 1,167 500 400 400 Short Term Debt 1,384 701 500 350 250 Total Debt 3,527 1,868 1,000 750 650 Deferred Taxes 95 139 139 139 139 Long Term Provisions & Others 177 188 207 228 250 TOTAL SOURCES OF FUNDS 7,749 7,224 8,041 10,185 13,306 APPLICATION OF FUNDS Net Block 2,678 3,442 3,546 3,716 3,844 CWIP 582 323 323 323 323 Investments, LT Loans & Advances 383 392 428 1,467 2,511 Inventories 2,587 2,668 3,366 4,175 5,414 Debtors 1,993 2,329 2,692 3,340 4,348 Cash & Equivalents 471 161 476 766 1,627 ST Loans & Advances, Others 1,824 1,164 1,280 1,408 1,549 Total Current Assets 6,876 6,322 7,814 9,689 12,938 Creditors 2,091 2,400 3,107 3,854 4,922 Other Current Liabilities & Provns 679 855 963 1,156 1,387 Total Current Liabilities 2,770 3,254 4,070 5,010 6,309 Net Current Assets 4,106 3,068 3,744 4,679 6,629 Misc Expenses & Others - - - - - TOTAL APPLICATION OF FUNDS 7,749 7,224 8,041 10,185 13,306
Source: Company, HDFC sec Inst Research
Page | 15
ALEMBIC PHARMA : INITIATING COVERAGE
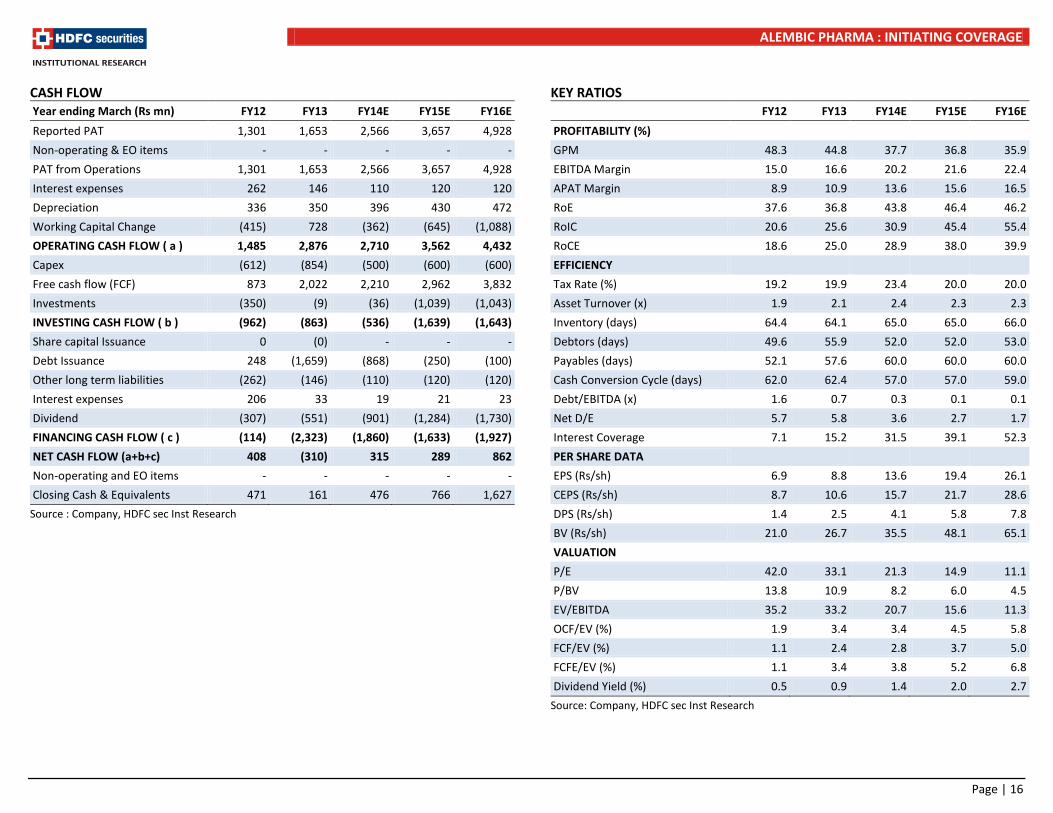
CASH FLOW Year ending March (Rs mn) FY12 FY13 FY14E FY15E FY16E Reported PAT 1,301 1,653 2,566 3,657 4,928 Non-operating & EO items - - - - - PAT from Operations 1,301 1,653 2,566 3,657 4,928 Interest expenses 262 146 110 120 120 Depreciation 336 350 396 430 472 Working Capital Change (415) 728 (362) (645) (1,088) OPERATING CASH FLOW ( a ) 1,485 2,876 2,710 3,562 4,432 Capex (612) (854) (500) (600) (600) Free cash flow (FCF) 873 2,022 2,210 2,962 3,832 Investments (350) (9) (36) (1,039) (1,043) INVESTING CASH FLOW ( b ) (962) (863) (536) (1,639) (1,643) Share capital Issuance 0 (0) - - - Debt Issuance 248 (1,659) (868) (250) (100) Other long term liabilities (262) (146) (110) (120) (120) Interest expenses 206 33 19 21 23 Dividend (307) (551) (901) (1,284) (1,730) FINANCING CASH FLOW ( c ) (114) (2,323) (1,860) (1,633) (1,927) NET CASH FLOW (a+b+c) 408 (310) 315 289 862 Non-operating and EO items - - - - - Closing Cash & Equivalents 471 161 476 766 1,627
Source : Company, HDFC sec Inst Research
KEY RATIOS FY12 FY13 FY14E FY15E FY16E PROFITABILITY (%) GPM 48.3 44.8 37.7 36.8 35.9 EBITDA Margin 15.0 16.6 20.2 21.6 22.4 APAT Margin 8.9 10.9 13.6 15.6 16.5 RoE 37.6 36.8 43.8 46.4 46.2 RoIC 20.6 25.6 30.9 45.4 55.4 RoCE 18.6 25.0 28.9 38.0 39.9 EFFICIENCY Tax Rate (%) 19.2 19.9 23.4 20.0 20.0 Asset Turnover (x) 1.9 2.1 2.4 2.3 2.3 Inventory (days) 64.4 64.1 65.0 65.0 66.0 Debtors (days) 49.6 55.9 52.0 52.0 53.0 Payables (days) 52.1 57.6 60.0 60.0 60.0 Cash Conversion Cycle (days) 62.0 62.4 57.0 57.0 59.0 Debt/EBITDA (x) 1.6 0.7 0.3 0.1 0.1 Net D/E 5.7 5.8 3.6 2.7 1.7 Interest Coverage 7.1 15.2 31.5 39.1 52.3 PER SHARE DATA EPS (Rs/sh) 6.9 8.8 13.6 19.4 26.1 CEPS (Rs/sh) 8.7 10.6 15.7 21.7 28.6 DPS (Rs/sh) 1.4 2.5 4.1 5.8 7.8 BV (Rs/sh) 21.0 26.7 35.5 48.1 65.1 VALUATION P/E 42.0 33.1 21.3 14.9 11.1 P/BV 13.8 10.9 8.2 6.0 4.5 EV/EBITDA 35.2 33.2 20.7 15.6 11.3 OCF/EV (%) 1.9 3.4 3.4 4.5 5.8 FCF/EV (%) 1.1 2.4 2.8 3.7 5.0 FCFE/EV (%) 1.1 3.4 3.8 5.2 6.8 Dividend Yield (%) 0.5 0.9 1.4 2.0 2.7
Source: Company, HDFC sec Inst Research
Page | 16

ALEMBIC PHARMA : INITIATING COVERAGE
Disclaimer: This report has been prepared by HDFC Securities Ltd and is meant for sole use by the recipient and not for circulation. The information and opinions contained herein have been compiled or arrived at,
based upon information obtained in good faith from sources believed to be reliable. Such information has not been independently verified and no guaranty, representation of warranty, express or implied, is made as to its accuracy, completeness or correctness. All such information and opinions are subject to change without notice. This document is for information purposes only. Descriptions of any company or companies or their securities mentioned herein are not intended to be complete and this document is not, and should not be construed as an offer or solicitation of an offer, to buy or sell any securities or other financial instruments. This report is not directed to, or intended for display, downloading, printing, reproducing or for distribution to or use by, any person or entity who is a citizen or resident or located in any locality, state, country or other jurisdiction where such distribution, publication, reproduction, availability or use would be contrary to law or regulation or what would subject HDFC Securities Ltd or its affiliates to any registration or licensing requirement within such jurisdiction. If this report is inadvertently send or has reached any individual in such country, especially, USA, the same may be ignored and brought to the attention of the sender. This document may not be reproduced, distributed or published for any purposes without prior written approval of HDFC Securities Ltd . Foreign currencies denominated securities, wherever mentioned, are subject to exchange rate fluctuations, which could have an adverse effect on their value or price, or the income derived from them. In addition, investors in securities such as ADRs, the values of which are influenced by foreign currencies effectively assume currency risk. It should not be considered to be taken as an offer to sell or a solicitation to buy any security. HDFC Securities Ltd may from time to time solicit from, or perform broking, or other services for, any company mentioned in this mail and/or its attachments. HDFC Securities and its affiliated company(ies), their directors and employees may; (a) from time to time, have a long or short position in, and buy or sell the securities of the company(ies) mentioned herein or (b) be engaged in any other transaction involving such securities and earn brokerage or other compensation or act as a market maker in the financial instruments of the company(ies) discussed herein or act as an advisor or lender/borrower to such company(ies) or may have any other potential conflict of interests with respect to any recommendation and other related information and opinions. HDFC Securities Ltd, its directors, analysts or employees do not take any responsibility, financial or otherwise, of the losses or the damages sustained due to the investments made or any action taken on basis of this report, including but not restricted to, fluctuation in the prices of shares and bonds, changes in the currency rates, diminution in the NAVs, reduction in the dividend or income, etc. HDFC Securities Ltd and other group companies, its directors, associates, employees may have various positions in any of the stocks, securities and financial instruments dealt in the report, or may make sell or purchase or other deals in these securities from time to time or may deal in other securities of the companies / organisations described in this report.
Rating Definitions
BUY : Where the stock is expected to deliver more than 10% returns over the next 12 month period
NEUTRAL : Where the stock is expected to deliver (-)10% to 10% returns over the next 12 month period
SELL : Where the stock is expected to deliver less than (-)10% returns over the next 12 month period
HDFC securities Institutional Equities Unit No. 1602, 16th Floor, Tower A, Peninsula Business Park, Senapati Bapat Marg, Lower Parel, Mumbai - 400 013 Board : +91-22-6171 7330 www.hdfcsec.com
Page | 17