busting the myths of programmer productivity
TRANSCRIPT

1Busting the Myths of Programmer Productivity© 2020 Carnegie Mellon University
[DISTRIBUTION STATEMENT A] This material has been approved for public release and unlimited distribution.
Software Engineering InstituteCarnegie Mellon UniversityPittsburgh, PA 15213
[DISTRIBUTION STATEMENT A] This material has been approved for public release and unlimited distribution.
Busting the Myths of Programmer Productivity
William Nichols
Software Engineering Institute
2Busting the Myths of Programmer Productivity© 2020 Carnegie Mellon University
[DISTRIBUTION STATEMENT A] This material has been approved for public release and unlimited distribution.
Document MarkingsCopyright 2020 Carnegie Mellon University.This material is based upon work funded and supported by the Department of Defense under Contract No. FA8702-15-D-0002 with Carnegie Mellon University for the operation of the Software Engineering Institute, a federally funded research and development center.The view, opinions, and/or findings contained in this material are those of the author(s) and should not be construed as an official Government position, policy, or decision, unless designated by other documentation.NO WARRANTY. THIS CARNEGIE MELLON UNIVERSITY AND SOFTWARE ENGINEERING INSTITUTE MATERIAL IS FURNISHED ON AN "AS-IS" BASIS. CARNEGIE MELLON UNIVERSITY MAKES NO WARRANTIES OF ANY KIND, EITHER EXPRESSED OR IMPLIED, AS TO ANY MATTER INCLUDING, BUT NOT LIMITED TO, WARRANTY OF FITNESS FOR PURPOSE OR MERCHANTABILITY, EXCLUSIVITY, OR RESULTS OBTAINED FROM USE OF THE MATERIAL. CARNEGIE MELLON UNIVERSITY DOES NOT MAKE ANY WARRANTY OF ANY KIND WITH RESPECT TO FREEDOM FROM PATENT, TRADEMARK, OR COPYRIGHT INFRINGEMENT.[DISTRIBUTION STATEMENT A] This material has been approved for public release and unlimited distribution. Please see Copyright notice for non-US Government use and distribution.This material may be reproduced in its entirety, without modification, and freely distributed in written or electronic form without requesting formal permission. Permission is required for any other use. Requests for permission should be directed to the Software Engineering Institute at [email protected] is a service mark of Carnegie Mellon University.DM20-1140

3Busting the Myths of Programmer Productivity© 2020 Carnegie Mellon University
[DISTRIBUTION STATEMENT A] This material has been approved for public release and unlimited distribution.
Measurement of x10 Productivity Differences Replicates!
“One of the most replicated results in software engineering research is the 10-fold difference in productivity and quality between different programmers with the same levels of experience.” – Steve McConnell [McConnell, 2002]
Reported Productivity ranges of 5-1 to 28-1
Sources
[Sackman, 1968] [Card 1987][Curtis 1981] [Boehm and Papaccio 1988] [Mills 1983] [Valett and McGarry 1989],[DeMarco and Lister 1985] [Boehm 1975, 2000][Curtis et al. 1986] [Schwartz, 1968]

4Busting the Myths of Programmer Productivity© 2020 Carnegie Mellon University
[DISTRIBUTION STATEMENT A] This material has been approved for public release and unlimited distribution.
Measurement of x10 Productivity Differences Replicates!
“One of the most replicated results in software engineering research is the 10-fold difference in productivity and quality between different programmers with the same levels of experience.” – Steve McConnell [McConnell, 2002]
But they were wrong! I will show some data to challenge how we think about this and maybe lead to a more nuanced view.
Reported Productivity ranges of 5-1 to 28-1

5Busting the Myths of Programmer Productivity© 2020 Carnegie Mellon University
[DISTRIBUTION STATEMENT A] This material has been approved for public release and unlimited distribution.
Why Does Productivity Range Matter?
Huge productivity ranges between programmers should affect• Benchmarks – I want to be the best!• Hiring - we want the best!• Training – we make the best!• Evaluation – we only keep the best!• Promotion – we recognize the best!• Pay – we pay the best!• Planning – we need the best!

6Busting the Myths of Programmer Productivity© 2020 Carnegie Mellon University
[DISTRIBUTION STATEMENT A] This material has been approved for public release and unlimited distribution.
Questions
1. Does our data replicate the scale of performance range?2. How much does programmer productivity vary?3. What factors (experience, education, the individual) account for the variation?4. What practical effect will the differences have?

7Busting the Myths of Programmer Productivity© 2020 Carnegie Mellon University
[DISTRIBUTION STATEMENT A] This material has been approved for public release and unlimited distribution.
Approach
Sponsored by the SCOPE SEI research project.SCOPE focused on identifying causal relationships from observational data to investigate potentially controllable causes of software development cost.Random Controlled Trials (RCT) are usually not practical in software engineering, so we looked for ways infer causal relationships from observational data.
SCOPE included cutting edge ML techniques for causal inference sponsored by NIH. (Center for Causal Discovery)Use the performance data collected during the Personal Software Process (PSP) course.

8Busting the Myths of Programmer Productivity© 2020 Carnegie Mellon University
[DISTRIBUTION STATEMENT A] This material has been approved for public release and unlimited distribution.
PSP Course Students Write 10 Programs
PSP0Current processBasic measures
PSP1Size estimating
Test report
PSP2Code reviews
Design reviews
PSP3Cyclic development
PSP2.1Design templates
PSP1.1Task planning
Schedule planning
PSP0.1Coding standard
Process improvementproposal
Size measurement
PSP components- Record data with forms and logs- Follow a process with defined
- Scripts, and- Standards
Programs 8,9,10Program 7
Program 1
(Program 10)
Program 2
Program 3Programs 4,5,6
Programs vary in size, but
typically take an afternoon to
complete.

9Busting the Myths of Programmer Productivity© 2020 Carnegie Mellon University
[DISTRIBUTION STATEMENT A] This material has been approved for public release and unlimited distribution.
PSP Data
We have a lot of data, and this is dataset is unique.This version PSP course was taught for about 10 years, primarily to professionals. Each programmer developed the same 10 programs.The programming data includes• 3140 developers and 31,140 programs• 3,355,882 lines of code• 123,996.53 hours of work• 221,346 defectsWe also collected demographic data for experience, education, and so forth.Of these, 494 include complete sets of 10 programs written in “C”.We will only look at these data.

10Busting the Myths of Programmer Productivity© 2020 Carnegie Mellon University
[DISTRIBUTION STATEMENT A] This material has been approved for public release and unlimited distribution.
Data Selection And Analysis
SelectionLimit context to reduce confounding.• Focus only on Programming Effort (limit the scope).• Limit sample to C Programmers (constrain confounders).• Also have large samples of C++, C#, Java, and VB
Analysis• Apply causal search techniques (find direction of causality).• Apply Linear Hierarchical Models and SEM to measure effect size and
quantify variation.

11Busting the Myths of Programmer Productivity© 2020 Carnegie Mellon University
[DISTRIBUTION STATEMENT A] This material has been approved for public release and unlimited distribution.
Causal Search Found “Something about Students”
1) There were no correlations (let alone causation) between experience, education level, or statistics background and productivity.
2) Evidence that Student (j) caused outcome on Assignment (i)
3) But the “within programmer” variation was surprisingly strong. Error terms from mixed model (ANOVA) and SEM showed individual programmer results were only almost as variable as between programmers.Followed up with closer look at the variation.
𝑷𝑷𝑷𝑷𝑷𝑷𝑷𝑷𝑷𝑷𝑷𝑷𝑷𝑷𝑷𝑷𝑷𝑷𝑷𝑷𝑷𝑷[𝐿𝐿𝐿𝐿𝐿𝐿]𝑖𝑖𝑖𝑖= 𝑹𝑹𝑷𝑷𝑹𝑹𝑷𝑷𝑷𝑷𝑷𝑷𝑷𝑷𝑖𝑖 × 𝑆𝑆𝑆𝑆𝑆𝑆𝑆𝑆𝑆𝑆𝑆𝑆𝑆𝑆𝑆𝑆𝑆𝑆𝑆𝑆𝑆𝑆𝑆𝑆𝑆𝑆𝑆𝑆𝑆𝑆𝑆𝑆𝑆𝑆𝑖𝑖𝐷𝐷𝑆𝑆𝐷𝐷𝑆𝑆𝑆𝑆𝑆𝑆𝐷𝐷𝑖𝑖𝑖𝑖 = 𝑃𝑃𝑆𝑆𝑆𝑆𝑃𝑃𝑆𝑆𝑆𝑆𝑃𝑃𝑆𝑆𝑆𝑆𝑃𝑃𝑃𝑃𝐷𝐷𝐷𝐷𝑆𝑆𝑆𝑆𝑆𝑆𝑖𝑖𝑖𝑖 × 𝑆𝑆𝑆𝑆𝑆𝑆𝑆𝑆𝑆𝑆𝑆𝑆𝑆𝑆𝐷𝐷𝑆𝑆𝐷𝐷𝑆𝑆𝑆𝑆𝑆𝑆𝑆𝑆𝑆𝑆𝑆𝑆𝑆𝑆𝑖𝑖
𝑃𝑃𝑆𝑆𝑆𝑆𝑃𝑃𝑆𝑆𝑆𝑆𝑃𝑃𝑃𝑃𝐷𝐷𝐷𝐷𝑆𝑆𝑆𝑆𝑆𝑆𝑖𝑖𝑖𝑖 = 𝑹𝑹𝑷𝑷𝑹𝑹𝑹𝑹𝑷𝑷𝑷𝑷𝑷𝑷𝑷𝑷𝑷𝑷𝑹𝑹𝑹𝑹𝑷𝑷𝑷𝑷𝑷𝑷𝑷𝑷𝑖𝑖× 𝑆𝑆𝑆𝑆𝑆𝑆𝑆𝑆𝑆𝑆𝑆𝑆𝑆𝑆𝑃𝑃𝐷𝐷𝐷𝐷𝑆𝑆𝑆𝑆𝑆𝑆𝑆𝑆𝑆𝑆𝑆𝑆𝑆𝑆𝑆𝑆𝑆𝑆𝑖𝑖

12Busting the Myths of Programmer Productivity© 2020 Carnegie Mellon University
[DISTRIBUTION STATEMENT A] This material has been approved for public release and unlimited distribution.
Total Programmer Relative Effort
360300240180120600
120
100
80
60
40
20
0
(Total Programmer Effort)/(Class Average Effort)
Freq
uenc
y
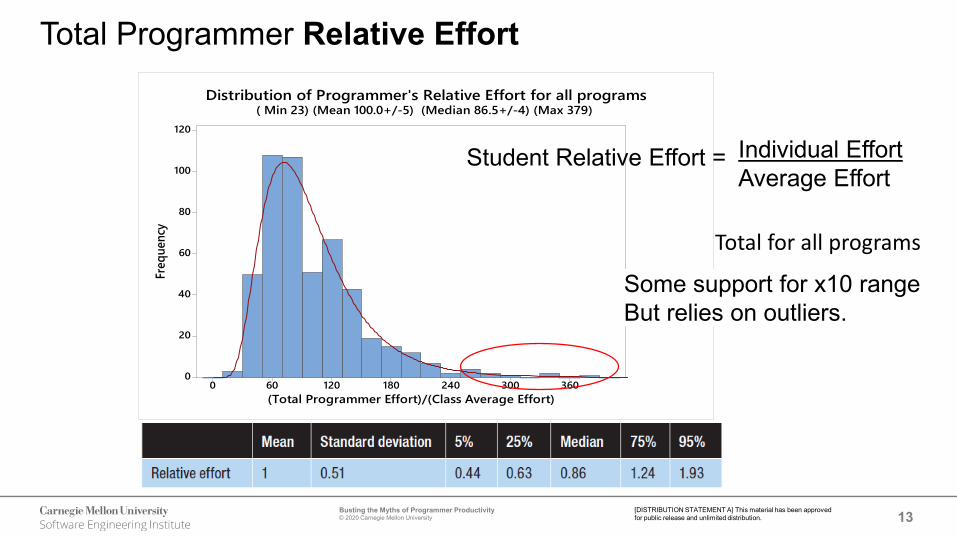
Distribution of Programmer's Relative Effort for all programs( Min 23) (Mean 100.0+/-5) (Median 86.5+/-4) (Max 379)
Student Relative Effort = Individual EffortAverage Effort
Total for all programs
13Busting the Myths of Programmer Productivity© 2020 Carnegie Mellon University
[DISTRIBUTION STATEMENT A] This material has been approved for public release and unlimited distribution.
Total Programmer Relative Effort
360300240180120600
120
100
80
60
40
20
0
(Total Programmer Effort)/(Class Average Effort)
Freq
uenc
y
Distribution of Programmer's Relative Effort for all programs( Min 23) (Mean 100.0+/-5) (Median 86.5+/-4) (Max 379)
Student Relative Effort = Individual EffortAverage Effort
Total for all programs
Some support for x10 rangeBut relies on outliers.

14Busting the Myths of Programmer Productivity© 2020 Carnegie Mellon University
[DISTRIBUTION STATEMENT A] This material has been approved for public release and unlimited distribution.
Total Programmer Relative Effort
360300240180120600
120
100
80
60
40
20
0
(Total Programmer Effort)/(Class Average Effort)
Freq
uenc
y
Distribution of Programmer's Relative Effort for all programs( Min 23) (Mean 100.0+/-5) (Median 86.5+/-4) (Max 379)
Student Relative Effort = Individual EffortAverage Effort
Total for all programs
Some support for x10 rangeBut relies on outliers.Most within x2

15Busting the Myths of Programmer Productivity© 2020 Carnegie Mellon University
[DISTRIBUTION STATEMENT A] This material has been approved for public release and unlimited distribution.
Total Programmer Relative Effort
360300240180120600
120
100
80
60
40
20
0
(Total Programmer Effort)/(Class Average Effort)
Freq
uenc
y
Distribution of Programmer's Relative Effort for all programs( Min 23) (Mean 100.0+/-5) (Median 86.5+/-4) (Max 379)
Student Relative Effort = Individual EffortAverage Effort
Total for all programs
Some support for x10 rangeBut relies on outliers.Most within x2 effortExtremes about x5 effort
So where did the very wide ranges come from?

16Busting the Myths of Programmer Productivity© 2020 Carnegie Mellon University
[DISTRIBUTION STATEMENT A] This material has been approved for public release and unlimited distribution.
Quartiles of Relative Effort for the 10 ProgramsRun Chart
Relative Effort = Individual EffortAverage Effort
1 2 3 4 5 6 7 8 9 10Maximum 4.92 5.44 6.23 4.31 6.11 4.57 4.24 5.94 5.60 5.03Q3 1.27 1.22 1.19 1.29 1.25 1.27 1.26 1.31 1.24 1.26Median 0.82 0.85 0.81 0.85 0.85 0.87 0.87 0.85 0.87 0.82Q1 0.48 0.58 0.52 0.61 0.59 0.59 0.62 0.47 0.60 0.59Minimum 0.09 0.11 0.13 0.14 0.13 0.21 0.20 0.14 0.21 0.19
0.001.002.003.004.005.006.007.00
Rela
tive
Effo
rt
Program Assignment
Programmer Relative Productivity by Program
Max/Min 54.9 51.1 48.5 31.1 46.5 21.8 21.5 41.5 26.6 26.9Q3/Q1 2.6 2.1 2.3 2.1 2.1 2.1 2.0 2.8 2.1 2.1
Normalized Effort by ProgramMean = 1.0

17Busting the Myths of Programmer Productivity© 2020 Carnegie Mellon University
[DISTRIBUTION STATEMENT A] This material has been approved for public release and unlimited distribution.
Min/Max of Relative Effort by Program Are Outliers
1 2 3 4 5 6 7 8 9 10Maximum 4.92 5.44 6.23 4.31 6.11 4.57 4.24 5.94 5.60 5.03Q3 1.27 1.22 1.19 1.29 1.25 1.27 1.26 1.31 1.24 1.26Median 0.82 0.85 0.81 0.85 0.85 0.87 0.87 0.85 0.87 0.82Q1 0.48 0.58 0.52 0.61 0.59 0.59 0.62 0.47 0.60 0.59Minimum 0.09 0.11 0.13 0.14 0.13 0.21 0.20 0.14 0.21 0.19
0.001.002.003.004.005.006.007.00
Rela
tive
Effo
rt
Program Assignment
Programmer Relative Productivity by Program
Max/Min 54.9 51.1 48.5 31.1 46.5 21.8 21.5 41.5 26.6 26.9Q3/Q1 2.6 2.1 2.3 2.1 2.1 2.1 2.0 2.8 2.1 2.1
Program Max/Max extreme and
variable
Someone always did really well
Someone always did poorly

18Busting the Myths of Programmer Productivity© 2020 Carnegie Mellon University
[DISTRIBUTION STATEMENT A] This material has been approved for public release and unlimited distribution.
Min/Max Effort by Program Are Outliers
Interquartile range is narrow and
stable
Programmer performance category changes by program.
1 2 3 4 5 6 7 8 9 10Maximum 4.92 5.44 6.23 4.31 6.11 4.57 4.24 5.94 5.60 5.03Q3 1.27 1.22 1.19 1.29 1.25 1.27 1.26 1.31 1.24 1.26Median 0.82 0.85 0.81 0.85 0.85 0.87 0.87 0.85 0.87 0.82Q1 0.48 0.58 0.52 0.61 0.59 0.59 0.62 0.47 0.60 0.59Minimum 0.09 0.11 0.13 0.14 0.13 0.21 0.20 0.14 0.21 0.19
0.001.002.003.004.005.006.007.00
Rela
tive
Effo
rt
Program Assignment
Programmer Relative Productivity by Program
Max/Min 54.9 51.1 48.5 31.1 46.5 21.8 21.5 41.5 26.6 26.9Q3/Q1 2.6 2.1 2.3 2.1 2.1 2.1 2.0 2.8 2.1 2.1

19Busting the Myths of Programmer Productivity© 2020 Carnegie Mellon University
[DISTRIBUTION STATEMENT A] This material has been approved for public release and unlimited distribution.
Caterpillar Plot of Effort Rank for Within and Between
Vertical shows individual range of ranks (within)
90 % confidence interval for estimate of median
90% confidence in individual rank spans half the sample.
Individual Median Rank
Horizontal positions show developer median rank
(between)

20Busting the Myths of Programmer Productivity© 2020 Carnegie Mellon University
[DISTRIBUTION STATEMENT A] This material has been approved for public release and unlimited distribution.
Best Performers Usually Finished in the First Quintile
Typical 90% interval for
top 5%
90% confidence in individual rank spans half the sample.
Individual Median Rank

21Busting the Myths of Programmer Productivity© 2020 Carnegie Mellon University
[DISTRIBUTION STATEMENT A] This material has been approved for public release and unlimited distribution.
Weakest Performers Were a little More Variable
Typical 90% interval for weakest 5%
90% confidence in individual rank spans half the sample.
Individual Median Rank

22Busting the Myths of Programmer Productivity© 2020 Carnegie Mellon University
[DISTRIBUTION STATEMENT A] This material has been approved for public release and unlimited distribution.
Most Individual Effort Rank Varied by 50% of the Population
Typical 90% interval for middle 50% performers
90% confidence in individual rank spans half the sample.
Individual Median Rank
no effec

23Busting the Myths of Programmer Productivity© 2020 Carnegie Mellon University
[DISTRIBUTION STATEMENT A] This material has been approved for public release and unlimited distribution.
Is there at least an Order of Magnitude range in programmer productivity?

24Busting the Myths of Programmer Productivity© 2020 Carnegie Mellon University
[DISTRIBUTION STATEMENT A] This material has been approved for public release and unlimited distribution.
Is there at least an Order of Magnitude range in programmer productivity?
The question either isn’t very precise, or doesn’t mean the same thing to all people.What do we mean?Programmers have about a x5 range, butMost are within about x2There may be very few much much slower, than average, butThere are not many more than twice average speed
This is for small programs that should not exceed normal capability.
With caveats.
25Busting the Myths of Programmer Productivity© 2020 Carnegie Mellon University
[DISTRIBUTION STATEMENT A] This material has been approved for public release and unlimited distribution.
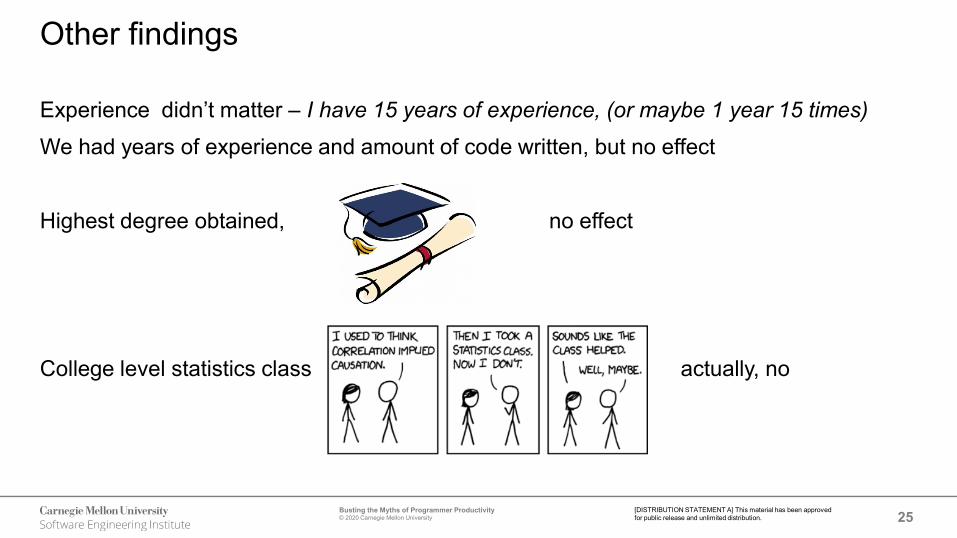
Other findings
Experience didn’t matter – I have 15 years of experience, (or maybe 1 year 15 times)
We had years of experience and amount of code written, but no effect
Highest degree obtained, no effect
College level statistics class actually, no

26Busting the Myths of Programmer Productivity© 2020 Carnegie Mellon University
[DISTRIBUTION STATEMENT A] This material has been approved for public release and unlimited distribution.
Summary, Similar within and between productivity variation
1) IntraCluster Correlation 0.6 (40% of variation within developer)2) New Within variation had not previously been reported3) Wide min/max range remains, but4) Vast majority of developers are within a much narrower “x5” total productivity range,
best and average about “x2”, middle 50% about x25) Single point rather than repeated measures
- Are not reliable (high variation)- Exaggerate range
6) Can get what ever Min/Max ratio you want by varying sample size and other assumptions. Min/Max isn’t very useful by itself.
7) Older studies replicated, but chased the noise

27Busting the Myths of Programmer Productivity© 2020 Carnegie Mellon University
[DISTRIBUTION STATEMENT A] This material has been approved for public release and unlimited distribution.
Limitations of This Study
This study only used C programmers (15% of the sample).Programs are not broadly representative.
• Mostly implement math and numeric • Small• Simple and well defined
Drop out bias? (common problem among the studies)Selection bias for entry?Some “re-use” affects individual program results.Significant differences in productivity remain.

28Busting the Myths of Programmer Productivity© 2020 Carnegie Mellon University
[DISTRIBUTION STATEMENT A] This material has been approved for public release and unlimited distribution.
Implications
This has implications for Industry.• Max/Min ratio doesn’t tell us much because it’s mostly from the low end. We are
measuring outliers not the main effects.• Hard to get enough “top” programmers to affect a large project performance. • Don’t over react to short term variation.
• Look for controllable sources of variation (test, design, reviews).• Recognize outlier events for intervention.• Short term variation swamps other productivity effects.
• Don’t focus just on productivity! Other factors matter too!, environment, design, tooling, reviews, and quality. These matter, are more controllable, and are trainable. Don’t focus excessively on short term productivity.

29Busting the Myths of Programmer Productivity© 2020 Carnegie Mellon University
[DISTRIBUTION STATEMENT A] This material has been approved for public release and unlimited distribution.
Future workLinear mixed models are suggestive.
Relative Effort had the highest intra class correlation of these!Look at effects across programming languages.
Test other long held beliefsHow much does programming language matter?Is Quality free?
0 0.1 0.2 0.3 0.4 0.5 0.6 0.7
Rel Est Error LOCRel Est Error Effort
Defect Density in TestDefect Density Total
Production Rate [LOC/Hr]Relative Effort
Rel EstError LOC
Rel EstError Effort
DefectDensity in
Test
DefectDensity
Total
ProductionRate
[LOC/Hr]
RelativeEffort
Series1 0.032 0.081 0.141 0.255 0.497 0.614
IntraClass Correlation
Data Link: http://ieee-dataport.org/1783

30Busting the Myths of Programmer Productivity© 2020 Carnegie Mellon University
[DISTRIBUTION STATEMENT A] This material has been approved for public release and unlimited distribution.
To Use the PSP and (some TSP) Data
PSP STUDENT ASSIGNMENT DATAPermalink: http://ieee-dataport.org/open-access/psp-student-assignment-dataDOI Link: http://dx.doi.org/10.21227/a5vb-cf02Short Link: http://ieee-dataport.org/1783Citation: William Nichols, Watts Humphrey, Julia Mullaney, James McHale, Dan Burton, Alan Willett, "PSP Student Assignment Data", IEEE Dataport, 2019. [Online]. Available: http://dx.doi.org/10.21227/a5vb-cf02.
The PSP and TSP course materials are available on the SEI Digital Library at https://www.sei.cmu.edu/go/tsp for use under the terms of the Creative Commons licenseTSP data used in the the CESAW report is available as follows:Nichols, W.R. Carnegie Mellon University, 2019. CESAW Fact Sheets. https://kilthub.cmu.edu/articles/CESAW_Project_Data_Fact_sheets/9922697

31Busting the Myths of Programmer Productivity© 2020 Carnegie Mellon University
[DISTRIBUTION STATEMENT A] This material has been approved for public release and unlimited distribution.
Acknowledgements
Mike Konrad and SCOPE project for supporting this workTim Menzies for his guidance and editing for the IEEE articlePSP Instructors and Students who contributed their data
The PSP team
32Busting the Myths of Programmer Productivity© 2020 Carnegie Mellon University
[DISTRIBUTION STATEMENT A] This material has been approved for public release and unlimited distribution.
References
Glass, R. L. Facts and Fallacies of Software Engineering. (2002). Boston, MA: Addison Wesley. McConnell, S. Chapter 30 . What Does 10x Mean ? Measuring Variations in Programmer Productivity. Making software : what really works, and why we believe it (2010). Sackman, H., W. I. Erikson, and E. E. Grant. 1968. "Exploratory Experimental Studies Comparing Online and Offline Programming Performances." Communications of the ACM, Jan.Schwartz, Jules. 1968. "Analyzing Large-Scale System Development." In Software Engineering Concepts and Techniques, Proceedings of the 1968 NATO Conference, edited by Thomas Smith andKaren Billings. New York: Petrocelli/Charter.

33Busting the Myths of Programmer Productivity© 2020 Carnegie Mellon University
[DISTRIBUTION STATEMENT A] This material has been approved for public release and unlimited distribution.
Data Distributions Roughly Log-Normal
Student(j)
Assignment(i,j)
Size [LoC] Effort [Minutes] Defects