Page 1
(TSE 4539)
FY2017 Business Summary(Year Ended March 31 2018)
Contents
1
I FY2017 Business ResultsSales Income 3Pharmaceutical Sales 4Sales Distribution 5Balance Sheet per Share Information 6Cash Flow Expenditure 7
II FY2018 ForecastsSales Income 9Pharmaceutical Sales 10Per Share Information Expenditure 11
Slide
プレゼンター
プレゼンテーションのノート
本日はお手元に配布した資料の目次にありますとおり最初に「2014年3月期 決算の概要」について13次に「2015年3月期 業績予想と取り組み」についてご説明したいと思います13
2
I FY2017 Business Results
Sales Income
3
(yenmn)
of of YOY AchievedAmount Sales Amount Sales () Forecast ()
Net Sales 35689 1000 35331 1000 (10) 35500 995 Pharmaceuticals 34551 968 34279 970 (08) ― ― Others 1137 32 1051 30 (76) ― ―Cost of sales 19449 545 19535 553 04 ― ―SGampA expenses 13403 376 13947 395 41 ― ― RampD expenses 1984 56 2280 65 150 2200 1037Operating income 2836 79 1848 52 (348) 1800 1027
2849 80 1777 50 (376) ― ―
2054 58 1160 33 (435) 1150― 1009 Revised forecast issued on October 31 2017
Net income attributble to owners of the parent
FY2016 FY2017
Income before income taxes and minority interests
SalesFor generic drugs the overall speed of replacement has slowed as substitution rates centered on products with large markets neared government targets In addition due to the rise of authorized generics and increasingly fierce price competition profits in this market are being squeezed For Nippon Chemiphar sales to other makers did not grow as expected because orders from our existing business partners were not as large as anticipated On the other hand sales to medical institutions increased 49 YOY due to newly launched products and the expansion of sales channels mainly by our subsidiary As a result our generic sales increased 31 YOY
Although sales of proprietary products declined 117 the results were in line with our forecasts which included factors such as the impact of substitutions for generic drugs
For the above reasons our sales of ethical pharmaceuticals were yen32153 million (up 20 YOY) and total sales of pharmaceutical products including businesses such as diagnostics were yen34279 million (down 08 YOY)
As a result consolidated sales including other segments were yen 35331 million (down 10 YOY)
Operating incomeDuring FY2017 the cost of sales ratio rose 08 percentage points YOY due to factors including adjusted production volumes of products manufactured within the Nippon Chemiphar Group In addition SGampA expenses ratio rose 19 percentage points YOY to 395 This was due mainly to an increase in upfront strategic expenses such as trial costs ahead of the commencement of commercial production at the Vietnam factory (scheduled for the second half of FY 2018) as well as increased research and development expenses for new and generic drugs As a result operating income was yen1848 million (down 348 YOY)
PL 医薬品① 医薬品② 医薬品③ BS① BS③ 和文にある「前年同期間比」「前期3月末比」は記載が難しく英語版では必要度の低い情報であるとみなして記載をしないこととなった2016年2Q~(木村)ただし期末では記載が可能なので書きます(須田)
CF CAP EX 業績予想① 英語版では経常利益は書かないので注意(須田)
業績予想 ② 業績予想③ Pharmaceutical Sales
4
Generics Proprietary Products (yenmn)
Distrib Distrib YOY AchievedAmount () Amount () () Forecast ()
Total 31513 1000 32153 1000 20 32000 1005 Generics 29204 927 30115 937 31 30000 1004 To medical institutions 27808 29174 49 29100 1003 To other makers 1395 941 (326) 900 1046 Amlodipine 2865 2940 26 2900 1014 Lansoprazole 2279 2163 (51) 2100 1030 Donepezil 1642 1557 (52) 1600 973 Rabeprazole 1586 1558 (18) 1600 974 Limaprost Alfadex 1469 1427 (28) 1400 1020 Pravastatine 1173 1147 (22) 1100 1043 Voglibose 957 870 (91) 900 967 Others 17229 18449 71 18400 1003 Proprietary products 2308 73 2038 63 (117) 2000 1019 Uralyt 1409 1225 (131) 1200 1021 Soleton 679 598 (120) 600 997 Calvan 219 214 (21) 200 1074
Chemiphar ODM Generics (yenmn)
Distrib Distrib YOY AchievedAmount () Amount () () Forecast ()
Total 30445 1000 31100 1000 22 31400 990 Generics 29204 959 30115 968 31 30000 1004 Generics (ODM) 1240 41 985 32 (206) 1400 704 Includes exports Revised forecast issued on October 31 2017
FY2017
FY2016
FY2016
FY2017
PL 医薬品① 医薬品② 医薬品③ BS① BS③ 和文にある「前年同期間比」「前期3月末比」は記載が難しく英語版では必要度の低い情報であるとみなして記載をしないこととなった2016年2Q~(木村)ただし期末では記載が可能なので書きます(須田)
CF CAP EX 業績予想① 英語版では経常利益は書かないので注意(須田)
業績予想 ② 業績予想③ Sales Distribution
5
By Main Therapeutic Categories ()FY2016 FY2017
Cardiovascular and respiratory drugs 309 320Digestive organ drugs 196 183Agents affecting metabolism 164 165Drugs for nervous system sensory organs 99 91Antibiotics and chemotherapeutic drugs 65 62Antineoplastic agents 32 34Others 135 145
By Launch Year (yenmn)
Fiscal Year AmountDistrib
() AmountDistrib
() YOY ()2010 and before 19487 667 19194 637 (15)2011 2348 80 2210 73 (59)2012 1484 51 1404 47 (54)2013 2917 100 3127 104 722014 1746 60 1937 64 1102015 1001 34 1222 41 2212016 219 08 459 15 10912017 ― ― 558 19 ―Total 29204 1000 30115 1000 31
FY2016 FY2017
PL 医薬品① 医薬品② 医薬品③ BS① BS③ 和文にある「前年同期間比」「前期3月末比」は記載が難しく英語版では必要度の低い情報であるとみなして記載をしないこととなった2016年2Q~(木村)ただし期末では記載が可能なので書きます(須田)
CF CAP EX 業績予想① 英語版では経常利益は書かないので注意(須田)
業績予想 ② 業績予想③ PL 医薬品① 医薬品② 医薬品③ BS① BS③ 和文にある「前年同期間比」「前期3月末比」は記載が難しく英語版では必要度の低い情報であるとみなして記載をしないこととなった2016年2Q~(木村)ただし期末では記載が可能なので書きます(須田)
CF CAP EX 業績予想① 英語版では経常利益は書かないので注意(須田)
業績予想 ② 業績予想③ Balance Sheet per Share Information
6
Per Share Information (yen)FY2016Amount Amount Change Forecast
Earnings per share 53002 31528 (21474) 30673Book value per share 454880 485986 31106 ―Dividend per share 10000 10000 ― 10000Dividend payout ratio () 189 317 ― 326 Revised forecast issued on October 31 2017
FY2017
Balance Sheet Data (yenmn)March 31 2017
Amount Amount ChangeTotal assets 47002 46814 (187) Return on assets () 63 36 (27)Net assets 17355 17487 132 Owned capital 17346 17474 127 Capital-to-asset ratio () 369 373 04 Return on equity () 123 67 (56)Current assets 29009 28334 (674)Current liabilities 14939 14914 (25) Current ratio (x) 194 19 (004)
March 31 2018
PL 医薬品① 医薬品② 医薬品③ BS① BS③ 和文にある「前年同期間比」「前期3月末比」は記載が難しく英語版では必要度の低い情報であるとみなして記載をしないこととなった2016年2Q~(木村)ただし期末では記載が可能なので書きます(須田)
CF CAP EX 業績予想① 英語版では経常利益は書かないので注意(須田)
業績予想 ② 業績予想③ PL 医薬品① 医薬品② 医薬品③ BS① BS③ 和文にある「前年同期間比」「前期3月末比」は記載が難しく英語版では必要度の低い情報であるとみなして記載をしないこととなった2016年2Q~(木村)ただし期末では記載が可能なので書きます(須田)
CF CAP EX 業績予想① 英語版では経常利益は書かないので注意(須田)
業績予想 ② 業績予想③ Cash Flow Expenditure
7
Cash Flow Statements (yenmn)FY2016 FY2017Amount Amount
Net cash Provided by operating activities 2737 3188 Used in investing activities (2504) (1606) Provided by (Used in) financing activities 787 (1741)Cash and cash equivalents 8084 7890Free cash flow 232 1582
Capital Expenditure and Other (yenmn)FY2016
UsageAmount Amount YOY () Forecast Rate ()
Capital expenditure 2928 1645 (438) 1650 997Depreciation and amortization 1112 1192 72 1250 954 Revised forecast issued on October 31 2017
Items
FY2017
PL 医薬品① 医薬品② 医薬品③ BS① BS③ 和文にある「前年同期間比」「前期3月末比」は記載が難しく英語版では必要度の低い情報であるとみなして記載をしないこととなった2016年2Q~(木村)ただし期末では記載が可能なので書きます(須田)
CF CAP EX 業績予想① 英語版では経常利益は書かないので注意(須田)
業績予想 ② 業績予想③ PL 医薬品① 医薬品② 医薬品③ BS① BS③ 和文にある「前年同期間比」「前期3月末比」は記載が難しく英語版では必要度の低い情報であるとみなして記載をしないこととなった2016年2Q~(木村)ただし期末では記載が可能なので書きます(須田)
CF CAP EX 業績予想① 英語版では経常利益は書かないので注意(須田)
業績予想 ② 業績予想③ 8
II FY2018 Forecasts
Sales Income
9
(yenmn)
of of YOYAmount Sales Amount Sales ()
Net Sales 35331 1000 35500 1000 05 Pharmaceuticals 34279 970 ― ― ― Others 1051 30 ― ― ―Cost of sales 19535 553 ― ― ―SGampA expenses 13947 395 ― ― ― RampD expenses 2280 65 2700 76 184Operating income 1848 52 1100 31 (405)
1777 50 ― ― ―
1160 33 500 14 (569)Net income attributble to owners of the parent
FY2018 (Forecast)FY2017
Income before income taxes and minority interests
Annual ForecastSales and profit in FY2018 will be impacted by NHI drug price revisions On the other hand however due to our focus on newly launched products and expansion of new sales channels sales of generic drugs are expected to be nearly flat compared to the previous fiscal year As a result consolidated net sales including other businesses such as contracted testing business are projected to be yen35500 million (up 05 YOY)
Regarding profits due to increased development costs as the progress in new drug development and continued strategic expenses such as trial costs leading up to the commencement of commercial production at the Vietnam factory operating income is forecast at yen1100 million (down 405 YOY) and net income attributable to owners of the parent is expected to be yen500 million (down 569 YOY)
PL 医薬品① 医薬品② 医薬品③ BS① BS③ 和文にある「前年同期間比」「前期3月末比」は記載が難しく英語版では必要度の低い情報であるとみなして記載をしないこととなった2016年2Q~(木村)ただし期末では記載が可能なので書きます(須田)
CF CAP EX 業績予想① 英語版では経常利益は書かないので注意(須田)
業績予想 ② 業績予想③ Pharmaceutical Sales
10
Generics Proprietary Products (yenmn)FY2017Amount Amount YOY ()
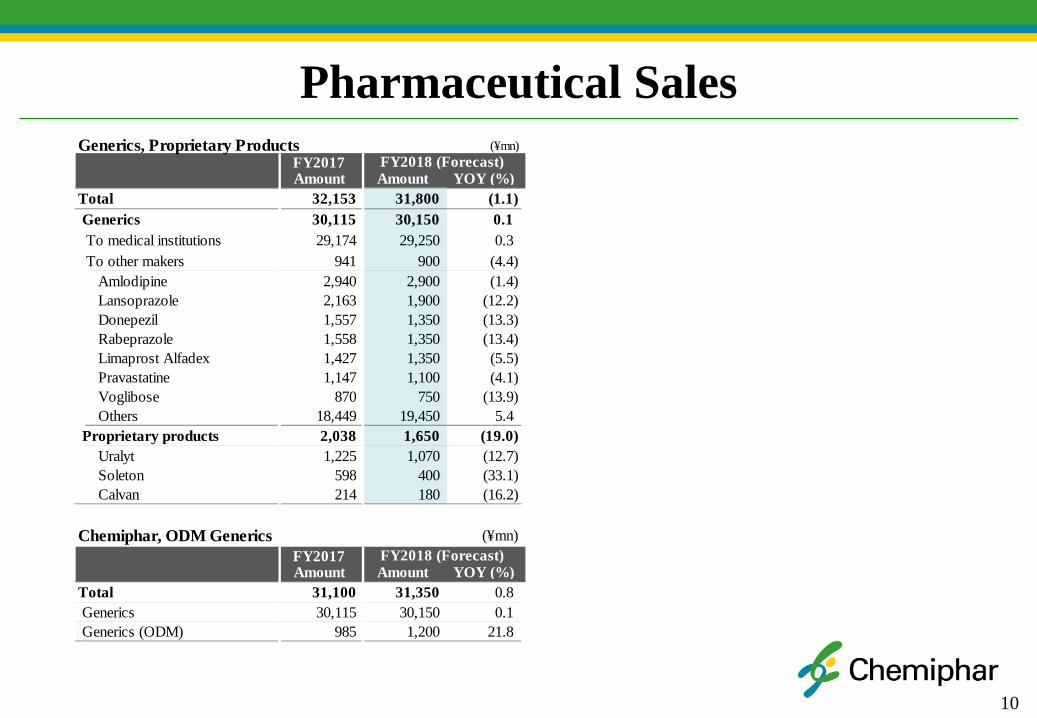
Total 32153 31800 (11) Generics 30115 30150 01 To medical institutions 29174 29250 03 To other makers 941 900 (44) Amlodipine 2940 2900 (14) Lansoprazole 2163 1900 (122) Donepezil 1557 1350 (133) Rabeprazole 1558 1350 (134) Limaprost Alfadex 1427 1350 (55) Pravastatine 1147 1100 (41) Voglibose 870 750 (139) Others 18449 19450 54 Proprietary products 2038 1650 (190) Uralyt 1225 1070 (127) Soleton 598 400 (331) Calvan 214 180 (162)
Chemiphar ODM Generics (yenmn)FY2017Amount Amount YOY ()
Total 31100 31350 08 Generics 30115 30150 01 Generics (ODM) 985 1200 218
FY2018 (Forecast)
FY2018 (Forecast)
PL 医薬品① 医薬品② 医薬品③ BS① BS③ 和文にある「前年同期間比」「前期3月末比」は記載が難しく英語版では必要度の低い情報であるとみなして記載をしないこととなった2016年2Q~(木村)ただし期末では記載が可能なので書きます(須田)
CF CAP EX 業績予想① 英語版では経常利益は書かないので注意(須田)
業績予想 ② 業績予想③ Per Share Information Expenditure
11
For further information contactPublic Relations Department Nippon Chemiphar Co LtdE-mail irchemipharcojp
Note about Forward-looking Statements and ForecastsStatements made in this Highlights of Business Results with respect to current plans estimates strategies and beliefs and other statements of Nippon Chemiphar that are not historical facts are forward-looking statements about the future performance of Nippon Chemiphar
These statements are based on managementrsquos current assumptions and beliefs in light of the information currently available to it and involve known and unknown risks and uncertainties Consequently undue reliance should not be placed on these statements
Nippon Chemiphar cautions the reader that a number of important factors could cause actual results to differ materially from those discussed in the forward-looking statements
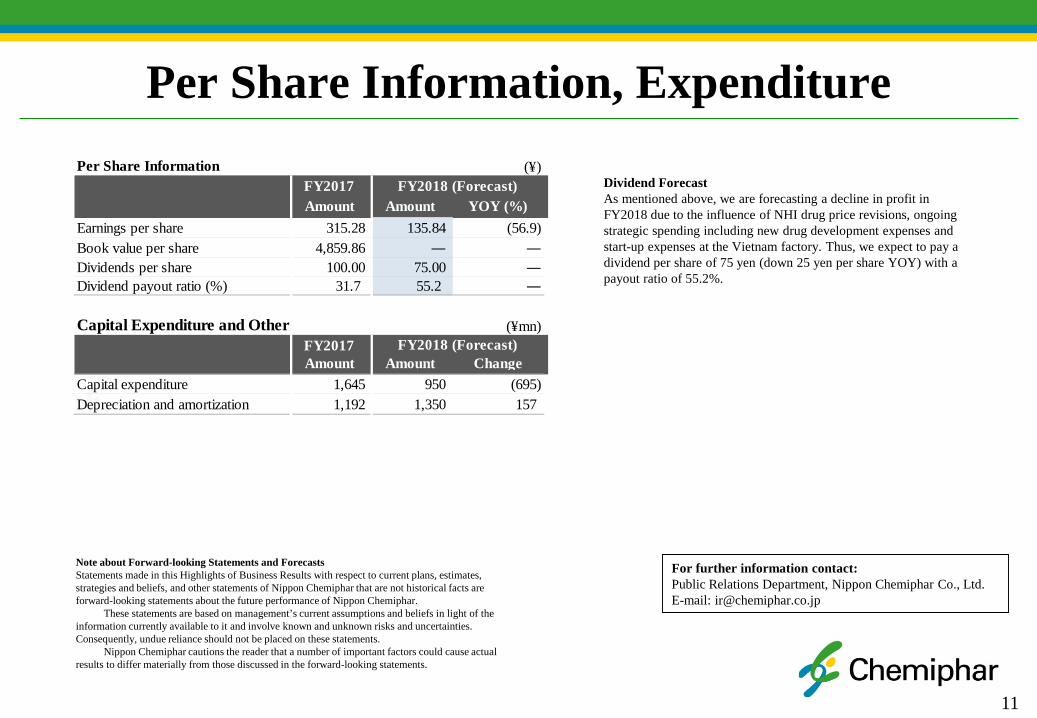
Per Share Information (yen)FY2017Amount Amount YOY ()
Earnings per share 31528 13584 (569)Book value per share 485986 ― ―Dividends per share 10000 7500 ―Dividend payout ratio () 317 552 ―
Capital Expenditure and Other (yenmn)FY2017Amount Amount Change
Capital expenditure 1645 950 (695)Depreciation and amortization 1192 1350 157
FY2018 (Forecast)
FY2018 (Forecast)
Dividend ForecastAs mentioned above we are forecasting a decline in profit in FY2018 due to the influence of NHI drug price revisions ongoing strategic spending including new drug development expenses and start-up expenses at the Vietnam factory Thus we expect to pay a dividend per share of 75 yen (down 25 yen per share YOY) with a payout ratio of 552
PL 医薬品① 医薬品② 医薬品③ BS① BS③ 和文にある「前年同期間比」「前期3月末比」は記載が難しく英語版では必要度の低い情報であるとみなして記載をしないこととなった2016年2Q~(木村)ただし期末では記載が可能なので書きます(須田)
CF CAP EX 業績予想① 英語版では経常利益は書かないので注意(須田)
業績予想 ② 業績予想③ スライド番号 1 Contents スライド番号 3 Sales Income Pharmaceutical Sales Sales Distribution Balance Sheet per Share Information Cash Flow Expenditure スライド番号 9 Sales Income Pharmaceutical Sales Per Share Information Expenditure Per Share Information (yen) FY2017 FY2018 (Forecast) Amount Amount YOY () Earnings per share 31528 13584 (569) Book value per share 485986 ― ― Dividends per share 10000 7500 ― Dividend payout ratio () 317 552 ― Capital Expenditure and Other (yenmn) FY2017 FY2018 (Forecast) Amount Amount Change Capital expenditure 1645 950 (695) Depreciation and amortization 1192 1350 157 2015年3月期 ガツキ 2016年3月期(予想) ガツキ ヨソウ 金額 キンガク 金額 キンガク 増減額 ゾウゲンガク 増減率 ゾウゲン リツ 医療用医薬品 イリョウヨウ イヤクヒン 27400 30950 +05 ジェネリック医薬品(荷離) イヤクヒン ニ バナレ 25079 27430 +01 内自社販売 ウチ ジシャ ハンバイ 2321 25100 +01 内導出輸出 ウチ ドウシュツ ユシュツ 3011 2330 +04 アムロジピン 1935 3040 +09 ランソプラゾール 1509 1890 24 プラバスタチン 1595 1570 +40 ラベプラゾール 1704 1570 16 リマプロストアルファデクス 1273 1660 26 ボグリボース 1013 1300 +21 ドネペジル 15357 1030 +16 その他 タ 3400 15370 +01 主力品 シュリョク ヒン 1975 3520 +35 ウラリット 1134 1970 03 ソレトン 290 1250 +102 カルバン 0 300 +34 ジェネリック医薬品事業 イヤクヒン ジギョウ 2015年3月期 ガツキ 2016年3月期(予想) ガツキ ヨソウ 金額 キンガク 金額 キンガク 増減額 ゾウゲンガク 増減率 ゾウゲン リツ ジェネリック医薬品事業 イヤクヒン ジギョウ 28918 28840 +1003 ジェネリック医薬品(荷離) イヤクヒン ニ バナレ 27400 27430 +999 受託 ジュタク 1518 1410 +1077
Generics Proprietary Products (yenmn) FY2017 FY2018 (Forecast) Amount Amount YOY () Total 32153 31800 (11) Generics 30115 30150 01 To medical institutions 29174 29250 03 To other makers 941 900 (44) Amlodipine 2940 2900 (14) Lansoprazole 2163 1900 (122) Donepezil 1557 1350 (133) Rabeprazole 1558 1350 (134) Limaprost Alfadex 1427 1350 (55) Pravastatine 1147 1100 (41) Voglibose 870 750 (139) Others 18449 19450 54 Proprietary products 2038 1650 (190) Uralyt 1225 1070 (127) Soleton 598 400 (331) Calvan 214 180 (162) Chemiphar ODM Generics (yenmn) FY2017 FY2018 (Forecast) Amount Amount YOY () Total 31100 31350 08 Generics 30115 30150 01 Generics (ODM) 985 1200 218
Income Statement Overview (yenmn) FY2017 FY2018 (Forecast) of of YOY Amount Sales Amount Sales () Net Sales 35331 1000 35500 1000 05 Pharmaceuticals 34279 970 ― ― ― Others 1051 30 ― ― ― Cost of sales 19535 553 ― ― ― SGampA expenses 13947 395 ― ― ― RampD expenses 2280 65 2700 76 184 Operating income 1848 0 52 1100 31 (405) Income before income taxes and minority interests 1777 80 ― ― ― Net income attributble to owners of the parent 1160 33 500 14 (569)
Capital Expenditure and Other (yenmn) Items FY2016 FY2017 Usage Amount Amount YOY () Forecast Rate () Capital expenditure 2928 1645 (438) 1650 997 Depreciation and amortization 1112 1192 72 1250 954 Revised forecast issued on October 31 2017
Cash Flow Statements (yenmn) FY2016 FY2017 Amount Amount Net cash Provided by operating activities 2737 3188 Used in investing activities (2504) (1606) Used in financing activities 787 (1741) Cash and cash equivalents 8084 7890 Free cash flow 232 1582
Per Share Information (yen) FY2016 FY2017 Amount Amount Change Forecast Earnings per share 53002 31528 (21474) 30673 Book value per share 454880 485986 31106 ― Dividend per share 10000 10000 ― 10000 Dividend payout ratio () 189 317 ― 326 Revised forecast issued on October 31 2017
Balance Sheet Data (yenmn) March 31 2017 August 31 2017 March 31 2015 Amount Amount Change Total assets 47002 46814 3358 (187) Return on assets () 63 36 -06 (27) Net assets 17355 17487 1313 132 Owned capital 17346 17474 1312 127 Capital-to-asset ratio () 369 373 02 +04 Return on equity () 123 67 (01) (56) Current assets 29009 28334 1630 (674) Current liabilities 14939 14914 (716) (25) Current ratio (x) 194 19 019 004
By Main Therapeutic Categories () FY2016 FY2017 Cardiovascular and respiratory drugs 309 320 Digestive organ drugs 196 183 Agents affecting metabolism 164 165 Drugs for nervous system sensory organs 99 91 Antibiotics and chemotherapeutic drugs 65 62 Antineoplastic agents 32 34 Others 135 145
Sales Distribution By Launch Year (yenmn) FY2016 FY2017 Fiscal Year Amount Distrib () Amount Distrib () YOY () 2010 and before 19487 1 667 19194 637 (15) 2009 2011 2348 0 80 2210 73 (59) 2012 1484 0 51 1404 47 (54) 2013 2917 0 100 3127 104 72 2014 1746 0 60 1937 64 110 2015 1001 0 34 1222 41 221 2016 219 0 08 459 15 1091 2017 ― ― ― 558 19 ― Total 29204 1 1000 30115 1000 31
Generics Proprietary Products (yenmn) FY2016 FY2017 Distrib Distrib YOY Achieved Amount () Amount () () Forecast () Total 31513 1 1000 32153 1 1000 20 32000 1005 Generics 29204 1 927 30115 1 937 31 30000 1 1004 To medical institutions 27808 29174 49 29100 1 1003 To other makers 1395 941 (326) 900 1 1046 Amlodipine 2865 2940 26 2900 1 1014 Lansoprazole 2279 2163 (51) 2100 1 1030 Donepezil 1642 1557 (52) 1600 1 973 Rabeprazole 1586 1558 (18) 1600 1 974 Limaprost Alfadex 1469 1427 (28) 1400 1 1020 Pravastatine 1173 1147 (22) 1100 1 1043 Voglibose 957 870 (91) 900 1 967 Others 17229 18449 71 18400 1 1003 Proprietary products 2308 0 73 2038 0 63 (117) 2000 1 1019 Uralyt 1409 1225 (131) 1200 1 1021 Soleton 679 598 (120) 600 1 997 Calvan 219 214 (21) 200 1 1074 Chemiphar ODM Generics (yenmn) FY2016 FY2017 Distrib Distrib YOY Achieved Amount () Amount () () Forecast () Total 30445 1000 31100 1000 22 31400 990 Generics 29204 959 30115 968 31 30000 1004 Generics (ODM) 1240 41 985 32 (206) 1400 704 Includes exports Revised forecast issued on October 31 2017
Income Statement Overview (yenmn) FY2016 FY2017 of of YOY Achieved Amount Sales Amount Sales () Forecast () Net Sales 35689 1 1000 35331 1 1000 (10) 35500 1 995 Pharmaceuticals 34551 1 968 34279 1 970 (08) ― ― ― Others 1137 0 32 1051 0 30 (76) ― ― ― Cost of sales 19449 1 545 19535 1 553 04 ― ― ― SGampA expenses 13403 0 376 13947 0 395 41 ― ― ― RampD expenses 1984 0 56 2280 0 65 150 2200 0 1037 Operating income 2836 0 79 1848 0 52 (348) 1800 0 1027 Income before income taxes and minority interests 2849 0 80 1696 0 48 (405) 1700 ― 998 Net income attributble to owners of the parent 2054 0 58 1160 0 33 (435) 1150 ― 1009 1961 00550933658 00550933658 00575628587 Revised forecast issued on October 31 2017
Per Share Information (yen) FY2017 FY2018 (Forecast) Amount Amount YOY () Earnings per share 31528 13584 (569) Book value per share 485986 ― ― Dividends per share 10000 7500 ― Dividend payout ratio() 317 552 ― Capital Expenditure and Other (yenmn) FY2017 FY2018 (Forecast) Amount Amount Change Capital expenditure 1645 950 (695) Depreciation and amortization 1192 1350 157 2015年3月期 ガツキ 2016年3月期(予想) ガツキ ヨソウ 金額 キンガク 金額 キンガク 増減額 ゾウゲンガク 増減率 ゾウゲン リツ 医療用医薬品 イリョウヨウ イヤクヒン 27400 30950 +05 ジェネリック医薬品(荷離) イヤクヒン ニ バナレ 25079 27430 +01 内自社販売 ウチ ジシャ ハンバイ 2321 25100 +01 内導出輸出 ウチ ドウシュツ ユシュツ 3011 2330 +04 アムロジピン 1935 3040 +09 ランソプラゾール 1509 1890 24 プラバスタチン 1595 1570 +40 ラベプラゾール 1704 1570 16 リマプロストアルファデクス 1273 1660 26 ボグリボース 1013 1300 +21 ドネペジル 15357 1030 +16 その他 タ 3400 15370 +01 主力品 シュリョク ヒン 1975 3520 +35 ウラリット 1134 1970 03 ソレトン 290 1250 +102 カルバン 0 300 +34 ジェネリック医薬品事業 イヤクヒン ジギョウ 2015年3月期 ガツキ 2016年3月期(予想) ガツキ ヨソウ 金額 キンガク 金額 キンガク 増減額 ゾウゲンガク 増減率 ゾウゲン リツ ジェネリック医薬品事業 イヤクヒン ジギョウ 28918 28840 +1003 ジェネリック医薬品(荷離) イヤクヒン ニ バナレ 27400 27430 +999 受託 ジュタク 1518 1410 +1077
Generics Proprietary Products (yenmn) FY2017 FY2018 (Forecast) Amount Amount YOY () Total 32153 31800 (11) Generics 30115 30150 01 To medical institutions 29174 29250 03 To other makers 941 900 (44) Amlodipine 2940 2900 (14) Lansoprazole 2163 1900 (122) Donepezil 1557 1350 (133) Rabeprazole 1558 1350 (134) Limaprost Alfadex 1427 1350 (55) Pravastatine 1147 1100 (41) Voglibose 870 750 (139) Others 18449 19450 54 Proprietary products 2038 1650 (190) Uralyt 1225 1070 (127) Soleton 598 400 (331) Calvan 214 180 (162) Chemiphar ODM Generics (yenmn) FY2017 FY2018 (Forecast) Amount Amount YOY () Total 31100 31350 08 Generics 30115 30150 01 Generics (ODM) 985 1200 218
Income Statement Overview (yenmn) FY2017 FY2018 (Forecast) of of YOY Amount Sales Amount Sales () Net Sales 35331 1000 35500 1000 05 Pharmaceuticals 34279 970 ― ― ― Others 1051 30 ― ― ― Cost of sales 19535 553 ― ― ― SGampA expenses 13947 395 ― ― ― RampD expenses 2280 65 2700 76 184 Operating income 1848 0 52 1100 31 (405) Income before income taxes and minority interests 1777 50 ― ― ― Net income attributble to owners of the parent 1160 33 500 14 (569)
Capital Expenditure and Other (yenmn) Items FY2016 FY2017 Usage Amount Amount YOY () Forecast Rate () Capital expenditure 2928 1645 (438) 1650 997 Depreciation and amortization 1112 1192 72 1250 954 Revised forecast issued on October 31 2017
Cash Flow Statements (yenmn) FY2016 FY2017 Amount Amount Net cash Provided by operating activities 2737 3188 Used in investing activities (2504) (1606) Used in financing activities 787 (1741) Cash and cash equivalents 8084 7890 Free cash flow 232 1582
Per Share Information (yen) FY2016 FY2017 Amount Amount Change Forecast Earnings per share 53002 31528 (21474) 30673 Book value per share 454880 485986 31106 ― Dividend per share 10000 10000 ― 10000 Dividend payout ratio () 189 317 ― 326 Revised forecast issued on October 31 2017
Balance Sheet Data (yenmn) March 31 2017 March 31 2018 March 31 2015 Amount Amount Change Total assets 47002 46814 3358 (187) Return on assets () 63 36 -06 (27) Net assets 17355 17487 1313 132 Owned capital 17346 17474 1312 127 Capital-to-asset ratio () 369 373 02 04 Return on equity () 123 67 (01) (56) Current assets 29009 28334 1630 (674) Current liabilities 14939 14914 (716) (25) Current ratio (x) 194 19 019 (004)
By Main Therapeutic Categories () FY2016 FY2017 Cardiovascular and respiratory drugs 309 320 Digestive organ drugs 196 183 Agents affecting metabolism 164 165 Drugs for nervous system sensory organs 99 91 Antibiotics and chemotherapeutic drugs 65 62 Antineoplastic agents 32 34 Others 135 145
Sales Distribution By Launch Year (yenmn) FY2016 FY2017 Fiscal Year Amount Distrib () Amount Distrib () YOY () 2010 and before 19487 1 667 19194 637 (15) 2009 2011 2348 0 80 2210 73 (59) 2012 1484 0 51 1404 47 (54) 2013 2917 0 100 3127 104 72 2014 1746 0 60 1937 64 110 2015 1001 0 34 1222 41 221 2016 219 0 08 459 15 1091 2017 ― ― 558 19 ― Total 29204 1 1000 30115 1000 31
Generics Proprietary Products (yenmn) FY2016 FY2017 Distrib Distrib YOY Achieved Amount () Amount () () Forecast () Total 31513 1 1000 32153 1 1000 20 32000 1005 Generics 29204 1 927 30115 1 937 31 30000 1 1004 To medical institutions 27808 29174 49 29100 1 1003 To other makers 1395 941 (326) 900 1 1046 Amlodipine 2865 2940 26 2900 1 1014 Lansoprazole 2279 2163 (51) 2100 1 1030 Donepezil 1642 1557 (52) 1600 1 973 Rabeprazole 1586 1558 (18) 1600 1 974 Limaprost Alfadex 1469 1427 (28) 1400 1 1020 Pravastatine 1173 1147 (22) 1100 1 1043 Voglibose 957 870 (91) 900 1 967 Others 17229 18449 71 18400 1 1003 Proprietary products 2308 0 73 2038 0 63 (117) 2000 1 1019 Uralyt 1409 1225 (131) 1200 1 1021 Soleton 679 598 (120) 600 1 997 Calvan 219 214 (21) 200 1 1074 Chemiphar ODM Generics (yenmn) FY2016 FY2017 Distrib Distrib YOY Achieved Amount () Amount () () Forecast () Total 30445 1000 31100 1000 22 31400 990 Generics 29204 959 30115 968 31 30000 1004 Generics (ODM) 1240 41 985 32 (206) 1400 704 Includes exports Revised forecast issued on October 31 2017
Income Statement Overview (yenmn) FY2016 FY2017 of of YOY Achieved Amount Sales Amount Sales () Forecast () Net Sales 35689 1 1000 35331 1 1000 (10) 35500 1 995 Pharmaceuticals 34551 1 968 34279 1 970 (08) ― ― Others 1137 0 32 1051 0 30 (76) ― ― Cost of sales 19449 1 545 19535 1 553 04 ― ― SGampA expenses 13403 0 376 13947 0 395 41 ― ― RampD expenses 1984 0 56 2280 0 65 150 2200 0 1037 Operating income 2836 0 79 1848 0 52 (348) 1800 0 1027 Income before income taxes and minority interests 2849 0 80 1777 0 50 (376) ― ― Net income attributble to owners of the parent 2054 0 58 1160 0 33 (435) 1150 ― 1009 1961 00550933658 00550933658 00575628587 Revised forecast issued on October 31 2017
Per Share Information (yen) FY2017 FY2018 (Forecast) Amount Amount YOY () Earnings per share 31528 13584 (569) Book value per share 485986 ― ― Dividends per share 10000 7500 ― Dividend payout ratio() 317 552 ― Capital Expenditure and Other (yenmn) FY2017 FY2018 (Forecast) Amount Amount Change Capital expenditure 1645 950 (695) Depreciation and amortization 1192 1350 157 2015年3月期 ガツキ 2016年3月期(予想) ガツキ ヨソウ 金額 キンガク 金額 キンガク 増減額 ゾウゲンガク 増減率 ゾウゲン リツ 医療用医薬品 イリョウヨウ イヤクヒン 27400 30950 +05 ジェネリック医薬品(荷離) イヤクヒン ニ バナレ 25079 27430 +01 内自社販売 ウチ ジシャ ハンバイ 2321 25100 +01 内導出輸出 ウチ ドウシュツ ユシュツ 3011 2330 +04 アムロジピン 1935 3040 +09 ランソプラゾール 1509 1890 24 プラバスタチン 1595 1570 +40 ラベプラゾール 1704 1570 16 リマプロストアルファデクス 1273 1660 26 ボグリボース 1013 1300 +21 ドネペジル 15357 1030 +16 その他 タ 3400 15370 +01 主力品 シュリョク ヒン 1975 3520 +35 ウラリット 1134 1970 03 ソレトン 290 1250 +102 カルバン 0 300 +34 ジェネリック医薬品事業 イヤクヒン ジギョウ 2015年3月期 ガツキ 2016年3月期(予想) ガツキ ヨソウ 金額 キンガク 金額 キンガク 増減額 ゾウゲンガク 増減率 ゾウゲン リツ ジェネリック医薬品事業 イヤクヒン ジギョウ 28918 28840 +1003 ジェネリック医薬品(荷離) イヤクヒン ニ バナレ 27400 27430 +999 受託 ジュタク 1518 1410 +1077
Generics Proprietary Products (yenmn) FY2017 FY2018 (Forecast) Amount Amount YOY () Total 32153 31800 (11) Generics 30115 30150 01 To medical institutions 29174 29250 03 To other makers 941 900 (44) Amlodipine 2940 2900 (14) Lansoprazole 2163 1900 (122) Donepezil 1557 1350 (133) Rabeprazole 1558 1350 (134) Limaprost Alfadex 1427 1350 (55) Pravastatine 1147 1100 (41) Voglibose 870 750 (139) Others 18449 19450 54 Proprietary products 2038 1650 (190) Uralyt 1225 1070 (127) Soleton 598 400 (331) Calvan 214 180 (162) Chemiphar ODM Generics (yenmn) FY2017 FY2018 (Forecast) Amount Amount YOY () Total 31100 31350 08 Generics 30115 30150 01 Generics (ODM) 985 1200 218
Income Statement Overview (yenmn) FY2017 FY2018 (Forecast) of of YOY Amount Sales Amount Sales () Net Sales 35331 1000 35500 1000 05 Pharmaceuticals 34279 970 ― ― ― Others 1051 30 ― ― ― Cost of sales 19535 553 ― ― ― SGampA expenses 13947 395 ― ― ― RampD expenses 2280 65 2700 76 184 Operating income 1848 0 52 1100 31 (405) Income before income taxes and minority interests 1777 80 ― ― ― Net income attributble to owners of the parent 1160 33 500 14 (569)
Capital Expenditure and Other (yenmn) Items FY2016 FY2017 Usage Amount Amount YOY () Forecast Rate () Capital expenditure 2928 1645 (438) 1650 997 Depreciation and amortization 1112 1192 72 1250 954 Revised forecast issued on October 31 2017
Cash Flow Statements (yenmn) FY2016 FY2017 Amount Amount Net cash Provided by operating activities 2737 3188 Used in investing activities (2504) (1606) Used in financing activities 787 (1741) Cash and cash equivalents 8084 7890 Free cash flow 232 1582
Per Share Information (yen) FY2016 FY2017 Amount Amount Change Forecast Earnings per share 53002 31528 (21474) 30673 Book value per share 454880 485986 31106 ― Dividend per share 10000 10000 ― 10000 Dividend payout ratio () 189 317 ― 326 Revised forecast issued on October 31 2017
Balance Sheet Data (yenmn) March 31 2017 August 31 2017 March 31 2015 Amount Amount Change Total assets 47002 46814 3358 (187) Return on assets () 63 36 -06 (27) Net assets 17355 17487 1313 132 Owned capital 17346 17474 1312 127 Capital-to-asset ratio () 369 373 02 +04 Return on equity () 123 67 (01) (56) Current assets 29009 28334 1630 (674) Current liabilities 14939 14914 (716) (25) Current ratio (x) 194 19 019 004
By Main Therapeutic Categories () FY2016 FY2017 Cardiovascular and respiratory drugs 309 320 Digestive organ drugs 196 183 Agents affecting metabolism 164 165 Drugs for nervous system sensory organs 99 91 Antibiotics and chemotherapeutic drugs 65 62 Antineoplastic agents 32 34 Others 135 145
Sales Distribution By Launch Year (yenmn) FY2016 FY2017 Fiscal Year Amount Distrib () Amount Distrib () YOY () 2010 and before 19487 1 667 19194 637 (15) 2009 2011 2348 0 80 2210 73 (59) 2012 1484 0 51 1404 47 (54) 2013 2917 0 100 3127 104 72 2014 1746 0 60 1937 64 110 2015 1001 0 34 1222 41 221 2016 219 0 08 459 15 1091 2017 ― ― ― 558 19 ― Total 29204 1 1000 30115 1000 31
Generics Proprietary Products (yenmn) FY2016 FY2017 Distrib Distrib YOY Achieved Amount () Amount () () Forecast () Total 31513 1 1000 32153 1 1000 20 32000 1005 Generics 29204 1 927 30115 1 937 31 30000 1 1004 To medical institutions 27808 29174 49 29100 1 1003 To other makers 1395 941 (326) 900 1 1046 Amlodipine 2865 2940 26 2900 1 1014 Lansoprazole 2279 2163 (51) 2100 1 1030 Donepezil 1642 1557 (52) 1600 1 973 Rabeprazole 1586 1558 (18) 1600 1 974 Limaprost Alfadex 1469 1427 (28) 1400 1 1020 Pravastatine 1173 1147 (22) 1100 1 1043 Voglibose 957 870 (91) 900 1 967 Others 17229 18449 71 18400 1 1003 Proprietary products 2308 0 73 2038 0 63 (117) 2000 1 1019 Uralyt 1409 1225 (131) 1200 1 1021 Soleton 679 598 (120) 600 1 997 Calvan 219 214 (21) 200 1 1074 Chemiphar ODM Generics (yenmn) FY2016 FY2017 Distrib Distrib YOY Achieved Amount () Amount () () Forecast () Total 30445 1000 31100 1000 22 31400 990 Generics 29204 959 30115 968 31 30000 1004 Generics (ODM) 1240 41 985 32 (206) 1400 704 Includes exports Revised forecast issued on October 31 2017
Income Statement Overview (yenmn) FY2016 FY2017 of of YOY Achieved Amount Sales Amount Sales () Forecast () Net Sales 35689 1 1000 35331 1 1000 (10) 35500 1 995 Pharmaceuticals 34551 1 968 34279 1 970 (08) ― ― ― Others 1137 0 32 1051 0 30 (76) ― ― ― Cost of sales 19449 1 545 19535 1 553 04 ― ― ― SGampA expenses 13403 0 376 13947 0 395 41 ― ― ― RampD expenses 1984 0 56 2280 0 65 150 2200 0 1037 Operating income 2836 0 79 1848 0 52 (348) 1800 0 1027 Income before income taxes and minority interests 2849 0 80 1696 0 48 (405) 1700 ― 998 Net income attributble to owners of the parent 2054 0 58 1160 0 33 (435) 1150 ― 1009 1961 00550933658 00550933658 00575628587 Revised forecast issued on October 31 2017
Per Share Information (yen) FY2017 FY2018 (Forecast) Amount Amount YOY () Earnings per share 31528 13584 (569) Book value per share 485986 ― ― Dividends per share 10000 7500 ― Dividend payout ratio() 317 552 ― Capital Expenditure and Other (yenmn) FY2017 FY2018 (Forecast) Amount Amount Change Capital expenditure 1645 950 (695) Depreciation and amortization 1192 1350 157 2015年3月期 ガツキ 2016年3月期(予想) ガツキ ヨソウ 金額 キンガク 金額 キンガク 増減額 ゾウゲンガク 増減率 ゾウゲン リツ 医療用医薬品 イリョウヨウ イヤクヒン 27400 30950 +05 ジェネリック医薬品(荷離) イヤクヒン ニ バナレ 25079 27430 +01 内自社販売 ウチ ジシャ ハンバイ 2321 25100 +01 内導出輸出 ウチ ドウシュツ ユシュツ 3011 2330 +04 アムロジピン 1935 3040 +09 ランソプラゾール 1509 1890 24 プラバスタチン 1595 1570 +40 ラベプラゾール 1704 1570 16 リマプロストアルファデクス 1273 1660 26 ボグリボース 1013 1300 +21 ドネペジル 15357 1030 +16 その他 タ 3400 15370 +01 主力品 シュリョク ヒン 1975 3520 +35 ウラリット 1134 1970 03 ソレトン 290 1250 +102 カルバン 0 300 +34 ジェネリック医薬品事業 イヤクヒン ジギョウ 2015年3月期 ガツキ 2016年3月期(予想) ガツキ ヨソウ 金額 キンガク 金額 キンガク 増減額 ゾウゲンガク 増減率 ゾウゲン リツ ジェネリック医薬品事業 イヤクヒン ジギョウ 28918 28840 +1003 ジェネリック医薬品(荷離) イヤクヒン ニ バナレ 27400 27430 +999 受託 ジュタク 1518 1410 +1077
Generics Proprietary Products (yenmn) FY2017 FY2018 (Forecast) Amount Amount YOY () Total 32153 31800 (11) Generics 30115 30150 01 To medical institutions 29174 29250 03 To other makers 941 900 (44) Amlodipine 2940 2900 (14) Lansoprazole 2163 1900 (122) Donepezil 1557 1350 (133) Rabeprazole 1558 1350 (134) Limaprost Alfadex 1427 1350 (55) Pravastatine 1147 1100 (41) Voglibose 870 750 (139) Others 18449 19450 54 Proprietary products 2038 1650 (190) Uralyt 1225 1070 (127) Soleton 598 400 (331) Calvan 214 180 (162) Chemiphar ODM Generics (yenmn) FY2017 FY2018 (Forecast) Amount Amount YOY () Total 31100 31350 08 Generics 30115 30150 01 Generics (ODM) 985 1200 218
Income Statement Overview (yenmn) FY2017 FY2018 (Forecast) of of YOY Amount Sales Amount Sales () Net Sales 35331 1000 35500 1000 05 Pharmaceuticals 34279 970 ― ― ― Others 1051 30 ― ― ― Cost of sales 19535 553 ― ― ― SGampA expenses 13947 395 ― ― ― RampD expenses 2280 65 2700 76 184 Operating income 1848 0 52 1100 31 (405) Income before income taxes and minority interests 1777 80 ― ― ― Net income attributble to owners of the parent 1160 33 500 14 (569)
Capital Expenditure and Other (yenmn) Items FY2016 FY2017 Usage Amount Amount YOY () Forecast Rate () Capital expenditure 2928 1645 (438) 1650 997 Depreciation and amortization 1112 1192 72 1250 954 Revised forecast issued on October 31 2017
Cash Flow Statements (yenmn) FY2016 FY2017 Amount Amount Net cash Provided by operating activities 2737 3188 Used in investing activities (2504) (1606) Provided by (Used in) financing activities 787 (1741) Cash and cash equivalents 8084 7890 Free cash flow 232 1582
Per Share Information (yen) FY2016 FY2017 Amount Amount Change Forecast Earnings per share 53002 31528 (21474) 30673 Book value per share 454880 485986 31106 ― Dividend per share 10000 10000 ― 10000 Dividend payout ratio () 189 317 ― 326 Revised forecast issued on October 31 2017
Balance Sheet Data (yenmn) March 31 2017 August 31 2017 March 31 2015 Amount Amount Change Total assets 47002 46814 3358 (187) Return on assets () 63 36 -06 (27) Net assets 17355 17487 1313 132 Owned capital 17346 17474 1312 127 Capital-to-asset ratio () 369 373 02 +04 Return on equity () 123 67 (01) (56) Current assets 29009 28334 1630 (674) Current liabilities 14939 14914 (716) (25) Current ratio (x) 194 19 019 004
By Main Therapeutic Categories () FY2016 FY2017 Cardiovascular and respiratory drugs 309 320 Digestive organ drugs 196 183 Agents affecting metabolism 164 165 Drugs for nervous system sensory organs 99 91 Antibiotics and chemotherapeutic drugs 65 62 Antineoplastic agents 32 34 Others 135 145
Sales Distribution By Launch Year (yenmn) FY2016 FY2017 Fiscal Year Amount Distrib () Amount Distrib () YOY () 2010 and before 19487 1 667 19194 637 (15) 2009 2011 2348 0 80 2210 73 (59) 2012 1484 0 51 1404 47 (54) 2013 2917 0 100 3127 104 72 2014 1746 0 60 1937 64 110 2015 1001 0 34 1222 41 221 2016 219 0 08 459 15 1091 2017 ― ― ― 558 19 ― Total 29204 1 1000 30115 1000 31
Generics Proprietary Products (yenmn) FY2016 FY2017 Distrib Distrib YOY Achieved Amount () Amount () () Forecast () Total 31513 1 1000 32153 1 1000 20 32000 1005 Generics 29204 1 927 30115 1 937 31 30000 1 1004 To medical institutions 27808 29174 49 29100 1 1003 To other makers 1395 941 (326) 900 1 1046 Amlodipine 2865 2940 26 2900 1 1014 Lansoprazole 2279 2163 (51) 2100 1 1030 Donepezil 1642 1557 (52) 1600 1 973 Rabeprazole 1586 1558 (18) 1600 1 974 Limaprost Alfadex 1469 1427 (28) 1400 1 1020 Pravastatine 1173 1147 (22) 1100 1 1043 Voglibose 957 870 (91) 900 1 967 Others 17229 18449 71 18400 1 1003 Proprietary products 2308 0 73 2038 0 63 (117) 2000 1 1019 Uralyt 1409 1225 (131) 1200 1 1021 Soleton 679 598 (120) 600 1 997 Calvan 219 214 (21) 200 1 1074 Chemiphar ODM Generics (yenmn) FY2016 FY2017 Distrib Distrib YOY Achieved Amount () Amount () () Forecast () Total 30445 1000 31100 1000 22 31400 990 Generics 29204 959 30115 968 31 30000 1004 Generics (ODM) 1240 41 985 32 (206) 1400 704 Includes exports Revised forecast issued on October 31 2017
Income Statement Overview (yenmn) FY2016 FY2017 of of YOY Achieved Amount Sales Amount Sales () Forecast () Net Sales 35689 1 1000 35331 1 1000 (10) 35500 1 995 Pharmaceuticals 34551 1 968 34279 1 970 (08) ― ― ― Others 1137 0 32 1051 0 30 (76) ― ― ― Cost of sales 19449 1 545 19535 1 553 04 ― ― ― SGampA expenses 13403 0 376 13947 0 395 41 ― ― ― RampD expenses 1984 0 56 2280 0 65 150 2200 0 1037 Operating income 2836 0 79 1848 0 52 (348) 1800 0 1027 Income before income taxes and minority interests 2849 0 80 1696 0 48 (405) 1700 ― 998 Net income attributble to owners of the parent 2054 0 58 1160 0 33 (435) 1150 ― 1009 1961 00550933658 00550933658 00575628587 Revised forecast issued on October 31 2017
Per Share Information (yen) FY2017 FY2018 (Forecast) Amount Amount YOY () Earnings per share 31528 13584 (569) Book value per share 485986 ― ― Dividends per share 10000 7500 ― Dividend payout ratio() 317 552 ― Capital Expenditure and Other (yenmn) FY2017 FY2018 (Forecast) Amount Amount Change Capital expenditure 1645 950 (695) Depreciation and amortization 1192 1350 157 2015年3月期 ガツキ 2016年3月期(予想) ガツキ ヨソウ 金額 キンガク 金額 キンガク 増減額 ゾウゲンガク 増減率 ゾウゲン リツ 医療用医薬品 イリョウヨウ イヤクヒン 27400 30950 +05 ジェネリック医薬品(荷離) イヤクヒン ニ バナレ 25079 27430 +01 内自社販売 ウチ ジシャ ハンバイ 2321 25100 +01 内導出輸出 ウチ ドウシュツ ユシュツ 3011 2330 +04 アムロジピン 1935 3040 +09 ランソプラゾール 1509 1890 24 プラバスタチン 1595 1570 +40 ラベプラゾール 1704 1570 16 リマプロストアルファデクス 1273 1660 26 ボグリボース 1013 1300 +21 ドネペジル 15357 1030 +16 その他 タ 3400 15370 +01 主力品 シュリョク ヒン 1975 3520 +35 ウラリット 1134 1970 03 ソレトン 290 1250 +102 カルバン 0 300 +34 ジェネリック医薬品事業 イヤクヒン ジギョウ 2015年3月期 ガツキ 2016年3月期(予想) ガツキ ヨソウ 金額 キンガク 金額 キンガク 増減額 ゾウゲンガク 増減率 ゾウゲン リツ ジェネリック医薬品事業 イヤクヒン ジギョウ 28918 28840 +1003 ジェネリック医薬品(荷離) イヤクヒン ニ バナレ 27400 27430 +999 受託 ジュタク 1518 1410 +1077
Generics Proprietary Products (yenmn) FY2017 FY2018 (Forecast) Amount Amount YOY () Total 32153 31800 (11) Generics 30115 30150 01 To medical institutions 29174 29250 03 To other makers 941 900 (44) Amlodipine 2940 2900 (14) Lansoprazole 2163 1900 (122) Donepezil 1557 1350 (133) Rabeprazole 1558 1350 (134) Limaprost Alfadex 1427 1350 (55) Pravastatine 1147 1100 (41) Voglibose 870 750 (139) Others 18449 19450 54 Proprietary products 2038 1650 (190) Uralyt 1225 1070 (127) Soleton 598 400 (331) Calvan 214 180 (162) Chemiphar ODM Generics (yenmn) FY2017 FY2018 (Forecast) Amount Amount YOY () Total 31100 31350 08 Generics 30115 30150 01 Generics (ODM) 985 1200 218
Income Statement Overview (yenmn) FY2017 FY2018 (Forecast) of of YOY Amount Sales Amount Sales () Net Sales 35331 1000 35500 1000 05 Pharmaceuticals 34279 970 ― ― ― Others 1051 30 ― ― ― Cost of sales 19535 553 ― ― ― SGampA expenses 13947 395 ― ― ― RampD expenses 2280 65 2700 76 184 Operating income 1848 0 52 1100 31 (405) Income before income taxes and minority interests 1777 80 ― ― ― Net income attributble to owners of the parent 1160 33 500 14 (569)
Capital Expenditure and Other (yenmn) Items FY2016 FY2017 Usage Amount Amount YOY () Forecast Rate () Capital expenditure 2928 1645 (438) 1650 997 Depreciation and amortization 1112 1192 72 1250 954 Revised forecast issued on October 31 2017
Cash Flow Statements (yenmn) FY2016 FY2017 Amount Amount Net cash Provided by operating activities 2737 3188 Used in investing activities (2504) (1606) Used in financing activities 787 (1741) Cash and cash equivalents 8084 7890 Free cash flow 232 1582
Per Share Information (yen) FY2016 FY2017 Amount Amount Change Forecast Earnings per share 53002 31528 (21474) 30673 Book value per share 454880 485986 31106 ― Dividend per share 10000 10000 ― 10000 Dividend payout ratio () 189 317 ― 326 Revised forecast issued on October 31 2017
Balance Sheet Data (yenmn) March 31 2017 March 31 2018 March 31 2015 Amount Amount Change Total assets 47002 46814 3358 (187) Return on assets () 63 36 -06 (27) Net assets 17355 17487 1313 132 Owned capital 17346 17474 1312 127 Capital-to-asset ratio () 369 373 02 04 Return on equity () 123 67 (01) (56) Current assets 29009 28334 1630 (674) Current liabilities 14939 14914 (716) (25) Current ratio (x) 194 19 019 (004)
By Main Therapeutic Categories () FY2016 FY2017 Cardiovascular and respiratory drugs 309 320 Digestive organ drugs 196 183 Agents affecting metabolism 164 165 Drugs for nervous system sensory organs 99 91 Antibiotics and chemotherapeutic drugs 65 62 Antineoplastic agents 32 34 Others 135 145
Sales Distribution By Launch Year (yenmn) FY2016 FY2017 Fiscal Year Amount Distrib () Amount Distrib () YOY () 2010 and before 19487 1 667 19194 637 (15) 2009 2011 2348 0 80 2210 73 (59) 2012 1484 0 51 1404 47 (54) 2013 2917 0 100 3127 104 72 2014 1746 0 60 1937 64 110 2015 1001 0 34 1222 41 221 2016 219 0 08 459 15 1091 2017 ― ― 558 19 ― Total 29204 1 1000 30115 1000 31
Generics Proprietary Products (yenmn) FY2016 FY2017 Distrib Distrib YOY Achieved Amount () Amount () () Forecast () Total 31513 1 1000 32153 1 1000 20 32000 1005 Generics 29204 1 927 30115 1 937 31 30000 1 1004 To medical institutions 27808 29174 49 29100 1 1003 To other makers 1395 941 (326) 900 1 1046 Amlodipine 2865 2940 26 2900 1 1014 Lansoprazole 2279 2163 (51) 2100 1 1030 Donepezil 1642 1557 (52) 1600 1 973 Rabeprazole 1586 1558 (18) 1600 1 974 Limaprost Alfadex 1469 1427 (28) 1400 1 1020 Pravastatine 1173 1147 (22) 1100 1 1043 Voglibose 957 870 (91) 900 1 967 Others 17229 18449 71 18400 1 1003 Proprietary products 2308 0 73 2038 0 63 (117) 2000 1 1019 Uralyt 1409 1225 (131) 1200 1 1021 Soleton 679 598 (120) 600 1 997 Calvan 219 214 (21) 200 1 1074 Chemiphar ODM Generics (yenmn) FY2016 FY2017 Distrib Distrib YOY Achieved Amount () Amount () () Forecast () Total 30445 1000 31100 1000 22 31400 990 Generics 29204 959 30115 968 31 30000 1004 Generics (ODM) 1240 41 985 32 (206) 1400 704 Includes exports Revised forecast issued on October 31 2017
Income Statement Overview (yenmn) FY2016 FY2017 of of YOY Achieved Amount Sales Amount Sales () Forecast () Net Sales 35689 1 1000 35331 1 1000 (10) 35500 1 995 Pharmaceuticals 34551 1 968 34279 1 970 (08) ― ― Others 1137 0 32 1051 0 30 (76) ― ― Cost of sales 19449 1 545 19535 1 553 04 ― ― SGampA expenses 13403 0 376 13947 0 395 41 ― ― RampD expenses 1984 0 56 2280 0 65 150 2200 0 1037 Operating income 2836 0 79 1848 0 52 (348) 1800 0 1027 Income before income taxes and minority interests 2849 0 80 1777 0 50 (376) ― ― Net income attributble to owners of the parent 2054 0 58 1160 0 33 (435) 1150 ― 1009 1961 00550933658 00550933658 00575628587 Revised forecast issued on October 31 2017
Per Share Information (yen) FY2017 FY2018 (Forecast) Amount Amount YOY () Earnings per share 31528 13584 (569) Book value per share 485986 ― ― Dividends per share 10000 7500 ― Dividend payout ratio() 317 552 ― Capital Expenditure and Other (yenmn) FY2017 FY2018 (Forecast) Amount Amount Change Capital expenditure 1645 950 (695) Depreciation and amortization 1192 1350 157 2015年3月期 ガツキ 2016年3月期(予想) ガツキ ヨソウ 金額 キンガク 金額 キンガク 増減額 ゾウゲンガク 増減率 ゾウゲン リツ 医療用医薬品 イリョウヨウ イヤクヒン 27400 30950 +05 ジェネリック医薬品(荷離) イヤクヒン ニ バナレ 25079 27430 +01 内自社販売 ウチ ジシャ ハンバイ 2321 25100 +01 内導出輸出 ウチ ドウシュツ ユシュツ 3011 2330 +04 アムロジピン 1935 3040 +09 ランソプラゾール 1509 1890 24 プラバスタチン 1595 1570 +40 ラベプラゾール 1704 1570 16 リマプロストアルファデクス 1273 1660 26 ボグリボース 1013 1300 +21 ドネペジル 15357 1030 +16 その他 タ 3400 15370 +01 主力品 シュリョク ヒン 1975 3520 +35 ウラリット 1134 1970 03 ソレトン 290 1250 +102 カルバン 0 300 +34 ジェネリック医薬品事業 イヤクヒン ジギョウ 2015年3月期 ガツキ 2016年3月期(予想) ガツキ ヨソウ 金額 キンガク 金額 キンガク 増減額 ゾウゲンガク 増減率 ゾウゲン リツ ジェネリック医薬品事業 イヤクヒン ジギョウ 28918 28840 +1003 ジェネリック医薬品(荷離) イヤクヒン ニ バナレ 27400 27430 +999 受託 ジュタク 1518 1410 +1077
Generics Proprietary Products (yenmn) FY2017 FY2018 (Forecast) Amount Amount YOY () Total 32153 31800 (11) Generics 30115 30150 01 To medical institutions 29174 29250 03 To other makers 941 900 (44) Amlodipine 2940 2900 (14) Lansoprazole 2163 1900 (122) Donepezil 1557 1350 (133) Rabeprazole 1558 1350 (134) Limaprost Alfadex 1427 1350 (55) Pravastatine 1147 1100 (41) Voglibose 870 750 (139) Others 18449 19450 54 Proprietary products 2038 1650 (190) Uralyt 1225 1070 (127) Soleton 598 400 (331) Calvan 214 180 (162) Chemiphar ODM Generics (yenmn) FY2017 FY2018 (Forecast) Amount Amount YOY () Total 31100 31350 08 Generics 30115 30150 01 Generics (ODM) 985 1200 218
Income Statement Overview (yenmn) FY2017 FY2018 (Forecast) of of YOY Amount Sales Amount Sales () Net Sales 35331 1000 35500 1000 05 Pharmaceuticals 34279 970 ― ― ― Others 1051 30 ― ― ― Cost of sales 19535 553 ― ― ― SGampA expenses 13947 395 ― ― ― RampD expenses 2280 65 2700 76 184 Operating income 1848 0 52 1100 31 (405) Income before income taxes and minority interests 1777 80 ― ― ― Net income attributble to owners of the parent 1160 33 500 14 (569)
Capital Expenditure and Other (yenmn) Items FY2016 FY2017 Usage Amount Amount YOY () Forecast Rate () Capital expenditure 2928 1645 (438) 1650 997 Depreciation and amortization 1112 1192 72 1250 954 Revised forecast issued on October 31 2017
Cash Flow Statements (yenmn) FY2016 FY2017 Amount Amount Net cash Provided by operating activities 2737 3188 Used in investing activities (2504) (1606) Used in financing activities 787 (1741) Cash and cash equivalents 8084 7890 Free cash flow 232 1582
Per Share Information (yen) FY2016 FY2017 Amount Amount Change Forecast Earnings per share 53002 31528 (21474) 30673 Book value per share 454880 485986 31106 ― Dividend per share 10000 10000 ― 10000 Dividend payout ratio () 189 317 ― 326 Revised forecast issued on October 31 2017
Balance Sheet Data (yenmn) March 31 2017 August 31 2017 March 31 2015 Amount Amount Change Total assets 47002 46814 3358 (187) Return on assets () 63 36 -06 (27) Net assets 17355 17487 1313 132 Owned capital 17346 17474 1312 127 Capital-to-asset ratio () 369 373 02 +04 Return on equity () 123 67 (01) (56) Current assets 29009 28334 1630 (674) Current liabilities 14939 14914 (716) (25) Current ratio (x) 194 19 019 004
By Main Therapeutic Categories () FY2016 FY2017 Cardiovascular and respiratory drugs 309 320 Digestive organ drugs 196 183 Agents affecting metabolism 164 165 Drugs for nervous system sensory organs 99 91 Antibiotics and chemotherapeutic drugs 65 62 Antineoplastic agents 32 34 Others 135 145
Sales Distribution By Launch Year (yenmn) FY2016 FY2017 Fiscal Year Amount Distrib () Amount Distrib () YOY () 2010 and before 19487 1 667 19194 637 (15) 2009 2011 2348 0 80 2210 73 (59) 2012 1484 0 51 1404 47 (54) 2013 2917 0 100 3127 104 72 2014 1746 0 60 1937 64 110 2015 1001 0 34 1222 41 221 2016 219 0 08 459 15 1091 2017 ― ― ― 558 19 ― Total 29204 1 1000 30115 1000 31
Generics Proprietary Products (yenmn) FY2016 FY2017 Distrib Distrib YOY Achieved Amount () Amount () () Forecast () Total 31513 1 1000 32153 1 1000 20 32000 1005 Generics 29204 1 927 30115 1 937 31 30000 1 1004 To medical institutions 27808 29174 49 29100 1 1003 To other makers 1395 941 (326) 900 1 1046 Amlodipine 2865 2940 26 2900 1 1014 Lansoprazole 2279 2163 (51) 2100 1 1030 Donepezil 1642 1557 (52) 1600 1 973 Rabeprazole 1586 1558 (18) 1600 1 974 Limaprost Alfadex 1469 1427 (28) 1400 1 1020 Pravastatine 1173 1147 (22) 1100 1 1043 Voglibose 957 870 (91) 900 1 967 Others 17229 18449 71 18400 1 1003 Proprietary products 2308 0 73 2038 0 63 (117) 2000 1 1019 Uralyt 1409 1225 (131) 1200 1 1021 Soleton 679 598 (120) 600 1 997 Calvan 219 214 (21) 200 1 1074 Chemiphar ODM Generics (yenmn) FY2016 FY2017 Distrib Distrib YOY Achieved Amount () Amount () () Forecast () Total 30445 1000 31100 1000 22 31400 990 Generics 29204 959 30115 968 31 30000 1004 Generics (ODM) 1240 41 985 32 (206) 1400 704 Includes exports Revised forecast issued on October 31 2017
Income Statement Overview (yenmn) FY2016 FY2017 of of YOY Achieved Amount Sales Amount Sales () Forecast () Net Sales 35689 1 1000 35331 1 1000 (10) 35500 1 995 Pharmaceuticals 34551 1 968 34279 1 970 (08) ― ― ― Others 1137 0 32 1051 0 30 (76) ― ― ― Cost of sales 19449 1 545 19535 1 553 04 ― ― ― SGampA expenses 13403 0 376 13947 0 395 41 ― ― ― RampD expenses 1984 0 56 2280 0 65 150 2200 0 1037 Operating income 2836 0 79 1848 0 52 (348) 1800 0 1027 Income before income taxes and minority interests 2849 0 80 1696 0 48 (405) 1700 ― 998 Net income attributble to owners of the parent 2054 0 58 1160 0 33 (435) 1150 ― 1009 1961 00550933658 00550933658 00575628587 Revised forecast issued on October 31 2017
Per Share Information (yen) FY2017 FY2018 (Forecast) Amount Amount YOY () Earnings per share 31528 13584 (569) Book value per share 485986 ― ― Dividends per share 10000 7500 ― Dividend payout ratio() 317 552 ― Capital Expenditure and Other (yenmn) FY2017 FY2018 (Forecast) Amount Amount Change Capital expenditure 1645 950 (695) Depreciation and amortization 1192 1350 157 2015年3月期 ガツキ 2016年3月期(予想) ガツキ ヨソウ 金額 キンガク 金額 キンガク 増減額 ゾウゲンガク 増減率 ゾウゲン リツ 医療用医薬品 イリョウヨウ イヤクヒン 27400 30950 +05 ジェネリック医薬品(荷離) イヤクヒン ニ バナレ 25079 27430 +01 内自社販売 ウチ ジシャ ハンバイ 2321 25100 +01 内導出輸出 ウチ ドウシュツ ユシュツ 3011 2330 +04 アムロジピン 1935 3040 +09 ランソプラゾール 1509 1890 24 プラバスタチン 1595 1570 +40 ラベプラゾール 1704 1570 16 リマプロストアルファデクス 1273 1660 26 ボグリボース 1013 1300 +21 ドネペジル 15357 1030 +16 その他 タ 3400 15370 +01 主力品 シュリョク ヒン 1975 3520 +35 ウラリット 1134 1970 03 ソレトン 290 1250 +102 カルバン 0 300 +34 ジェネリック医薬品事業 イヤクヒン ジギョウ 2015年3月期 ガツキ 2016年3月期(予想) ガツキ ヨソウ 金額 キンガク 金額 キンガク 増減額 ゾウゲンガク 増減率 ゾウゲン リツ ジェネリック医薬品事業 イヤクヒン ジギョウ 28918 28840 +1003 ジェネリック医薬品(荷離) イヤクヒン ニ バナレ 27400 27430 +999 受託 ジュタク 1518 1410 +1077
Generics Proprietary Products (yenmn) FY2017 FY2018 (Forecast) Amount Amount YOY () Total 32153 31800 (11) Generics 30115 30150 01 To medical institutions 29174 29250 03 To other makers 941 900 (44) Amlodipine 2940 2900 (14) Lansoprazole 2163 1900 (122) Donepezil 1557 1350 (133) Rabeprazole 1558 1350 (134) Limaprost Alfadex 1427 1350 (55) Pravastatine 1147 1100 (41) Voglibose 870 750 (139) Others 18449 19450 54 Proprietary products 2038 1650 (190) Uralyt 1225 1070 (127) Soleton 598 400 (331) Calvan 214 180 (162) Chemiphar ODM Generics (yenmn) FY2017 FY2018 (Forecast) Amount Amount YOY () Total 31100 31350 08 Generics 30115 30150 01 Generics (ODM) 985 1200 218
Income Statement Overview (yenmn) FY2017 FY2018 (Forecast) of of YOY Amount Sales Amount Sales () Net Sales 35331 1000 35500 1000 05 Pharmaceuticals 34279 970 ― ― ― Others 1051 30 ― ― ― Cost of sales 19535 553 ― ― ― SGampA expenses 13947 395 ― ― ― RampD expenses 2280 65 2700 76 184 Operating income 1848 0 52 1100 31 (405) Income before income taxes and minority interests 1777 80 ― ― ― Net income attributble to owners of the parent 1160 33 500 14 (569)
Capital Expenditure and Other (yenmn) Items FY2016 FY2017 Usage Amount Amount YOY () Forecast Rate () Capital expenditure 2928 1645 (438) 1650 997 Depreciation and amortization 1112 1192 72 1250 954 Revised forecast issued on October 31 2017
Cash Flow Statements (yenmn) FY2016 FY2017 Amount Amount Net cash Provided by operating activities 2737 3188 Used in investing activities (2504) (1606) Used in financing activities 787 (1741) Cash and cash equivalents 8084 7890 Free cash flow 232 1582
Per Share Information (yen) FY2016 FY2017 Amount Amount Change Forecast Earnings per share 53002 31528 (21474) 30673 Book value per share 454880 485986 31106 ― Dividend per share 10000 10000 ― 10000 Dividend payout ratio () 189 317 ― 326 Revised forecast issued on October 31 2017
Balance Sheet Data (yenmn) March 31 2017 August 31 2017 March 31 2015 Amount Amount Change Total assets 47002 46814 3358 (187) Return on assets () 63 36 -06 (27) Net assets 17355 17487 1313 132 Owned capital 17346 17474 1312 127 Capital-to-asset ratio () 369 373 02 +04 Return on equity () 123 67 (01) (56) Current assets 29009 28334 1630 (674) Current liabilities 14939 14914 (716) (25) Current ratio (x) 194 19 019 004
By Main Therapeutic Categories () FY2016 FY2017 Cardiovascular and respiratory drugs 309 320 Digestive organ drugs 196 183 Agents affecting metabolism 164 165 Drugs for nervous system sensory organs 99 91 Antibiotics and chemotherapeutic drugs 65 62 Antineoplastic agents 32 34 Others 135 145
Sales Distribution By Launch Year (yenmn) FY2016 FY2017 Fiscal Year Amount Distrib () Amount Distrib () YOY () 2010 and before 19487 1 667 19194 637 (15) 2009 2011 2348 0 80 2210 73 (59) 2012 1484 0 51 1404 47 (54) 2013 2917 0 100 3127 104 72 2014 1746 0 60 1937 64 110 2015 1001 0 34 1222 41 221 2016 219 0 08 459 15 1091 2017 ― ― 558 19 ― Total 29204 1 1000 30115 1000 31
Generics Proprietary Products (yenmn) FY2016 FY2017 Distrib Distrib YOY Achieved Amount () Amount () () Forecast () Total 31513 1 1000 32153 1 1000 20 32000 1005 Generics 29204 1 927 30115 1 937 31 30000 1 1004 To medical institutions 27808 29174 49 29100 1 1003 To other makers 1395 941 (326) 900 1 1046 Amlodipine 2865 2940 26 2900 1 1014 Lansoprazole 2279 2163 (51) 2100 1 1030 Donepezil 1642 1557 (52) 1600 1 973 Rabeprazole 1586 1558 (18) 1600 1 974 Limaprost Alfadex 1469 1427 (28) 1400 1 1020 Pravastatine 1173 1147 (22) 1100 1 1043 Voglibose 957 870 (91) 900 1 967 Others 17229 18449 71 18400 1 1003 Proprietary products 2308 0 73 2038 0 63 (117) 2000 1 1019 Uralyt 1409 1225 (131) 1200 1 1021 Soleton 679 598 (120) 600 1 997 Calvan 219 214 (21) 200 1 1074 Chemiphar ODM Generics (yenmn) FY2016 FY2017 Distrib Distrib YOY Achieved Amount () Amount () () Forecast () Total 30445 1000 31100 1000 22 31400 990 Generics 29204 959 30115 968 31 30000 1004 Generics (ODM) 1240 41 985 32 (206) 1400 704 Includes exports Revised forecast issued on October 31 2017
Income Statement Overview (yenmn) FY2016 FY2017 of of YOY Achieved Amount Sales Amount Sales () Forecast () Net Sales 35689 1 1000 35331 1 1000 (10) 35500 1 995 Pharmaceuticals 34551 1 968 34279 1 970 (08) ― ― Others 1137 0 32 1051 0 30 (76) ― ― Cost of sales 19449 1 545 19535 1 553 04 ― ― SGampA expenses 13403 0 376 13947 0 395 41 ― ― RampD expenses 1984 0 56 2280 0 65 150 2200 0 1037 Operating income 2836 0 79 1848 0 52 (348) 1800 0 1027 Income before income taxes and minority interests 2849 0 80 1696 0 48 (405) 1700 ― 998 Net income attributble to owners of the parent 2054 0 58 1160 0 33 (435) 1150 ― 1009 1961 00550933658 00550933658 00575628587 Revised forecast issued on October 31 2017
Per Share Information (yen) FY2017 FY2018 (Forecast) Amount Amount YOY () Earnings per share 31528 13584 (569) Book value per share 485986 ― ― Dividends per share 10000 7500 ― Dividend payout ratio() 317 552 ― Capital Expenditure and Other (yenmn) FY2017 FY2018 (Forecast) Amount Amount Change Capital expenditure 1645 950 (695) Depreciation and amortization 1192 1350 157 2015年3月期 ガツキ 2016年3月期(予想) ガツキ ヨソウ 金額 キンガク 金額 キンガク 増減額 ゾウゲンガク 増減率 ゾウゲン リツ 医療用医薬品 イリョウヨウ イヤクヒン 27400 30950 +05 ジェネリック医薬品(荷離) イヤクヒン ニ バナレ 25079 27430 +01 内自社販売 ウチ ジシャ ハンバイ 2321 25100 +01 内導出輸出 ウチ ドウシュツ ユシュツ 3011 2330 +04 アムロジピン 1935 3040 +09 ランソプラゾール 1509 1890 24 プラバスタチン 1595 1570 +40 ラベプラゾール 1704 1570 16 リマプロストアルファデクス 1273 1660 26 ボグリボース 1013 1300 +21 ドネペジル 15357 1030 +16 その他 タ 3400 15370 +01 主力品 シュリョク ヒン 1975 3520 +35 ウラリット 1134 1970 03 ソレトン 290 1250 +102 カルバン 0 300 +34 ジェネリック医薬品事業 イヤクヒン ジギョウ 2015年3月期 ガツキ 2016年3月期(予想) ガツキ ヨソウ 金額 キンガク 金額 キンガク 増減額 ゾウゲンガク 増減率 ゾウゲン リツ ジェネリック医薬品事業 イヤクヒン ジギョウ 28918 28840 +1003 ジェネリック医薬品(荷離) イヤクヒン ニ バナレ 27400 27430 +999 受託 ジュタク 1518 1410 +1077
Generics Proprietary Products (yenmn) FY2017 FY2018 (Forecast) Amount Amount YOY () Total 32153 31800 (11) Generics 30115 30150 01 To medical institutions 29174 29250 03 To other makers 941 900 (44) Amlodipine 2940 2900 (14) Lansoprazole 2163 1900 (122) Donepezil 1557 1350 (133) Rabeprazole 1558 1350 (134) Limaprost Alfadex 1427 1350 (55) Pravastatine 1147 1100 (41) Voglibose 870 750 (139) Others 18449 19450 54 Proprietary products 2038 1650 (190) Uralyt 1225 1070 (127) Soleton 598 400 (331) Calvan 214 180 (162) Chemiphar ODM Generics (yenmn) FY2017 FY2018 (Forecast) Amount Amount YOY () Total 31100 31350 08 Generics 30115 30150 01 Generics (ODM) 985 1200 218
Income Statement Overview (yenmn) FY2017 FY2018 (Forecast) of of YOY Amount Sales Amount Sales () Net Sales 35331 1000 35500 1000 05 Pharmaceuticals 34279 970 ― ― ― Others 1051 30 ― ― ― Cost of sales 19535 553 ― ― ― SGampA expenses 13947 395 ― ― ― RampD expenses 2280 65 2700 76 184 Operating income 1848 0 52 1100 31 (405) Income before income taxes and minority interests 1777 80 ― ― ― Net income attributble to owners of the parent 1160 33 500 14 (569)
Capital Expenditure and Other (yenmn) Items FY2016 FY2017 Usage Amount Amount YOY () Forecast Rate () Capital expenditure 2928 1645 (438) 1650 997 Depreciation and amortization 1112 1192 72 1250 954 Revised forecast issued on October 31 2017
Cash Flow Statements (yenmn) FY2016 FY2017 Amount Amount Net cash Provided by operating activities 2737 3188 Used in investing activities (2504) (1606) Used in financing activities 787 (1741) Cash and cash equivalents 8084 7890 Free cash flow 232 1582
Per Share Information (yen) FY2016 FY2017 Amount Amount Change Forecast Earnings per share 53002 31528 (21474) 30673 Book value per share 454880 485986 31106 ― Dividend per share 10000 10000 ― 10000 Dividend payout ratio () 189 317 ― 326 Revised forecast issued on October 31 2017
Balance Sheet Data (yenmn) March 31 2017 August 31 2017 March 31 2015 Amount Amount Change Total assets 47002 46814 3358 (187) Return on assets () 63 36 -06 (27) Net assets 17355 17487 1313 132 Owned capital 17346 17474 1312 127 Capital-to-asset ratio () 369 373 02 +04 Return on equity () 123 67 (01) (56) Current assets 29009 28334 1630 (674) Current liabilities 14939 14914 (716) (25) Current ratio (x) 194 19 019 004
By Main Therapeutic Categories () FY2016 FY2017 Cardiovascular and respiratory drugs 309 320 Digestive organ drugs 196 183 Agents affecting metabolism 164 165 Drugs for nervous system sensory organs 99 91 Antibiotics and chemotherapeutic drugs 65 62 Antineoplastic agents 32 34 Others 135 145
Sales Distribution By Launch Year (yenmn) FY2016 FY2017 Fiscal Year Amount Distrib () Amount Distrib () YOY () 2010 and before 19487 1 667 19194 637 (15) 2009 2011 2348 0 80 2210 73 (59) 2012 1484 0 51 1404 47 (54) 2013 2917 0 100 3127 104 72 2014 1746 0 60 1937 64 110 2015 1001 0 34 1222 41 221 2016 219 0 08 459 15 1091 2017 ― ― ― 558 19 ― Total 29204 1 1000 30115 1000 31
Generics Proprietary Products (yenmn) FY2016 FY2017 Distrib Distrib YOY Achieved Amount () Amount () () Forecast () Total 31513 1 1000 32153 1 1000 20 32000 1005 Generics 29204 1 927 30115 1 937 31 30000 1 1004 To medical institutions 27808 29174 49 29100 1 1003 To other makers 1395 941 (326) 900 1 1046 Amlodipine 2865 2940 26 2900 1 1014 Lansoprazole 2279 2163 (51) 2100 1 1030 Donepezil 1642 1557 (52) 1600 1 973 Rabeprazole 1586 1558 (18) 1600 1 974 Limaprost Alfadex 1469 1427 (28) 1400 1 1020 Pravastatine 1173 1147 (22) 1100 1 1043 Voglibose 957 870 (91) 900 1 967 Others 17229 18449 71 18400 1 1003 Proprietary products 2308 0 73 2038 0 63 (117) 2000 1 1019 Uralyt 1409 1225 (131) 1200 1 1021 Soleton 679 598 (120) 600 1 997 Calvan 219 214 (21) 200 1 1074 Chemiphar ODM Generics (yenmn) FY2016 FY2017 Distrib Distrib YOY Achieved Amount () Amount () () Forecast () Total 30445 1000 31100 1000 22 31400 990 Generics 29204 959 30115 968 31 30000 1004 Generics (ODM) 1240 41 985 32 (206) 1400 704 Includes exports Revised forecast issued on October 31 2017
Income Statement Overview (yenmn) FY2016 FY2017 of of YOY Achieved Amount Sales Amount Sales () Forecast () Net Sales 35689 1 1000 35331 1 1000 (10) 35500 1 995 Pharmaceuticals 34551 1 968 34279 1 970 (08) ― ― ― Others 1137 0 32 1051 0 30 (76) ― ― ― Cost of sales 19449 1 545 19535 1 553 04 ― ― ― SGampA expenses 13403 0 376 13947 0 395 41 ― ― ― RampD expenses 1984 0 56 2280 0 65 150 2200 0 1037 Operating income 2836 0 79 1848 0 52 (348) 1800 0 1027 Income before income taxes and minority interests 2849 0 80 1696 0 48 (405) 1700 ― 998 Net income attributble to owners of the parent 2054 0 58 1160 0 33 (435) 1150 ― 1009 1961 00550933658 00550933658 00575628587 Revised forecast issued on October 31 2017
Per Share Information (yen) FY2017 FY2018 (Forecast) Amount Amount YOY () Earnings per share 31528 13584 (569) Book value per share 485986 ― ― Dividends per share 10000 7500 ― Dividend payout ratio() 317 552 ― Capital Expenditure and Other (yenmn) FY2017 FY2018 (Forecast) Amount Amount Change Capital expenditure 1645 950 (695) Depreciation and amortization 1192 1350 157 2015年3月期 ガツキ 2016年3月期(予想) ガツキ ヨソウ 金額 キンガク 金額 キンガク 増減額 ゾウゲンガク 増減率 ゾウゲン リツ 医療用医薬品 イリョウヨウ イヤクヒン 27400 30950 +05 ジェネリック医薬品(荷離) イヤクヒン ニ バナレ 25079 27430 +01 内自社販売 ウチ ジシャ ハンバイ 2321 25100 +01 内導出輸出 ウチ ドウシュツ ユシュツ 3011 2330 +04 アムロジピン 1935 3040 +09 ランソプラゾール 1509 1890 24 プラバスタチン 1595 1570 +40 ラベプラゾール 1704 1570 16 リマプロストアルファデクス 1273 1660 26 ボグリボース 1013 1300 +21 ドネペジル 15357 1030 +16 その他 タ 3400 15370 +01 主力品 シュリョク ヒン 1975 3520 +35 ウラリット 1134 1970 03 ソレトン 290 1250 +102 カルバン 0 300 +34 ジェネリック医薬品事業 イヤクヒン ジギョウ 2015年3月期 ガツキ 2016年3月期(予想) ガツキ ヨソウ 金額 キンガク 金額 キンガク 増減額 ゾウゲンガク 増減率 ゾウゲン リツ ジェネリック医薬品事業 イヤクヒン ジギョウ 28918 28840 +1003 ジェネリック医薬品(荷離) イヤクヒン ニ バナレ 27400 27430 +999 受託 ジュタク 1518 1410 +1077
Generics Proprietary Products (yenmn) FY2017 FY2018 (Forecast) Amount Amount YOY () Total 32153 31800 (11) Generics 30115 30150 01 To medical institutions 29174 29250 03 To other makers 941 900 (44) Amlodipine 2940 2900 (14) Lansoprazole 2163 1900 (122) Donepezil 1557 1350 (133) Rabeprazole 1558 1350 (134) Limaprost Alfadex 1427 1350 (55) Pravastatine 1147 1100 (41) Voglibose 870 750 (139) Others 18449 19450 54 Proprietary products 2038 1650 (190) Uralyt 1225 1070 (127) Soleton 598 400 (331) Calvan 214 180 (162) Chemiphar ODM Generics (yenmn) FY2017 FY2018 (Forecast) Amount Amount YOY () Total 31100 31350 08 Generics 30115 30150 01 Generics (ODM) 985 1200 218
Income Statement Overview (yenmn) FY2017 FY2018 (Forecast) of of YOY Amount Sales Amount Sales () Net Sales 35331 1000 35500 1000 05 Pharmaceuticals 34279 970 ― ― ― Others 1051 30 ― ― ― Cost of sales 19535 553 ― ― ― SGampA expenses 13947 395 ― ― ― RampD expenses 2280 65 2700 76 184 Operating income 1848 0 52 1100 31 (405) Income before income taxes and minority interests 1777 80 ― ― ― Net income attributble to owners of the parent 1160 33 500 14 (569)
Capital Expenditure and Other (yenmn) Items FY2016 FY2017 Usage Amount Amount YOY () Forecast Rate () Capital expenditure 2928 1645 (438) 1650 997 Depreciation and amortization 1112 1192 72 1250 954 Revised forecast issued on October 31 2017
Cash Flow Statements (yenmn) FY2016 FY2017 Amount Amount Net cash Provided by operating activities 2737 3188 Used in investing activities (2504) (1606) Used in financing activities 787 (1741) Cash and cash equivalents 8084 7890 Free cash flow 232 1582
Per Share Information (yen) FY2016 FY2017 Amount Amount Change Forecast Earnings per share 53002 31528 (21474) 30673 Book value per share 454880 485986 31106 ― Dividend per share 10000 10000 ― 10000 Dividend payout ratio () 189 317 ― 326 Revised forecast issued on October 31 2017
Balance Sheet Data (yenmn) March 31 2017 August 31 2017 March 31 2015 Amount Amount Change Total assets 47002 46814 3358 (187) Return on assets () 63 36 -06 (27) Net assets 17355 17487 1313 132 Owned capital 17346 17474 1312 127 Capital-to-asset ratio () 369 373 02 +04 Return on equity () 123 67 (01) (56) Current assets 29009 28334 1630 (674) Current liabilities 14939 14914 (716) (25) Current ratio (x) 194 19 019 004
By Main Therapeutic Categories () FY2016 FY2017 Cardiovascular and respiratory drugs 309 320 Digestive organ drugs 196 183 Agents affecting metabolism 164 165 Drugs for nervous system sensory organs 99 91 Antibiotics and chemotherapeutic drugs 65 62 Antineoplastic agents 32 34 Others 135 145
Sales Distribution By Launch Year (yenmn) FY2016 FY2017 Fiscal Year Amount Distrib () Amount Distrib () YOY () 2010 and before 19487 1 667 19194 637 (15) 2009 2011 2348 0 80 2210 73 (59) 2012 1484 0 51 1404 47 (54) 2013 2917 0 100 3127 104 72 2014 1746 0 60 1937 64 110 2015 1001 0 34 1222 41 221 2016 219 0 08 459 15 1091 2017 ― ― 558 19 ― Total 29204 1 1000 30115 1000 31
Generics Proprietary Products (yenmn) FY2016 FY2017 Distrib Distrib YOY Achieved Amount () Amount () () Forecast () Total 31513 1 1000 32153 1 1000 20 32000 1005 Generics 29204 1 927 30115 1 937 31 30000 1 1004 To medical institutions 27808 29174 49 29100 1 1003 To other makers 1395 941 (326) 900 1 1046 Amlodipine 2865 2940 26 2900 1 1014 Lansoprazole 2279 2163 (51) 2100 1 1030 Donepezil 1642 1557 (52) 1600 1 973 Rabeprazole 1586 1558 (18) 1600 1 974 Limaprost Alfadex 1469 1427 (28) 1400 1 1020 Pravastatine 1173 1147 (22) 1100 1 1043 Voglibose 957 870 (91) 900 1 967 Others 17229 18449 71 18400 1 1003 Proprietary products 2308 0 73 2038 0 63 (117) 2000 1 1019 Uralyt 1409 1225 (131) 1200 1 1021 Soleton 679 598 (120) 600 1 997 Calvan 219 214 (21) 200 1 1074 Chemiphar ODM Generics (yenmn) FY2016 FY2017 Distrib Distrib YOY Achieved Amount () Amount () () Forecast () Total 30445 1000 31100 1000 22 31400 990 Generics 29204 959 30115 968 31 30000 1004 Generics (ODM) 1240 41 985 32 (206) 1400 704 Includes exports Revised forecast issued on October 31 2017
Income Statement Overview (yenmn) FY2016 FY2017 of of YOY Achieved Amount Sales Amount Sales () Forecast () Net Sales 35689 1 1000 35331 1 1000 (10) 35500 1 995 Pharmaceuticals 34551 1 968 34279 1 970 (08) ― ― Others 1137 0 32 1051 0 30 (76) ― ― Cost of sales 19449 1 545 19535 1 553 04 ― ― SGampA expenses 13403 0 376 13947 0 395 41 ― ― RampD expenses 1984 0 56 2280 0 65 150 2200 0 1037 Operating income 2836 0 79 1848 0 52 (348) 1800 0 1027 Income before income taxes and minority interests 2849 0 80 1777 0 50 (376) ― ― Net income attributble to owners of the parent 2054 0 58 1160 0 33 (435) 1150 ― 1009 1961 00550933658 00550933658 00575628587 Revised forecast issued on October 31 2017
Page 2
Contents
1
I FY2017 Business ResultsSales Income 3Pharmaceutical Sales 4Sales Distribution 5Balance Sheet per Share Information 6Cash Flow Expenditure 7
II FY2018 ForecastsSales Income 9Pharmaceutical Sales 10Per Share Information Expenditure 11
Slide
プレゼンター
プレゼンテーションのノート
本日はお手元に配布した資料の目次にありますとおり最初に「2014年3月期 決算の概要」について13次に「2015年3月期 業績予想と取り組み」についてご説明したいと思います13
2
I FY2017 Business Results
Sales Income
3
(yenmn)
of of YOY AchievedAmount Sales Amount Sales () Forecast ()
Net Sales 35689 1000 35331 1000 (10) 35500 995 Pharmaceuticals 34551 968 34279 970 (08) ― ― Others 1137 32 1051 30 (76) ― ―Cost of sales 19449 545 19535 553 04 ― ―SGampA expenses 13403 376 13947 395 41 ― ― RampD expenses 1984 56 2280 65 150 2200 1037Operating income 2836 79 1848 52 (348) 1800 1027
2849 80 1777 50 (376) ― ―
2054 58 1160 33 (435) 1150― 1009 Revised forecast issued on October 31 2017
Net income attributble to owners of the parent
FY2016 FY2017
Income before income taxes and minority interests
SalesFor generic drugs the overall speed of replacement has slowed as substitution rates centered on products with large markets neared government targets In addition due to the rise of authorized generics and increasingly fierce price competition profits in this market are being squeezed For Nippon Chemiphar sales to other makers did not grow as expected because orders from our existing business partners were not as large as anticipated On the other hand sales to medical institutions increased 49 YOY due to newly launched products and the expansion of sales channels mainly by our subsidiary As a result our generic sales increased 31 YOY
Although sales of proprietary products declined 117 the results were in line with our forecasts which included factors such as the impact of substitutions for generic drugs
For the above reasons our sales of ethical pharmaceuticals were yen32153 million (up 20 YOY) and total sales of pharmaceutical products including businesses such as diagnostics were yen34279 million (down 08 YOY)
As a result consolidated sales including other segments were yen 35331 million (down 10 YOY)
Operating incomeDuring FY2017 the cost of sales ratio rose 08 percentage points YOY due to factors including adjusted production volumes of products manufactured within the Nippon Chemiphar Group In addition SGampA expenses ratio rose 19 percentage points YOY to 395 This was due mainly to an increase in upfront strategic expenses such as trial costs ahead of the commencement of commercial production at the Vietnam factory (scheduled for the second half of FY 2018) as well as increased research and development expenses for new and generic drugs As a result operating income was yen1848 million (down 348 YOY)
PL 医薬品① 医薬品② 医薬品③ BS① BS③ 和文にある「前年同期間比」「前期3月末比」は記載が難しく英語版では必要度の低い情報であるとみなして記載をしないこととなった2016年2Q~(木村)ただし期末では記載が可能なので書きます(須田)
CF CAP EX 業績予想① 英語版では経常利益は書かないので注意(須田)
業績予想 ② 業績予想③ Pharmaceutical Sales
4
Generics Proprietary Products (yenmn)
Distrib Distrib YOY AchievedAmount () Amount () () Forecast ()
Total 31513 1000 32153 1000 20 32000 1005 Generics 29204 927 30115 937 31 30000 1004 To medical institutions 27808 29174 49 29100 1003 To other makers 1395 941 (326) 900 1046 Amlodipine 2865 2940 26 2900 1014 Lansoprazole 2279 2163 (51) 2100 1030 Donepezil 1642 1557 (52) 1600 973 Rabeprazole 1586 1558 (18) 1600 974 Limaprost Alfadex 1469 1427 (28) 1400 1020 Pravastatine 1173 1147 (22) 1100 1043 Voglibose 957 870 (91) 900 967 Others 17229 18449 71 18400 1003 Proprietary products 2308 73 2038 63 (117) 2000 1019 Uralyt 1409 1225 (131) 1200 1021 Soleton 679 598 (120) 600 997 Calvan 219 214 (21) 200 1074
Chemiphar ODM Generics (yenmn)
Distrib Distrib YOY AchievedAmount () Amount () () Forecast ()
Total 30445 1000 31100 1000 22 31400 990 Generics 29204 959 30115 968 31 30000 1004 Generics (ODM) 1240 41 985 32 (206) 1400 704 Includes exports Revised forecast issued on October 31 2017
FY2017
FY2016
FY2016
FY2017
PL 医薬品① 医薬品② 医薬品③ BS① BS③ 和文にある「前年同期間比」「前期3月末比」は記載が難しく英語版では必要度の低い情報であるとみなして記載をしないこととなった2016年2Q~(木村)ただし期末では記載が可能なので書きます(須田)
CF CAP EX 業績予想① 英語版では経常利益は書かないので注意(須田)
業績予想 ② 業績予想③ Sales Distribution
5
By Main Therapeutic Categories ()FY2016 FY2017
Cardiovascular and respiratory drugs 309 320Digestive organ drugs 196 183Agents affecting metabolism 164 165Drugs for nervous system sensory organs 99 91Antibiotics and chemotherapeutic drugs 65 62Antineoplastic agents 32 34Others 135 145
By Launch Year (yenmn)
Fiscal Year AmountDistrib
() AmountDistrib
() YOY ()2010 and before 19487 667 19194 637 (15)2011 2348 80 2210 73 (59)2012 1484 51 1404 47 (54)2013 2917 100 3127 104 722014 1746 60 1937 64 1102015 1001 34 1222 41 2212016 219 08 459 15 10912017 ― ― 558 19 ―Total 29204 1000 30115 1000 31
FY2016 FY2017
PL 医薬品① 医薬品② 医薬品③ BS① BS③ 和文にある「前年同期間比」「前期3月末比」は記載が難しく英語版では必要度の低い情報であるとみなして記載をしないこととなった2016年2Q~(木村)ただし期末では記載が可能なので書きます(須田)
CF CAP EX 業績予想① 英語版では経常利益は書かないので注意(須田)
業績予想 ② 業績予想③ PL 医薬品① 医薬品② 医薬品③ BS① BS③ 和文にある「前年同期間比」「前期3月末比」は記載が難しく英語版では必要度の低い情報であるとみなして記載をしないこととなった2016年2Q~(木村)ただし期末では記載が可能なので書きます(須田)
CF CAP EX 業績予想① 英語版では経常利益は書かないので注意(須田)
業績予想 ② 業績予想③ Balance Sheet per Share Information
6
Per Share Information (yen)FY2016Amount Amount Change Forecast
Earnings per share 53002 31528 (21474) 30673Book value per share 454880 485986 31106 ―Dividend per share 10000 10000 ― 10000Dividend payout ratio () 189 317 ― 326 Revised forecast issued on October 31 2017
FY2017
Balance Sheet Data (yenmn)March 31 2017
Amount Amount ChangeTotal assets 47002 46814 (187) Return on assets () 63 36 (27)Net assets 17355 17487 132 Owned capital 17346 17474 127 Capital-to-asset ratio () 369 373 04 Return on equity () 123 67 (56)Current assets 29009 28334 (674)Current liabilities 14939 14914 (25) Current ratio (x) 194 19 (004)
March 31 2018
PL 医薬品① 医薬品② 医薬品③ BS① BS③ 和文にある「前年同期間比」「前期3月末比」は記載が難しく英語版では必要度の低い情報であるとみなして記載をしないこととなった2016年2Q~(木村)ただし期末では記載が可能なので書きます(須田)
CF CAP EX 業績予想① 英語版では経常利益は書かないので注意(須田)
業績予想 ② 業績予想③ PL 医薬品① 医薬品② 医薬品③ BS① BS③ 和文にある「前年同期間比」「前期3月末比」は記載が難しく英語版では必要度の低い情報であるとみなして記載をしないこととなった2016年2Q~(木村)ただし期末では記載が可能なので書きます(須田)
CF CAP EX 業績予想① 英語版では経常利益は書かないので注意(須田)
業績予想 ② 業績予想③ Cash Flow Expenditure
7
Cash Flow Statements (yenmn)FY2016 FY2017Amount Amount
Net cash Provided by operating activities 2737 3188 Used in investing activities (2504) (1606) Provided by (Used in) financing activities 787 (1741)Cash and cash equivalents 8084 7890Free cash flow 232 1582
Capital Expenditure and Other (yenmn)FY2016
UsageAmount Amount YOY () Forecast Rate ()
Capital expenditure 2928 1645 (438) 1650 997Depreciation and amortization 1112 1192 72 1250 954 Revised forecast issued on October 31 2017
Items
FY2017
PL 医薬品① 医薬品② 医薬品③ BS① BS③ 和文にある「前年同期間比」「前期3月末比」は記載が難しく英語版では必要度の低い情報であるとみなして記載をしないこととなった2016年2Q~(木村)ただし期末では記載が可能なので書きます(須田)
CF CAP EX 業績予想① 英語版では経常利益は書かないので注意(須田)
業績予想 ② 業績予想③ PL 医薬品① 医薬品② 医薬品③ BS① BS③ 和文にある「前年同期間比」「前期3月末比」は記載が難しく英語版では必要度の低い情報であるとみなして記載をしないこととなった2016年2Q~(木村)ただし期末では記載が可能なので書きます(須田)
CF CAP EX 業績予想① 英語版では経常利益は書かないので注意(須田)
業績予想 ② 業績予想③ 8
II FY2018 Forecasts
Sales Income
9
(yenmn)
of of YOYAmount Sales Amount Sales ()
Net Sales 35331 1000 35500 1000 05 Pharmaceuticals 34279 970 ― ― ― Others 1051 30 ― ― ―Cost of sales 19535 553 ― ― ―SGampA expenses 13947 395 ― ― ― RampD expenses 2280 65 2700 76 184Operating income 1848 52 1100 31 (405)
1777 50 ― ― ―
1160 33 500 14 (569)Net income attributble to owners of the parent
FY2018 (Forecast)FY2017
Income before income taxes and minority interests
Annual ForecastSales and profit in FY2018 will be impacted by NHI drug price revisions On the other hand however due to our focus on newly launched products and expansion of new sales channels sales of generic drugs are expected to be nearly flat compared to the previous fiscal year As a result consolidated net sales including other businesses such as contracted testing business are projected to be yen35500 million (up 05 YOY)
Regarding profits due to increased development costs as the progress in new drug development and continued strategic expenses such as trial costs leading up to the commencement of commercial production at the Vietnam factory operating income is forecast at yen1100 million (down 405 YOY) and net income attributable to owners of the parent is expected to be yen500 million (down 569 YOY)
PL 医薬品① 医薬品② 医薬品③ BS① BS③ 和文にある「前年同期間比」「前期3月末比」は記載が難しく英語版では必要度の低い情報であるとみなして記載をしないこととなった2016年2Q~(木村)ただし期末では記載が可能なので書きます(須田)
CF CAP EX 業績予想① 英語版では経常利益は書かないので注意(須田)
業績予想 ② 業績予想③ Pharmaceutical Sales
10
Generics Proprietary Products (yenmn)FY2017Amount Amount YOY ()
Total 32153 31800 (11) Generics 30115 30150 01 To medical institutions 29174 29250 03 To other makers 941 900 (44) Amlodipine 2940 2900 (14) Lansoprazole 2163 1900 (122) Donepezil 1557 1350 (133) Rabeprazole 1558 1350 (134) Limaprost Alfadex 1427 1350 (55) Pravastatine 1147 1100 (41) Voglibose 870 750 (139) Others 18449 19450 54 Proprietary products 2038 1650 (190) Uralyt 1225 1070 (127) Soleton 598 400 (331) Calvan 214 180 (162)
Chemiphar ODM Generics (yenmn)FY2017Amount Amount YOY ()
Total 31100 31350 08 Generics 30115 30150 01 Generics (ODM) 985 1200 218
FY2018 (Forecast)
FY2018 (Forecast)
PL 医薬品① 医薬品② 医薬品③ BS① BS③ 和文にある「前年同期間比」「前期3月末比」は記載が難しく英語版では必要度の低い情報であるとみなして記載をしないこととなった2016年2Q~(木村)ただし期末では記載が可能なので書きます(須田)
CF CAP EX 業績予想① 英語版では経常利益は書かないので注意(須田)
業績予想 ② 業績予想③ Per Share Information Expenditure
11
For further information contactPublic Relations Department Nippon Chemiphar Co LtdE-mail irchemipharcojp
Note about Forward-looking Statements and ForecastsStatements made in this Highlights of Business Results with respect to current plans estimates strategies and beliefs and other statements of Nippon Chemiphar that are not historical facts are forward-looking statements about the future performance of Nippon Chemiphar
These statements are based on managementrsquos current assumptions and beliefs in light of the information currently available to it and involve known and unknown risks and uncertainties Consequently undue reliance should not be placed on these statements
Nippon Chemiphar cautions the reader that a number of important factors could cause actual results to differ materially from those discussed in the forward-looking statements
Per Share Information (yen)FY2017Amount Amount YOY ()
Earnings per share 31528 13584 (569)Book value per share 485986 ― ―Dividends per share 10000 7500 ―Dividend payout ratio () 317 552 ―
Capital Expenditure and Other (yenmn)FY2017Amount Amount Change
Capital expenditure 1645 950 (695)Depreciation and amortization 1192 1350 157
FY2018 (Forecast)
FY2018 (Forecast)
Dividend ForecastAs mentioned above we are forecasting a decline in profit in FY2018 due to the influence of NHI drug price revisions ongoing strategic spending including new drug development expenses and start-up expenses at the Vietnam factory Thus we expect to pay a dividend per share of 75 yen (down 25 yen per share YOY) with a payout ratio of 552
PL 医薬品① 医薬品② 医薬品③ BS① BS③ 和文にある「前年同期間比」「前期3月末比」は記載が難しく英語版では必要度の低い情報であるとみなして記載をしないこととなった2016年2Q~(木村)ただし期末では記載が可能なので書きます(須田)
CF CAP EX 業績予想① 英語版では経常利益は書かないので注意(須田)
業績予想 ② 業績予想③ スライド番号 1 Contents スライド番号 3 Sales Income Pharmaceutical Sales Sales Distribution Balance Sheet per Share Information Cash Flow Expenditure スライド番号 9 Sales Income Pharmaceutical Sales Per Share Information Expenditure Per Share Information (yen) FY2017 FY2018 (Forecast) Amount Amount YOY () Earnings per share 31528 13584 (569) Book value per share 485986 ― ― Dividends per share 10000 7500 ― Dividend payout ratio () 317 552 ― Capital Expenditure and Other (yenmn) FY2017 FY2018 (Forecast) Amount Amount Change Capital expenditure 1645 950 (695) Depreciation and amortization 1192 1350 157 2015年3月期 ガツキ 2016年3月期(予想) ガツキ ヨソウ 金額 キンガク 金額 キンガク 増減額 ゾウゲンガク 増減率 ゾウゲン リツ 医療用医薬品 イリョウヨウ イヤクヒン 27400 30950 +05 ジェネリック医薬品(荷離) イヤクヒン ニ バナレ 25079 27430 +01 内自社販売 ウチ ジシャ ハンバイ 2321 25100 +01 内導出輸出 ウチ ドウシュツ ユシュツ 3011 2330 +04 アムロジピン 1935 3040 +09 ランソプラゾール 1509 1890 24 プラバスタチン 1595 1570 +40 ラベプラゾール 1704 1570 16 リマプロストアルファデクス 1273 1660 26 ボグリボース 1013 1300 +21 ドネペジル 15357 1030 +16 その他 タ 3400 15370 +01 主力品 シュリョク ヒン 1975 3520 +35 ウラリット 1134 1970 03 ソレトン 290 1250 +102 カルバン 0 300 +34 ジェネリック医薬品事業 イヤクヒン ジギョウ 2015年3月期 ガツキ 2016年3月期(予想) ガツキ ヨソウ 金額 キンガク 金額 キンガク 増減額 ゾウゲンガク 増減率 ゾウゲン リツ ジェネリック医薬品事業 イヤクヒン ジギョウ 28918 28840 +1003 ジェネリック医薬品(荷離) イヤクヒン ニ バナレ 27400 27430 +999 受託 ジュタク 1518 1410 +1077
Generics Proprietary Products (yenmn) FY2017 FY2018 (Forecast) Amount Amount YOY () Total 32153 31800 (11) Generics 30115 30150 01 To medical institutions 29174 29250 03 To other makers 941 900 (44) Amlodipine 2940 2900 (14) Lansoprazole 2163 1900 (122) Donepezil 1557 1350 (133) Rabeprazole 1558 1350 (134) Limaprost Alfadex 1427 1350 (55) Pravastatine 1147 1100 (41) Voglibose 870 750 (139) Others 18449 19450 54 Proprietary products 2038 1650 (190) Uralyt 1225 1070 (127) Soleton 598 400 (331) Calvan 214 180 (162) Chemiphar ODM Generics (yenmn) FY2017 FY2018 (Forecast) Amount Amount YOY () Total 31100 31350 08 Generics 30115 30150 01 Generics (ODM) 985 1200 218
Income Statement Overview (yenmn) FY2017 FY2018 (Forecast) of of YOY Amount Sales Amount Sales () Net Sales 35331 1000 35500 1000 05 Pharmaceuticals 34279 970 ― ― ― Others 1051 30 ― ― ― Cost of sales 19535 553 ― ― ― SGampA expenses 13947 395 ― ― ― RampD expenses 2280 65 2700 76 184 Operating income 1848 0 52 1100 31 (405) Income before income taxes and minority interests 1777 80 ― ― ― Net income attributble to owners of the parent 1160 33 500 14 (569)
Capital Expenditure and Other (yenmn) Items FY2016 FY2017 Usage Amount Amount YOY () Forecast Rate () Capital expenditure 2928 1645 (438) 1650 997 Depreciation and amortization 1112 1192 72 1250 954 Revised forecast issued on October 31 2017
Cash Flow Statements (yenmn) FY2016 FY2017 Amount Amount Net cash Provided by operating activities 2737 3188 Used in investing activities (2504) (1606) Used in financing activities 787 (1741) Cash and cash equivalents 8084 7890 Free cash flow 232 1582
Per Share Information (yen) FY2016 FY2017 Amount Amount Change Forecast Earnings per share 53002 31528 (21474) 30673 Book value per share 454880 485986 31106 ― Dividend per share 10000 10000 ― 10000 Dividend payout ratio () 189 317 ― 326 Revised forecast issued on October 31 2017
Balance Sheet Data (yenmn) March 31 2017 August 31 2017 March 31 2015 Amount Amount Change Total assets 47002 46814 3358 (187) Return on assets () 63 36 -06 (27) Net assets 17355 17487 1313 132 Owned capital 17346 17474 1312 127 Capital-to-asset ratio () 369 373 02 +04 Return on equity () 123 67 (01) (56) Current assets 29009 28334 1630 (674) Current liabilities 14939 14914 (716) (25) Current ratio (x) 194 19 019 004
By Main Therapeutic Categories () FY2016 FY2017 Cardiovascular and respiratory drugs 309 320 Digestive organ drugs 196 183 Agents affecting metabolism 164 165 Drugs for nervous system sensory organs 99 91 Antibiotics and chemotherapeutic drugs 65 62 Antineoplastic agents 32 34 Others 135 145
Sales Distribution By Launch Year (yenmn) FY2016 FY2017 Fiscal Year Amount Distrib () Amount Distrib () YOY () 2010 and before 19487 1 667 19194 637 (15) 2009 2011 2348 0 80 2210 73 (59) 2012 1484 0 51 1404 47 (54) 2013 2917 0 100 3127 104 72 2014 1746 0 60 1937 64 110 2015 1001 0 34 1222 41 221 2016 219 0 08 459 15 1091 2017 ― ― ― 558 19 ― Total 29204 1 1000 30115 1000 31
Generics Proprietary Products (yenmn) FY2016 FY2017 Distrib Distrib YOY Achieved Amount () Amount () () Forecast () Total 31513 1 1000 32153 1 1000 20 32000 1005 Generics 29204 1 927 30115 1 937 31 30000 1 1004 To medical institutions 27808 29174 49 29100 1 1003 To other makers 1395 941 (326) 900 1 1046 Amlodipine 2865 2940 26 2900 1 1014 Lansoprazole 2279 2163 (51) 2100 1 1030 Donepezil 1642 1557 (52) 1600 1 973 Rabeprazole 1586 1558 (18) 1600 1 974 Limaprost Alfadex 1469 1427 (28) 1400 1 1020 Pravastatine 1173 1147 (22) 1100 1 1043 Voglibose 957 870 (91) 900 1 967 Others 17229 18449 71 18400 1 1003 Proprietary products 2308 0 73 2038 0 63 (117) 2000 1 1019 Uralyt 1409 1225 (131) 1200 1 1021 Soleton 679 598 (120) 600 1 997 Calvan 219 214 (21) 200 1 1074 Chemiphar ODM Generics (yenmn) FY2016 FY2017 Distrib Distrib YOY Achieved Amount () Amount () () Forecast () Total 30445 1000 31100 1000 22 31400 990 Generics 29204 959 30115 968 31 30000 1004 Generics (ODM) 1240 41 985 32 (206) 1400 704 Includes exports Revised forecast issued on October 31 2017
Income Statement Overview (yenmn) FY2016 FY2017 of of YOY Achieved Amount Sales Amount Sales () Forecast () Net Sales 35689 1 1000 35331 1 1000 (10) 35500 1 995 Pharmaceuticals 34551 1 968 34279 1 970 (08) ― ― ― Others 1137 0 32 1051 0 30 (76) ― ― ― Cost of sales 19449 1 545 19535 1 553 04 ― ― ― SGampA expenses 13403 0 376 13947 0 395 41 ― ― ― RampD expenses 1984 0 56 2280 0 65 150 2200 0 1037 Operating income 2836 0 79 1848 0 52 (348) 1800 0 1027 Income before income taxes and minority interests 2849 0 80 1696 0 48 (405) 1700 ― 998 Net income attributble to owners of the parent 2054 0 58 1160 0 33 (435) 1150 ― 1009 1961 00550933658 00550933658 00575628587 Revised forecast issued on October 31 2017
Per Share Information (yen) FY2017 FY2018 (Forecast) Amount Amount YOY () Earnings per share 31528 13584 (569) Book value per share 485986 ― ― Dividends per share 10000 7500 ― Dividend payout ratio() 317 552 ― Capital Expenditure and Other (yenmn) FY2017 FY2018 (Forecast) Amount Amount Change Capital expenditure 1645 950 (695) Depreciation and amortization 1192 1350 157 2015年3月期 ガツキ 2016年3月期(予想) ガツキ ヨソウ 金額 キンガク 金額 キンガク 増減額 ゾウゲンガク 増減率 ゾウゲン リツ 医療用医薬品 イリョウヨウ イヤクヒン 27400 30950 +05 ジェネリック医薬品(荷離) イヤクヒン ニ バナレ 25079 27430 +01 内自社販売 ウチ ジシャ ハンバイ 2321 25100 +01 内導出輸出 ウチ ドウシュツ ユシュツ 3011 2330 +04 アムロジピン 1935 3040 +09 ランソプラゾール 1509 1890 24 プラバスタチン 1595 1570 +40 ラベプラゾール 1704 1570 16 リマプロストアルファデクス 1273 1660 26 ボグリボース 1013 1300 +21 ドネペジル 15357 1030 +16 その他 タ 3400 15370 +01 主力品 シュリョク ヒン 1975 3520 +35 ウラリット 1134 1970 03 ソレトン 290 1250 +102 カルバン 0 300 +34 ジェネリック医薬品事業 イヤクヒン ジギョウ 2015年3月期 ガツキ 2016年3月期(予想) ガツキ ヨソウ 金額 キンガク 金額 キンガク 増減額 ゾウゲンガク 増減率 ゾウゲン リツ ジェネリック医薬品事業 イヤクヒン ジギョウ 28918 28840 +1003 ジェネリック医薬品(荷離) イヤクヒン ニ バナレ 27400 27430 +999 受託 ジュタク 1518 1410 +1077
Generics Proprietary Products (yenmn) FY2017 FY2018 (Forecast) Amount Amount YOY () Total 32153 31800 (11) Generics 30115 30150 01 To medical institutions 29174 29250 03 To other makers 941 900 (44) Amlodipine 2940 2900 (14) Lansoprazole 2163 1900 (122) Donepezil 1557 1350 (133) Rabeprazole 1558 1350 (134) Limaprost Alfadex 1427 1350 (55) Pravastatine 1147 1100 (41) Voglibose 870 750 (139) Others 18449 19450 54 Proprietary products 2038 1650 (190) Uralyt 1225 1070 (127) Soleton 598 400 (331) Calvan 214 180 (162) Chemiphar ODM Generics (yenmn) FY2017 FY2018 (Forecast) Amount Amount YOY () Total 31100 31350 08 Generics 30115 30150 01 Generics (ODM) 985 1200 218
Income Statement Overview (yenmn) FY2017 FY2018 (Forecast) of of YOY Amount Sales Amount Sales () Net Sales 35331 1000 35500 1000 05 Pharmaceuticals 34279 970 ― ― ― Others 1051 30 ― ― ― Cost of sales 19535 553 ― ― ― SGampA expenses 13947 395 ― ― ― RampD expenses 2280 65 2700 76 184 Operating income 1848 0 52 1100 31 (405) Income before income taxes and minority interests 1777 80 ― ― ― Net income attributble to owners of the parent 1160 33 500 14 (569)
Capital Expenditure and Other (yenmn) Items FY2016 FY2017 Usage Amount Amount YOY () Forecast Rate () Capital expenditure 2928 1645 (438) 1650 997 Depreciation and amortization 1112 1192 72 1250 954 Revised forecast issued on October 31 2017
Cash Flow Statements (yenmn) FY2016 FY2017 Amount Amount Net cash Provided by operating activities 2737 3188 Used in investing activities (2504) (1606) Used in financing activities 787 (1741) Cash and cash equivalents 8084 7890 Free cash flow 232 1582
Per Share Information (yen) FY2016 FY2017 Amount Amount Change Forecast Earnings per share 53002 31528 (21474) 30673 Book value per share 454880 485986 31106 ― Dividend per share 10000 10000 ― 10000 Dividend payout ratio () 189 317 ― 326 Revised forecast issued on October 31 2017
Balance Sheet Data (yenmn) March 31 2017 August 31 2017 March 31 2015 Amount Amount Change Total assets 47002 46814 3358 (187) Return on assets () 63 36 -06 (27) Net assets 17355 17487 1313 132 Owned capital 17346 17474 1312 127 Capital-to-asset ratio () 369 373 02 +04 Return on equity () 123 67 (01) (56) Current assets 29009 28334 1630 (674) Current liabilities 14939 14914 (716) (25) Current ratio (x) 194 19 019 004
By Main Therapeutic Categories () FY2016 FY2017 Cardiovascular and respiratory drugs 309 320 Digestive organ drugs 196 183 Agents affecting metabolism 164 165 Drugs for nervous system sensory organs 99 91 Antibiotics and chemotherapeutic drugs 65 62 Antineoplastic agents 32 34 Others 135 145
Sales Distribution By Launch Year (yenmn) FY2016 FY2017 Fiscal Year Amount Distrib () Amount Distrib () YOY () 2010 and before 19487 1 667 19194 637 (15) 2009 2011 2348 0 80 2210 73 (59) 2012 1484 0 51 1404 47 (54) 2013 2917 0 100 3127 104 72 2014 1746 0 60 1937 64 110 2015 1001 0 34 1222 41 221 2016 219 0 08 459 15 1091 2017 ― ― ― 558 19 ― Total 29204 1 1000 30115 1000 31
Generics Proprietary Products (yenmn) FY2016 FY2017 Distrib Distrib YOY Achieved Amount () Amount () () Forecast () Total 31513 1 1000 32153 1 1000 20 32000 1005 Generics 29204 1 927 30115 1 937 31 30000 1 1004 To medical institutions 27808 29174 49 29100 1 1003 To other makers 1395 941 (326) 900 1 1046 Amlodipine 2865 2940 26 2900 1 1014 Lansoprazole 2279 2163 (51) 2100 1 1030 Donepezil 1642 1557 (52) 1600 1 973 Rabeprazole 1586 1558 (18) 1600 1 974 Limaprost Alfadex 1469 1427 (28) 1400 1 1020 Pravastatine 1173 1147 (22) 1100 1 1043 Voglibose 957 870 (91) 900 1 967 Others 17229 18449 71 18400 1 1003 Proprietary products 2308 0 73 2038 0 63 (117) 2000 1 1019 Uralyt 1409 1225 (131) 1200 1 1021 Soleton 679 598 (120) 600 1 997 Calvan 219 214 (21) 200 1 1074 Chemiphar ODM Generics (yenmn) FY2016 FY2017 Distrib Distrib YOY Achieved Amount () Amount () () Forecast () Total 30445 1000 31100 1000 22 31400 990 Generics 29204 959 30115 968 31 30000 1004 Generics (ODM) 1240 41 985 32 (206) 1400 704 Includes exports Revised forecast issued on October 31 2017
Income Statement Overview (yenmn) FY2016 FY2017 of of YOY Achieved Amount Sales Amount Sales () Forecast () Net Sales 35689 1 1000 35331 1 1000 (10) 35500 1 995 Pharmaceuticals 34551 1 968 34279 1 970 (08) ― ― ― Others 1137 0 32 1051 0 30 (76) ― ― ― Cost of sales 19449 1 545 19535 1 553 04 ― ― ― SGampA expenses 13403 0 376 13947 0 395 41 ― ― ― RampD expenses 1984 0 56 2280 0 65 150 2200 0 1037 Operating income 2836 0 79 1848 0 52 (348) 1800 0 1027 Income before income taxes and minority interests 2849 0 80 1696 0 48 (405) 1700 ― 998 Net income attributble to owners of the parent 2054 0 58 1160 0 33 (435) 1150 ― 1009 1961 00550933658 00550933658 00575628587 Revised forecast issued on October 31 2017
Per Share Information (yen) FY2017 FY2018 (Forecast) Amount Amount YOY () Earnings per share 31528 13584 (569) Book value per share 485986 ― ― Dividends per share 10000 7500 ― Dividend payout ratio() 317 552 ― Capital Expenditure and Other (yenmn) FY2017 FY2018 (Forecast) Amount Amount Change Capital expenditure 1645 950 (695) Depreciation and amortization 1192 1350 157 2015年3月期 ガツキ 2016年3月期(予想) ガツキ ヨソウ 金額 キンガク 金額 キンガク 増減額 ゾウゲンガク 増減率 ゾウゲン リツ 医療用医薬品 イリョウヨウ イヤクヒン 27400 30950 +05 ジェネリック医薬品(荷離) イヤクヒン ニ バナレ 25079 27430 +01 内自社販売 ウチ ジシャ ハンバイ 2321 25100 +01 内導出輸出 ウチ ドウシュツ ユシュツ 3011 2330 +04 アムロジピン 1935 3040 +09 ランソプラゾール 1509 1890 24 プラバスタチン 1595 1570 +40 ラベプラゾール 1704 1570 16 リマプロストアルファデクス 1273 1660 26 ボグリボース 1013 1300 +21 ドネペジル 15357 1030 +16 その他 タ 3400 15370 +01 主力品 シュリョク ヒン 1975 3520 +35 ウラリット 1134 1970 03 ソレトン 290 1250 +102 カルバン 0 300 +34 ジェネリック医薬品事業 イヤクヒン ジギョウ 2015年3月期 ガツキ 2016年3月期(予想) ガツキ ヨソウ 金額 キンガク 金額 キンガク 増減額 ゾウゲンガク 増減率 ゾウゲン リツ ジェネリック医薬品事業 イヤクヒン ジギョウ 28918 28840 +1003 ジェネリック医薬品(荷離) イヤクヒン ニ バナレ 27400 27430 +999 受託 ジュタク 1518 1410 +1077
Generics Proprietary Products (yenmn) FY2017 FY2018 (Forecast) Amount Amount YOY () Total 32153 31800 (11) Generics 30115 30150 01 To medical institutions 29174 29250 03 To other makers 941 900 (44) Amlodipine 2940 2900 (14) Lansoprazole 2163 1900 (122) Donepezil 1557 1350 (133) Rabeprazole 1558 1350 (134) Limaprost Alfadex 1427 1350 (55) Pravastatine 1147 1100 (41) Voglibose 870 750 (139) Others 18449 19450 54 Proprietary products 2038 1650 (190) Uralyt 1225 1070 (127) Soleton 598 400 (331) Calvan 214 180 (162) Chemiphar ODM Generics (yenmn) FY2017 FY2018 (Forecast) Amount Amount YOY () Total 31100 31350 08 Generics 30115 30150 01 Generics (ODM) 985 1200 218
Income Statement Overview (yenmn) FY2017 FY2018 (Forecast) of of YOY Amount Sales Amount Sales () Net Sales 35331 1000 35500 1000 05 Pharmaceuticals 34279 970 ― ― ― Others 1051 30 ― ― ― Cost of sales 19535 553 ― ― ― SGampA expenses 13947 395 ― ― ― RampD expenses 2280 65 2700 76 184 Operating income 1848 0 52 1100 31 (405) Income before income taxes and minority interests 1777 50 ― ― ― Net income attributble to owners of the parent 1160 33 500 14 (569)
Capital Expenditure and Other (yenmn) Items FY2016 FY2017 Usage Amount Amount YOY () Forecast Rate () Capital expenditure 2928 1645 (438) 1650 997 Depreciation and amortization 1112 1192 72 1250 954 Revised forecast issued on October 31 2017
Cash Flow Statements (yenmn) FY2016 FY2017 Amount Amount Net cash Provided by operating activities 2737 3188 Used in investing activities (2504) (1606) Used in financing activities 787 (1741) Cash and cash equivalents 8084 7890 Free cash flow 232 1582
Per Share Information (yen) FY2016 FY2017 Amount Amount Change Forecast Earnings per share 53002 31528 (21474) 30673 Book value per share 454880 485986 31106 ― Dividend per share 10000 10000 ― 10000 Dividend payout ratio () 189 317 ― 326 Revised forecast issued on October 31 2017
Balance Sheet Data (yenmn) March 31 2017 March 31 2018 March 31 2015 Amount Amount Change Total assets 47002 46814 3358 (187) Return on assets () 63 36 -06 (27) Net assets 17355 17487 1313 132 Owned capital 17346 17474 1312 127 Capital-to-asset ratio () 369 373 02 04 Return on equity () 123 67 (01) (56) Current assets 29009 28334 1630 (674) Current liabilities 14939 14914 (716) (25) Current ratio (x) 194 19 019 (004)
By Main Therapeutic Categories () FY2016 FY2017 Cardiovascular and respiratory drugs 309 320 Digestive organ drugs 196 183 Agents affecting metabolism 164 165 Drugs for nervous system sensory organs 99 91 Antibiotics and chemotherapeutic drugs 65 62 Antineoplastic agents 32 34 Others 135 145
Sales Distribution By Launch Year (yenmn) FY2016 FY2017 Fiscal Year Amount Distrib () Amount Distrib () YOY () 2010 and before 19487 1 667 19194 637 (15) 2009 2011 2348 0 80 2210 73 (59) 2012 1484 0 51 1404 47 (54) 2013 2917 0 100 3127 104 72 2014 1746 0 60 1937 64 110 2015 1001 0 34 1222 41 221 2016 219 0 08 459 15 1091 2017 ― ― 558 19 ― Total 29204 1 1000 30115 1000 31
Generics Proprietary Products (yenmn) FY2016 FY2017 Distrib Distrib YOY Achieved Amount () Amount () () Forecast () Total 31513 1 1000 32153 1 1000 20 32000 1005 Generics 29204 1 927 30115 1 937 31 30000 1 1004 To medical institutions 27808 29174 49 29100 1 1003 To other makers 1395 941 (326) 900 1 1046 Amlodipine 2865 2940 26 2900 1 1014 Lansoprazole 2279 2163 (51) 2100 1 1030 Donepezil 1642 1557 (52) 1600 1 973 Rabeprazole 1586 1558 (18) 1600 1 974 Limaprost Alfadex 1469 1427 (28) 1400 1 1020 Pravastatine 1173 1147 (22) 1100 1 1043 Voglibose 957 870 (91) 900 1 967 Others 17229 18449 71 18400 1 1003 Proprietary products 2308 0 73 2038 0 63 (117) 2000 1 1019 Uralyt 1409 1225 (131) 1200 1 1021 Soleton 679 598 (120) 600 1 997 Calvan 219 214 (21) 200 1 1074 Chemiphar ODM Generics (yenmn) FY2016 FY2017 Distrib Distrib YOY Achieved Amount () Amount () () Forecast () Total 30445 1000 31100 1000 22 31400 990 Generics 29204 959 30115 968 31 30000 1004 Generics (ODM) 1240 41 985 32 (206) 1400 704 Includes exports Revised forecast issued on October 31 2017
Income Statement Overview (yenmn) FY2016 FY2017 of of YOY Achieved Amount Sales Amount Sales () Forecast () Net Sales 35689 1 1000 35331 1 1000 (10) 35500 1 995 Pharmaceuticals 34551 1 968 34279 1 970 (08) ― ― Others 1137 0 32 1051 0 30 (76) ― ― Cost of sales 19449 1 545 19535 1 553 04 ― ― SGampA expenses 13403 0 376 13947 0 395 41 ― ― RampD expenses 1984 0 56 2280 0 65 150 2200 0 1037 Operating income 2836 0 79 1848 0 52 (348) 1800 0 1027 Income before income taxes and minority interests 2849 0 80 1777 0 50 (376) ― ― Net income attributble to owners of the parent 2054 0 58 1160 0 33 (435) 1150 ― 1009 1961 00550933658 00550933658 00575628587 Revised forecast issued on October 31 2017
Per Share Information (yen) FY2017 FY2018 (Forecast) Amount Amount YOY () Earnings per share 31528 13584 (569) Book value per share 485986 ― ― Dividends per share 10000 7500 ― Dividend payout ratio() 317 552 ― Capital Expenditure and Other (yenmn) FY2017 FY2018 (Forecast) Amount Amount Change Capital expenditure 1645 950 (695) Depreciation and amortization 1192 1350 157 2015年3月期 ガツキ 2016年3月期(予想) ガツキ ヨソウ 金額 キンガク 金額 キンガク 増減額 ゾウゲンガク 増減率 ゾウゲン リツ 医療用医薬品 イリョウヨウ イヤクヒン 27400 30950 +05 ジェネリック医薬品(荷離) イヤクヒン ニ バナレ 25079 27430 +01 内自社販売 ウチ ジシャ ハンバイ 2321 25100 +01 内導出輸出 ウチ ドウシュツ ユシュツ 3011 2330 +04 アムロジピン 1935 3040 +09 ランソプラゾール 1509 1890 24 プラバスタチン 1595 1570 +40 ラベプラゾール 1704 1570 16 リマプロストアルファデクス 1273 1660 26 ボグリボース 1013 1300 +21 ドネペジル 15357 1030 +16 その他 タ 3400 15370 +01 主力品 シュリョク ヒン 1975 3520 +35 ウラリット 1134 1970 03 ソレトン 290 1250 +102 カルバン 0 300 +34 ジェネリック医薬品事業 イヤクヒン ジギョウ 2015年3月期 ガツキ 2016年3月期(予想) ガツキ ヨソウ 金額 キンガク 金額 キンガク 増減額 ゾウゲンガク 増減率 ゾウゲン リツ ジェネリック医薬品事業 イヤクヒン ジギョウ 28918 28840 +1003 ジェネリック医薬品(荷離) イヤクヒン ニ バナレ 27400 27430 +999 受託 ジュタク 1518 1410 +1077
Generics Proprietary Products (yenmn) FY2017 FY2018 (Forecast) Amount Amount YOY () Total 32153 31800 (11) Generics 30115 30150 01 To medical institutions 29174 29250 03 To other makers 941 900 (44) Amlodipine 2940 2900 (14) Lansoprazole 2163 1900 (122) Donepezil 1557 1350 (133) Rabeprazole 1558 1350 (134) Limaprost Alfadex 1427 1350 (55) Pravastatine 1147 1100 (41) Voglibose 870 750 (139) Others 18449 19450 54 Proprietary products 2038 1650 (190) Uralyt 1225 1070 (127) Soleton 598 400 (331) Calvan 214 180 (162) Chemiphar ODM Generics (yenmn) FY2017 FY2018 (Forecast) Amount Amount YOY () Total 31100 31350 08 Generics 30115 30150 01 Generics (ODM) 985 1200 218
Income Statement Overview (yenmn) FY2017 FY2018 (Forecast) of of YOY Amount Sales Amount Sales () Net Sales 35331 1000 35500 1000 05 Pharmaceuticals 34279 970 ― ― ― Others 1051 30 ― ― ― Cost of sales 19535 553 ― ― ― SGampA expenses 13947 395 ― ― ― RampD expenses 2280 65 2700 76 184 Operating income 1848 0 52 1100 31 (405) Income before income taxes and minority interests 1777 80 ― ― ― Net income attributble to owners of the parent 1160 33 500 14 (569)
Capital Expenditure and Other (yenmn) Items FY2016 FY2017 Usage Amount Amount YOY () Forecast Rate () Capital expenditure 2928 1645 (438) 1650 997 Depreciation and amortization 1112 1192 72 1250 954 Revised forecast issued on October 31 2017
Cash Flow Statements (yenmn) FY2016 FY2017 Amount Amount Net cash Provided by operating activities 2737 3188 Used in investing activities (2504) (1606) Used in financing activities 787 (1741) Cash and cash equivalents 8084 7890 Free cash flow 232 1582
Per Share Information (yen) FY2016 FY2017 Amount Amount Change Forecast Earnings per share 53002 31528 (21474) 30673 Book value per share 454880 485986 31106 ― Dividend per share 10000 10000 ― 10000 Dividend payout ratio () 189 317 ― 326 Revised forecast issued on October 31 2017
Balance Sheet Data (yenmn) March 31 2017 August 31 2017 March 31 2015 Amount Amount Change Total assets 47002 46814 3358 (187) Return on assets () 63 36 -06 (27) Net assets 17355 17487 1313 132 Owned capital 17346 17474 1312 127 Capital-to-asset ratio () 369 373 02 +04 Return on equity () 123 67 (01) (56) Current assets 29009 28334 1630 (674) Current liabilities 14939 14914 (716) (25) Current ratio (x) 194 19 019 004
By Main Therapeutic Categories () FY2016 FY2017 Cardiovascular and respiratory drugs 309 320 Digestive organ drugs 196 183 Agents affecting metabolism 164 165 Drugs for nervous system sensory organs 99 91 Antibiotics and chemotherapeutic drugs 65 62 Antineoplastic agents 32 34 Others 135 145
Sales Distribution By Launch Year (yenmn) FY2016 FY2017 Fiscal Year Amount Distrib () Amount Distrib () YOY () 2010 and before 19487 1 667 19194 637 (15) 2009 2011 2348 0 80 2210 73 (59) 2012 1484 0 51 1404 47 (54) 2013 2917 0 100 3127 104 72 2014 1746 0 60 1937 64 110 2015 1001 0 34 1222 41 221 2016 219 0 08 459 15 1091 2017 ― ― ― 558 19 ― Total 29204 1 1000 30115 1000 31
Generics Proprietary Products (yenmn) FY2016 FY2017 Distrib Distrib YOY Achieved Amount () Amount () () Forecast () Total 31513 1 1000 32153 1 1000 20 32000 1005 Generics 29204 1 927 30115 1 937 31 30000 1 1004 To medical institutions 27808 29174 49 29100 1 1003 To other makers 1395 941 (326) 900 1 1046 Amlodipine 2865 2940 26 2900 1 1014 Lansoprazole 2279 2163 (51) 2100 1 1030 Donepezil 1642 1557 (52) 1600 1 973 Rabeprazole 1586 1558 (18) 1600 1 974 Limaprost Alfadex 1469 1427 (28) 1400 1 1020 Pravastatine 1173 1147 (22) 1100 1 1043 Voglibose 957 870 (91) 900 1 967 Others 17229 18449 71 18400 1 1003 Proprietary products 2308 0 73 2038 0 63 (117) 2000 1 1019 Uralyt 1409 1225 (131) 1200 1 1021 Soleton 679 598 (120) 600 1 997 Calvan 219 214 (21) 200 1 1074 Chemiphar ODM Generics (yenmn) FY2016 FY2017 Distrib Distrib YOY Achieved Amount () Amount () () Forecast () Total 30445 1000 31100 1000 22 31400 990 Generics 29204 959 30115 968 31 30000 1004 Generics (ODM) 1240 41 985 32 (206) 1400 704 Includes exports Revised forecast issued on October 31 2017
Income Statement Overview (yenmn) FY2016 FY2017 of of YOY Achieved Amount Sales Amount Sales () Forecast () Net Sales 35689 1 1000 35331 1 1000 (10) 35500 1 995 Pharmaceuticals 34551 1 968 34279 1 970 (08) ― ― ― Others 1137 0 32 1051 0 30 (76) ― ― ― Cost of sales 19449 1 545 19535 1 553 04 ― ― ― SGampA expenses 13403 0 376 13947 0 395 41 ― ― ― RampD expenses 1984 0 56 2280 0 65 150 2200 0 1037 Operating income 2836 0 79 1848 0 52 (348) 1800 0 1027 Income before income taxes and minority interests 2849 0 80 1696 0 48 (405) 1700 ― 998 Net income attributble to owners of the parent 2054 0 58 1160 0 33 (435) 1150 ― 1009 1961 00550933658 00550933658 00575628587 Revised forecast issued on October 31 2017
Per Share Information (yen) FY2017 FY2018 (Forecast) Amount Amount YOY () Earnings per share 31528 13584 (569) Book value per share 485986 ― ― Dividends per share 10000 7500 ― Dividend payout ratio() 317 552 ― Capital Expenditure and Other (yenmn) FY2017 FY2018 (Forecast) Amount Amount Change Capital expenditure 1645 950 (695) Depreciation and amortization 1192 1350 157 2015年3月期 ガツキ 2016年3月期(予想) ガツキ ヨソウ 金額 キンガク 金額 キンガク 増減額 ゾウゲンガク 増減率 ゾウゲン リツ 医療用医薬品 イリョウヨウ イヤクヒン 27400 30950 +05 ジェネリック医薬品(荷離) イヤクヒン ニ バナレ 25079 27430 +01 内自社販売 ウチ ジシャ ハンバイ 2321 25100 +01 内導出輸出 ウチ ドウシュツ ユシュツ 3011 2330 +04 アムロジピン 1935 3040 +09 ランソプラゾール 1509 1890 24 プラバスタチン 1595 1570 +40 ラベプラゾール 1704 1570 16 リマプロストアルファデクス 1273 1660 26 ボグリボース 1013 1300 +21 ドネペジル 15357 1030 +16 その他 タ 3400 15370 +01 主力品 シュリョク ヒン 1975 3520 +35 ウラリット 1134 1970 03 ソレトン 290 1250 +102 カルバン 0 300 +34 ジェネリック医薬品事業 イヤクヒン ジギョウ 2015年3月期 ガツキ 2016年3月期(予想) ガツキ ヨソウ 金額 キンガク 金額 キンガク 増減額 ゾウゲンガク 増減率 ゾウゲン リツ ジェネリック医薬品事業 イヤクヒン ジギョウ 28918 28840 +1003 ジェネリック医薬品(荷離) イヤクヒン ニ バナレ 27400 27430 +999 受託 ジュタク 1518 1410 +1077
Generics Proprietary Products (yenmn) FY2017 FY2018 (Forecast) Amount Amount YOY () Total 32153 31800 (11) Generics 30115 30150 01 To medical institutions 29174 29250 03 To other makers 941 900 (44) Amlodipine 2940 2900 (14) Lansoprazole 2163 1900 (122) Donepezil 1557 1350 (133) Rabeprazole 1558 1350 (134) Limaprost Alfadex 1427 1350 (55) Pravastatine 1147 1100 (41) Voglibose 870 750 (139) Others 18449 19450 54 Proprietary products 2038 1650 (190) Uralyt 1225 1070 (127) Soleton 598 400 (331) Calvan 214 180 (162) Chemiphar ODM Generics (yenmn) FY2017 FY2018 (Forecast) Amount Amount YOY () Total 31100 31350 08 Generics 30115 30150 01 Generics (ODM) 985 1200 218
Income Statement Overview (yenmn) FY2017 FY2018 (Forecast) of of YOY Amount Sales Amount Sales () Net Sales 35331 1000 35500 1000 05 Pharmaceuticals 34279 970 ― ― ― Others 1051 30 ― ― ― Cost of sales 19535 553 ― ― ― SGampA expenses 13947 395 ― ― ― RampD expenses 2280 65 2700 76 184 Operating income 1848 0 52 1100 31 (405) Income before income taxes and minority interests 1777 80 ― ― ― Net income attributble to owners of the parent 1160 33 500 14 (569)
Capital Expenditure and Other (yenmn) Items FY2016 FY2017 Usage Amount Amount YOY () Forecast Rate () Capital expenditure 2928 1645 (438) 1650 997 Depreciation and amortization 1112 1192 72 1250 954 Revised forecast issued on October 31 2017
Cash Flow Statements (yenmn) FY2016 FY2017 Amount Amount Net cash Provided by operating activities 2737 3188 Used in investing activities (2504) (1606) Provided by (Used in) financing activities 787 (1741) Cash and cash equivalents 8084 7890 Free cash flow 232 1582
Per Share Information (yen) FY2016 FY2017 Amount Amount Change Forecast Earnings per share 53002 31528 (21474) 30673 Book value per share 454880 485986 31106 ― Dividend per share 10000 10000 ― 10000 Dividend payout ratio () 189 317 ― 326 Revised forecast issued on October 31 2017
Balance Sheet Data (yenmn) March 31 2017 August 31 2017 March 31 2015 Amount Amount Change Total assets 47002 46814 3358 (187) Return on assets () 63 36 -06 (27) Net assets 17355 17487 1313 132 Owned capital 17346 17474 1312 127 Capital-to-asset ratio () 369 373 02 +04 Return on equity () 123 67 (01) (56) Current assets 29009 28334 1630 (674) Current liabilities 14939 14914 (716) (25) Current ratio (x) 194 19 019 004
By Main Therapeutic Categories () FY2016 FY2017 Cardiovascular and respiratory drugs 309 320 Digestive organ drugs 196 183 Agents affecting metabolism 164 165 Drugs for nervous system sensory organs 99 91 Antibiotics and chemotherapeutic drugs 65 62 Antineoplastic agents 32 34 Others 135 145
Sales Distribution By Launch Year (yenmn) FY2016 FY2017 Fiscal Year Amount Distrib () Amount Distrib () YOY () 2010 and before 19487 1 667 19194 637 (15) 2009 2011 2348 0 80 2210 73 (59) 2012 1484 0 51 1404 47 (54) 2013 2917 0 100 3127 104 72 2014 1746 0 60 1937 64 110 2015 1001 0 34 1222 41 221 2016 219 0 08 459 15 1091 2017 ― ― ― 558 19 ― Total 29204 1 1000 30115 1000 31
Generics Proprietary Products (yenmn) FY2016 FY2017 Distrib Distrib YOY Achieved Amount () Amount () () Forecast () Total 31513 1 1000 32153 1 1000 20 32000 1005 Generics 29204 1 927 30115 1 937 31 30000 1 1004 To medical institutions 27808 29174 49 29100 1 1003 To other makers 1395 941 (326) 900 1 1046 Amlodipine 2865 2940 26 2900 1 1014 Lansoprazole 2279 2163 (51) 2100 1 1030 Donepezil 1642 1557 (52) 1600 1 973 Rabeprazole 1586 1558 (18) 1600 1 974 Limaprost Alfadex 1469 1427 (28) 1400 1 1020 Pravastatine 1173 1147 (22) 1100 1 1043 Voglibose 957 870 (91) 900 1 967 Others 17229 18449 71 18400 1 1003 Proprietary products 2308 0 73 2038 0 63 (117) 2000 1 1019 Uralyt 1409 1225 (131) 1200 1 1021 Soleton 679 598 (120) 600 1 997 Calvan 219 214 (21) 200 1 1074 Chemiphar ODM Generics (yenmn) FY2016 FY2017 Distrib Distrib YOY Achieved Amount () Amount () () Forecast () Total 30445 1000 31100 1000 22 31400 990 Generics 29204 959 30115 968 31 30000 1004 Generics (ODM) 1240 41 985 32 (206) 1400 704 Includes exports Revised forecast issued on October 31 2017
Income Statement Overview (yenmn) FY2016 FY2017 of of YOY Achieved Amount Sales Amount Sales () Forecast () Net Sales 35689 1 1000 35331 1 1000 (10) 35500 1 995 Pharmaceuticals 34551 1 968 34279 1 970 (08) ― ― ― Others 1137 0 32 1051 0 30 (76) ― ― ― Cost of sales 19449 1 545 19535 1 553 04 ― ― ― SGampA expenses 13403 0 376 13947 0 395 41 ― ― ― RampD expenses 1984 0 56 2280 0 65 150 2200 0 1037 Operating income 2836 0 79 1848 0 52 (348) 1800 0 1027 Income before income taxes and minority interests 2849 0 80 1696 0 48 (405) 1700 ― 998 Net income attributble to owners of the parent 2054 0 58 1160 0 33 (435) 1150 ― 1009 1961 00550933658 00550933658 00575628587 Revised forecast issued on October 31 2017
Per Share Information (yen) FY2017 FY2018 (Forecast) Amount Amount YOY () Earnings per share 31528 13584 (569) Book value per share 485986 ― ― Dividends per share 10000 7500 ― Dividend payout ratio() 317 552 ― Capital Expenditure and Other (yenmn) FY2017 FY2018 (Forecast) Amount Amount Change Capital expenditure 1645 950 (695) Depreciation and amortization 1192 1350 157 2015年3月期 ガツキ 2016年3月期(予想) ガツキ ヨソウ 金額 キンガク 金額 キンガク 増減額 ゾウゲンガク 増減率 ゾウゲン リツ 医療用医薬品 イリョウヨウ イヤクヒン 27400 30950 +05 ジェネリック医薬品(荷離) イヤクヒン ニ バナレ 25079 27430 +01 内自社販売 ウチ ジシャ ハンバイ 2321 25100 +01 内導出輸出 ウチ ドウシュツ ユシュツ 3011 2330 +04 アムロジピン 1935 3040 +09 ランソプラゾール 1509 1890 24 プラバスタチン 1595 1570 +40 ラベプラゾール 1704 1570 16 リマプロストアルファデクス 1273 1660 26 ボグリボース 1013 1300 +21 ドネペジル 15357 1030 +16 その他 タ 3400 15370 +01 主力品 シュリョク ヒン 1975 3520 +35 ウラリット 1134 1970 03 ソレトン 290 1250 +102 カルバン 0 300 +34 ジェネリック医薬品事業 イヤクヒン ジギョウ 2015年3月期 ガツキ 2016年3月期(予想) ガツキ ヨソウ 金額 キンガク 金額 キンガク 増減額 ゾウゲンガク 増減率 ゾウゲン リツ ジェネリック医薬品事業 イヤクヒン ジギョウ 28918 28840 +1003 ジェネリック医薬品(荷離) イヤクヒン ニ バナレ 27400 27430 +999 受託 ジュタク 1518 1410 +1077
Generics Proprietary Products (yenmn) FY2017 FY2018 (Forecast) Amount Amount YOY () Total 32153 31800 (11) Generics 30115 30150 01 To medical institutions 29174 29250 03 To other makers 941 900 (44) Amlodipine 2940 2900 (14) Lansoprazole 2163 1900 (122) Donepezil 1557 1350 (133) Rabeprazole 1558 1350 (134) Limaprost Alfadex 1427 1350 (55) Pravastatine 1147 1100 (41) Voglibose 870 750 (139) Others 18449 19450 54 Proprietary products 2038 1650 (190) Uralyt 1225 1070 (127) Soleton 598 400 (331) Calvan 214 180 (162) Chemiphar ODM Generics (yenmn) FY2017 FY2018 (Forecast) Amount Amount YOY () Total 31100 31350 08 Generics 30115 30150 01 Generics (ODM) 985 1200 218
Income Statement Overview (yenmn) FY2017 FY2018 (Forecast) of of YOY Amount Sales Amount Sales () Net Sales 35331 1000 35500 1000 05 Pharmaceuticals 34279 970 ― ― ― Others 1051 30 ― ― ― Cost of sales 19535 553 ― ― ― SGampA expenses 13947 395 ― ― ― RampD expenses 2280 65 2700 76 184 Operating income 1848 0 52 1100 31 (405) Income before income taxes and minority interests 1777 80 ― ― ― Net income attributble to owners of the parent 1160 33 500 14 (569)
Capital Expenditure and Other (yenmn) Items FY2016 FY2017 Usage Amount Amount YOY () Forecast Rate () Capital expenditure 2928 1645 (438) 1650 997 Depreciation and amortization 1112 1192 72 1250 954 Revised forecast issued on October 31 2017
Cash Flow Statements (yenmn) FY2016 FY2017 Amount Amount Net cash Provided by operating activities 2737 3188 Used in investing activities (2504) (1606) Used in financing activities 787 (1741) Cash and cash equivalents 8084 7890 Free cash flow 232 1582
Per Share Information (yen) FY2016 FY2017 Amount Amount Change Forecast Earnings per share 53002 31528 (21474) 30673 Book value per share 454880 485986 31106 ― Dividend per share 10000 10000 ― 10000 Dividend payout ratio () 189 317 ― 326 Revised forecast issued on October 31 2017
Balance Sheet Data (yenmn) March 31 2017 March 31 2018 March 31 2015 Amount Amount Change Total assets 47002 46814 3358 (187) Return on assets () 63 36 -06 (27) Net assets 17355 17487 1313 132 Owned capital 17346 17474 1312 127 Capital-to-asset ratio () 369 373 02 04 Return on equity () 123 67 (01) (56) Current assets 29009 28334 1630 (674) Current liabilities 14939 14914 (716) (25) Current ratio (x) 194 19 019 (004)
By Main Therapeutic Categories () FY2016 FY2017 Cardiovascular and respiratory drugs 309 320 Digestive organ drugs 196 183 Agents affecting metabolism 164 165 Drugs for nervous system sensory organs 99 91 Antibiotics and chemotherapeutic drugs 65 62 Antineoplastic agents 32 34 Others 135 145
Sales Distribution By Launch Year (yenmn) FY2016 FY2017 Fiscal Year Amount Distrib () Amount Distrib () YOY () 2010 and before 19487 1 667 19194 637 (15) 2009 2011 2348 0 80 2210 73 (59) 2012 1484 0 51 1404 47 (54) 2013 2917 0 100 3127 104 72 2014 1746 0 60 1937 64 110 2015 1001 0 34 1222 41 221 2016 219 0 08 459 15 1091 2017 ― ― 558 19 ― Total 29204 1 1000 30115 1000 31
Generics Proprietary Products (yenmn) FY2016 FY2017 Distrib Distrib YOY Achieved Amount () Amount () () Forecast () Total 31513 1 1000 32153 1 1000 20 32000 1005 Generics 29204 1 927 30115 1 937 31 30000 1 1004 To medical institutions 27808 29174 49 29100 1 1003 To other makers 1395 941 (326) 900 1 1046 Amlodipine 2865 2940 26 2900 1 1014 Lansoprazole 2279 2163 (51) 2100 1 1030 Donepezil 1642 1557 (52) 1600 1 973 Rabeprazole 1586 1558 (18) 1600 1 974 Limaprost Alfadex 1469 1427 (28) 1400 1 1020 Pravastatine 1173 1147 (22) 1100 1 1043 Voglibose 957 870 (91) 900 1 967 Others 17229 18449 71 18400 1 1003 Proprietary products 2308 0 73 2038 0 63 (117) 2000 1 1019 Uralyt 1409 1225 (131) 1200 1 1021 Soleton 679 598 (120) 600 1 997 Calvan 219 214 (21) 200 1 1074 Chemiphar ODM Generics (yenmn) FY2016 FY2017 Distrib Distrib YOY Achieved Amount () Amount () () Forecast () Total 30445 1000 31100 1000 22 31400 990 Generics 29204 959 30115 968 31 30000 1004 Generics (ODM) 1240 41 985 32 (206) 1400 704 Includes exports Revised forecast issued on October 31 2017
Income Statement Overview (yenmn) FY2016 FY2017 of of YOY Achieved Amount Sales Amount Sales () Forecast () Net Sales 35689 1 1000 35331 1 1000 (10) 35500 1 995 Pharmaceuticals 34551 1 968 34279 1 970 (08) ― ― Others 1137 0 32 1051 0 30 (76) ― ― Cost of sales 19449 1 545 19535 1 553 04 ― ― SGampA expenses 13403 0 376 13947 0 395 41 ― ― RampD expenses 1984 0 56 2280 0 65 150 2200 0 1037 Operating income 2836 0 79 1848 0 52 (348) 1800 0 1027 Income before income taxes and minority interests 2849 0 80 1777 0 50 (376) ― ― Net income attributble to owners of the parent 2054 0 58 1160 0 33 (435) 1150 ― 1009 1961 00550933658 00550933658 00575628587 Revised forecast issued on October 31 2017
Per Share Information (yen) FY2017 FY2018 (Forecast) Amount Amount YOY () Earnings per share 31528 13584 (569) Book value per share 485986 ― ― Dividends per share 10000 7500 ― Dividend payout ratio() 317 552 ― Capital Expenditure and Other (yenmn) FY2017 FY2018 (Forecast) Amount Amount Change Capital expenditure 1645 950 (695) Depreciation and amortization 1192 1350 157 2015年3月期 ガツキ 2016年3月期(予想) ガツキ ヨソウ 金額 キンガク 金額 キンガク 増減額 ゾウゲンガク 増減率 ゾウゲン リツ 医療用医薬品 イリョウヨウ イヤクヒン 27400 30950 +05 ジェネリック医薬品(荷離) イヤクヒン ニ バナレ 25079 27430 +01 内自社販売 ウチ ジシャ ハンバイ 2321 25100 +01 内導出輸出 ウチ ドウシュツ ユシュツ 3011 2330 +04 アムロジピン 1935 3040 +09 ランソプラゾール 1509 1890 24 プラバスタチン 1595 1570 +40 ラベプラゾール 1704 1570 16 リマプロストアルファデクス 1273 1660 26 ボグリボース 1013 1300 +21 ドネペジル 15357 1030 +16 その他 タ 3400 15370 +01 主力品 シュリョク ヒン 1975 3520 +35 ウラリット 1134 1970 03 ソレトン 290 1250 +102 カルバン 0 300 +34 ジェネリック医薬品事業 イヤクヒン ジギョウ 2015年3月期 ガツキ 2016年3月期(予想) ガツキ ヨソウ 金額 キンガク 金額 キンガク 増減額 ゾウゲンガク 増減率 ゾウゲン リツ ジェネリック医薬品事業 イヤクヒン ジギョウ 28918 28840 +1003 ジェネリック医薬品(荷離) イヤクヒン ニ バナレ 27400 27430 +999 受託 ジュタク 1518 1410 +1077
Generics Proprietary Products (yenmn) FY2017 FY2018 (Forecast) Amount Amount YOY () Total 32153 31800 (11) Generics 30115 30150 01 To medical institutions 29174 29250 03 To other makers 941 900 (44) Amlodipine 2940 2900 (14) Lansoprazole 2163 1900 (122) Donepezil 1557 1350 (133) Rabeprazole 1558 1350 (134) Limaprost Alfadex 1427 1350 (55) Pravastatine 1147 1100 (41) Voglibose 870 750 (139) Others 18449 19450 54 Proprietary products 2038 1650 (190) Uralyt 1225 1070 (127) Soleton 598 400 (331) Calvan 214 180 (162) Chemiphar ODM Generics (yenmn) FY2017 FY2018 (Forecast) Amount Amount YOY () Total 31100 31350 08 Generics 30115 30150 01 Generics (ODM) 985 1200 218
Income Statement Overview (yenmn) FY2017 FY2018 (Forecast) of of YOY Amount Sales Amount Sales () Net Sales 35331 1000 35500 1000 05 Pharmaceuticals 34279 970 ― ― ― Others 1051 30 ― ― ― Cost of sales 19535 553 ― ― ― SGampA expenses 13947 395 ― ― ― RampD expenses 2280 65 2700 76 184 Operating income 1848 0 52 1100 31 (405) Income before income taxes and minority interests 1777 80 ― ― ― Net income attributble to owners of the parent 1160 33 500 14 (569)
Capital Expenditure and Other (yenmn) Items FY2016 FY2017 Usage Amount Amount YOY () Forecast Rate () Capital expenditure 2928 1645 (438) 1650 997 Depreciation and amortization 1112 1192 72 1250 954 Revised forecast issued on October 31 2017
Cash Flow Statements (yenmn) FY2016 FY2017 Amount Amount Net cash Provided by operating activities 2737 3188 Used in investing activities (2504) (1606) Used in financing activities 787 (1741) Cash and cash equivalents 8084 7890 Free cash flow 232 1582
Per Share Information (yen) FY2016 FY2017 Amount Amount Change Forecast Earnings per share 53002 31528 (21474) 30673 Book value per share 454880 485986 31106 ― Dividend per share 10000 10000 ― 10000 Dividend payout ratio () 189 317 ― 326 Revised forecast issued on October 31 2017
Balance Sheet Data (yenmn) March 31 2017 August 31 2017 March 31 2015 Amount Amount Change Total assets 47002 46814 3358 (187) Return on assets () 63 36 -06 (27) Net assets 17355 17487 1313 132 Owned capital 17346 17474 1312 127 Capital-to-asset ratio () 369 373 02 +04 Return on equity () 123 67 (01) (56) Current assets 29009 28334 1630 (674) Current liabilities 14939 14914 (716) (25) Current ratio (x) 194 19 019 004
By Main Therapeutic Categories () FY2016 FY2017 Cardiovascular and respiratory drugs 309 320 Digestive organ drugs 196 183 Agents affecting metabolism 164 165 Drugs for nervous system sensory organs 99 91 Antibiotics and chemotherapeutic drugs 65 62 Antineoplastic agents 32 34 Others 135 145
Sales Distribution By Launch Year (yenmn) FY2016 FY2017 Fiscal Year Amount Distrib () Amount Distrib () YOY () 2010 and before 19487 1 667 19194 637 (15) 2009 2011 2348 0 80 2210 73 (59) 2012 1484 0 51 1404 47 (54) 2013 2917 0 100 3127 104 72 2014 1746 0 60 1937 64 110 2015 1001 0 34 1222 41 221 2016 219 0 08 459 15 1091 2017 ― ― ― 558 19 ― Total 29204 1 1000 30115 1000 31
Generics Proprietary Products (yenmn) FY2016 FY2017 Distrib Distrib YOY Achieved Amount () Amount () () Forecast () Total 31513 1 1000 32153 1 1000 20 32000 1005 Generics 29204 1 927 30115 1 937 31 30000 1 1004 To medical institutions 27808 29174 49 29100 1 1003 To other makers 1395 941 (326) 900 1 1046 Amlodipine 2865 2940 26 2900 1 1014 Lansoprazole 2279 2163 (51) 2100 1 1030 Donepezil 1642 1557 (52) 1600 1 973 Rabeprazole 1586 1558 (18) 1600 1 974 Limaprost Alfadex 1469 1427 (28) 1400 1 1020 Pravastatine 1173 1147 (22) 1100 1 1043 Voglibose 957 870 (91) 900 1 967 Others 17229 18449 71 18400 1 1003 Proprietary products 2308 0 73 2038 0 63 (117) 2000 1 1019 Uralyt 1409 1225 (131) 1200 1 1021 Soleton 679 598 (120) 600 1 997 Calvan 219 214 (21) 200 1 1074 Chemiphar ODM Generics (yenmn) FY2016 FY2017 Distrib Distrib YOY Achieved Amount () Amount () () Forecast () Total 30445 1000 31100 1000 22 31400 990 Generics 29204 959 30115 968 31 30000 1004 Generics (ODM) 1240 41 985 32 (206) 1400 704 Includes exports Revised forecast issued on October 31 2017
Income Statement Overview (yenmn) FY2016 FY2017 of of YOY Achieved Amount Sales Amount Sales () Forecast () Net Sales 35689 1 1000 35331 1 1000 (10) 35500 1 995 Pharmaceuticals 34551 1 968 34279 1 970 (08) ― ― ― Others 1137 0 32 1051 0 30 (76) ― ― ― Cost of sales 19449 1 545 19535 1 553 04 ― ― ― SGampA expenses 13403 0 376 13947 0 395 41 ― ― ― RampD expenses 1984 0 56 2280 0 65 150 2200 0 1037 Operating income 2836 0 79 1848 0 52 (348) 1800 0 1027 Income before income taxes and minority interests 2849 0 80 1696 0 48 (405) 1700 ― 998 Net income attributble to owners of the parent 2054 0 58 1160 0 33 (435) 1150 ― 1009 1961 00550933658 00550933658 00575628587 Revised forecast issued on October 31 2017
Per Share Information (yen) FY2017 FY2018 (Forecast) Amount Amount YOY () Earnings per share 31528 13584 (569) Book value per share 485986 ― ― Dividends per share 10000 7500 ― Dividend payout ratio() 317 552 ― Capital Expenditure and Other (yenmn) FY2017 FY2018 (Forecast) Amount Amount Change Capital expenditure 1645 950 (695) Depreciation and amortization 1192 1350 157 2015年3月期 ガツキ 2016年3月期(予想) ガツキ ヨソウ 金額 キンガク 金額 キンガク 増減額 ゾウゲンガク 増減率 ゾウゲン リツ 医療用医薬品 イリョウヨウ イヤクヒン 27400 30950 +05 ジェネリック医薬品(荷離) イヤクヒン ニ バナレ 25079 27430 +01 内自社販売 ウチ ジシャ ハンバイ 2321 25100 +01 内導出輸出 ウチ ドウシュツ ユシュツ 3011 2330 +04 アムロジピン 1935 3040 +09 ランソプラゾール 1509 1890 24 プラバスタチン 1595 1570 +40 ラベプラゾール 1704 1570 16 リマプロストアルファデクス 1273 1660 26 ボグリボース 1013 1300 +21 ドネペジル 15357 1030 +16 その他 タ 3400 15370 +01 主力品 シュリョク ヒン 1975 3520 +35 ウラリット 1134 1970 03 ソレトン 290 1250 +102 カルバン 0 300 +34 ジェネリック医薬品事業 イヤクヒン ジギョウ 2015年3月期 ガツキ 2016年3月期(予想) ガツキ ヨソウ 金額 キンガク 金額 キンガク 増減額 ゾウゲンガク 増減率 ゾウゲン リツ ジェネリック医薬品事業 イヤクヒン ジギョウ 28918 28840 +1003 ジェネリック医薬品(荷離) イヤクヒン ニ バナレ 27400 27430 +999 受託 ジュタク 1518 1410 +1077
Generics Proprietary Products (yenmn) FY2017 FY2018 (Forecast) Amount Amount YOY () Total 32153 31800 (11) Generics 30115 30150 01 To medical institutions 29174 29250 03 To other makers 941 900 (44) Amlodipine 2940 2900 (14) Lansoprazole 2163 1900 (122) Donepezil 1557 1350 (133) Rabeprazole 1558 1350 (134) Limaprost Alfadex 1427 1350 (55) Pravastatine 1147 1100 (41) Voglibose 870 750 (139) Others 18449 19450 54 Proprietary products 2038 1650 (190) Uralyt 1225 1070 (127) Soleton 598 400 (331) Calvan 214 180 (162) Chemiphar ODM Generics (yenmn) FY2017 FY2018 (Forecast) Amount Amount YOY () Total 31100 31350 08 Generics 30115 30150 01 Generics (ODM) 985 1200 218
Income Statement Overview (yenmn) FY2017 FY2018 (Forecast) of of YOY Amount Sales Amount Sales () Net Sales 35331 1000 35500 1000 05 Pharmaceuticals 34279 970 ― ― ― Others 1051 30 ― ― ― Cost of sales 19535 553 ― ― ― SGampA expenses 13947 395 ― ― ― RampD expenses 2280 65 2700 76 184 Operating income 1848 0 52 1100 31 (405) Income before income taxes and minority interests 1777 80 ― ― ― Net income attributble to owners of the parent 1160 33 500 14 (569)
Capital Expenditure and Other (yenmn) Items FY2016 FY2017 Usage Amount Amount YOY () Forecast Rate () Capital expenditure 2928 1645 (438) 1650 997 Depreciation and amortization 1112 1192 72 1250 954 Revised forecast issued on October 31 2017
Cash Flow Statements (yenmn) FY2016 FY2017 Amount Amount Net cash Provided by operating activities 2737 3188 Used in investing activities (2504) (1606) Used in financing activities 787 (1741) Cash and cash equivalents 8084 7890 Free cash flow 232 1582
Per Share Information (yen) FY2016 FY2017 Amount Amount Change Forecast Earnings per share 53002 31528 (21474) 30673 Book value per share 454880 485986 31106 ― Dividend per share 10000 10000 ― 10000 Dividend payout ratio () 189 317 ― 326 Revised forecast issued on October 31 2017
Balance Sheet Data (yenmn) March 31 2017 August 31 2017 March 31 2015 Amount Amount Change Total assets 47002 46814 3358 (187) Return on assets () 63 36 -06 (27) Net assets 17355 17487 1313 132 Owned capital 17346 17474 1312 127 Capital-to-asset ratio () 369 373 02 +04 Return on equity () 123 67 (01) (56) Current assets 29009 28334 1630 (674) Current liabilities 14939 14914 (716) (25) Current ratio (x) 194 19 019 004
By Main Therapeutic Categories () FY2016 FY2017 Cardiovascular and respiratory drugs 309 320 Digestive organ drugs 196 183 Agents affecting metabolism 164 165 Drugs for nervous system sensory organs 99 91 Antibiotics and chemotherapeutic drugs 65 62 Antineoplastic agents 32 34 Others 135 145
Sales Distribution By Launch Year (yenmn) FY2016 FY2017 Fiscal Year Amount Distrib () Amount Distrib () YOY () 2010 and before 19487 1 667 19194 637 (15) 2009 2011 2348 0 80 2210 73 (59) 2012 1484 0 51 1404 47 (54) 2013 2917 0 100 3127 104 72 2014 1746 0 60 1937 64 110 2015 1001 0 34 1222 41 221 2016 219 0 08 459 15 1091 2017 ― ― 558 19 ― Total 29204 1 1000 30115 1000 31
Generics Proprietary Products (yenmn) FY2016 FY2017 Distrib Distrib YOY Achieved Amount () Amount () () Forecast () Total 31513 1 1000 32153 1 1000 20 32000 1005 Generics 29204 1 927 30115 1 937 31 30000 1 1004 To medical institutions 27808 29174 49 29100 1 1003 To other makers 1395 941 (326) 900 1 1046 Amlodipine 2865 2940 26 2900 1 1014 Lansoprazole 2279 2163 (51) 2100 1 1030 Donepezil 1642 1557 (52) 1600 1 973 Rabeprazole 1586 1558 (18) 1600 1 974 Limaprost Alfadex 1469 1427 (28) 1400 1 1020 Pravastatine 1173 1147 (22) 1100 1 1043 Voglibose 957 870 (91) 900 1 967 Others 17229 18449 71 18400 1 1003 Proprietary products 2308 0 73 2038 0 63 (117) 2000 1 1019 Uralyt 1409 1225 (131) 1200 1 1021 Soleton 679 598 (120) 600 1 997 Calvan 219 214 (21) 200 1 1074 Chemiphar ODM Generics (yenmn) FY2016 FY2017 Distrib Distrib YOY Achieved Amount () Amount () () Forecast () Total 30445 1000 31100 1000 22 31400 990 Generics 29204 959 30115 968 31 30000 1004 Generics (ODM) 1240 41 985 32 (206) 1400 704 Includes exports Revised forecast issued on October 31 2017
Income Statement Overview (yenmn) FY2016 FY2017 of of YOY Achieved Amount Sales Amount Sales () Forecast () Net Sales 35689 1 1000 35331 1 1000 (10) 35500 1 995 Pharmaceuticals 34551 1 968 34279 1 970 (08) ― ― Others 1137 0 32 1051 0 30 (76) ― ― Cost of sales 19449 1 545 19535 1 553 04 ― ― SGampA expenses 13403 0 376 13947 0 395 41 ― ― RampD expenses 1984 0 56 2280 0 65 150 2200 0 1037 Operating income 2836 0 79 1848 0 52 (348) 1800 0 1027 Income before income taxes and minority interests 2849 0 80 1696 0 48 (405) 1700 ― 998 Net income attributble to owners of the parent 2054 0 58 1160 0 33 (435) 1150 ― 1009 1961 00550933658 00550933658 00575628587 Revised forecast issued on October 31 2017
Per Share Information (yen) FY2017 FY2018 (Forecast) Amount Amount YOY () Earnings per share 31528 13584 (569) Book value per share 485986 ― ― Dividends per share 10000 7500 ― Dividend payout ratio() 317 552 ― Capital Expenditure and Other (yenmn) FY2017 FY2018 (Forecast) Amount Amount Change Capital expenditure 1645 950 (695) Depreciation and amortization 1192 1350 157 2015年3月期 ガツキ 2016年3月期(予想) ガツキ ヨソウ 金額 キンガク 金額 キンガク 増減額 ゾウゲンガク 増減率 ゾウゲン リツ 医療用医薬品 イリョウヨウ イヤクヒン 27400 30950 +05 ジェネリック医薬品(荷離) イヤクヒン ニ バナレ 25079 27430 +01 内自社販売 ウチ ジシャ ハンバイ 2321 25100 +01 内導出輸出 ウチ ドウシュツ ユシュツ 3011 2330 +04 アムロジピン 1935 3040 +09 ランソプラゾール 1509 1890 24 プラバスタチン 1595 1570 +40 ラベプラゾール 1704 1570 16 リマプロストアルファデクス 1273 1660 26 ボグリボース 1013 1300 +21 ドネペジル 15357 1030 +16 その他 タ 3400 15370 +01 主力品 シュリョク ヒン 1975 3520 +35 ウラリット 1134 1970 03 ソレトン 290 1250 +102 カルバン 0 300 +34 ジェネリック医薬品事業 イヤクヒン ジギョウ 2015年3月期 ガツキ 2016年3月期(予想) ガツキ ヨソウ 金額 キンガク 金額 キンガク 増減額 ゾウゲンガク 増減率 ゾウゲン リツ ジェネリック医薬品事業 イヤクヒン ジギョウ 28918 28840 +1003 ジェネリック医薬品(荷離) イヤクヒン ニ バナレ 27400 27430 +999 受託 ジュタク 1518 1410 +1077
Generics Proprietary Products (yenmn) FY2017 FY2018 (Forecast) Amount Amount YOY () Total 32153 31800 (11) Generics 30115 30150 01 To medical institutions 29174 29250 03 To other makers 941 900 (44) Amlodipine 2940 2900 (14) Lansoprazole 2163 1900 (122) Donepezil 1557 1350 (133) Rabeprazole 1558 1350 (134) Limaprost Alfadex 1427 1350 (55) Pravastatine 1147 1100 (41) Voglibose 870 750 (139) Others 18449 19450 54 Proprietary products 2038 1650 (190) Uralyt 1225 1070 (127) Soleton 598 400 (331) Calvan 214 180 (162) Chemiphar ODM Generics (yenmn) FY2017 FY2018 (Forecast) Amount Amount YOY () Total 31100 31350 08 Generics 30115 30150 01 Generics (ODM) 985 1200 218
Income Statement Overview (yenmn) FY2017 FY2018 (Forecast) of of YOY Amount Sales Amount Sales () Net Sales 35331 1000 35500 1000 05 Pharmaceuticals 34279 970 ― ― ― Others 1051 30 ― ― ― Cost of sales 19535 553 ― ― ― SGampA expenses 13947 395 ― ― ― RampD expenses 2280 65 2700 76 184 Operating income 1848 0 52 1100 31 (405) Income before income taxes and minority interests 1777 80 ― ― ― Net income attributble to owners of the parent 1160 33 500 14 (569)
Capital Expenditure and Other (yenmn) Items FY2016 FY2017 Usage Amount Amount YOY () Forecast Rate () Capital expenditure 2928 1645 (438) 1650 997 Depreciation and amortization 1112 1192 72 1250 954 Revised forecast issued on October 31 2017
Cash Flow Statements (yenmn) FY2016 FY2017 Amount Amount Net cash Provided by operating activities 2737 3188 Used in investing activities (2504) (1606) Used in financing activities 787 (1741) Cash and cash equivalents 8084 7890 Free cash flow 232 1582
Per Share Information (yen) FY2016 FY2017 Amount Amount Change Forecast Earnings per share 53002 31528 (21474) 30673 Book value per share 454880 485986 31106 ― Dividend per share 10000 10000 ― 10000 Dividend payout ratio () 189 317 ― 326 Revised forecast issued on October 31 2017
Balance Sheet Data (yenmn) March 31 2017 August 31 2017 March 31 2015 Amount Amount Change Total assets 47002 46814 3358 (187) Return on assets () 63 36 -06 (27) Net assets 17355 17487 1313 132 Owned capital 17346 17474 1312 127 Capital-to-asset ratio () 369 373 02 +04 Return on equity () 123 67 (01) (56) Current assets 29009 28334 1630 (674) Current liabilities 14939 14914 (716) (25) Current ratio (x) 194 19 019 004
By Main Therapeutic Categories () FY2016 FY2017 Cardiovascular and respiratory drugs 309 320 Digestive organ drugs 196 183 Agents affecting metabolism 164 165 Drugs for nervous system sensory organs 99 91 Antibiotics and chemotherapeutic drugs 65 62 Antineoplastic agents 32 34 Others 135 145
Sales Distribution By Launch Year (yenmn) FY2016 FY2017 Fiscal Year Amount Distrib () Amount Distrib () YOY () 2010 and before 19487 1 667 19194 637 (15) 2009 2011 2348 0 80 2210 73 (59) 2012 1484 0 51 1404 47 (54) 2013 2917 0 100 3127 104 72 2014 1746 0 60 1937 64 110 2015 1001 0 34 1222 41 221 2016 219 0 08 459 15 1091 2017 ― ― ― 558 19 ― Total 29204 1 1000 30115 1000 31
Generics Proprietary Products (yenmn) FY2016 FY2017 Distrib Distrib YOY Achieved Amount () Amount () () Forecast () Total 31513 1 1000 32153 1 1000 20 32000 1005 Generics 29204 1 927 30115 1 937 31 30000 1 1004 To medical institutions 27808 29174 49 29100 1 1003 To other makers 1395 941 (326) 900 1 1046 Amlodipine 2865 2940 26 2900 1 1014 Lansoprazole 2279 2163 (51) 2100 1 1030 Donepezil 1642 1557 (52) 1600 1 973 Rabeprazole 1586 1558 (18) 1600 1 974 Limaprost Alfadex 1469 1427 (28) 1400 1 1020 Pravastatine 1173 1147 (22) 1100 1 1043 Voglibose 957 870 (91) 900 1 967 Others 17229 18449 71 18400 1 1003 Proprietary products 2308 0 73 2038 0 63 (117) 2000 1 1019 Uralyt 1409 1225 (131) 1200 1 1021 Soleton 679 598 (120) 600 1 997 Calvan 219 214 (21) 200 1 1074 Chemiphar ODM Generics (yenmn) FY2016 FY2017 Distrib Distrib YOY Achieved Amount () Amount () () Forecast () Total 30445 1000 31100 1000 22 31400 990 Generics 29204 959 30115 968 31 30000 1004 Generics (ODM) 1240 41 985 32 (206) 1400 704 Includes exports Revised forecast issued on October 31 2017
Income Statement Overview (yenmn) FY2016 FY2017 of of YOY Achieved Amount Sales Amount Sales () Forecast () Net Sales 35689 1 1000 35331 1 1000 (10) 35500 1 995 Pharmaceuticals 34551 1 968 34279 1 970 (08) ― ― ― Others 1137 0 32 1051 0 30 (76) ― ― ― Cost of sales 19449 1 545 19535 1 553 04 ― ― ― SGampA expenses 13403 0 376 13947 0 395 41 ― ― ― RampD expenses 1984 0 56 2280 0 65 150 2200 0 1037 Operating income 2836 0 79 1848 0 52 (348) 1800 0 1027 Income before income taxes and minority interests 2849 0 80 1696 0 48 (405) 1700 ― 998 Net income attributble to owners of the parent 2054 0 58 1160 0 33 (435) 1150 ― 1009 1961 00550933658 00550933658 00575628587 Revised forecast issued on October 31 2017
Per Share Information (yen) FY2017 FY2018 (Forecast) Amount Amount YOY () Earnings per share 31528 13584 (569) Book value per share 485986 ― ― Dividends per share 10000 7500 ― Dividend payout ratio() 317 552 ― Capital Expenditure and Other (yenmn) FY2017 FY2018 (Forecast) Amount Amount Change Capital expenditure 1645 950 (695) Depreciation and amortization 1192 1350 157 2015年3月期 ガツキ 2016年3月期(予想) ガツキ ヨソウ 金額 キンガク 金額 キンガク 増減額 ゾウゲンガク 増減率 ゾウゲン リツ 医療用医薬品 イリョウヨウ イヤクヒン 27400 30950 +05 ジェネリック医薬品(荷離) イヤクヒン ニ バナレ 25079 27430 +01 内自社販売 ウチ ジシャ ハンバイ 2321 25100 +01 内導出輸出 ウチ ドウシュツ ユシュツ 3011 2330 +04 アムロジピン 1935 3040 +09 ランソプラゾール 1509 1890 24 プラバスタチン 1595 1570 +40 ラベプラゾール 1704 1570 16 リマプロストアルファデクス 1273 1660 26 ボグリボース 1013 1300 +21 ドネペジル 15357 1030 +16 その他 タ 3400 15370 +01 主力品 シュリョク ヒン 1975 3520 +35 ウラリット 1134 1970 03 ソレトン 290 1250 +102 カルバン 0 300 +34 ジェネリック医薬品事業 イヤクヒン ジギョウ 2015年3月期 ガツキ 2016年3月期(予想) ガツキ ヨソウ 金額 キンガク 金額 キンガク 増減額 ゾウゲンガク 増減率 ゾウゲン リツ ジェネリック医薬品事業 イヤクヒン ジギョウ 28918 28840 +1003 ジェネリック医薬品(荷離) イヤクヒン ニ バナレ 27400 27430 +999 受託 ジュタク 1518 1410 +1077
Generics Proprietary Products (yenmn) FY2017 FY2018 (Forecast) Amount Amount YOY () Total 32153 31800 (11) Generics 30115 30150 01 To medical institutions 29174 29250 03 To other makers 941 900 (44) Amlodipine 2940 2900 (14) Lansoprazole 2163 1900 (122) Donepezil 1557 1350 (133) Rabeprazole 1558 1350 (134) Limaprost Alfadex 1427 1350 (55) Pravastatine 1147 1100 (41) Voglibose 870 750 (139) Others 18449 19450 54 Proprietary products 2038 1650 (190) Uralyt 1225 1070 (127) Soleton 598 400 (331) Calvan 214 180 (162) Chemiphar ODM Generics (yenmn) FY2017 FY2018 (Forecast) Amount Amount YOY () Total 31100 31350 08 Generics 30115 30150 01 Generics (ODM) 985 1200 218
Income Statement Overview (yenmn) FY2017 FY2018 (Forecast) of of YOY Amount Sales Amount Sales () Net Sales 35331 1000 35500 1000 05 Pharmaceuticals 34279 970 ― ― ― Others 1051 30 ― ― ― Cost of sales 19535 553 ― ― ― SGampA expenses 13947 395 ― ― ― RampD expenses 2280 65 2700 76 184 Operating income 1848 0 52 1100 31 (405) Income before income taxes and minority interests 1777 80 ― ― ― Net income attributble to owners of the parent 1160 33 500 14 (569)
Capital Expenditure and Other (yenmn) Items FY2016 FY2017 Usage Amount Amount YOY () Forecast Rate () Capital expenditure 2928 1645 (438) 1650 997 Depreciation and amortization 1112 1192 72 1250 954 Revised forecast issued on October 31 2017
Cash Flow Statements (yenmn) FY2016 FY2017 Amount Amount Net cash Provided by operating activities 2737 3188 Used in investing activities (2504) (1606) Used in financing activities 787 (1741) Cash and cash equivalents 8084 7890 Free cash flow 232 1582
Per Share Information (yen) FY2016 FY2017 Amount Amount Change Forecast Earnings per share 53002 31528 (21474) 30673 Book value per share 454880 485986 31106 ― Dividend per share 10000 10000 ― 10000 Dividend payout ratio () 189 317 ― 326 Revised forecast issued on October 31 2017
Balance Sheet Data (yenmn) March 31 2017 August 31 2017 March 31 2015 Amount Amount Change Total assets 47002 46814 3358 (187) Return on assets () 63 36 -06 (27) Net assets 17355 17487 1313 132 Owned capital 17346 17474 1312 127 Capital-to-asset ratio () 369 373 02 +04 Return on equity () 123 67 (01) (56) Current assets 29009 28334 1630 (674) Current liabilities 14939 14914 (716) (25) Current ratio (x) 194 19 019 004
By Main Therapeutic Categories () FY2016 FY2017 Cardiovascular and respiratory drugs 309 320 Digestive organ drugs 196 183 Agents affecting metabolism 164 165 Drugs for nervous system sensory organs 99 91 Antibiotics and chemotherapeutic drugs 65 62 Antineoplastic agents 32 34 Others 135 145
Sales Distribution By Launch Year (yenmn) FY2016 FY2017 Fiscal Year Amount Distrib () Amount Distrib () YOY () 2010 and before 19487 1 667 19194 637 (15) 2009 2011 2348 0 80 2210 73 (59) 2012 1484 0 51 1404 47 (54) 2013 2917 0 100 3127 104 72 2014 1746 0 60 1937 64 110 2015 1001 0 34 1222 41 221 2016 219 0 08 459 15 1091 2017 ― ― ― 558 19 ― Total 29204 1 1000 30115 1000 31
Generics Proprietary Products (yenmn) FY2016 FY2017 Distrib Distrib YOY Achieved Amount () Amount () () Forecast () Total 31513 1 1000 32153 1 1000 20 32000 1005 Generics 29204 1 927 30115 1 937 31 30000 1 1004 To medical institutions 27808 29174 49 29100 1 1003 To other makers 1395 941 (326) 900 1 1046 Amlodipine 2865 2940 26 2900 1 1014 Lansoprazole 2279 2163 (51) 2100 1 1030 Donepezil 1642 1557 (52) 1600 1 973 Rabeprazole 1586 1558 (18) 1600 1 974 Limaprost Alfadex 1469 1427 (28) 1400 1 1020 Pravastatine 1173 1147 (22) 1100 1 1043 Voglibose 957 870 (91) 900 1 967 Others 17229 18449 71 18400 1 1003 Proprietary products 2308 0 73 2038 0 63 (117) 2000 1 1019 Uralyt 1409 1225 (131) 1200 1 1021 Soleton 679 598 (120) 600 1 997 Calvan 219 214 (21) 200 1 1074 Chemiphar ODM Generics (yenmn) FY2016 FY2017 Distrib Distrib YOY Achieved Amount () Amount () () Forecast () Total 30445 1000 31100 1000 22 31400 990 Generics 29204 959 30115 968 31 30000 1004 Generics (ODM) 1240 41 985 32 (206) 1400 704 Includes exports Revised forecast issued on October 31 2017
Income Statement Overview (yenmn) FY2016 FY2017 of of YOY Achieved Amount Sales Amount Sales () Forecast () Net Sales 35689 1 1000 35331 1 1000 (10) 35500 1 995 Pharmaceuticals 34551 1 968 34279 1 970 (08) ― ― ― Others 1137 0 32 1051 0 30 (76) ― ― ― Cost of sales 19449 1 545 19535 1 553 04 ― ― ― SGampA expenses 13403 0 376 13947 0 395 41 ― ― ― RampD expenses 1984 0 56 2280 0 65 150 2200 0 1037 Operating income 2836 0 79 1848 0 52 (348) 1800 0 1027 Income before income taxes and minority interests 2849 0 80 1696 0 48 (405) 1700 ― 998 Net income attributble to owners of the parent 2054 0 58 1160 0 33 (435) 1150 ― 1009 1961 00550933658 00550933658 00575628587 Revised forecast issued on October 31 2017
Per Share Information (yen) FY2017 FY2018 (Forecast) Amount Amount YOY () Earnings per share 31528 13584 (569) Book value per share 485986 ― ― Dividends per share 10000 7500 ― Dividend payout ratio() 317 552 ― Capital Expenditure and Other (yenmn) FY2017 FY2018 (Forecast) Amount Amount Change Capital expenditure 1645 950 (695) Depreciation and amortization 1192 1350 157 2015年3月期 ガツキ 2016年3月期(予想) ガツキ ヨソウ 金額 キンガク 金額 キンガク 増減額 ゾウゲンガク 増減率 ゾウゲン リツ 医療用医薬品 イリョウヨウ イヤクヒン 27400 30950 +05 ジェネリック医薬品(荷離) イヤクヒン ニ バナレ 25079 27430 +01 内自社販売 ウチ ジシャ ハンバイ 2321 25100 +01 内導出輸出 ウチ ドウシュツ ユシュツ 3011 2330 +04 アムロジピン 1935 3040 +09 ランソプラゾール 1509 1890 24 プラバスタチン 1595 1570 +40 ラベプラゾール 1704 1570 16 リマプロストアルファデクス 1273 1660 26 ボグリボース 1013 1300 +21 ドネペジル 15357 1030 +16 その他 タ 3400 15370 +01 主力品 シュリョク ヒン 1975 3520 +35 ウラリット 1134 1970 03 ソレトン 290 1250 +102 カルバン 0 300 +34 ジェネリック医薬品事業 イヤクヒン ジギョウ 2015年3月期 ガツキ 2016年3月期(予想) ガツキ ヨソウ 金額 キンガク 金額 キンガク 増減額 ゾウゲンガク 増減率 ゾウゲン リツ ジェネリック医薬品事業 イヤクヒン ジギョウ 28918 28840 +1003 ジェネリック医薬品(荷離) イヤクヒン ニ バナレ 27400 27430 +999 受託 ジュタク 1518 1410 +1077
Generics Proprietary Products (yenmn) FY2017 FY2018 (Forecast) Amount Amount YOY () Total 32153 31800 (11) Generics 30115 30150 01 To medical institutions 29174 29250 03 To other makers 941 900 (44) Amlodipine 2940 2900 (14) Lansoprazole 2163 1900 (122) Donepezil 1557 1350 (133) Rabeprazole 1558 1350 (134) Limaprost Alfadex 1427 1350 (55) Pravastatine 1147 1100 (41) Voglibose 870 750 (139) Others 18449 19450 54 Proprietary products 2038 1650 (190) Uralyt 1225 1070 (127) Soleton 598 400 (331) Calvan 214 180 (162) Chemiphar ODM Generics (yenmn) FY2017 FY2018 (Forecast) Amount Amount YOY () Total 31100 31350 08 Generics 30115 30150 01 Generics (ODM) 985 1200 218
Income Statement Overview (yenmn) FY2017 FY2018 (Forecast) of of YOY Amount Sales Amount Sales () Net Sales 35331 1000 35500 1000 05 Pharmaceuticals 34279 970 ― ― ― Others 1051 30 ― ― ― Cost of sales 19535 553 ― ― ― SGampA expenses 13947 395 ― ― ― RampD expenses 2280 65 2700 76 184 Operating income 1848 0 52 1100 31 (405) Income before income taxes and minority interests 1777 80 ― ― ― Net income attributble to owners of the parent 1160 33 500 14 (569)
Capital Expenditure and Other (yenmn) Items FY2016 FY2017 Usage Amount Amount YOY () Forecast Rate () Capital expenditure 2928 1645 (438) 1650 997 Depreciation and amortization 1112 1192 72 1250 954 Revised forecast issued on October 31 2017
Cash Flow Statements (yenmn) FY2016 FY2017 Amount Amount Net cash Provided by operating activities 2737 3188 Used in investing activities (2504) (1606) Used in financing activities 787 (1741) Cash and cash equivalents 8084 7890 Free cash flow 232 1582
Per Share Information (yen) FY2016 FY2017 Amount Amount Change Forecast Earnings per share 53002 31528 (21474) 30673 Book value per share 454880 485986 31106 ― Dividend per share 10000 10000 ― 10000 Dividend payout ratio () 189 317 ― 326 Revised forecast issued on October 31 2017
Balance Sheet Data (yenmn) March 31 2017 August 31 2017 March 31 2015 Amount Amount Change Total assets 47002 46814 3358 (187) Return on assets () 63 36 -06 (27) Net assets 17355 17487 1313 132 Owned capital 17346 17474 1312 127 Capital-to-asset ratio () 369 373 02 +04 Return on equity () 123 67 (01) (56) Current assets 29009 28334 1630 (674) Current liabilities 14939 14914 (716) (25) Current ratio (x) 194 19 019 004
By Main Therapeutic Categories () FY2016 FY2017 Cardiovascular and respiratory drugs 309 320 Digestive organ drugs 196 183 Agents affecting metabolism 164 165 Drugs for nervous system sensory organs 99 91 Antibiotics and chemotherapeutic drugs 65 62 Antineoplastic agents 32 34 Others 135 145
Sales Distribution By Launch Year (yenmn) FY2016 FY2017 Fiscal Year Amount Distrib () Amount Distrib () YOY () 2010 and before 19487 1 667 19194 637 (15) 2009 2011 2348 0 80 2210 73 (59) 2012 1484 0 51 1404 47 (54) 2013 2917 0 100 3127 104 72 2014 1746 0 60 1937 64 110 2015 1001 0 34 1222 41 221 2016 219 0 08 459 15 1091 2017 ― ― 558 19 ― Total 29204 1 1000 30115 1000 31
Generics Proprietary Products (yenmn) FY2016 FY2017 Distrib Distrib YOY Achieved Amount () Amount () () Forecast () Total 31513 1 1000 32153 1 1000 20 32000 1005 Generics 29204 1 927 30115 1 937 31 30000 1 1004 To medical institutions 27808 29174 49 29100 1 1003 To other makers 1395 941 (326) 900 1 1046 Amlodipine 2865 2940 26 2900 1 1014 Lansoprazole 2279 2163 (51) 2100 1 1030 Donepezil 1642 1557 (52) 1600 1 973 Rabeprazole 1586 1558 (18) 1600 1 974 Limaprost Alfadex 1469 1427 (28) 1400 1 1020 Pravastatine 1173 1147 (22) 1100 1 1043 Voglibose 957 870 (91) 900 1 967 Others 17229 18449 71 18400 1 1003 Proprietary products 2308 0 73 2038 0 63 (117) 2000 1 1019 Uralyt 1409 1225 (131) 1200 1 1021 Soleton 679 598 (120) 600 1 997 Calvan 219 214 (21) 200 1 1074 Chemiphar ODM Generics (yenmn) FY2016 FY2017 Distrib Distrib YOY Achieved Amount () Amount () () Forecast () Total 30445 1000 31100 1000 22 31400 990 Generics 29204 959 30115 968 31 30000 1004 Generics (ODM) 1240 41 985 32 (206) 1400 704 Includes exports Revised forecast issued on October 31 2017
Income Statement Overview (yenmn) FY2016 FY2017 of of YOY Achieved Amount Sales Amount Sales () Forecast () Net Sales 35689 1 1000 35331 1 1000 (10) 35500 1 995 Pharmaceuticals 34551 1 968 34279 1 970 (08) ― ― Others 1137 0 32 1051 0 30 (76) ― ― Cost of sales 19449 1 545 19535 1 553 04 ― ― SGampA expenses 13403 0 376 13947 0 395 41 ― ― RampD expenses 1984 0 56 2280 0 65 150 2200 0 1037 Operating income 2836 0 79 1848 0 52 (348) 1800 0 1027 Income before income taxes and minority interests 2849 0 80 1777 0 50 (376) ― ― Net income attributble to owners of the parent 2054 0 58 1160 0 33 (435) 1150 ― 1009 1961 00550933658 00550933658 00575628587 Revised forecast issued on October 31 2017
Page 3
2
I FY2017 Business Results
Sales Income
3
(yenmn)
of of YOY AchievedAmount Sales Amount Sales () Forecast ()
Net Sales 35689 1000 35331 1000 (10) 35500 995 Pharmaceuticals 34551 968 34279 970 (08) ― ― Others 1137 32 1051 30 (76) ― ―Cost of sales 19449 545 19535 553 04 ― ―SGampA expenses 13403 376 13947 395 41 ― ― RampD expenses 1984 56 2280 65 150 2200 1037Operating income 2836 79 1848 52 (348) 1800 1027
2849 80 1777 50 (376) ― ―
2054 58 1160 33 (435) 1150― 1009 Revised forecast issued on October 31 2017
Net income attributble to owners of the parent
FY2016 FY2017
Income before income taxes and minority interests
SalesFor generic drugs the overall speed of replacement has slowed as substitution rates centered on products with large markets neared government targets In addition due to the rise of authorized generics and increasingly fierce price competition profits in this market are being squeezed For Nippon Chemiphar sales to other makers did not grow as expected because orders from our existing business partners were not as large as anticipated On the other hand sales to medical institutions increased 49 YOY due to newly launched products and the expansion of sales channels mainly by our subsidiary As a result our generic sales increased 31 YOY
Although sales of proprietary products declined 117 the results were in line with our forecasts which included factors such as the impact of substitutions for generic drugs
For the above reasons our sales of ethical pharmaceuticals were yen32153 million (up 20 YOY) and total sales of pharmaceutical products including businesses such as diagnostics were yen34279 million (down 08 YOY)
As a result consolidated sales including other segments were yen 35331 million (down 10 YOY)
Operating incomeDuring FY2017 the cost of sales ratio rose 08 percentage points YOY due to factors including adjusted production volumes of products manufactured within the Nippon Chemiphar Group In addition SGampA expenses ratio rose 19 percentage points YOY to 395 This was due mainly to an increase in upfront strategic expenses such as trial costs ahead of the commencement of commercial production at the Vietnam factory (scheduled for the second half of FY 2018) as well as increased research and development expenses for new and generic drugs As a result operating income was yen1848 million (down 348 YOY)
PL 医薬品① 医薬品② 医薬品③ BS① BS③ 和文にある「前年同期間比」「前期3月末比」は記載が難しく英語版では必要度の低い情報であるとみなして記載をしないこととなった2016年2Q~(木村)ただし期末では記載が可能なので書きます(須田)
CF CAP EX 業績予想① 英語版では経常利益は書かないので注意(須田)
業績予想 ② 業績予想③ Pharmaceutical Sales
4
Generics Proprietary Products (yenmn)
Distrib Distrib YOY AchievedAmount () Amount () () Forecast ()
Total 31513 1000 32153 1000 20 32000 1005 Generics 29204 927 30115 937 31 30000 1004 To medical institutions 27808 29174 49 29100 1003 To other makers 1395 941 (326) 900 1046 Amlodipine 2865 2940 26 2900 1014 Lansoprazole 2279 2163 (51) 2100 1030 Donepezil 1642 1557 (52) 1600 973 Rabeprazole 1586 1558 (18) 1600 974 Limaprost Alfadex 1469 1427 (28) 1400 1020 Pravastatine 1173 1147 (22) 1100 1043 Voglibose 957 870 (91) 900 967 Others 17229 18449 71 18400 1003 Proprietary products 2308 73 2038 63 (117) 2000 1019 Uralyt 1409 1225 (131) 1200 1021 Soleton 679 598 (120) 600 997 Calvan 219 214 (21) 200 1074
Chemiphar ODM Generics (yenmn)
Distrib Distrib YOY AchievedAmount () Amount () () Forecast ()
Total 30445 1000 31100 1000 22 31400 990 Generics 29204 959 30115 968 31 30000 1004 Generics (ODM) 1240 41 985 32 (206) 1400 704 Includes exports Revised forecast issued on October 31 2017
FY2017
FY2016
FY2016
FY2017
PL 医薬品① 医薬品② 医薬品③ BS① BS③ 和文にある「前年同期間比」「前期3月末比」は記載が難しく英語版では必要度の低い情報であるとみなして記載をしないこととなった2016年2Q~(木村)ただし期末では記載が可能なので書きます(須田)
CF CAP EX 業績予想① 英語版では経常利益は書かないので注意(須田)
業績予想 ② 業績予想③ Sales Distribution
5
By Main Therapeutic Categories ()FY2016 FY2017
Cardiovascular and respiratory drugs 309 320Digestive organ drugs 196 183Agents affecting metabolism 164 165Drugs for nervous system sensory organs 99 91Antibiotics and chemotherapeutic drugs 65 62Antineoplastic agents 32 34Others 135 145
By Launch Year (yenmn)
Fiscal Year AmountDistrib
() AmountDistrib
() YOY ()2010 and before 19487 667 19194 637 (15)2011 2348 80 2210 73 (59)2012 1484 51 1404 47 (54)2013 2917 100 3127 104 722014 1746 60 1937 64 1102015 1001 34 1222 41 2212016 219 08 459 15 10912017 ― ― 558 19 ―Total 29204 1000 30115 1000 31
FY2016 FY2017
PL 医薬品① 医薬品② 医薬品③ BS① BS③ 和文にある「前年同期間比」「前期3月末比」は記載が難しく英語版では必要度の低い情報であるとみなして記載をしないこととなった2016年2Q~(木村)ただし期末では記載が可能なので書きます(須田)
CF CAP EX 業績予想① 英語版では経常利益は書かないので注意(須田)
業績予想 ② 業績予想③ PL 医薬品① 医薬品② 医薬品③ BS① BS③ 和文にある「前年同期間比」「前期3月末比」は記載が難しく英語版では必要度の低い情報であるとみなして記載をしないこととなった2016年2Q~(木村)ただし期末では記載が可能なので書きます(須田)
CF CAP EX 業績予想① 英語版では経常利益は書かないので注意(須田)
業績予想 ② 業績予想③ Balance Sheet per Share Information
6
Per Share Information (yen)FY2016Amount Amount Change Forecast
Earnings per share 53002 31528 (21474) 30673Book value per share 454880 485986 31106 ―Dividend per share 10000 10000 ― 10000Dividend payout ratio () 189 317 ― 326 Revised forecast issued on October 31 2017
FY2017
Balance Sheet Data (yenmn)March 31 2017
Amount Amount ChangeTotal assets 47002 46814 (187) Return on assets () 63 36 (27)Net assets 17355 17487 132 Owned capital 17346 17474 127 Capital-to-asset ratio () 369 373 04 Return on equity () 123 67 (56)Current assets 29009 28334 (674)Current liabilities 14939 14914 (25) Current ratio (x) 194 19 (004)
March 31 2018
PL 医薬品① 医薬品② 医薬品③ BS① BS③ 和文にある「前年同期間比」「前期3月末比」は記載が難しく英語版では必要度の低い情報であるとみなして記載をしないこととなった2016年2Q~(木村)ただし期末では記載が可能なので書きます(須田)
CF CAP EX 業績予想① 英語版では経常利益は書かないので注意(須田)
業績予想 ② 業績予想③ PL 医薬品① 医薬品② 医薬品③ BS① BS③ 和文にある「前年同期間比」「前期3月末比」は記載が難しく英語版では必要度の低い情報であるとみなして記載をしないこととなった2016年2Q~(木村)ただし期末では記載が可能なので書きます(須田)
CF CAP EX 業績予想① 英語版では経常利益は書かないので注意(須田)
業績予想 ② 業績予想③ Cash Flow Expenditure
7
Cash Flow Statements (yenmn)FY2016 FY2017Amount Amount
Net cash Provided by operating activities 2737 3188 Used in investing activities (2504) (1606) Provided by (Used in) financing activities 787 (1741)Cash and cash equivalents 8084 7890Free cash flow 232 1582
Capital Expenditure and Other (yenmn)FY2016
UsageAmount Amount YOY () Forecast Rate ()
Capital expenditure 2928 1645 (438) 1650 997Depreciation and amortization 1112 1192 72 1250 954 Revised forecast issued on October 31 2017
Items
FY2017
PL 医薬品① 医薬品② 医薬品③ BS① BS③ 和文にある「前年同期間比」「前期3月末比」は記載が難しく英語版では必要度の低い情報であるとみなして記載をしないこととなった2016年2Q~(木村)ただし期末では記載が可能なので書きます(須田)
CF CAP EX 業績予想① 英語版では経常利益は書かないので注意(須田)
業績予想 ② 業績予想③ PL 医薬品① 医薬品② 医薬品③ BS① BS③ 和文にある「前年同期間比」「前期3月末比」は記載が難しく英語版では必要度の低い情報であるとみなして記載をしないこととなった2016年2Q~(木村)ただし期末では記載が可能なので書きます(須田)
CF CAP EX 業績予想① 英語版では経常利益は書かないので注意(須田)
業績予想 ② 業績予想③ 8
II FY2018 Forecasts
Sales Income
9
(yenmn)
of of YOYAmount Sales Amount Sales ()
Net Sales 35331 1000 35500 1000 05 Pharmaceuticals 34279 970 ― ― ― Others 1051 30 ― ― ―Cost of sales 19535 553 ― ― ―SGampA expenses 13947 395 ― ― ― RampD expenses 2280 65 2700 76 184Operating income 1848 52 1100 31 (405)
1777 50 ― ― ―
1160 33 500 14 (569)Net income attributble to owners of the parent
FY2018 (Forecast)FY2017
Income before income taxes and minority interests
Annual ForecastSales and profit in FY2018 will be impacted by NHI drug price revisions On the other hand however due to our focus on newly launched products and expansion of new sales channels sales of generic drugs are expected to be nearly flat compared to the previous fiscal year As a result consolidated net sales including other businesses such as contracted testing business are projected to be yen35500 million (up 05 YOY)
Regarding profits due to increased development costs as the progress in new drug development and continued strategic expenses such as trial costs leading up to the commencement of commercial production at the Vietnam factory operating income is forecast at yen1100 million (down 405 YOY) and net income attributable to owners of the parent is expected to be yen500 million (down 569 YOY)
PL 医薬品① 医薬品② 医薬品③ BS① BS③ 和文にある「前年同期間比」「前期3月末比」は記載が難しく英語版では必要度の低い情報であるとみなして記載をしないこととなった2016年2Q~(木村)ただし期末では記載が可能なので書きます(須田)
CF CAP EX 業績予想① 英語版では経常利益は書かないので注意(須田)
業績予想 ② 業績予想③ Pharmaceutical Sales
10
Generics Proprietary Products (yenmn)FY2017Amount Amount YOY ()
Total 32153 31800 (11) Generics 30115 30150 01 To medical institutions 29174 29250 03 To other makers 941 900 (44) Amlodipine 2940 2900 (14) Lansoprazole 2163 1900 (122) Donepezil 1557 1350 (133) Rabeprazole 1558 1350 (134) Limaprost Alfadex 1427 1350 (55) Pravastatine 1147 1100 (41) Voglibose 870 750 (139) Others 18449 19450 54 Proprietary products 2038 1650 (190) Uralyt 1225 1070 (127) Soleton 598 400 (331) Calvan 214 180 (162)
Chemiphar ODM Generics (yenmn)FY2017Amount Amount YOY ()
Total 31100 31350 08 Generics 30115 30150 01 Generics (ODM) 985 1200 218
FY2018 (Forecast)
FY2018 (Forecast)
PL 医薬品① 医薬品② 医薬品③ BS① BS③ 和文にある「前年同期間比」「前期3月末比」は記載が難しく英語版では必要度の低い情報であるとみなして記載をしないこととなった2016年2Q~(木村)ただし期末では記載が可能なので書きます(須田)
CF CAP EX 業績予想① 英語版では経常利益は書かないので注意(須田)
業績予想 ② 業績予想③ Per Share Information Expenditure
11
For further information contactPublic Relations Department Nippon Chemiphar Co LtdE-mail irchemipharcojp
Note about Forward-looking Statements and ForecastsStatements made in this Highlights of Business Results with respect to current plans estimates strategies and beliefs and other statements of Nippon Chemiphar that are not historical facts are forward-looking statements about the future performance of Nippon Chemiphar
These statements are based on managementrsquos current assumptions and beliefs in light of the information currently available to it and involve known and unknown risks and uncertainties Consequently undue reliance should not be placed on these statements
Nippon Chemiphar cautions the reader that a number of important factors could cause actual results to differ materially from those discussed in the forward-looking statements
Per Share Information (yen)FY2017Amount Amount YOY ()
Earnings per share 31528 13584 (569)Book value per share 485986 ― ―Dividends per share 10000 7500 ―Dividend payout ratio () 317 552 ―
Capital Expenditure and Other (yenmn)FY2017Amount Amount Change
Capital expenditure 1645 950 (695)Depreciation and amortization 1192 1350 157
FY2018 (Forecast)
FY2018 (Forecast)
Dividend ForecastAs mentioned above we are forecasting a decline in profit in FY2018 due to the influence of NHI drug price revisions ongoing strategic spending including new drug development expenses and start-up expenses at the Vietnam factory Thus we expect to pay a dividend per share of 75 yen (down 25 yen per share YOY) with a payout ratio of 552
PL 医薬品① 医薬品② 医薬品③ BS① BS③ 和文にある「前年同期間比」「前期3月末比」は記載が難しく英語版では必要度の低い情報であるとみなして記載をしないこととなった2016年2Q~(木村)ただし期末では記載が可能なので書きます(須田)
CF CAP EX 業績予想① 英語版では経常利益は書かないので注意(須田)
業績予想 ② 業績予想③ スライド番号 1 Contents スライド番号 3 Sales Income Pharmaceutical Sales Sales Distribution Balance Sheet per Share Information Cash Flow Expenditure スライド番号 9 Sales Income Pharmaceutical Sales Per Share Information Expenditure Per Share Information (yen) FY2017 FY2018 (Forecast) Amount Amount YOY () Earnings per share 31528 13584 (569) Book value per share 485986 ― ― Dividends per share 10000 7500 ― Dividend payout ratio () 317 552 ― Capital Expenditure and Other (yenmn) FY2017 FY2018 (Forecast) Amount Amount Change Capital expenditure 1645 950 (695) Depreciation and amortization 1192 1350 157 2015年3月期 ガツキ 2016年3月期(予想) ガツキ ヨソウ 金額 キンガク 金額 キンガク 増減額 ゾウゲンガク 増減率 ゾウゲン リツ 医療用医薬品 イリョウヨウ イヤクヒン 27400 30950 +05 ジェネリック医薬品(荷離) イヤクヒン ニ バナレ 25079 27430 +01 内自社販売 ウチ ジシャ ハンバイ 2321 25100 +01 内導出輸出 ウチ ドウシュツ ユシュツ 3011 2330 +04 アムロジピン 1935 3040 +09 ランソプラゾール 1509 1890 24 プラバスタチン 1595 1570 +40 ラベプラゾール 1704 1570 16 リマプロストアルファデクス 1273 1660 26 ボグリボース 1013 1300 +21 ドネペジル 15357 1030 +16 その他 タ 3400 15370 +01 主力品 シュリョク ヒン 1975 3520 +35 ウラリット 1134 1970 03 ソレトン 290 1250 +102 カルバン 0 300 +34 ジェネリック医薬品事業 イヤクヒン ジギョウ 2015年3月期 ガツキ 2016年3月期(予想) ガツキ ヨソウ 金額 キンガク 金額 キンガク 増減額 ゾウゲンガク 増減率 ゾウゲン リツ ジェネリック医薬品事業 イヤクヒン ジギョウ 28918 28840 +1003 ジェネリック医薬品(荷離) イヤクヒン ニ バナレ 27400 27430 +999 受託 ジュタク 1518 1410 +1077
Generics Proprietary Products (yenmn) FY2017 FY2018 (Forecast) Amount Amount YOY () Total 32153 31800 (11) Generics 30115 30150 01 To medical institutions 29174 29250 03 To other makers 941 900 (44) Amlodipine 2940 2900 (14) Lansoprazole 2163 1900 (122) Donepezil 1557 1350 (133) Rabeprazole 1558 1350 (134) Limaprost Alfadex 1427 1350 (55) Pravastatine 1147 1100 (41) Voglibose 870 750 (139) Others 18449 19450 54 Proprietary products 2038 1650 (190) Uralyt 1225 1070 (127) Soleton 598 400 (331) Calvan 214 180 (162) Chemiphar ODM Generics (yenmn) FY2017 FY2018 (Forecast) Amount Amount YOY () Total 31100 31350 08 Generics 30115 30150 01 Generics (ODM) 985 1200 218
Income Statement Overview (yenmn) FY2017 FY2018 (Forecast) of of YOY Amount Sales Amount Sales () Net Sales 35331 1000 35500 1000 05 Pharmaceuticals 34279 970 ― ― ― Others 1051 30 ― ― ― Cost of sales 19535 553 ― ― ― SGampA expenses 13947 395 ― ― ― RampD expenses 2280 65 2700 76 184 Operating income 1848 0 52 1100 31 (405) Income before income taxes and minority interests 1777 80 ― ― ― Net income attributble to owners of the parent 1160 33 500 14 (569)
Capital Expenditure and Other (yenmn) Items FY2016 FY2017 Usage Amount Amount YOY () Forecast Rate () Capital expenditure 2928 1645 (438) 1650 997 Depreciation and amortization 1112 1192 72 1250 954 Revised forecast issued on October 31 2017
Cash Flow Statements (yenmn) FY2016 FY2017 Amount Amount Net cash Provided by operating activities 2737 3188 Used in investing activities (2504) (1606) Used in financing activities 787 (1741) Cash and cash equivalents 8084 7890 Free cash flow 232 1582
Per Share Information (yen) FY2016 FY2017 Amount Amount Change Forecast Earnings per share 53002 31528 (21474) 30673 Book value per share 454880 485986 31106 ― Dividend per share 10000 10000 ― 10000 Dividend payout ratio () 189 317 ― 326 Revised forecast issued on October 31 2017
Balance Sheet Data (yenmn) March 31 2017 August 31 2017 March 31 2015 Amount Amount Change Total assets 47002 46814 3358 (187) Return on assets () 63 36 -06 (27) Net assets 17355 17487 1313 132 Owned capital 17346 17474 1312 127 Capital-to-asset ratio () 369 373 02 +04 Return on equity () 123 67 (01) (56) Current assets 29009 28334 1630 (674) Current liabilities 14939 14914 (716) (25) Current ratio (x) 194 19 019 004
By Main Therapeutic Categories () FY2016 FY2017 Cardiovascular and respiratory drugs 309 320 Digestive organ drugs 196 183 Agents affecting metabolism 164 165 Drugs for nervous system sensory organs 99 91 Antibiotics and chemotherapeutic drugs 65 62 Antineoplastic agents 32 34 Others 135 145
Sales Distribution By Launch Year (yenmn) FY2016 FY2017 Fiscal Year Amount Distrib () Amount Distrib () YOY () 2010 and before 19487 1 667 19194 637 (15) 2009 2011 2348 0 80 2210 73 (59) 2012 1484 0 51 1404 47 (54) 2013 2917 0 100 3127 104 72 2014 1746 0 60 1937 64 110 2015 1001 0 34 1222 41 221 2016 219 0 08 459 15 1091 2017 ― ― ― 558 19 ― Total 29204 1 1000 30115 1000 31
Generics Proprietary Products (yenmn) FY2016 FY2017 Distrib Distrib YOY Achieved Amount () Amount () () Forecast () Total 31513 1 1000 32153 1 1000 20 32000 1005 Generics 29204 1 927 30115 1 937 31 30000 1 1004 To medical institutions 27808 29174 49 29100 1 1003 To other makers 1395 941 (326) 900 1 1046 Amlodipine 2865 2940 26 2900 1 1014 Lansoprazole 2279 2163 (51) 2100 1 1030 Donepezil 1642 1557 (52) 1600 1 973 Rabeprazole 1586 1558 (18) 1600 1 974 Limaprost Alfadex 1469 1427 (28) 1400 1 1020 Pravastatine 1173 1147 (22) 1100 1 1043 Voglibose 957 870 (91) 900 1 967 Others 17229 18449 71 18400 1 1003 Proprietary products 2308 0 73 2038 0 63 (117) 2000 1 1019 Uralyt 1409 1225 (131) 1200 1 1021 Soleton 679 598 (120) 600 1 997 Calvan 219 214 (21) 200 1 1074 Chemiphar ODM Generics (yenmn) FY2016 FY2017 Distrib Distrib YOY Achieved Amount () Amount () () Forecast () Total 30445 1000 31100 1000 22 31400 990 Generics 29204 959 30115 968 31 30000 1004 Generics (ODM) 1240 41 985 32 (206) 1400 704 Includes exports Revised forecast issued on October 31 2017
Income Statement Overview (yenmn) FY2016 FY2017 of of YOY Achieved Amount Sales Amount Sales () Forecast () Net Sales 35689 1 1000 35331 1 1000 (10) 35500 1 995 Pharmaceuticals 34551 1 968 34279 1 970 (08) ― ― ― Others 1137 0 32 1051 0 30 (76) ― ― ― Cost of sales 19449 1 545 19535 1 553 04 ― ― ― SGampA expenses 13403 0 376 13947 0 395 41 ― ― ― RampD expenses 1984 0 56 2280 0 65 150 2200 0 1037 Operating income 2836 0 79 1848 0 52 (348) 1800 0 1027 Income before income taxes and minority interests 2849 0 80 1696 0 48 (405) 1700 ― 998 Net income attributble to owners of the parent 2054 0 58 1160 0 33 (435) 1150 ― 1009 1961 00550933658 00550933658 00575628587 Revised forecast issued on October 31 2017
Per Share Information (yen) FY2017 FY2018 (Forecast) Amount Amount YOY () Earnings per share 31528 13584 (569) Book value per share 485986 ― ― Dividends per share 10000 7500 ― Dividend payout ratio() 317 552 ― Capital Expenditure and Other (yenmn) FY2017 FY2018 (Forecast) Amount Amount Change Capital expenditure 1645 950 (695) Depreciation and amortization 1192 1350 157 2015年3月期 ガツキ 2016年3月期(予想) ガツキ ヨソウ 金額 キンガク 金額 キンガク 増減額 ゾウゲンガク 増減率 ゾウゲン リツ 医療用医薬品 イリョウヨウ イヤクヒン 27400 30950 +05 ジェネリック医薬品(荷離) イヤクヒン ニ バナレ 25079 27430 +01 内自社販売 ウチ ジシャ ハンバイ 2321 25100 +01 内導出輸出 ウチ ドウシュツ ユシュツ 3011 2330 +04 アムロジピン 1935 3040 +09 ランソプラゾール 1509 1890 24 プラバスタチン 1595 1570 +40 ラベプラゾール 1704 1570 16 リマプロストアルファデクス 1273 1660 26 ボグリボース 1013 1300 +21 ドネペジル 15357 1030 +16 その他 タ 3400 15370 +01 主力品 シュリョク ヒン 1975 3520 +35 ウラリット 1134 1970 03 ソレトン 290 1250 +102 カルバン 0 300 +34 ジェネリック医薬品事業 イヤクヒン ジギョウ 2015年3月期 ガツキ 2016年3月期(予想) ガツキ ヨソウ 金額 キンガク 金額 キンガク 増減額 ゾウゲンガク 増減率 ゾウゲン リツ ジェネリック医薬品事業 イヤクヒン ジギョウ 28918 28840 +1003 ジェネリック医薬品(荷離) イヤクヒン ニ バナレ 27400 27430 +999 受託 ジュタク 1518 1410 +1077
Generics Proprietary Products (yenmn) FY2017 FY2018 (Forecast) Amount Amount YOY () Total 32153 31800 (11) Generics 30115 30150 01 To medical institutions 29174 29250 03 To other makers 941 900 (44) Amlodipine 2940 2900 (14) Lansoprazole 2163 1900 (122) Donepezil 1557 1350 (133) Rabeprazole 1558 1350 (134) Limaprost Alfadex 1427 1350 (55) Pravastatine 1147 1100 (41) Voglibose 870 750 (139) Others 18449 19450 54 Proprietary products 2038 1650 (190) Uralyt 1225 1070 (127) Soleton 598 400 (331) Calvan 214 180 (162) Chemiphar ODM Generics (yenmn) FY2017 FY2018 (Forecast) Amount Amount YOY () Total 31100 31350 08 Generics 30115 30150 01 Generics (ODM) 985 1200 218
Income Statement Overview (yenmn) FY2017 FY2018 (Forecast) of of YOY Amount Sales Amount Sales () Net Sales 35331 1000 35500 1000 05 Pharmaceuticals 34279 970 ― ― ― Others 1051 30 ― ― ― Cost of sales 19535 553 ― ― ― SGampA expenses 13947 395 ― ― ― RampD expenses 2280 65 2700 76 184 Operating income 1848 0 52 1100 31 (405) Income before income taxes and minority interests 1777 80 ― ― ― Net income attributble to owners of the parent 1160 33 500 14 (569)
Capital Expenditure and Other (yenmn) Items FY2016 FY2017 Usage Amount Amount YOY () Forecast Rate () Capital expenditure 2928 1645 (438) 1650 997 Depreciation and amortization 1112 1192 72 1250 954 Revised forecast issued on October 31 2017
Cash Flow Statements (yenmn) FY2016 FY2017 Amount Amount Net cash Provided by operating activities 2737 3188 Used in investing activities (2504) (1606) Used in financing activities 787 (1741) Cash and cash equivalents 8084 7890 Free cash flow 232 1582
Per Share Information (yen) FY2016 FY2017 Amount Amount Change Forecast Earnings per share 53002 31528 (21474) 30673 Book value per share 454880 485986 31106 ― Dividend per share 10000 10000 ― 10000 Dividend payout ratio () 189 317 ― 326 Revised forecast issued on October 31 2017
Balance Sheet Data (yenmn) March 31 2017 August 31 2017 March 31 2015 Amount Amount Change Total assets 47002 46814 3358 (187) Return on assets () 63 36 -06 (27) Net assets 17355 17487 1313 132 Owned capital 17346 17474 1312 127 Capital-to-asset ratio () 369 373 02 +04 Return on equity () 123 67 (01) (56) Current assets 29009 28334 1630 (674) Current liabilities 14939 14914 (716) (25) Current ratio (x) 194 19 019 004
By Main Therapeutic Categories () FY2016 FY2017 Cardiovascular and respiratory drugs 309 320 Digestive organ drugs 196 183 Agents affecting metabolism 164 165 Drugs for nervous system sensory organs 99 91 Antibiotics and chemotherapeutic drugs 65 62 Antineoplastic agents 32 34 Others 135 145
Sales Distribution By Launch Year (yenmn) FY2016 FY2017 Fiscal Year Amount Distrib () Amount Distrib () YOY () 2010 and before 19487 1 667 19194 637 (15) 2009 2011 2348 0 80 2210 73 (59) 2012 1484 0 51 1404 47 (54) 2013 2917 0 100 3127 104 72 2014 1746 0 60 1937 64 110 2015 1001 0 34 1222 41 221 2016 219 0 08 459 15 1091 2017 ― ― ― 558 19 ― Total 29204 1 1000 30115 1000 31
Generics Proprietary Products (yenmn) FY2016 FY2017 Distrib Distrib YOY Achieved Amount () Amount () () Forecast () Total 31513 1 1000 32153 1 1000 20 32000 1005 Generics 29204 1 927 30115 1 937 31 30000 1 1004 To medical institutions 27808 29174 49 29100 1 1003 To other makers 1395 941 (326) 900 1 1046 Amlodipine 2865 2940 26 2900 1 1014 Lansoprazole 2279 2163 (51) 2100 1 1030 Donepezil 1642 1557 (52) 1600 1 973 Rabeprazole 1586 1558 (18) 1600 1 974 Limaprost Alfadex 1469 1427 (28) 1400 1 1020 Pravastatine 1173 1147 (22) 1100 1 1043 Voglibose 957 870 (91) 900 1 967 Others 17229 18449 71 18400 1 1003 Proprietary products 2308 0 73 2038 0 63 (117) 2000 1 1019 Uralyt 1409 1225 (131) 1200 1 1021 Soleton 679 598 (120) 600 1 997 Calvan 219 214 (21) 200 1 1074 Chemiphar ODM Generics (yenmn) FY2016 FY2017 Distrib Distrib YOY Achieved Amount () Amount () () Forecast () Total 30445 1000 31100 1000 22 31400 990 Generics 29204 959 30115 968 31 30000 1004 Generics (ODM) 1240 41 985 32 (206) 1400 704 Includes exports Revised forecast issued on October 31 2017
Income Statement Overview (yenmn) FY2016 FY2017 of of YOY Achieved Amount Sales Amount Sales () Forecast () Net Sales 35689 1 1000 35331 1 1000 (10) 35500 1 995 Pharmaceuticals 34551 1 968 34279 1 970 (08) ― ― ― Others 1137 0 32 1051 0 30 (76) ― ― ― Cost of sales 19449 1 545 19535 1 553 04 ― ― ― SGampA expenses 13403 0 376 13947 0 395 41 ― ― ― RampD expenses 1984 0 56 2280 0 65 150 2200 0 1037 Operating income 2836 0 79 1848 0 52 (348) 1800 0 1027 Income before income taxes and minority interests 2849 0 80 1696 0 48 (405) 1700 ― 998 Net income attributble to owners of the parent 2054 0 58 1160 0 33 (435) 1150 ― 1009 1961 00550933658 00550933658 00575628587 Revised forecast issued on October 31 2017
Per Share Information (yen) FY2017 FY2018 (Forecast) Amount Amount YOY () Earnings per share 31528 13584 (569) Book value per share 485986 ― ― Dividends per share 10000 7500 ― Dividend payout ratio() 317 552 ― Capital Expenditure and Other (yenmn) FY2017 FY2018 (Forecast) Amount Amount Change Capital expenditure 1645 950 (695) Depreciation and amortization 1192 1350 157 2015年3月期 ガツキ 2016年3月期(予想) ガツキ ヨソウ 金額 キンガク 金額 キンガク 増減額 ゾウゲンガク 増減率 ゾウゲン リツ 医療用医薬品 イリョウヨウ イヤクヒン 27400 30950 +05 ジェネリック医薬品(荷離) イヤクヒン ニ バナレ 25079 27430 +01 内自社販売 ウチ ジシャ ハンバイ 2321 25100 +01 内導出輸出 ウチ ドウシュツ ユシュツ 3011 2330 +04 アムロジピン 1935 3040 +09 ランソプラゾール 1509 1890 24 プラバスタチン 1595 1570 +40 ラベプラゾール 1704 1570 16 リマプロストアルファデクス 1273 1660 26 ボグリボース 1013 1300 +21 ドネペジル 15357 1030 +16 その他 タ 3400 15370 +01 主力品 シュリョク ヒン 1975 3520 +35 ウラリット 1134 1970 03 ソレトン 290 1250 +102 カルバン 0 300 +34 ジェネリック医薬品事業 イヤクヒン ジギョウ 2015年3月期 ガツキ 2016年3月期(予想) ガツキ ヨソウ 金額 キンガク 金額 キンガク 増減額 ゾウゲンガク 増減率 ゾウゲン リツ ジェネリック医薬品事業 イヤクヒン ジギョウ 28918 28840 +1003 ジェネリック医薬品(荷離) イヤクヒン ニ バナレ 27400 27430 +999 受託 ジュタク 1518 1410 +1077
Generics Proprietary Products (yenmn) FY2017 FY2018 (Forecast) Amount Amount YOY () Total 32153 31800 (11) Generics 30115 30150 01 To medical institutions 29174 29250 03 To other makers 941 900 (44) Amlodipine 2940 2900 (14) Lansoprazole 2163 1900 (122) Donepezil 1557 1350 (133) Rabeprazole 1558 1350 (134) Limaprost Alfadex 1427 1350 (55) Pravastatine 1147 1100 (41) Voglibose 870 750 (139) Others 18449 19450 54 Proprietary products 2038 1650 (190) Uralyt 1225 1070 (127) Soleton 598 400 (331) Calvan 214 180 (162) Chemiphar ODM Generics (yenmn) FY2017 FY2018 (Forecast) Amount Amount YOY () Total 31100 31350 08 Generics 30115 30150 01 Generics (ODM) 985 1200 218
Income Statement Overview (yenmn) FY2017 FY2018 (Forecast) of of YOY Amount Sales Amount Sales () Net Sales 35331 1000 35500 1000 05 Pharmaceuticals 34279 970 ― ― ― Others 1051 30 ― ― ― Cost of sales 19535 553 ― ― ― SGampA expenses 13947 395 ― ― ― RampD expenses 2280 65 2700 76 184 Operating income 1848 0 52 1100 31 (405) Income before income taxes and minority interests 1777 50 ― ― ― Net income attributble to owners of the parent 1160 33 500 14 (569)
Capital Expenditure and Other (yenmn) Items FY2016 FY2017 Usage Amount Amount YOY () Forecast Rate () Capital expenditure 2928 1645 (438) 1650 997 Depreciation and amortization 1112 1192 72 1250 954 Revised forecast issued on October 31 2017
Cash Flow Statements (yenmn) FY2016 FY2017 Amount Amount Net cash Provided by operating activities 2737 3188 Used in investing activities (2504) (1606) Used in financing activities 787 (1741) Cash and cash equivalents 8084 7890 Free cash flow 232 1582
Per Share Information (yen) FY2016 FY2017 Amount Amount Change Forecast Earnings per share 53002 31528 (21474) 30673 Book value per share 454880 485986 31106 ― Dividend per share 10000 10000 ― 10000 Dividend payout ratio () 189 317 ― 326 Revised forecast issued on October 31 2017
Balance Sheet Data (yenmn) March 31 2017 March 31 2018 March 31 2015 Amount Amount Change Total assets 47002 46814 3358 (187) Return on assets () 63 36 -06 (27) Net assets 17355 17487 1313 132 Owned capital 17346 17474 1312 127 Capital-to-asset ratio () 369 373 02 04 Return on equity () 123 67 (01) (56) Current assets 29009 28334 1630 (674) Current liabilities 14939 14914 (716) (25) Current ratio (x) 194 19 019 (004)
By Main Therapeutic Categories () FY2016 FY2017 Cardiovascular and respiratory drugs 309 320 Digestive organ drugs 196 183 Agents affecting metabolism 164 165 Drugs for nervous system sensory organs 99 91 Antibiotics and chemotherapeutic drugs 65 62 Antineoplastic agents 32 34 Others 135 145
Sales Distribution By Launch Year (yenmn) FY2016 FY2017 Fiscal Year Amount Distrib () Amount Distrib () YOY () 2010 and before 19487 1 667 19194 637 (15) 2009 2011 2348 0 80 2210 73 (59) 2012 1484 0 51 1404 47 (54) 2013 2917 0 100 3127 104 72 2014 1746 0 60 1937 64 110 2015 1001 0 34 1222 41 221 2016 219 0 08 459 15 1091 2017 ― ― 558 19 ― Total 29204 1 1000 30115 1000 31
Generics Proprietary Products (yenmn) FY2016 FY2017 Distrib Distrib YOY Achieved Amount () Amount () () Forecast () Total 31513 1 1000 32153 1 1000 20 32000 1005 Generics 29204 1 927 30115 1 937 31 30000 1 1004 To medical institutions 27808 29174 49 29100 1 1003 To other makers 1395 941 (326) 900 1 1046 Amlodipine 2865 2940 26 2900 1 1014 Lansoprazole 2279 2163 (51) 2100 1 1030 Donepezil 1642 1557 (52) 1600 1 973 Rabeprazole 1586 1558 (18) 1600 1 974 Limaprost Alfadex 1469 1427 (28) 1400 1 1020 Pravastatine 1173 1147 (22) 1100 1 1043 Voglibose 957 870 (91) 900 1 967 Others 17229 18449 71 18400 1 1003 Proprietary products 2308 0 73 2038 0 63 (117) 2000 1 1019 Uralyt 1409 1225 (131) 1200 1 1021 Soleton 679 598 (120) 600 1 997 Calvan 219 214 (21) 200 1 1074 Chemiphar ODM Generics (yenmn) FY2016 FY2017 Distrib Distrib YOY Achieved Amount () Amount () () Forecast () Total 30445 1000 31100 1000 22 31400 990 Generics 29204 959 30115 968 31 30000 1004 Generics (ODM) 1240 41 985 32 (206) 1400 704 Includes exports Revised forecast issued on October 31 2017
Income Statement Overview (yenmn) FY2016 FY2017 of of YOY Achieved Amount Sales Amount Sales () Forecast () Net Sales 35689 1 1000 35331 1 1000 (10) 35500 1 995 Pharmaceuticals 34551 1 968 34279 1 970 (08) ― ― Others 1137 0 32 1051 0 30 (76) ― ― Cost of sales 19449 1 545 19535 1 553 04 ― ― SGampA expenses 13403 0 376 13947 0 395 41 ― ― RampD expenses 1984 0 56 2280 0 65 150 2200 0 1037 Operating income 2836 0 79 1848 0 52 (348) 1800 0 1027 Income before income taxes and minority interests 2849 0 80 1777 0 50 (376) ― ― Net income attributble to owners of the parent 2054 0 58 1160 0 33 (435) 1150 ― 1009 1961 00550933658 00550933658 00575628587 Revised forecast issued on October 31 2017
Per Share Information (yen) FY2017 FY2018 (Forecast) Amount Amount YOY () Earnings per share 31528 13584 (569) Book value per share 485986 ― ― Dividends per share 10000 7500 ― Dividend payout ratio() 317 552 ― Capital Expenditure and Other (yenmn) FY2017 FY2018 (Forecast) Amount Amount Change Capital expenditure 1645 950 (695) Depreciation and amortization 1192 1350 157 2015年3月期 ガツキ 2016年3月期(予想) ガツキ ヨソウ 金額 キンガク 金額 キンガク 増減額 ゾウゲンガク 増減率 ゾウゲン リツ 医療用医薬品 イリョウヨウ イヤクヒン 27400 30950 +05 ジェネリック医薬品(荷離) イヤクヒン ニ バナレ 25079 27430 +01 内自社販売 ウチ ジシャ ハンバイ 2321 25100 +01 内導出輸出 ウチ ドウシュツ ユシュツ 3011 2330 +04 アムロジピン 1935 3040 +09 ランソプラゾール 1509 1890 24 プラバスタチン 1595 1570 +40 ラベプラゾール 1704 1570 16 リマプロストアルファデクス 1273 1660 26 ボグリボース 1013 1300 +21 ドネペジル 15357 1030 +16 その他 タ 3400 15370 +01 主力品 シュリョク ヒン 1975 3520 +35 ウラリット 1134 1970 03 ソレトン 290 1250 +102 カルバン 0 300 +34 ジェネリック医薬品事業 イヤクヒン ジギョウ 2015年3月期 ガツキ 2016年3月期(予想) ガツキ ヨソウ 金額 キンガク 金額 キンガク 増減額 ゾウゲンガク 増減率 ゾウゲン リツ ジェネリック医薬品事業 イヤクヒン ジギョウ 28918 28840 +1003 ジェネリック医薬品(荷離) イヤクヒン ニ バナレ 27400 27430 +999 受託 ジュタク 1518 1410 +1077
Generics Proprietary Products (yenmn) FY2017 FY2018 (Forecast) Amount Amount YOY () Total 32153 31800 (11) Generics 30115 30150 01 To medical institutions 29174 29250 03 To other makers 941 900 (44) Amlodipine 2940 2900 (14) Lansoprazole 2163 1900 (122) Donepezil 1557 1350 (133) Rabeprazole 1558 1350 (134) Limaprost Alfadex 1427 1350 (55) Pravastatine 1147 1100 (41) Voglibose 870 750 (139) Others 18449 19450 54 Proprietary products 2038 1650 (190) Uralyt 1225 1070 (127) Soleton 598 400 (331) Calvan 214 180 (162) Chemiphar ODM Generics (yenmn) FY2017 FY2018 (Forecast) Amount Amount YOY () Total 31100 31350 08 Generics 30115 30150 01 Generics (ODM) 985 1200 218
Income Statement Overview (yenmn) FY2017 FY2018 (Forecast) of of YOY Amount Sales Amount Sales () Net Sales 35331 1000 35500 1000 05 Pharmaceuticals 34279 970 ― ― ― Others 1051 30 ― ― ― Cost of sales 19535 553 ― ― ― SGampA expenses 13947 395 ― ― ― RampD expenses 2280 65 2700 76 184 Operating income 1848 0 52 1100 31 (405) Income before income taxes and minority interests 1777 80 ― ― ― Net income attributble to owners of the parent 1160 33 500 14 (569)
Capital Expenditure and Other (yenmn) Items FY2016 FY2017 Usage Amount Amount YOY () Forecast Rate () Capital expenditure 2928 1645 (438) 1650 997 Depreciation and amortization 1112 1192 72 1250 954 Revised forecast issued on October 31 2017
Cash Flow Statements (yenmn) FY2016 FY2017 Amount Amount Net cash Provided by operating activities 2737 3188 Used in investing activities (2504) (1606) Used in financing activities 787 (1741) Cash and cash equivalents 8084 7890 Free cash flow 232 1582
Per Share Information (yen) FY2016 FY2017 Amount Amount Change Forecast Earnings per share 53002 31528 (21474) 30673 Book value per share 454880 485986 31106 ― Dividend per share 10000 10000 ― 10000 Dividend payout ratio () 189 317 ― 326 Revised forecast issued on October 31 2017
Balance Sheet Data (yenmn) March 31 2017 August 31 2017 March 31 2015 Amount Amount Change Total assets 47002 46814 3358 (187) Return on assets () 63 36 -06 (27) Net assets 17355 17487 1313 132 Owned capital 17346 17474 1312 127 Capital-to-asset ratio () 369 373 02 +04 Return on equity () 123 67 (01) (56) Current assets 29009 28334 1630 (674) Current liabilities 14939 14914 (716) (25) Current ratio (x) 194 19 019 004
By Main Therapeutic Categories () FY2016 FY2017 Cardiovascular and respiratory drugs 309 320 Digestive organ drugs 196 183 Agents affecting metabolism 164 165 Drugs for nervous system sensory organs 99 91 Antibiotics and chemotherapeutic drugs 65 62 Antineoplastic agents 32 34 Others 135 145
Sales Distribution By Launch Year (yenmn) FY2016 FY2017 Fiscal Year Amount Distrib () Amount Distrib () YOY () 2010 and before 19487 1 667 19194 637 (15) 2009 2011 2348 0 80 2210 73 (59) 2012 1484 0 51 1404 47 (54) 2013 2917 0 100 3127 104 72 2014 1746 0 60 1937 64 110 2015 1001 0 34 1222 41 221 2016 219 0 08 459 15 1091 2017 ― ― ― 558 19 ― Total 29204 1 1000 30115 1000 31
Generics Proprietary Products (yenmn) FY2016 FY2017 Distrib Distrib YOY Achieved Amount () Amount () () Forecast () Total 31513 1 1000 32153 1 1000 20 32000 1005 Generics 29204 1 927 30115 1 937 31 30000 1 1004 To medical institutions 27808 29174 49 29100 1 1003 To other makers 1395 941 (326) 900 1 1046 Amlodipine 2865 2940 26 2900 1 1014 Lansoprazole 2279 2163 (51) 2100 1 1030 Donepezil 1642 1557 (52) 1600 1 973 Rabeprazole 1586 1558 (18) 1600 1 974 Limaprost Alfadex 1469 1427 (28) 1400 1 1020 Pravastatine 1173 1147 (22) 1100 1 1043 Voglibose 957 870 (91) 900 1 967 Others 17229 18449 71 18400 1 1003 Proprietary products 2308 0 73 2038 0 63 (117) 2000 1 1019 Uralyt 1409 1225 (131) 1200 1 1021 Soleton 679 598 (120) 600 1 997 Calvan 219 214 (21) 200 1 1074 Chemiphar ODM Generics (yenmn) FY2016 FY2017 Distrib Distrib YOY Achieved Amount () Amount () () Forecast () Total 30445 1000 31100 1000 22 31400 990 Generics 29204 959 30115 968 31 30000 1004 Generics (ODM) 1240 41 985 32 (206) 1400 704 Includes exports Revised forecast issued on October 31 2017
Income Statement Overview (yenmn) FY2016 FY2017 of of YOY Achieved Amount Sales Amount Sales () Forecast () Net Sales 35689 1 1000 35331 1 1000 (10) 35500 1 995 Pharmaceuticals 34551 1 968 34279 1 970 (08) ― ― ― Others 1137 0 32 1051 0 30 (76) ― ― ― Cost of sales 19449 1 545 19535 1 553 04 ― ― ― SGampA expenses 13403 0 376 13947 0 395 41 ― ― ― RampD expenses 1984 0 56 2280 0 65 150 2200 0 1037 Operating income 2836 0 79 1848 0 52 (348) 1800 0 1027 Income before income taxes and minority interests 2849 0 80 1696 0 48 (405) 1700 ― 998 Net income attributble to owners of the parent 2054 0 58 1160 0 33 (435) 1150 ― 1009 1961 00550933658 00550933658 00575628587 Revised forecast issued on October 31 2017
Per Share Information (yen) FY2017 FY2018 (Forecast) Amount Amount YOY () Earnings per share 31528 13584 (569) Book value per share 485986 ― ― Dividends per share 10000 7500 ― Dividend payout ratio() 317 552 ― Capital Expenditure and Other (yenmn) FY2017 FY2018 (Forecast) Amount Amount Change Capital expenditure 1645 950 (695) Depreciation and amortization 1192 1350 157 2015年3月期 ガツキ 2016年3月期(予想) ガツキ ヨソウ 金額 キンガク 金額 キンガク 増減額 ゾウゲンガク 増減率 ゾウゲン リツ 医療用医薬品 イリョウヨウ イヤクヒン 27400 30950 +05 ジェネリック医薬品(荷離) イヤクヒン ニ バナレ 25079 27430 +01 内自社販売 ウチ ジシャ ハンバイ 2321 25100 +01 内導出輸出 ウチ ドウシュツ ユシュツ 3011 2330 +04 アムロジピン 1935 3040 +09 ランソプラゾール 1509 1890 24 プラバスタチン 1595 1570 +40 ラベプラゾール 1704 1570 16 リマプロストアルファデクス 1273 1660 26 ボグリボース 1013 1300 +21 ドネペジル 15357 1030 +16 その他 タ 3400 15370 +01 主力品 シュリョク ヒン 1975 3520 +35 ウラリット 1134 1970 03 ソレトン 290 1250 +102 カルバン 0 300 +34 ジェネリック医薬品事業 イヤクヒン ジギョウ 2015年3月期 ガツキ 2016年3月期(予想) ガツキ ヨソウ 金額 キンガク 金額 キンガク 増減額 ゾウゲンガク 増減率 ゾウゲン リツ ジェネリック医薬品事業 イヤクヒン ジギョウ 28918 28840 +1003 ジェネリック医薬品(荷離) イヤクヒン ニ バナレ 27400 27430 +999 受託 ジュタク 1518 1410 +1077
Generics Proprietary Products (yenmn) FY2017 FY2018 (Forecast) Amount Amount YOY () Total 32153 31800 (11) Generics 30115 30150 01 To medical institutions 29174 29250 03 To other makers 941 900 (44) Amlodipine 2940 2900 (14) Lansoprazole 2163 1900 (122) Donepezil 1557 1350 (133) Rabeprazole 1558 1350 (134) Limaprost Alfadex 1427 1350 (55) Pravastatine 1147 1100 (41) Voglibose 870 750 (139) Others 18449 19450 54 Proprietary products 2038 1650 (190) Uralyt 1225 1070 (127) Soleton 598 400 (331) Calvan 214 180 (162) Chemiphar ODM Generics (yenmn) FY2017 FY2018 (Forecast) Amount Amount YOY () Total 31100 31350 08 Generics 30115 30150 01 Generics (ODM) 985 1200 218
Income Statement Overview (yenmn) FY2017 FY2018 (Forecast) of of YOY Amount Sales Amount Sales () Net Sales 35331 1000 35500 1000 05 Pharmaceuticals 34279 970 ― ― ― Others 1051 30 ― ― ― Cost of sales 19535 553 ― ― ― SGampA expenses 13947 395 ― ― ― RampD expenses 2280 65 2700 76 184 Operating income 1848 0 52 1100 31 (405) Income before income taxes and minority interests 1777 80 ― ― ― Net income attributble to owners of the parent 1160 33 500 14 (569)
Capital Expenditure and Other (yenmn) Items FY2016 FY2017 Usage Amount Amount YOY () Forecast Rate () Capital expenditure 2928 1645 (438) 1650 997 Depreciation and amortization 1112 1192 72 1250 954 Revised forecast issued on October 31 2017
Cash Flow Statements (yenmn) FY2016 FY2017 Amount Amount Net cash Provided by operating activities 2737 3188 Used in investing activities (2504) (1606) Provided by (Used in) financing activities 787 (1741) Cash and cash equivalents 8084 7890 Free cash flow 232 1582
Per Share Information (yen) FY2016 FY2017 Amount Amount Change Forecast Earnings per share 53002 31528 (21474) 30673 Book value per share 454880 485986 31106 ― Dividend per share 10000 10000 ― 10000 Dividend payout ratio () 189 317 ― 326 Revised forecast issued on October 31 2017
Balance Sheet Data (yenmn) March 31 2017 August 31 2017 March 31 2015 Amount Amount Change Total assets 47002 46814 3358 (187) Return on assets () 63 36 -06 (27) Net assets 17355 17487 1313 132 Owned capital 17346 17474 1312 127 Capital-to-asset ratio () 369 373 02 +04 Return on equity () 123 67 (01) (56) Current assets 29009 28334 1630 (674) Current liabilities 14939 14914 (716) (25) Current ratio (x) 194 19 019 004
By Main Therapeutic Categories () FY2016 FY2017 Cardiovascular and respiratory drugs 309 320 Digestive organ drugs 196 183 Agents affecting metabolism 164 165 Drugs for nervous system sensory organs 99 91 Antibiotics and chemotherapeutic drugs 65 62 Antineoplastic agents 32 34 Others 135 145
Sales Distribution By Launch Year (yenmn) FY2016 FY2017 Fiscal Year Amount Distrib () Amount Distrib () YOY () 2010 and before 19487 1 667 19194 637 (15) 2009 2011 2348 0 80 2210 73 (59) 2012 1484 0 51 1404 47 (54) 2013 2917 0 100 3127 104 72 2014 1746 0 60 1937 64 110 2015 1001 0 34 1222 41 221 2016 219 0 08 459 15 1091 2017 ― ― ― 558 19 ― Total 29204 1 1000 30115 1000 31
Generics Proprietary Products (yenmn) FY2016 FY2017 Distrib Distrib YOY Achieved Amount () Amount () () Forecast () Total 31513 1 1000 32153 1 1000 20 32000 1005 Generics 29204 1 927 30115 1 937 31 30000 1 1004 To medical institutions 27808 29174 49 29100 1 1003 To other makers 1395 941 (326) 900 1 1046 Amlodipine 2865 2940 26 2900 1 1014 Lansoprazole 2279 2163 (51) 2100 1 1030 Donepezil 1642 1557 (52) 1600 1 973 Rabeprazole 1586 1558 (18) 1600 1 974 Limaprost Alfadex 1469 1427 (28) 1400 1 1020 Pravastatine 1173 1147 (22) 1100 1 1043 Voglibose 957 870 (91) 900 1 967 Others 17229 18449 71 18400 1 1003 Proprietary products 2308 0 73 2038 0 63 (117) 2000 1 1019 Uralyt 1409 1225 (131) 1200 1 1021 Soleton 679 598 (120) 600 1 997 Calvan 219 214 (21) 200 1 1074 Chemiphar ODM Generics (yenmn) FY2016 FY2017 Distrib Distrib YOY Achieved Amount () Amount () () Forecast () Total 30445 1000 31100 1000 22 31400 990 Generics 29204 959 30115 968 31 30000 1004 Generics (ODM) 1240 41 985 32 (206) 1400 704 Includes exports Revised forecast issued on October 31 2017
Income Statement Overview (yenmn) FY2016 FY2017 of of YOY Achieved Amount Sales Amount Sales () Forecast () Net Sales 35689 1 1000 35331 1 1000 (10) 35500 1 995 Pharmaceuticals 34551 1 968 34279 1 970 (08) ― ― ― Others 1137 0 32 1051 0 30 (76) ― ― ― Cost of sales 19449 1 545 19535 1 553 04 ― ― ― SGampA expenses 13403 0 376 13947 0 395 41 ― ― ― RampD expenses 1984 0 56 2280 0 65 150 2200 0 1037 Operating income 2836 0 79 1848 0 52 (348) 1800 0 1027 Income before income taxes and minority interests 2849 0 80 1696 0 48 (405) 1700 ― 998 Net income attributble to owners of the parent 2054 0 58 1160 0 33 (435) 1150 ― 1009 1961 00550933658 00550933658 00575628587 Revised forecast issued on October 31 2017
Per Share Information (yen) FY2017 FY2018 (Forecast) Amount Amount YOY () Earnings per share 31528 13584 (569) Book value per share 485986 ― ― Dividends per share 10000 7500 ― Dividend payout ratio() 317 552 ― Capital Expenditure and Other (yenmn) FY2017 FY2018 (Forecast) Amount Amount Change Capital expenditure 1645 950 (695) Depreciation and amortization 1192 1350 157 2015年3月期 ガツキ 2016年3月期(予想) ガツキ ヨソウ 金額 キンガク 金額 キンガク 増減額 ゾウゲンガク 増減率 ゾウゲン リツ 医療用医薬品 イリョウヨウ イヤクヒン 27400 30950 +05 ジェネリック医薬品(荷離) イヤクヒン ニ バナレ 25079 27430 +01 内自社販売 ウチ ジシャ ハンバイ 2321 25100 +01 内導出輸出 ウチ ドウシュツ ユシュツ 3011 2330 +04 アムロジピン 1935 3040 +09 ランソプラゾール 1509 1890 24 プラバスタチン 1595 1570 +40 ラベプラゾール 1704 1570 16 リマプロストアルファデクス 1273 1660 26 ボグリボース 1013 1300 +21 ドネペジル 15357 1030 +16 その他 タ 3400 15370 +01 主力品 シュリョク ヒン 1975 3520 +35 ウラリット 1134 1970 03 ソレトン 290 1250 +102 カルバン 0 300 +34 ジェネリック医薬品事業 イヤクヒン ジギョウ 2015年3月期 ガツキ 2016年3月期(予想) ガツキ ヨソウ 金額 キンガク 金額 キンガク 増減額 ゾウゲンガク 増減率 ゾウゲン リツ ジェネリック医薬品事業 イヤクヒン ジギョウ 28918 28840 +1003 ジェネリック医薬品(荷離) イヤクヒン ニ バナレ 27400 27430 +999 受託 ジュタク 1518 1410 +1077
Generics Proprietary Products (yenmn) FY2017 FY2018 (Forecast) Amount Amount YOY () Total 32153 31800 (11) Generics 30115 30150 01 To medical institutions 29174 29250 03 To other makers 941 900 (44) Amlodipine 2940 2900 (14) Lansoprazole 2163 1900 (122) Donepezil 1557 1350 (133) Rabeprazole 1558 1350 (134) Limaprost Alfadex 1427 1350 (55) Pravastatine 1147 1100 (41) Voglibose 870 750 (139) Others 18449 19450 54 Proprietary products 2038 1650 (190) Uralyt 1225 1070 (127) Soleton 598 400 (331) Calvan 214 180 (162) Chemiphar ODM Generics (yenmn) FY2017 FY2018 (Forecast) Amount Amount YOY () Total 31100 31350 08 Generics 30115 30150 01 Generics (ODM) 985 1200 218
Income Statement Overview (yenmn) FY2017 FY2018 (Forecast) of of YOY Amount Sales Amount Sales () Net Sales 35331 1000 35500 1000 05 Pharmaceuticals 34279 970 ― ― ― Others 1051 30 ― ― ― Cost of sales 19535 553 ― ― ― SGampA expenses 13947 395 ― ― ― RampD expenses 2280 65 2700 76 184 Operating income 1848 0 52 1100 31 (405) Income before income taxes and minority interests 1777 80 ― ― ― Net income attributble to owners of the parent 1160 33 500 14 (569)
Capital Expenditure and Other (yenmn) Items FY2016 FY2017 Usage Amount Amount YOY () Forecast Rate () Capital expenditure 2928 1645 (438) 1650 997 Depreciation and amortization 1112 1192 72 1250 954 Revised forecast issued on October 31 2017
Cash Flow Statements (yenmn) FY2016 FY2017 Amount Amount Net cash Provided by operating activities 2737 3188 Used in investing activities (2504) (1606) Used in financing activities 787 (1741) Cash and cash equivalents 8084 7890 Free cash flow 232 1582
Per Share Information (yen) FY2016 FY2017 Amount Amount Change Forecast Earnings per share 53002 31528 (21474) 30673 Book value per share 454880 485986 31106 ― Dividend per share 10000 10000 ― 10000 Dividend payout ratio () 189 317 ― 326 Revised forecast issued on October 31 2017
Balance Sheet Data (yenmn) March 31 2017 March 31 2018 March 31 2015 Amount Amount Change Total assets 47002 46814 3358 (187) Return on assets () 63 36 -06 (27) Net assets 17355 17487 1313 132 Owned capital 17346 17474 1312 127 Capital-to-asset ratio () 369 373 02 04 Return on equity () 123 67 (01) (56) Current assets 29009 28334 1630 (674) Current liabilities 14939 14914 (716) (25) Current ratio (x) 194 19 019 (004)
By Main Therapeutic Categories () FY2016 FY2017 Cardiovascular and respiratory drugs 309 320 Digestive organ drugs 196 183 Agents affecting metabolism 164 165 Drugs for nervous system sensory organs 99 91 Antibiotics and chemotherapeutic drugs 65 62 Antineoplastic agents 32 34 Others 135 145
Sales Distribution By Launch Year (yenmn) FY2016 FY2017 Fiscal Year Amount Distrib () Amount Distrib () YOY () 2010 and before 19487 1 667 19194 637 (15) 2009 2011 2348 0 80 2210 73 (59) 2012 1484 0 51 1404 47 (54) 2013 2917 0 100 3127 104 72 2014 1746 0 60 1937 64 110 2015 1001 0 34 1222 41 221 2016 219 0 08 459 15 1091 2017 ― ― 558 19 ― Total 29204 1 1000 30115 1000 31
Generics Proprietary Products (yenmn) FY2016 FY2017 Distrib Distrib YOY Achieved Amount () Amount () () Forecast () Total 31513 1 1000 32153 1 1000 20 32000 1005 Generics 29204 1 927 30115 1 937 31 30000 1 1004 To medical institutions 27808 29174 49 29100 1 1003 To other makers 1395 941 (326) 900 1 1046 Amlodipine 2865 2940 26 2900 1 1014 Lansoprazole 2279 2163 (51) 2100 1 1030 Donepezil 1642 1557 (52) 1600 1 973 Rabeprazole 1586 1558 (18) 1600 1 974 Limaprost Alfadex 1469 1427 (28) 1400 1 1020 Pravastatine 1173 1147 (22) 1100 1 1043 Voglibose 957 870 (91) 900 1 967 Others 17229 18449 71 18400 1 1003 Proprietary products 2308 0 73 2038 0 63 (117) 2000 1 1019 Uralyt 1409 1225 (131) 1200 1 1021 Soleton 679 598 (120) 600 1 997 Calvan 219 214 (21) 200 1 1074 Chemiphar ODM Generics (yenmn) FY2016 FY2017 Distrib Distrib YOY Achieved Amount () Amount () () Forecast () Total 30445 1000 31100 1000 22 31400 990 Generics 29204 959 30115 968 31 30000 1004 Generics (ODM) 1240 41 985 32 (206) 1400 704 Includes exports Revised forecast issued on October 31 2017
Income Statement Overview (yenmn) FY2016 FY2017 of of YOY Achieved Amount Sales Amount Sales () Forecast () Net Sales 35689 1 1000 35331 1 1000 (10) 35500 1 995 Pharmaceuticals 34551 1 968 34279 1 970 (08) ― ― Others 1137 0 32 1051 0 30 (76) ― ― Cost of sales 19449 1 545 19535 1 553 04 ― ― SGampA expenses 13403 0 376 13947 0 395 41 ― ― RampD expenses 1984 0 56 2280 0 65 150 2200 0 1037 Operating income 2836 0 79 1848 0 52 (348) 1800 0 1027 Income before income taxes and minority interests 2849 0 80 1777 0 50 (376) ― ― Net income attributble to owners of the parent 2054 0 58 1160 0 33 (435) 1150 ― 1009 1961 00550933658 00550933658 00575628587 Revised forecast issued on October 31 2017
Per Share Information (yen) FY2017 FY2018 (Forecast) Amount Amount YOY () Earnings per share 31528 13584 (569) Book value per share 485986 ― ― Dividends per share 10000 7500 ― Dividend payout ratio() 317 552 ― Capital Expenditure and Other (yenmn) FY2017 FY2018 (Forecast) Amount Amount Change Capital expenditure 1645 950 (695) Depreciation and amortization 1192 1350 157 2015年3月期 ガツキ 2016年3月期(予想) ガツキ ヨソウ 金額 キンガク 金額 キンガク 増減額 ゾウゲンガク 増減率 ゾウゲン リツ 医療用医薬品 イリョウヨウ イヤクヒン 27400 30950 +05 ジェネリック医薬品(荷離) イヤクヒン ニ バナレ 25079 27430 +01 内自社販売 ウチ ジシャ ハンバイ 2321 25100 +01 内導出輸出 ウチ ドウシュツ ユシュツ 3011 2330 +04 アムロジピン 1935 3040 +09 ランソプラゾール 1509 1890 24 プラバスタチン 1595 1570 +40 ラベプラゾール 1704 1570 16 リマプロストアルファデクス 1273 1660 26 ボグリボース 1013 1300 +21 ドネペジル 15357 1030 +16 その他 タ 3400 15370 +01 主力品 シュリョク ヒン 1975 3520 +35 ウラリット 1134 1970 03 ソレトン 290 1250 +102 カルバン 0 300 +34 ジェネリック医薬品事業 イヤクヒン ジギョウ 2015年3月期 ガツキ 2016年3月期(予想) ガツキ ヨソウ 金額 キンガク 金額 キンガク 増減額 ゾウゲンガク 増減率 ゾウゲン リツ ジェネリック医薬品事業 イヤクヒン ジギョウ 28918 28840 +1003 ジェネリック医薬品(荷離) イヤクヒン ニ バナレ 27400 27430 +999 受託 ジュタク 1518 1410 +1077
Generics Proprietary Products (yenmn) FY2017 FY2018 (Forecast) Amount Amount YOY () Total 32153 31800 (11) Generics 30115 30150 01 To medical institutions 29174 29250 03 To other makers 941 900 (44) Amlodipine 2940 2900 (14) Lansoprazole 2163 1900 (122) Donepezil 1557 1350 (133) Rabeprazole 1558 1350 (134) Limaprost Alfadex 1427 1350 (55) Pravastatine 1147 1100 (41) Voglibose 870 750 (139) Others 18449 19450 54 Proprietary products 2038 1650 (190) Uralyt 1225 1070 (127) Soleton 598 400 (331) Calvan 214 180 (162) Chemiphar ODM Generics (yenmn) FY2017 FY2018 (Forecast) Amount Amount YOY () Total 31100 31350 08 Generics 30115 30150 01 Generics (ODM) 985 1200 218
Income Statement Overview (yenmn) FY2017 FY2018 (Forecast) of of YOY Amount Sales Amount Sales () Net Sales 35331 1000 35500 1000 05 Pharmaceuticals 34279 970 ― ― ― Others 1051 30 ― ― ― Cost of sales 19535 553 ― ― ― SGampA expenses 13947 395 ― ― ― RampD expenses 2280 65 2700 76 184 Operating income 1848 0 52 1100 31 (405) Income before income taxes and minority interests 1777 80 ― ― ― Net income attributble to owners of the parent 1160 33 500 14 (569)
Capital Expenditure and Other (yenmn) Items FY2016 FY2017 Usage Amount Amount YOY () Forecast Rate () Capital expenditure 2928 1645 (438) 1650 997 Depreciation and amortization 1112 1192 72 1250 954 Revised forecast issued on October 31 2017
Cash Flow Statements (yenmn) FY2016 FY2017 Amount Amount Net cash Provided by operating activities 2737 3188 Used in investing activities (2504) (1606) Used in financing activities 787 (1741) Cash and cash equivalents 8084 7890 Free cash flow 232 1582
Per Share Information (yen) FY2016 FY2017 Amount Amount Change Forecast Earnings per share 53002 31528 (21474) 30673 Book value per share 454880 485986 31106 ― Dividend per share 10000 10000 ― 10000 Dividend payout ratio () 189 317 ― 326 Revised forecast issued on October 31 2017
Balance Sheet Data (yenmn) March 31 2017 August 31 2017 March 31 2015 Amount Amount Change Total assets 47002 46814 3358 (187) Return on assets () 63 36 -06 (27) Net assets 17355 17487 1313 132 Owned capital 17346 17474 1312 127 Capital-to-asset ratio () 369 373 02 +04 Return on equity () 123 67 (01) (56) Current assets 29009 28334 1630 (674) Current liabilities 14939 14914 (716) (25) Current ratio (x) 194 19 019 004
By Main Therapeutic Categories () FY2016 FY2017 Cardiovascular and respiratory drugs 309 320 Digestive organ drugs 196 183 Agents affecting metabolism 164 165 Drugs for nervous system sensory organs 99 91 Antibiotics and chemotherapeutic drugs 65 62 Antineoplastic agents 32 34 Others 135 145
Sales Distribution By Launch Year (yenmn) FY2016 FY2017 Fiscal Year Amount Distrib () Amount Distrib () YOY () 2010 and before 19487 1 667 19194 637 (15) 2009 2011 2348 0 80 2210 73 (59) 2012 1484 0 51 1404 47 (54) 2013 2917 0 100 3127 104 72 2014 1746 0 60 1937 64 110 2015 1001 0 34 1222 41 221 2016 219 0 08 459 15 1091 2017 ― ― ― 558 19 ― Total 29204 1 1000 30115 1000 31
Generics Proprietary Products (yenmn) FY2016 FY2017 Distrib Distrib YOY Achieved Amount () Amount () () Forecast () Total 31513 1 1000 32153 1 1000 20 32000 1005 Generics 29204 1 927 30115 1 937 31 30000 1 1004 To medical institutions 27808 29174 49 29100 1 1003 To other makers 1395 941 (326) 900 1 1046 Amlodipine 2865 2940 26 2900 1 1014 Lansoprazole 2279 2163 (51) 2100 1 1030 Donepezil 1642 1557 (52) 1600 1 973 Rabeprazole 1586 1558 (18) 1600 1 974 Limaprost Alfadex 1469 1427 (28) 1400 1 1020 Pravastatine 1173 1147 (22) 1100 1 1043 Voglibose 957 870 (91) 900 1 967 Others 17229 18449 71 18400 1 1003 Proprietary products 2308 0 73 2038 0 63 (117) 2000 1 1019 Uralyt 1409 1225 (131) 1200 1 1021 Soleton 679 598 (120) 600 1 997 Calvan 219 214 (21) 200 1 1074 Chemiphar ODM Generics (yenmn) FY2016 FY2017 Distrib Distrib YOY Achieved Amount () Amount () () Forecast () Total 30445 1000 31100 1000 22 31400 990 Generics 29204 959 30115 968 31 30000 1004 Generics (ODM) 1240 41 985 32 (206) 1400 704 Includes exports Revised forecast issued on October 31 2017
Income Statement Overview (yenmn) FY2016 FY2017 of of YOY Achieved Amount Sales Amount Sales () Forecast () Net Sales 35689 1 1000 35331 1 1000 (10) 35500 1 995 Pharmaceuticals 34551 1 968 34279 1 970 (08) ― ― ― Others 1137 0 32 1051 0 30 (76) ― ― ― Cost of sales 19449 1 545 19535 1 553 04 ― ― ― SGampA expenses 13403 0 376 13947 0 395 41 ― ― ― RampD expenses 1984 0 56 2280 0 65 150 2200 0 1037 Operating income 2836 0 79 1848 0 52 (348) 1800 0 1027 Income before income taxes and minority interests 2849 0 80 1696 0 48 (405) 1700 ― 998 Net income attributble to owners of the parent 2054 0 58 1160 0 33 (435) 1150 ― 1009 1961 00550933658 00550933658 00575628587 Revised forecast issued on October 31 2017
Per Share Information (yen) FY2017 FY2018 (Forecast) Amount Amount YOY () Earnings per share 31528 13584 (569) Book value per share 485986 ― ― Dividends per share 10000 7500 ― Dividend payout ratio() 317 552 ― Capital Expenditure and Other (yenmn) FY2017 FY2018 (Forecast) Amount Amount Change Capital expenditure 1645 950 (695) Depreciation and amortization 1192 1350 157 2015年3月期 ガツキ 2016年3月期(予想) ガツキ ヨソウ 金額 キンガク 金額 キンガク 増減額 ゾウゲンガク 増減率 ゾウゲン リツ 医療用医薬品 イリョウヨウ イヤクヒン 27400 30950 +05 ジェネリック医薬品(荷離) イヤクヒン ニ バナレ 25079 27430 +01 内自社販売 ウチ ジシャ ハンバイ 2321 25100 +01 内導出輸出 ウチ ドウシュツ ユシュツ 3011 2330 +04 アムロジピン 1935 3040 +09 ランソプラゾール 1509 1890 24 プラバスタチン 1595 1570 +40 ラベプラゾール 1704 1570 16 リマプロストアルファデクス 1273 1660 26 ボグリボース 1013 1300 +21 ドネペジル 15357 1030 +16 その他 タ 3400 15370 +01 主力品 シュリョク ヒン 1975 3520 +35 ウラリット 1134 1970 03 ソレトン 290 1250 +102 カルバン 0 300 +34 ジェネリック医薬品事業 イヤクヒン ジギョウ 2015年3月期 ガツキ 2016年3月期(予想) ガツキ ヨソウ 金額 キンガク 金額 キンガク 増減額 ゾウゲンガク 増減率 ゾウゲン リツ ジェネリック医薬品事業 イヤクヒン ジギョウ 28918 28840 +1003 ジェネリック医薬品(荷離) イヤクヒン ニ バナレ 27400 27430 +999 受託 ジュタク 1518 1410 +1077
Generics Proprietary Products (yenmn) FY2017 FY2018 (Forecast) Amount Amount YOY () Total 32153 31800 (11) Generics 30115 30150 01 To medical institutions 29174 29250 03 To other makers 941 900 (44) Amlodipine 2940 2900 (14) Lansoprazole 2163 1900 (122) Donepezil 1557 1350 (133) Rabeprazole 1558 1350 (134) Limaprost Alfadex 1427 1350 (55) Pravastatine 1147 1100 (41) Voglibose 870 750 (139) Others 18449 19450 54 Proprietary products 2038 1650 (190) Uralyt 1225 1070 (127) Soleton 598 400 (331) Calvan 214 180 (162) Chemiphar ODM Generics (yenmn) FY2017 FY2018 (Forecast) Amount Amount YOY () Total 31100 31350 08 Generics 30115 30150 01 Generics (ODM) 985 1200 218
Income Statement Overview (yenmn) FY2017 FY2018 (Forecast) of of YOY Amount Sales Amount Sales () Net Sales 35331 1000 35500 1000 05 Pharmaceuticals 34279 970 ― ― ― Others 1051 30 ― ― ― Cost of sales 19535 553 ― ― ― SGampA expenses 13947 395 ― ― ― RampD expenses 2280 65 2700 76 184 Operating income 1848 0 52 1100 31 (405) Income before income taxes and minority interests 1777 80 ― ― ― Net income attributble to owners of the parent 1160 33 500 14 (569)
Capital Expenditure and Other (yenmn) Items FY2016 FY2017 Usage Amount Amount YOY () Forecast Rate () Capital expenditure 2928 1645 (438) 1650 997 Depreciation and amortization 1112 1192 72 1250 954 Revised forecast issued on October 31 2017
Cash Flow Statements (yenmn) FY2016 FY2017 Amount Amount Net cash Provided by operating activities 2737 3188 Used in investing activities (2504) (1606) Used in financing activities 787 (1741) Cash and cash equivalents 8084 7890 Free cash flow 232 1582
Per Share Information (yen) FY2016 FY2017 Amount Amount Change Forecast Earnings per share 53002 31528 (21474) 30673 Book value per share 454880 485986 31106 ― Dividend per share 10000 10000 ― 10000 Dividend payout ratio () 189 317 ― 326 Revised forecast issued on October 31 2017
Balance Sheet Data (yenmn) March 31 2017 August 31 2017 March 31 2015 Amount Amount Change Total assets 47002 46814 3358 (187) Return on assets () 63 36 -06 (27) Net assets 17355 17487 1313 132 Owned capital 17346 17474 1312 127 Capital-to-asset ratio () 369 373 02 +04 Return on equity () 123 67 (01) (56) Current assets 29009 28334 1630 (674) Current liabilities 14939 14914 (716) (25) Current ratio (x) 194 19 019 004
By Main Therapeutic Categories () FY2016 FY2017 Cardiovascular and respiratory drugs 309 320 Digestive organ drugs 196 183 Agents affecting metabolism 164 165 Drugs for nervous system sensory organs 99 91 Antibiotics and chemotherapeutic drugs 65 62 Antineoplastic agents 32 34 Others 135 145
Sales Distribution By Launch Year (yenmn) FY2016 FY2017 Fiscal Year Amount Distrib () Amount Distrib () YOY () 2010 and before 19487 1 667 19194 637 (15) 2009 2011 2348 0 80 2210 73 (59) 2012 1484 0 51 1404 47 (54) 2013 2917 0 100 3127 104 72 2014 1746 0 60 1937 64 110 2015 1001 0 34 1222 41 221 2016 219 0 08 459 15 1091 2017 ― ― 558 19 ― Total 29204 1 1000 30115 1000 31
Generics Proprietary Products (yenmn) FY2016 FY2017 Distrib Distrib YOY Achieved Amount () Amount () () Forecast () Total 31513 1 1000 32153 1 1000 20 32000 1005 Generics 29204 1 927 30115 1 937 31 30000 1 1004 To medical institutions 27808 29174 49 29100 1 1003 To other makers 1395 941 (326) 900 1 1046 Amlodipine 2865 2940 26 2900 1 1014 Lansoprazole 2279 2163 (51) 2100 1 1030 Donepezil 1642 1557 (52) 1600 1 973 Rabeprazole 1586 1558 (18) 1600 1 974 Limaprost Alfadex 1469 1427 (28) 1400 1 1020 Pravastatine 1173 1147 (22) 1100 1 1043 Voglibose 957 870 (91) 900 1 967 Others 17229 18449 71 18400 1 1003 Proprietary products 2308 0 73 2038 0 63 (117) 2000 1 1019 Uralyt 1409 1225 (131) 1200 1 1021 Soleton 679 598 (120) 600 1 997 Calvan 219 214 (21) 200 1 1074 Chemiphar ODM Generics (yenmn) FY2016 FY2017 Distrib Distrib YOY Achieved Amount () Amount () () Forecast () Total 30445 1000 31100 1000 22 31400 990 Generics 29204 959 30115 968 31 30000 1004 Generics (ODM) 1240 41 985 32 (206) 1400 704 Includes exports Revised forecast issued on October 31 2017
Income Statement Overview (yenmn) FY2016 FY2017 of of YOY Achieved Amount Sales Amount Sales () Forecast () Net Sales 35689 1 1000 35331 1 1000 (10) 35500 1 995 Pharmaceuticals 34551 1 968 34279 1 970 (08) ― ― Others 1137 0 32 1051 0 30 (76) ― ― Cost of sales 19449 1 545 19535 1 553 04 ― ― SGampA expenses 13403 0 376 13947 0 395 41 ― ― RampD expenses 1984 0 56 2280 0 65 150 2200 0 1037 Operating income 2836 0 79 1848 0 52 (348) 1800 0 1027 Income before income taxes and minority interests 2849 0 80 1696 0 48 (405) 1700 ― 998 Net income attributble to owners of the parent 2054 0 58 1160 0 33 (435) 1150 ― 1009 1961 00550933658 00550933658 00575628587 Revised forecast issued on October 31 2017
Per Share Information (yen) FY2017 FY2018 (Forecast) Amount Amount YOY () Earnings per share 31528 13584 (569) Book value per share 485986 ― ― Dividends per share 10000 7500 ― Dividend payout ratio() 317 552 ― Capital Expenditure and Other (yenmn) FY2017 FY2018 (Forecast) Amount Amount Change Capital expenditure 1645 950 (695) Depreciation and amortization 1192 1350 157 2015年3月期 ガツキ 2016年3月期(予想) ガツキ ヨソウ 金額 キンガク 金額 キンガク 増減額 ゾウゲンガク 増減率 ゾウゲン リツ 医療用医薬品 イリョウヨウ イヤクヒン 27400 30950 +05 ジェネリック医薬品(荷離) イヤクヒン ニ バナレ 25079 27430 +01 内自社販売 ウチ ジシャ ハンバイ 2321 25100 +01 内導出輸出 ウチ ドウシュツ ユシュツ 3011 2330 +04 アムロジピン 1935 3040 +09 ランソプラゾール 1509 1890 24 プラバスタチン 1595 1570 +40 ラベプラゾール 1704 1570 16 リマプロストアルファデクス 1273 1660 26 ボグリボース 1013 1300 +21 ドネペジル 15357 1030 +16 その他 タ 3400 15370 +01 主力品 シュリョク ヒン 1975 3520 +35 ウラリット 1134 1970 03 ソレトン 290 1250 +102 カルバン 0 300 +34 ジェネリック医薬品事業 イヤクヒン ジギョウ 2015年3月期 ガツキ 2016年3月期(予想) ガツキ ヨソウ 金額 キンガク 金額 キンガク 増減額 ゾウゲンガク 増減率 ゾウゲン リツ ジェネリック医薬品事業 イヤクヒン ジギョウ 28918 28840 +1003 ジェネリック医薬品(荷離) イヤクヒン ニ バナレ 27400 27430 +999 受託 ジュタク 1518 1410 +1077
Generics Proprietary Products (yenmn) FY2017 FY2018 (Forecast) Amount Amount YOY () Total 32153 31800 (11) Generics 30115 30150 01 To medical institutions 29174 29250 03 To other makers 941 900 (44) Amlodipine 2940 2900 (14) Lansoprazole 2163 1900 (122) Donepezil 1557 1350 (133) Rabeprazole 1558 1350 (134) Limaprost Alfadex 1427 1350 (55) Pravastatine 1147 1100 (41) Voglibose 870 750 (139) Others 18449 19450 54 Proprietary products 2038 1650 (190) Uralyt 1225 1070 (127) Soleton 598 400 (331) Calvan 214 180 (162) Chemiphar ODM Generics (yenmn) FY2017 FY2018 (Forecast) Amount Amount YOY () Total 31100 31350 08 Generics 30115 30150 01 Generics (ODM) 985 1200 218
Income Statement Overview (yenmn) FY2017 FY2018 (Forecast) of of YOY Amount Sales Amount Sales () Net Sales 35331 1000 35500 1000 05 Pharmaceuticals 34279 970 ― ― ― Others 1051 30 ― ― ― Cost of sales 19535 553 ― ― ― SGampA expenses 13947 395 ― ― ― RampD expenses 2280 65 2700 76 184 Operating income 1848 0 52 1100 31 (405) Income before income taxes and minority interests 1777 80 ― ― ― Net income attributble to owners of the parent 1160 33 500 14 (569)
Capital Expenditure and Other (yenmn) Items FY2016 FY2017 Usage Amount Amount YOY () Forecast Rate () Capital expenditure 2928 1645 (438) 1650 997 Depreciation and amortization 1112 1192 72 1250 954 Revised forecast issued on October 31 2017
Cash Flow Statements (yenmn) FY2016 FY2017 Amount Amount Net cash Provided by operating activities 2737 3188 Used in investing activities (2504) (1606) Used in financing activities 787 (1741) Cash and cash equivalents 8084 7890 Free cash flow 232 1582
Per Share Information (yen) FY2016 FY2017 Amount Amount Change Forecast Earnings per share 53002 31528 (21474) 30673 Book value per share 454880 485986 31106 ― Dividend per share 10000 10000 ― 10000 Dividend payout ratio () 189 317 ― 326 Revised forecast issued on October 31 2017
Balance Sheet Data (yenmn) March 31 2017 August 31 2017 March 31 2015 Amount Amount Change Total assets 47002 46814 3358 (187) Return on assets () 63 36 -06 (27) Net assets 17355 17487 1313 132 Owned capital 17346 17474 1312 127 Capital-to-asset ratio () 369 373 02 +04 Return on equity () 123 67 (01) (56) Current assets 29009 28334 1630 (674) Current liabilities 14939 14914 (716) (25) Current ratio (x) 194 19 019 004
By Main Therapeutic Categories () FY2016 FY2017 Cardiovascular and respiratory drugs 309 320 Digestive organ drugs 196 183 Agents affecting metabolism 164 165 Drugs for nervous system sensory organs 99 91 Antibiotics and chemotherapeutic drugs 65 62 Antineoplastic agents 32 34 Others 135 145
Sales Distribution By Launch Year (yenmn) FY2016 FY2017 Fiscal Year Amount Distrib () Amount Distrib () YOY () 2010 and before 19487 1 667 19194 637 (15) 2009 2011 2348 0 80 2210 73 (59) 2012 1484 0 51 1404 47 (54) 2013 2917 0 100 3127 104 72 2014 1746 0 60 1937 64 110 2015 1001 0 34 1222 41 221 2016 219 0 08 459 15 1091 2017 ― ― ― 558 19 ― Total 29204 1 1000 30115 1000 31
Generics Proprietary Products (yenmn) FY2016 FY2017 Distrib Distrib YOY Achieved Amount () Amount () () Forecast () Total 31513 1 1000 32153 1 1000 20 32000 1005 Generics 29204 1 927 30115 1 937 31 30000 1 1004 To medical institutions 27808 29174 49 29100 1 1003 To other makers 1395 941 (326) 900 1 1046 Amlodipine 2865 2940 26 2900 1 1014 Lansoprazole 2279 2163 (51) 2100 1 1030 Donepezil 1642 1557 (52) 1600 1 973 Rabeprazole 1586 1558 (18) 1600 1 974 Limaprost Alfadex 1469 1427 (28) 1400 1 1020 Pravastatine 1173 1147 (22) 1100 1 1043 Voglibose 957 870 (91) 900 1 967 Others 17229 18449 71 18400 1 1003 Proprietary products 2308 0 73 2038 0 63 (117) 2000 1 1019 Uralyt 1409 1225 (131) 1200 1 1021 Soleton 679 598 (120) 600 1 997 Calvan 219 214 (21) 200 1 1074 Chemiphar ODM Generics (yenmn) FY2016 FY2017 Distrib Distrib YOY Achieved Amount () Amount () () Forecast () Total 30445 1000 31100 1000 22 31400 990 Generics 29204 959 30115 968 31 30000 1004 Generics (ODM) 1240 41 985 32 (206) 1400 704 Includes exports Revised forecast issued on October 31 2017
Income Statement Overview (yenmn) FY2016 FY2017 of of YOY Achieved Amount Sales Amount Sales () Forecast () Net Sales 35689 1 1000 35331 1 1000 (10) 35500 1 995 Pharmaceuticals 34551 1 968 34279 1 970 (08) ― ― ― Others 1137 0 32 1051 0 30 (76) ― ― ― Cost of sales 19449 1 545 19535 1 553 04 ― ― ― SGampA expenses 13403 0 376 13947 0 395 41 ― ― ― RampD expenses 1984 0 56 2280 0 65 150 2200 0 1037 Operating income 2836 0 79 1848 0 52 (348) 1800 0 1027 Income before income taxes and minority interests 2849 0 80 1696 0 48 (405) 1700 ― 998 Net income attributble to owners of the parent 2054 0 58 1160 0 33 (435) 1150 ― 1009 1961 00550933658 00550933658 00575628587 Revised forecast issued on October 31 2017
Per Share Information (yen) FY2017 FY2018 (Forecast) Amount Amount YOY () Earnings per share 31528 13584 (569) Book value per share 485986 ― ― Dividends per share 10000 7500 ― Dividend payout ratio() 317 552 ― Capital Expenditure and Other (yenmn) FY2017 FY2018 (Forecast) Amount Amount Change Capital expenditure 1645 950 (695) Depreciation and amortization 1192 1350 157 2015年3月期 ガツキ 2016年3月期(予想) ガツキ ヨソウ 金額 キンガク 金額 キンガク 増減額 ゾウゲンガク 増減率 ゾウゲン リツ 医療用医薬品 イリョウヨウ イヤクヒン 27400 30950 +05 ジェネリック医薬品(荷離) イヤクヒン ニ バナレ 25079 27430 +01 内自社販売 ウチ ジシャ ハンバイ 2321 25100 +01 内導出輸出 ウチ ドウシュツ ユシュツ 3011 2330 +04 アムロジピン 1935 3040 +09 ランソプラゾール 1509 1890 24 プラバスタチン 1595 1570 +40 ラベプラゾール 1704 1570 16 リマプロストアルファデクス 1273 1660 26 ボグリボース 1013 1300 +21 ドネペジル 15357 1030 +16 その他 タ 3400 15370 +01 主力品 シュリョク ヒン 1975 3520 +35 ウラリット 1134 1970 03 ソレトン 290 1250 +102 カルバン 0 300 +34 ジェネリック医薬品事業 イヤクヒン ジギョウ 2015年3月期 ガツキ 2016年3月期(予想) ガツキ ヨソウ 金額 キンガク 金額 キンガク 増減額 ゾウゲンガク 増減率 ゾウゲン リツ ジェネリック医薬品事業 イヤクヒン ジギョウ 28918 28840 +1003 ジェネリック医薬品(荷離) イヤクヒン ニ バナレ 27400 27430 +999 受託 ジュタク 1518 1410 +1077
Generics Proprietary Products (yenmn) FY2017 FY2018 (Forecast) Amount Amount YOY () Total 32153 31800 (11) Generics 30115 30150 01 To medical institutions 29174 29250 03 To other makers 941 900 (44) Amlodipine 2940 2900 (14) Lansoprazole 2163 1900 (122) Donepezil 1557 1350 (133) Rabeprazole 1558 1350 (134) Limaprost Alfadex 1427 1350 (55) Pravastatine 1147 1100 (41) Voglibose 870 750 (139) Others 18449 19450 54 Proprietary products 2038 1650 (190) Uralyt 1225 1070 (127) Soleton 598 400 (331) Calvan 214 180 (162) Chemiphar ODM Generics (yenmn) FY2017 FY2018 (Forecast) Amount Amount YOY () Total 31100 31350 08 Generics 30115 30150 01 Generics (ODM) 985 1200 218
Income Statement Overview (yenmn) FY2017 FY2018 (Forecast) of of YOY Amount Sales Amount Sales () Net Sales 35331 1000 35500 1000 05 Pharmaceuticals 34279 970 ― ― ― Others 1051 30 ― ― ― Cost of sales 19535 553 ― ― ― SGampA expenses 13947 395 ― ― ― RampD expenses 2280 65 2700 76 184 Operating income 1848 0 52 1100 31 (405) Income before income taxes and minority interests 1777 80 ― ― ― Net income attributble to owners of the parent 1160 33 500 14 (569)
Capital Expenditure and Other (yenmn) Items FY2016 FY2017 Usage Amount Amount YOY () Forecast Rate () Capital expenditure 2928 1645 (438) 1650 997 Depreciation and amortization 1112 1192 72 1250 954 Revised forecast issued on October 31 2017
Cash Flow Statements (yenmn) FY2016 FY2017 Amount Amount Net cash Provided by operating activities 2737 3188 Used in investing activities (2504) (1606) Used in financing activities 787 (1741) Cash and cash equivalents 8084 7890 Free cash flow 232 1582
Per Share Information (yen) FY2016 FY2017 Amount Amount Change Forecast Earnings per share 53002 31528 (21474) 30673 Book value per share 454880 485986 31106 ― Dividend per share 10000 10000 ― 10000 Dividend payout ratio () 189 317 ― 326 Revised forecast issued on October 31 2017
Balance Sheet Data (yenmn) March 31 2017 August 31 2017 March 31 2015 Amount Amount Change Total assets 47002 46814 3358 (187) Return on assets () 63 36 -06 (27) Net assets 17355 17487 1313 132 Owned capital 17346 17474 1312 127 Capital-to-asset ratio () 369 373 02 +04 Return on equity () 123 67 (01) (56) Current assets 29009 28334 1630 (674) Current liabilities 14939 14914 (716) (25) Current ratio (x) 194 19 019 004
By Main Therapeutic Categories () FY2016 FY2017 Cardiovascular and respiratory drugs 309 320 Digestive organ drugs 196 183 Agents affecting metabolism 164 165 Drugs for nervous system sensory organs 99 91 Antibiotics and chemotherapeutic drugs 65 62 Antineoplastic agents 32 34 Others 135 145
Sales Distribution By Launch Year (yenmn) FY2016 FY2017 Fiscal Year Amount Distrib () Amount Distrib () YOY () 2010 and before 19487 1 667 19194 637 (15) 2009 2011 2348 0 80 2210 73 (59) 2012 1484 0 51 1404 47 (54) 2013 2917 0 100 3127 104 72 2014 1746 0 60 1937 64 110 2015 1001 0 34 1222 41 221 2016 219 0 08 459 15 1091 2017 ― ― ― 558 19 ― Total 29204 1 1000 30115 1000 31
Generics Proprietary Products (yenmn) FY2016 FY2017 Distrib Distrib YOY Achieved Amount () Amount () () Forecast () Total 31513 1 1000 32153 1 1000 20 32000 1005 Generics 29204 1 927 30115 1 937 31 30000 1 1004 To medical institutions 27808 29174 49 29100 1 1003 To other makers 1395 941 (326) 900 1 1046 Amlodipine 2865 2940 26 2900 1 1014 Lansoprazole 2279 2163 (51) 2100 1 1030 Donepezil 1642 1557 (52) 1600 1 973 Rabeprazole 1586 1558 (18) 1600 1 974 Limaprost Alfadex 1469 1427 (28) 1400 1 1020 Pravastatine 1173 1147 (22) 1100 1 1043 Voglibose 957 870 (91) 900 1 967 Others 17229 18449 71 18400 1 1003 Proprietary products 2308 0 73 2038 0 63 (117) 2000 1 1019 Uralyt 1409 1225 (131) 1200 1 1021 Soleton 679 598 (120) 600 1 997 Calvan 219 214 (21) 200 1 1074 Chemiphar ODM Generics (yenmn) FY2016 FY2017 Distrib Distrib YOY Achieved Amount () Amount () () Forecast () Total 30445 1000 31100 1000 22 31400 990 Generics 29204 959 30115 968 31 30000 1004 Generics (ODM) 1240 41 985 32 (206) 1400 704 Includes exports Revised forecast issued on October 31 2017
Income Statement Overview (yenmn) FY2016 FY2017 of of YOY Achieved Amount Sales Amount Sales () Forecast () Net Sales 35689 1 1000 35331 1 1000 (10) 35500 1 995 Pharmaceuticals 34551 1 968 34279 1 970 (08) ― ― ― Others 1137 0 32 1051 0 30 (76) ― ― ― Cost of sales 19449 1 545 19535 1 553 04 ― ― ― SGampA expenses 13403 0 376 13947 0 395 41 ― ― ― RampD expenses 1984 0 56 2280 0 65 150 2200 0 1037 Operating income 2836 0 79 1848 0 52 (348) 1800 0 1027 Income before income taxes and minority interests 2849 0 80 1696 0 48 (405) 1700 ― 998 Net income attributble to owners of the parent 2054 0 58 1160 0 33 (435) 1150 ― 1009 1961 00550933658 00550933658 00575628587 Revised forecast issued on October 31 2017
Per Share Information (yen) FY2017 FY2018 (Forecast) Amount Amount YOY () Earnings per share 31528 13584 (569) Book value per share 485986 ― ― Dividends per share 10000 7500 ― Dividend payout ratio() 317 552 ― Capital Expenditure and Other (yenmn) FY2017 FY2018 (Forecast) Amount Amount Change Capital expenditure 1645 950 (695) Depreciation and amortization 1192 1350 157 2015年3月期 ガツキ 2016年3月期(予想) ガツキ ヨソウ 金額 キンガク 金額 キンガク 増減額 ゾウゲンガク 増減率 ゾウゲン リツ 医療用医薬品 イリョウヨウ イヤクヒン 27400 30950 +05 ジェネリック医薬品(荷離) イヤクヒン ニ バナレ 25079 27430 +01 内自社販売 ウチ ジシャ ハンバイ 2321 25100 +01 内導出輸出 ウチ ドウシュツ ユシュツ 3011 2330 +04 アムロジピン 1935 3040 +09 ランソプラゾール 1509 1890 24 プラバスタチン 1595 1570 +40 ラベプラゾール 1704 1570 16 リマプロストアルファデクス 1273 1660 26 ボグリボース 1013 1300 +21 ドネペジル 15357 1030 +16 その他 タ 3400 15370 +01 主力品 シュリョク ヒン 1975 3520 +35 ウラリット 1134 1970 03 ソレトン 290 1250 +102 カルバン 0 300 +34 ジェネリック医薬品事業 イヤクヒン ジギョウ 2015年3月期 ガツキ 2016年3月期(予想) ガツキ ヨソウ 金額 キンガク 金額 キンガク 増減額 ゾウゲンガク 増減率 ゾウゲン リツ ジェネリック医薬品事業 イヤクヒン ジギョウ 28918 28840 +1003 ジェネリック医薬品(荷離) イヤクヒン ニ バナレ 27400 27430 +999 受託 ジュタク 1518 1410 +1077
Generics Proprietary Products (yenmn) FY2017 FY2018 (Forecast) Amount Amount YOY () Total 32153 31800 (11) Generics 30115 30150 01 To medical institutions 29174 29250 03 To other makers 941 900 (44) Amlodipine 2940 2900 (14) Lansoprazole 2163 1900 (122) Donepezil 1557 1350 (133) Rabeprazole 1558 1350 (134) Limaprost Alfadex 1427 1350 (55) Pravastatine 1147 1100 (41) Voglibose 870 750 (139) Others 18449 19450 54 Proprietary products 2038 1650 (190) Uralyt 1225 1070 (127) Soleton 598 400 (331) Calvan 214 180 (162) Chemiphar ODM Generics (yenmn) FY2017 FY2018 (Forecast) Amount Amount YOY () Total 31100 31350 08 Generics 30115 30150 01 Generics (ODM) 985 1200 218
Income Statement Overview (yenmn) FY2017 FY2018 (Forecast) of of YOY Amount Sales Amount Sales () Net Sales 35331 1000 35500 1000 05 Pharmaceuticals 34279 970 ― ― ― Others 1051 30 ― ― ― Cost of sales 19535 553 ― ― ― SGampA expenses 13947 395 ― ― ― RampD expenses 2280 65 2700 76 184 Operating income 1848 0 52 1100 31 (405) Income before income taxes and minority interests 1777 80 ― ― ― Net income attributble to owners of the parent 1160 33 500 14 (569)
Capital Expenditure and Other (yenmn) Items FY2016 FY2017 Usage Amount Amount YOY () Forecast Rate () Capital expenditure 2928 1645 (438) 1650 997 Depreciation and amortization 1112 1192 72 1250 954 Revised forecast issued on October 31 2017
Cash Flow Statements (yenmn) FY2016 FY2017 Amount Amount Net cash Provided by operating activities 2737 3188 Used in investing activities (2504) (1606) Used in financing activities 787 (1741) Cash and cash equivalents 8084 7890 Free cash flow 232 1582
Per Share Information (yen) FY2016 FY2017 Amount Amount Change Forecast Earnings per share 53002 31528 (21474) 30673 Book value per share 454880 485986 31106 ― Dividend per share 10000 10000 ― 10000 Dividend payout ratio () 189 317 ― 326 Revised forecast issued on October 31 2017
Balance Sheet Data (yenmn) March 31 2017 August 31 2017 March 31 2015 Amount Amount Change Total assets 47002 46814 3358 (187) Return on assets () 63 36 -06 (27) Net assets 17355 17487 1313 132 Owned capital 17346 17474 1312 127 Capital-to-asset ratio () 369 373 02 +04 Return on equity () 123 67 (01) (56) Current assets 29009 28334 1630 (674) Current liabilities 14939 14914 (716) (25) Current ratio (x) 194 19 019 004
By Main Therapeutic Categories () FY2016 FY2017 Cardiovascular and respiratory drugs 309 320 Digestive organ drugs 196 183 Agents affecting metabolism 164 165 Drugs for nervous system sensory organs 99 91 Antibiotics and chemotherapeutic drugs 65 62 Antineoplastic agents 32 34 Others 135 145
Sales Distribution By Launch Year (yenmn) FY2016 FY2017 Fiscal Year Amount Distrib () Amount Distrib () YOY () 2010 and before 19487 1 667 19194 637 (15) 2009 2011 2348 0 80 2210 73 (59) 2012 1484 0 51 1404 47 (54) 2013 2917 0 100 3127 104 72 2014 1746 0 60 1937 64 110 2015 1001 0 34 1222 41 221 2016 219 0 08 459 15 1091 2017 ― ― 558 19 ― Total 29204 1 1000 30115 1000 31
Generics Proprietary Products (yenmn) FY2016 FY2017 Distrib Distrib YOY Achieved Amount () Amount () () Forecast () Total 31513 1 1000 32153 1 1000 20 32000 1005 Generics 29204 1 927 30115 1 937 31 30000 1 1004 To medical institutions 27808 29174 49 29100 1 1003 To other makers 1395 941 (326) 900 1 1046 Amlodipine 2865 2940 26 2900 1 1014 Lansoprazole 2279 2163 (51) 2100 1 1030 Donepezil 1642 1557 (52) 1600 1 973 Rabeprazole 1586 1558 (18) 1600 1 974 Limaprost Alfadex 1469 1427 (28) 1400 1 1020 Pravastatine 1173 1147 (22) 1100 1 1043 Voglibose 957 870 (91) 900 1 967 Others 17229 18449 71 18400 1 1003 Proprietary products 2308 0 73 2038 0 63 (117) 2000 1 1019 Uralyt 1409 1225 (131) 1200 1 1021 Soleton 679 598 (120) 600 1 997 Calvan 219 214 (21) 200 1 1074 Chemiphar ODM Generics (yenmn) FY2016 FY2017 Distrib Distrib YOY Achieved Amount () Amount () () Forecast () Total 30445 1000 31100 1000 22 31400 990 Generics 29204 959 30115 968 31 30000 1004 Generics (ODM) 1240 41 985 32 (206) 1400 704 Includes exports Revised forecast issued on October 31 2017
Income Statement Overview (yenmn) FY2016 FY2017 of of YOY Achieved Amount Sales Amount Sales () Forecast () Net Sales 35689 1 1000 35331 1 1000 (10) 35500 1 995 Pharmaceuticals 34551 1 968 34279 1 970 (08) ― ― Others 1137 0 32 1051 0 30 (76) ― ― Cost of sales 19449 1 545 19535 1 553 04 ― ― SGampA expenses 13403 0 376 13947 0 395 41 ― ― RampD expenses 1984 0 56 2280 0 65 150 2200 0 1037 Operating income 2836 0 79 1848 0 52 (348) 1800 0 1027 Income before income taxes and minority interests 2849 0 80 1777 0 50 (376) ― ― Net income attributble to owners of the parent 2054 0 58 1160 0 33 (435) 1150 ― 1009 1961 00550933658 00550933658 00575628587 Revised forecast issued on October 31 2017
Page 4
Sales Income
3
(yenmn)
of of YOY AchievedAmount Sales Amount Sales () Forecast ()
Net Sales 35689 1000 35331 1000 (10) 35500 995 Pharmaceuticals 34551 968 34279 970 (08) ― ― Others 1137 32 1051 30 (76) ― ―Cost of sales 19449 545 19535 553 04 ― ―SGampA expenses 13403 376 13947 395 41 ― ― RampD expenses 1984 56 2280 65 150 2200 1037Operating income 2836 79 1848 52 (348) 1800 1027
2849 80 1777 50 (376) ― ―
2054 58 1160 33 (435) 1150― 1009 Revised forecast issued on October 31 2017
Net income attributble to owners of the parent
FY2016 FY2017
Income before income taxes and minority interests
SalesFor generic drugs the overall speed of replacement has slowed as substitution rates centered on products with large markets neared government targets In addition due to the rise of authorized generics and increasingly fierce price competition profits in this market are being squeezed For Nippon Chemiphar sales to other makers did not grow as expected because orders from our existing business partners were not as large as anticipated On the other hand sales to medical institutions increased 49 YOY due to newly launched products and the expansion of sales channels mainly by our subsidiary As a result our generic sales increased 31 YOY
Although sales of proprietary products declined 117 the results were in line with our forecasts which included factors such as the impact of substitutions for generic drugs
For the above reasons our sales of ethical pharmaceuticals were yen32153 million (up 20 YOY) and total sales of pharmaceutical products including businesses such as diagnostics were yen34279 million (down 08 YOY)
As a result consolidated sales including other segments were yen 35331 million (down 10 YOY)
Operating incomeDuring FY2017 the cost of sales ratio rose 08 percentage points YOY due to factors including adjusted production volumes of products manufactured within the Nippon Chemiphar Group In addition SGampA expenses ratio rose 19 percentage points YOY to 395 This was due mainly to an increase in upfront strategic expenses such as trial costs ahead of the commencement of commercial production at the Vietnam factory (scheduled for the second half of FY 2018) as well as increased research and development expenses for new and generic drugs As a result operating income was yen1848 million (down 348 YOY)
PL 医薬品① 医薬品② 医薬品③ BS① BS③ 和文にある「前年同期間比」「前期3月末比」は記載が難しく英語版では必要度の低い情報であるとみなして記載をしないこととなった2016年2Q~(木村)ただし期末では記載が可能なので書きます(須田)
CF CAP EX 業績予想① 英語版では経常利益は書かないので注意(須田)
業績予想 ② 業績予想③ Pharmaceutical Sales
4
Generics Proprietary Products (yenmn)
Distrib Distrib YOY AchievedAmount () Amount () () Forecast ()
Total 31513 1000 32153 1000 20 32000 1005 Generics 29204 927 30115 937 31 30000 1004 To medical institutions 27808 29174 49 29100 1003 To other makers 1395 941 (326) 900 1046 Amlodipine 2865 2940 26 2900 1014 Lansoprazole 2279 2163 (51) 2100 1030 Donepezil 1642 1557 (52) 1600 973 Rabeprazole 1586 1558 (18) 1600 974 Limaprost Alfadex 1469 1427 (28) 1400 1020 Pravastatine 1173 1147 (22) 1100 1043 Voglibose 957 870 (91) 900 967 Others 17229 18449 71 18400 1003 Proprietary products 2308 73 2038 63 (117) 2000 1019 Uralyt 1409 1225 (131) 1200 1021 Soleton 679 598 (120) 600 997 Calvan 219 214 (21) 200 1074
Chemiphar ODM Generics (yenmn)
Distrib Distrib YOY AchievedAmount () Amount () () Forecast ()
Total 30445 1000 31100 1000 22 31400 990 Generics 29204 959 30115 968 31 30000 1004 Generics (ODM) 1240 41 985 32 (206) 1400 704 Includes exports Revised forecast issued on October 31 2017
FY2017
FY2016
FY2016
FY2017
PL 医薬品① 医薬品② 医薬品③ BS① BS③ 和文にある「前年同期間比」「前期3月末比」は記載が難しく英語版では必要度の低い情報であるとみなして記載をしないこととなった2016年2Q~(木村)ただし期末では記載が可能なので書きます(須田)
CF CAP EX 業績予想① 英語版では経常利益は書かないので注意(須田)
業績予想 ② 業績予想③ Sales Distribution
5
By Main Therapeutic Categories ()FY2016 FY2017
Cardiovascular and respiratory drugs 309 320Digestive organ drugs 196 183Agents affecting metabolism 164 165Drugs for nervous system sensory organs 99 91Antibiotics and chemotherapeutic drugs 65 62Antineoplastic agents 32 34Others 135 145
By Launch Year (yenmn)
Fiscal Year AmountDistrib
() AmountDistrib
() YOY ()2010 and before 19487 667 19194 637 (15)2011 2348 80 2210 73 (59)2012 1484 51 1404 47 (54)2013 2917 100 3127 104 722014 1746 60 1937 64 1102015 1001 34 1222 41 2212016 219 08 459 15 10912017 ― ― 558 19 ―Total 29204 1000 30115 1000 31
FY2016 FY2017
PL 医薬品① 医薬品② 医薬品③ BS① BS③ 和文にある「前年同期間比」「前期3月末比」は記載が難しく英語版では必要度の低い情報であるとみなして記載をしないこととなった2016年2Q~(木村)ただし期末では記載が可能なので書きます(須田)
CF CAP EX 業績予想① 英語版では経常利益は書かないので注意(須田)
業績予想 ② 業績予想③ PL 医薬品① 医薬品② 医薬品③ BS① BS③ 和文にある「前年同期間比」「前期3月末比」は記載が難しく英語版では必要度の低い情報であるとみなして記載をしないこととなった2016年2Q~(木村)ただし期末では記載が可能なので書きます(須田)
CF CAP EX 業績予想① 英語版では経常利益は書かないので注意(須田)
業績予想 ② 業績予想③ Balance Sheet per Share Information
6
Per Share Information (yen)FY2016Amount Amount Change Forecast
Earnings per share 53002 31528 (21474) 30673Book value per share 454880 485986 31106 ―Dividend per share 10000 10000 ― 10000Dividend payout ratio () 189 317 ― 326 Revised forecast issued on October 31 2017
FY2017
Balance Sheet Data (yenmn)March 31 2017
Amount Amount ChangeTotal assets 47002 46814 (187) Return on assets () 63 36 (27)Net assets 17355 17487 132 Owned capital 17346 17474 127 Capital-to-asset ratio () 369 373 04 Return on equity () 123 67 (56)Current assets 29009 28334 (674)Current liabilities 14939 14914 (25) Current ratio (x) 194 19 (004)
March 31 2018
PL 医薬品① 医薬品② 医薬品③ BS① BS③ 和文にある「前年同期間比」「前期3月末比」は記載が難しく英語版では必要度の低い情報であるとみなして記載をしないこととなった2016年2Q~(木村)ただし期末では記載が可能なので書きます(須田)
CF CAP EX 業績予想① 英語版では経常利益は書かないので注意(須田)
業績予想 ② 業績予想③ PL 医薬品① 医薬品② 医薬品③ BS① BS③ 和文にある「前年同期間比」「前期3月末比」は記載が難しく英語版では必要度の低い情報であるとみなして記載をしないこととなった2016年2Q~(木村)ただし期末では記載が可能なので書きます(須田)
CF CAP EX 業績予想① 英語版では経常利益は書かないので注意(須田)
業績予想 ② 業績予想③ Cash Flow Expenditure
7
Cash Flow Statements (yenmn)FY2016 FY2017Amount Amount
Net cash Provided by operating activities 2737 3188 Used in investing activities (2504) (1606) Provided by (Used in) financing activities 787 (1741)Cash and cash equivalents 8084 7890Free cash flow 232 1582
Capital Expenditure and Other (yenmn)FY2016
UsageAmount Amount YOY () Forecast Rate ()
Capital expenditure 2928 1645 (438) 1650 997Depreciation and amortization 1112 1192 72 1250 954 Revised forecast issued on October 31 2017
Items
FY2017
PL 医薬品① 医薬品② 医薬品③ BS① BS③ 和文にある「前年同期間比」「前期3月末比」は記載が難しく英語版では必要度の低い情報であるとみなして記載をしないこととなった2016年2Q~(木村)ただし期末では記載が可能なので書きます(須田)
CF CAP EX 業績予想① 英語版では経常利益は書かないので注意(須田)
業績予想 ② 業績予想③ PL 医薬品① 医薬品② 医薬品③ BS① BS③ 和文にある「前年同期間比」「前期3月末比」は記載が難しく英語版では必要度の低い情報であるとみなして記載をしないこととなった2016年2Q~(木村)ただし期末では記載が可能なので書きます(須田)
CF CAP EX 業績予想① 英語版では経常利益は書かないので注意(須田)
業績予想 ② 業績予想③ 8
II FY2018 Forecasts
Sales Income
9
(yenmn)
of of YOYAmount Sales Amount Sales ()
Net Sales 35331 1000 35500 1000 05 Pharmaceuticals 34279 970 ― ― ― Others 1051 30 ― ― ―Cost of sales 19535 553 ― ― ―SGampA expenses 13947 395 ― ― ― RampD expenses 2280 65 2700 76 184Operating income 1848 52 1100 31 (405)
1777 50 ― ― ―
1160 33 500 14 (569)Net income attributble to owners of the parent
FY2018 (Forecast)FY2017
Income before income taxes and minority interests
Annual ForecastSales and profit in FY2018 will be impacted by NHI drug price revisions On the other hand however due to our focus on newly launched products and expansion of new sales channels sales of generic drugs are expected to be nearly flat compared to the previous fiscal year As a result consolidated net sales including other businesses such as contracted testing business are projected to be yen35500 million (up 05 YOY)
Regarding profits due to increased development costs as the progress in new drug development and continued strategic expenses such as trial costs leading up to the commencement of commercial production at the Vietnam factory operating income is forecast at yen1100 million (down 405 YOY) and net income attributable to owners of the parent is expected to be yen500 million (down 569 YOY)
PL 医薬品① 医薬品② 医薬品③ BS① BS③ 和文にある「前年同期間比」「前期3月末比」は記載が難しく英語版では必要度の低い情報であるとみなして記載をしないこととなった2016年2Q~(木村)ただし期末では記載が可能なので書きます(須田)
CF CAP EX 業績予想① 英語版では経常利益は書かないので注意(須田)
業績予想 ② 業績予想③ Pharmaceutical Sales
10
Generics Proprietary Products (yenmn)FY2017Amount Amount YOY ()
Total 32153 31800 (11) Generics 30115 30150 01 To medical institutions 29174 29250 03 To other makers 941 900 (44) Amlodipine 2940 2900 (14) Lansoprazole 2163 1900 (122) Donepezil 1557 1350 (133) Rabeprazole 1558 1350 (134) Limaprost Alfadex 1427 1350 (55) Pravastatine 1147 1100 (41) Voglibose 870 750 (139) Others 18449 19450 54 Proprietary products 2038 1650 (190) Uralyt 1225 1070 (127) Soleton 598 400 (331) Calvan 214 180 (162)
Chemiphar ODM Generics (yenmn)FY2017Amount Amount YOY ()
Total 31100 31350 08 Generics 30115 30150 01 Generics (ODM) 985 1200 218
FY2018 (Forecast)
FY2018 (Forecast)
PL 医薬品① 医薬品② 医薬品③ BS① BS③ 和文にある「前年同期間比」「前期3月末比」は記載が難しく英語版では必要度の低い情報であるとみなして記載をしないこととなった2016年2Q~(木村)ただし期末では記載が可能なので書きます(須田)
CF CAP EX 業績予想① 英語版では経常利益は書かないので注意(須田)
業績予想 ② 業績予想③ Per Share Information Expenditure
11
For further information contactPublic Relations Department Nippon Chemiphar Co LtdE-mail irchemipharcojp
Note about Forward-looking Statements and ForecastsStatements made in this Highlights of Business Results with respect to current plans estimates strategies and beliefs and other statements of Nippon Chemiphar that are not historical facts are forward-looking statements about the future performance of Nippon Chemiphar
These statements are based on managementrsquos current assumptions and beliefs in light of the information currently available to it and involve known and unknown risks and uncertainties Consequently undue reliance should not be placed on these statements
Nippon Chemiphar cautions the reader that a number of important factors could cause actual results to differ materially from those discussed in the forward-looking statements
Per Share Information (yen)FY2017Amount Amount YOY ()
Earnings per share 31528 13584 (569)Book value per share 485986 ― ―Dividends per share 10000 7500 ―Dividend payout ratio () 317 552 ―
Capital Expenditure and Other (yenmn)FY2017Amount Amount Change
Capital expenditure 1645 950 (695)Depreciation and amortization 1192 1350 157
FY2018 (Forecast)
FY2018 (Forecast)
Dividend ForecastAs mentioned above we are forecasting a decline in profit in FY2018 due to the influence of NHI drug price revisions ongoing strategic spending including new drug development expenses and start-up expenses at the Vietnam factory Thus we expect to pay a dividend per share of 75 yen (down 25 yen per share YOY) with a payout ratio of 552
PL 医薬品① 医薬品② 医薬品③ BS① BS③ 和文にある「前年同期間比」「前期3月末比」は記載が難しく英語版では必要度の低い情報であるとみなして記載をしないこととなった2016年2Q~(木村)ただし期末では記載が可能なので書きます(須田)
CF CAP EX 業績予想① 英語版では経常利益は書かないので注意(須田)
業績予想 ② 業績予想③ スライド番号 1 Contents スライド番号 3 Sales Income Pharmaceutical Sales Sales Distribution Balance Sheet per Share Information Cash Flow Expenditure スライド番号 9 Sales Income Pharmaceutical Sales Per Share Information Expenditure Per Share Information (yen) FY2017 FY2018 (Forecast) Amount Amount YOY () Earnings per share 31528 13584 (569) Book value per share 485986 ― ― Dividends per share 10000 7500 ― Dividend payout ratio () 317 552 ― Capital Expenditure and Other (yenmn) FY2017 FY2018 (Forecast) Amount Amount Change Capital expenditure 1645 950 (695) Depreciation and amortization 1192 1350 157 2015年3月期 ガツキ 2016年3月期(予想) ガツキ ヨソウ 金額 キンガク 金額 キンガク 増減額 ゾウゲンガク 増減率 ゾウゲン リツ 医療用医薬品 イリョウヨウ イヤクヒン 27400 30950 +05 ジェネリック医薬品(荷離) イヤクヒン ニ バナレ 25079 27430 +01 内自社販売 ウチ ジシャ ハンバイ 2321 25100 +01 内導出輸出 ウチ ドウシュツ ユシュツ 3011 2330 +04 アムロジピン 1935 3040 +09 ランソプラゾール 1509 1890 24 プラバスタチン 1595 1570 +40 ラベプラゾール 1704 1570 16 リマプロストアルファデクス 1273 1660 26 ボグリボース 1013 1300 +21 ドネペジル 15357 1030 +16 その他 タ 3400 15370 +01 主力品 シュリョク ヒン 1975 3520 +35 ウラリット 1134 1970 03 ソレトン 290 1250 +102 カルバン 0 300 +34 ジェネリック医薬品事業 イヤクヒン ジギョウ 2015年3月期 ガツキ 2016年3月期(予想) ガツキ ヨソウ 金額 キンガク 金額 キンガク 増減額 ゾウゲンガク 増減率 ゾウゲン リツ ジェネリック医薬品事業 イヤクヒン ジギョウ 28918 28840 +1003 ジェネリック医薬品(荷離) イヤクヒン ニ バナレ 27400 27430 +999 受託 ジュタク 1518 1410 +1077
Generics Proprietary Products (yenmn) FY2017 FY2018 (Forecast) Amount Amount YOY () Total 32153 31800 (11) Generics 30115 30150 01 To medical institutions 29174 29250 03 To other makers 941 900 (44) Amlodipine 2940 2900 (14) Lansoprazole 2163 1900 (122) Donepezil 1557 1350 (133) Rabeprazole 1558 1350 (134) Limaprost Alfadex 1427 1350 (55) Pravastatine 1147 1100 (41) Voglibose 870 750 (139) Others 18449 19450 54 Proprietary products 2038 1650 (190) Uralyt 1225 1070 (127) Soleton 598 400 (331) Calvan 214 180 (162) Chemiphar ODM Generics (yenmn) FY2017 FY2018 (Forecast) Amount Amount YOY () Total 31100 31350 08 Generics 30115 30150 01 Generics (ODM) 985 1200 218
Income Statement Overview (yenmn) FY2017 FY2018 (Forecast) of of YOY Amount Sales Amount Sales () Net Sales 35331 1000 35500 1000 05 Pharmaceuticals 34279 970 ― ― ― Others 1051 30 ― ― ― Cost of sales 19535 553 ― ― ― SGampA expenses 13947 395 ― ― ― RampD expenses 2280 65 2700 76 184 Operating income 1848 0 52 1100 31 (405) Income before income taxes and minority interests 1777 80 ― ― ― Net income attributble to owners of the parent 1160 33 500 14 (569)
Capital Expenditure and Other (yenmn) Items FY2016 FY2017 Usage Amount Amount YOY () Forecast Rate () Capital expenditure 2928 1645 (438) 1650 997 Depreciation and amortization 1112 1192 72 1250 954 Revised forecast issued on October 31 2017
Cash Flow Statements (yenmn) FY2016 FY2017 Amount Amount Net cash Provided by operating activities 2737 3188 Used in investing activities (2504) (1606) Used in financing activities 787 (1741) Cash and cash equivalents 8084 7890 Free cash flow 232 1582
Per Share Information (yen) FY2016 FY2017 Amount Amount Change Forecast Earnings per share 53002 31528 (21474) 30673 Book value per share 454880 485986 31106 ― Dividend per share 10000 10000 ― 10000 Dividend payout ratio () 189 317 ― 326 Revised forecast issued on October 31 2017
Balance Sheet Data (yenmn) March 31 2017 August 31 2017 March 31 2015 Amount Amount Change Total assets 47002 46814 3358 (187) Return on assets () 63 36 -06 (27) Net assets 17355 17487 1313 132 Owned capital 17346 17474 1312 127 Capital-to-asset ratio () 369 373 02 +04 Return on equity () 123 67 (01) (56) Current assets 29009 28334 1630 (674) Current liabilities 14939 14914 (716) (25) Current ratio (x) 194 19 019 004
By Main Therapeutic Categories () FY2016 FY2017 Cardiovascular and respiratory drugs 309 320 Digestive organ drugs 196 183 Agents affecting metabolism 164 165 Drugs for nervous system sensory organs 99 91 Antibiotics and chemotherapeutic drugs 65 62 Antineoplastic agents 32 34 Others 135 145
Sales Distribution By Launch Year (yenmn) FY2016 FY2017 Fiscal Year Amount Distrib () Amount Distrib () YOY () 2010 and before 19487 1 667 19194 637 (15) 2009 2011 2348 0 80 2210 73 (59) 2012 1484 0 51 1404 47 (54) 2013 2917 0 100 3127 104 72 2014 1746 0 60 1937 64 110 2015 1001 0 34 1222 41 221 2016 219 0 08 459 15 1091 2017 ― ― ― 558 19 ― Total 29204 1 1000 30115 1000 31
Generics Proprietary Products (yenmn) FY2016 FY2017 Distrib Distrib YOY Achieved Amount () Amount () () Forecast () Total 31513 1 1000 32153 1 1000 20 32000 1005 Generics 29204 1 927 30115 1 937 31 30000 1 1004 To medical institutions 27808 29174 49 29100 1 1003 To other makers 1395 941 (326) 900 1 1046 Amlodipine 2865 2940 26 2900 1 1014 Lansoprazole 2279 2163 (51) 2100 1 1030 Donepezil 1642 1557 (52) 1600 1 973 Rabeprazole 1586 1558 (18) 1600 1 974 Limaprost Alfadex 1469 1427 (28) 1400 1 1020 Pravastatine 1173 1147 (22) 1100 1 1043 Voglibose 957 870 (91) 900 1 967 Others 17229 18449 71 18400 1 1003 Proprietary products 2308 0 73 2038 0 63 (117) 2000 1 1019 Uralyt 1409 1225 (131) 1200 1 1021 Soleton 679 598 (120) 600 1 997 Calvan 219 214 (21) 200 1 1074 Chemiphar ODM Generics (yenmn) FY2016 FY2017 Distrib Distrib YOY Achieved Amount () Amount () () Forecast () Total 30445 1000 31100 1000 22 31400 990 Generics 29204 959 30115 968 31 30000 1004 Generics (ODM) 1240 41 985 32 (206) 1400 704 Includes exports Revised forecast issued on October 31 2017
Income Statement Overview (yenmn) FY2016 FY2017 of of YOY Achieved Amount Sales Amount Sales () Forecast () Net Sales 35689 1 1000 35331 1 1000 (10) 35500 1 995 Pharmaceuticals 34551 1 968 34279 1 970 (08) ― ― ― Others 1137 0 32 1051 0 30 (76) ― ― ― Cost of sales 19449 1 545 19535 1 553 04 ― ― ― SGampA expenses 13403 0 376 13947 0 395 41 ― ― ― RampD expenses 1984 0 56 2280 0 65 150 2200 0 1037 Operating income 2836 0 79 1848 0 52 (348) 1800 0 1027 Income before income taxes and minority interests 2849 0 80 1696 0 48 (405) 1700 ― 998 Net income attributble to owners of the parent 2054 0 58 1160 0 33 (435) 1150 ― 1009 1961 00550933658 00550933658 00575628587 Revised forecast issued on October 31 2017
Per Share Information (yen) FY2017 FY2018 (Forecast) Amount Amount YOY () Earnings per share 31528 13584 (569) Book value per share 485986 ― ― Dividends per share 10000 7500 ― Dividend payout ratio() 317 552 ― Capital Expenditure and Other (yenmn) FY2017 FY2018 (Forecast) Amount Amount Change Capital expenditure 1645 950 (695) Depreciation and amortization 1192 1350 157 2015年3月期 ガツキ 2016年3月期(予想) ガツキ ヨソウ 金額 キンガク 金額 キンガク 増減額 ゾウゲンガク 増減率 ゾウゲン リツ 医療用医薬品 イリョウヨウ イヤクヒン 27400 30950 +05 ジェネリック医薬品(荷離) イヤクヒン ニ バナレ 25079 27430 +01 内自社販売 ウチ ジシャ ハンバイ 2321 25100 +01 内導出輸出 ウチ ドウシュツ ユシュツ 3011 2330 +04 アムロジピン 1935 3040 +09 ランソプラゾール 1509 1890 24 プラバスタチン 1595 1570 +40 ラベプラゾール 1704 1570 16 リマプロストアルファデクス 1273 1660 26 ボグリボース 1013 1300 +21 ドネペジル 15357 1030 +16 その他 タ 3400 15370 +01 主力品 シュリョク ヒン 1975 3520 +35 ウラリット 1134 1970 03 ソレトン 290 1250 +102 カルバン 0 300 +34 ジェネリック医薬品事業 イヤクヒン ジギョウ 2015年3月期 ガツキ 2016年3月期(予想) ガツキ ヨソウ 金額 キンガク 金額 キンガク 増減額 ゾウゲンガク 増減率 ゾウゲン リツ ジェネリック医薬品事業 イヤクヒン ジギョウ 28918 28840 +1003 ジェネリック医薬品(荷離) イヤクヒン ニ バナレ 27400 27430 +999 受託 ジュタク 1518 1410 +1077
Generics Proprietary Products (yenmn) FY2017 FY2018 (Forecast) Amount Amount YOY () Total 32153 31800 (11) Generics 30115 30150 01 To medical institutions 29174 29250 03 To other makers 941 900 (44) Amlodipine 2940 2900 (14) Lansoprazole 2163 1900 (122) Donepezil 1557 1350 (133) Rabeprazole 1558 1350 (134) Limaprost Alfadex 1427 1350 (55) Pravastatine 1147 1100 (41) Voglibose 870 750 (139) Others 18449 19450 54 Proprietary products 2038 1650 (190) Uralyt 1225 1070 (127) Soleton 598 400 (331) Calvan 214 180 (162) Chemiphar ODM Generics (yenmn) FY2017 FY2018 (Forecast) Amount Amount YOY () Total 31100 31350 08 Generics 30115 30150 01 Generics (ODM) 985 1200 218
Income Statement Overview (yenmn) FY2017 FY2018 (Forecast) of of YOY Amount Sales Amount Sales () Net Sales 35331 1000 35500 1000 05 Pharmaceuticals 34279 970 ― ― ― Others 1051 30 ― ― ― Cost of sales 19535 553 ― ― ― SGampA expenses 13947 395 ― ― ― RampD expenses 2280 65 2700 76 184 Operating income 1848 0 52 1100 31 (405) Income before income taxes and minority interests 1777 80 ― ― ― Net income attributble to owners of the parent 1160 33 500 14 (569)
Capital Expenditure and Other (yenmn) Items FY2016 FY2017 Usage Amount Amount YOY () Forecast Rate () Capital expenditure 2928 1645 (438) 1650 997 Depreciation and amortization 1112 1192 72 1250 954 Revised forecast issued on October 31 2017
Cash Flow Statements (yenmn) FY2016 FY2017 Amount Amount Net cash Provided by operating activities 2737 3188 Used in investing activities (2504) (1606) Used in financing activities 787 (1741) Cash and cash equivalents 8084 7890 Free cash flow 232 1582
Per Share Information (yen) FY2016 FY2017 Amount Amount Change Forecast Earnings per share 53002 31528 (21474) 30673 Book value per share 454880 485986 31106 ― Dividend per share 10000 10000 ― 10000 Dividend payout ratio () 189 317 ― 326 Revised forecast issued on October 31 2017
Balance Sheet Data (yenmn) March 31 2017 August 31 2017 March 31 2015 Amount Amount Change Total assets 47002 46814 3358 (187) Return on assets () 63 36 -06 (27) Net assets 17355 17487 1313 132 Owned capital 17346 17474 1312 127 Capital-to-asset ratio () 369 373 02 +04 Return on equity () 123 67 (01) (56) Current assets 29009 28334 1630 (674) Current liabilities 14939 14914 (716) (25) Current ratio (x) 194 19 019 004
By Main Therapeutic Categories () FY2016 FY2017 Cardiovascular and respiratory drugs 309 320 Digestive organ drugs 196 183 Agents affecting metabolism 164 165 Drugs for nervous system sensory organs 99 91 Antibiotics and chemotherapeutic drugs 65 62 Antineoplastic agents 32 34 Others 135 145
Sales Distribution By Launch Year (yenmn) FY2016 FY2017 Fiscal Year Amount Distrib () Amount Distrib () YOY () 2010 and before 19487 1 667 19194 637 (15) 2009 2011 2348 0 80 2210 73 (59) 2012 1484 0 51 1404 47 (54) 2013 2917 0 100 3127 104 72 2014 1746 0 60 1937 64 110 2015 1001 0 34 1222 41 221 2016 219 0 08 459 15 1091 2017 ― ― ― 558 19 ― Total 29204 1 1000 30115 1000 31
Generics Proprietary Products (yenmn) FY2016 FY2017 Distrib Distrib YOY Achieved Amount () Amount () () Forecast () Total 31513 1 1000 32153 1 1000 20 32000 1005 Generics 29204 1 927 30115 1 937 31 30000 1 1004 To medical institutions 27808 29174 49 29100 1 1003 To other makers 1395 941 (326) 900 1 1046 Amlodipine 2865 2940 26 2900 1 1014 Lansoprazole 2279 2163 (51) 2100 1 1030 Donepezil 1642 1557 (52) 1600 1 973 Rabeprazole 1586 1558 (18) 1600 1 974 Limaprost Alfadex 1469 1427 (28) 1400 1 1020 Pravastatine 1173 1147 (22) 1100 1 1043 Voglibose 957 870 (91) 900 1 967 Others 17229 18449 71 18400 1 1003 Proprietary products 2308 0 73 2038 0 63 (117) 2000 1 1019 Uralyt 1409 1225 (131) 1200 1 1021 Soleton 679 598 (120) 600 1 997 Calvan 219 214 (21) 200 1 1074 Chemiphar ODM Generics (yenmn) FY2016 FY2017 Distrib Distrib YOY Achieved Amount () Amount () () Forecast () Total 30445 1000 31100 1000 22 31400 990 Generics 29204 959 30115 968 31 30000 1004 Generics (ODM) 1240 41 985 32 (206) 1400 704 Includes exports Revised forecast issued on October 31 2017
Income Statement Overview (yenmn) FY2016 FY2017 of of YOY Achieved Amount Sales Amount Sales () Forecast () Net Sales 35689 1 1000 35331 1 1000 (10) 35500 1 995 Pharmaceuticals 34551 1 968 34279 1 970 (08) ― ― ― Others 1137 0 32 1051 0 30 (76) ― ― ― Cost of sales 19449 1 545 19535 1 553 04 ― ― ― SGampA expenses 13403 0 376 13947 0 395 41 ― ― ― RampD expenses 1984 0 56 2280 0 65 150 2200 0 1037 Operating income 2836 0 79 1848 0 52 (348) 1800 0 1027 Income before income taxes and minority interests 2849 0 80 1696 0 48 (405) 1700 ― 998 Net income attributble to owners of the parent 2054 0 58 1160 0 33 (435) 1150 ― 1009 1961 00550933658 00550933658 00575628587 Revised forecast issued on October 31 2017
Per Share Information (yen) FY2017 FY2018 (Forecast) Amount Amount YOY () Earnings per share 31528 13584 (569) Book value per share 485986 ― ― Dividends per share 10000 7500 ― Dividend payout ratio() 317 552 ― Capital Expenditure and Other (yenmn) FY2017 FY2018 (Forecast) Amount Amount Change Capital expenditure 1645 950 (695) Depreciation and amortization 1192 1350 157 2015年3月期 ガツキ 2016年3月期(予想) ガツキ ヨソウ 金額 キンガク 金額 キンガク 増減額 ゾウゲンガク 増減率 ゾウゲン リツ 医療用医薬品 イリョウヨウ イヤクヒン 27400 30950 +05 ジェネリック医薬品(荷離) イヤクヒン ニ バナレ 25079 27430 +01 内自社販売 ウチ ジシャ ハンバイ 2321 25100 +01 内導出輸出 ウチ ドウシュツ ユシュツ 3011 2330 +04 アムロジピン 1935 3040 +09 ランソプラゾール 1509 1890 24 プラバスタチン 1595 1570 +40 ラベプラゾール 1704 1570 16 リマプロストアルファデクス 1273 1660 26 ボグリボース 1013 1300 +21 ドネペジル 15357 1030 +16 その他 タ 3400 15370 +01 主力品 シュリョク ヒン 1975 3520 +35 ウラリット 1134 1970 03 ソレトン 290 1250 +102 カルバン 0 300 +34 ジェネリック医薬品事業 イヤクヒン ジギョウ 2015年3月期 ガツキ 2016年3月期(予想) ガツキ ヨソウ 金額 キンガク 金額 キンガク 増減額 ゾウゲンガク 増減率 ゾウゲン リツ ジェネリック医薬品事業 イヤクヒン ジギョウ 28918 28840 +1003 ジェネリック医薬品(荷離) イヤクヒン ニ バナレ 27400 27430 +999 受託 ジュタク 1518 1410 +1077
Generics Proprietary Products (yenmn) FY2017 FY2018 (Forecast) Amount Amount YOY () Total 32153 31800 (11) Generics 30115 30150 01 To medical institutions 29174 29250 03 To other makers 941 900 (44) Amlodipine 2940 2900 (14) Lansoprazole 2163 1900 (122) Donepezil 1557 1350 (133) Rabeprazole 1558 1350 (134) Limaprost Alfadex 1427 1350 (55) Pravastatine 1147 1100 (41) Voglibose 870 750 (139) Others 18449 19450 54 Proprietary products 2038 1650 (190) Uralyt 1225 1070 (127) Soleton 598 400 (331) Calvan 214 180 (162) Chemiphar ODM Generics (yenmn) FY2017 FY2018 (Forecast) Amount Amount YOY () Total 31100 31350 08 Generics 30115 30150 01 Generics (ODM) 985 1200 218
Income Statement Overview (yenmn) FY2017 FY2018 (Forecast) of of YOY Amount Sales Amount Sales () Net Sales 35331 1000 35500 1000 05 Pharmaceuticals 34279 970 ― ― ― Others 1051 30 ― ― ― Cost of sales 19535 553 ― ― ― SGampA expenses 13947 395 ― ― ― RampD expenses 2280 65 2700 76 184 Operating income 1848 0 52 1100 31 (405) Income before income taxes and minority interests 1777 50 ― ― ― Net income attributble to owners of the parent 1160 33 500 14 (569)
Capital Expenditure and Other (yenmn) Items FY2016 FY2017 Usage Amount Amount YOY () Forecast Rate () Capital expenditure 2928 1645 (438) 1650 997 Depreciation and amortization 1112 1192 72 1250 954 Revised forecast issued on October 31 2017
Cash Flow Statements (yenmn) FY2016 FY2017 Amount Amount Net cash Provided by operating activities 2737 3188 Used in investing activities (2504) (1606) Used in financing activities 787 (1741) Cash and cash equivalents 8084 7890 Free cash flow 232 1582
Per Share Information (yen) FY2016 FY2017 Amount Amount Change Forecast Earnings per share 53002 31528 (21474) 30673 Book value per share 454880 485986 31106 ― Dividend per share 10000 10000 ― 10000 Dividend payout ratio () 189 317 ― 326 Revised forecast issued on October 31 2017
Balance Sheet Data (yenmn) March 31 2017 March 31 2018 March 31 2015 Amount Amount Change Total assets 47002 46814 3358 (187) Return on assets () 63 36 -06 (27) Net assets 17355 17487 1313 132 Owned capital 17346 17474 1312 127 Capital-to-asset ratio () 369 373 02 04 Return on equity () 123 67 (01) (56) Current assets 29009 28334 1630 (674) Current liabilities 14939 14914 (716) (25) Current ratio (x) 194 19 019 (004)
By Main Therapeutic Categories () FY2016 FY2017 Cardiovascular and respiratory drugs 309 320 Digestive organ drugs 196 183 Agents affecting metabolism 164 165 Drugs for nervous system sensory organs 99 91 Antibiotics and chemotherapeutic drugs 65 62 Antineoplastic agents 32 34 Others 135 145
Sales Distribution By Launch Year (yenmn) FY2016 FY2017 Fiscal Year Amount Distrib () Amount Distrib () YOY () 2010 and before 19487 1 667 19194 637 (15) 2009 2011 2348 0 80 2210 73 (59) 2012 1484 0 51 1404 47 (54) 2013 2917 0 100 3127 104 72 2014 1746 0 60 1937 64 110 2015 1001 0 34 1222 41 221 2016 219 0 08 459 15 1091 2017 ― ― 558 19 ― Total 29204 1 1000 30115 1000 31
Generics Proprietary Products (yenmn) FY2016 FY2017 Distrib Distrib YOY Achieved Amount () Amount () () Forecast () Total 31513 1 1000 32153 1 1000 20 32000 1005 Generics 29204 1 927 30115 1 937 31 30000 1 1004 To medical institutions 27808 29174 49 29100 1 1003 To other makers 1395 941 (326) 900 1 1046 Amlodipine 2865 2940 26 2900 1 1014 Lansoprazole 2279 2163 (51) 2100 1 1030 Donepezil 1642 1557 (52) 1600 1 973 Rabeprazole 1586 1558 (18) 1600 1 974 Limaprost Alfadex 1469 1427 (28) 1400 1 1020 Pravastatine 1173 1147 (22) 1100 1 1043 Voglibose 957 870 (91) 900 1 967 Others 17229 18449 71 18400 1 1003 Proprietary products 2308 0 73 2038 0 63 (117) 2000 1 1019 Uralyt 1409 1225 (131) 1200 1 1021 Soleton 679 598 (120) 600 1 997 Calvan 219 214 (21) 200 1 1074 Chemiphar ODM Generics (yenmn) FY2016 FY2017 Distrib Distrib YOY Achieved Amount () Amount () () Forecast () Total 30445 1000 31100 1000 22 31400 990 Generics 29204 959 30115 968 31 30000 1004 Generics (ODM) 1240 41 985 32 (206) 1400 704 Includes exports Revised forecast issued on October 31 2017
Income Statement Overview (yenmn) FY2016 FY2017 of of YOY Achieved Amount Sales Amount Sales () Forecast () Net Sales 35689 1 1000 35331 1 1000 (10) 35500 1 995 Pharmaceuticals 34551 1 968 34279 1 970 (08) ― ― Others 1137 0 32 1051 0 30 (76) ― ― Cost of sales 19449 1 545 19535 1 553 04 ― ― SGampA expenses 13403 0 376 13947 0 395 41 ― ― RampD expenses 1984 0 56 2280 0 65 150 2200 0 1037 Operating income 2836 0 79 1848 0 52 (348) 1800 0 1027 Income before income taxes and minority interests 2849 0 80 1777 0 50 (376) ― ― Net income attributble to owners of the parent 2054 0 58 1160 0 33 (435) 1150 ― 1009 1961 00550933658 00550933658 00575628587 Revised forecast issued on October 31 2017
Per Share Information (yen) FY2017 FY2018 (Forecast) Amount Amount YOY () Earnings per share 31528 13584 (569) Book value per share 485986 ― ― Dividends per share 10000 7500 ― Dividend payout ratio() 317 552 ― Capital Expenditure and Other (yenmn) FY2017 FY2018 (Forecast) Amount Amount Change Capital expenditure 1645 950 (695) Depreciation and amortization 1192 1350 157 2015年3月期 ガツキ 2016年3月期(予想) ガツキ ヨソウ 金額 キンガク 金額 キンガク 増減額 ゾウゲンガク 増減率 ゾウゲン リツ 医療用医薬品 イリョウヨウ イヤクヒン 27400 30950 +05 ジェネリック医薬品(荷離) イヤクヒン ニ バナレ 25079 27430 +01 内自社販売 ウチ ジシャ ハンバイ 2321 25100 +01 内導出輸出 ウチ ドウシュツ ユシュツ 3011 2330 +04 アムロジピン 1935 3040 +09 ランソプラゾール 1509 1890 24 プラバスタチン 1595 1570 +40 ラベプラゾール 1704 1570 16 リマプロストアルファデクス 1273 1660 26 ボグリボース 1013 1300 +21 ドネペジル 15357 1030 +16 その他 タ 3400 15370 +01 主力品 シュリョク ヒン 1975 3520 +35 ウラリット 1134 1970 03 ソレトン 290 1250 +102 カルバン 0 300 +34 ジェネリック医薬品事業 イヤクヒン ジギョウ 2015年3月期 ガツキ 2016年3月期(予想) ガツキ ヨソウ 金額 キンガク 金額 キンガク 増減額 ゾウゲンガク 増減率 ゾウゲン リツ ジェネリック医薬品事業 イヤクヒン ジギョウ 28918 28840 +1003 ジェネリック医薬品(荷離) イヤクヒン ニ バナレ 27400 27430 +999 受託 ジュタク 1518 1410 +1077
Generics Proprietary Products (yenmn) FY2017 FY2018 (Forecast) Amount Amount YOY () Total 32153 31800 (11) Generics 30115 30150 01 To medical institutions 29174 29250 03 To other makers 941 900 (44) Amlodipine 2940 2900 (14) Lansoprazole 2163 1900 (122) Donepezil 1557 1350 (133) Rabeprazole 1558 1350 (134) Limaprost Alfadex 1427 1350 (55) Pravastatine 1147 1100 (41) Voglibose 870 750 (139) Others 18449 19450 54 Proprietary products 2038 1650 (190) Uralyt 1225 1070 (127) Soleton 598 400 (331) Calvan 214 180 (162) Chemiphar ODM Generics (yenmn) FY2017 FY2018 (Forecast) Amount Amount YOY () Total 31100 31350 08 Generics 30115 30150 01 Generics (ODM) 985 1200 218
Income Statement Overview (yenmn) FY2017 FY2018 (Forecast) of of YOY Amount Sales Amount Sales () Net Sales 35331 1000 35500 1000 05 Pharmaceuticals 34279 970 ― ― ― Others 1051 30 ― ― ― Cost of sales 19535 553 ― ― ― SGampA expenses 13947 395 ― ― ― RampD expenses 2280 65 2700 76 184 Operating income 1848 0 52 1100 31 (405) Income before income taxes and minority interests 1777 80 ― ― ― Net income attributble to owners of the parent 1160 33 500 14 (569)
Capital Expenditure and Other (yenmn) Items FY2016 FY2017 Usage Amount Amount YOY () Forecast Rate () Capital expenditure 2928 1645 (438) 1650 997 Depreciation and amortization 1112 1192 72 1250 954 Revised forecast issued on October 31 2017
Cash Flow Statements (yenmn) FY2016 FY2017 Amount Amount Net cash Provided by operating activities 2737 3188 Used in investing activities (2504) (1606) Used in financing activities 787 (1741) Cash and cash equivalents 8084 7890 Free cash flow 232 1582
Per Share Information (yen) FY2016 FY2017 Amount Amount Change Forecast Earnings per share 53002 31528 (21474) 30673 Book value per share 454880 485986 31106 ― Dividend per share 10000 10000 ― 10000 Dividend payout ratio () 189 317 ― 326 Revised forecast issued on October 31 2017
Balance Sheet Data (yenmn) March 31 2017 August 31 2017 March 31 2015 Amount Amount Change Total assets 47002 46814 3358 (187) Return on assets () 63 36 -06 (27) Net assets 17355 17487 1313 132 Owned capital 17346 17474 1312 127 Capital-to-asset ratio () 369 373 02 +04 Return on equity () 123 67 (01) (56) Current assets 29009 28334 1630 (674) Current liabilities 14939 14914 (716) (25) Current ratio (x) 194 19 019 004
By Main Therapeutic Categories () FY2016 FY2017 Cardiovascular and respiratory drugs 309 320 Digestive organ drugs 196 183 Agents affecting metabolism 164 165 Drugs for nervous system sensory organs 99 91 Antibiotics and chemotherapeutic drugs 65 62 Antineoplastic agents 32 34 Others 135 145
Sales Distribution By Launch Year (yenmn) FY2016 FY2017 Fiscal Year Amount Distrib () Amount Distrib () YOY () 2010 and before 19487 1 667 19194 637 (15) 2009 2011 2348 0 80 2210 73 (59) 2012 1484 0 51 1404 47 (54) 2013 2917 0 100 3127 104 72 2014 1746 0 60 1937 64 110 2015 1001 0 34 1222 41 221 2016 219 0 08 459 15 1091 2017 ― ― ― 558 19 ― Total 29204 1 1000 30115 1000 31
Generics Proprietary Products (yenmn) FY2016 FY2017 Distrib Distrib YOY Achieved Amount () Amount () () Forecast () Total 31513 1 1000 32153 1 1000 20 32000 1005 Generics 29204 1 927 30115 1 937 31 30000 1 1004 To medical institutions 27808 29174 49 29100 1 1003 To other makers 1395 941 (326) 900 1 1046 Amlodipine 2865 2940 26 2900 1 1014 Lansoprazole 2279 2163 (51) 2100 1 1030 Donepezil 1642 1557 (52) 1600 1 973 Rabeprazole 1586 1558 (18) 1600 1 974 Limaprost Alfadex 1469 1427 (28) 1400 1 1020 Pravastatine 1173 1147 (22) 1100 1 1043 Voglibose 957 870 (91) 900 1 967 Others 17229 18449 71 18400 1 1003 Proprietary products 2308 0 73 2038 0 63 (117) 2000 1 1019 Uralyt 1409 1225 (131) 1200 1 1021 Soleton 679 598 (120) 600 1 997 Calvan 219 214 (21) 200 1 1074 Chemiphar ODM Generics (yenmn) FY2016 FY2017 Distrib Distrib YOY Achieved Amount () Amount () () Forecast () Total 30445 1000 31100 1000 22 31400 990 Generics 29204 959 30115 968 31 30000 1004 Generics (ODM) 1240 41 985 32 (206) 1400 704 Includes exports Revised forecast issued on October 31 2017
Income Statement Overview (yenmn) FY2016 FY2017 of of YOY Achieved Amount Sales Amount Sales () Forecast () Net Sales 35689 1 1000 35331 1 1000 (10) 35500 1 995 Pharmaceuticals 34551 1 968 34279 1 970 (08) ― ― ― Others 1137 0 32 1051 0 30 (76) ― ― ― Cost of sales 19449 1 545 19535 1 553 04 ― ― ― SGampA expenses 13403 0 376 13947 0 395 41 ― ― ― RampD expenses 1984 0 56 2280 0 65 150 2200 0 1037 Operating income 2836 0 79 1848 0 52 (348) 1800 0 1027 Income before income taxes and minority interests 2849 0 80 1696 0 48 (405) 1700 ― 998 Net income attributble to owners of the parent 2054 0 58 1160 0 33 (435) 1150 ― 1009 1961 00550933658 00550933658 00575628587 Revised forecast issued on October 31 2017
Per Share Information (yen) FY2017 FY2018 (Forecast) Amount Amount YOY () Earnings per share 31528 13584 (569) Book value per share 485986 ― ― Dividends per share 10000 7500 ― Dividend payout ratio() 317 552 ― Capital Expenditure and Other (yenmn) FY2017 FY2018 (Forecast) Amount Amount Change Capital expenditure 1645 950 (695) Depreciation and amortization 1192 1350 157 2015年3月期 ガツキ 2016年3月期(予想) ガツキ ヨソウ 金額 キンガク 金額 キンガク 増減額 ゾウゲンガク 増減率 ゾウゲン リツ 医療用医薬品 イリョウヨウ イヤクヒン 27400 30950 +05 ジェネリック医薬品(荷離) イヤクヒン ニ バナレ 25079 27430 +01 内自社販売 ウチ ジシャ ハンバイ 2321 25100 +01 内導出輸出 ウチ ドウシュツ ユシュツ 3011 2330 +04 アムロジピン 1935 3040 +09 ランソプラゾール 1509 1890 24 プラバスタチン 1595 1570 +40 ラベプラゾール 1704 1570 16 リマプロストアルファデクス 1273 1660 26 ボグリボース 1013 1300 +21 ドネペジル 15357 1030 +16 その他 タ 3400 15370 +01 主力品 シュリョク ヒン 1975 3520 +35 ウラリット 1134 1970 03 ソレトン 290 1250 +102 カルバン 0 300 +34 ジェネリック医薬品事業 イヤクヒン ジギョウ 2015年3月期 ガツキ 2016年3月期(予想) ガツキ ヨソウ 金額 キンガク 金額 キンガク 増減額 ゾウゲンガク 増減率 ゾウゲン リツ ジェネリック医薬品事業 イヤクヒン ジギョウ 28918 28840 +1003 ジェネリック医薬品(荷離) イヤクヒン ニ バナレ 27400 27430 +999 受託 ジュタク 1518 1410 +1077
Generics Proprietary Products (yenmn) FY2017 FY2018 (Forecast) Amount Amount YOY () Total 32153 31800 (11) Generics 30115 30150 01 To medical institutions 29174 29250 03 To other makers 941 900 (44) Amlodipine 2940 2900 (14) Lansoprazole 2163 1900 (122) Donepezil 1557 1350 (133) Rabeprazole 1558 1350 (134) Limaprost Alfadex 1427 1350 (55) Pravastatine 1147 1100 (41) Voglibose 870 750 (139) Others 18449 19450 54 Proprietary products 2038 1650 (190) Uralyt 1225 1070 (127) Soleton 598 400 (331) Calvan 214 180 (162) Chemiphar ODM Generics (yenmn) FY2017 FY2018 (Forecast) Amount Amount YOY () Total 31100 31350 08 Generics 30115 30150 01 Generics (ODM) 985 1200 218
Income Statement Overview (yenmn) FY2017 FY2018 (Forecast) of of YOY Amount Sales Amount Sales () Net Sales 35331 1000 35500 1000 05 Pharmaceuticals 34279 970 ― ― ― Others 1051 30 ― ― ― Cost of sales 19535 553 ― ― ― SGampA expenses 13947 395 ― ― ― RampD expenses 2280 65 2700 76 184 Operating income 1848 0 52 1100 31 (405) Income before income taxes and minority interests 1777 80 ― ― ― Net income attributble to owners of the parent 1160 33 500 14 (569)
Capital Expenditure and Other (yenmn) Items FY2016 FY2017 Usage Amount Amount YOY () Forecast Rate () Capital expenditure 2928 1645 (438) 1650 997 Depreciation and amortization 1112 1192 72 1250 954 Revised forecast issued on October 31 2017
Cash Flow Statements (yenmn) FY2016 FY2017 Amount Amount Net cash Provided by operating activities 2737 3188 Used in investing activities (2504) (1606) Provided by (Used in) financing activities 787 (1741) Cash and cash equivalents 8084 7890 Free cash flow 232 1582
Per Share Information (yen) FY2016 FY2017 Amount Amount Change Forecast Earnings per share 53002 31528 (21474) 30673 Book value per share 454880 485986 31106 ― Dividend per share 10000 10000 ― 10000 Dividend payout ratio () 189 317 ― 326 Revised forecast issued on October 31 2017
Balance Sheet Data (yenmn) March 31 2017 August 31 2017 March 31 2015 Amount Amount Change Total assets 47002 46814 3358 (187) Return on assets () 63 36 -06 (27) Net assets 17355 17487 1313 132 Owned capital 17346 17474 1312 127 Capital-to-asset ratio () 369 373 02 +04 Return on equity () 123 67 (01) (56) Current assets 29009 28334 1630 (674) Current liabilities 14939 14914 (716) (25) Current ratio (x) 194 19 019 004
By Main Therapeutic Categories () FY2016 FY2017 Cardiovascular and respiratory drugs 309 320 Digestive organ drugs 196 183 Agents affecting metabolism 164 165 Drugs for nervous system sensory organs 99 91 Antibiotics and chemotherapeutic drugs 65 62 Antineoplastic agents 32 34 Others 135 145
Sales Distribution By Launch Year (yenmn) FY2016 FY2017 Fiscal Year Amount Distrib () Amount Distrib () YOY () 2010 and before 19487 1 667 19194 637 (15) 2009 2011 2348 0 80 2210 73 (59) 2012 1484 0 51 1404 47 (54) 2013 2917 0 100 3127 104 72 2014 1746 0 60 1937 64 110 2015 1001 0 34 1222 41 221 2016 219 0 08 459 15 1091 2017 ― ― ― 558 19 ― Total 29204 1 1000 30115 1000 31
Generics Proprietary Products (yenmn) FY2016 FY2017 Distrib Distrib YOY Achieved Amount () Amount () () Forecast () Total 31513 1 1000 32153 1 1000 20 32000 1005 Generics 29204 1 927 30115 1 937 31 30000 1 1004 To medical institutions 27808 29174 49 29100 1 1003 To other makers 1395 941 (326) 900 1 1046 Amlodipine 2865 2940 26 2900 1 1014 Lansoprazole 2279 2163 (51) 2100 1 1030 Donepezil 1642 1557 (52) 1600 1 973 Rabeprazole 1586 1558 (18) 1600 1 974 Limaprost Alfadex 1469 1427 (28) 1400 1 1020 Pravastatine 1173 1147 (22) 1100 1 1043 Voglibose 957 870 (91) 900 1 967 Others 17229 18449 71 18400 1 1003 Proprietary products 2308 0 73 2038 0 63 (117) 2000 1 1019 Uralyt 1409 1225 (131) 1200 1 1021 Soleton 679 598 (120) 600 1 997 Calvan 219 214 (21) 200 1 1074 Chemiphar ODM Generics (yenmn) FY2016 FY2017 Distrib Distrib YOY Achieved Amount () Amount () () Forecast () Total 30445 1000 31100 1000 22 31400 990 Generics 29204 959 30115 968 31 30000 1004 Generics (ODM) 1240 41 985 32 (206) 1400 704 Includes exports Revised forecast issued on October 31 2017
Income Statement Overview (yenmn) FY2016 FY2017 of of YOY Achieved Amount Sales Amount Sales () Forecast () Net Sales 35689 1 1000 35331 1 1000 (10) 35500 1 995 Pharmaceuticals 34551 1 968 34279 1 970 (08) ― ― ― Others 1137 0 32 1051 0 30 (76) ― ― ― Cost of sales 19449 1 545 19535 1 553 04 ― ― ― SGampA expenses 13403 0 376 13947 0 395 41 ― ― ― RampD expenses 1984 0 56 2280 0 65 150 2200 0 1037 Operating income 2836 0 79 1848 0 52 (348) 1800 0 1027 Income before income taxes and minority interests 2849 0 80 1696 0 48 (405) 1700 ― 998 Net income attributble to owners of the parent 2054 0 58 1160 0 33 (435) 1150 ― 1009 1961 00550933658 00550933658 00575628587 Revised forecast issued on October 31 2017
Per Share Information (yen) FY2017 FY2018 (Forecast) Amount Amount YOY () Earnings per share 31528 13584 (569) Book value per share 485986 ― ― Dividends per share 10000 7500 ― Dividend payout ratio() 317 552 ― Capital Expenditure and Other (yenmn) FY2017 FY2018 (Forecast) Amount Amount Change Capital expenditure 1645 950 (695) Depreciation and amortization 1192 1350 157 2015年3月期 ガツキ 2016年3月期(予想) ガツキ ヨソウ 金額 キンガク 金額 キンガク 増減額 ゾウゲンガク 増減率 ゾウゲン リツ 医療用医薬品 イリョウヨウ イヤクヒン 27400 30950 +05 ジェネリック医薬品(荷離) イヤクヒン ニ バナレ 25079 27430 +01 内自社販売 ウチ ジシャ ハンバイ 2321 25100 +01 内導出輸出 ウチ ドウシュツ ユシュツ 3011 2330 +04 アムロジピン 1935 3040 +09 ランソプラゾール 1509 1890 24 プラバスタチン 1595 1570 +40 ラベプラゾール 1704 1570 16 リマプロストアルファデクス 1273 1660 26 ボグリボース 1013 1300 +21 ドネペジル 15357 1030 +16 その他 タ 3400 15370 +01 主力品 シュリョク ヒン 1975 3520 +35 ウラリット 1134 1970 03 ソレトン 290 1250 +102 カルバン 0 300 +34 ジェネリック医薬品事業 イヤクヒン ジギョウ 2015年3月期 ガツキ 2016年3月期(予想) ガツキ ヨソウ 金額 キンガク 金額 キンガク 増減額 ゾウゲンガク 増減率 ゾウゲン リツ ジェネリック医薬品事業 イヤクヒン ジギョウ 28918 28840 +1003 ジェネリック医薬品(荷離) イヤクヒン ニ バナレ 27400 27430 +999 受託 ジュタク 1518 1410 +1077
Generics Proprietary Products (yenmn) FY2017 FY2018 (Forecast) Amount Amount YOY () Total 32153 31800 (11) Generics 30115 30150 01 To medical institutions 29174 29250 03 To other makers 941 900 (44) Amlodipine 2940 2900 (14) Lansoprazole 2163 1900 (122) Donepezil 1557 1350 (133) Rabeprazole 1558 1350 (134) Limaprost Alfadex 1427 1350 (55) Pravastatine 1147 1100 (41) Voglibose 870 750 (139) Others 18449 19450 54 Proprietary products 2038 1650 (190) Uralyt 1225 1070 (127) Soleton 598 400 (331) Calvan 214 180 (162) Chemiphar ODM Generics (yenmn) FY2017 FY2018 (Forecast) Amount Amount YOY () Total 31100 31350 08 Generics 30115 30150 01 Generics (ODM) 985 1200 218
Income Statement Overview (yenmn) FY2017 FY2018 (Forecast) of of YOY Amount Sales Amount Sales () Net Sales 35331 1000 35500 1000 05 Pharmaceuticals 34279 970 ― ― ― Others 1051 30 ― ― ― Cost of sales 19535 553 ― ― ― SGampA expenses 13947 395 ― ― ― RampD expenses 2280 65 2700 76 184 Operating income 1848 0 52 1100 31 (405) Income before income taxes and minority interests 1777 80 ― ― ― Net income attributble to owners of the parent 1160 33 500 14 (569)
Capital Expenditure and Other (yenmn) Items FY2016 FY2017 Usage Amount Amount YOY () Forecast Rate () Capital expenditure 2928 1645 (438) 1650 997 Depreciation and amortization 1112 1192 72 1250 954 Revised forecast issued on October 31 2017
Cash Flow Statements (yenmn) FY2016 FY2017 Amount Amount Net cash Provided by operating activities 2737 3188 Used in investing activities (2504) (1606) Used in financing activities 787 (1741) Cash and cash equivalents 8084 7890 Free cash flow 232 1582
Per Share Information (yen) FY2016 FY2017 Amount Amount Change Forecast Earnings per share 53002 31528 (21474) 30673 Book value per share 454880 485986 31106 ― Dividend per share 10000 10000 ― 10000 Dividend payout ratio () 189 317 ― 326 Revised forecast issued on October 31 2017
Balance Sheet Data (yenmn) March 31 2017 March 31 2018 March 31 2015 Amount Amount Change Total assets 47002 46814 3358 (187) Return on assets () 63 36 -06 (27) Net assets 17355 17487 1313 132 Owned capital 17346 17474 1312 127 Capital-to-asset ratio () 369 373 02 04 Return on equity () 123 67 (01) (56) Current assets 29009 28334 1630 (674) Current liabilities 14939 14914 (716) (25) Current ratio (x) 194 19 019 (004)
By Main Therapeutic Categories () FY2016 FY2017 Cardiovascular and respiratory drugs 309 320 Digestive organ drugs 196 183 Agents affecting metabolism 164 165 Drugs for nervous system sensory organs 99 91 Antibiotics and chemotherapeutic drugs 65 62 Antineoplastic agents 32 34 Others 135 145
Sales Distribution By Launch Year (yenmn) FY2016 FY2017 Fiscal Year Amount Distrib () Amount Distrib () YOY () 2010 and before 19487 1 667 19194 637 (15) 2009 2011 2348 0 80 2210 73 (59) 2012 1484 0 51 1404 47 (54) 2013 2917 0 100 3127 104 72 2014 1746 0 60 1937 64 110 2015 1001 0 34 1222 41 221 2016 219 0 08 459 15 1091 2017 ― ― 558 19 ― Total 29204 1 1000 30115 1000 31
Generics Proprietary Products (yenmn) FY2016 FY2017 Distrib Distrib YOY Achieved Amount () Amount () () Forecast () Total 31513 1 1000 32153 1 1000 20 32000 1005 Generics 29204 1 927 30115 1 937 31 30000 1 1004 To medical institutions 27808 29174 49 29100 1 1003 To other makers 1395 941 (326) 900 1 1046 Amlodipine 2865 2940 26 2900 1 1014 Lansoprazole 2279 2163 (51) 2100 1 1030 Donepezil 1642 1557 (52) 1600 1 973 Rabeprazole 1586 1558 (18) 1600 1 974 Limaprost Alfadex 1469 1427 (28) 1400 1 1020 Pravastatine 1173 1147 (22) 1100 1 1043 Voglibose 957 870 (91) 900 1 967 Others 17229 18449 71 18400 1 1003 Proprietary products 2308 0 73 2038 0 63 (117) 2000 1 1019 Uralyt 1409 1225 (131) 1200 1 1021 Soleton 679 598 (120) 600 1 997 Calvan 219 214 (21) 200 1 1074 Chemiphar ODM Generics (yenmn) FY2016 FY2017 Distrib Distrib YOY Achieved Amount () Amount () () Forecast () Total 30445 1000 31100 1000 22 31400 990 Generics 29204 959 30115 968 31 30000 1004 Generics (ODM) 1240 41 985 32 (206) 1400 704 Includes exports Revised forecast issued on October 31 2017
Income Statement Overview (yenmn) FY2016 FY2017 of of YOY Achieved Amount Sales Amount Sales () Forecast () Net Sales 35689 1 1000 35331 1 1000 (10) 35500 1 995 Pharmaceuticals 34551 1 968 34279 1 970 (08) ― ― Others 1137 0 32 1051 0 30 (76) ― ― Cost of sales 19449 1 545 19535 1 553 04 ― ― SGampA expenses 13403 0 376 13947 0 395 41 ― ― RampD expenses 1984 0 56 2280 0 65 150 2200 0 1037 Operating income 2836 0 79 1848 0 52 (348) 1800 0 1027 Income before income taxes and minority interests 2849 0 80 1777 0 50 (376) ― ― Net income attributble to owners of the parent 2054 0 58 1160 0 33 (435) 1150 ― 1009 1961 00550933658 00550933658 00575628587 Revised forecast issued on October 31 2017
Per Share Information (yen) FY2017 FY2018 (Forecast) Amount Amount YOY () Earnings per share 31528 13584 (569) Book value per share 485986 ― ― Dividends per share 10000 7500 ― Dividend payout ratio() 317 552 ― Capital Expenditure and Other (yenmn) FY2017 FY2018 (Forecast) Amount Amount Change Capital expenditure 1645 950 (695) Depreciation and amortization 1192 1350 157 2015年3月期 ガツキ 2016年3月期(予想) ガツキ ヨソウ 金額 キンガク 金額 キンガク 増減額 ゾウゲンガク 増減率 ゾウゲン リツ 医療用医薬品 イリョウヨウ イヤクヒン 27400 30950 +05 ジェネリック医薬品(荷離) イヤクヒン ニ バナレ 25079 27430 +01 内自社販売 ウチ ジシャ ハンバイ 2321 25100 +01 内導出輸出 ウチ ドウシュツ ユシュツ 3011 2330 +04 アムロジピン 1935 3040 +09 ランソプラゾール 1509 1890 24 プラバスタチン 1595 1570 +40 ラベプラゾール 1704 1570 16 リマプロストアルファデクス 1273 1660 26 ボグリボース 1013 1300 +21 ドネペジル 15357 1030 +16 その他 タ 3400 15370 +01 主力品 シュリョク ヒン 1975 3520 +35 ウラリット 1134 1970 03 ソレトン 290 1250 +102 カルバン 0 300 +34 ジェネリック医薬品事業 イヤクヒン ジギョウ 2015年3月期 ガツキ 2016年3月期(予想) ガツキ ヨソウ 金額 キンガク 金額 キンガク 増減額 ゾウゲンガク 増減率 ゾウゲン リツ ジェネリック医薬品事業 イヤクヒン ジギョウ 28918 28840 +1003 ジェネリック医薬品(荷離) イヤクヒン ニ バナレ 27400 27430 +999 受託 ジュタク 1518 1410 +1077
Generics Proprietary Products (yenmn) FY2017 FY2018 (Forecast) Amount Amount YOY () Total 32153 31800 (11) Generics 30115 30150 01 To medical institutions 29174 29250 03 To other makers 941 900 (44) Amlodipine 2940 2900 (14) Lansoprazole 2163 1900 (122) Donepezil 1557 1350 (133) Rabeprazole 1558 1350 (134) Limaprost Alfadex 1427 1350 (55) Pravastatine 1147 1100 (41) Voglibose 870 750 (139) Others 18449 19450 54 Proprietary products 2038 1650 (190) Uralyt 1225 1070 (127) Soleton 598 400 (331) Calvan 214 180 (162) Chemiphar ODM Generics (yenmn) FY2017 FY2018 (Forecast) Amount Amount YOY () Total 31100 31350 08 Generics 30115 30150 01 Generics (ODM) 985 1200 218
Income Statement Overview (yenmn) FY2017 FY2018 (Forecast) of of YOY Amount Sales Amount Sales () Net Sales 35331 1000 35500 1000 05 Pharmaceuticals 34279 970 ― ― ― Others 1051 30 ― ― ― Cost of sales 19535 553 ― ― ― SGampA expenses 13947 395 ― ― ― RampD expenses 2280 65 2700 76 184 Operating income 1848 0 52 1100 31 (405) Income before income taxes and minority interests 1777 80 ― ― ― Net income attributble to owners of the parent 1160 33 500 14 (569)
Capital Expenditure and Other (yenmn) Items FY2016 FY2017 Usage Amount Amount YOY () Forecast Rate () Capital expenditure 2928 1645 (438) 1650 997 Depreciation and amortization 1112 1192 72 1250 954 Revised forecast issued on October 31 2017
Cash Flow Statements (yenmn) FY2016 FY2017 Amount Amount Net cash Provided by operating activities 2737 3188 Used in investing activities (2504) (1606) Used in financing activities 787 (1741) Cash and cash equivalents 8084 7890 Free cash flow 232 1582
Per Share Information (yen) FY2016 FY2017 Amount Amount Change Forecast Earnings per share 53002 31528 (21474) 30673 Book value per share 454880 485986 31106 ― Dividend per share 10000 10000 ― 10000 Dividend payout ratio () 189 317 ― 326 Revised forecast issued on October 31 2017
Balance Sheet Data (yenmn) March 31 2017 August 31 2017 March 31 2015 Amount Amount Change Total assets 47002 46814 3358 (187) Return on assets () 63 36 -06 (27) Net assets 17355 17487 1313 132 Owned capital 17346 17474 1312 127 Capital-to-asset ratio () 369 373 02 +04 Return on equity () 123 67 (01) (56) Current assets 29009 28334 1630 (674) Current liabilities 14939 14914 (716) (25) Current ratio (x) 194 19 019 004
By Main Therapeutic Categories () FY2016 FY2017 Cardiovascular and respiratory drugs 309 320 Digestive organ drugs 196 183 Agents affecting metabolism 164 165 Drugs for nervous system sensory organs 99 91 Antibiotics and chemotherapeutic drugs 65 62 Antineoplastic agents 32 34 Others 135 145
Sales Distribution By Launch Year (yenmn) FY2016 FY2017 Fiscal Year Amount Distrib () Amount Distrib () YOY () 2010 and before 19487 1 667 19194 637 (15) 2009 2011 2348 0 80 2210 73 (59) 2012 1484 0 51 1404 47 (54) 2013 2917 0 100 3127 104 72 2014 1746 0 60 1937 64 110 2015 1001 0 34 1222 41 221 2016 219 0 08 459 15 1091 2017 ― ― ― 558 19 ― Total 29204 1 1000 30115 1000 31
Generics Proprietary Products (yenmn) FY2016 FY2017 Distrib Distrib YOY Achieved Amount () Amount () () Forecast () Total 31513 1 1000 32153 1 1000 20 32000 1005 Generics 29204 1 927 30115 1 937 31 30000 1 1004 To medical institutions 27808 29174 49 29100 1 1003 To other makers 1395 941 (326) 900 1 1046 Amlodipine 2865 2940 26 2900 1 1014 Lansoprazole 2279 2163 (51) 2100 1 1030 Donepezil 1642 1557 (52) 1600 1 973 Rabeprazole 1586 1558 (18) 1600 1 974 Limaprost Alfadex 1469 1427 (28) 1400 1 1020 Pravastatine 1173 1147 (22) 1100 1 1043 Voglibose 957 870 (91) 900 1 967 Others 17229 18449 71 18400 1 1003 Proprietary products 2308 0 73 2038 0 63 (117) 2000 1 1019 Uralyt 1409 1225 (131) 1200 1 1021 Soleton 679 598 (120) 600 1 997 Calvan 219 214 (21) 200 1 1074 Chemiphar ODM Generics (yenmn) FY2016 FY2017 Distrib Distrib YOY Achieved Amount () Amount () () Forecast () Total 30445 1000 31100 1000 22 31400 990 Generics 29204 959 30115 968 31 30000 1004 Generics (ODM) 1240 41 985 32 (206) 1400 704 Includes exports Revised forecast issued on October 31 2017
Income Statement Overview (yenmn) FY2016 FY2017 of of YOY Achieved Amount Sales Amount Sales () Forecast () Net Sales 35689 1 1000 35331 1 1000 (10) 35500 1 995 Pharmaceuticals 34551 1 968 34279 1 970 (08) ― ― ― Others 1137 0 32 1051 0 30 (76) ― ― ― Cost of sales 19449 1 545 19535 1 553 04 ― ― ― SGampA expenses 13403 0 376 13947 0 395 41 ― ― ― RampD expenses 1984 0 56 2280 0 65 150 2200 0 1037 Operating income 2836 0 79 1848 0 52 (348) 1800 0 1027 Income before income taxes and minority interests 2849 0 80 1696 0 48 (405) 1700 ― 998 Net income attributble to owners of the parent 2054 0 58 1160 0 33 (435) 1150 ― 1009 1961 00550933658 00550933658 00575628587 Revised forecast issued on October 31 2017
Per Share Information (yen) FY2017 FY2018 (Forecast) Amount Amount YOY () Earnings per share 31528 13584 (569) Book value per share 485986 ― ― Dividends per share 10000 7500 ― Dividend payout ratio() 317 552 ― Capital Expenditure and Other (yenmn) FY2017 FY2018 (Forecast) Amount Amount Change Capital expenditure 1645 950 (695) Depreciation and amortization 1192 1350 157 2015年3月期 ガツキ 2016年3月期(予想) ガツキ ヨソウ 金額 キンガク 金額 キンガク 増減額 ゾウゲンガク 増減率 ゾウゲン リツ 医療用医薬品 イリョウヨウ イヤクヒン 27400 30950 +05 ジェネリック医薬品(荷離) イヤクヒン ニ バナレ 25079 27430 +01 内自社販売 ウチ ジシャ ハンバイ 2321 25100 +01 内導出輸出 ウチ ドウシュツ ユシュツ 3011 2330 +04 アムロジピン 1935 3040 +09 ランソプラゾール 1509 1890 24 プラバスタチン 1595 1570 +40 ラベプラゾール 1704 1570 16 リマプロストアルファデクス 1273 1660 26 ボグリボース 1013 1300 +21 ドネペジル 15357 1030 +16 その他 タ 3400 15370 +01 主力品 シュリョク ヒン 1975 3520 +35 ウラリット 1134 1970 03 ソレトン 290 1250 +102 カルバン 0 300 +34 ジェネリック医薬品事業 イヤクヒン ジギョウ 2015年3月期 ガツキ 2016年3月期(予想) ガツキ ヨソウ 金額 キンガク 金額 キンガク 増減額 ゾウゲンガク 増減率 ゾウゲン リツ ジェネリック医薬品事業 イヤクヒン ジギョウ 28918 28840 +1003 ジェネリック医薬品(荷離) イヤクヒン ニ バナレ 27400 27430 +999 受託 ジュタク 1518 1410 +1077
Generics Proprietary Products (yenmn) FY2017 FY2018 (Forecast) Amount Amount YOY () Total 32153 31800 (11) Generics 30115 30150 01 To medical institutions 29174 29250 03 To other makers 941 900 (44) Amlodipine 2940 2900 (14) Lansoprazole 2163 1900 (122) Donepezil 1557 1350 (133) Rabeprazole 1558 1350 (134) Limaprost Alfadex 1427 1350 (55) Pravastatine 1147 1100 (41) Voglibose 870 750 (139) Others 18449 19450 54 Proprietary products 2038 1650 (190) Uralyt 1225 1070 (127) Soleton 598 400 (331) Calvan 214 180 (162) Chemiphar ODM Generics (yenmn) FY2017 FY2018 (Forecast) Amount Amount YOY () Total 31100 31350 08 Generics 30115 30150 01 Generics (ODM) 985 1200 218
Income Statement Overview (yenmn) FY2017 FY2018 (Forecast) of of YOY Amount Sales Amount Sales () Net Sales 35331 1000 35500 1000 05 Pharmaceuticals 34279 970 ― ― ― Others 1051 30 ― ― ― Cost of sales 19535 553 ― ― ― SGampA expenses 13947 395 ― ― ― RampD expenses 2280 65 2700 76 184 Operating income 1848 0 52 1100 31 (405) Income before income taxes and minority interests 1777 80 ― ― ― Net income attributble to owners of the parent 1160 33 500 14 (569)
Capital Expenditure and Other (yenmn) Items FY2016 FY2017 Usage Amount Amount YOY () Forecast Rate () Capital expenditure 2928 1645 (438) 1650 997 Depreciation and amortization 1112 1192 72 1250 954 Revised forecast issued on October 31 2017
Cash Flow Statements (yenmn) FY2016 FY2017 Amount Amount Net cash Provided by operating activities 2737 3188 Used in investing activities (2504) (1606) Used in financing activities 787 (1741) Cash and cash equivalents 8084 7890 Free cash flow 232 1582
Per Share Information (yen) FY2016 FY2017 Amount Amount Change Forecast Earnings per share 53002 31528 (21474) 30673 Book value per share 454880 485986 31106 ― Dividend per share 10000 10000 ― 10000 Dividend payout ratio () 189 317 ― 326 Revised forecast issued on October 31 2017
Balance Sheet Data (yenmn) March 31 2017 August 31 2017 March 31 2015 Amount Amount Change Total assets 47002 46814 3358 (187) Return on assets () 63 36 -06 (27) Net assets 17355 17487 1313 132 Owned capital 17346 17474 1312 127 Capital-to-asset ratio () 369 373 02 +04 Return on equity () 123 67 (01) (56) Current assets 29009 28334 1630 (674) Current liabilities 14939 14914 (716) (25) Current ratio (x) 194 19 019 004
By Main Therapeutic Categories () FY2016 FY2017 Cardiovascular and respiratory drugs 309 320 Digestive organ drugs 196 183 Agents affecting metabolism 164 165 Drugs for nervous system sensory organs 99 91 Antibiotics and chemotherapeutic drugs 65 62 Antineoplastic agents 32 34 Others 135 145
Sales Distribution By Launch Year (yenmn) FY2016 FY2017 Fiscal Year Amount Distrib () Amount Distrib () YOY () 2010 and before 19487 1 667 19194 637 (15) 2009 2011 2348 0 80 2210 73 (59) 2012 1484 0 51 1404 47 (54) 2013 2917 0 100 3127 104 72 2014 1746 0 60 1937 64 110 2015 1001 0 34 1222 41 221 2016 219 0 08 459 15 1091 2017 ― ― 558 19 ― Total 29204 1 1000 30115 1000 31
Generics Proprietary Products (yenmn) FY2016 FY2017 Distrib Distrib YOY Achieved Amount () Amount () () Forecast () Total 31513 1 1000 32153 1 1000 20 32000 1005 Generics 29204 1 927 30115 1 937 31 30000 1 1004 To medical institutions 27808 29174 49 29100 1 1003 To other makers 1395 941 (326) 900 1 1046 Amlodipine 2865 2940 26 2900 1 1014 Lansoprazole 2279 2163 (51) 2100 1 1030 Donepezil 1642 1557 (52) 1600 1 973 Rabeprazole 1586 1558 (18) 1600 1 974 Limaprost Alfadex 1469 1427 (28) 1400 1 1020 Pravastatine 1173 1147 (22) 1100 1 1043 Voglibose 957 870 (91) 900 1 967 Others 17229 18449 71 18400 1 1003 Proprietary products 2308 0 73 2038 0 63 (117) 2000 1 1019 Uralyt 1409 1225 (131) 1200 1 1021 Soleton 679 598 (120) 600 1 997 Calvan 219 214 (21) 200 1 1074 Chemiphar ODM Generics (yenmn) FY2016 FY2017 Distrib Distrib YOY Achieved Amount () Amount () () Forecast () Total 30445 1000 31100 1000 22 31400 990 Generics 29204 959 30115 968 31 30000 1004 Generics (ODM) 1240 41 985 32 (206) 1400 704 Includes exports Revised forecast issued on October 31 2017
Income Statement Overview (yenmn) FY2016 FY2017 of of YOY Achieved Amount Sales Amount Sales () Forecast () Net Sales 35689 1 1000 35331 1 1000 (10) 35500 1 995 Pharmaceuticals 34551 1 968 34279 1 970 (08) ― ― Others 1137 0 32 1051 0 30 (76) ― ― Cost of sales 19449 1 545 19535 1 553 04 ― ― SGampA expenses 13403 0 376 13947 0 395 41 ― ― RampD expenses 1984 0 56 2280 0 65 150 2200 0 1037 Operating income 2836 0 79 1848 0 52 (348) 1800 0 1027 Income before income taxes and minority interests 2849 0 80 1696 0 48 (405) 1700 ― 998 Net income attributble to owners of the parent 2054 0 58 1160 0 33 (435) 1150 ― 1009 1961 00550933658 00550933658 00575628587 Revised forecast issued on October 31 2017
Per Share Information (yen) FY2017 FY2018 (Forecast) Amount Amount YOY () Earnings per share 31528 13584 (569) Book value per share 485986 ― ― Dividends per share 10000 7500 ― Dividend payout ratio() 317 552 ― Capital Expenditure and Other (yenmn) FY2017 FY2018 (Forecast) Amount Amount Change Capital expenditure 1645 950 (695) Depreciation and amortization 1192 1350 157 2015年3月期 ガツキ 2016年3月期(予想) ガツキ ヨソウ 金額 キンガク 金額 キンガク 増減額 ゾウゲンガク 増減率 ゾウゲン リツ 医療用医薬品 イリョウヨウ イヤクヒン 27400 30950 +05 ジェネリック医薬品(荷離) イヤクヒン ニ バナレ 25079 27430 +01 内自社販売 ウチ ジシャ ハンバイ 2321 25100 +01 内導出輸出 ウチ ドウシュツ ユシュツ 3011 2330 +04 アムロジピン 1935 3040 +09 ランソプラゾール 1509 1890 24 プラバスタチン 1595 1570 +40 ラベプラゾール 1704 1570 16 リマプロストアルファデクス 1273 1660 26 ボグリボース 1013 1300 +21 ドネペジル 15357 1030 +16 その他 タ 3400 15370 +01 主力品 シュリョク ヒン 1975 3520 +35 ウラリット 1134 1970 03 ソレトン 290 1250 +102 カルバン 0 300 +34 ジェネリック医薬品事業 イヤクヒン ジギョウ 2015年3月期 ガツキ 2016年3月期(予想) ガツキ ヨソウ 金額 キンガク 金額 キンガク 増減額 ゾウゲンガク 増減率 ゾウゲン リツ ジェネリック医薬品事業 イヤクヒン ジギョウ 28918 28840 +1003 ジェネリック医薬品(荷離) イヤクヒン ニ バナレ 27400 27430 +999 受託 ジュタク 1518 1410 +1077
Generics Proprietary Products (yenmn) FY2017 FY2018 (Forecast) Amount Amount YOY () Total 32153 31800 (11) Generics 30115 30150 01 To medical institutions 29174 29250 03 To other makers 941 900 (44) Amlodipine 2940 2900 (14) Lansoprazole 2163 1900 (122) Donepezil 1557 1350 (133) Rabeprazole 1558 1350 (134) Limaprost Alfadex 1427 1350 (55) Pravastatine 1147 1100 (41) Voglibose 870 750 (139) Others 18449 19450 54 Proprietary products 2038 1650 (190) Uralyt 1225 1070 (127) Soleton 598 400 (331) Calvan 214 180 (162) Chemiphar ODM Generics (yenmn) FY2017 FY2018 (Forecast) Amount Amount YOY () Total 31100 31350 08 Generics 30115 30150 01 Generics (ODM) 985 1200 218
Income Statement Overview (yenmn) FY2017 FY2018 (Forecast) of of YOY Amount Sales Amount Sales () Net Sales 35331 1000 35500 1000 05 Pharmaceuticals 34279 970 ― ― ― Others 1051 30 ― ― ― Cost of sales 19535 553 ― ― ― SGampA expenses 13947 395 ― ― ― RampD expenses 2280 65 2700 76 184 Operating income 1848 0 52 1100 31 (405) Income before income taxes and minority interests 1777 80 ― ― ― Net income attributble to owners of the parent 1160 33 500 14 (569)
Capital Expenditure and Other (yenmn) Items FY2016 FY2017 Usage Amount Amount YOY () Forecast Rate () Capital expenditure 2928 1645 (438) 1650 997 Depreciation and amortization 1112 1192 72 1250 954 Revised forecast issued on October 31 2017
Cash Flow Statements (yenmn) FY2016 FY2017 Amount Amount Net cash Provided by operating activities 2737 3188 Used in investing activities (2504) (1606) Used in financing activities 787 (1741) Cash and cash equivalents 8084 7890 Free cash flow 232 1582
Per Share Information (yen) FY2016 FY2017 Amount Amount Change Forecast Earnings per share 53002 31528 (21474) 30673 Book value per share 454880 485986 31106 ― Dividend per share 10000 10000 ― 10000 Dividend payout ratio () 189 317 ― 326 Revised forecast issued on October 31 2017
Balance Sheet Data (yenmn) March 31 2017 August 31 2017 March 31 2015 Amount Amount Change Total assets 47002 46814 3358 (187) Return on assets () 63 36 -06 (27) Net assets 17355 17487 1313 132 Owned capital 17346 17474 1312 127 Capital-to-asset ratio () 369 373 02 +04 Return on equity () 123 67 (01) (56) Current assets 29009 28334 1630 (674) Current liabilities 14939 14914 (716) (25) Current ratio (x) 194 19 019 004
By Main Therapeutic Categories () FY2016 FY2017 Cardiovascular and respiratory drugs 309 320 Digestive organ drugs 196 183 Agents affecting metabolism 164 165 Drugs for nervous system sensory organs 99 91 Antibiotics and chemotherapeutic drugs 65 62 Antineoplastic agents 32 34 Others 135 145
Sales Distribution By Launch Year (yenmn) FY2016 FY2017 Fiscal Year Amount Distrib () Amount Distrib () YOY () 2010 and before 19487 1 667 19194 637 (15) 2009 2011 2348 0 80 2210 73 (59) 2012 1484 0 51 1404 47 (54) 2013 2917 0 100 3127 104 72 2014 1746 0 60 1937 64 110 2015 1001 0 34 1222 41 221 2016 219 0 08 459 15 1091 2017 ― ― ― 558 19 ― Total 29204 1 1000 30115 1000 31
Generics Proprietary Products (yenmn) FY2016 FY2017 Distrib Distrib YOY Achieved Amount () Amount () () Forecast () Total 31513 1 1000 32153 1 1000 20 32000 1005 Generics 29204 1 927 30115 1 937 31 30000 1 1004 To medical institutions 27808 29174 49 29100 1 1003 To other makers 1395 941 (326) 900 1 1046 Amlodipine 2865 2940 26 2900 1 1014 Lansoprazole 2279 2163 (51) 2100 1 1030 Donepezil 1642 1557 (52) 1600 1 973 Rabeprazole 1586 1558 (18) 1600 1 974 Limaprost Alfadex 1469 1427 (28) 1400 1 1020 Pravastatine 1173 1147 (22) 1100 1 1043 Voglibose 957 870 (91) 900 1 967 Others 17229 18449 71 18400 1 1003 Proprietary products 2308 0 73 2038 0 63 (117) 2000 1 1019 Uralyt 1409 1225 (131) 1200 1 1021 Soleton 679 598 (120) 600 1 997 Calvan 219 214 (21) 200 1 1074 Chemiphar ODM Generics (yenmn) FY2016 FY2017 Distrib Distrib YOY Achieved Amount () Amount () () Forecast () Total 30445 1000 31100 1000 22 31400 990 Generics 29204 959 30115 968 31 30000 1004 Generics (ODM) 1240 41 985 32 (206) 1400 704 Includes exports Revised forecast issued on October 31 2017
Income Statement Overview (yenmn) FY2016 FY2017 of of YOY Achieved Amount Sales Amount Sales () Forecast () Net Sales 35689 1 1000 35331 1 1000 (10) 35500 1 995 Pharmaceuticals 34551 1 968 34279 1 970 (08) ― ― ― Others 1137 0 32 1051 0 30 (76) ― ― ― Cost of sales 19449 1 545 19535 1 553 04 ― ― ― SGampA expenses 13403 0 376 13947 0 395 41 ― ― ― RampD expenses 1984 0 56 2280 0 65 150 2200 0 1037 Operating income 2836 0 79 1848 0 52 (348) 1800 0 1027 Income before income taxes and minority interests 2849 0 80 1696 0 48 (405) 1700 ― 998 Net income attributble to owners of the parent 2054 0 58 1160 0 33 (435) 1150 ― 1009 1961 00550933658 00550933658 00575628587 Revised forecast issued on October 31 2017
Per Share Information (yen) FY2017 FY2018 (Forecast) Amount Amount YOY () Earnings per share 31528 13584 (569) Book value per share 485986 ― ― Dividends per share 10000 7500 ― Dividend payout ratio() 317 552 ― Capital Expenditure and Other (yenmn) FY2017 FY2018 (Forecast) Amount Amount Change Capital expenditure 1645 950 (695) Depreciation and amortization 1192 1350 157 2015年3月期 ガツキ 2016年3月期(予想) ガツキ ヨソウ 金額 キンガク 金額 キンガク 増減額 ゾウゲンガク 増減率 ゾウゲン リツ 医療用医薬品 イリョウヨウ イヤクヒン 27400 30950 +05 ジェネリック医薬品(荷離) イヤクヒン ニ バナレ 25079 27430 +01 内自社販売 ウチ ジシャ ハンバイ 2321 25100 +01 内導出輸出 ウチ ドウシュツ ユシュツ 3011 2330 +04 アムロジピン 1935 3040 +09 ランソプラゾール 1509 1890 24 プラバスタチン 1595 1570 +40 ラベプラゾール 1704 1570 16 リマプロストアルファデクス 1273 1660 26 ボグリボース 1013 1300 +21 ドネペジル 15357 1030 +16 その他 タ 3400 15370 +01 主力品 シュリョク ヒン 1975 3520 +35 ウラリット 1134 1970 03 ソレトン 290 1250 +102 カルバン 0 300 +34 ジェネリック医薬品事業 イヤクヒン ジギョウ 2015年3月期 ガツキ 2016年3月期(予想) ガツキ ヨソウ 金額 キンガク 金額 キンガク 増減額 ゾウゲンガク 増減率 ゾウゲン リツ ジェネリック医薬品事業 イヤクヒン ジギョウ 28918 28840 +1003 ジェネリック医薬品(荷離) イヤクヒン ニ バナレ 27400 27430 +999 受託 ジュタク 1518 1410 +1077
Generics Proprietary Products (yenmn) FY2017 FY2018 (Forecast) Amount Amount YOY () Total 32153 31800 (11) Generics 30115 30150 01 To medical institutions 29174 29250 03 To other makers 941 900 (44) Amlodipine 2940 2900 (14) Lansoprazole 2163 1900 (122) Donepezil 1557 1350 (133) Rabeprazole 1558 1350 (134) Limaprost Alfadex 1427 1350 (55) Pravastatine 1147 1100 (41) Voglibose 870 750 (139) Others 18449 19450 54 Proprietary products 2038 1650 (190) Uralyt 1225 1070 (127) Soleton 598 400 (331) Calvan 214 180 (162) Chemiphar ODM Generics (yenmn) FY2017 FY2018 (Forecast) Amount Amount YOY () Total 31100 31350 08 Generics 30115 30150 01 Generics (ODM) 985 1200 218
Income Statement Overview (yenmn) FY2017 FY2018 (Forecast) of of YOY Amount Sales Amount Sales () Net Sales 35331 1000 35500 1000 05 Pharmaceuticals 34279 970 ― ― ― Others 1051 30 ― ― ― Cost of sales 19535 553 ― ― ― SGampA expenses 13947 395 ― ― ― RampD expenses 2280 65 2700 76 184 Operating income 1848 0 52 1100 31 (405) Income before income taxes and minority interests 1777 80 ― ― ― Net income attributble to owners of the parent 1160 33 500 14 (569)
Capital Expenditure and Other (yenmn) Items FY2016 FY2017 Usage Amount Amount YOY () Forecast Rate () Capital expenditure 2928 1645 (438) 1650 997 Depreciation and amortization 1112 1192 72 1250 954 Revised forecast issued on October 31 2017
Cash Flow Statements (yenmn) FY2016 FY2017 Amount Amount Net cash Provided by operating activities 2737 3188 Used in investing activities (2504) (1606) Used in financing activities 787 (1741) Cash and cash equivalents 8084 7890 Free cash flow 232 1582
Per Share Information (yen) FY2016 FY2017 Amount Amount Change Forecast Earnings per share 53002 31528 (21474) 30673 Book value per share 454880 485986 31106 ― Dividend per share 10000 10000 ― 10000 Dividend payout ratio () 189 317 ― 326 Revised forecast issued on October 31 2017
Balance Sheet Data (yenmn) March 31 2017 August 31 2017 March 31 2015 Amount Amount Change Total assets 47002 46814 3358 (187) Return on assets () 63 36 -06 (27) Net assets 17355 17487 1313 132 Owned capital 17346 17474 1312 127 Capital-to-asset ratio () 369 373 02 +04 Return on equity () 123 67 (01) (56) Current assets 29009 28334 1630 (674) Current liabilities 14939 14914 (716) (25) Current ratio (x) 194 19 019 004
By Main Therapeutic Categories () FY2016 FY2017 Cardiovascular and respiratory drugs 309 320 Digestive organ drugs 196 183 Agents affecting metabolism 164 165 Drugs for nervous system sensory organs 99 91 Antibiotics and chemotherapeutic drugs 65 62 Antineoplastic agents 32 34 Others 135 145
Sales Distribution By Launch Year (yenmn) FY2016 FY2017 Fiscal Year Amount Distrib () Amount Distrib () YOY () 2010 and before 19487 1 667 19194 637 (15) 2009 2011 2348 0 80 2210 73 (59) 2012 1484 0 51 1404 47 (54) 2013 2917 0 100 3127 104 72 2014 1746 0 60 1937 64 110 2015 1001 0 34 1222 41 221 2016 219 0 08 459 15 1091 2017 ― ― ― 558 19 ― Total 29204 1 1000 30115 1000 31
Generics Proprietary Products (yenmn) FY2016 FY2017 Distrib Distrib YOY Achieved Amount () Amount () () Forecast () Total 31513 1 1000 32153 1 1000 20 32000 1005 Generics 29204 1 927 30115 1 937 31 30000 1 1004 To medical institutions 27808 29174 49 29100 1 1003 To other makers 1395 941 (326) 900 1 1046 Amlodipine 2865 2940 26 2900 1 1014 Lansoprazole 2279 2163 (51) 2100 1 1030 Donepezil 1642 1557 (52) 1600 1 973 Rabeprazole 1586 1558 (18) 1600 1 974 Limaprost Alfadex 1469 1427 (28) 1400 1 1020 Pravastatine 1173 1147 (22) 1100 1 1043 Voglibose 957 870 (91) 900 1 967 Others 17229 18449 71 18400 1 1003 Proprietary products 2308 0 73 2038 0 63 (117) 2000 1 1019 Uralyt 1409 1225 (131) 1200 1 1021 Soleton 679 598 (120) 600 1 997 Calvan 219 214 (21) 200 1 1074 Chemiphar ODM Generics (yenmn) FY2016 FY2017 Distrib Distrib YOY Achieved Amount () Amount () () Forecast () Total 30445 1000 31100 1000 22 31400 990 Generics 29204 959 30115 968 31 30000 1004 Generics (ODM) 1240 41 985 32 (206) 1400 704 Includes exports Revised forecast issued on October 31 2017
Income Statement Overview (yenmn) FY2016 FY2017 of of YOY Achieved Amount Sales Amount Sales () Forecast () Net Sales 35689 1 1000 35331 1 1000 (10) 35500 1 995 Pharmaceuticals 34551 1 968 34279 1 970 (08) ― ― ― Others 1137 0 32 1051 0 30 (76) ― ― ― Cost of sales 19449 1 545 19535 1 553 04 ― ― ― SGampA expenses 13403 0 376 13947 0 395 41 ― ― ― RampD expenses 1984 0 56 2280 0 65 150 2200 0 1037 Operating income 2836 0 79 1848 0 52 (348) 1800 0 1027 Income before income taxes and minority interests 2849 0 80 1696 0 48 (405) 1700 ― 998 Net income attributble to owners of the parent 2054 0 58 1160 0 33 (435) 1150 ― 1009 1961 00550933658 00550933658 00575628587 Revised forecast issued on October 31 2017
Per Share Information (yen) FY2017 FY2018 (Forecast) Amount Amount YOY () Earnings per share 31528 13584 (569) Book value per share 485986 ― ― Dividends per share 10000 7500 ― Dividend payout ratio() 317 552 ― Capital Expenditure and Other (yenmn) FY2017 FY2018 (Forecast) Amount Amount Change Capital expenditure 1645 950 (695) Depreciation and amortization 1192 1350 157 2015年3月期 ガツキ 2016年3月期(予想) ガツキ ヨソウ 金額 キンガク 金額 キンガク 増減額 ゾウゲンガク 増減率 ゾウゲン リツ 医療用医薬品 イリョウヨウ イヤクヒン 27400 30950 +05 ジェネリック医薬品(荷離) イヤクヒン ニ バナレ 25079 27430 +01 内自社販売 ウチ ジシャ ハンバイ 2321 25100 +01 内導出輸出 ウチ ドウシュツ ユシュツ 3011 2330 +04 アムロジピン 1935 3040 +09 ランソプラゾール 1509 1890 24 プラバスタチン 1595 1570 +40 ラベプラゾール 1704 1570 16 リマプロストアルファデクス 1273 1660 26 ボグリボース 1013 1300 +21 ドネペジル 15357 1030 +16 その他 タ 3400 15370 +01 主力品 シュリョク ヒン 1975 3520 +35 ウラリット 1134 1970 03 ソレトン 290 1250 +102 カルバン 0 300 +34 ジェネリック医薬品事業 イヤクヒン ジギョウ 2015年3月期 ガツキ 2016年3月期(予想) ガツキ ヨソウ 金額 キンガク 金額 キンガク 増減額 ゾウゲンガク 増減率 ゾウゲン リツ ジェネリック医薬品事業 イヤクヒン ジギョウ 28918 28840 +1003 ジェネリック医薬品(荷離) イヤクヒン ニ バナレ 27400 27430 +999 受託 ジュタク 1518 1410 +1077
Generics Proprietary Products (yenmn) FY2017 FY2018 (Forecast) Amount Amount YOY () Total 32153 31800 (11) Generics 30115 30150 01 To medical institutions 29174 29250 03 To other makers 941 900 (44) Amlodipine 2940 2900 (14) Lansoprazole 2163 1900 (122) Donepezil 1557 1350 (133) Rabeprazole 1558 1350 (134) Limaprost Alfadex 1427 1350 (55) Pravastatine 1147 1100 (41) Voglibose 870 750 (139) Others 18449 19450 54 Proprietary products 2038 1650 (190) Uralyt 1225 1070 (127) Soleton 598 400 (331) Calvan 214 180 (162) Chemiphar ODM Generics (yenmn) FY2017 FY2018 (Forecast) Amount Amount YOY () Total 31100 31350 08 Generics 30115 30150 01 Generics (ODM) 985 1200 218
Income Statement Overview (yenmn) FY2017 FY2018 (Forecast) of of YOY Amount Sales Amount Sales () Net Sales 35331 1000 35500 1000 05 Pharmaceuticals 34279 970 ― ― ― Others 1051 30 ― ― ― Cost of sales 19535 553 ― ― ― SGampA expenses 13947 395 ― ― ― RampD expenses 2280 65 2700 76 184 Operating income 1848 0 52 1100 31 (405) Income before income taxes and minority interests 1777 80 ― ― ― Net income attributble to owners of the parent 1160 33 500 14 (569)
Capital Expenditure and Other (yenmn) Items FY2016 FY2017 Usage Amount Amount YOY () Forecast Rate () Capital expenditure 2928 1645 (438) 1650 997 Depreciation and amortization 1112 1192 72 1250 954 Revised forecast issued on October 31 2017
Cash Flow Statements (yenmn) FY2016 FY2017 Amount Amount Net cash Provided by operating activities 2737 3188 Used in investing activities (2504) (1606) Used in financing activities 787 (1741) Cash and cash equivalents 8084 7890 Free cash flow 232 1582
Per Share Information (yen) FY2016 FY2017 Amount Amount Change Forecast Earnings per share 53002 31528 (21474) 30673 Book value per share 454880 485986 31106 ― Dividend per share 10000 10000 ― 10000 Dividend payout ratio () 189 317 ― 326 Revised forecast issued on October 31 2017
Balance Sheet Data (yenmn) March 31 2017 August 31 2017 March 31 2015 Amount Amount Change Total assets 47002 46814 3358 (187) Return on assets () 63 36 -06 (27) Net assets 17355 17487 1313 132 Owned capital 17346 17474 1312 127 Capital-to-asset ratio () 369 373 02 +04 Return on equity () 123 67 (01) (56) Current assets 29009 28334 1630 (674) Current liabilities 14939 14914 (716) (25) Current ratio (x) 194 19 019 004
By Main Therapeutic Categories () FY2016 FY2017 Cardiovascular and respiratory drugs 309 320 Digestive organ drugs 196 183 Agents affecting metabolism 164 165 Drugs for nervous system sensory organs 99 91 Antibiotics and chemotherapeutic drugs 65 62 Antineoplastic agents 32 34 Others 135 145
Sales Distribution By Launch Year (yenmn) FY2016 FY2017 Fiscal Year Amount Distrib () Amount Distrib () YOY () 2010 and before 19487 1 667 19194 637 (15) 2009 2011 2348 0 80 2210 73 (59) 2012 1484 0 51 1404 47 (54) 2013 2917 0 100 3127 104 72 2014 1746 0 60 1937 64 110 2015 1001 0 34 1222 41 221 2016 219 0 08 459 15 1091 2017 ― ― 558 19 ― Total 29204 1 1000 30115 1000 31
Generics Proprietary Products (yenmn) FY2016 FY2017 Distrib Distrib YOY Achieved Amount () Amount () () Forecast () Total 31513 1 1000 32153 1 1000 20 32000 1005 Generics 29204 1 927 30115 1 937 31 30000 1 1004 To medical institutions 27808 29174 49 29100 1 1003 To other makers 1395 941 (326) 900 1 1046 Amlodipine 2865 2940 26 2900 1 1014 Lansoprazole 2279 2163 (51) 2100 1 1030 Donepezil 1642 1557 (52) 1600 1 973 Rabeprazole 1586 1558 (18) 1600 1 974 Limaprost Alfadex 1469 1427 (28) 1400 1 1020 Pravastatine 1173 1147 (22) 1100 1 1043 Voglibose 957 870 (91) 900 1 967 Others 17229 18449 71 18400 1 1003 Proprietary products 2308 0 73 2038 0 63 (117) 2000 1 1019 Uralyt 1409 1225 (131) 1200 1 1021 Soleton 679 598 (120) 600 1 997 Calvan 219 214 (21) 200 1 1074 Chemiphar ODM Generics (yenmn) FY2016 FY2017 Distrib Distrib YOY Achieved Amount () Amount () () Forecast () Total 30445 1000 31100 1000 22 31400 990 Generics 29204 959 30115 968 31 30000 1004 Generics (ODM) 1240 41 985 32 (206) 1400 704 Includes exports Revised forecast issued on October 31 2017
Income Statement Overview (yenmn) FY2016 FY2017 of of YOY Achieved Amount Sales Amount Sales () Forecast () Net Sales 35689 1 1000 35331 1 1000 (10) 35500 1 995 Pharmaceuticals 34551 1 968 34279 1 970 (08) ― ― Others 1137 0 32 1051 0 30 (76) ― ― Cost of sales 19449 1 545 19535 1 553 04 ― ― SGampA expenses 13403 0 376 13947 0 395 41 ― ― RampD expenses 1984 0 56 2280 0 65 150 2200 0 1037 Operating income 2836 0 79 1848 0 52 (348) 1800 0 1027 Income before income taxes and minority interests 2849 0 80 1777 0 50 (376) ― ― Net income attributble to owners of the parent 2054 0 58 1160 0 33 (435) 1150 ― 1009 1961 00550933658 00550933658 00575628587 Revised forecast issued on October 31 2017
Page 5
Pharmaceutical Sales
4
Generics Proprietary Products (yenmn)
Distrib Distrib YOY AchievedAmount () Amount () () Forecast ()
Total 31513 1000 32153 1000 20 32000 1005 Generics 29204 927 30115 937 31 30000 1004 To medical institutions 27808 29174 49 29100 1003 To other makers 1395 941 (326) 900 1046 Amlodipine 2865 2940 26 2900 1014 Lansoprazole 2279 2163 (51) 2100 1030 Donepezil 1642 1557 (52) 1600 973 Rabeprazole 1586 1558 (18) 1600 974 Limaprost Alfadex 1469 1427 (28) 1400 1020 Pravastatine 1173 1147 (22) 1100 1043 Voglibose 957 870 (91) 900 967 Others 17229 18449 71 18400 1003 Proprietary products 2308 73 2038 63 (117) 2000 1019 Uralyt 1409 1225 (131) 1200 1021 Soleton 679 598 (120) 600 997 Calvan 219 214 (21) 200 1074
Chemiphar ODM Generics (yenmn)
Distrib Distrib YOY AchievedAmount () Amount () () Forecast ()
Total 30445 1000 31100 1000 22 31400 990 Generics 29204 959 30115 968 31 30000 1004 Generics (ODM) 1240 41 985 32 (206) 1400 704 Includes exports Revised forecast issued on October 31 2017
FY2017
FY2016
FY2016
FY2017
PL 医薬品① 医薬品② 医薬品③ BS① BS③ 和文にある「前年同期間比」「前期3月末比」は記載が難しく英語版では必要度の低い情報であるとみなして記載をしないこととなった2016年2Q~(木村)ただし期末では記載が可能なので書きます(須田)
CF CAP EX 業績予想① 英語版では経常利益は書かないので注意(須田)
業績予想 ② 業績予想③ Sales Distribution
5
By Main Therapeutic Categories ()FY2016 FY2017
Cardiovascular and respiratory drugs 309 320Digestive organ drugs 196 183Agents affecting metabolism 164 165Drugs for nervous system sensory organs 99 91Antibiotics and chemotherapeutic drugs 65 62Antineoplastic agents 32 34Others 135 145
By Launch Year (yenmn)
Fiscal Year AmountDistrib
() AmountDistrib
() YOY ()2010 and before 19487 667 19194 637 (15)2011 2348 80 2210 73 (59)2012 1484 51 1404 47 (54)2013 2917 100 3127 104 722014 1746 60 1937 64 1102015 1001 34 1222 41 2212016 219 08 459 15 10912017 ― ― 558 19 ―Total 29204 1000 30115 1000 31
FY2016 FY2017
PL 医薬品① 医薬品② 医薬品③ BS① BS③ 和文にある「前年同期間比」「前期3月末比」は記載が難しく英語版では必要度の低い情報であるとみなして記載をしないこととなった2016年2Q~(木村)ただし期末では記載が可能なので書きます(須田)
CF CAP EX 業績予想① 英語版では経常利益は書かないので注意(須田)
業績予想 ② 業績予想③ PL 医薬品① 医薬品② 医薬品③ BS① BS③ 和文にある「前年同期間比」「前期3月末比」は記載が難しく英語版では必要度の低い情報であるとみなして記載をしないこととなった2016年2Q~(木村)ただし期末では記載が可能なので書きます(須田)
CF CAP EX 業績予想① 英語版では経常利益は書かないので注意(須田)
業績予想 ② 業績予想③ Balance Sheet per Share Information
6
Per Share Information (yen)FY2016Amount Amount Change Forecast
Earnings per share 53002 31528 (21474) 30673Book value per share 454880 485986 31106 ―Dividend per share 10000 10000 ― 10000Dividend payout ratio () 189 317 ― 326 Revised forecast issued on October 31 2017
FY2017
Balance Sheet Data (yenmn)March 31 2017
Amount Amount ChangeTotal assets 47002 46814 (187) Return on assets () 63 36 (27)Net assets 17355 17487 132 Owned capital 17346 17474 127 Capital-to-asset ratio () 369 373 04 Return on equity () 123 67 (56)Current assets 29009 28334 (674)Current liabilities 14939 14914 (25) Current ratio (x) 194 19 (004)
March 31 2018
PL 医薬品① 医薬品② 医薬品③ BS① BS③ 和文にある「前年同期間比」「前期3月末比」は記載が難しく英語版では必要度の低い情報であるとみなして記載をしないこととなった2016年2Q~(木村)ただし期末では記載が可能なので書きます(須田)
CF CAP EX 業績予想① 英語版では経常利益は書かないので注意(須田)
業績予想 ② 業績予想③ PL 医薬品① 医薬品② 医薬品③ BS① BS③ 和文にある「前年同期間比」「前期3月末比」は記載が難しく英語版では必要度の低い情報であるとみなして記載をしないこととなった2016年2Q~(木村)ただし期末では記載が可能なので書きます(須田)
CF CAP EX 業績予想① 英語版では経常利益は書かないので注意(須田)
業績予想 ② 業績予想③ Cash Flow Expenditure
7
Cash Flow Statements (yenmn)FY2016 FY2017Amount Amount
Net cash Provided by operating activities 2737 3188 Used in investing activities (2504) (1606) Provided by (Used in) financing activities 787 (1741)Cash and cash equivalents 8084 7890Free cash flow 232 1582
Capital Expenditure and Other (yenmn)FY2016
UsageAmount Amount YOY () Forecast Rate ()
Capital expenditure 2928 1645 (438) 1650 997Depreciation and amortization 1112 1192 72 1250 954 Revised forecast issued on October 31 2017
Items
FY2017
PL 医薬品① 医薬品② 医薬品③ BS① BS③ 和文にある「前年同期間比」「前期3月末比」は記載が難しく英語版では必要度の低い情報であるとみなして記載をしないこととなった2016年2Q~(木村)ただし期末では記載が可能なので書きます(須田)
CF CAP EX 業績予想① 英語版では経常利益は書かないので注意(須田)
業績予想 ② 業績予想③ PL 医薬品① 医薬品② 医薬品③ BS① BS③ 和文にある「前年同期間比」「前期3月末比」は記載が難しく英語版では必要度の低い情報であるとみなして記載をしないこととなった2016年2Q~(木村)ただし期末では記載が可能なので書きます(須田)
CF CAP EX 業績予想① 英語版では経常利益は書かないので注意(須田)
業績予想 ② 業績予想③ 8
II FY2018 Forecasts
Sales Income
9
(yenmn)
of of YOYAmount Sales Amount Sales ()
Net Sales 35331 1000 35500 1000 05 Pharmaceuticals 34279 970 ― ― ― Others 1051 30 ― ― ―Cost of sales 19535 553 ― ― ―SGampA expenses 13947 395 ― ― ― RampD expenses 2280 65 2700 76 184Operating income 1848 52 1100 31 (405)
1777 50 ― ― ―
1160 33 500 14 (569)Net income attributble to owners of the parent
FY2018 (Forecast)FY2017
Income before income taxes and minority interests
Annual ForecastSales and profit in FY2018 will be impacted by NHI drug price revisions On the other hand however due to our focus on newly launched products and expansion of new sales channels sales of generic drugs are expected to be nearly flat compared to the previous fiscal year As a result consolidated net sales including other businesses such as contracted testing business are projected to be yen35500 million (up 05 YOY)
Regarding profits due to increased development costs as the progress in new drug development and continued strategic expenses such as trial costs leading up to the commencement of commercial production at the Vietnam factory operating income is forecast at yen1100 million (down 405 YOY) and net income attributable to owners of the parent is expected to be yen500 million (down 569 YOY)
PL 医薬品① 医薬品② 医薬品③ BS① BS③ 和文にある「前年同期間比」「前期3月末比」は記載が難しく英語版では必要度の低い情報であるとみなして記載をしないこととなった2016年2Q~(木村)ただし期末では記載が可能なので書きます(須田)
CF CAP EX 業績予想① 英語版では経常利益は書かないので注意(須田)
業績予想 ② 業績予想③ Pharmaceutical Sales
10
Generics Proprietary Products (yenmn)FY2017Amount Amount YOY ()
Total 32153 31800 (11) Generics 30115 30150 01 To medical institutions 29174 29250 03 To other makers 941 900 (44) Amlodipine 2940 2900 (14) Lansoprazole 2163 1900 (122) Donepezil 1557 1350 (133) Rabeprazole 1558 1350 (134) Limaprost Alfadex 1427 1350 (55) Pravastatine 1147 1100 (41) Voglibose 870 750 (139) Others 18449 19450 54 Proprietary products 2038 1650 (190) Uralyt 1225 1070 (127) Soleton 598 400 (331) Calvan 214 180 (162)
Chemiphar ODM Generics (yenmn)FY2017Amount Amount YOY ()
Total 31100 31350 08 Generics 30115 30150 01 Generics (ODM) 985 1200 218
FY2018 (Forecast)
FY2018 (Forecast)
PL 医薬品① 医薬品② 医薬品③ BS① BS③ 和文にある「前年同期間比」「前期3月末比」は記載が難しく英語版では必要度の低い情報であるとみなして記載をしないこととなった2016年2Q~(木村)ただし期末では記載が可能なので書きます(須田)
CF CAP EX 業績予想① 英語版では経常利益は書かないので注意(須田)
業績予想 ② 業績予想③ Per Share Information Expenditure
11
For further information contactPublic Relations Department Nippon Chemiphar Co LtdE-mail irchemipharcojp
Note about Forward-looking Statements and ForecastsStatements made in this Highlights of Business Results with respect to current plans estimates strategies and beliefs and other statements of Nippon Chemiphar that are not historical facts are forward-looking statements about the future performance of Nippon Chemiphar
These statements are based on managementrsquos current assumptions and beliefs in light of the information currently available to it and involve known and unknown risks and uncertainties Consequently undue reliance should not be placed on these statements
Nippon Chemiphar cautions the reader that a number of important factors could cause actual results to differ materially from those discussed in the forward-looking statements
Per Share Information (yen)FY2017Amount Amount YOY ()
Earnings per share 31528 13584 (569)Book value per share 485986 ― ―Dividends per share 10000 7500 ―Dividend payout ratio () 317 552 ―
Capital Expenditure and Other (yenmn)FY2017Amount Amount Change
Capital expenditure 1645 950 (695)Depreciation and amortization 1192 1350 157
FY2018 (Forecast)
FY2018 (Forecast)
Dividend ForecastAs mentioned above we are forecasting a decline in profit in FY2018 due to the influence of NHI drug price revisions ongoing strategic spending including new drug development expenses and start-up expenses at the Vietnam factory Thus we expect to pay a dividend per share of 75 yen (down 25 yen per share YOY) with a payout ratio of 552
PL 医薬品① 医薬品② 医薬品③ BS① BS③ 和文にある「前年同期間比」「前期3月末比」は記載が難しく英語版では必要度の低い情報であるとみなして記載をしないこととなった2016年2Q~(木村)ただし期末では記載が可能なので書きます(須田)
CF CAP EX 業績予想① 英語版では経常利益は書かないので注意(須田)
業績予想 ② 業績予想③ スライド番号 1 Contents スライド番号 3 Sales Income Pharmaceutical Sales Sales Distribution Balance Sheet per Share Information Cash Flow Expenditure スライド番号 9 Sales Income Pharmaceutical Sales Per Share Information Expenditure Per Share Information (yen) FY2017 FY2018 (Forecast) Amount Amount YOY () Earnings per share 31528 13584 (569) Book value per share 485986 ― ― Dividends per share 10000 7500 ― Dividend payout ratio () 317 552 ― Capital Expenditure and Other (yenmn) FY2017 FY2018 (Forecast) Amount Amount Change Capital expenditure 1645 950 (695) Depreciation and amortization 1192 1350 157 2015年3月期 ガツキ 2016年3月期(予想) ガツキ ヨソウ 金額 キンガク 金額 キンガク 増減額 ゾウゲンガク 増減率 ゾウゲン リツ 医療用医薬品 イリョウヨウ イヤクヒン 27400 30950 +05 ジェネリック医薬品(荷離) イヤクヒン ニ バナレ 25079 27430 +01 内自社販売 ウチ ジシャ ハンバイ 2321 25100 +01 内導出輸出 ウチ ドウシュツ ユシュツ 3011 2330 +04 アムロジピン 1935 3040 +09 ランソプラゾール 1509 1890 24 プラバスタチン 1595 1570 +40 ラベプラゾール 1704 1570 16 リマプロストアルファデクス 1273 1660 26 ボグリボース 1013 1300 +21 ドネペジル 15357 1030 +16 その他 タ 3400 15370 +01 主力品 シュリョク ヒン 1975 3520 +35 ウラリット 1134 1970 03 ソレトン 290 1250 +102 カルバン 0 300 +34 ジェネリック医薬品事業 イヤクヒン ジギョウ 2015年3月期 ガツキ 2016年3月期(予想) ガツキ ヨソウ 金額 キンガク 金額 キンガク 増減額 ゾウゲンガク 増減率 ゾウゲン リツ ジェネリック医薬品事業 イヤクヒン ジギョウ 28918 28840 +1003 ジェネリック医薬品(荷離) イヤクヒン ニ バナレ 27400 27430 +999 受託 ジュタク 1518 1410 +1077
Generics Proprietary Products (yenmn) FY2017 FY2018 (Forecast) Amount Amount YOY () Total 32153 31800 (11) Generics 30115 30150 01 To medical institutions 29174 29250 03 To other makers 941 900 (44) Amlodipine 2940 2900 (14) Lansoprazole 2163 1900 (122) Donepezil 1557 1350 (133) Rabeprazole 1558 1350 (134) Limaprost Alfadex 1427 1350 (55) Pravastatine 1147 1100 (41) Voglibose 870 750 (139) Others 18449 19450 54 Proprietary products 2038 1650 (190) Uralyt 1225 1070 (127) Soleton 598 400 (331) Calvan 214 180 (162) Chemiphar ODM Generics (yenmn) FY2017 FY2018 (Forecast) Amount Amount YOY () Total 31100 31350 08 Generics 30115 30150 01 Generics (ODM) 985 1200 218
Income Statement Overview (yenmn) FY2017 FY2018 (Forecast) of of YOY Amount Sales Amount Sales () Net Sales 35331 1000 35500 1000 05 Pharmaceuticals 34279 970 ― ― ― Others 1051 30 ― ― ― Cost of sales 19535 553 ― ― ― SGampA expenses 13947 395 ― ― ― RampD expenses 2280 65 2700 76 184 Operating income 1848 0 52 1100 31 (405) Income before income taxes and minority interests 1777 80 ― ― ― Net income attributble to owners of the parent 1160 33 500 14 (569)
Capital Expenditure and Other (yenmn) Items FY2016 FY2017 Usage Amount Amount YOY () Forecast Rate () Capital expenditure 2928 1645 (438) 1650 997 Depreciation and amortization 1112 1192 72 1250 954 Revised forecast issued on October 31 2017
Cash Flow Statements (yenmn) FY2016 FY2017 Amount Amount Net cash Provided by operating activities 2737 3188 Used in investing activities (2504) (1606) Used in financing activities 787 (1741) Cash and cash equivalents 8084 7890 Free cash flow 232 1582
Per Share Information (yen) FY2016 FY2017 Amount Amount Change Forecast Earnings per share 53002 31528 (21474) 30673 Book value per share 454880 485986 31106 ― Dividend per share 10000 10000 ― 10000 Dividend payout ratio () 189 317 ― 326 Revised forecast issued on October 31 2017
Balance Sheet Data (yenmn) March 31 2017 August 31 2017 March 31 2015 Amount Amount Change Total assets 47002 46814 3358 (187) Return on assets () 63 36 -06 (27) Net assets 17355 17487 1313 132 Owned capital 17346 17474 1312 127 Capital-to-asset ratio () 369 373 02 +04 Return on equity () 123 67 (01) (56) Current assets 29009 28334 1630 (674) Current liabilities 14939 14914 (716) (25) Current ratio (x) 194 19 019 004
By Main Therapeutic Categories () FY2016 FY2017 Cardiovascular and respiratory drugs 309 320 Digestive organ drugs 196 183 Agents affecting metabolism 164 165 Drugs for nervous system sensory organs 99 91 Antibiotics and chemotherapeutic drugs 65 62 Antineoplastic agents 32 34 Others 135 145
Sales Distribution By Launch Year (yenmn) FY2016 FY2017 Fiscal Year Amount Distrib () Amount Distrib () YOY () 2010 and before 19487 1 667 19194 637 (15) 2009 2011 2348 0 80 2210 73 (59) 2012 1484 0 51 1404 47 (54) 2013 2917 0 100 3127 104 72 2014 1746 0 60 1937 64 110 2015 1001 0 34 1222 41 221 2016 219 0 08 459 15 1091 2017 ― ― ― 558 19 ― Total 29204 1 1000 30115 1000 31
Generics Proprietary Products (yenmn) FY2016 FY2017 Distrib Distrib YOY Achieved Amount () Amount () () Forecast () Total 31513 1 1000 32153 1 1000 20 32000 1005 Generics 29204 1 927 30115 1 937 31 30000 1 1004 To medical institutions 27808 29174 49 29100 1 1003 To other makers 1395 941 (326) 900 1 1046 Amlodipine 2865 2940 26 2900 1 1014 Lansoprazole 2279 2163 (51) 2100 1 1030 Donepezil 1642 1557 (52) 1600 1 973 Rabeprazole 1586 1558 (18) 1600 1 974 Limaprost Alfadex 1469 1427 (28) 1400 1 1020 Pravastatine 1173 1147 (22) 1100 1 1043 Voglibose 957 870 (91) 900 1 967 Others 17229 18449 71 18400 1 1003 Proprietary products 2308 0 73 2038 0 63 (117) 2000 1 1019 Uralyt 1409 1225 (131) 1200 1 1021 Soleton 679 598 (120) 600 1 997 Calvan 219 214 (21) 200 1 1074 Chemiphar ODM Generics (yenmn) FY2016 FY2017 Distrib Distrib YOY Achieved Amount () Amount () () Forecast () Total 30445 1000 31100 1000 22 31400 990 Generics 29204 959 30115 968 31 30000 1004 Generics (ODM) 1240 41 985 32 (206) 1400 704 Includes exports Revised forecast issued on October 31 2017
Income Statement Overview (yenmn) FY2016 FY2017 of of YOY Achieved Amount Sales Amount Sales () Forecast () Net Sales 35689 1 1000 35331 1 1000 (10) 35500 1 995 Pharmaceuticals 34551 1 968 34279 1 970 (08) ― ― ― Others 1137 0 32 1051 0 30 (76) ― ― ― Cost of sales 19449 1 545 19535 1 553 04 ― ― ― SGampA expenses 13403 0 376 13947 0 395 41 ― ― ― RampD expenses 1984 0 56 2280 0 65 150 2200 0 1037 Operating income 2836 0 79 1848 0 52 (348) 1800 0 1027 Income before income taxes and minority interests 2849 0 80 1696 0 48 (405) 1700 ― 998 Net income attributble to owners of the parent 2054 0 58 1160 0 33 (435) 1150 ― 1009 1961 00550933658 00550933658 00575628587 Revised forecast issued on October 31 2017
Per Share Information (yen) FY2017 FY2018 (Forecast) Amount Amount YOY () Earnings per share 31528 13584 (569) Book value per share 485986 ― ― Dividends per share 10000 7500 ― Dividend payout ratio() 317 552 ― Capital Expenditure and Other (yenmn) FY2017 FY2018 (Forecast) Amount Amount Change Capital expenditure 1645 950 (695) Depreciation and amortization 1192 1350 157 2015年3月期 ガツキ 2016年3月期(予想) ガツキ ヨソウ 金額 キンガク 金額 キンガク 増減額 ゾウゲンガク 増減率 ゾウゲン リツ 医療用医薬品 イリョウヨウ イヤクヒン 27400 30950 +05 ジェネリック医薬品(荷離) イヤクヒン ニ バナレ 25079 27430 +01 内自社販売 ウチ ジシャ ハンバイ 2321 25100 +01 内導出輸出 ウチ ドウシュツ ユシュツ 3011 2330 +04 アムロジピン 1935 3040 +09 ランソプラゾール 1509 1890 24 プラバスタチン 1595 1570 +40 ラベプラゾール 1704 1570 16 リマプロストアルファデクス 1273 1660 26 ボグリボース 1013 1300 +21 ドネペジル 15357 1030 +16 その他 タ 3400 15370 +01 主力品 シュリョク ヒン 1975 3520 +35 ウラリット 1134 1970 03 ソレトン 290 1250 +102 カルバン 0 300 +34 ジェネリック医薬品事業 イヤクヒン ジギョウ 2015年3月期 ガツキ 2016年3月期(予想) ガツキ ヨソウ 金額 キンガク 金額 キンガク 増減額 ゾウゲンガク 増減率 ゾウゲン リツ ジェネリック医薬品事業 イヤクヒン ジギョウ 28918 28840 +1003 ジェネリック医薬品(荷離) イヤクヒン ニ バナレ 27400 27430 +999 受託 ジュタク 1518 1410 +1077
Generics Proprietary Products (yenmn) FY2017 FY2018 (Forecast) Amount Amount YOY () Total 32153 31800 (11) Generics 30115 30150 01 To medical institutions 29174 29250 03 To other makers 941 900 (44) Amlodipine 2940 2900 (14) Lansoprazole 2163 1900 (122) Donepezil 1557 1350 (133) Rabeprazole 1558 1350 (134) Limaprost Alfadex 1427 1350 (55) Pravastatine 1147 1100 (41) Voglibose 870 750 (139) Others 18449 19450 54 Proprietary products 2038 1650 (190) Uralyt 1225 1070 (127) Soleton 598 400 (331) Calvan 214 180 (162) Chemiphar ODM Generics (yenmn) FY2017 FY2018 (Forecast) Amount Amount YOY () Total 31100 31350 08 Generics 30115 30150 01 Generics (ODM) 985 1200 218
Income Statement Overview (yenmn) FY2017 FY2018 (Forecast) of of YOY Amount Sales Amount Sales () Net Sales 35331 1000 35500 1000 05 Pharmaceuticals 34279 970 ― ― ― Others 1051 30 ― ― ― Cost of sales 19535 553 ― ― ― SGampA expenses 13947 395 ― ― ― RampD expenses 2280 65 2700 76 184 Operating income 1848 0 52 1100 31 (405) Income before income taxes and minority interests 1777 80 ― ― ― Net income attributble to owners of the parent 1160 33 500 14 (569)
Capital Expenditure and Other (yenmn) Items FY2016 FY2017 Usage Amount Amount YOY () Forecast Rate () Capital expenditure 2928 1645 (438) 1650 997 Depreciation and amortization 1112 1192 72 1250 954 Revised forecast issued on October 31 2017
Cash Flow Statements (yenmn) FY2016 FY2017 Amount Amount Net cash Provided by operating activities 2737 3188 Used in investing activities (2504) (1606) Used in financing activities 787 (1741) Cash and cash equivalents 8084 7890 Free cash flow 232 1582
Per Share Information (yen) FY2016 FY2017 Amount Amount Change Forecast Earnings per share 53002 31528 (21474) 30673 Book value per share 454880 485986 31106 ― Dividend per share 10000 10000 ― 10000 Dividend payout ratio () 189 317 ― 326 Revised forecast issued on October 31 2017
Balance Sheet Data (yenmn) March 31 2017 August 31 2017 March 31 2015 Amount Amount Change Total assets 47002 46814 3358 (187) Return on assets () 63 36 -06 (27) Net assets 17355 17487 1313 132 Owned capital 17346 17474 1312 127 Capital-to-asset ratio () 369 373 02 +04 Return on equity () 123 67 (01) (56) Current assets 29009 28334 1630 (674) Current liabilities 14939 14914 (716) (25) Current ratio (x) 194 19 019 004
By Main Therapeutic Categories () FY2016 FY2017 Cardiovascular and respiratory drugs 309 320 Digestive organ drugs 196 183 Agents affecting metabolism 164 165 Drugs for nervous system sensory organs 99 91 Antibiotics and chemotherapeutic drugs 65 62 Antineoplastic agents 32 34 Others 135 145
Sales Distribution By Launch Year (yenmn) FY2016 FY2017 Fiscal Year Amount Distrib () Amount Distrib () YOY () 2010 and before 19487 1 667 19194 637 (15) 2009 2011 2348 0 80 2210 73 (59) 2012 1484 0 51 1404 47 (54) 2013 2917 0 100 3127 104 72 2014 1746 0 60 1937 64 110 2015 1001 0 34 1222 41 221 2016 219 0 08 459 15 1091 2017 ― ― ― 558 19 ― Total 29204 1 1000 30115 1000 31
Generics Proprietary Products (yenmn) FY2016 FY2017 Distrib Distrib YOY Achieved Amount () Amount () () Forecast () Total 31513 1 1000 32153 1 1000 20 32000 1005 Generics 29204 1 927 30115 1 937 31 30000 1 1004 To medical institutions 27808 29174 49 29100 1 1003 To other makers 1395 941 (326) 900 1 1046 Amlodipine 2865 2940 26 2900 1 1014 Lansoprazole 2279 2163 (51) 2100 1 1030 Donepezil 1642 1557 (52) 1600 1 973 Rabeprazole 1586 1558 (18) 1600 1 974 Limaprost Alfadex 1469 1427 (28) 1400 1 1020 Pravastatine 1173 1147 (22) 1100 1 1043 Voglibose 957 870 (91) 900 1 967 Others 17229 18449 71 18400 1 1003 Proprietary products 2308 0 73 2038 0 63 (117) 2000 1 1019 Uralyt 1409 1225 (131) 1200 1 1021 Soleton 679 598 (120) 600 1 997 Calvan 219 214 (21) 200 1 1074 Chemiphar ODM Generics (yenmn) FY2016 FY2017 Distrib Distrib YOY Achieved Amount () Amount () () Forecast () Total 30445 1000 31100 1000 22 31400 990 Generics 29204 959 30115 968 31 30000 1004 Generics (ODM) 1240 41 985 32 (206) 1400 704 Includes exports Revised forecast issued on October 31 2017
Income Statement Overview (yenmn) FY2016 FY2017 of of YOY Achieved Amount Sales Amount Sales () Forecast () Net Sales 35689 1 1000 35331 1 1000 (10) 35500 1 995 Pharmaceuticals 34551 1 968 34279 1 970 (08) ― ― ― Others 1137 0 32 1051 0 30 (76) ― ― ― Cost of sales 19449 1 545 19535 1 553 04 ― ― ― SGampA expenses 13403 0 376 13947 0 395 41 ― ― ― RampD expenses 1984 0 56 2280 0 65 150 2200 0 1037 Operating income 2836 0 79 1848 0 52 (348) 1800 0 1027 Income before income taxes and minority interests 2849 0 80 1696 0 48 (405) 1700 ― 998 Net income attributble to owners of the parent 2054 0 58 1160 0 33 (435) 1150 ― 1009 1961 00550933658 00550933658 00575628587 Revised forecast issued on October 31 2017
Per Share Information (yen) FY2017 FY2018 (Forecast) Amount Amount YOY () Earnings per share 31528 13584 (569) Book value per share 485986 ― ― Dividends per share 10000 7500 ― Dividend payout ratio() 317 552 ― Capital Expenditure and Other (yenmn) FY2017 FY2018 (Forecast) Amount Amount Change Capital expenditure 1645 950 (695) Depreciation and amortization 1192 1350 157 2015年3月期 ガツキ 2016年3月期(予想) ガツキ ヨソウ 金額 キンガク 金額 キンガク 増減額 ゾウゲンガク 増減率 ゾウゲン リツ 医療用医薬品 イリョウヨウ イヤクヒン 27400 30950 +05 ジェネリック医薬品(荷離) イヤクヒン ニ バナレ 25079 27430 +01 内自社販売 ウチ ジシャ ハンバイ 2321 25100 +01 内導出輸出 ウチ ドウシュツ ユシュツ 3011 2330 +04 アムロジピン 1935 3040 +09 ランソプラゾール 1509 1890 24 プラバスタチン 1595 1570 +40 ラベプラゾール 1704 1570 16 リマプロストアルファデクス 1273 1660 26 ボグリボース 1013 1300 +21 ドネペジル 15357 1030 +16 その他 タ 3400 15370 +01 主力品 シュリョク ヒン 1975 3520 +35 ウラリット 1134 1970 03 ソレトン 290 1250 +102 カルバン 0 300 +34 ジェネリック医薬品事業 イヤクヒン ジギョウ 2015年3月期 ガツキ 2016年3月期(予想) ガツキ ヨソウ 金額 キンガク 金額 キンガク 増減額 ゾウゲンガク 増減率 ゾウゲン リツ ジェネリック医薬品事業 イヤクヒン ジギョウ 28918 28840 +1003 ジェネリック医薬品(荷離) イヤクヒン ニ バナレ 27400 27430 +999 受託 ジュタク 1518 1410 +1077
Generics Proprietary Products (yenmn) FY2017 FY2018 (Forecast) Amount Amount YOY () Total 32153 31800 (11) Generics 30115 30150 01 To medical institutions 29174 29250 03 To other makers 941 900 (44) Amlodipine 2940 2900 (14) Lansoprazole 2163 1900 (122) Donepezil 1557 1350 (133) Rabeprazole 1558 1350 (134) Limaprost Alfadex 1427 1350 (55) Pravastatine 1147 1100 (41) Voglibose 870 750 (139) Others 18449 19450 54 Proprietary products 2038 1650 (190) Uralyt 1225 1070 (127) Soleton 598 400 (331) Calvan 214 180 (162) Chemiphar ODM Generics (yenmn) FY2017 FY2018 (Forecast) Amount Amount YOY () Total 31100 31350 08 Generics 30115 30150 01 Generics (ODM) 985 1200 218
Income Statement Overview (yenmn) FY2017 FY2018 (Forecast) of of YOY Amount Sales Amount Sales () Net Sales 35331 1000 35500 1000 05 Pharmaceuticals 34279 970 ― ― ― Others 1051 30 ― ― ― Cost of sales 19535 553 ― ― ― SGampA expenses 13947 395 ― ― ― RampD expenses 2280 65 2700 76 184 Operating income 1848 0 52 1100 31 (405) Income before income taxes and minority interests 1777 50 ― ― ― Net income attributble to owners of the parent 1160 33 500 14 (569)
Capital Expenditure and Other (yenmn) Items FY2016 FY2017 Usage Amount Amount YOY () Forecast Rate () Capital expenditure 2928 1645 (438) 1650 997 Depreciation and amortization 1112 1192 72 1250 954 Revised forecast issued on October 31 2017
Cash Flow Statements (yenmn) FY2016 FY2017 Amount Amount Net cash Provided by operating activities 2737 3188 Used in investing activities (2504) (1606) Used in financing activities 787 (1741) Cash and cash equivalents 8084 7890 Free cash flow 232 1582
Per Share Information (yen) FY2016 FY2017 Amount Amount Change Forecast Earnings per share 53002 31528 (21474) 30673 Book value per share 454880 485986 31106 ― Dividend per share 10000 10000 ― 10000 Dividend payout ratio () 189 317 ― 326 Revised forecast issued on October 31 2017
Balance Sheet Data (yenmn) March 31 2017 March 31 2018 March 31 2015 Amount Amount Change Total assets 47002 46814 3358 (187) Return on assets () 63 36 -06 (27) Net assets 17355 17487 1313 132 Owned capital 17346 17474 1312 127 Capital-to-asset ratio () 369 373 02 04 Return on equity () 123 67 (01) (56) Current assets 29009 28334 1630 (674) Current liabilities 14939 14914 (716) (25) Current ratio (x) 194 19 019 (004)
By Main Therapeutic Categories () FY2016 FY2017 Cardiovascular and respiratory drugs 309 320 Digestive organ drugs 196 183 Agents affecting metabolism 164 165 Drugs for nervous system sensory organs 99 91 Antibiotics and chemotherapeutic drugs 65 62 Antineoplastic agents 32 34 Others 135 145
Sales Distribution By Launch Year (yenmn) FY2016 FY2017 Fiscal Year Amount Distrib () Amount Distrib () YOY () 2010 and before 19487 1 667 19194 637 (15) 2009 2011 2348 0 80 2210 73 (59) 2012 1484 0 51 1404 47 (54) 2013 2917 0 100 3127 104 72 2014 1746 0 60 1937 64 110 2015 1001 0 34 1222 41 221 2016 219 0 08 459 15 1091 2017 ― ― 558 19 ― Total 29204 1 1000 30115 1000 31
Generics Proprietary Products (yenmn) FY2016 FY2017 Distrib Distrib YOY Achieved Amount () Amount () () Forecast () Total 31513 1 1000 32153 1 1000 20 32000 1005 Generics 29204 1 927 30115 1 937 31 30000 1 1004 To medical institutions 27808 29174 49 29100 1 1003 To other makers 1395 941 (326) 900 1 1046 Amlodipine 2865 2940 26 2900 1 1014 Lansoprazole 2279 2163 (51) 2100 1 1030 Donepezil 1642 1557 (52) 1600 1 973 Rabeprazole 1586 1558 (18) 1600 1 974 Limaprost Alfadex 1469 1427 (28) 1400 1 1020 Pravastatine 1173 1147 (22) 1100 1 1043 Voglibose 957 870 (91) 900 1 967 Others 17229 18449 71 18400 1 1003 Proprietary products 2308 0 73 2038 0 63 (117) 2000 1 1019 Uralyt 1409 1225 (131) 1200 1 1021 Soleton 679 598 (120) 600 1 997 Calvan 219 214 (21) 200 1 1074 Chemiphar ODM Generics (yenmn) FY2016 FY2017 Distrib Distrib YOY Achieved Amount () Amount () () Forecast () Total 30445 1000 31100 1000 22 31400 990 Generics 29204 959 30115 968 31 30000 1004 Generics (ODM) 1240 41 985 32 (206) 1400 704 Includes exports Revised forecast issued on October 31 2017
Income Statement Overview (yenmn) FY2016 FY2017 of of YOY Achieved Amount Sales Amount Sales () Forecast () Net Sales 35689 1 1000 35331 1 1000 (10) 35500 1 995 Pharmaceuticals 34551 1 968 34279 1 970 (08) ― ― Others 1137 0 32 1051 0 30 (76) ― ― Cost of sales 19449 1 545 19535 1 553 04 ― ― SGampA expenses 13403 0 376 13947 0 395 41 ― ― RampD expenses 1984 0 56 2280 0 65 150 2200 0 1037 Operating income 2836 0 79 1848 0 52 (348) 1800 0 1027 Income before income taxes and minority interests 2849 0 80 1777 0 50 (376) ― ― Net income attributble to owners of the parent 2054 0 58 1160 0 33 (435) 1150 ― 1009 1961 00550933658 00550933658 00575628587 Revised forecast issued on October 31 2017
Per Share Information (yen) FY2017 FY2018 (Forecast) Amount Amount YOY () Earnings per share 31528 13584 (569) Book value per share 485986 ― ― Dividends per share 10000 7500 ― Dividend payout ratio() 317 552 ― Capital Expenditure and Other (yenmn) FY2017 FY2018 (Forecast) Amount Amount Change Capital expenditure 1645 950 (695) Depreciation and amortization 1192 1350 157 2015年3月期 ガツキ 2016年3月期(予想) ガツキ ヨソウ 金額 キンガク 金額 キンガク 増減額 ゾウゲンガク 増減率 ゾウゲン リツ 医療用医薬品 イリョウヨウ イヤクヒン 27400 30950 +05 ジェネリック医薬品(荷離) イヤクヒン ニ バナレ 25079 27430 +01 内自社販売 ウチ ジシャ ハンバイ 2321 25100 +01 内導出輸出 ウチ ドウシュツ ユシュツ 3011 2330 +04 アムロジピン 1935 3040 +09 ランソプラゾール 1509 1890 24 プラバスタチン 1595 1570 +40 ラベプラゾール 1704 1570 16 リマプロストアルファデクス 1273 1660 26 ボグリボース 1013 1300 +21 ドネペジル 15357 1030 +16 その他 タ 3400 15370 +01 主力品 シュリョク ヒン 1975 3520 +35 ウラリット 1134 1970 03 ソレトン 290 1250 +102 カルバン 0 300 +34 ジェネリック医薬品事業 イヤクヒン ジギョウ 2015年3月期 ガツキ 2016年3月期(予想) ガツキ ヨソウ 金額 キンガク 金額 キンガク 増減額 ゾウゲンガク 増減率 ゾウゲン リツ ジェネリック医薬品事業 イヤクヒン ジギョウ 28918 28840 +1003 ジェネリック医薬品(荷離) イヤクヒン ニ バナレ 27400 27430 +999 受託 ジュタク 1518 1410 +1077
Generics Proprietary Products (yenmn) FY2017 FY2018 (Forecast) Amount Amount YOY () Total 32153 31800 (11) Generics 30115 30150 01 To medical institutions 29174 29250 03 To other makers 941 900 (44) Amlodipine 2940 2900 (14) Lansoprazole 2163 1900 (122) Donepezil 1557 1350 (133) Rabeprazole 1558 1350 (134) Limaprost Alfadex 1427 1350 (55) Pravastatine 1147 1100 (41) Voglibose 870 750 (139) Others 18449 19450 54 Proprietary products 2038 1650 (190) Uralyt 1225 1070 (127) Soleton 598 400 (331) Calvan 214 180 (162) Chemiphar ODM Generics (yenmn) FY2017 FY2018 (Forecast) Amount Amount YOY () Total 31100 31350 08 Generics 30115 30150 01 Generics (ODM) 985 1200 218
Income Statement Overview (yenmn) FY2017 FY2018 (Forecast) of of YOY Amount Sales Amount Sales () Net Sales 35331 1000 35500 1000 05 Pharmaceuticals 34279 970 ― ― ― Others 1051 30 ― ― ― Cost of sales 19535 553 ― ― ― SGampA expenses 13947 395 ― ― ― RampD expenses 2280 65 2700 76 184 Operating income 1848 0 52 1100 31 (405) Income before income taxes and minority interests 1777 80 ― ― ― Net income attributble to owners of the parent 1160 33 500 14 (569)
Capital Expenditure and Other (yenmn) Items FY2016 FY2017 Usage Amount Amount YOY () Forecast Rate () Capital expenditure 2928 1645 (438) 1650 997 Depreciation and amortization 1112 1192 72 1250 954 Revised forecast issued on October 31 2017
Cash Flow Statements (yenmn) FY2016 FY2017 Amount Amount Net cash Provided by operating activities 2737 3188 Used in investing activities (2504) (1606) Used in financing activities 787 (1741) Cash and cash equivalents 8084 7890 Free cash flow 232 1582
Per Share Information (yen) FY2016 FY2017 Amount Amount Change Forecast Earnings per share 53002 31528 (21474) 30673 Book value per share 454880 485986 31106 ― Dividend per share 10000 10000 ― 10000 Dividend payout ratio () 189 317 ― 326 Revised forecast issued on October 31 2017
Balance Sheet Data (yenmn) March 31 2017 August 31 2017 March 31 2015 Amount Amount Change Total assets 47002 46814 3358 (187) Return on assets () 63 36 -06 (27) Net assets 17355 17487 1313 132 Owned capital 17346 17474 1312 127 Capital-to-asset ratio () 369 373 02 +04 Return on equity () 123 67 (01) (56) Current assets 29009 28334 1630 (674) Current liabilities 14939 14914 (716) (25) Current ratio (x) 194 19 019 004
By Main Therapeutic Categories () FY2016 FY2017 Cardiovascular and respiratory drugs 309 320 Digestive organ drugs 196 183 Agents affecting metabolism 164 165 Drugs for nervous system sensory organs 99 91 Antibiotics and chemotherapeutic drugs 65 62 Antineoplastic agents 32 34 Others 135 145
Sales Distribution By Launch Year (yenmn) FY2016 FY2017 Fiscal Year Amount Distrib () Amount Distrib () YOY () 2010 and before 19487 1 667 19194 637 (15) 2009 2011 2348 0 80 2210 73 (59) 2012 1484 0 51 1404 47 (54) 2013 2917 0 100 3127 104 72 2014 1746 0 60 1937 64 110 2015 1001 0 34 1222 41 221 2016 219 0 08 459 15 1091 2017 ― ― ― 558 19 ― Total 29204 1 1000 30115 1000 31
Generics Proprietary Products (yenmn) FY2016 FY2017 Distrib Distrib YOY Achieved Amount () Amount () () Forecast () Total 31513 1 1000 32153 1 1000 20 32000 1005 Generics 29204 1 927 30115 1 937 31 30000 1 1004 To medical institutions 27808 29174 49 29100 1 1003 To other makers 1395 941 (326) 900 1 1046 Amlodipine 2865 2940 26 2900 1 1014 Lansoprazole 2279 2163 (51) 2100 1 1030 Donepezil 1642 1557 (52) 1600 1 973 Rabeprazole 1586 1558 (18) 1600 1 974 Limaprost Alfadex 1469 1427 (28) 1400 1 1020 Pravastatine 1173 1147 (22) 1100 1 1043 Voglibose 957 870 (91) 900 1 967 Others 17229 18449 71 18400 1 1003 Proprietary products 2308 0 73 2038 0 63 (117) 2000 1 1019 Uralyt 1409 1225 (131) 1200 1 1021 Soleton 679 598 (120) 600 1 997 Calvan 219 214 (21) 200 1 1074 Chemiphar ODM Generics (yenmn) FY2016 FY2017 Distrib Distrib YOY Achieved Amount () Amount () () Forecast () Total 30445 1000 31100 1000 22 31400 990 Generics 29204 959 30115 968 31 30000 1004 Generics (ODM) 1240 41 985 32 (206) 1400 704 Includes exports Revised forecast issued on October 31 2017
Income Statement Overview (yenmn) FY2016 FY2017 of of YOY Achieved Amount Sales Amount Sales () Forecast () Net Sales 35689 1 1000 35331 1 1000 (10) 35500 1 995 Pharmaceuticals 34551 1 968 34279 1 970 (08) ― ― ― Others 1137 0 32 1051 0 30 (76) ― ― ― Cost of sales 19449 1 545 19535 1 553 04 ― ― ― SGampA expenses 13403 0 376 13947 0 395 41 ― ― ― RampD expenses 1984 0 56 2280 0 65 150 2200 0 1037 Operating income 2836 0 79 1848 0 52 (348) 1800 0 1027 Income before income taxes and minority interests 2849 0 80 1696 0 48 (405) 1700 ― 998 Net income attributble to owners of the parent 2054 0 58 1160 0 33 (435) 1150 ― 1009 1961 00550933658 00550933658 00575628587 Revised forecast issued on October 31 2017
Per Share Information (yen) FY2017 FY2018 (Forecast) Amount Amount YOY () Earnings per share 31528 13584 (569) Book value per share 485986 ― ― Dividends per share 10000 7500 ― Dividend payout ratio() 317 552 ― Capital Expenditure and Other (yenmn) FY2017 FY2018 (Forecast) Amount Amount Change Capital expenditure 1645 950 (695) Depreciation and amortization 1192 1350 157 2015年3月期 ガツキ 2016年3月期(予想) ガツキ ヨソウ 金額 キンガク 金額 キンガク 増減額 ゾウゲンガク 増減率 ゾウゲン リツ 医療用医薬品 イリョウヨウ イヤクヒン 27400 30950 +05 ジェネリック医薬品(荷離) イヤクヒン ニ バナレ 25079 27430 +01 内自社販売 ウチ ジシャ ハンバイ 2321 25100 +01 内導出輸出 ウチ ドウシュツ ユシュツ 3011 2330 +04 アムロジピン 1935 3040 +09 ランソプラゾール 1509 1890 24 プラバスタチン 1595 1570 +40 ラベプラゾール 1704 1570 16 リマプロストアルファデクス 1273 1660 26 ボグリボース 1013 1300 +21 ドネペジル 15357 1030 +16 その他 タ 3400 15370 +01 主力品 シュリョク ヒン 1975 3520 +35 ウラリット 1134 1970 03 ソレトン 290 1250 +102 カルバン 0 300 +34 ジェネリック医薬品事業 イヤクヒン ジギョウ 2015年3月期 ガツキ 2016年3月期(予想) ガツキ ヨソウ 金額 キンガク 金額 キンガク 増減額 ゾウゲンガク 増減率 ゾウゲン リツ ジェネリック医薬品事業 イヤクヒン ジギョウ 28918 28840 +1003 ジェネリック医薬品(荷離) イヤクヒン ニ バナレ 27400 27430 +999 受託 ジュタク 1518 1410 +1077
Generics Proprietary Products (yenmn) FY2017 FY2018 (Forecast) Amount Amount YOY () Total 32153 31800 (11) Generics 30115 30150 01 To medical institutions 29174 29250 03 To other makers 941 900 (44) Amlodipine 2940 2900 (14) Lansoprazole 2163 1900 (122) Donepezil 1557 1350 (133) Rabeprazole 1558 1350 (134) Limaprost Alfadex 1427 1350 (55) Pravastatine 1147 1100 (41) Voglibose 870 750 (139) Others 18449 19450 54 Proprietary products 2038 1650 (190) Uralyt 1225 1070 (127) Soleton 598 400 (331) Calvan 214 180 (162) Chemiphar ODM Generics (yenmn) FY2017 FY2018 (Forecast) Amount Amount YOY () Total 31100 31350 08 Generics 30115 30150 01 Generics (ODM) 985 1200 218
Income Statement Overview (yenmn) FY2017 FY2018 (Forecast) of of YOY Amount Sales Amount Sales () Net Sales 35331 1000 35500 1000 05 Pharmaceuticals 34279 970 ― ― ― Others 1051 30 ― ― ― Cost of sales 19535 553 ― ― ― SGampA expenses 13947 395 ― ― ― RampD expenses 2280 65 2700 76 184 Operating income 1848 0 52 1100 31 (405) Income before income taxes and minority interests 1777 80 ― ― ― Net income attributble to owners of the parent 1160 33 500 14 (569)
Capital Expenditure and Other (yenmn) Items FY2016 FY2017 Usage Amount Amount YOY () Forecast Rate () Capital expenditure 2928 1645 (438) 1650 997 Depreciation and amortization 1112 1192 72 1250 954 Revised forecast issued on October 31 2017
Cash Flow Statements (yenmn) FY2016 FY2017 Amount Amount Net cash Provided by operating activities 2737 3188 Used in investing activities (2504) (1606) Provided by (Used in) financing activities 787 (1741) Cash and cash equivalents 8084 7890 Free cash flow 232 1582
Per Share Information (yen) FY2016 FY2017 Amount Amount Change Forecast Earnings per share 53002 31528 (21474) 30673 Book value per share 454880 485986 31106 ― Dividend per share 10000 10000 ― 10000 Dividend payout ratio () 189 317 ― 326 Revised forecast issued on October 31 2017
Balance Sheet Data (yenmn) March 31 2017 August 31 2017 March 31 2015 Amount Amount Change Total assets 47002 46814 3358 (187) Return on assets () 63 36 -06 (27) Net assets 17355 17487 1313 132 Owned capital 17346 17474 1312 127 Capital-to-asset ratio () 369 373 02 +04 Return on equity () 123 67 (01) (56) Current assets 29009 28334 1630 (674) Current liabilities 14939 14914 (716) (25) Current ratio (x) 194 19 019 004
By Main Therapeutic Categories () FY2016 FY2017 Cardiovascular and respiratory drugs 309 320 Digestive organ drugs 196 183 Agents affecting metabolism 164 165 Drugs for nervous system sensory organs 99 91 Antibiotics and chemotherapeutic drugs 65 62 Antineoplastic agents 32 34 Others 135 145
Sales Distribution By Launch Year (yenmn) FY2016 FY2017 Fiscal Year Amount Distrib () Amount Distrib () YOY () 2010 and before 19487 1 667 19194 637 (15) 2009 2011 2348 0 80 2210 73 (59) 2012 1484 0 51 1404 47 (54) 2013 2917 0 100 3127 104 72 2014 1746 0 60 1937 64 110 2015 1001 0 34 1222 41 221 2016 219 0 08 459 15 1091 2017 ― ― ― 558 19 ― Total 29204 1 1000 30115 1000 31
Generics Proprietary Products (yenmn) FY2016 FY2017 Distrib Distrib YOY Achieved Amount () Amount () () Forecast () Total 31513 1 1000 32153 1 1000 20 32000 1005 Generics 29204 1 927 30115 1 937 31 30000 1 1004 To medical institutions 27808 29174 49 29100 1 1003 To other makers 1395 941 (326) 900 1 1046 Amlodipine 2865 2940 26 2900 1 1014 Lansoprazole 2279 2163 (51) 2100 1 1030 Donepezil 1642 1557 (52) 1600 1 973 Rabeprazole 1586 1558 (18) 1600 1 974 Limaprost Alfadex 1469 1427 (28) 1400 1 1020 Pravastatine 1173 1147 (22) 1100 1 1043 Voglibose 957 870 (91) 900 1 967 Others 17229 18449 71 18400 1 1003 Proprietary products 2308 0 73 2038 0 63 (117) 2000 1 1019 Uralyt 1409 1225 (131) 1200 1 1021 Soleton 679 598 (120) 600 1 997 Calvan 219 214 (21) 200 1 1074 Chemiphar ODM Generics (yenmn) FY2016 FY2017 Distrib Distrib YOY Achieved Amount () Amount () () Forecast () Total 30445 1000 31100 1000 22 31400 990 Generics 29204 959 30115 968 31 30000 1004 Generics (ODM) 1240 41 985 32 (206) 1400 704 Includes exports Revised forecast issued on October 31 2017
Income Statement Overview (yenmn) FY2016 FY2017 of of YOY Achieved Amount Sales Amount Sales () Forecast () Net Sales 35689 1 1000 35331 1 1000 (10) 35500 1 995 Pharmaceuticals 34551 1 968 34279 1 970 (08) ― ― ― Others 1137 0 32 1051 0 30 (76) ― ― ― Cost of sales 19449 1 545 19535 1 553 04 ― ― ― SGampA expenses 13403 0 376 13947 0 395 41 ― ― ― RampD expenses 1984 0 56 2280 0 65 150 2200 0 1037 Operating income 2836 0 79 1848 0 52 (348) 1800 0 1027 Income before income taxes and minority interests 2849 0 80 1696 0 48 (405) 1700 ― 998 Net income attributble to owners of the parent 2054 0 58 1160 0 33 (435) 1150 ― 1009 1961 00550933658 00550933658 00575628587 Revised forecast issued on October 31 2017
Per Share Information (yen) FY2017 FY2018 (Forecast) Amount Amount YOY () Earnings per share 31528 13584 (569) Book value per share 485986 ― ― Dividends per share 10000 7500 ― Dividend payout ratio() 317 552 ― Capital Expenditure and Other (yenmn) FY2017 FY2018 (Forecast) Amount Amount Change Capital expenditure 1645 950 (695) Depreciation and amortization 1192 1350 157 2015年3月期 ガツキ 2016年3月期(予想) ガツキ ヨソウ 金額 キンガク 金額 キンガク 増減額 ゾウゲンガク 増減率 ゾウゲン リツ 医療用医薬品 イリョウヨウ イヤクヒン 27400 30950 +05 ジェネリック医薬品(荷離) イヤクヒン ニ バナレ 25079 27430 +01 内自社販売 ウチ ジシャ ハンバイ 2321 25100 +01 内導出輸出 ウチ ドウシュツ ユシュツ 3011 2330 +04 アムロジピン 1935 3040 +09 ランソプラゾール 1509 1890 24 プラバスタチン 1595 1570 +40 ラベプラゾール 1704 1570 16 リマプロストアルファデクス 1273 1660 26 ボグリボース 1013 1300 +21 ドネペジル 15357 1030 +16 その他 タ 3400 15370 +01 主力品 シュリョク ヒン 1975 3520 +35 ウラリット 1134 1970 03 ソレトン 290 1250 +102 カルバン 0 300 +34 ジェネリック医薬品事業 イヤクヒン ジギョウ 2015年3月期 ガツキ 2016年3月期(予想) ガツキ ヨソウ 金額 キンガク 金額 キンガク 増減額 ゾウゲンガク 増減率 ゾウゲン リツ ジェネリック医薬品事業 イヤクヒン ジギョウ 28918 28840 +1003 ジェネリック医薬品(荷離) イヤクヒン ニ バナレ 27400 27430 +999 受託 ジュタク 1518 1410 +1077
Generics Proprietary Products (yenmn) FY2017 FY2018 (Forecast) Amount Amount YOY () Total 32153 31800 (11) Generics 30115 30150 01 To medical institutions 29174 29250 03 To other makers 941 900 (44) Amlodipine 2940 2900 (14) Lansoprazole 2163 1900 (122) Donepezil 1557 1350 (133) Rabeprazole 1558 1350 (134) Limaprost Alfadex 1427 1350 (55) Pravastatine 1147 1100 (41) Voglibose 870 750 (139) Others 18449 19450 54 Proprietary products 2038 1650 (190) Uralyt 1225 1070 (127) Soleton 598 400 (331) Calvan 214 180 (162) Chemiphar ODM Generics (yenmn) FY2017 FY2018 (Forecast) Amount Amount YOY () Total 31100 31350 08 Generics 30115 30150 01 Generics (ODM) 985 1200 218
Income Statement Overview (yenmn) FY2017 FY2018 (Forecast) of of YOY Amount Sales Amount Sales () Net Sales 35331 1000 35500 1000 05 Pharmaceuticals 34279 970 ― ― ― Others 1051 30 ― ― ― Cost of sales 19535 553 ― ― ― SGampA expenses 13947 395 ― ― ― RampD expenses 2280 65 2700 76 184 Operating income 1848 0 52 1100 31 (405) Income before income taxes and minority interests 1777 80 ― ― ― Net income attributble to owners of the parent 1160 33 500 14 (569)
Capital Expenditure and Other (yenmn) Items FY2016 FY2017 Usage Amount Amount YOY () Forecast Rate () Capital expenditure 2928 1645 (438) 1650 997 Depreciation and amortization 1112 1192 72 1250 954 Revised forecast issued on October 31 2017
Cash Flow Statements (yenmn) FY2016 FY2017 Amount Amount Net cash Provided by operating activities 2737 3188 Used in investing activities (2504) (1606) Used in financing activities 787 (1741) Cash and cash equivalents 8084 7890 Free cash flow 232 1582
Per Share Information (yen) FY2016 FY2017 Amount Amount Change Forecast Earnings per share 53002 31528 (21474) 30673 Book value per share 454880 485986 31106 ― Dividend per share 10000 10000 ― 10000 Dividend payout ratio () 189 317 ― 326 Revised forecast issued on October 31 2017
Balance Sheet Data (yenmn) March 31 2017 March 31 2018 March 31 2015 Amount Amount Change Total assets 47002 46814 3358 (187) Return on assets () 63 36 -06 (27) Net assets 17355 17487 1313 132 Owned capital 17346 17474 1312 127 Capital-to-asset ratio () 369 373 02 04 Return on equity () 123 67 (01) (56) Current assets 29009 28334 1630 (674) Current liabilities 14939 14914 (716) (25) Current ratio (x) 194 19 019 (004)
By Main Therapeutic Categories () FY2016 FY2017 Cardiovascular and respiratory drugs 309 320 Digestive organ drugs 196 183 Agents affecting metabolism 164 165 Drugs for nervous system sensory organs 99 91 Antibiotics and chemotherapeutic drugs 65 62 Antineoplastic agents 32 34 Others 135 145
Sales Distribution By Launch Year (yenmn) FY2016 FY2017 Fiscal Year Amount Distrib () Amount Distrib () YOY () 2010 and before 19487 1 667 19194 637 (15) 2009 2011 2348 0 80 2210 73 (59) 2012 1484 0 51 1404 47 (54) 2013 2917 0 100 3127 104 72 2014 1746 0 60 1937 64 110 2015 1001 0 34 1222 41 221 2016 219 0 08 459 15 1091 2017 ― ― 558 19 ― Total 29204 1 1000 30115 1000 31
Generics Proprietary Products (yenmn) FY2016 FY2017 Distrib Distrib YOY Achieved Amount () Amount () () Forecast () Total 31513 1 1000 32153 1 1000 20 32000 1005 Generics 29204 1 927 30115 1 937 31 30000 1 1004 To medical institutions 27808 29174 49 29100 1 1003 To other makers 1395 941 (326) 900 1 1046 Amlodipine 2865 2940 26 2900 1 1014 Lansoprazole 2279 2163 (51) 2100 1 1030 Donepezil 1642 1557 (52) 1600 1 973 Rabeprazole 1586 1558 (18) 1600 1 974 Limaprost Alfadex 1469 1427 (28) 1400 1 1020 Pravastatine 1173 1147 (22) 1100 1 1043 Voglibose 957 870 (91) 900 1 967 Others 17229 18449 71 18400 1 1003 Proprietary products 2308 0 73 2038 0 63 (117) 2000 1 1019 Uralyt 1409 1225 (131) 1200 1 1021 Soleton 679 598 (120) 600 1 997 Calvan 219 214 (21) 200 1 1074 Chemiphar ODM Generics (yenmn) FY2016 FY2017 Distrib Distrib YOY Achieved Amount () Amount () () Forecast () Total 30445 1000 31100 1000 22 31400 990 Generics 29204 959 30115 968 31 30000 1004 Generics (ODM) 1240 41 985 32 (206) 1400 704 Includes exports Revised forecast issued on October 31 2017
Income Statement Overview (yenmn) FY2016 FY2017 of of YOY Achieved Amount Sales Amount Sales () Forecast () Net Sales 35689 1 1000 35331 1 1000 (10) 35500 1 995 Pharmaceuticals 34551 1 968 34279 1 970 (08) ― ― Others 1137 0 32 1051 0 30 (76) ― ― Cost of sales 19449 1 545 19535 1 553 04 ― ― SGampA expenses 13403 0 376 13947 0 395 41 ― ― RampD expenses 1984 0 56 2280 0 65 150 2200 0 1037 Operating income 2836 0 79 1848 0 52 (348) 1800 0 1027 Income before income taxes and minority interests 2849 0 80 1777 0 50 (376) ― ― Net income attributble to owners of the parent 2054 0 58 1160 0 33 (435) 1150 ― 1009 1961 00550933658 00550933658 00575628587 Revised forecast issued on October 31 2017
Per Share Information (yen) FY2017 FY2018 (Forecast) Amount Amount YOY () Earnings per share 31528 13584 (569) Book value per share 485986 ― ― Dividends per share 10000 7500 ― Dividend payout ratio() 317 552 ― Capital Expenditure and Other (yenmn) FY2017 FY2018 (Forecast) Amount Amount Change Capital expenditure 1645 950 (695) Depreciation and amortization 1192 1350 157 2015年3月期 ガツキ 2016年3月期(予想) ガツキ ヨソウ 金額 キンガク 金額 キンガク 増減額 ゾウゲンガク 増減率 ゾウゲン リツ 医療用医薬品 イリョウヨウ イヤクヒン 27400 30950 +05 ジェネリック医薬品(荷離) イヤクヒン ニ バナレ 25079 27430 +01 内自社販売 ウチ ジシャ ハンバイ 2321 25100 +01 内導出輸出 ウチ ドウシュツ ユシュツ 3011 2330 +04 アムロジピン 1935 3040 +09 ランソプラゾール 1509 1890 24 プラバスタチン 1595 1570 +40 ラベプラゾール 1704 1570 16 リマプロストアルファデクス 1273 1660 26 ボグリボース 1013 1300 +21 ドネペジル 15357 1030 +16 その他 タ 3400 15370 +01 主力品 シュリョク ヒン 1975 3520 +35 ウラリット 1134 1970 03 ソレトン 290 1250 +102 カルバン 0 300 +34 ジェネリック医薬品事業 イヤクヒン ジギョウ 2015年3月期 ガツキ 2016年3月期(予想) ガツキ ヨソウ 金額 キンガク 金額 キンガク 増減額 ゾウゲンガク 増減率 ゾウゲン リツ ジェネリック医薬品事業 イヤクヒン ジギョウ 28918 28840 +1003 ジェネリック医薬品(荷離) イヤクヒン ニ バナレ 27400 27430 +999 受託 ジュタク 1518 1410 +1077
Generics Proprietary Products (yenmn) FY2017 FY2018 (Forecast) Amount Amount YOY () Total 32153 31800 (11) Generics 30115 30150 01 To medical institutions 29174 29250 03 To other makers 941 900 (44) Amlodipine 2940 2900 (14) Lansoprazole 2163 1900 (122) Donepezil 1557 1350 (133) Rabeprazole 1558 1350 (134) Limaprost Alfadex 1427 1350 (55) Pravastatine 1147 1100 (41) Voglibose 870 750 (139) Others 18449 19450 54 Proprietary products 2038 1650 (190) Uralyt 1225 1070 (127) Soleton 598 400 (331) Calvan 214 180 (162) Chemiphar ODM Generics (yenmn) FY2017 FY2018 (Forecast) Amount Amount YOY () Total 31100 31350 08 Generics 30115 30150 01 Generics (ODM) 985 1200 218
Income Statement Overview (yenmn) FY2017 FY2018 (Forecast) of of YOY Amount Sales Amount Sales () Net Sales 35331 1000 35500 1000 05 Pharmaceuticals 34279 970 ― ― ― Others 1051 30 ― ― ― Cost of sales 19535 553 ― ― ― SGampA expenses 13947 395 ― ― ― RampD expenses 2280 65 2700 76 184 Operating income 1848 0 52 1100 31 (405) Income before income taxes and minority interests 1777 80 ― ― ― Net income attributble to owners of the parent 1160 33 500 14 (569)
Capital Expenditure and Other (yenmn) Items FY2016 FY2017 Usage Amount Amount YOY () Forecast Rate () Capital expenditure 2928 1645 (438) 1650 997 Depreciation and amortization 1112 1192 72 1250 954 Revised forecast issued on October 31 2017
Cash Flow Statements (yenmn) FY2016 FY2017 Amount Amount Net cash Provided by operating activities 2737 3188 Used in investing activities (2504) (1606) Used in financing activities 787 (1741) Cash and cash equivalents 8084 7890 Free cash flow 232 1582
Per Share Information (yen) FY2016 FY2017 Amount Amount Change Forecast Earnings per share 53002 31528 (21474) 30673 Book value per share 454880 485986 31106 ― Dividend per share 10000 10000 ― 10000 Dividend payout ratio () 189 317 ― 326 Revised forecast issued on October 31 2017
Balance Sheet Data (yenmn) March 31 2017 August 31 2017 March 31 2015 Amount Amount Change Total assets 47002 46814 3358 (187) Return on assets () 63 36 -06 (27) Net assets 17355 17487 1313 132 Owned capital 17346 17474 1312 127 Capital-to-asset ratio () 369 373 02 +04 Return on equity () 123 67 (01) (56) Current assets 29009 28334 1630 (674) Current liabilities 14939 14914 (716) (25) Current ratio (x) 194 19 019 004
By Main Therapeutic Categories () FY2016 FY2017 Cardiovascular and respiratory drugs 309 320 Digestive organ drugs 196 183 Agents affecting metabolism 164 165 Drugs for nervous system sensory organs 99 91 Antibiotics and chemotherapeutic drugs 65 62 Antineoplastic agents 32 34 Others 135 145
Sales Distribution By Launch Year (yenmn) FY2016 FY2017 Fiscal Year Amount Distrib () Amount Distrib () YOY () 2010 and before 19487 1 667 19194 637 (15) 2009 2011 2348 0 80 2210 73 (59) 2012 1484 0 51 1404 47 (54) 2013 2917 0 100 3127 104 72 2014 1746 0 60 1937 64 110 2015 1001 0 34 1222 41 221 2016 219 0 08 459 15 1091 2017 ― ― ― 558 19 ― Total 29204 1 1000 30115 1000 31
Generics Proprietary Products (yenmn) FY2016 FY2017 Distrib Distrib YOY Achieved Amount () Amount () () Forecast () Total 31513 1 1000 32153 1 1000 20 32000 1005 Generics 29204 1 927 30115 1 937 31 30000 1 1004 To medical institutions 27808 29174 49 29100 1 1003 To other makers 1395 941 (326) 900 1 1046 Amlodipine 2865 2940 26 2900 1 1014 Lansoprazole 2279 2163 (51) 2100 1 1030 Donepezil 1642 1557 (52) 1600 1 973 Rabeprazole 1586 1558 (18) 1600 1 974 Limaprost Alfadex 1469 1427 (28) 1400 1 1020 Pravastatine 1173 1147 (22) 1100 1 1043 Voglibose 957 870 (91) 900 1 967 Others 17229 18449 71 18400 1 1003 Proprietary products 2308 0 73 2038 0 63 (117) 2000 1 1019 Uralyt 1409 1225 (131) 1200 1 1021 Soleton 679 598 (120) 600 1 997 Calvan 219 214 (21) 200 1 1074 Chemiphar ODM Generics (yenmn) FY2016 FY2017 Distrib Distrib YOY Achieved Amount () Amount () () Forecast () Total 30445 1000 31100 1000 22 31400 990 Generics 29204 959 30115 968 31 30000 1004 Generics (ODM) 1240 41 985 32 (206) 1400 704 Includes exports Revised forecast issued on October 31 2017
Income Statement Overview (yenmn) FY2016 FY2017 of of YOY Achieved Amount Sales Amount Sales () Forecast () Net Sales 35689 1 1000 35331 1 1000 (10) 35500 1 995 Pharmaceuticals 34551 1 968 34279 1 970 (08) ― ― ― Others 1137 0 32 1051 0 30 (76) ― ― ― Cost of sales 19449 1 545 19535 1 553 04 ― ― ― SGampA expenses 13403 0 376 13947 0 395 41 ― ― ― RampD expenses 1984 0 56 2280 0 65 150 2200 0 1037 Operating income 2836 0 79 1848 0 52 (348) 1800 0 1027 Income before income taxes and minority interests 2849 0 80 1696 0 48 (405) 1700 ― 998 Net income attributble to owners of the parent 2054 0 58 1160 0 33 (435) 1150 ― 1009 1961 00550933658 00550933658 00575628587 Revised forecast issued on October 31 2017
Per Share Information (yen) FY2017 FY2018 (Forecast) Amount Amount YOY () Earnings per share 31528 13584 (569) Book value per share 485986 ― ― Dividends per share 10000 7500 ― Dividend payout ratio() 317 552 ― Capital Expenditure and Other (yenmn) FY2017 FY2018 (Forecast) Amount Amount Change Capital expenditure 1645 950 (695) Depreciation and amortization 1192 1350 157 2015年3月期 ガツキ 2016年3月期(予想) ガツキ ヨソウ 金額 キンガク 金額 キンガク 増減額 ゾウゲンガク 増減率 ゾウゲン リツ 医療用医薬品 イリョウヨウ イヤクヒン 27400 30950 +05 ジェネリック医薬品(荷離) イヤクヒン ニ バナレ 25079 27430 +01 内自社販売 ウチ ジシャ ハンバイ 2321 25100 +01 内導出輸出 ウチ ドウシュツ ユシュツ 3011 2330 +04 アムロジピン 1935 3040 +09 ランソプラゾール 1509 1890 24 プラバスタチン 1595 1570 +40 ラベプラゾール 1704 1570 16 リマプロストアルファデクス 1273 1660 26 ボグリボース 1013 1300 +21 ドネペジル 15357 1030 +16 その他 タ 3400 15370 +01 主力品 シュリョク ヒン 1975 3520 +35 ウラリット 1134 1970 03 ソレトン 290 1250 +102 カルバン 0 300 +34 ジェネリック医薬品事業 イヤクヒン ジギョウ 2015年3月期 ガツキ 2016年3月期(予想) ガツキ ヨソウ 金額 キンガク 金額 キンガク 増減額 ゾウゲンガク 増減率 ゾウゲン リツ ジェネリック医薬品事業 イヤクヒン ジギョウ 28918 28840 +1003 ジェネリック医薬品(荷離) イヤクヒン ニ バナレ 27400 27430 +999 受託 ジュタク 1518 1410 +1077
Generics Proprietary Products (yenmn) FY2017 FY2018 (Forecast) Amount Amount YOY () Total 32153 31800 (11) Generics 30115 30150 01 To medical institutions 29174 29250 03 To other makers 941 900 (44) Amlodipine 2940 2900 (14) Lansoprazole 2163 1900 (122) Donepezil 1557 1350 (133) Rabeprazole 1558 1350 (134) Limaprost Alfadex 1427 1350 (55) Pravastatine 1147 1100 (41) Voglibose 870 750 (139) Others 18449 19450 54 Proprietary products 2038 1650 (190) Uralyt 1225 1070 (127) Soleton 598 400 (331) Calvan 214 180 (162) Chemiphar ODM Generics (yenmn) FY2017 FY2018 (Forecast) Amount Amount YOY () Total 31100 31350 08 Generics 30115 30150 01 Generics (ODM) 985 1200 218
Income Statement Overview (yenmn) FY2017 FY2018 (Forecast) of of YOY Amount Sales Amount Sales () Net Sales 35331 1000 35500 1000 05 Pharmaceuticals 34279 970 ― ― ― Others 1051 30 ― ― ― Cost of sales 19535 553 ― ― ― SGampA expenses 13947 395 ― ― ― RampD expenses 2280 65 2700 76 184 Operating income 1848 0 52 1100 31 (405) Income before income taxes and minority interests 1777 80 ― ― ― Net income attributble to owners of the parent 1160 33 500 14 (569)
Capital Expenditure and Other (yenmn) Items FY2016 FY2017 Usage Amount Amount YOY () Forecast Rate () Capital expenditure 2928 1645 (438) 1650 997 Depreciation and amortization 1112 1192 72 1250 954 Revised forecast issued on October 31 2017
Cash Flow Statements (yenmn) FY2016 FY2017 Amount Amount Net cash Provided by operating activities 2737 3188 Used in investing activities (2504) (1606) Used in financing activities 787 (1741) Cash and cash equivalents 8084 7890 Free cash flow 232 1582
Per Share Information (yen) FY2016 FY2017 Amount Amount Change Forecast Earnings per share 53002 31528 (21474) 30673 Book value per share 454880 485986 31106 ― Dividend per share 10000 10000 ― 10000 Dividend payout ratio () 189 317 ― 326 Revised forecast issued on October 31 2017
Balance Sheet Data (yenmn) March 31 2017 August 31 2017 March 31 2015 Amount Amount Change Total assets 47002 46814 3358 (187) Return on assets () 63 36 -06 (27) Net assets 17355 17487 1313 132 Owned capital 17346 17474 1312 127 Capital-to-asset ratio () 369 373 02 +04 Return on equity () 123 67 (01) (56) Current assets 29009 28334 1630 (674) Current liabilities 14939 14914 (716) (25) Current ratio (x) 194 19 019 004
By Main Therapeutic Categories () FY2016 FY2017 Cardiovascular and respiratory drugs 309 320 Digestive organ drugs 196 183 Agents affecting metabolism 164 165 Drugs for nervous system sensory organs 99 91 Antibiotics and chemotherapeutic drugs 65 62 Antineoplastic agents 32 34 Others 135 145
Sales Distribution By Launch Year (yenmn) FY2016 FY2017 Fiscal Year Amount Distrib () Amount Distrib () YOY () 2010 and before 19487 1 667 19194 637 (15) 2009 2011 2348 0 80 2210 73 (59) 2012 1484 0 51 1404 47 (54) 2013 2917 0 100 3127 104 72 2014 1746 0 60 1937 64 110 2015 1001 0 34 1222 41 221 2016 219 0 08 459 15 1091 2017 ― ― 558 19 ― Total 29204 1 1000 30115 1000 31
Generics Proprietary Products (yenmn) FY2016 FY2017 Distrib Distrib YOY Achieved Amount () Amount () () Forecast () Total 31513 1 1000 32153 1 1000 20 32000 1005 Generics 29204 1 927 30115 1 937 31 30000 1 1004 To medical institutions 27808 29174 49 29100 1 1003 To other makers 1395 941 (326) 900 1 1046 Amlodipine 2865 2940 26 2900 1 1014 Lansoprazole 2279 2163 (51) 2100 1 1030 Donepezil 1642 1557 (52) 1600 1 973 Rabeprazole 1586 1558 (18) 1600 1 974 Limaprost Alfadex 1469 1427 (28) 1400 1 1020 Pravastatine 1173 1147 (22) 1100 1 1043 Voglibose 957 870 (91) 900 1 967 Others 17229 18449 71 18400 1 1003 Proprietary products 2308 0 73 2038 0 63 (117) 2000 1 1019 Uralyt 1409 1225 (131) 1200 1 1021 Soleton 679 598 (120) 600 1 997 Calvan 219 214 (21) 200 1 1074 Chemiphar ODM Generics (yenmn) FY2016 FY2017 Distrib Distrib YOY Achieved Amount () Amount () () Forecast () Total 30445 1000 31100 1000 22 31400 990 Generics 29204 959 30115 968 31 30000 1004 Generics (ODM) 1240 41 985 32 (206) 1400 704 Includes exports Revised forecast issued on October 31 2017
Income Statement Overview (yenmn) FY2016 FY2017 of of YOY Achieved Amount Sales Amount Sales () Forecast () Net Sales 35689 1 1000 35331 1 1000 (10) 35500 1 995 Pharmaceuticals 34551 1 968 34279 1 970 (08) ― ― Others 1137 0 32 1051 0 30 (76) ― ― Cost of sales 19449 1 545 19535 1 553 04 ― ― SGampA expenses 13403 0 376 13947 0 395 41 ― ― RampD expenses 1984 0 56 2280 0 65 150 2200 0 1037 Operating income 2836 0 79 1848 0 52 (348) 1800 0 1027 Income before income taxes and minority interests 2849 0 80 1696 0 48 (405) 1700 ― 998 Net income attributble to owners of the parent 2054 0 58 1160 0 33 (435) 1150 ― 1009 1961 00550933658 00550933658 00575628587 Revised forecast issued on October 31 2017
Per Share Information (yen) FY2017 FY2018 (Forecast) Amount Amount YOY () Earnings per share 31528 13584 (569) Book value per share 485986 ― ― Dividends per share 10000 7500 ― Dividend payout ratio() 317 552 ― Capital Expenditure and Other (yenmn) FY2017 FY2018 (Forecast) Amount Amount Change Capital expenditure 1645 950 (695) Depreciation and amortization 1192 1350 157 2015年3月期 ガツキ 2016年3月期(予想) ガツキ ヨソウ 金額 キンガク 金額 キンガク 増減額 ゾウゲンガク 増減率 ゾウゲン リツ 医療用医薬品 イリョウヨウ イヤクヒン 27400 30950 +05 ジェネリック医薬品(荷離) イヤクヒン ニ バナレ 25079 27430 +01 内自社販売 ウチ ジシャ ハンバイ 2321 25100 +01 内導出輸出 ウチ ドウシュツ ユシュツ 3011 2330 +04 アムロジピン 1935 3040 +09 ランソプラゾール 1509 1890 24 プラバスタチン 1595 1570 +40 ラベプラゾール 1704 1570 16 リマプロストアルファデクス 1273 1660 26 ボグリボース 1013 1300 +21 ドネペジル 15357 1030 +16 その他 タ 3400 15370 +01 主力品 シュリョク ヒン 1975 3520 +35 ウラリット 1134 1970 03 ソレトン 290 1250 +102 カルバン 0 300 +34 ジェネリック医薬品事業 イヤクヒン ジギョウ 2015年3月期 ガツキ 2016年3月期(予想) ガツキ ヨソウ 金額 キンガク 金額 キンガク 増減額 ゾウゲンガク 増減率 ゾウゲン リツ ジェネリック医薬品事業 イヤクヒン ジギョウ 28918 28840 +1003 ジェネリック医薬品(荷離) イヤクヒン ニ バナレ 27400 27430 +999 受託 ジュタク 1518 1410 +1077
Generics Proprietary Products (yenmn) FY2017 FY2018 (Forecast) Amount Amount YOY () Total 32153 31800 (11) Generics 30115 30150 01 To medical institutions 29174 29250 03 To other makers 941 900 (44) Amlodipine 2940 2900 (14) Lansoprazole 2163 1900 (122) Donepezil 1557 1350 (133) Rabeprazole 1558 1350 (134) Limaprost Alfadex 1427 1350 (55) Pravastatine 1147 1100 (41) Voglibose 870 750 (139) Others 18449 19450 54 Proprietary products 2038 1650 (190) Uralyt 1225 1070 (127) Soleton 598 400 (331) Calvan 214 180 (162) Chemiphar ODM Generics (yenmn) FY2017 FY2018 (Forecast) Amount Amount YOY () Total 31100 31350 08 Generics 30115 30150 01 Generics (ODM) 985 1200 218
Income Statement Overview (yenmn) FY2017 FY2018 (Forecast) of of YOY Amount Sales Amount Sales () Net Sales 35331 1000 35500 1000 05 Pharmaceuticals 34279 970 ― ― ― Others 1051 30 ― ― ― Cost of sales 19535 553 ― ― ― SGampA expenses 13947 395 ― ― ― RampD expenses 2280 65 2700 76 184 Operating income 1848 0 52 1100 31 (405) Income before income taxes and minority interests 1777 80 ― ― ― Net income attributble to owners of the parent 1160 33 500 14 (569)
Capital Expenditure and Other (yenmn) Items FY2016 FY2017 Usage Amount Amount YOY () Forecast Rate () Capital expenditure 2928 1645 (438) 1650 997 Depreciation and amortization 1112 1192 72 1250 954 Revised forecast issued on October 31 2017
Cash Flow Statements (yenmn) FY2016 FY2017 Amount Amount Net cash Provided by operating activities 2737 3188 Used in investing activities (2504) (1606) Used in financing activities 787 (1741) Cash and cash equivalents 8084 7890 Free cash flow 232 1582
Per Share Information (yen) FY2016 FY2017 Amount Amount Change Forecast Earnings per share 53002 31528 (21474) 30673 Book value per share 454880 485986 31106 ― Dividend per share 10000 10000 ― 10000 Dividend payout ratio () 189 317 ― 326 Revised forecast issued on October 31 2017
Balance Sheet Data (yenmn) March 31 2017 August 31 2017 March 31 2015 Amount Amount Change Total assets 47002 46814 3358 (187) Return on assets () 63 36 -06 (27) Net assets 17355 17487 1313 132 Owned capital 17346 17474 1312 127 Capital-to-asset ratio () 369 373 02 +04 Return on equity () 123 67 (01) (56) Current assets 29009 28334 1630 (674) Current liabilities 14939 14914 (716) (25) Current ratio (x) 194 19 019 004
By Main Therapeutic Categories () FY2016 FY2017 Cardiovascular and respiratory drugs 309 320 Digestive organ drugs 196 183 Agents affecting metabolism 164 165 Drugs for nervous system sensory organs 99 91 Antibiotics and chemotherapeutic drugs 65 62 Antineoplastic agents 32 34 Others 135 145
Sales Distribution By Launch Year (yenmn) FY2016 FY2017 Fiscal Year Amount Distrib () Amount Distrib () YOY () 2010 and before 19487 1 667 19194 637 (15) 2009 2011 2348 0 80 2210 73 (59) 2012 1484 0 51 1404 47 (54) 2013 2917 0 100 3127 104 72 2014 1746 0 60 1937 64 110 2015 1001 0 34 1222 41 221 2016 219 0 08 459 15 1091 2017 ― ― ― 558 19 ― Total 29204 1 1000 30115 1000 31
Generics Proprietary Products (yenmn) FY2016 FY2017 Distrib Distrib YOY Achieved Amount () Amount () () Forecast () Total 31513 1 1000 32153 1 1000 20 32000 1005 Generics 29204 1 927 30115 1 937 31 30000 1 1004 To medical institutions 27808 29174 49 29100 1 1003 To other makers 1395 941 (326) 900 1 1046 Amlodipine 2865 2940 26 2900 1 1014 Lansoprazole 2279 2163 (51) 2100 1 1030 Donepezil 1642 1557 (52) 1600 1 973 Rabeprazole 1586 1558 (18) 1600 1 974 Limaprost Alfadex 1469 1427 (28) 1400 1 1020 Pravastatine 1173 1147 (22) 1100 1 1043 Voglibose 957 870 (91) 900 1 967 Others 17229 18449 71 18400 1 1003 Proprietary products 2308 0 73 2038 0 63 (117) 2000 1 1019 Uralyt 1409 1225 (131) 1200 1 1021 Soleton 679 598 (120) 600 1 997 Calvan 219 214 (21) 200 1 1074 Chemiphar ODM Generics (yenmn) FY2016 FY2017 Distrib Distrib YOY Achieved Amount () Amount () () Forecast () Total 30445 1000 31100 1000 22 31400 990 Generics 29204 959 30115 968 31 30000 1004 Generics (ODM) 1240 41 985 32 (206) 1400 704 Includes exports Revised forecast issued on October 31 2017
Income Statement Overview (yenmn) FY2016 FY2017 of of YOY Achieved Amount Sales Amount Sales () Forecast () Net Sales 35689 1 1000 35331 1 1000 (10) 35500 1 995 Pharmaceuticals 34551 1 968 34279 1 970 (08) ― ― ― Others 1137 0 32 1051 0 30 (76) ― ― ― Cost of sales 19449 1 545 19535 1 553 04 ― ― ― SGampA expenses 13403 0 376 13947 0 395 41 ― ― ― RampD expenses 1984 0 56 2280 0 65 150 2200 0 1037 Operating income 2836 0 79 1848 0 52 (348) 1800 0 1027 Income before income taxes and minority interests 2849 0 80 1696 0 48 (405) 1700 ― 998 Net income attributble to owners of the parent 2054 0 58 1160 0 33 (435) 1150 ― 1009 1961 00550933658 00550933658 00575628587 Revised forecast issued on October 31 2017
Per Share Information (yen) FY2017 FY2018 (Forecast) Amount Amount YOY () Earnings per share 31528 13584 (569) Book value per share 485986 ― ― Dividends per share 10000 7500 ― Dividend payout ratio() 317 552 ― Capital Expenditure and Other (yenmn) FY2017 FY2018 (Forecast) Amount Amount Change Capital expenditure 1645 950 (695) Depreciation and amortization 1192 1350 157 2015年3月期 ガツキ 2016年3月期(予想) ガツキ ヨソウ 金額 キンガク 金額 キンガク 増減額 ゾウゲンガク 増減率 ゾウゲン リツ 医療用医薬品 イリョウヨウ イヤクヒン 27400 30950 +05 ジェネリック医薬品(荷離) イヤクヒン ニ バナレ 25079 27430 +01 内自社販売 ウチ ジシャ ハンバイ 2321 25100 +01 内導出輸出 ウチ ドウシュツ ユシュツ 3011 2330 +04 アムロジピン 1935 3040 +09 ランソプラゾール 1509 1890 24 プラバスタチン 1595 1570 +40 ラベプラゾール 1704 1570 16 リマプロストアルファデクス 1273 1660 26 ボグリボース 1013 1300 +21 ドネペジル 15357 1030 +16 その他 タ 3400 15370 +01 主力品 シュリョク ヒン 1975 3520 +35 ウラリット 1134 1970 03 ソレトン 290 1250 +102 カルバン 0 300 +34 ジェネリック医薬品事業 イヤクヒン ジギョウ 2015年3月期 ガツキ 2016年3月期(予想) ガツキ ヨソウ 金額 キンガク 金額 キンガク 増減額 ゾウゲンガク 増減率 ゾウゲン リツ ジェネリック医薬品事業 イヤクヒン ジギョウ 28918 28840 +1003 ジェネリック医薬品(荷離) イヤクヒン ニ バナレ 27400 27430 +999 受託 ジュタク 1518 1410 +1077
Generics Proprietary Products (yenmn) FY2017 FY2018 (Forecast) Amount Amount YOY () Total 32153 31800 (11) Generics 30115 30150 01 To medical institutions 29174 29250 03 To other makers 941 900 (44) Amlodipine 2940 2900 (14) Lansoprazole 2163 1900 (122) Donepezil 1557 1350 (133) Rabeprazole 1558 1350 (134) Limaprost Alfadex 1427 1350 (55) Pravastatine 1147 1100 (41) Voglibose 870 750 (139) Others 18449 19450 54 Proprietary products 2038 1650 (190) Uralyt 1225 1070 (127) Soleton 598 400 (331) Calvan 214 180 (162) Chemiphar ODM Generics (yenmn) FY2017 FY2018 (Forecast) Amount Amount YOY () Total 31100 31350 08 Generics 30115 30150 01 Generics (ODM) 985 1200 218
Income Statement Overview (yenmn) FY2017 FY2018 (Forecast) of of YOY Amount Sales Amount Sales () Net Sales 35331 1000 35500 1000 05 Pharmaceuticals 34279 970 ― ― ― Others 1051 30 ― ― ― Cost of sales 19535 553 ― ― ― SGampA expenses 13947 395 ― ― ― RampD expenses 2280 65 2700 76 184 Operating income 1848 0 52 1100 31 (405) Income before income taxes and minority interests 1777 80 ― ― ― Net income attributble to owners of the parent 1160 33 500 14 (569)
Capital Expenditure and Other (yenmn) Items FY2016 FY2017 Usage Amount Amount YOY () Forecast Rate () Capital expenditure 2928 1645 (438) 1650 997 Depreciation and amortization 1112 1192 72 1250 954 Revised forecast issued on October 31 2017
Cash Flow Statements (yenmn) FY2016 FY2017 Amount Amount Net cash Provided by operating activities 2737 3188 Used in investing activities (2504) (1606) Used in financing activities 787 (1741) Cash and cash equivalents 8084 7890 Free cash flow 232 1582
Per Share Information (yen) FY2016 FY2017 Amount Amount Change Forecast Earnings per share 53002 31528 (21474) 30673 Book value per share 454880 485986 31106 ― Dividend per share 10000 10000 ― 10000 Dividend payout ratio () 189 317 ― 326 Revised forecast issued on October 31 2017
Balance Sheet Data (yenmn) March 31 2017 August 31 2017 March 31 2015 Amount Amount Change Total assets 47002 46814 3358 (187) Return on assets () 63 36 -06 (27) Net assets 17355 17487 1313 132 Owned capital 17346 17474 1312 127 Capital-to-asset ratio () 369 373 02 +04 Return on equity () 123 67 (01) (56) Current assets 29009 28334 1630 (674) Current liabilities 14939 14914 (716) (25) Current ratio (x) 194 19 019 004
By Main Therapeutic Categories () FY2016 FY2017 Cardiovascular and respiratory drugs 309 320 Digestive organ drugs 196 183 Agents affecting metabolism 164 165 Drugs for nervous system sensory organs 99 91 Antibiotics and chemotherapeutic drugs 65 62 Antineoplastic agents 32 34 Others 135 145
Sales Distribution By Launch Year (yenmn) FY2016 FY2017 Fiscal Year Amount Distrib () Amount Distrib () YOY () 2010 and before 19487 1 667 19194 637 (15) 2009 2011 2348 0 80 2210 73 (59) 2012 1484 0 51 1404 47 (54) 2013 2917 0 100 3127 104 72 2014 1746 0 60 1937 64 110 2015 1001 0 34 1222 41 221 2016 219 0 08 459 15 1091 2017 ― ― ― 558 19 ― Total 29204 1 1000 30115 1000 31
Generics Proprietary Products (yenmn) FY2016 FY2017 Distrib Distrib YOY Achieved Amount () Amount () () Forecast () Total 31513 1 1000 32153 1 1000 20 32000 1005 Generics 29204 1 927 30115 1 937 31 30000 1 1004 To medical institutions 27808 29174 49 29100 1 1003 To other makers 1395 941 (326) 900 1 1046 Amlodipine 2865 2940 26 2900 1 1014 Lansoprazole 2279 2163 (51) 2100 1 1030 Donepezil 1642 1557 (52) 1600 1 973 Rabeprazole 1586 1558 (18) 1600 1 974 Limaprost Alfadex 1469 1427 (28) 1400 1 1020 Pravastatine 1173 1147 (22) 1100 1 1043 Voglibose 957 870 (91) 900 1 967 Others 17229 18449 71 18400 1 1003 Proprietary products 2308 0 73 2038 0 63 (117) 2000 1 1019 Uralyt 1409 1225 (131) 1200 1 1021 Soleton 679 598 (120) 600 1 997 Calvan 219 214 (21) 200 1 1074 Chemiphar ODM Generics (yenmn) FY2016 FY2017 Distrib Distrib YOY Achieved Amount () Amount () () Forecast () Total 30445 1000 31100 1000 22 31400 990 Generics 29204 959 30115 968 31 30000 1004 Generics (ODM) 1240 41 985 32 (206) 1400 704 Includes exports Revised forecast issued on October 31 2017
Income Statement Overview (yenmn) FY2016 FY2017 of of YOY Achieved Amount Sales Amount Sales () Forecast () Net Sales 35689 1 1000 35331 1 1000 (10) 35500 1 995 Pharmaceuticals 34551 1 968 34279 1 970 (08) ― ― ― Others 1137 0 32 1051 0 30 (76) ― ― ― Cost of sales 19449 1 545 19535 1 553 04 ― ― ― SGampA expenses 13403 0 376 13947 0 395 41 ― ― ― RampD expenses 1984 0 56 2280 0 65 150 2200 0 1037 Operating income 2836 0 79 1848 0 52 (348) 1800 0 1027 Income before income taxes and minority interests 2849 0 80 1696 0 48 (405) 1700 ― 998 Net income attributble to owners of the parent 2054 0 58 1160 0 33 (435) 1150 ― 1009 1961 00550933658 00550933658 00575628587 Revised forecast issued on October 31 2017
Page 6
Sales Distribution
5
By Main Therapeutic Categories ()FY2016 FY2017
Cardiovascular and respiratory drugs 309 320Digestive organ drugs 196 183Agents affecting metabolism 164 165Drugs for nervous system sensory organs 99 91Antibiotics and chemotherapeutic drugs 65 62Antineoplastic agents 32 34Others 135 145
By Launch Year (yenmn)
Fiscal Year AmountDistrib
() AmountDistrib
() YOY ()2010 and before 19487 667 19194 637 (15)2011 2348 80 2210 73 (59)2012 1484 51 1404 47 (54)2013 2917 100 3127 104 722014 1746 60 1937 64 1102015 1001 34 1222 41 2212016 219 08 459 15 10912017 ― ― 558 19 ―Total 29204 1000 30115 1000 31
FY2016 FY2017
PL 医薬品① 医薬品② 医薬品③ BS① BS③ 和文にある「前年同期間比」「前期3月末比」は記載が難しく英語版では必要度の低い情報であるとみなして記載をしないこととなった2016年2Q~(木村)ただし期末では記載が可能なので書きます(須田)
CF CAP EX 業績予想① 英語版では経常利益は書かないので注意(須田)
業績予想 ② 業績予想③ PL 医薬品① 医薬品② 医薬品③ BS① BS③ 和文にある「前年同期間比」「前期3月末比」は記載が難しく英語版では必要度の低い情報であるとみなして記載をしないこととなった2016年2Q~(木村)ただし期末では記載が可能なので書きます(須田)
CF CAP EX 業績予想① 英語版では経常利益は書かないので注意(須田)
業績予想 ② 業績予想③ Balance Sheet per Share Information
6
Per Share Information (yen)FY2016Amount Amount Change Forecast
Earnings per share 53002 31528 (21474) 30673Book value per share 454880 485986 31106 ―Dividend per share 10000 10000 ― 10000Dividend payout ratio () 189 317 ― 326 Revised forecast issued on October 31 2017
FY2017
Balance Sheet Data (yenmn)March 31 2017
Amount Amount ChangeTotal assets 47002 46814 (187) Return on assets () 63 36 (27)Net assets 17355 17487 132 Owned capital 17346 17474 127 Capital-to-asset ratio () 369 373 04 Return on equity () 123 67 (56)Current assets 29009 28334 (674)Current liabilities 14939 14914 (25) Current ratio (x) 194 19 (004)
March 31 2018
PL 医薬品① 医薬品② 医薬品③ BS① BS③ 和文にある「前年同期間比」「前期3月末比」は記載が難しく英語版では必要度の低い情報であるとみなして記載をしないこととなった2016年2Q~(木村)ただし期末では記載が可能なので書きます(須田)
CF CAP EX 業績予想① 英語版では経常利益は書かないので注意(須田)
業績予想 ② 業績予想③ PL 医薬品① 医薬品② 医薬品③ BS① BS③ 和文にある「前年同期間比」「前期3月末比」は記載が難しく英語版では必要度の低い情報であるとみなして記載をしないこととなった2016年2Q~(木村)ただし期末では記載が可能なので書きます(須田)
CF CAP EX 業績予想① 英語版では経常利益は書かないので注意(須田)
業績予想 ② 業績予想③ Cash Flow Expenditure
7
Cash Flow Statements (yenmn)FY2016 FY2017Amount Amount
Net cash Provided by operating activities 2737 3188 Used in investing activities (2504) (1606) Provided by (Used in) financing activities 787 (1741)Cash and cash equivalents 8084 7890Free cash flow 232 1582
Capital Expenditure and Other (yenmn)FY2016
UsageAmount Amount YOY () Forecast Rate ()
Capital expenditure 2928 1645 (438) 1650 997Depreciation and amortization 1112 1192 72 1250 954 Revised forecast issued on October 31 2017
Items
FY2017
PL 医薬品① 医薬品② 医薬品③ BS① BS③ 和文にある「前年同期間比」「前期3月末比」は記載が難しく英語版では必要度の低い情報であるとみなして記載をしないこととなった2016年2Q~(木村)ただし期末では記載が可能なので書きます(須田)
CF CAP EX 業績予想① 英語版では経常利益は書かないので注意(須田)
業績予想 ② 業績予想③ PL 医薬品① 医薬品② 医薬品③ BS① BS③ 和文にある「前年同期間比」「前期3月末比」は記載が難しく英語版では必要度の低い情報であるとみなして記載をしないこととなった2016年2Q~(木村)ただし期末では記載が可能なので書きます(須田)
CF CAP EX 業績予想① 英語版では経常利益は書かないので注意(須田)
業績予想 ② 業績予想③ 8
II FY2018 Forecasts
Sales Income
9
(yenmn)
of of YOYAmount Sales Amount Sales ()
Net Sales 35331 1000 35500 1000 05 Pharmaceuticals 34279 970 ― ― ― Others 1051 30 ― ― ―Cost of sales 19535 553 ― ― ―SGampA expenses 13947 395 ― ― ― RampD expenses 2280 65 2700 76 184Operating income 1848 52 1100 31 (405)
1777 50 ― ― ―
1160 33 500 14 (569)Net income attributble to owners of the parent
FY2018 (Forecast)FY2017
Income before income taxes and minority interests
Annual ForecastSales and profit in FY2018 will be impacted by NHI drug price revisions On the other hand however due to our focus on newly launched products and expansion of new sales channels sales of generic drugs are expected to be nearly flat compared to the previous fiscal year As a result consolidated net sales including other businesses such as contracted testing business are projected to be yen35500 million (up 05 YOY)
Regarding profits due to increased development costs as the progress in new drug development and continued strategic expenses such as trial costs leading up to the commencement of commercial production at the Vietnam factory operating income is forecast at yen1100 million (down 405 YOY) and net income attributable to owners of the parent is expected to be yen500 million (down 569 YOY)
PL 医薬品① 医薬品② 医薬品③ BS① BS③ 和文にある「前年同期間比」「前期3月末比」は記載が難しく英語版では必要度の低い情報であるとみなして記載をしないこととなった2016年2Q~(木村)ただし期末では記載が可能なので書きます(須田)
CF CAP EX 業績予想① 英語版では経常利益は書かないので注意(須田)
業績予想 ② 業績予想③ Pharmaceutical Sales
10
Generics Proprietary Products (yenmn)FY2017Amount Amount YOY ()
Total 32153 31800 (11) Generics 30115 30150 01 To medical institutions 29174 29250 03 To other makers 941 900 (44) Amlodipine 2940 2900 (14) Lansoprazole 2163 1900 (122) Donepezil 1557 1350 (133) Rabeprazole 1558 1350 (134) Limaprost Alfadex 1427 1350 (55) Pravastatine 1147 1100 (41) Voglibose 870 750 (139) Others 18449 19450 54 Proprietary products 2038 1650 (190) Uralyt 1225 1070 (127) Soleton 598 400 (331) Calvan 214 180 (162)
Chemiphar ODM Generics (yenmn)FY2017Amount Amount YOY ()
Total 31100 31350 08 Generics 30115 30150 01 Generics (ODM) 985 1200 218
FY2018 (Forecast)
FY2018 (Forecast)
PL 医薬品① 医薬品② 医薬品③ BS① BS③ 和文にある「前年同期間比」「前期3月末比」は記載が難しく英語版では必要度の低い情報であるとみなして記載をしないこととなった2016年2Q~(木村)ただし期末では記載が可能なので書きます(須田)
CF CAP EX 業績予想① 英語版では経常利益は書かないので注意(須田)
業績予想 ② 業績予想③ Per Share Information Expenditure
11
For further information contactPublic Relations Department Nippon Chemiphar Co LtdE-mail irchemipharcojp
Note about Forward-looking Statements and ForecastsStatements made in this Highlights of Business Results with respect to current plans estimates strategies and beliefs and other statements of Nippon Chemiphar that are not historical facts are forward-looking statements about the future performance of Nippon Chemiphar
These statements are based on managementrsquos current assumptions and beliefs in light of the information currently available to it and involve known and unknown risks and uncertainties Consequently undue reliance should not be placed on these statements
Nippon Chemiphar cautions the reader that a number of important factors could cause actual results to differ materially from those discussed in the forward-looking statements
Per Share Information (yen)FY2017Amount Amount YOY ()
Earnings per share 31528 13584 (569)Book value per share 485986 ― ―Dividends per share 10000 7500 ―Dividend payout ratio () 317 552 ―
Capital Expenditure and Other (yenmn)FY2017Amount Amount Change
Capital expenditure 1645 950 (695)Depreciation and amortization 1192 1350 157
FY2018 (Forecast)
FY2018 (Forecast)
Dividend ForecastAs mentioned above we are forecasting a decline in profit in FY2018 due to the influence of NHI drug price revisions ongoing strategic spending including new drug development expenses and start-up expenses at the Vietnam factory Thus we expect to pay a dividend per share of 75 yen (down 25 yen per share YOY) with a payout ratio of 552
PL 医薬品① 医薬品② 医薬品③ BS① BS③ 和文にある「前年同期間比」「前期3月末比」は記載が難しく英語版では必要度の低い情報であるとみなして記載をしないこととなった2016年2Q~(木村)ただし期末では記載が可能なので書きます(須田)
CF CAP EX 業績予想① 英語版では経常利益は書かないので注意(須田)
業績予想 ② 業績予想③ スライド番号 1 Contents スライド番号 3 Sales Income Pharmaceutical Sales Sales Distribution Balance Sheet per Share Information Cash Flow Expenditure スライド番号 9 Sales Income Pharmaceutical Sales Per Share Information Expenditure Per Share Information (yen) FY2017 FY2018 (Forecast) Amount Amount YOY () Earnings per share 31528 13584 (569) Book value per share 485986 ― ― Dividends per share 10000 7500 ― Dividend payout ratio () 317 552 ― Capital Expenditure and Other (yenmn) FY2017 FY2018 (Forecast) Amount Amount Change Capital expenditure 1645 950 (695) Depreciation and amortization 1192 1350 157 2015年3月期 ガツキ 2016年3月期(予想) ガツキ ヨソウ 金額 キンガク 金額 キンガク 増減額 ゾウゲンガク 増減率 ゾウゲン リツ 医療用医薬品 イリョウヨウ イヤクヒン 27400 30950 +05 ジェネリック医薬品(荷離) イヤクヒン ニ バナレ 25079 27430 +01 内自社販売 ウチ ジシャ ハンバイ 2321 25100 +01 内導出輸出 ウチ ドウシュツ ユシュツ 3011 2330 +04 アムロジピン 1935 3040 +09 ランソプラゾール 1509 1890 24 プラバスタチン 1595 1570 +40 ラベプラゾール 1704 1570 16 リマプロストアルファデクス 1273 1660 26 ボグリボース 1013 1300 +21 ドネペジル 15357 1030 +16 その他 タ 3400 15370 +01 主力品 シュリョク ヒン 1975 3520 +35 ウラリット 1134 1970 03 ソレトン 290 1250 +102 カルバン 0 300 +34 ジェネリック医薬品事業 イヤクヒン ジギョウ 2015年3月期 ガツキ 2016年3月期(予想) ガツキ ヨソウ 金額 キンガク 金額 キンガク 増減額 ゾウゲンガク 増減率 ゾウゲン リツ ジェネリック医薬品事業 イヤクヒン ジギョウ 28918 28840 +1003 ジェネリック医薬品(荷離) イヤクヒン ニ バナレ 27400 27430 +999 受託 ジュタク 1518 1410 +1077
Generics Proprietary Products (yenmn) FY2017 FY2018 (Forecast) Amount Amount YOY () Total 32153 31800 (11) Generics 30115 30150 01 To medical institutions 29174 29250 03 To other makers 941 900 (44) Amlodipine 2940 2900 (14) Lansoprazole 2163 1900 (122) Donepezil 1557 1350 (133) Rabeprazole 1558 1350 (134) Limaprost Alfadex 1427 1350 (55) Pravastatine 1147 1100 (41) Voglibose 870 750 (139) Others 18449 19450 54 Proprietary products 2038 1650 (190) Uralyt 1225 1070 (127) Soleton 598 400 (331) Calvan 214 180 (162) Chemiphar ODM Generics (yenmn) FY2017 FY2018 (Forecast) Amount Amount YOY () Total 31100 31350 08 Generics 30115 30150 01 Generics (ODM) 985 1200 218
Income Statement Overview (yenmn) FY2017 FY2018 (Forecast) of of YOY Amount Sales Amount Sales () Net Sales 35331 1000 35500 1000 05 Pharmaceuticals 34279 970 ― ― ― Others 1051 30 ― ― ― Cost of sales 19535 553 ― ― ― SGampA expenses 13947 395 ― ― ― RampD expenses 2280 65 2700 76 184 Operating income 1848 0 52 1100 31 (405) Income before income taxes and minority interests 1777 80 ― ― ― Net income attributble to owners of the parent 1160 33 500 14 (569)
Capital Expenditure and Other (yenmn) Items FY2016 FY2017 Usage Amount Amount YOY () Forecast Rate () Capital expenditure 2928 1645 (438) 1650 997 Depreciation and amortization 1112 1192 72 1250 954 Revised forecast issued on October 31 2017
Cash Flow Statements (yenmn) FY2016 FY2017 Amount Amount Net cash Provided by operating activities 2737 3188 Used in investing activities (2504) (1606) Used in financing activities 787 (1741) Cash and cash equivalents 8084 7890 Free cash flow 232 1582
Per Share Information (yen) FY2016 FY2017 Amount Amount Change Forecast Earnings per share 53002 31528 (21474) 30673 Book value per share 454880 485986 31106 ― Dividend per share 10000 10000 ― 10000 Dividend payout ratio () 189 317 ― 326 Revised forecast issued on October 31 2017
Balance Sheet Data (yenmn) March 31 2017 August 31 2017 March 31 2015 Amount Amount Change Total assets 47002 46814 3358 (187) Return on assets () 63 36 -06 (27) Net assets 17355 17487 1313 132 Owned capital 17346 17474 1312 127 Capital-to-asset ratio () 369 373 02 +04 Return on equity () 123 67 (01) (56) Current assets 29009 28334 1630 (674) Current liabilities 14939 14914 (716) (25) Current ratio (x) 194 19 019 004
By Main Therapeutic Categories () FY2016 FY2017 Cardiovascular and respiratory drugs 309 320 Digestive organ drugs 196 183 Agents affecting metabolism 164 165 Drugs for nervous system sensory organs 99 91 Antibiotics and chemotherapeutic drugs 65 62 Antineoplastic agents 32 34 Others 135 145
Sales Distribution By Launch Year (yenmn) FY2016 FY2017 Fiscal Year Amount Distrib () Amount Distrib () YOY () 2010 and before 19487 1 667 19194 637 (15) 2009 2011 2348 0 80 2210 73 (59) 2012 1484 0 51 1404 47 (54) 2013 2917 0 100 3127 104 72 2014 1746 0 60 1937 64 110 2015 1001 0 34 1222 41 221 2016 219 0 08 459 15 1091 2017 ― ― ― 558 19 ― Total 29204 1 1000 30115 1000 31
Generics Proprietary Products (yenmn) FY2016 FY2017 Distrib Distrib YOY Achieved Amount () Amount () () Forecast () Total 31513 1 1000 32153 1 1000 20 32000 1005 Generics 29204 1 927 30115 1 937 31 30000 1 1004 To medical institutions 27808 29174 49 29100 1 1003 To other makers 1395 941 (326) 900 1 1046 Amlodipine 2865 2940 26 2900 1 1014 Lansoprazole 2279 2163 (51) 2100 1 1030 Donepezil 1642 1557 (52) 1600 1 973 Rabeprazole 1586 1558 (18) 1600 1 974 Limaprost Alfadex 1469 1427 (28) 1400 1 1020 Pravastatine 1173 1147 (22) 1100 1 1043 Voglibose 957 870 (91) 900 1 967 Others 17229 18449 71 18400 1 1003 Proprietary products 2308 0 73 2038 0 63 (117) 2000 1 1019 Uralyt 1409 1225 (131) 1200 1 1021 Soleton 679 598 (120) 600 1 997 Calvan 219 214 (21) 200 1 1074 Chemiphar ODM Generics (yenmn) FY2016 FY2017 Distrib Distrib YOY Achieved Amount () Amount () () Forecast () Total 30445 1000 31100 1000 22 31400 990 Generics 29204 959 30115 968 31 30000 1004 Generics (ODM) 1240 41 985 32 (206) 1400 704 Includes exports Revised forecast issued on October 31 2017
Income Statement Overview (yenmn) FY2016 FY2017 of of YOY Achieved Amount Sales Amount Sales () Forecast () Net Sales 35689 1 1000 35331 1 1000 (10) 35500 1 995 Pharmaceuticals 34551 1 968 34279 1 970 (08) ― ― ― Others 1137 0 32 1051 0 30 (76) ― ― ― Cost of sales 19449 1 545 19535 1 553 04 ― ― ― SGampA expenses 13403 0 376 13947 0 395 41 ― ― ― RampD expenses 1984 0 56 2280 0 65 150 2200 0 1037 Operating income 2836 0 79 1848 0 52 (348) 1800 0 1027 Income before income taxes and minority interests 2849 0 80 1696 0 48 (405) 1700 ― 998 Net income attributble to owners of the parent 2054 0 58 1160 0 33 (435) 1150 ― 1009 1961 00550933658 00550933658 00575628587 Revised forecast issued on October 31 2017
Per Share Information (yen) FY2017 FY2018 (Forecast) Amount Amount YOY () Earnings per share 31528 13584 (569) Book value per share 485986 ― ― Dividends per share 10000 7500 ― Dividend payout ratio() 317 552 ― Capital Expenditure and Other (yenmn) FY2017 FY2018 (Forecast) Amount Amount Change Capital expenditure 1645 950 (695) Depreciation and amortization 1192 1350 157 2015年3月期 ガツキ 2016年3月期(予想) ガツキ ヨソウ 金額 キンガク 金額 キンガク 増減額 ゾウゲンガク 増減率 ゾウゲン リツ 医療用医薬品 イリョウヨウ イヤクヒン 27400 30950 +05 ジェネリック医薬品(荷離) イヤクヒン ニ バナレ 25079 27430 +01 内自社販売 ウチ ジシャ ハンバイ 2321 25100 +01 内導出輸出 ウチ ドウシュツ ユシュツ 3011 2330 +04 アムロジピン 1935 3040 +09 ランソプラゾール 1509 1890 24 プラバスタチン 1595 1570 +40 ラベプラゾール 1704 1570 16 リマプロストアルファデクス 1273 1660 26 ボグリボース 1013 1300 +21 ドネペジル 15357 1030 +16 その他 タ 3400 15370 +01 主力品 シュリョク ヒン 1975 3520 +35 ウラリット 1134 1970 03 ソレトン 290 1250 +102 カルバン 0 300 +34 ジェネリック医薬品事業 イヤクヒン ジギョウ 2015年3月期 ガツキ 2016年3月期(予想) ガツキ ヨソウ 金額 キンガク 金額 キンガク 増減額 ゾウゲンガク 増減率 ゾウゲン リツ ジェネリック医薬品事業 イヤクヒン ジギョウ 28918 28840 +1003 ジェネリック医薬品(荷離) イヤクヒン ニ バナレ 27400 27430 +999 受託 ジュタク 1518 1410 +1077
Generics Proprietary Products (yenmn) FY2017 FY2018 (Forecast) Amount Amount YOY () Total 32153 31800 (11) Generics 30115 30150 01 To medical institutions 29174 29250 03 To other makers 941 900 (44) Amlodipine 2940 2900 (14) Lansoprazole 2163 1900 (122) Donepezil 1557 1350 (133) Rabeprazole 1558 1350 (134) Limaprost Alfadex 1427 1350 (55) Pravastatine 1147 1100 (41) Voglibose 870 750 (139) Others 18449 19450 54 Proprietary products 2038 1650 (190) Uralyt 1225 1070 (127) Soleton 598 400 (331) Calvan 214 180 (162) Chemiphar ODM Generics (yenmn) FY2017 FY2018 (Forecast) Amount Amount YOY () Total 31100 31350 08 Generics 30115 30150 01 Generics (ODM) 985 1200 218
Income Statement Overview (yenmn) FY2017 FY2018 (Forecast) of of YOY Amount Sales Amount Sales () Net Sales 35331 1000 35500 1000 05 Pharmaceuticals 34279 970 ― ― ― Others 1051 30 ― ― ― Cost of sales 19535 553 ― ― ― SGampA expenses 13947 395 ― ― ― RampD expenses 2280 65 2700 76 184 Operating income 1848 0 52 1100 31 (405) Income before income taxes and minority interests 1777 80 ― ― ― Net income attributble to owners of the parent 1160 33 500 14 (569)
Capital Expenditure and Other (yenmn) Items FY2016 FY2017 Usage Amount Amount YOY () Forecast Rate () Capital expenditure 2928 1645 (438) 1650 997 Depreciation and amortization 1112 1192 72 1250 954 Revised forecast issued on October 31 2017
Cash Flow Statements (yenmn) FY2016 FY2017 Amount Amount Net cash Provided by operating activities 2737 3188 Used in investing activities (2504) (1606) Used in financing activities 787 (1741) Cash and cash equivalents 8084 7890 Free cash flow 232 1582
Per Share Information (yen) FY2016 FY2017 Amount Amount Change Forecast Earnings per share 53002 31528 (21474) 30673 Book value per share 454880 485986 31106 ― Dividend per share 10000 10000 ― 10000 Dividend payout ratio () 189 317 ― 326 Revised forecast issued on October 31 2017
Balance Sheet Data (yenmn) March 31 2017 August 31 2017 March 31 2015 Amount Amount Change Total assets 47002 46814 3358 (187) Return on assets () 63 36 -06 (27) Net assets 17355 17487 1313 132 Owned capital 17346 17474 1312 127 Capital-to-asset ratio () 369 373 02 +04 Return on equity () 123 67 (01) (56) Current assets 29009 28334 1630 (674) Current liabilities 14939 14914 (716) (25) Current ratio (x) 194 19 019 004
By Main Therapeutic Categories () FY2016 FY2017 Cardiovascular and respiratory drugs 309 320 Digestive organ drugs 196 183 Agents affecting metabolism 164 165 Drugs for nervous system sensory organs 99 91 Antibiotics and chemotherapeutic drugs 65 62 Antineoplastic agents 32 34 Others 135 145
Sales Distribution By Launch Year (yenmn) FY2016 FY2017 Fiscal Year Amount Distrib () Amount Distrib () YOY () 2010 and before 19487 1 667 19194 637 (15) 2009 2011 2348 0 80 2210 73 (59) 2012 1484 0 51 1404 47 (54) 2013 2917 0 100 3127 104 72 2014 1746 0 60 1937 64 110 2015 1001 0 34 1222 41 221 2016 219 0 08 459 15 1091 2017 ― ― ― 558 19 ― Total 29204 1 1000 30115 1000 31
Generics Proprietary Products (yenmn) FY2016 FY2017 Distrib Distrib YOY Achieved Amount () Amount () () Forecast () Total 31513 1 1000 32153 1 1000 20 32000 1005 Generics 29204 1 927 30115 1 937 31 30000 1 1004 To medical institutions 27808 29174 49 29100 1 1003 To other makers 1395 941 (326) 900 1 1046 Amlodipine 2865 2940 26 2900 1 1014 Lansoprazole 2279 2163 (51) 2100 1 1030 Donepezil 1642 1557 (52) 1600 1 973 Rabeprazole 1586 1558 (18) 1600 1 974 Limaprost Alfadex 1469 1427 (28) 1400 1 1020 Pravastatine 1173 1147 (22) 1100 1 1043 Voglibose 957 870 (91) 900 1 967 Others 17229 18449 71 18400 1 1003 Proprietary products 2308 0 73 2038 0 63 (117) 2000 1 1019 Uralyt 1409 1225 (131) 1200 1 1021 Soleton 679 598 (120) 600 1 997 Calvan 219 214 (21) 200 1 1074 Chemiphar ODM Generics (yenmn) FY2016 FY2017 Distrib Distrib YOY Achieved Amount () Amount () () Forecast () Total 30445 1000 31100 1000 22 31400 990 Generics 29204 959 30115 968 31 30000 1004 Generics (ODM) 1240 41 985 32 (206) 1400 704 Includes exports Revised forecast issued on October 31 2017
Income Statement Overview (yenmn) FY2016 FY2017 of of YOY Achieved Amount Sales Amount Sales () Forecast () Net Sales 35689 1 1000 35331 1 1000 (10) 35500 1 995 Pharmaceuticals 34551 1 968 34279 1 970 (08) ― ― ― Others 1137 0 32 1051 0 30 (76) ― ― ― Cost of sales 19449 1 545 19535 1 553 04 ― ― ― SGampA expenses 13403 0 376 13947 0 395 41 ― ― ― RampD expenses 1984 0 56 2280 0 65 150 2200 0 1037 Operating income 2836 0 79 1848 0 52 (348) 1800 0 1027 Income before income taxes and minority interests 2849 0 80 1696 0 48 (405) 1700 ― 998 Net income attributble to owners of the parent 2054 0 58 1160 0 33 (435) 1150 ― 1009 1961 00550933658 00550933658 00575628587 Revised forecast issued on October 31 2017
Per Share Information (yen) FY2017 FY2018 (Forecast) Amount Amount YOY () Earnings per share 31528 13584 (569) Book value per share 485986 ― ― Dividends per share 10000 7500 ― Dividend payout ratio() 317 552 ― Capital Expenditure and Other (yenmn) FY2017 FY2018 (Forecast) Amount Amount Change Capital expenditure 1645 950 (695) Depreciation and amortization 1192 1350 157 2015年3月期 ガツキ 2016年3月期(予想) ガツキ ヨソウ 金額 キンガク 金額 キンガク 増減額 ゾウゲンガク 増減率 ゾウゲン リツ 医療用医薬品 イリョウヨウ イヤクヒン 27400 30950 +05 ジェネリック医薬品(荷離) イヤクヒン ニ バナレ 25079 27430 +01 内自社販売 ウチ ジシャ ハンバイ 2321 25100 +01 内導出輸出 ウチ ドウシュツ ユシュツ 3011 2330 +04 アムロジピン 1935 3040 +09 ランソプラゾール 1509 1890 24 プラバスタチン 1595 1570 +40 ラベプラゾール 1704 1570 16 リマプロストアルファデクス 1273 1660 26 ボグリボース 1013 1300 +21 ドネペジル 15357 1030 +16 その他 タ 3400 15370 +01 主力品 シュリョク ヒン 1975 3520 +35 ウラリット 1134 1970 03 ソレトン 290 1250 +102 カルバン 0 300 +34 ジェネリック医薬品事業 イヤクヒン ジギョウ 2015年3月期 ガツキ 2016年3月期(予想) ガツキ ヨソウ 金額 キンガク 金額 キンガク 増減額 ゾウゲンガク 増減率 ゾウゲン リツ ジェネリック医薬品事業 イヤクヒン ジギョウ 28918 28840 +1003 ジェネリック医薬品(荷離) イヤクヒン ニ バナレ 27400 27430 +999 受託 ジュタク 1518 1410 +1077
Generics Proprietary Products (yenmn) FY2017 FY2018 (Forecast) Amount Amount YOY () Total 32153 31800 (11) Generics 30115 30150 01 To medical institutions 29174 29250 03 To other makers 941 900 (44) Amlodipine 2940 2900 (14) Lansoprazole 2163 1900 (122) Donepezil 1557 1350 (133) Rabeprazole 1558 1350 (134) Limaprost Alfadex 1427 1350 (55) Pravastatine 1147 1100 (41) Voglibose 870 750 (139) Others 18449 19450 54 Proprietary products 2038 1650 (190) Uralyt 1225 1070 (127) Soleton 598 400 (331) Calvan 214 180 (162) Chemiphar ODM Generics (yenmn) FY2017 FY2018 (Forecast) Amount Amount YOY () Total 31100 31350 08 Generics 30115 30150 01 Generics (ODM) 985 1200 218
Income Statement Overview (yenmn) FY2017 FY2018 (Forecast) of of YOY Amount Sales Amount Sales () Net Sales 35331 1000 35500 1000 05 Pharmaceuticals 34279 970 ― ― ― Others 1051 30 ― ― ― Cost of sales 19535 553 ― ― ― SGampA expenses 13947 395 ― ― ― RampD expenses 2280 65 2700 76 184 Operating income 1848 0 52 1100 31 (405) Income before income taxes and minority interests 1777 50 ― ― ― Net income attributble to owners of the parent 1160 33 500 14 (569)
Capital Expenditure and Other (yenmn) Items FY2016 FY2017 Usage Amount Amount YOY () Forecast Rate () Capital expenditure 2928 1645 (438) 1650 997 Depreciation and amortization 1112 1192 72 1250 954 Revised forecast issued on October 31 2017
Cash Flow Statements (yenmn) FY2016 FY2017 Amount Amount Net cash Provided by operating activities 2737 3188 Used in investing activities (2504) (1606) Used in financing activities 787 (1741) Cash and cash equivalents 8084 7890 Free cash flow 232 1582
Per Share Information (yen) FY2016 FY2017 Amount Amount Change Forecast Earnings per share 53002 31528 (21474) 30673 Book value per share 454880 485986 31106 ― Dividend per share 10000 10000 ― 10000 Dividend payout ratio () 189 317 ― 326 Revised forecast issued on October 31 2017
Balance Sheet Data (yenmn) March 31 2017 March 31 2018 March 31 2015 Amount Amount Change Total assets 47002 46814 3358 (187) Return on assets () 63 36 -06 (27) Net assets 17355 17487 1313 132 Owned capital 17346 17474 1312 127 Capital-to-asset ratio () 369 373 02 04 Return on equity () 123 67 (01) (56) Current assets 29009 28334 1630 (674) Current liabilities 14939 14914 (716) (25) Current ratio (x) 194 19 019 (004)
By Main Therapeutic Categories () FY2016 FY2017 Cardiovascular and respiratory drugs 309 320 Digestive organ drugs 196 183 Agents affecting metabolism 164 165 Drugs for nervous system sensory organs 99 91 Antibiotics and chemotherapeutic drugs 65 62 Antineoplastic agents 32 34 Others 135 145
Sales Distribution By Launch Year (yenmn) FY2016 FY2017 Fiscal Year Amount Distrib () Amount Distrib () YOY () 2010 and before 19487 1 667 19194 637 (15) 2009 2011 2348 0 80 2210 73 (59) 2012 1484 0 51 1404 47 (54) 2013 2917 0 100 3127 104 72 2014 1746 0 60 1937 64 110 2015 1001 0 34 1222 41 221 2016 219 0 08 459 15 1091 2017 ― ― 558 19 ― Total 29204 1 1000 30115 1000 31
Generics Proprietary Products (yenmn) FY2016 FY2017 Distrib Distrib YOY Achieved Amount () Amount () () Forecast () Total 31513 1 1000 32153 1 1000 20 32000 1005 Generics 29204 1 927 30115 1 937 31 30000 1 1004 To medical institutions 27808 29174 49 29100 1 1003 To other makers 1395 941 (326) 900 1 1046 Amlodipine 2865 2940 26 2900 1 1014 Lansoprazole 2279 2163 (51) 2100 1 1030 Donepezil 1642 1557 (52) 1600 1 973 Rabeprazole 1586 1558 (18) 1600 1 974 Limaprost Alfadex 1469 1427 (28) 1400 1 1020 Pravastatine 1173 1147 (22) 1100 1 1043 Voglibose 957 870 (91) 900 1 967 Others 17229 18449 71 18400 1 1003 Proprietary products 2308 0 73 2038 0 63 (117) 2000 1 1019 Uralyt 1409 1225 (131) 1200 1 1021 Soleton 679 598 (120) 600 1 997 Calvan 219 214 (21) 200 1 1074 Chemiphar ODM Generics (yenmn) FY2016 FY2017 Distrib Distrib YOY Achieved Amount () Amount () () Forecast () Total 30445 1000 31100 1000 22 31400 990 Generics 29204 959 30115 968 31 30000 1004 Generics (ODM) 1240 41 985 32 (206) 1400 704 Includes exports Revised forecast issued on October 31 2017
Income Statement Overview (yenmn) FY2016 FY2017 of of YOY Achieved Amount Sales Amount Sales () Forecast () Net Sales 35689 1 1000 35331 1 1000 (10) 35500 1 995 Pharmaceuticals 34551 1 968 34279 1 970 (08) ― ― Others 1137 0 32 1051 0 30 (76) ― ― Cost of sales 19449 1 545 19535 1 553 04 ― ― SGampA expenses 13403 0 376 13947 0 395 41 ― ― RampD expenses 1984 0 56 2280 0 65 150 2200 0 1037 Operating income 2836 0 79 1848 0 52 (348) 1800 0 1027 Income before income taxes and minority interests 2849 0 80 1777 0 50 (376) ― ― Net income attributble to owners of the parent 2054 0 58 1160 0 33 (435) 1150 ― 1009 1961 00550933658 00550933658 00575628587 Revised forecast issued on October 31 2017
Per Share Information (yen) FY2017 FY2018 (Forecast) Amount Amount YOY () Earnings per share 31528 13584 (569) Book value per share 485986 ― ― Dividends per share 10000 7500 ― Dividend payout ratio() 317 552 ― Capital Expenditure and Other (yenmn) FY2017 FY2018 (Forecast) Amount Amount Change Capital expenditure 1645 950 (695) Depreciation and amortization 1192 1350 157 2015年3月期 ガツキ 2016年3月期(予想) ガツキ ヨソウ 金額 キンガク 金額 キンガク 増減額 ゾウゲンガク 増減率 ゾウゲン リツ 医療用医薬品 イリョウヨウ イヤクヒン 27400 30950 +05 ジェネリック医薬品(荷離) イヤクヒン ニ バナレ 25079 27430 +01 内自社販売 ウチ ジシャ ハンバイ 2321 25100 +01 内導出輸出 ウチ ドウシュツ ユシュツ 3011 2330 +04 アムロジピン 1935 3040 +09 ランソプラゾール 1509 1890 24 プラバスタチン 1595 1570 +40 ラベプラゾール 1704 1570 16 リマプロストアルファデクス 1273 1660 26 ボグリボース 1013 1300 +21 ドネペジル 15357 1030 +16 その他 タ 3400 15370 +01 主力品 シュリョク ヒン 1975 3520 +35 ウラリット 1134 1970 03 ソレトン 290 1250 +102 カルバン 0 300 +34 ジェネリック医薬品事業 イヤクヒン ジギョウ 2015年3月期 ガツキ 2016年3月期(予想) ガツキ ヨソウ 金額 キンガク 金額 キンガク 増減額 ゾウゲンガク 増減率 ゾウゲン リツ ジェネリック医薬品事業 イヤクヒン ジギョウ 28918 28840 +1003 ジェネリック医薬品(荷離) イヤクヒン ニ バナレ 27400 27430 +999 受託 ジュタク 1518 1410 +1077
Generics Proprietary Products (yenmn) FY2017 FY2018 (Forecast) Amount Amount YOY () Total 32153 31800 (11) Generics 30115 30150 01 To medical institutions 29174 29250 03 To other makers 941 900 (44) Amlodipine 2940 2900 (14) Lansoprazole 2163 1900 (122) Donepezil 1557 1350 (133) Rabeprazole 1558 1350 (134) Limaprost Alfadex 1427 1350 (55) Pravastatine 1147 1100 (41) Voglibose 870 750 (139) Others 18449 19450 54 Proprietary products 2038 1650 (190) Uralyt 1225 1070 (127) Soleton 598 400 (331) Calvan 214 180 (162) Chemiphar ODM Generics (yenmn) FY2017 FY2018 (Forecast) Amount Amount YOY () Total 31100 31350 08 Generics 30115 30150 01 Generics (ODM) 985 1200 218
Income Statement Overview (yenmn) FY2017 FY2018 (Forecast) of of YOY Amount Sales Amount Sales () Net Sales 35331 1000 35500 1000 05 Pharmaceuticals 34279 970 ― ― ― Others 1051 30 ― ― ― Cost of sales 19535 553 ― ― ― SGampA expenses 13947 395 ― ― ― RampD expenses 2280 65 2700 76 184 Operating income 1848 0 52 1100 31 (405) Income before income taxes and minority interests 1777 80 ― ― ― Net income attributble to owners of the parent 1160 33 500 14 (569)
Capital Expenditure and Other (yenmn) Items FY2016 FY2017 Usage Amount Amount YOY () Forecast Rate () Capital expenditure 2928 1645 (438) 1650 997 Depreciation and amortization 1112 1192 72 1250 954 Revised forecast issued on October 31 2017
Cash Flow Statements (yenmn) FY2016 FY2017 Amount Amount Net cash Provided by operating activities 2737 3188 Used in investing activities (2504) (1606) Used in financing activities 787 (1741) Cash and cash equivalents 8084 7890 Free cash flow 232 1582
Per Share Information (yen) FY2016 FY2017 Amount Amount Change Forecast Earnings per share 53002 31528 (21474) 30673 Book value per share 454880 485986 31106 ― Dividend per share 10000 10000 ― 10000 Dividend payout ratio () 189 317 ― 326 Revised forecast issued on October 31 2017
Balance Sheet Data (yenmn) March 31 2017 August 31 2017 March 31 2015 Amount Amount Change Total assets 47002 46814 3358 (187) Return on assets () 63 36 -06 (27) Net assets 17355 17487 1313 132 Owned capital 17346 17474 1312 127 Capital-to-asset ratio () 369 373 02 +04 Return on equity () 123 67 (01) (56) Current assets 29009 28334 1630 (674) Current liabilities 14939 14914 (716) (25) Current ratio (x) 194 19 019 004
By Main Therapeutic Categories () FY2016 FY2017 Cardiovascular and respiratory drugs 309 320 Digestive organ drugs 196 183 Agents affecting metabolism 164 165 Drugs for nervous system sensory organs 99 91 Antibiotics and chemotherapeutic drugs 65 62 Antineoplastic agents 32 34 Others 135 145
Sales Distribution By Launch Year (yenmn) FY2016 FY2017 Fiscal Year Amount Distrib () Amount Distrib () YOY () 2010 and before 19487 1 667 19194 637 (15) 2009 2011 2348 0 80 2210 73 (59) 2012 1484 0 51 1404 47 (54) 2013 2917 0 100 3127 104 72 2014 1746 0 60 1937 64 110 2015 1001 0 34 1222 41 221 2016 219 0 08 459 15 1091 2017 ― ― ― 558 19 ― Total 29204 1 1000 30115 1000 31
Generics Proprietary Products (yenmn) FY2016 FY2017 Distrib Distrib YOY Achieved Amount () Amount () () Forecast () Total 31513 1 1000 32153 1 1000 20 32000 1005 Generics 29204 1 927 30115 1 937 31 30000 1 1004 To medical institutions 27808 29174 49 29100 1 1003 To other makers 1395 941 (326) 900 1 1046 Amlodipine 2865 2940 26 2900 1 1014 Lansoprazole 2279 2163 (51) 2100 1 1030 Donepezil 1642 1557 (52) 1600 1 973 Rabeprazole 1586 1558 (18) 1600 1 974 Limaprost Alfadex 1469 1427 (28) 1400 1 1020 Pravastatine 1173 1147 (22) 1100 1 1043 Voglibose 957 870 (91) 900 1 967 Others 17229 18449 71 18400 1 1003 Proprietary products 2308 0 73 2038 0 63 (117) 2000 1 1019 Uralyt 1409 1225 (131) 1200 1 1021 Soleton 679 598 (120) 600 1 997 Calvan 219 214 (21) 200 1 1074 Chemiphar ODM Generics (yenmn) FY2016 FY2017 Distrib Distrib YOY Achieved Amount () Amount () () Forecast () Total 30445 1000 31100 1000 22 31400 990 Generics 29204 959 30115 968 31 30000 1004 Generics (ODM) 1240 41 985 32 (206) 1400 704 Includes exports Revised forecast issued on October 31 2017
Income Statement Overview (yenmn) FY2016 FY2017 of of YOY Achieved Amount Sales Amount Sales () Forecast () Net Sales 35689 1 1000 35331 1 1000 (10) 35500 1 995 Pharmaceuticals 34551 1 968 34279 1 970 (08) ― ― ― Others 1137 0 32 1051 0 30 (76) ― ― ― Cost of sales 19449 1 545 19535 1 553 04 ― ― ― SGampA expenses 13403 0 376 13947 0 395 41 ― ― ― RampD expenses 1984 0 56 2280 0 65 150 2200 0 1037 Operating income 2836 0 79 1848 0 52 (348) 1800 0 1027 Income before income taxes and minority interests 2849 0 80 1696 0 48 (405) 1700 ― 998 Net income attributble to owners of the parent 2054 0 58 1160 0 33 (435) 1150 ― 1009 1961 00550933658 00550933658 00575628587 Revised forecast issued on October 31 2017
Per Share Information (yen) FY2017 FY2018 (Forecast) Amount Amount YOY () Earnings per share 31528 13584 (569) Book value per share 485986 ― ― Dividends per share 10000 7500 ― Dividend payout ratio() 317 552 ― Capital Expenditure and Other (yenmn) FY2017 FY2018 (Forecast) Amount Amount Change Capital expenditure 1645 950 (695) Depreciation and amortization 1192 1350 157 2015年3月期 ガツキ 2016年3月期(予想) ガツキ ヨソウ 金額 キンガク 金額 キンガク 増減額 ゾウゲンガク 増減率 ゾウゲン リツ 医療用医薬品 イリョウヨウ イヤクヒン 27400 30950 +05 ジェネリック医薬品(荷離) イヤクヒン ニ バナレ 25079 27430 +01 内自社販売 ウチ ジシャ ハンバイ 2321 25100 +01 内導出輸出 ウチ ドウシュツ ユシュツ 3011 2330 +04 アムロジピン 1935 3040 +09 ランソプラゾール 1509 1890 24 プラバスタチン 1595 1570 +40 ラベプラゾール 1704 1570 16 リマプロストアルファデクス 1273 1660 26 ボグリボース 1013 1300 +21 ドネペジル 15357 1030 +16 その他 タ 3400 15370 +01 主力品 シュリョク ヒン 1975 3520 +35 ウラリット 1134 1970 03 ソレトン 290 1250 +102 カルバン 0 300 +34 ジェネリック医薬品事業 イヤクヒン ジギョウ 2015年3月期 ガツキ 2016年3月期(予想) ガツキ ヨソウ 金額 キンガク 金額 キンガク 増減額 ゾウゲンガク 増減率 ゾウゲン リツ ジェネリック医薬品事業 イヤクヒン ジギョウ 28918 28840 +1003 ジェネリック医薬品(荷離) イヤクヒン ニ バナレ 27400 27430 +999 受託 ジュタク 1518 1410 +1077
Generics Proprietary Products (yenmn) FY2017 FY2018 (Forecast) Amount Amount YOY () Total 32153 31800 (11) Generics 30115 30150 01 To medical institutions 29174 29250 03 To other makers 941 900 (44) Amlodipine 2940 2900 (14) Lansoprazole 2163 1900 (122) Donepezil 1557 1350 (133) Rabeprazole 1558 1350 (134) Limaprost Alfadex 1427 1350 (55) Pravastatine 1147 1100 (41) Voglibose 870 750 (139) Others 18449 19450 54 Proprietary products 2038 1650 (190) Uralyt 1225 1070 (127) Soleton 598 400 (331) Calvan 214 180 (162) Chemiphar ODM Generics (yenmn) FY2017 FY2018 (Forecast) Amount Amount YOY () Total 31100 31350 08 Generics 30115 30150 01 Generics (ODM) 985 1200 218
Income Statement Overview (yenmn) FY2017 FY2018 (Forecast) of of YOY Amount Sales Amount Sales () Net Sales 35331 1000 35500 1000 05 Pharmaceuticals 34279 970 ― ― ― Others 1051 30 ― ― ― Cost of sales 19535 553 ― ― ― SGampA expenses 13947 395 ― ― ― RampD expenses 2280 65 2700 76 184 Operating income 1848 0 52 1100 31 (405) Income before income taxes and minority interests 1777 80 ― ― ― Net income attributble to owners of the parent 1160 33 500 14 (569)
Capital Expenditure and Other (yenmn) Items FY2016 FY2017 Usage Amount Amount YOY () Forecast Rate () Capital expenditure 2928 1645 (438) 1650 997 Depreciation and amortization 1112 1192 72 1250 954 Revised forecast issued on October 31 2017
Cash Flow Statements (yenmn) FY2016 FY2017 Amount Amount Net cash Provided by operating activities 2737 3188 Used in investing activities (2504) (1606) Provided by (Used in) financing activities 787 (1741) Cash and cash equivalents 8084 7890 Free cash flow 232 1582
Per Share Information (yen) FY2016 FY2017 Amount Amount Change Forecast Earnings per share 53002 31528 (21474) 30673 Book value per share 454880 485986 31106 ― Dividend per share 10000 10000 ― 10000 Dividend payout ratio () 189 317 ― 326 Revised forecast issued on October 31 2017
Balance Sheet Data (yenmn) March 31 2017 August 31 2017 March 31 2015 Amount Amount Change Total assets 47002 46814 3358 (187) Return on assets () 63 36 -06 (27) Net assets 17355 17487 1313 132 Owned capital 17346 17474 1312 127 Capital-to-asset ratio () 369 373 02 +04 Return on equity () 123 67 (01) (56) Current assets 29009 28334 1630 (674) Current liabilities 14939 14914 (716) (25) Current ratio (x) 194 19 019 004
By Main Therapeutic Categories () FY2016 FY2017 Cardiovascular and respiratory drugs 309 320 Digestive organ drugs 196 183 Agents affecting metabolism 164 165 Drugs for nervous system sensory organs 99 91 Antibiotics and chemotherapeutic drugs 65 62 Antineoplastic agents 32 34 Others 135 145
Sales Distribution By Launch Year (yenmn) FY2016 FY2017 Fiscal Year Amount Distrib () Amount Distrib () YOY () 2010 and before 19487 1 667 19194 637 (15) 2009 2011 2348 0 80 2210 73 (59) 2012 1484 0 51 1404 47 (54) 2013 2917 0 100 3127 104 72 2014 1746 0 60 1937 64 110 2015 1001 0 34 1222 41 221 2016 219 0 08 459 15 1091 2017 ― ― ― 558 19 ― Total 29204 1 1000 30115 1000 31
Generics Proprietary Products (yenmn) FY2016 FY2017 Distrib Distrib YOY Achieved Amount () Amount () () Forecast () Total 31513 1 1000 32153 1 1000 20 32000 1005 Generics 29204 1 927 30115 1 937 31 30000 1 1004 To medical institutions 27808 29174 49 29100 1 1003 To other makers 1395 941 (326) 900 1 1046 Amlodipine 2865 2940 26 2900 1 1014 Lansoprazole 2279 2163 (51) 2100 1 1030 Donepezil 1642 1557 (52) 1600 1 973 Rabeprazole 1586 1558 (18) 1600 1 974 Limaprost Alfadex 1469 1427 (28) 1400 1 1020 Pravastatine 1173 1147 (22) 1100 1 1043 Voglibose 957 870 (91) 900 1 967 Others 17229 18449 71 18400 1 1003 Proprietary products 2308 0 73 2038 0 63 (117) 2000 1 1019 Uralyt 1409 1225 (131) 1200 1 1021 Soleton 679 598 (120) 600 1 997 Calvan 219 214 (21) 200 1 1074 Chemiphar ODM Generics (yenmn) FY2016 FY2017 Distrib Distrib YOY Achieved Amount () Amount () () Forecast () Total 30445 1000 31100 1000 22 31400 990 Generics 29204 959 30115 968 31 30000 1004 Generics (ODM) 1240 41 985 32 (206) 1400 704 Includes exports Revised forecast issued on October 31 2017
Income Statement Overview (yenmn) FY2016 FY2017 of of YOY Achieved Amount Sales Amount Sales () Forecast () Net Sales 35689 1 1000 35331 1 1000 (10) 35500 1 995 Pharmaceuticals 34551 1 968 34279 1 970 (08) ― ― ― Others 1137 0 32 1051 0 30 (76) ― ― ― Cost of sales 19449 1 545 19535 1 553 04 ― ― ― SGampA expenses 13403 0 376 13947 0 395 41 ― ― ― RampD expenses 1984 0 56 2280 0 65 150 2200 0 1037 Operating income 2836 0 79 1848 0 52 (348) 1800 0 1027 Income before income taxes and minority interests 2849 0 80 1696 0 48 (405) 1700 ― 998 Net income attributble to owners of the parent 2054 0 58 1160 0 33 (435) 1150 ― 1009 1961 00550933658 00550933658 00575628587 Revised forecast issued on October 31 2017
Per Share Information (yen) FY2017 FY2018 (Forecast) Amount Amount YOY () Earnings per share 31528 13584 (569) Book value per share 485986 ― ― Dividends per share 10000 7500 ― Dividend payout ratio() 317 552 ― Capital Expenditure and Other (yenmn) FY2017 FY2018 (Forecast) Amount Amount Change Capital expenditure 1645 950 (695) Depreciation and amortization 1192 1350 157 2015年3月期 ガツキ 2016年3月期(予想) ガツキ ヨソウ 金額 キンガク 金額 キンガク 増減額 ゾウゲンガク 増減率 ゾウゲン リツ 医療用医薬品 イリョウヨウ イヤクヒン 27400 30950 +05 ジェネリック医薬品(荷離) イヤクヒン ニ バナレ 25079 27430 +01 内自社販売 ウチ ジシャ ハンバイ 2321 25100 +01 内導出輸出 ウチ ドウシュツ ユシュツ 3011 2330 +04 アムロジピン 1935 3040 +09 ランソプラゾール 1509 1890 24 プラバスタチン 1595 1570 +40 ラベプラゾール 1704 1570 16 リマプロストアルファデクス 1273 1660 26 ボグリボース 1013 1300 +21 ドネペジル 15357 1030 +16 その他 タ 3400 15370 +01 主力品 シュリョク ヒン 1975 3520 +35 ウラリット 1134 1970 03 ソレトン 290 1250 +102 カルバン 0 300 +34 ジェネリック医薬品事業 イヤクヒン ジギョウ 2015年3月期 ガツキ 2016年3月期(予想) ガツキ ヨソウ 金額 キンガク 金額 キンガク 増減額 ゾウゲンガク 増減率 ゾウゲン リツ ジェネリック医薬品事業 イヤクヒン ジギョウ 28918 28840 +1003 ジェネリック医薬品(荷離) イヤクヒン ニ バナレ 27400 27430 +999 受託 ジュタク 1518 1410 +1077
Generics Proprietary Products (yenmn) FY2017 FY2018 (Forecast) Amount Amount YOY () Total 32153 31800 (11) Generics 30115 30150 01 To medical institutions 29174 29250 03 To other makers 941 900 (44) Amlodipine 2940 2900 (14) Lansoprazole 2163 1900 (122) Donepezil 1557 1350 (133) Rabeprazole 1558 1350 (134) Limaprost Alfadex 1427 1350 (55) Pravastatine 1147 1100 (41) Voglibose 870 750 (139) Others 18449 19450 54 Proprietary products 2038 1650 (190) Uralyt 1225 1070 (127) Soleton 598 400 (331) Calvan 214 180 (162) Chemiphar ODM Generics (yenmn) FY2017 FY2018 (Forecast) Amount Amount YOY () Total 31100 31350 08 Generics 30115 30150 01 Generics (ODM) 985 1200 218
Income Statement Overview (yenmn) FY2017 FY2018 (Forecast) of of YOY Amount Sales Amount Sales () Net Sales 35331 1000 35500 1000 05 Pharmaceuticals 34279 970 ― ― ― Others 1051 30 ― ― ― Cost of sales 19535 553 ― ― ― SGampA expenses 13947 395 ― ― ― RampD expenses 2280 65 2700 76 184 Operating income 1848 0 52 1100 31 (405) Income before income taxes and minority interests 1777 80 ― ― ― Net income attributble to owners of the parent 1160 33 500 14 (569)
Capital Expenditure and Other (yenmn) Items FY2016 FY2017 Usage Amount Amount YOY () Forecast Rate () Capital expenditure 2928 1645 (438) 1650 997 Depreciation and amortization 1112 1192 72 1250 954 Revised forecast issued on October 31 2017
Cash Flow Statements (yenmn) FY2016 FY2017 Amount Amount Net cash Provided by operating activities 2737 3188 Used in investing activities (2504) (1606) Used in financing activities 787 (1741) Cash and cash equivalents 8084 7890 Free cash flow 232 1582
Per Share Information (yen) FY2016 FY2017 Amount Amount Change Forecast Earnings per share 53002 31528 (21474) 30673 Book value per share 454880 485986 31106 ― Dividend per share 10000 10000 ― 10000 Dividend payout ratio () 189 317 ― 326 Revised forecast issued on October 31 2017
Balance Sheet Data (yenmn) March 31 2017 March 31 2018 March 31 2015 Amount Amount Change Total assets 47002 46814 3358 (187) Return on assets () 63 36 -06 (27) Net assets 17355 17487 1313 132 Owned capital 17346 17474 1312 127 Capital-to-asset ratio () 369 373 02 04 Return on equity () 123 67 (01) (56) Current assets 29009 28334 1630 (674) Current liabilities 14939 14914 (716) (25) Current ratio (x) 194 19 019 (004)
By Main Therapeutic Categories () FY2016 FY2017 Cardiovascular and respiratory drugs 309 320 Digestive organ drugs 196 183 Agents affecting metabolism 164 165 Drugs for nervous system sensory organs 99 91 Antibiotics and chemotherapeutic drugs 65 62 Antineoplastic agents 32 34 Others 135 145
Sales Distribution By Launch Year (yenmn) FY2016 FY2017 Fiscal Year Amount Distrib () Amount Distrib () YOY () 2010 and before 19487 1 667 19194 637 (15) 2009 2011 2348 0 80 2210 73 (59) 2012 1484 0 51 1404 47 (54) 2013 2917 0 100 3127 104 72 2014 1746 0 60 1937 64 110 2015 1001 0 34 1222 41 221 2016 219 0 08 459 15 1091 2017 ― ― 558 19 ― Total 29204 1 1000 30115 1000 31
Generics Proprietary Products (yenmn) FY2016 FY2017 Distrib Distrib YOY Achieved Amount () Amount () () Forecast () Total 31513 1 1000 32153 1 1000 20 32000 1005 Generics 29204 1 927 30115 1 937 31 30000 1 1004 To medical institutions 27808 29174 49 29100 1 1003 To other makers 1395 941 (326) 900 1 1046 Amlodipine 2865 2940 26 2900 1 1014 Lansoprazole 2279 2163 (51) 2100 1 1030 Donepezil 1642 1557 (52) 1600 1 973 Rabeprazole 1586 1558 (18) 1600 1 974 Limaprost Alfadex 1469 1427 (28) 1400 1 1020 Pravastatine 1173 1147 (22) 1100 1 1043 Voglibose 957 870 (91) 900 1 967 Others 17229 18449 71 18400 1 1003 Proprietary products 2308 0 73 2038 0 63 (117) 2000 1 1019 Uralyt 1409 1225 (131) 1200 1 1021 Soleton 679 598 (120) 600 1 997 Calvan 219 214 (21) 200 1 1074 Chemiphar ODM Generics (yenmn) FY2016 FY2017 Distrib Distrib YOY Achieved Amount () Amount () () Forecast () Total 30445 1000 31100 1000 22 31400 990 Generics 29204 959 30115 968 31 30000 1004 Generics (ODM) 1240 41 985 32 (206) 1400 704 Includes exports Revised forecast issued on October 31 2017
Income Statement Overview (yenmn) FY2016 FY2017 of of YOY Achieved Amount Sales Amount Sales () Forecast () Net Sales 35689 1 1000 35331 1 1000 (10) 35500 1 995 Pharmaceuticals 34551 1 968 34279 1 970 (08) ― ― Others 1137 0 32 1051 0 30 (76) ― ― Cost of sales 19449 1 545 19535 1 553 04 ― ― SGampA expenses 13403 0 376 13947 0 395 41 ― ― RampD expenses 1984 0 56 2280 0 65 150 2200 0 1037 Operating income 2836 0 79 1848 0 52 (348) 1800 0 1027 Income before income taxes and minority interests 2849 0 80 1777 0 50 (376) ― ― Net income attributble to owners of the parent 2054 0 58 1160 0 33 (435) 1150 ― 1009 1961 00550933658 00550933658 00575628587 Revised forecast issued on October 31 2017
Per Share Information (yen) FY2017 FY2018 (Forecast) Amount Amount YOY () Earnings per share 31528 13584 (569) Book value per share 485986 ― ― Dividends per share 10000 7500 ― Dividend payout ratio() 317 552 ― Capital Expenditure and Other (yenmn) FY2017 FY2018 (Forecast) Amount Amount Change Capital expenditure 1645 950 (695) Depreciation and amortization 1192 1350 157 2015年3月期 ガツキ 2016年3月期(予想) ガツキ ヨソウ 金額 キンガク 金額 キンガク 増減額 ゾウゲンガク 増減率 ゾウゲン リツ 医療用医薬品 イリョウヨウ イヤクヒン 27400 30950 +05 ジェネリック医薬品(荷離) イヤクヒン ニ バナレ 25079 27430 +01 内自社販売 ウチ ジシャ ハンバイ 2321 25100 +01 内導出輸出 ウチ ドウシュツ ユシュツ 3011 2330 +04 アムロジピン 1935 3040 +09 ランソプラゾール 1509 1890 24 プラバスタチン 1595 1570 +40 ラベプラゾール 1704 1570 16 リマプロストアルファデクス 1273 1660 26 ボグリボース 1013 1300 +21 ドネペジル 15357 1030 +16 その他 タ 3400 15370 +01 主力品 シュリョク ヒン 1975 3520 +35 ウラリット 1134 1970 03 ソレトン 290 1250 +102 カルバン 0 300 +34 ジェネリック医薬品事業 イヤクヒン ジギョウ 2015年3月期 ガツキ 2016年3月期(予想) ガツキ ヨソウ 金額 キンガク 金額 キンガク 増減額 ゾウゲンガク 増減率 ゾウゲン リツ ジェネリック医薬品事業 イヤクヒン ジギョウ 28918 28840 +1003 ジェネリック医薬品(荷離) イヤクヒン ニ バナレ 27400 27430 +999 受託 ジュタク 1518 1410 +1077
Generics Proprietary Products (yenmn) FY2017 FY2018 (Forecast) Amount Amount YOY () Total 32153 31800 (11) Generics 30115 30150 01 To medical institutions 29174 29250 03 To other makers 941 900 (44) Amlodipine 2940 2900 (14) Lansoprazole 2163 1900 (122) Donepezil 1557 1350 (133) Rabeprazole 1558 1350 (134) Limaprost Alfadex 1427 1350 (55) Pravastatine 1147 1100 (41) Voglibose 870 750 (139) Others 18449 19450 54 Proprietary products 2038 1650 (190) Uralyt 1225 1070 (127) Soleton 598 400 (331) Calvan 214 180 (162) Chemiphar ODM Generics (yenmn) FY2017 FY2018 (Forecast) Amount Amount YOY () Total 31100 31350 08 Generics 30115 30150 01 Generics (ODM) 985 1200 218
Income Statement Overview (yenmn) FY2017 FY2018 (Forecast) of of YOY Amount Sales Amount Sales () Net Sales 35331 1000 35500 1000 05 Pharmaceuticals 34279 970 ― ― ― Others 1051 30 ― ― ― Cost of sales 19535 553 ― ― ― SGampA expenses 13947 395 ― ― ― RampD expenses 2280 65 2700 76 184 Operating income 1848 0 52 1100 31 (405) Income before income taxes and minority interests 1777 80 ― ― ― Net income attributble to owners of the parent 1160 33 500 14 (569)
Capital Expenditure and Other (yenmn) Items FY2016 FY2017 Usage Amount Amount YOY () Forecast Rate () Capital expenditure 2928 1645 (438) 1650 997 Depreciation and amortization 1112 1192 72 1250 954 Revised forecast issued on October 31 2017
Cash Flow Statements (yenmn) FY2016 FY2017 Amount Amount Net cash Provided by operating activities 2737 3188 Used in investing activities (2504) (1606) Used in financing activities 787 (1741) Cash and cash equivalents 8084 7890 Free cash flow 232 1582
Per Share Information (yen) FY2016 FY2017 Amount Amount Change Forecast Earnings per share 53002 31528 (21474) 30673 Book value per share 454880 485986 31106 ― Dividend per share 10000 10000 ― 10000 Dividend payout ratio () 189 317 ― 326 Revised forecast issued on October 31 2017
Balance Sheet Data (yenmn) March 31 2017 August 31 2017 March 31 2015 Amount Amount Change Total assets 47002 46814 3358 (187) Return on assets () 63 36 -06 (27) Net assets 17355 17487 1313 132 Owned capital 17346 17474 1312 127 Capital-to-asset ratio () 369 373 02 +04 Return on equity () 123 67 (01) (56) Current assets 29009 28334 1630 (674) Current liabilities 14939 14914 (716) (25) Current ratio (x) 194 19 019 004
By Main Therapeutic Categories () FY2016 FY2017 Cardiovascular and respiratory drugs 309 320 Digestive organ drugs 196 183 Agents affecting metabolism 164 165 Drugs for nervous system sensory organs 99 91 Antibiotics and chemotherapeutic drugs 65 62 Antineoplastic agents 32 34 Others 135 145
Sales Distribution By Launch Year (yenmn) FY2016 FY2017 Fiscal Year Amount Distrib () Amount Distrib () YOY () 2010 and before 19487 1 667 19194 637 (15) 2009 2011 2348 0 80 2210 73 (59) 2012 1484 0 51 1404 47 (54) 2013 2917 0 100 3127 104 72 2014 1746 0 60 1937 64 110 2015 1001 0 34 1222 41 221 2016 219 0 08 459 15 1091 2017 ― ― ― 558 19 ― Total 29204 1 1000 30115 1000 31
Generics Proprietary Products (yenmn) FY2016 FY2017 Distrib Distrib YOY Achieved Amount () Amount () () Forecast () Total 31513 1 1000 32153 1 1000 20 32000 1005 Generics 29204 1 927 30115 1 937 31 30000 1 1004 To medical institutions 27808 29174 49 29100 1 1003 To other makers 1395 941 (326) 900 1 1046 Amlodipine 2865 2940 26 2900 1 1014 Lansoprazole 2279 2163 (51) 2100 1 1030 Donepezil 1642 1557 (52) 1600 1 973 Rabeprazole 1586 1558 (18) 1600 1 974 Limaprost Alfadex 1469 1427 (28) 1400 1 1020 Pravastatine 1173 1147 (22) 1100 1 1043 Voglibose 957 870 (91) 900 1 967 Others 17229 18449 71 18400 1 1003 Proprietary products 2308 0 73 2038 0 63 (117) 2000 1 1019 Uralyt 1409 1225 (131) 1200 1 1021 Soleton 679 598 (120) 600 1 997 Calvan 219 214 (21) 200 1 1074 Chemiphar ODM Generics (yenmn) FY2016 FY2017 Distrib Distrib YOY Achieved Amount () Amount () () Forecast () Total 30445 1000 31100 1000 22 31400 990 Generics 29204 959 30115 968 31 30000 1004 Generics (ODM) 1240 41 985 32 (206) 1400 704 Includes exports Revised forecast issued on October 31 2017
Income Statement Overview (yenmn) FY2016 FY2017 of of YOY Achieved Amount Sales Amount Sales () Forecast () Net Sales 35689 1 1000 35331 1 1000 (10) 35500 1 995 Pharmaceuticals 34551 1 968 34279 1 970 (08) ― ― ― Others 1137 0 32 1051 0 30 (76) ― ― ― Cost of sales 19449 1 545 19535 1 553 04 ― ― ― SGampA expenses 13403 0 376 13947 0 395 41 ― ― ― RampD expenses 1984 0 56 2280 0 65 150 2200 0 1037 Operating income 2836 0 79 1848 0 52 (348) 1800 0 1027 Income before income taxes and minority interests 2849 0 80 1696 0 48 (405) 1700 ― 998 Net income attributble to owners of the parent 2054 0 58 1160 0 33 (435) 1150 ― 1009 1961 00550933658 00550933658 00575628587 Revised forecast issued on October 31 2017
Per Share Information (yen) FY2017 FY2018 (Forecast) Amount Amount YOY () Earnings per share 31528 13584 (569) Book value per share 485986 ― ― Dividends per share 10000 7500 ― Dividend payout ratio() 317 552 ― Capital Expenditure and Other (yenmn) FY2017 FY2018 (Forecast) Amount Amount Change Capital expenditure 1645 950 (695) Depreciation and amortization 1192 1350 157 2015年3月期 ガツキ 2016年3月期(予想) ガツキ ヨソウ 金額 キンガク 金額 キンガク 増減額 ゾウゲンガク 増減率 ゾウゲン リツ 医療用医薬品 イリョウヨウ イヤクヒン 27400 30950 +05 ジェネリック医薬品(荷離) イヤクヒン ニ バナレ 25079 27430 +01 内自社販売 ウチ ジシャ ハンバイ 2321 25100 +01 内導出輸出 ウチ ドウシュツ ユシュツ 3011 2330 +04 アムロジピン 1935 3040 +09 ランソプラゾール 1509 1890 24 プラバスタチン 1595 1570 +40 ラベプラゾール 1704 1570 16 リマプロストアルファデクス 1273 1660 26 ボグリボース 1013 1300 +21 ドネペジル 15357 1030 +16 その他 タ 3400 15370 +01 主力品 シュリョク ヒン 1975 3520 +35 ウラリット 1134 1970 03 ソレトン 290 1250 +102 カルバン 0 300 +34 ジェネリック医薬品事業 イヤクヒン ジギョウ 2015年3月期 ガツキ 2016年3月期(予想) ガツキ ヨソウ 金額 キンガク 金額 キンガク 増減額 ゾウゲンガク 増減率 ゾウゲン リツ ジェネリック医薬品事業 イヤクヒン ジギョウ 28918 28840 +1003 ジェネリック医薬品(荷離) イヤクヒン ニ バナレ 27400 27430 +999 受託 ジュタク 1518 1410 +1077
Generics Proprietary Products (yenmn) FY2017 FY2018 (Forecast) Amount Amount YOY () Total 32153 31800 (11) Generics 30115 30150 01 To medical institutions 29174 29250 03 To other makers 941 900 (44) Amlodipine 2940 2900 (14) Lansoprazole 2163 1900 (122) Donepezil 1557 1350 (133) Rabeprazole 1558 1350 (134) Limaprost Alfadex 1427 1350 (55) Pravastatine 1147 1100 (41) Voglibose 870 750 (139) Others 18449 19450 54 Proprietary products 2038 1650 (190) Uralyt 1225 1070 (127) Soleton 598 400 (331) Calvan 214 180 (162) Chemiphar ODM Generics (yenmn) FY2017 FY2018 (Forecast) Amount Amount YOY () Total 31100 31350 08 Generics 30115 30150 01 Generics (ODM) 985 1200 218
Income Statement Overview (yenmn) FY2017 FY2018 (Forecast) of of YOY Amount Sales Amount Sales () Net Sales 35331 1000 35500 1000 05 Pharmaceuticals 34279 970 ― ― ― Others 1051 30 ― ― ― Cost of sales 19535 553 ― ― ― SGampA expenses 13947 395 ― ― ― RampD expenses 2280 65 2700 76 184 Operating income 1848 0 52 1100 31 (405) Income before income taxes and minority interests 1777 80 ― ― ― Net income attributble to owners of the parent 1160 33 500 14 (569)
Capital Expenditure and Other (yenmn) Items FY2016 FY2017 Usage Amount Amount YOY () Forecast Rate () Capital expenditure 2928 1645 (438) 1650 997 Depreciation and amortization 1112 1192 72 1250 954 Revised forecast issued on October 31 2017
Cash Flow Statements (yenmn) FY2016 FY2017 Amount Amount Net cash Provided by operating activities 2737 3188 Used in investing activities (2504) (1606) Used in financing activities 787 (1741) Cash and cash equivalents 8084 7890 Free cash flow 232 1582
Per Share Information (yen) FY2016 FY2017 Amount Amount Change Forecast Earnings per share 53002 31528 (21474) 30673 Book value per share 454880 485986 31106 ― Dividend per share 10000 10000 ― 10000 Dividend payout ratio () 189 317 ― 326 Revised forecast issued on October 31 2017
Balance Sheet Data (yenmn) March 31 2017 August 31 2017 March 31 2015 Amount Amount Change Total assets 47002 46814 3358 (187) Return on assets () 63 36 -06 (27) Net assets 17355 17487 1313 132 Owned capital 17346 17474 1312 127 Capital-to-asset ratio () 369 373 02 +04 Return on equity () 123 67 (01) (56) Current assets 29009 28334 1630 (674) Current liabilities 14939 14914 (716) (25) Current ratio (x) 194 19 019 004
By Main Therapeutic Categories () FY2016 FY2017 Cardiovascular and respiratory drugs 309 320 Digestive organ drugs 196 183 Agents affecting metabolism 164 165 Drugs for nervous system sensory organs 99 91 Antibiotics and chemotherapeutic drugs 65 62 Antineoplastic agents 32 34 Others 135 145
Sales Distribution By Launch Year (yenmn) FY2016 FY2017 Fiscal Year Amount Distrib () Amount Distrib () YOY () 2010 and before 19487 1 667 19194 637 (15) 2009 2011 2348 0 80 2210 73 (59) 2012 1484 0 51 1404 47 (54) 2013 2917 0 100 3127 104 72 2014 1746 0 60 1937 64 110 2015 1001 0 34 1222 41 221 2016 219 0 08 459 15 1091 2017 ― ― 558 19 ― Total 29204 1 1000 30115 1000 31
Generics Proprietary Products (yenmn) FY2016 FY2017 Distrib Distrib YOY Achieved Amount () Amount () () Forecast () Total 31513 1 1000 32153 1 1000 20 32000 1005 Generics 29204 1 927 30115 1 937 31 30000 1 1004 To medical institutions 27808 29174 49 29100 1 1003 To other makers 1395 941 (326) 900 1 1046 Amlodipine 2865 2940 26 2900 1 1014 Lansoprazole 2279 2163 (51) 2100 1 1030 Donepezil 1642 1557 (52) 1600 1 973 Rabeprazole 1586 1558 (18) 1600 1 974 Limaprost Alfadex 1469 1427 (28) 1400 1 1020 Pravastatine 1173 1147 (22) 1100 1 1043 Voglibose 957 870 (91) 900 1 967 Others 17229 18449 71 18400 1 1003 Proprietary products 2308 0 73 2038 0 63 (117) 2000 1 1019 Uralyt 1409 1225 (131) 1200 1 1021 Soleton 679 598 (120) 600 1 997 Calvan 219 214 (21) 200 1 1074 Chemiphar ODM Generics (yenmn) FY2016 FY2017 Distrib Distrib YOY Achieved Amount () Amount () () Forecast () Total 30445 1000 31100 1000 22 31400 990 Generics 29204 959 30115 968 31 30000 1004 Generics (ODM) 1240 41 985 32 (206) 1400 704 Includes exports Revised forecast issued on October 31 2017
Income Statement Overview (yenmn) FY2016 FY2017 of of YOY Achieved Amount Sales Amount Sales () Forecast () Net Sales 35689 1 1000 35331 1 1000 (10) 35500 1 995 Pharmaceuticals 34551 1 968 34279 1 970 (08) ― ― Others 1137 0 32 1051 0 30 (76) ― ― Cost of sales 19449 1 545 19535 1 553 04 ― ― SGampA expenses 13403 0 376 13947 0 395 41 ― ― RampD expenses 1984 0 56 2280 0 65 150 2200 0 1037 Operating income 2836 0 79 1848 0 52 (348) 1800 0 1027 Income before income taxes and minority interests 2849 0 80 1696 0 48 (405) 1700 ― 998 Net income attributble to owners of the parent 2054 0 58 1160 0 33 (435) 1150 ― 1009 1961 00550933658 00550933658 00575628587 Revised forecast issued on October 31 2017
Per Share Information (yen) FY2017 FY2018 (Forecast) Amount Amount YOY () Earnings per share 31528 13584 (569) Book value per share 485986 ― ― Dividends per share 10000 7500 ― Dividend payout ratio() 317 552 ― Capital Expenditure and Other (yenmn) FY2017 FY2018 (Forecast) Amount Amount Change Capital expenditure 1645 950 (695) Depreciation and amortization 1192 1350 157 2015年3月期 ガツキ 2016年3月期(予想) ガツキ ヨソウ 金額 キンガク 金額 キンガク 増減額 ゾウゲンガク 増減率 ゾウゲン リツ 医療用医薬品 イリョウヨウ イヤクヒン 27400 30950 +05 ジェネリック医薬品(荷離) イヤクヒン ニ バナレ 25079 27430 +01 内自社販売 ウチ ジシャ ハンバイ 2321 25100 +01 内導出輸出 ウチ ドウシュツ ユシュツ 3011 2330 +04 アムロジピン 1935 3040 +09 ランソプラゾール 1509 1890 24 プラバスタチン 1595 1570 +40 ラベプラゾール 1704 1570 16 リマプロストアルファデクス 1273 1660 26 ボグリボース 1013 1300 +21 ドネペジル 15357 1030 +16 その他 タ 3400 15370 +01 主力品 シュリョク ヒン 1975 3520 +35 ウラリット 1134 1970 03 ソレトン 290 1250 +102 カルバン 0 300 +34 ジェネリック医薬品事業 イヤクヒン ジギョウ 2015年3月期 ガツキ 2016年3月期(予想) ガツキ ヨソウ 金額 キンガク 金額 キンガク 増減額 ゾウゲンガク 増減率 ゾウゲン リツ ジェネリック医薬品事業 イヤクヒン ジギョウ 28918 28840 +1003 ジェネリック医薬品(荷離) イヤクヒン ニ バナレ 27400 27430 +999 受託 ジュタク 1518 1410 +1077
Generics Proprietary Products (yenmn) FY2017 FY2018 (Forecast) Amount Amount YOY () Total 32153 31800 (11) Generics 30115 30150 01 To medical institutions 29174 29250 03 To other makers 941 900 (44) Amlodipine 2940 2900 (14) Lansoprazole 2163 1900 (122) Donepezil 1557 1350 (133) Rabeprazole 1558 1350 (134) Limaprost Alfadex 1427 1350 (55) Pravastatine 1147 1100 (41) Voglibose 870 750 (139) Others 18449 19450 54 Proprietary products 2038 1650 (190) Uralyt 1225 1070 (127) Soleton 598 400 (331) Calvan 214 180 (162) Chemiphar ODM Generics (yenmn) FY2017 FY2018 (Forecast) Amount Amount YOY () Total 31100 31350 08 Generics 30115 30150 01 Generics (ODM) 985 1200 218
Income Statement Overview (yenmn) FY2017 FY2018 (Forecast) of of YOY Amount Sales Amount Sales () Net Sales 35331 1000 35500 1000 05 Pharmaceuticals 34279 970 ― ― ― Others 1051 30 ― ― ― Cost of sales 19535 553 ― ― ― SGampA expenses 13947 395 ― ― ― RampD expenses 2280 65 2700 76 184 Operating income 1848 0 52 1100 31 (405) Income before income taxes and minority interests 1777 80 ― ― ― Net income attributble to owners of the parent 1160 33 500 14 (569)
Capital Expenditure and Other (yenmn) Items FY2016 FY2017 Usage Amount Amount YOY () Forecast Rate () Capital expenditure 2928 1645 (438) 1650 997 Depreciation and amortization 1112 1192 72 1250 954 Revised forecast issued on October 31 2017
Cash Flow Statements (yenmn) FY2016 FY2017 Amount Amount Net cash Provided by operating activities 2737 3188 Used in investing activities (2504) (1606) Used in financing activities 787 (1741) Cash and cash equivalents 8084 7890 Free cash flow 232 1582
Per Share Information (yen) FY2016 FY2017 Amount Amount Change Forecast Earnings per share 53002 31528 (21474) 30673 Book value per share 454880 485986 31106 ― Dividend per share 10000 10000 ― 10000 Dividend payout ratio () 189 317 ― 326 Revised forecast issued on October 31 2017
Balance Sheet Data (yenmn) March 31 2017 August 31 2017 March 31 2015 Amount Amount Change Total assets 47002 46814 3358 (187) Return on assets () 63 36 -06 (27) Net assets 17355 17487 1313 132 Owned capital 17346 17474 1312 127 Capital-to-asset ratio () 369 373 02 +04 Return on equity () 123 67 (01) (56) Current assets 29009 28334 1630 (674) Current liabilities 14939 14914 (716) (25) Current ratio (x) 194 19 019 004
By Main Therapeutic Categories () FY2016 FY2017 Cardiovascular and respiratory drugs 309 320 Digestive organ drugs 196 183 Agents affecting metabolism 164 165 Drugs for nervous system sensory organs 99 91 Antibiotics and chemotherapeutic drugs 65 62 Antineoplastic agents 32 34 Others 135 145
Sales Distribution By Launch Year (yenmn) FY2016 FY2017 Fiscal Year Amount Distrib () Amount Distrib () YOY () 2010 and before 19487 1 667 19194 637 (15) 2009 2011 2348 0 80 2210 73 (59) 2012 1484 0 51 1404 47 (54) 2013 2917 0 100 3127 104 72 2014 1746 0 60 1937 64 110 2015 1001 0 34 1222 41 221 2016 219 0 08 459 15 1091 2017 ― ― ― 558 19 ― Total 29204 1 1000 30115 1000 31
Generics Proprietary Products (yenmn) FY2016 FY2017 Distrib Distrib YOY Achieved Amount () Amount () () Forecast () Total 31513 1 1000 32153 1 1000 20 32000 1005 Generics 29204 1 927 30115 1 937 31 30000 1 1004 To medical institutions 27808 29174 49 29100 1 1003 To other makers 1395 941 (326) 900 1 1046 Amlodipine 2865 2940 26 2900 1 1014 Lansoprazole 2279 2163 (51) 2100 1 1030 Donepezil 1642 1557 (52) 1600 1 973 Rabeprazole 1586 1558 (18) 1600 1 974 Limaprost Alfadex 1469 1427 (28) 1400 1 1020 Pravastatine 1173 1147 (22) 1100 1 1043 Voglibose 957 870 (91) 900 1 967 Others 17229 18449 71 18400 1 1003 Proprietary products 2308 0 73 2038 0 63 (117) 2000 1 1019 Uralyt 1409 1225 (131) 1200 1 1021 Soleton 679 598 (120) 600 1 997 Calvan 219 214 (21) 200 1 1074 Chemiphar ODM Generics (yenmn) FY2016 FY2017 Distrib Distrib YOY Achieved Amount () Amount () () Forecast () Total 30445 1000 31100 1000 22 31400 990 Generics 29204 959 30115 968 31 30000 1004 Generics (ODM) 1240 41 985 32 (206) 1400 704 Includes exports Revised forecast issued on October 31 2017
Income Statement Overview (yenmn) FY2016 FY2017 of of YOY Achieved Amount Sales Amount Sales () Forecast () Net Sales 35689 1 1000 35331 1 1000 (10) 35500 1 995 Pharmaceuticals 34551 1 968 34279 1 970 (08) ― ― ― Others 1137 0 32 1051 0 30 (76) ― ― ― Cost of sales 19449 1 545 19535 1 553 04 ― ― ― SGampA expenses 13403 0 376 13947 0 395 41 ― ― ― RampD expenses 1984 0 56 2280 0 65 150 2200 0 1037 Operating income 2836 0 79 1848 0 52 (348) 1800 0 1027 Income before income taxes and minority interests 2849 0 80 1696 0 48 (405) 1700 ― 998 Net income attributble to owners of the parent 2054 0 58 1160 0 33 (435) 1150 ― 1009 1961 00550933658 00550933658 00575628587 Revised forecast issued on October 31 2017
Page 7
Balance Sheet per Share Information
6
Per Share Information (yen)FY2016Amount Amount Change Forecast
Earnings per share 53002 31528 (21474) 30673Book value per share 454880 485986 31106 ―Dividend per share 10000 10000 ― 10000Dividend payout ratio () 189 317 ― 326 Revised forecast issued on October 31 2017
FY2017
Balance Sheet Data (yenmn)March 31 2017
Amount Amount ChangeTotal assets 47002 46814 (187) Return on assets () 63 36 (27)Net assets 17355 17487 132 Owned capital 17346 17474 127 Capital-to-asset ratio () 369 373 04 Return on equity () 123 67 (56)Current assets 29009 28334 (674)Current liabilities 14939 14914 (25) Current ratio (x) 194 19 (004)
March 31 2018
PL 医薬品① 医薬品② 医薬品③ BS① BS③ 和文にある「前年同期間比」「前期3月末比」は記載が難しく英語版では必要度の低い情報であるとみなして記載をしないこととなった2016年2Q~(木村)ただし期末では記載が可能なので書きます(須田)
CF CAP EX 業績予想① 英語版では経常利益は書かないので注意(須田)
業績予想 ② 業績予想③ PL 医薬品① 医薬品② 医薬品③ BS① BS③ 和文にある「前年同期間比」「前期3月末比」は記載が難しく英語版では必要度の低い情報であるとみなして記載をしないこととなった2016年2Q~(木村)ただし期末では記載が可能なので書きます(須田)
CF CAP EX 業績予想① 英語版では経常利益は書かないので注意(須田)
業績予想 ② 業績予想③ Cash Flow Expenditure
7
Cash Flow Statements (yenmn)FY2016 FY2017Amount Amount
Net cash Provided by operating activities 2737 3188 Used in investing activities (2504) (1606) Provided by (Used in) financing activities 787 (1741)Cash and cash equivalents 8084 7890Free cash flow 232 1582
Capital Expenditure and Other (yenmn)FY2016
UsageAmount Amount YOY () Forecast Rate ()
Capital expenditure 2928 1645 (438) 1650 997Depreciation and amortization 1112 1192 72 1250 954 Revised forecast issued on October 31 2017
Items
FY2017
PL 医薬品① 医薬品② 医薬品③ BS① BS③ 和文にある「前年同期間比」「前期3月末比」は記載が難しく英語版では必要度の低い情報であるとみなして記載をしないこととなった2016年2Q~(木村)ただし期末では記載が可能なので書きます(須田)
CF CAP EX 業績予想① 英語版では経常利益は書かないので注意(須田)
業績予想 ② 業績予想③ PL 医薬品① 医薬品② 医薬品③ BS① BS③ 和文にある「前年同期間比」「前期3月末比」は記載が難しく英語版では必要度の低い情報であるとみなして記載をしないこととなった2016年2Q~(木村)ただし期末では記載が可能なので書きます(須田)
CF CAP EX 業績予想① 英語版では経常利益は書かないので注意(須田)
業績予想 ② 業績予想③ 8
II FY2018 Forecasts
Sales Income
9
(yenmn)
of of YOYAmount Sales Amount Sales ()
Net Sales 35331 1000 35500 1000 05 Pharmaceuticals 34279 970 ― ― ― Others 1051 30 ― ― ―Cost of sales 19535 553 ― ― ―SGampA expenses 13947 395 ― ― ― RampD expenses 2280 65 2700 76 184Operating income 1848 52 1100 31 (405)
1777 50 ― ― ―
1160 33 500 14 (569)Net income attributble to owners of the parent
FY2018 (Forecast)FY2017
Income before income taxes and minority interests
Annual ForecastSales and profit in FY2018 will be impacted by NHI drug price revisions On the other hand however due to our focus on newly launched products and expansion of new sales channels sales of generic drugs are expected to be nearly flat compared to the previous fiscal year As a result consolidated net sales including other businesses such as contracted testing business are projected to be yen35500 million (up 05 YOY)
Regarding profits due to increased development costs as the progress in new drug development and continued strategic expenses such as trial costs leading up to the commencement of commercial production at the Vietnam factory operating income is forecast at yen1100 million (down 405 YOY) and net income attributable to owners of the parent is expected to be yen500 million (down 569 YOY)
PL 医薬品① 医薬品② 医薬品③ BS① BS③ 和文にある「前年同期間比」「前期3月末比」は記載が難しく英語版では必要度の低い情報であるとみなして記載をしないこととなった2016年2Q~(木村)ただし期末では記載が可能なので書きます(須田)
CF CAP EX 業績予想① 英語版では経常利益は書かないので注意(須田)
業績予想 ② 業績予想③ Pharmaceutical Sales
10
Generics Proprietary Products (yenmn)FY2017Amount Amount YOY ()
Total 32153 31800 (11) Generics 30115 30150 01 To medical institutions 29174 29250 03 To other makers 941 900 (44) Amlodipine 2940 2900 (14) Lansoprazole 2163 1900 (122) Donepezil 1557 1350 (133) Rabeprazole 1558 1350 (134) Limaprost Alfadex 1427 1350 (55) Pravastatine 1147 1100 (41) Voglibose 870 750 (139) Others 18449 19450 54 Proprietary products 2038 1650 (190) Uralyt 1225 1070 (127) Soleton 598 400 (331) Calvan 214 180 (162)
Chemiphar ODM Generics (yenmn)FY2017Amount Amount YOY ()
Total 31100 31350 08 Generics 30115 30150 01 Generics (ODM) 985 1200 218
FY2018 (Forecast)
FY2018 (Forecast)
PL 医薬品① 医薬品② 医薬品③ BS① BS③ 和文にある「前年同期間比」「前期3月末比」は記載が難しく英語版では必要度の低い情報であるとみなして記載をしないこととなった2016年2Q~(木村)ただし期末では記載が可能なので書きます(須田)
CF CAP EX 業績予想① 英語版では経常利益は書かないので注意(須田)
業績予想 ② 業績予想③ Per Share Information Expenditure
11
For further information contactPublic Relations Department Nippon Chemiphar Co LtdE-mail irchemipharcojp
Note about Forward-looking Statements and ForecastsStatements made in this Highlights of Business Results with respect to current plans estimates strategies and beliefs and other statements of Nippon Chemiphar that are not historical facts are forward-looking statements about the future performance of Nippon Chemiphar
These statements are based on managementrsquos current assumptions and beliefs in light of the information currently available to it and involve known and unknown risks and uncertainties Consequently undue reliance should not be placed on these statements
Nippon Chemiphar cautions the reader that a number of important factors could cause actual results to differ materially from those discussed in the forward-looking statements
Per Share Information (yen)FY2017Amount Amount YOY ()
Earnings per share 31528 13584 (569)Book value per share 485986 ― ―Dividends per share 10000 7500 ―Dividend payout ratio () 317 552 ―
Capital Expenditure and Other (yenmn)FY2017Amount Amount Change
Capital expenditure 1645 950 (695)Depreciation and amortization 1192 1350 157
FY2018 (Forecast)
FY2018 (Forecast)
Dividend ForecastAs mentioned above we are forecasting a decline in profit in FY2018 due to the influence of NHI drug price revisions ongoing strategic spending including new drug development expenses and start-up expenses at the Vietnam factory Thus we expect to pay a dividend per share of 75 yen (down 25 yen per share YOY) with a payout ratio of 552
PL 医薬品① 医薬品② 医薬品③ BS① BS③ 和文にある「前年同期間比」「前期3月末比」は記載が難しく英語版では必要度の低い情報であるとみなして記載をしないこととなった2016年2Q~(木村)ただし期末では記載が可能なので書きます(須田)
CF CAP EX 業績予想① 英語版では経常利益は書かないので注意(須田)
業績予想 ② 業績予想③ スライド番号 1 Contents スライド番号 3 Sales Income Pharmaceutical Sales Sales Distribution Balance Sheet per Share Information Cash Flow Expenditure スライド番号 9 Sales Income Pharmaceutical Sales Per Share Information Expenditure Per Share Information (yen) FY2017 FY2018 (Forecast) Amount Amount YOY () Earnings per share 31528 13584 (569) Book value per share 485986 ― ― Dividends per share 10000 7500 ― Dividend payout ratio () 317 552 ― Capital Expenditure and Other (yenmn) FY2017 FY2018 (Forecast) Amount Amount Change Capital expenditure 1645 950 (695) Depreciation and amortization 1192 1350 157 2015年3月期 ガツキ 2016年3月期(予想) ガツキ ヨソウ 金額 キンガク 金額 キンガク 増減額 ゾウゲンガク 増減率 ゾウゲン リツ 医療用医薬品 イリョウヨウ イヤクヒン 27400 30950 +05 ジェネリック医薬品(荷離) イヤクヒン ニ バナレ 25079 27430 +01 内自社販売 ウチ ジシャ ハンバイ 2321 25100 +01 内導出輸出 ウチ ドウシュツ ユシュツ 3011 2330 +04 アムロジピン 1935 3040 +09 ランソプラゾール 1509 1890 24 プラバスタチン 1595 1570 +40 ラベプラゾール 1704 1570 16 リマプロストアルファデクス 1273 1660 26 ボグリボース 1013 1300 +21 ドネペジル 15357 1030 +16 その他 タ 3400 15370 +01 主力品 シュリョク ヒン 1975 3520 +35 ウラリット 1134 1970 03 ソレトン 290 1250 +102 カルバン 0 300 +34 ジェネリック医薬品事業 イヤクヒン ジギョウ 2015年3月期 ガツキ 2016年3月期(予想) ガツキ ヨソウ 金額 キンガク 金額 キンガク 増減額 ゾウゲンガク 増減率 ゾウゲン リツ ジェネリック医薬品事業 イヤクヒン ジギョウ 28918 28840 +1003 ジェネリック医薬品(荷離) イヤクヒン ニ バナレ 27400 27430 +999 受託 ジュタク 1518 1410 +1077
Generics Proprietary Products (yenmn) FY2017 FY2018 (Forecast) Amount Amount YOY () Total 32153 31800 (11) Generics 30115 30150 01 To medical institutions 29174 29250 03 To other makers 941 900 (44) Amlodipine 2940 2900 (14) Lansoprazole 2163 1900 (122) Donepezil 1557 1350 (133) Rabeprazole 1558 1350 (134) Limaprost Alfadex 1427 1350 (55) Pravastatine 1147 1100 (41) Voglibose 870 750 (139) Others 18449 19450 54 Proprietary products 2038 1650 (190) Uralyt 1225 1070 (127) Soleton 598 400 (331) Calvan 214 180 (162) Chemiphar ODM Generics (yenmn) FY2017 FY2018 (Forecast) Amount Amount YOY () Total 31100 31350 08 Generics 30115 30150 01 Generics (ODM) 985 1200 218
Income Statement Overview (yenmn) FY2017 FY2018 (Forecast) of of YOY Amount Sales Amount Sales () Net Sales 35331 1000 35500 1000 05 Pharmaceuticals 34279 970 ― ― ― Others 1051 30 ― ― ― Cost of sales 19535 553 ― ― ― SGampA expenses 13947 395 ― ― ― RampD expenses 2280 65 2700 76 184 Operating income 1848 0 52 1100 31 (405) Income before income taxes and minority interests 1777 80 ― ― ― Net income attributble to owners of the parent 1160 33 500 14 (569)
Capital Expenditure and Other (yenmn) Items FY2016 FY2017 Usage Amount Amount YOY () Forecast Rate () Capital expenditure 2928 1645 (438) 1650 997 Depreciation and amortization 1112 1192 72 1250 954 Revised forecast issued on October 31 2017
Cash Flow Statements (yenmn) FY2016 FY2017 Amount Amount Net cash Provided by operating activities 2737 3188 Used in investing activities (2504) (1606) Used in financing activities 787 (1741) Cash and cash equivalents 8084 7890 Free cash flow 232 1582
Per Share Information (yen) FY2016 FY2017 Amount Amount Change Forecast Earnings per share 53002 31528 (21474) 30673 Book value per share 454880 485986 31106 ― Dividend per share 10000 10000 ― 10000 Dividend payout ratio () 189 317 ― 326 Revised forecast issued on October 31 2017
Balance Sheet Data (yenmn) March 31 2017 August 31 2017 March 31 2015 Amount Amount Change Total assets 47002 46814 3358 (187) Return on assets () 63 36 -06 (27) Net assets 17355 17487 1313 132 Owned capital 17346 17474 1312 127 Capital-to-asset ratio () 369 373 02 +04 Return on equity () 123 67 (01) (56) Current assets 29009 28334 1630 (674) Current liabilities 14939 14914 (716) (25) Current ratio (x) 194 19 019 004
By Main Therapeutic Categories () FY2016 FY2017 Cardiovascular and respiratory drugs 309 320 Digestive organ drugs 196 183 Agents affecting metabolism 164 165 Drugs for nervous system sensory organs 99 91 Antibiotics and chemotherapeutic drugs 65 62 Antineoplastic agents 32 34 Others 135 145
Sales Distribution By Launch Year (yenmn) FY2016 FY2017 Fiscal Year Amount Distrib () Amount Distrib () YOY () 2010 and before 19487 1 667 19194 637 (15) 2009 2011 2348 0 80 2210 73 (59) 2012 1484 0 51 1404 47 (54) 2013 2917 0 100 3127 104 72 2014 1746 0 60 1937 64 110 2015 1001 0 34 1222 41 221 2016 219 0 08 459 15 1091 2017 ― ― ― 558 19 ― Total 29204 1 1000 30115 1000 31
Generics Proprietary Products (yenmn) FY2016 FY2017 Distrib Distrib YOY Achieved Amount () Amount () () Forecast () Total 31513 1 1000 32153 1 1000 20 32000 1005 Generics 29204 1 927 30115 1 937 31 30000 1 1004 To medical institutions 27808 29174 49 29100 1 1003 To other makers 1395 941 (326) 900 1 1046 Amlodipine 2865 2940 26 2900 1 1014 Lansoprazole 2279 2163 (51) 2100 1 1030 Donepezil 1642 1557 (52) 1600 1 973 Rabeprazole 1586 1558 (18) 1600 1 974 Limaprost Alfadex 1469 1427 (28) 1400 1 1020 Pravastatine 1173 1147 (22) 1100 1 1043 Voglibose 957 870 (91) 900 1 967 Others 17229 18449 71 18400 1 1003 Proprietary products 2308 0 73 2038 0 63 (117) 2000 1 1019 Uralyt 1409 1225 (131) 1200 1 1021 Soleton 679 598 (120) 600 1 997 Calvan 219 214 (21) 200 1 1074 Chemiphar ODM Generics (yenmn) FY2016 FY2017 Distrib Distrib YOY Achieved Amount () Amount () () Forecast () Total 30445 1000 31100 1000 22 31400 990 Generics 29204 959 30115 968 31 30000 1004 Generics (ODM) 1240 41 985 32 (206) 1400 704 Includes exports Revised forecast issued on October 31 2017
Income Statement Overview (yenmn) FY2016 FY2017 of of YOY Achieved Amount Sales Amount Sales () Forecast () Net Sales 35689 1 1000 35331 1 1000 (10) 35500 1 995 Pharmaceuticals 34551 1 968 34279 1 970 (08) ― ― ― Others 1137 0 32 1051 0 30 (76) ― ― ― Cost of sales 19449 1 545 19535 1 553 04 ― ― ― SGampA expenses 13403 0 376 13947 0 395 41 ― ― ― RampD expenses 1984 0 56 2280 0 65 150 2200 0 1037 Operating income 2836 0 79 1848 0 52 (348) 1800 0 1027 Income before income taxes and minority interests 2849 0 80 1696 0 48 (405) 1700 ― 998 Net income attributble to owners of the parent 2054 0 58 1160 0 33 (435) 1150 ― 1009 1961 00550933658 00550933658 00575628587 Revised forecast issued on October 31 2017
Per Share Information (yen) FY2017 FY2018 (Forecast) Amount Amount YOY () Earnings per share 31528 13584 (569) Book value per share 485986 ― ― Dividends per share 10000 7500 ― Dividend payout ratio() 317 552 ― Capital Expenditure and Other (yenmn) FY2017 FY2018 (Forecast) Amount Amount Change Capital expenditure 1645 950 (695) Depreciation and amortization 1192 1350 157 2015年3月期 ガツキ 2016年3月期(予想) ガツキ ヨソウ 金額 キンガク 金額 キンガク 増減額 ゾウゲンガク 増減率 ゾウゲン リツ 医療用医薬品 イリョウヨウ イヤクヒン 27400 30950 +05 ジェネリック医薬品(荷離) イヤクヒン ニ バナレ 25079 27430 +01 内自社販売 ウチ ジシャ ハンバイ 2321 25100 +01 内導出輸出 ウチ ドウシュツ ユシュツ 3011 2330 +04 アムロジピン 1935 3040 +09 ランソプラゾール 1509 1890 24 プラバスタチン 1595 1570 +40 ラベプラゾール 1704 1570 16 リマプロストアルファデクス 1273 1660 26 ボグリボース 1013 1300 +21 ドネペジル 15357 1030 +16 その他 タ 3400 15370 +01 主力品 シュリョク ヒン 1975 3520 +35 ウラリット 1134 1970 03 ソレトン 290 1250 +102 カルバン 0 300 +34 ジェネリック医薬品事業 イヤクヒン ジギョウ 2015年3月期 ガツキ 2016年3月期(予想) ガツキ ヨソウ 金額 キンガク 金額 キンガク 増減額 ゾウゲンガク 増減率 ゾウゲン リツ ジェネリック医薬品事業 イヤクヒン ジギョウ 28918 28840 +1003 ジェネリック医薬品(荷離) イヤクヒン ニ バナレ 27400 27430 +999 受託 ジュタク 1518 1410 +1077
Generics Proprietary Products (yenmn) FY2017 FY2018 (Forecast) Amount Amount YOY () Total 32153 31800 (11) Generics 30115 30150 01 To medical institutions 29174 29250 03 To other makers 941 900 (44) Amlodipine 2940 2900 (14) Lansoprazole 2163 1900 (122) Donepezil 1557 1350 (133) Rabeprazole 1558 1350 (134) Limaprost Alfadex 1427 1350 (55) Pravastatine 1147 1100 (41) Voglibose 870 750 (139) Others 18449 19450 54 Proprietary products 2038 1650 (190) Uralyt 1225 1070 (127) Soleton 598 400 (331) Calvan 214 180 (162) Chemiphar ODM Generics (yenmn) FY2017 FY2018 (Forecast) Amount Amount YOY () Total 31100 31350 08 Generics 30115 30150 01 Generics (ODM) 985 1200 218
Income Statement Overview (yenmn) FY2017 FY2018 (Forecast) of of YOY Amount Sales Amount Sales () Net Sales 35331 1000 35500 1000 05 Pharmaceuticals 34279 970 ― ― ― Others 1051 30 ― ― ― Cost of sales 19535 553 ― ― ― SGampA expenses 13947 395 ― ― ― RampD expenses 2280 65 2700 76 184 Operating income 1848 0 52 1100 31 (405) Income before income taxes and minority interests 1777 80 ― ― ― Net income attributble to owners of the parent 1160 33 500 14 (569)
Capital Expenditure and Other (yenmn) Items FY2016 FY2017 Usage Amount Amount YOY () Forecast Rate () Capital expenditure 2928 1645 (438) 1650 997 Depreciation and amortization 1112 1192 72 1250 954 Revised forecast issued on October 31 2017
Cash Flow Statements (yenmn) FY2016 FY2017 Amount Amount Net cash Provided by operating activities 2737 3188 Used in investing activities (2504) (1606) Used in financing activities 787 (1741) Cash and cash equivalents 8084 7890 Free cash flow 232 1582
Per Share Information (yen) FY2016 FY2017 Amount Amount Change Forecast Earnings per share 53002 31528 (21474) 30673 Book value per share 454880 485986 31106 ― Dividend per share 10000 10000 ― 10000 Dividend payout ratio () 189 317 ― 326 Revised forecast issued on October 31 2017
Balance Sheet Data (yenmn) March 31 2017 August 31 2017 March 31 2015 Amount Amount Change Total assets 47002 46814 3358 (187) Return on assets () 63 36 -06 (27) Net assets 17355 17487 1313 132 Owned capital 17346 17474 1312 127 Capital-to-asset ratio () 369 373 02 +04 Return on equity () 123 67 (01) (56) Current assets 29009 28334 1630 (674) Current liabilities 14939 14914 (716) (25) Current ratio (x) 194 19 019 004
By Main Therapeutic Categories () FY2016 FY2017 Cardiovascular and respiratory drugs 309 320 Digestive organ drugs 196 183 Agents affecting metabolism 164 165 Drugs for nervous system sensory organs 99 91 Antibiotics and chemotherapeutic drugs 65 62 Antineoplastic agents 32 34 Others 135 145
Sales Distribution By Launch Year (yenmn) FY2016 FY2017 Fiscal Year Amount Distrib () Amount Distrib () YOY () 2010 and before 19487 1 667 19194 637 (15) 2009 2011 2348 0 80 2210 73 (59) 2012 1484 0 51 1404 47 (54) 2013 2917 0 100 3127 104 72 2014 1746 0 60 1937 64 110 2015 1001 0 34 1222 41 221 2016 219 0 08 459 15 1091 2017 ― ― ― 558 19 ― Total 29204 1 1000 30115 1000 31
Generics Proprietary Products (yenmn) FY2016 FY2017 Distrib Distrib YOY Achieved Amount () Amount () () Forecast () Total 31513 1 1000 32153 1 1000 20 32000 1005 Generics 29204 1 927 30115 1 937 31 30000 1 1004 To medical institutions 27808 29174 49 29100 1 1003 To other makers 1395 941 (326) 900 1 1046 Amlodipine 2865 2940 26 2900 1 1014 Lansoprazole 2279 2163 (51) 2100 1 1030 Donepezil 1642 1557 (52) 1600 1 973 Rabeprazole 1586 1558 (18) 1600 1 974 Limaprost Alfadex 1469 1427 (28) 1400 1 1020 Pravastatine 1173 1147 (22) 1100 1 1043 Voglibose 957 870 (91) 900 1 967 Others 17229 18449 71 18400 1 1003 Proprietary products 2308 0 73 2038 0 63 (117) 2000 1 1019 Uralyt 1409 1225 (131) 1200 1 1021 Soleton 679 598 (120) 600 1 997 Calvan 219 214 (21) 200 1 1074 Chemiphar ODM Generics (yenmn) FY2016 FY2017 Distrib Distrib YOY Achieved Amount () Amount () () Forecast () Total 30445 1000 31100 1000 22 31400 990 Generics 29204 959 30115 968 31 30000 1004 Generics (ODM) 1240 41 985 32 (206) 1400 704 Includes exports Revised forecast issued on October 31 2017
Income Statement Overview (yenmn) FY2016 FY2017 of of YOY Achieved Amount Sales Amount Sales () Forecast () Net Sales 35689 1 1000 35331 1 1000 (10) 35500 1 995 Pharmaceuticals 34551 1 968 34279 1 970 (08) ― ― ― Others 1137 0 32 1051 0 30 (76) ― ― ― Cost of sales 19449 1 545 19535 1 553 04 ― ― ― SGampA expenses 13403 0 376 13947 0 395 41 ― ― ― RampD expenses 1984 0 56 2280 0 65 150 2200 0 1037 Operating income 2836 0 79 1848 0 52 (348) 1800 0 1027 Income before income taxes and minority interests 2849 0 80 1696 0 48 (405) 1700 ― 998 Net income attributble to owners of the parent 2054 0 58 1160 0 33 (435) 1150 ― 1009 1961 00550933658 00550933658 00575628587 Revised forecast issued on October 31 2017
Per Share Information (yen) FY2017 FY2018 (Forecast) Amount Amount YOY () Earnings per share 31528 13584 (569) Book value per share 485986 ― ― Dividends per share 10000 7500 ― Dividend payout ratio() 317 552 ― Capital Expenditure and Other (yenmn) FY2017 FY2018 (Forecast) Amount Amount Change Capital expenditure 1645 950 (695) Depreciation and amortization 1192 1350 157 2015年3月期 ガツキ 2016年3月期(予想) ガツキ ヨソウ 金額 キンガク 金額 キンガク 増減額 ゾウゲンガク 増減率 ゾウゲン リツ 医療用医薬品 イリョウヨウ イヤクヒン 27400 30950 +05 ジェネリック医薬品(荷離) イヤクヒン ニ バナレ 25079 27430 +01 内自社販売 ウチ ジシャ ハンバイ 2321 25100 +01 内導出輸出 ウチ ドウシュツ ユシュツ 3011 2330 +04 アムロジピン 1935 3040 +09 ランソプラゾール 1509 1890 24 プラバスタチン 1595 1570 +40 ラベプラゾール 1704 1570 16 リマプロストアルファデクス 1273 1660 26 ボグリボース 1013 1300 +21 ドネペジル 15357 1030 +16 その他 タ 3400 15370 +01 主力品 シュリョク ヒン 1975 3520 +35 ウラリット 1134 1970 03 ソレトン 290 1250 +102 カルバン 0 300 +34 ジェネリック医薬品事業 イヤクヒン ジギョウ 2015年3月期 ガツキ 2016年3月期(予想) ガツキ ヨソウ 金額 キンガク 金額 キンガク 増減額 ゾウゲンガク 増減率 ゾウゲン リツ ジェネリック医薬品事業 イヤクヒン ジギョウ 28918 28840 +1003 ジェネリック医薬品(荷離) イヤクヒン ニ バナレ 27400 27430 +999 受託 ジュタク 1518 1410 +1077
Generics Proprietary Products (yenmn) FY2017 FY2018 (Forecast) Amount Amount YOY () Total 32153 31800 (11) Generics 30115 30150 01 To medical institutions 29174 29250 03 To other makers 941 900 (44) Amlodipine 2940 2900 (14) Lansoprazole 2163 1900 (122) Donepezil 1557 1350 (133) Rabeprazole 1558 1350 (134) Limaprost Alfadex 1427 1350 (55) Pravastatine 1147 1100 (41) Voglibose 870 750 (139) Others 18449 19450 54 Proprietary products 2038 1650 (190) Uralyt 1225 1070 (127) Soleton 598 400 (331) Calvan 214 180 (162) Chemiphar ODM Generics (yenmn) FY2017 FY2018 (Forecast) Amount Amount YOY () Total 31100 31350 08 Generics 30115 30150 01 Generics (ODM) 985 1200 218
Income Statement Overview (yenmn) FY2017 FY2018 (Forecast) of of YOY Amount Sales Amount Sales () Net Sales 35331 1000 35500 1000 05 Pharmaceuticals 34279 970 ― ― ― Others 1051 30 ― ― ― Cost of sales 19535 553 ― ― ― SGampA expenses 13947 395 ― ― ― RampD expenses 2280 65 2700 76 184 Operating income 1848 0 52 1100 31 (405) Income before income taxes and minority interests 1777 50 ― ― ― Net income attributble to owners of the parent 1160 33 500 14 (569)
Capital Expenditure and Other (yenmn) Items FY2016 FY2017 Usage Amount Amount YOY () Forecast Rate () Capital expenditure 2928 1645 (438) 1650 997 Depreciation and amortization 1112 1192 72 1250 954 Revised forecast issued on October 31 2017
Cash Flow Statements (yenmn) FY2016 FY2017 Amount Amount Net cash Provided by operating activities 2737 3188 Used in investing activities (2504) (1606) Used in financing activities 787 (1741) Cash and cash equivalents 8084 7890 Free cash flow 232 1582
Per Share Information (yen) FY2016 FY2017 Amount Amount Change Forecast Earnings per share 53002 31528 (21474) 30673 Book value per share 454880 485986 31106 ― Dividend per share 10000 10000 ― 10000 Dividend payout ratio () 189 317 ― 326 Revised forecast issued on October 31 2017
Balance Sheet Data (yenmn) March 31 2017 March 31 2018 March 31 2015 Amount Amount Change Total assets 47002 46814 3358 (187) Return on assets () 63 36 -06 (27) Net assets 17355 17487 1313 132 Owned capital 17346 17474 1312 127 Capital-to-asset ratio () 369 373 02 04 Return on equity () 123 67 (01) (56) Current assets 29009 28334 1630 (674) Current liabilities 14939 14914 (716) (25) Current ratio (x) 194 19 019 (004)
By Main Therapeutic Categories () FY2016 FY2017 Cardiovascular and respiratory drugs 309 320 Digestive organ drugs 196 183 Agents affecting metabolism 164 165 Drugs for nervous system sensory organs 99 91 Antibiotics and chemotherapeutic drugs 65 62 Antineoplastic agents 32 34 Others 135 145
Sales Distribution By Launch Year (yenmn) FY2016 FY2017 Fiscal Year Amount Distrib () Amount Distrib () YOY () 2010 and before 19487 1 667 19194 637 (15) 2009 2011 2348 0 80 2210 73 (59) 2012 1484 0 51 1404 47 (54) 2013 2917 0 100 3127 104 72 2014 1746 0 60 1937 64 110 2015 1001 0 34 1222 41 221 2016 219 0 08 459 15 1091 2017 ― ― 558 19 ― Total 29204 1 1000 30115 1000 31
Generics Proprietary Products (yenmn) FY2016 FY2017 Distrib Distrib YOY Achieved Amount () Amount () () Forecast () Total 31513 1 1000 32153 1 1000 20 32000 1005 Generics 29204 1 927 30115 1 937 31 30000 1 1004 To medical institutions 27808 29174 49 29100 1 1003 To other makers 1395 941 (326) 900 1 1046 Amlodipine 2865 2940 26 2900 1 1014 Lansoprazole 2279 2163 (51) 2100 1 1030 Donepezil 1642 1557 (52) 1600 1 973 Rabeprazole 1586 1558 (18) 1600 1 974 Limaprost Alfadex 1469 1427 (28) 1400 1 1020 Pravastatine 1173 1147 (22) 1100 1 1043 Voglibose 957 870 (91) 900 1 967 Others 17229 18449 71 18400 1 1003 Proprietary products 2308 0 73 2038 0 63 (117) 2000 1 1019 Uralyt 1409 1225 (131) 1200 1 1021 Soleton 679 598 (120) 600 1 997 Calvan 219 214 (21) 200 1 1074 Chemiphar ODM Generics (yenmn) FY2016 FY2017 Distrib Distrib YOY Achieved Amount () Amount () () Forecast () Total 30445 1000 31100 1000 22 31400 990 Generics 29204 959 30115 968 31 30000 1004 Generics (ODM) 1240 41 985 32 (206) 1400 704 Includes exports Revised forecast issued on October 31 2017
Income Statement Overview (yenmn) FY2016 FY2017 of of YOY Achieved Amount Sales Amount Sales () Forecast () Net Sales 35689 1 1000 35331 1 1000 (10) 35500 1 995 Pharmaceuticals 34551 1 968 34279 1 970 (08) ― ― Others 1137 0 32 1051 0 30 (76) ― ― Cost of sales 19449 1 545 19535 1 553 04 ― ― SGampA expenses 13403 0 376 13947 0 395 41 ― ― RampD expenses 1984 0 56 2280 0 65 150 2200 0 1037 Operating income 2836 0 79 1848 0 52 (348) 1800 0 1027 Income before income taxes and minority interests 2849 0 80 1777 0 50 (376) ― ― Net income attributble to owners of the parent 2054 0 58 1160 0 33 (435) 1150 ― 1009 1961 00550933658 00550933658 00575628587 Revised forecast issued on October 31 2017
Per Share Information (yen) FY2017 FY2018 (Forecast) Amount Amount YOY () Earnings per share 31528 13584 (569) Book value per share 485986 ― ― Dividends per share 10000 7500 ― Dividend payout ratio() 317 552 ― Capital Expenditure and Other (yenmn) FY2017 FY2018 (Forecast) Amount Amount Change Capital expenditure 1645 950 (695) Depreciation and amortization 1192 1350 157 2015年3月期 ガツキ 2016年3月期(予想) ガツキ ヨソウ 金額 キンガク 金額 キンガク 増減額 ゾウゲンガク 増減率 ゾウゲン リツ 医療用医薬品 イリョウヨウ イヤクヒン 27400 30950 +05 ジェネリック医薬品(荷離) イヤクヒン ニ バナレ 25079 27430 +01 内自社販売 ウチ ジシャ ハンバイ 2321 25100 +01 内導出輸出 ウチ ドウシュツ ユシュツ 3011 2330 +04 アムロジピン 1935 3040 +09 ランソプラゾール 1509 1890 24 プラバスタチン 1595 1570 +40 ラベプラゾール 1704 1570 16 リマプロストアルファデクス 1273 1660 26 ボグリボース 1013 1300 +21 ドネペジル 15357 1030 +16 その他 タ 3400 15370 +01 主力品 シュリョク ヒン 1975 3520 +35 ウラリット 1134 1970 03 ソレトン 290 1250 +102 カルバン 0 300 +34 ジェネリック医薬品事業 イヤクヒン ジギョウ 2015年3月期 ガツキ 2016年3月期(予想) ガツキ ヨソウ 金額 キンガク 金額 キンガク 増減額 ゾウゲンガク 増減率 ゾウゲン リツ ジェネリック医薬品事業 イヤクヒン ジギョウ 28918 28840 +1003 ジェネリック医薬品(荷離) イヤクヒン ニ バナレ 27400 27430 +999 受託 ジュタク 1518 1410 +1077
Generics Proprietary Products (yenmn) FY2017 FY2018 (Forecast) Amount Amount YOY () Total 32153 31800 (11) Generics 30115 30150 01 To medical institutions 29174 29250 03 To other makers 941 900 (44) Amlodipine 2940 2900 (14) Lansoprazole 2163 1900 (122) Donepezil 1557 1350 (133) Rabeprazole 1558 1350 (134) Limaprost Alfadex 1427 1350 (55) Pravastatine 1147 1100 (41) Voglibose 870 750 (139) Others 18449 19450 54 Proprietary products 2038 1650 (190) Uralyt 1225 1070 (127) Soleton 598 400 (331) Calvan 214 180 (162) Chemiphar ODM Generics (yenmn) FY2017 FY2018 (Forecast) Amount Amount YOY () Total 31100 31350 08 Generics 30115 30150 01 Generics (ODM) 985 1200 218
Income Statement Overview (yenmn) FY2017 FY2018 (Forecast) of of YOY Amount Sales Amount Sales () Net Sales 35331 1000 35500 1000 05 Pharmaceuticals 34279 970 ― ― ― Others 1051 30 ― ― ― Cost of sales 19535 553 ― ― ― SGampA expenses 13947 395 ― ― ― RampD expenses 2280 65 2700 76 184 Operating income 1848 0 52 1100 31 (405) Income before income taxes and minority interests 1777 80 ― ― ― Net income attributble to owners of the parent 1160 33 500 14 (569)
Capital Expenditure and Other (yenmn) Items FY2016 FY2017 Usage Amount Amount YOY () Forecast Rate () Capital expenditure 2928 1645 (438) 1650 997 Depreciation and amortization 1112 1192 72 1250 954 Revised forecast issued on October 31 2017
Cash Flow Statements (yenmn) FY2016 FY2017 Amount Amount Net cash Provided by operating activities 2737 3188 Used in investing activities (2504) (1606) Used in financing activities 787 (1741) Cash and cash equivalents 8084 7890 Free cash flow 232 1582
Per Share Information (yen) FY2016 FY2017 Amount Amount Change Forecast Earnings per share 53002 31528 (21474) 30673 Book value per share 454880 485986 31106 ― Dividend per share 10000 10000 ― 10000 Dividend payout ratio () 189 317 ― 326 Revised forecast issued on October 31 2017
Balance Sheet Data (yenmn) March 31 2017 August 31 2017 March 31 2015 Amount Amount Change Total assets 47002 46814 3358 (187) Return on assets () 63 36 -06 (27) Net assets 17355 17487 1313 132 Owned capital 17346 17474 1312 127 Capital-to-asset ratio () 369 373 02 +04 Return on equity () 123 67 (01) (56) Current assets 29009 28334 1630 (674) Current liabilities 14939 14914 (716) (25) Current ratio (x) 194 19 019 004
By Main Therapeutic Categories () FY2016 FY2017 Cardiovascular and respiratory drugs 309 320 Digestive organ drugs 196 183 Agents affecting metabolism 164 165 Drugs for nervous system sensory organs 99 91 Antibiotics and chemotherapeutic drugs 65 62 Antineoplastic agents 32 34 Others 135 145
Sales Distribution By Launch Year (yenmn) FY2016 FY2017 Fiscal Year Amount Distrib () Amount Distrib () YOY () 2010 and before 19487 1 667 19194 637 (15) 2009 2011 2348 0 80 2210 73 (59) 2012 1484 0 51 1404 47 (54) 2013 2917 0 100 3127 104 72 2014 1746 0 60 1937 64 110 2015 1001 0 34 1222 41 221 2016 219 0 08 459 15 1091 2017 ― ― ― 558 19 ― Total 29204 1 1000 30115 1000 31
Generics Proprietary Products (yenmn) FY2016 FY2017 Distrib Distrib YOY Achieved Amount () Amount () () Forecast () Total 31513 1 1000 32153 1 1000 20 32000 1005 Generics 29204 1 927 30115 1 937 31 30000 1 1004 To medical institutions 27808 29174 49 29100 1 1003 To other makers 1395 941 (326) 900 1 1046 Amlodipine 2865 2940 26 2900 1 1014 Lansoprazole 2279 2163 (51) 2100 1 1030 Donepezil 1642 1557 (52) 1600 1 973 Rabeprazole 1586 1558 (18) 1600 1 974 Limaprost Alfadex 1469 1427 (28) 1400 1 1020 Pravastatine 1173 1147 (22) 1100 1 1043 Voglibose 957 870 (91) 900 1 967 Others 17229 18449 71 18400 1 1003 Proprietary products 2308 0 73 2038 0 63 (117) 2000 1 1019 Uralyt 1409 1225 (131) 1200 1 1021 Soleton 679 598 (120) 600 1 997 Calvan 219 214 (21) 200 1 1074 Chemiphar ODM Generics (yenmn) FY2016 FY2017 Distrib Distrib YOY Achieved Amount () Amount () () Forecast () Total 30445 1000 31100 1000 22 31400 990 Generics 29204 959 30115 968 31 30000 1004 Generics (ODM) 1240 41 985 32 (206) 1400 704 Includes exports Revised forecast issued on October 31 2017
Income Statement Overview (yenmn) FY2016 FY2017 of of YOY Achieved Amount Sales Amount Sales () Forecast () Net Sales 35689 1 1000 35331 1 1000 (10) 35500 1 995 Pharmaceuticals 34551 1 968 34279 1 970 (08) ― ― ― Others 1137 0 32 1051 0 30 (76) ― ― ― Cost of sales 19449 1 545 19535 1 553 04 ― ― ― SGampA expenses 13403 0 376 13947 0 395 41 ― ― ― RampD expenses 1984 0 56 2280 0 65 150 2200 0 1037 Operating income 2836 0 79 1848 0 52 (348) 1800 0 1027 Income before income taxes and minority interests 2849 0 80 1696 0 48 (405) 1700 ― 998 Net income attributble to owners of the parent 2054 0 58 1160 0 33 (435) 1150 ― 1009 1961 00550933658 00550933658 00575628587 Revised forecast issued on October 31 2017
Per Share Information (yen) FY2017 FY2018 (Forecast) Amount Amount YOY () Earnings per share 31528 13584 (569) Book value per share 485986 ― ― Dividends per share 10000 7500 ― Dividend payout ratio() 317 552 ― Capital Expenditure and Other (yenmn) FY2017 FY2018 (Forecast) Amount Amount Change Capital expenditure 1645 950 (695) Depreciation and amortization 1192 1350 157 2015年3月期 ガツキ 2016年3月期(予想) ガツキ ヨソウ 金額 キンガク 金額 キンガク 増減額 ゾウゲンガク 増減率 ゾウゲン リツ 医療用医薬品 イリョウヨウ イヤクヒン 27400 30950 +05 ジェネリック医薬品(荷離) イヤクヒン ニ バナレ 25079 27430 +01 内自社販売 ウチ ジシャ ハンバイ 2321 25100 +01 内導出輸出 ウチ ドウシュツ ユシュツ 3011 2330 +04 アムロジピン 1935 3040 +09 ランソプラゾール 1509 1890 24 プラバスタチン 1595 1570 +40 ラベプラゾール 1704 1570 16 リマプロストアルファデクス 1273 1660 26 ボグリボース 1013 1300 +21 ドネペジル 15357 1030 +16 その他 タ 3400 15370 +01 主力品 シュリョク ヒン 1975 3520 +35 ウラリット 1134 1970 03 ソレトン 290 1250 +102 カルバン 0 300 +34 ジェネリック医薬品事業 イヤクヒン ジギョウ 2015年3月期 ガツキ 2016年3月期(予想) ガツキ ヨソウ 金額 キンガク 金額 キンガク 増減額 ゾウゲンガク 増減率 ゾウゲン リツ ジェネリック医薬品事業 イヤクヒン ジギョウ 28918 28840 +1003 ジェネリック医薬品(荷離) イヤクヒン ニ バナレ 27400 27430 +999 受託 ジュタク 1518 1410 +1077
Generics Proprietary Products (yenmn) FY2017 FY2018 (Forecast) Amount Amount YOY () Total 32153 31800 (11) Generics 30115 30150 01 To medical institutions 29174 29250 03 To other makers 941 900 (44) Amlodipine 2940 2900 (14) Lansoprazole 2163 1900 (122) Donepezil 1557 1350 (133) Rabeprazole 1558 1350 (134) Limaprost Alfadex 1427 1350 (55) Pravastatine 1147 1100 (41) Voglibose 870 750 (139) Others 18449 19450 54 Proprietary products 2038 1650 (190) Uralyt 1225 1070 (127) Soleton 598 400 (331) Calvan 214 180 (162) Chemiphar ODM Generics (yenmn) FY2017 FY2018 (Forecast) Amount Amount YOY () Total 31100 31350 08 Generics 30115 30150 01 Generics (ODM) 985 1200 218
Income Statement Overview (yenmn) FY2017 FY2018 (Forecast) of of YOY Amount Sales Amount Sales () Net Sales 35331 1000 35500 1000 05 Pharmaceuticals 34279 970 ― ― ― Others 1051 30 ― ― ― Cost of sales 19535 553 ― ― ― SGampA expenses 13947 395 ― ― ― RampD expenses 2280 65 2700 76 184 Operating income 1848 0 52 1100 31 (405) Income before income taxes and minority interests 1777 80 ― ― ― Net income attributble to owners of the parent 1160 33 500 14 (569)
Capital Expenditure and Other (yenmn) Items FY2016 FY2017 Usage Amount Amount YOY () Forecast Rate () Capital expenditure 2928 1645 (438) 1650 997 Depreciation and amortization 1112 1192 72 1250 954 Revised forecast issued on October 31 2017
Cash Flow Statements (yenmn) FY2016 FY2017 Amount Amount Net cash Provided by operating activities 2737 3188 Used in investing activities (2504) (1606) Provided by (Used in) financing activities 787 (1741) Cash and cash equivalents 8084 7890 Free cash flow 232 1582
Per Share Information (yen) FY2016 FY2017 Amount Amount Change Forecast Earnings per share 53002 31528 (21474) 30673 Book value per share 454880 485986 31106 ― Dividend per share 10000 10000 ― 10000 Dividend payout ratio () 189 317 ― 326 Revised forecast issued on October 31 2017
Balance Sheet Data (yenmn) March 31 2017 August 31 2017 March 31 2015 Amount Amount Change Total assets 47002 46814 3358 (187) Return on assets () 63 36 -06 (27) Net assets 17355 17487 1313 132 Owned capital 17346 17474 1312 127 Capital-to-asset ratio () 369 373 02 +04 Return on equity () 123 67 (01) (56) Current assets 29009 28334 1630 (674) Current liabilities 14939 14914 (716) (25) Current ratio (x) 194 19 019 004
By Main Therapeutic Categories () FY2016 FY2017 Cardiovascular and respiratory drugs 309 320 Digestive organ drugs 196 183 Agents affecting metabolism 164 165 Drugs for nervous system sensory organs 99 91 Antibiotics and chemotherapeutic drugs 65 62 Antineoplastic agents 32 34 Others 135 145
Sales Distribution By Launch Year (yenmn) FY2016 FY2017 Fiscal Year Amount Distrib () Amount Distrib () YOY () 2010 and before 19487 1 667 19194 637 (15) 2009 2011 2348 0 80 2210 73 (59) 2012 1484 0 51 1404 47 (54) 2013 2917 0 100 3127 104 72 2014 1746 0 60 1937 64 110 2015 1001 0 34 1222 41 221 2016 219 0 08 459 15 1091 2017 ― ― ― 558 19 ― Total 29204 1 1000 30115 1000 31
Generics Proprietary Products (yenmn) FY2016 FY2017 Distrib Distrib YOY Achieved Amount () Amount () () Forecast () Total 31513 1 1000 32153 1 1000 20 32000 1005 Generics 29204 1 927 30115 1 937 31 30000 1 1004 To medical institutions 27808 29174 49 29100 1 1003 To other makers 1395 941 (326) 900 1 1046 Amlodipine 2865 2940 26 2900 1 1014 Lansoprazole 2279 2163 (51) 2100 1 1030 Donepezil 1642 1557 (52) 1600 1 973 Rabeprazole 1586 1558 (18) 1600 1 974 Limaprost Alfadex 1469 1427 (28) 1400 1 1020 Pravastatine 1173 1147 (22) 1100 1 1043 Voglibose 957 870 (91) 900 1 967 Others 17229 18449 71 18400 1 1003 Proprietary products 2308 0 73 2038 0 63 (117) 2000 1 1019 Uralyt 1409 1225 (131) 1200 1 1021 Soleton 679 598 (120) 600 1 997 Calvan 219 214 (21) 200 1 1074 Chemiphar ODM Generics (yenmn) FY2016 FY2017 Distrib Distrib YOY Achieved Amount () Amount () () Forecast () Total 30445 1000 31100 1000 22 31400 990 Generics 29204 959 30115 968 31 30000 1004 Generics (ODM) 1240 41 985 32 (206) 1400 704 Includes exports Revised forecast issued on October 31 2017
Income Statement Overview (yenmn) FY2016 FY2017 of of YOY Achieved Amount Sales Amount Sales () Forecast () Net Sales 35689 1 1000 35331 1 1000 (10) 35500 1 995 Pharmaceuticals 34551 1 968 34279 1 970 (08) ― ― ― Others 1137 0 32 1051 0 30 (76) ― ― ― Cost of sales 19449 1 545 19535 1 553 04 ― ― ― SGampA expenses 13403 0 376 13947 0 395 41 ― ― ― RampD expenses 1984 0 56 2280 0 65 150 2200 0 1037 Operating income 2836 0 79 1848 0 52 (348) 1800 0 1027 Income before income taxes and minority interests 2849 0 80 1696 0 48 (405) 1700 ― 998 Net income attributble to owners of the parent 2054 0 58 1160 0 33 (435) 1150 ― 1009 1961 00550933658 00550933658 00575628587 Revised forecast issued on October 31 2017
Per Share Information (yen) FY2017 FY2018 (Forecast) Amount Amount YOY () Earnings per share 31528 13584 (569) Book value per share 485986 ― ― Dividends per share 10000 7500 ― Dividend payout ratio() 317 552 ― Capital Expenditure and Other (yenmn) FY2017 FY2018 (Forecast) Amount Amount Change Capital expenditure 1645 950 (695) Depreciation and amortization 1192 1350 157 2015年3月期 ガツキ 2016年3月期(予想) ガツキ ヨソウ 金額 キンガク 金額 キンガク 増減額 ゾウゲンガク 増減率 ゾウゲン リツ 医療用医薬品 イリョウヨウ イヤクヒン 27400 30950 +05 ジェネリック医薬品(荷離) イヤクヒン ニ バナレ 25079 27430 +01 内自社販売 ウチ ジシャ ハンバイ 2321 25100 +01 内導出輸出 ウチ ドウシュツ ユシュツ 3011 2330 +04 アムロジピン 1935 3040 +09 ランソプラゾール 1509 1890 24 プラバスタチン 1595 1570 +40 ラベプラゾール 1704 1570 16 リマプロストアルファデクス 1273 1660 26 ボグリボース 1013 1300 +21 ドネペジル 15357 1030 +16 その他 タ 3400 15370 +01 主力品 シュリョク ヒン 1975 3520 +35 ウラリット 1134 1970 03 ソレトン 290 1250 +102 カルバン 0 300 +34 ジェネリック医薬品事業 イヤクヒン ジギョウ 2015年3月期 ガツキ 2016年3月期(予想) ガツキ ヨソウ 金額 キンガク 金額 キンガク 増減額 ゾウゲンガク 増減率 ゾウゲン リツ ジェネリック医薬品事業 イヤクヒン ジギョウ 28918 28840 +1003 ジェネリック医薬品(荷離) イヤクヒン ニ バナレ 27400 27430 +999 受託 ジュタク 1518 1410 +1077
Generics Proprietary Products (yenmn) FY2017 FY2018 (Forecast) Amount Amount YOY () Total 32153 31800 (11) Generics 30115 30150 01 To medical institutions 29174 29250 03 To other makers 941 900 (44) Amlodipine 2940 2900 (14) Lansoprazole 2163 1900 (122) Donepezil 1557 1350 (133) Rabeprazole 1558 1350 (134) Limaprost Alfadex 1427 1350 (55) Pravastatine 1147 1100 (41) Voglibose 870 750 (139) Others 18449 19450 54 Proprietary products 2038 1650 (190) Uralyt 1225 1070 (127) Soleton 598 400 (331) Calvan 214 180 (162) Chemiphar ODM Generics (yenmn) FY2017 FY2018 (Forecast) Amount Amount YOY () Total 31100 31350 08 Generics 30115 30150 01 Generics (ODM) 985 1200 218
Income Statement Overview (yenmn) FY2017 FY2018 (Forecast) of of YOY Amount Sales Amount Sales () Net Sales 35331 1000 35500 1000 05 Pharmaceuticals 34279 970 ― ― ― Others 1051 30 ― ― ― Cost of sales 19535 553 ― ― ― SGampA expenses 13947 395 ― ― ― RampD expenses 2280 65 2700 76 184 Operating income 1848 0 52 1100 31 (405) Income before income taxes and minority interests 1777 80 ― ― ― Net income attributble to owners of the parent 1160 33 500 14 (569)
Capital Expenditure and Other (yenmn) Items FY2016 FY2017 Usage Amount Amount YOY () Forecast Rate () Capital expenditure 2928 1645 (438) 1650 997 Depreciation and amortization 1112 1192 72 1250 954 Revised forecast issued on October 31 2017
Cash Flow Statements (yenmn) FY2016 FY2017 Amount Amount Net cash Provided by operating activities 2737 3188 Used in investing activities (2504) (1606) Used in financing activities 787 (1741) Cash and cash equivalents 8084 7890 Free cash flow 232 1582
Per Share Information (yen) FY2016 FY2017 Amount Amount Change Forecast Earnings per share 53002 31528 (21474) 30673 Book value per share 454880 485986 31106 ― Dividend per share 10000 10000 ― 10000 Dividend payout ratio () 189 317 ― 326 Revised forecast issued on October 31 2017
Balance Sheet Data (yenmn) March 31 2017 March 31 2018 March 31 2015 Amount Amount Change Total assets 47002 46814 3358 (187) Return on assets () 63 36 -06 (27) Net assets 17355 17487 1313 132 Owned capital 17346 17474 1312 127 Capital-to-asset ratio () 369 373 02 04 Return on equity () 123 67 (01) (56) Current assets 29009 28334 1630 (674) Current liabilities 14939 14914 (716) (25) Current ratio (x) 194 19 019 (004)
By Main Therapeutic Categories () FY2016 FY2017 Cardiovascular and respiratory drugs 309 320 Digestive organ drugs 196 183 Agents affecting metabolism 164 165 Drugs for nervous system sensory organs 99 91 Antibiotics and chemotherapeutic drugs 65 62 Antineoplastic agents 32 34 Others 135 145
Sales Distribution By Launch Year (yenmn) FY2016 FY2017 Fiscal Year Amount Distrib () Amount Distrib () YOY () 2010 and before 19487 1 667 19194 637 (15) 2009 2011 2348 0 80 2210 73 (59) 2012 1484 0 51 1404 47 (54) 2013 2917 0 100 3127 104 72 2014 1746 0 60 1937 64 110 2015 1001 0 34 1222 41 221 2016 219 0 08 459 15 1091 2017 ― ― 558 19 ― Total 29204 1 1000 30115 1000 31
Generics Proprietary Products (yenmn) FY2016 FY2017 Distrib Distrib YOY Achieved Amount () Amount () () Forecast () Total 31513 1 1000 32153 1 1000 20 32000 1005 Generics 29204 1 927 30115 1 937 31 30000 1 1004 To medical institutions 27808 29174 49 29100 1 1003 To other makers 1395 941 (326) 900 1 1046 Amlodipine 2865 2940 26 2900 1 1014 Lansoprazole 2279 2163 (51) 2100 1 1030 Donepezil 1642 1557 (52) 1600 1 973 Rabeprazole 1586 1558 (18) 1600 1 974 Limaprost Alfadex 1469 1427 (28) 1400 1 1020 Pravastatine 1173 1147 (22) 1100 1 1043 Voglibose 957 870 (91) 900 1 967 Others 17229 18449 71 18400 1 1003 Proprietary products 2308 0 73 2038 0 63 (117) 2000 1 1019 Uralyt 1409 1225 (131) 1200 1 1021 Soleton 679 598 (120) 600 1 997 Calvan 219 214 (21) 200 1 1074 Chemiphar ODM Generics (yenmn) FY2016 FY2017 Distrib Distrib YOY Achieved Amount () Amount () () Forecast () Total 30445 1000 31100 1000 22 31400 990 Generics 29204 959 30115 968 31 30000 1004 Generics (ODM) 1240 41 985 32 (206) 1400 704 Includes exports Revised forecast issued on October 31 2017
Income Statement Overview (yenmn) FY2016 FY2017 of of YOY Achieved Amount Sales Amount Sales () Forecast () Net Sales 35689 1 1000 35331 1 1000 (10) 35500 1 995 Pharmaceuticals 34551 1 968 34279 1 970 (08) ― ― Others 1137 0 32 1051 0 30 (76) ― ― Cost of sales 19449 1 545 19535 1 553 04 ― ― SGampA expenses 13403 0 376 13947 0 395 41 ― ― RampD expenses 1984 0 56 2280 0 65 150 2200 0 1037 Operating income 2836 0 79 1848 0 52 (348) 1800 0 1027 Income before income taxes and minority interests 2849 0 80 1777 0 50 (376) ― ― Net income attributble to owners of the parent 2054 0 58 1160 0 33 (435) 1150 ― 1009 1961 00550933658 00550933658 00575628587 Revised forecast issued on October 31 2017
Per Share Information (yen) FY2017 FY2018 (Forecast) Amount Amount YOY () Earnings per share 31528 13584 (569) Book value per share 485986 ― ― Dividends per share 10000 7500 ― Dividend payout ratio() 317 552 ― Capital Expenditure and Other (yenmn) FY2017 FY2018 (Forecast) Amount Amount Change Capital expenditure 1645 950 (695) Depreciation and amortization 1192 1350 157 2015年3月期 ガツキ 2016年3月期(予想) ガツキ ヨソウ 金額 キンガク 金額 キンガク 増減額 ゾウゲンガク 増減率 ゾウゲン リツ 医療用医薬品 イリョウヨウ イヤクヒン 27400 30950 +05 ジェネリック医薬品(荷離) イヤクヒン ニ バナレ 25079 27430 +01 内自社販売 ウチ ジシャ ハンバイ 2321 25100 +01 内導出輸出 ウチ ドウシュツ ユシュツ 3011 2330 +04 アムロジピン 1935 3040 +09 ランソプラゾール 1509 1890 24 プラバスタチン 1595 1570 +40 ラベプラゾール 1704 1570 16 リマプロストアルファデクス 1273 1660 26 ボグリボース 1013 1300 +21 ドネペジル 15357 1030 +16 その他 タ 3400 15370 +01 主力品 シュリョク ヒン 1975 3520 +35 ウラリット 1134 1970 03 ソレトン 290 1250 +102 カルバン 0 300 +34 ジェネリック医薬品事業 イヤクヒン ジギョウ 2015年3月期 ガツキ 2016年3月期(予想) ガツキ ヨソウ 金額 キンガク 金額 キンガク 増減額 ゾウゲンガク 増減率 ゾウゲン リツ ジェネリック医薬品事業 イヤクヒン ジギョウ 28918 28840 +1003 ジェネリック医薬品(荷離) イヤクヒン ニ バナレ 27400 27430 +999 受託 ジュタク 1518 1410 +1077
Generics Proprietary Products (yenmn) FY2017 FY2018 (Forecast) Amount Amount YOY () Total 32153 31800 (11) Generics 30115 30150 01 To medical institutions 29174 29250 03 To other makers 941 900 (44) Amlodipine 2940 2900 (14) Lansoprazole 2163 1900 (122) Donepezil 1557 1350 (133) Rabeprazole 1558 1350 (134) Limaprost Alfadex 1427 1350 (55) Pravastatine 1147 1100 (41) Voglibose 870 750 (139) Others 18449 19450 54 Proprietary products 2038 1650 (190) Uralyt 1225 1070 (127) Soleton 598 400 (331) Calvan 214 180 (162) Chemiphar ODM Generics (yenmn) FY2017 FY2018 (Forecast) Amount Amount YOY () Total 31100 31350 08 Generics 30115 30150 01 Generics (ODM) 985 1200 218
Income Statement Overview (yenmn) FY2017 FY2018 (Forecast) of of YOY Amount Sales Amount Sales () Net Sales 35331 1000 35500 1000 05 Pharmaceuticals 34279 970 ― ― ― Others 1051 30 ― ― ― Cost of sales 19535 553 ― ― ― SGampA expenses 13947 395 ― ― ― RampD expenses 2280 65 2700 76 184 Operating income 1848 0 52 1100 31 (405) Income before income taxes and minority interests 1777 80 ― ― ― Net income attributble to owners of the parent 1160 33 500 14 (569)
Capital Expenditure and Other (yenmn) Items FY2016 FY2017 Usage Amount Amount YOY () Forecast Rate () Capital expenditure 2928 1645 (438) 1650 997 Depreciation and amortization 1112 1192 72 1250 954 Revised forecast issued on October 31 2017
Cash Flow Statements (yenmn) FY2016 FY2017 Amount Amount Net cash Provided by operating activities 2737 3188 Used in investing activities (2504) (1606) Used in financing activities 787 (1741) Cash and cash equivalents 8084 7890 Free cash flow 232 1582
Per Share Information (yen) FY2016 FY2017 Amount Amount Change Forecast Earnings per share 53002 31528 (21474) 30673 Book value per share 454880 485986 31106 ― Dividend per share 10000 10000 ― 10000 Dividend payout ratio () 189 317 ― 326 Revised forecast issued on October 31 2017
Balance Sheet Data (yenmn) March 31 2017 August 31 2017 March 31 2015 Amount Amount Change Total assets 47002 46814 3358 (187) Return on assets () 63 36 -06 (27) Net assets 17355 17487 1313 132 Owned capital 17346 17474 1312 127 Capital-to-asset ratio () 369 373 02 +04 Return on equity () 123 67 (01) (56) Current assets 29009 28334 1630 (674) Current liabilities 14939 14914 (716) (25) Current ratio (x) 194 19 019 004
By Main Therapeutic Categories () FY2016 FY2017 Cardiovascular and respiratory drugs 309 320 Digestive organ drugs 196 183 Agents affecting metabolism 164 165 Drugs for nervous system sensory organs 99 91 Antibiotics and chemotherapeutic drugs 65 62 Antineoplastic agents 32 34 Others 135 145
Sales Distribution By Launch Year (yenmn) FY2016 FY2017 Fiscal Year Amount Distrib () Amount Distrib () YOY () 2010 and before 19487 1 667 19194 637 (15) 2009 2011 2348 0 80 2210 73 (59) 2012 1484 0 51 1404 47 (54) 2013 2917 0 100 3127 104 72 2014 1746 0 60 1937 64 110 2015 1001 0 34 1222 41 221 2016 219 0 08 459 15 1091 2017 ― ― ― 558 19 ― Total 29204 1 1000 30115 1000 31
Generics Proprietary Products (yenmn) FY2016 FY2017 Distrib Distrib YOY Achieved Amount () Amount () () Forecast () Total 31513 1 1000 32153 1 1000 20 32000 1005 Generics 29204 1 927 30115 1 937 31 30000 1 1004 To medical institutions 27808 29174 49 29100 1 1003 To other makers 1395 941 (326) 900 1 1046 Amlodipine 2865 2940 26 2900 1 1014 Lansoprazole 2279 2163 (51) 2100 1 1030 Donepezil 1642 1557 (52) 1600 1 973 Rabeprazole 1586 1558 (18) 1600 1 974 Limaprost Alfadex 1469 1427 (28) 1400 1 1020 Pravastatine 1173 1147 (22) 1100 1 1043 Voglibose 957 870 (91) 900 1 967 Others 17229 18449 71 18400 1 1003 Proprietary products 2308 0 73 2038 0 63 (117) 2000 1 1019 Uralyt 1409 1225 (131) 1200 1 1021 Soleton 679 598 (120) 600 1 997 Calvan 219 214 (21) 200 1 1074 Chemiphar ODM Generics (yenmn) FY2016 FY2017 Distrib Distrib YOY Achieved Amount () Amount () () Forecast () Total 30445 1000 31100 1000 22 31400 990 Generics 29204 959 30115 968 31 30000 1004 Generics (ODM) 1240 41 985 32 (206) 1400 704 Includes exports Revised forecast issued on October 31 2017
Income Statement Overview (yenmn) FY2016 FY2017 of of YOY Achieved Amount Sales Amount Sales () Forecast () Net Sales 35689 1 1000 35331 1 1000 (10) 35500 1 995 Pharmaceuticals 34551 1 968 34279 1 970 (08) ― ― ― Others 1137 0 32 1051 0 30 (76) ― ― ― Cost of sales 19449 1 545 19535 1 553 04 ― ― ― SGampA expenses 13403 0 376 13947 0 395 41 ― ― ― RampD expenses 1984 0 56 2280 0 65 150 2200 0 1037 Operating income 2836 0 79 1848 0 52 (348) 1800 0 1027 Income before income taxes and minority interests 2849 0 80 1696 0 48 (405) 1700 ― 998 Net income attributble to owners of the parent 2054 0 58 1160 0 33 (435) 1150 ― 1009 1961 00550933658 00550933658 00575628587 Revised forecast issued on October 31 2017
Page 8
Cash Flow Expenditure
7
Cash Flow Statements (yenmn)FY2016 FY2017Amount Amount
Net cash Provided by operating activities 2737 3188 Used in investing activities (2504) (1606) Provided by (Used in) financing activities 787 (1741)Cash and cash equivalents 8084 7890Free cash flow 232 1582
Capital Expenditure and Other (yenmn)FY2016
UsageAmount Amount YOY () Forecast Rate ()
Capital expenditure 2928 1645 (438) 1650 997Depreciation and amortization 1112 1192 72 1250 954 Revised forecast issued on October 31 2017
Items
FY2017
PL 医薬品① 医薬品② 医薬品③ BS① BS③ 和文にある「前年同期間比」「前期3月末比」は記載が難しく英語版では必要度の低い情報であるとみなして記載をしないこととなった2016年2Q~(木村)ただし期末では記載が可能なので書きます(須田)
CF CAP EX 業績予想① 英語版では経常利益は書かないので注意(須田)
業績予想 ② 業績予想③ PL 医薬品① 医薬品② 医薬品③ BS① BS③ 和文にある「前年同期間比」「前期3月末比」は記載が難しく英語版では必要度の低い情報であるとみなして記載をしないこととなった2016年2Q~(木村)ただし期末では記載が可能なので書きます(須田)
CF CAP EX 業績予想① 英語版では経常利益は書かないので注意(須田)
業績予想 ② 業績予想③ 8
II FY2018 Forecasts
Sales Income
9
(yenmn)
of of YOYAmount Sales Amount Sales ()
Net Sales 35331 1000 35500 1000 05 Pharmaceuticals 34279 970 ― ― ― Others 1051 30 ― ― ―Cost of sales 19535 553 ― ― ―SGampA expenses 13947 395 ― ― ― RampD expenses 2280 65 2700 76 184Operating income 1848 52 1100 31 (405)
1777 50 ― ― ―
1160 33 500 14 (569)Net income attributble to owners of the parent
FY2018 (Forecast)FY2017
Income before income taxes and minority interests
Annual ForecastSales and profit in FY2018 will be impacted by NHI drug price revisions On the other hand however due to our focus on newly launched products and expansion of new sales channels sales of generic drugs are expected to be nearly flat compared to the previous fiscal year As a result consolidated net sales including other businesses such as contracted testing business are projected to be yen35500 million (up 05 YOY)
Regarding profits due to increased development costs as the progress in new drug development and continued strategic expenses such as trial costs leading up to the commencement of commercial production at the Vietnam factory operating income is forecast at yen1100 million (down 405 YOY) and net income attributable to owners of the parent is expected to be yen500 million (down 569 YOY)
PL 医薬品① 医薬品② 医薬品③ BS① BS③ 和文にある「前年同期間比」「前期3月末比」は記載が難しく英語版では必要度の低い情報であるとみなして記載をしないこととなった2016年2Q~(木村)ただし期末では記載が可能なので書きます(須田)
CF CAP EX 業績予想① 英語版では経常利益は書かないので注意(須田)
業績予想 ② 業績予想③ Pharmaceutical Sales
10
Generics Proprietary Products (yenmn)FY2017Amount Amount YOY ()
Total 32153 31800 (11) Generics 30115 30150 01 To medical institutions 29174 29250 03 To other makers 941 900 (44) Amlodipine 2940 2900 (14) Lansoprazole 2163 1900 (122) Donepezil 1557 1350 (133) Rabeprazole 1558 1350 (134) Limaprost Alfadex 1427 1350 (55) Pravastatine 1147 1100 (41) Voglibose 870 750 (139) Others 18449 19450 54 Proprietary products 2038 1650 (190) Uralyt 1225 1070 (127) Soleton 598 400 (331) Calvan 214 180 (162)
Chemiphar ODM Generics (yenmn)FY2017Amount Amount YOY ()
Total 31100 31350 08 Generics 30115 30150 01 Generics (ODM) 985 1200 218
FY2018 (Forecast)
FY2018 (Forecast)
PL 医薬品① 医薬品② 医薬品③ BS① BS③ 和文にある「前年同期間比」「前期3月末比」は記載が難しく英語版では必要度の低い情報であるとみなして記載をしないこととなった2016年2Q~(木村)ただし期末では記載が可能なので書きます(須田)
CF CAP EX 業績予想① 英語版では経常利益は書かないので注意(須田)
業績予想 ② 業績予想③ Per Share Information Expenditure
11
For further information contactPublic Relations Department Nippon Chemiphar Co LtdE-mail irchemipharcojp
Note about Forward-looking Statements and ForecastsStatements made in this Highlights of Business Results with respect to current plans estimates strategies and beliefs and other statements of Nippon Chemiphar that are not historical facts are forward-looking statements about the future performance of Nippon Chemiphar
These statements are based on managementrsquos current assumptions and beliefs in light of the information currently available to it and involve known and unknown risks and uncertainties Consequently undue reliance should not be placed on these statements
Nippon Chemiphar cautions the reader that a number of important factors could cause actual results to differ materially from those discussed in the forward-looking statements
Per Share Information (yen)FY2017Amount Amount YOY ()
Earnings per share 31528 13584 (569)Book value per share 485986 ― ―Dividends per share 10000 7500 ―Dividend payout ratio () 317 552 ―
Capital Expenditure and Other (yenmn)FY2017Amount Amount Change
Capital expenditure 1645 950 (695)Depreciation and amortization 1192 1350 157
FY2018 (Forecast)
FY2018 (Forecast)
Dividend ForecastAs mentioned above we are forecasting a decline in profit in FY2018 due to the influence of NHI drug price revisions ongoing strategic spending including new drug development expenses and start-up expenses at the Vietnam factory Thus we expect to pay a dividend per share of 75 yen (down 25 yen per share YOY) with a payout ratio of 552
PL 医薬品① 医薬品② 医薬品③ BS① BS③ 和文にある「前年同期間比」「前期3月末比」は記載が難しく英語版では必要度の低い情報であるとみなして記載をしないこととなった2016年2Q~(木村)ただし期末では記載が可能なので書きます(須田)
CF CAP EX 業績予想① 英語版では経常利益は書かないので注意(須田)
業績予想 ② 業績予想③ スライド番号 1 Contents スライド番号 3 Sales Income Pharmaceutical Sales Sales Distribution Balance Sheet per Share Information Cash Flow Expenditure スライド番号 9 Sales Income Pharmaceutical Sales Per Share Information Expenditure Per Share Information (yen) FY2017 FY2018 (Forecast) Amount Amount YOY () Earnings per share 31528 13584 (569) Book value per share 485986 ― ― Dividends per share 10000 7500 ― Dividend payout ratio () 317 552 ― Capital Expenditure and Other (yenmn) FY2017 FY2018 (Forecast) Amount Amount Change Capital expenditure 1645 950 (695) Depreciation and amortization 1192 1350 157 2015年3月期 ガツキ 2016年3月期(予想) ガツキ ヨソウ 金額 キンガク 金額 キンガク 増減額 ゾウゲンガク 増減率 ゾウゲン リツ 医療用医薬品 イリョウヨウ イヤクヒン 27400 30950 +05 ジェネリック医薬品(荷離) イヤクヒン ニ バナレ 25079 27430 +01 内自社販売 ウチ ジシャ ハンバイ 2321 25100 +01 内導出輸出 ウチ ドウシュツ ユシュツ 3011 2330 +04 アムロジピン 1935 3040 +09 ランソプラゾール 1509 1890 24 プラバスタチン 1595 1570 +40 ラベプラゾール 1704 1570 16 リマプロストアルファデクス 1273 1660 26 ボグリボース 1013 1300 +21 ドネペジル 15357 1030 +16 その他 タ 3400 15370 +01 主力品 シュリョク ヒン 1975 3520 +35 ウラリット 1134 1970 03 ソレトン 290 1250 +102 カルバン 0 300 +34 ジェネリック医薬品事業 イヤクヒン ジギョウ 2015年3月期 ガツキ 2016年3月期(予想) ガツキ ヨソウ 金額 キンガク 金額 キンガク 増減額 ゾウゲンガク 増減率 ゾウゲン リツ ジェネリック医薬品事業 イヤクヒン ジギョウ 28918 28840 +1003 ジェネリック医薬品(荷離) イヤクヒン ニ バナレ 27400 27430 +999 受託 ジュタク 1518 1410 +1077
Generics Proprietary Products (yenmn) FY2017 FY2018 (Forecast) Amount Amount YOY () Total 32153 31800 (11) Generics 30115 30150 01 To medical institutions 29174 29250 03 To other makers 941 900 (44) Amlodipine 2940 2900 (14) Lansoprazole 2163 1900 (122) Donepezil 1557 1350 (133) Rabeprazole 1558 1350 (134) Limaprost Alfadex 1427 1350 (55) Pravastatine 1147 1100 (41) Voglibose 870 750 (139) Others 18449 19450 54 Proprietary products 2038 1650 (190) Uralyt 1225 1070 (127) Soleton 598 400 (331) Calvan 214 180 (162) Chemiphar ODM Generics (yenmn) FY2017 FY2018 (Forecast) Amount Amount YOY () Total 31100 31350 08 Generics 30115 30150 01 Generics (ODM) 985 1200 218
Income Statement Overview (yenmn) FY2017 FY2018 (Forecast) of of YOY Amount Sales Amount Sales () Net Sales 35331 1000 35500 1000 05 Pharmaceuticals 34279 970 ― ― ― Others 1051 30 ― ― ― Cost of sales 19535 553 ― ― ― SGampA expenses 13947 395 ― ― ― RampD expenses 2280 65 2700 76 184 Operating income 1848 0 52 1100 31 (405) Income before income taxes and minority interests 1777 80 ― ― ― Net income attributble to owners of the parent 1160 33 500 14 (569)
Capital Expenditure and Other (yenmn) Items FY2016 FY2017 Usage Amount Amount YOY () Forecast Rate () Capital expenditure 2928 1645 (438) 1650 997 Depreciation and amortization 1112 1192 72 1250 954 Revised forecast issued on October 31 2017
Cash Flow Statements (yenmn) FY2016 FY2017 Amount Amount Net cash Provided by operating activities 2737 3188 Used in investing activities (2504) (1606) Used in financing activities 787 (1741) Cash and cash equivalents 8084 7890 Free cash flow 232 1582
Per Share Information (yen) FY2016 FY2017 Amount Amount Change Forecast Earnings per share 53002 31528 (21474) 30673 Book value per share 454880 485986 31106 ― Dividend per share 10000 10000 ― 10000 Dividend payout ratio () 189 317 ― 326 Revised forecast issued on October 31 2017
Balance Sheet Data (yenmn) March 31 2017 August 31 2017 March 31 2015 Amount Amount Change Total assets 47002 46814 3358 (187) Return on assets () 63 36 -06 (27) Net assets 17355 17487 1313 132 Owned capital 17346 17474 1312 127 Capital-to-asset ratio () 369 373 02 +04 Return on equity () 123 67 (01) (56) Current assets 29009 28334 1630 (674) Current liabilities 14939 14914 (716) (25) Current ratio (x) 194 19 019 004
By Main Therapeutic Categories () FY2016 FY2017 Cardiovascular and respiratory drugs 309 320 Digestive organ drugs 196 183 Agents affecting metabolism 164 165 Drugs for nervous system sensory organs 99 91 Antibiotics and chemotherapeutic drugs 65 62 Antineoplastic agents 32 34 Others 135 145
Sales Distribution By Launch Year (yenmn) FY2016 FY2017 Fiscal Year Amount Distrib () Amount Distrib () YOY () 2010 and before 19487 1 667 19194 637 (15) 2009 2011 2348 0 80 2210 73 (59) 2012 1484 0 51 1404 47 (54) 2013 2917 0 100 3127 104 72 2014 1746 0 60 1937 64 110 2015 1001 0 34 1222 41 221 2016 219 0 08 459 15 1091 2017 ― ― ― 558 19 ― Total 29204 1 1000 30115 1000 31
Generics Proprietary Products (yenmn) FY2016 FY2017 Distrib Distrib YOY Achieved Amount () Amount () () Forecast () Total 31513 1 1000 32153 1 1000 20 32000 1005 Generics 29204 1 927 30115 1 937 31 30000 1 1004 To medical institutions 27808 29174 49 29100 1 1003 To other makers 1395 941 (326) 900 1 1046 Amlodipine 2865 2940 26 2900 1 1014 Lansoprazole 2279 2163 (51) 2100 1 1030 Donepezil 1642 1557 (52) 1600 1 973 Rabeprazole 1586 1558 (18) 1600 1 974 Limaprost Alfadex 1469 1427 (28) 1400 1 1020 Pravastatine 1173 1147 (22) 1100 1 1043 Voglibose 957 870 (91) 900 1 967 Others 17229 18449 71 18400 1 1003 Proprietary products 2308 0 73 2038 0 63 (117) 2000 1 1019 Uralyt 1409 1225 (131) 1200 1 1021 Soleton 679 598 (120) 600 1 997 Calvan 219 214 (21) 200 1 1074 Chemiphar ODM Generics (yenmn) FY2016 FY2017 Distrib Distrib YOY Achieved Amount () Amount () () Forecast () Total 30445 1000 31100 1000 22 31400 990 Generics 29204 959 30115 968 31 30000 1004 Generics (ODM) 1240 41 985 32 (206) 1400 704 Includes exports Revised forecast issued on October 31 2017
Income Statement Overview (yenmn) FY2016 FY2017 of of YOY Achieved Amount Sales Amount Sales () Forecast () Net Sales 35689 1 1000 35331 1 1000 (10) 35500 1 995 Pharmaceuticals 34551 1 968 34279 1 970 (08) ― ― ― Others 1137 0 32 1051 0 30 (76) ― ― ― Cost of sales 19449 1 545 19535 1 553 04 ― ― ― SGampA expenses 13403 0 376 13947 0 395 41 ― ― ― RampD expenses 1984 0 56 2280 0 65 150 2200 0 1037 Operating income 2836 0 79 1848 0 52 (348) 1800 0 1027 Income before income taxes and minority interests 2849 0 80 1696 0 48 (405) 1700 ― 998 Net income attributble to owners of the parent 2054 0 58 1160 0 33 (435) 1150 ― 1009 1961 00550933658 00550933658 00575628587 Revised forecast issued on October 31 2017
Per Share Information (yen) FY2017 FY2018 (Forecast) Amount Amount YOY () Earnings per share 31528 13584 (569) Book value per share 485986 ― ― Dividends per share 10000 7500 ― Dividend payout ratio() 317 552 ― Capital Expenditure and Other (yenmn) FY2017 FY2018 (Forecast) Amount Amount Change Capital expenditure 1645 950 (695) Depreciation and amortization 1192 1350 157 2015年3月期 ガツキ 2016年3月期(予想) ガツキ ヨソウ 金額 キンガク 金額 キンガク 増減額 ゾウゲンガク 増減率 ゾウゲン リツ 医療用医薬品 イリョウヨウ イヤクヒン 27400 30950 +05 ジェネリック医薬品(荷離) イヤクヒン ニ バナレ 25079 27430 +01 内自社販売 ウチ ジシャ ハンバイ 2321 25100 +01 内導出輸出 ウチ ドウシュツ ユシュツ 3011 2330 +04 アムロジピン 1935 3040 +09 ランソプラゾール 1509 1890 24 プラバスタチン 1595 1570 +40 ラベプラゾール 1704 1570 16 リマプロストアルファデクス 1273 1660 26 ボグリボース 1013 1300 +21 ドネペジル 15357 1030 +16 その他 タ 3400 15370 +01 主力品 シュリョク ヒン 1975 3520 +35 ウラリット 1134 1970 03 ソレトン 290 1250 +102 カルバン 0 300 +34 ジェネリック医薬品事業 イヤクヒン ジギョウ 2015年3月期 ガツキ 2016年3月期(予想) ガツキ ヨソウ 金額 キンガク 金額 キンガク 増減額 ゾウゲンガク 増減率 ゾウゲン リツ ジェネリック医薬品事業 イヤクヒン ジギョウ 28918 28840 +1003 ジェネリック医薬品(荷離) イヤクヒン ニ バナレ 27400 27430 +999 受託 ジュタク 1518 1410 +1077
Generics Proprietary Products (yenmn) FY2017 FY2018 (Forecast) Amount Amount YOY () Total 32153 31800 (11) Generics 30115 30150 01 To medical institutions 29174 29250 03 To other makers 941 900 (44) Amlodipine 2940 2900 (14) Lansoprazole 2163 1900 (122) Donepezil 1557 1350 (133) Rabeprazole 1558 1350 (134) Limaprost Alfadex 1427 1350 (55) Pravastatine 1147 1100 (41) Voglibose 870 750 (139) Others 18449 19450 54 Proprietary products 2038 1650 (190) Uralyt 1225 1070 (127) Soleton 598 400 (331) Calvan 214 180 (162) Chemiphar ODM Generics (yenmn) FY2017 FY2018 (Forecast) Amount Amount YOY () Total 31100 31350 08 Generics 30115 30150 01 Generics (ODM) 985 1200 218
Income Statement Overview (yenmn) FY2017 FY2018 (Forecast) of of YOY Amount Sales Amount Sales () Net Sales 35331 1000 35500 1000 05 Pharmaceuticals 34279 970 ― ― ― Others 1051 30 ― ― ― Cost of sales 19535 553 ― ― ― SGampA expenses 13947 395 ― ― ― RampD expenses 2280 65 2700 76 184 Operating income 1848 0 52 1100 31 (405) Income before income taxes and minority interests 1777 80 ― ― ― Net income attributble to owners of the parent 1160 33 500 14 (569)
Capital Expenditure and Other (yenmn) Items FY2016 FY2017 Usage Amount Amount YOY () Forecast Rate () Capital expenditure 2928 1645 (438) 1650 997 Depreciation and amortization 1112 1192 72 1250 954 Revised forecast issued on October 31 2017
Cash Flow Statements (yenmn) FY2016 FY2017 Amount Amount Net cash Provided by operating activities 2737 3188 Used in investing activities (2504) (1606) Used in financing activities 787 (1741) Cash and cash equivalents 8084 7890 Free cash flow 232 1582
Per Share Information (yen) FY2016 FY2017 Amount Amount Change Forecast Earnings per share 53002 31528 (21474) 30673 Book value per share 454880 485986 31106 ― Dividend per share 10000 10000 ― 10000 Dividend payout ratio () 189 317 ― 326 Revised forecast issued on October 31 2017
Balance Sheet Data (yenmn) March 31 2017 August 31 2017 March 31 2015 Amount Amount Change Total assets 47002 46814 3358 (187) Return on assets () 63 36 -06 (27) Net assets 17355 17487 1313 132 Owned capital 17346 17474 1312 127 Capital-to-asset ratio () 369 373 02 +04 Return on equity () 123 67 (01) (56) Current assets 29009 28334 1630 (674) Current liabilities 14939 14914 (716) (25) Current ratio (x) 194 19 019 004
By Main Therapeutic Categories () FY2016 FY2017 Cardiovascular and respiratory drugs 309 320 Digestive organ drugs 196 183 Agents affecting metabolism 164 165 Drugs for nervous system sensory organs 99 91 Antibiotics and chemotherapeutic drugs 65 62 Antineoplastic agents 32 34 Others 135 145
Sales Distribution By Launch Year (yenmn) FY2016 FY2017 Fiscal Year Amount Distrib () Amount Distrib () YOY () 2010 and before 19487 1 667 19194 637 (15) 2009 2011 2348 0 80 2210 73 (59) 2012 1484 0 51 1404 47 (54) 2013 2917 0 100 3127 104 72 2014 1746 0 60 1937 64 110 2015 1001 0 34 1222 41 221 2016 219 0 08 459 15 1091 2017 ― ― ― 558 19 ― Total 29204 1 1000 30115 1000 31
Generics Proprietary Products (yenmn) FY2016 FY2017 Distrib Distrib YOY Achieved Amount () Amount () () Forecast () Total 31513 1 1000 32153 1 1000 20 32000 1005 Generics 29204 1 927 30115 1 937 31 30000 1 1004 To medical institutions 27808 29174 49 29100 1 1003 To other makers 1395 941 (326) 900 1 1046 Amlodipine 2865 2940 26 2900 1 1014 Lansoprazole 2279 2163 (51) 2100 1 1030 Donepezil 1642 1557 (52) 1600 1 973 Rabeprazole 1586 1558 (18) 1600 1 974 Limaprost Alfadex 1469 1427 (28) 1400 1 1020 Pravastatine 1173 1147 (22) 1100 1 1043 Voglibose 957 870 (91) 900 1 967 Others 17229 18449 71 18400 1 1003 Proprietary products 2308 0 73 2038 0 63 (117) 2000 1 1019 Uralyt 1409 1225 (131) 1200 1 1021 Soleton 679 598 (120) 600 1 997 Calvan 219 214 (21) 200 1 1074 Chemiphar ODM Generics (yenmn) FY2016 FY2017 Distrib Distrib YOY Achieved Amount () Amount () () Forecast () Total 30445 1000 31100 1000 22 31400 990 Generics 29204 959 30115 968 31 30000 1004 Generics (ODM) 1240 41 985 32 (206) 1400 704 Includes exports Revised forecast issued on October 31 2017
Income Statement Overview (yenmn) FY2016 FY2017 of of YOY Achieved Amount Sales Amount Sales () Forecast () Net Sales 35689 1 1000 35331 1 1000 (10) 35500 1 995 Pharmaceuticals 34551 1 968 34279 1 970 (08) ― ― ― Others 1137 0 32 1051 0 30 (76) ― ― ― Cost of sales 19449 1 545 19535 1 553 04 ― ― ― SGampA expenses 13403 0 376 13947 0 395 41 ― ― ― RampD expenses 1984 0 56 2280 0 65 150 2200 0 1037 Operating income 2836 0 79 1848 0 52 (348) 1800 0 1027 Income before income taxes and minority interests 2849 0 80 1696 0 48 (405) 1700 ― 998 Net income attributble to owners of the parent 2054 0 58 1160 0 33 (435) 1150 ― 1009 1961 00550933658 00550933658 00575628587 Revised forecast issued on October 31 2017
Per Share Information (yen) FY2017 FY2018 (Forecast) Amount Amount YOY () Earnings per share 31528 13584 (569) Book value per share 485986 ― ― Dividends per share 10000 7500 ― Dividend payout ratio() 317 552 ― Capital Expenditure and Other (yenmn) FY2017 FY2018 (Forecast) Amount Amount Change Capital expenditure 1645 950 (695) Depreciation and amortization 1192 1350 157 2015年3月期 ガツキ 2016年3月期(予想) ガツキ ヨソウ 金額 キンガク 金額 キンガク 増減額 ゾウゲンガク 増減率 ゾウゲン リツ 医療用医薬品 イリョウヨウ イヤクヒン 27400 30950 +05 ジェネリック医薬品(荷離) イヤクヒン ニ バナレ 25079 27430 +01 内自社販売 ウチ ジシャ ハンバイ 2321 25100 +01 内導出輸出 ウチ ドウシュツ ユシュツ 3011 2330 +04 アムロジピン 1935 3040 +09 ランソプラゾール 1509 1890 24 プラバスタチン 1595 1570 +40 ラベプラゾール 1704 1570 16 リマプロストアルファデクス 1273 1660 26 ボグリボース 1013 1300 +21 ドネペジル 15357 1030 +16 その他 タ 3400 15370 +01 主力品 シュリョク ヒン 1975 3520 +35 ウラリット 1134 1970 03 ソレトン 290 1250 +102 カルバン 0 300 +34 ジェネリック医薬品事業 イヤクヒン ジギョウ 2015年3月期 ガツキ 2016年3月期(予想) ガツキ ヨソウ 金額 キンガク 金額 キンガク 増減額 ゾウゲンガク 増減率 ゾウゲン リツ ジェネリック医薬品事業 イヤクヒン ジギョウ 28918 28840 +1003 ジェネリック医薬品(荷離) イヤクヒン ニ バナレ 27400 27430 +999 受託 ジュタク 1518 1410 +1077
Generics Proprietary Products (yenmn) FY2017 FY2018 (Forecast) Amount Amount YOY () Total 32153 31800 (11) Generics 30115 30150 01 To medical institutions 29174 29250 03 To other makers 941 900 (44) Amlodipine 2940 2900 (14) Lansoprazole 2163 1900 (122) Donepezil 1557 1350 (133) Rabeprazole 1558 1350 (134) Limaprost Alfadex 1427 1350 (55) Pravastatine 1147 1100 (41) Voglibose 870 750 (139) Others 18449 19450 54 Proprietary products 2038 1650 (190) Uralyt 1225 1070 (127) Soleton 598 400 (331) Calvan 214 180 (162) Chemiphar ODM Generics (yenmn) FY2017 FY2018 (Forecast) Amount Amount YOY () Total 31100 31350 08 Generics 30115 30150 01 Generics (ODM) 985 1200 218
Income Statement Overview (yenmn) FY2017 FY2018 (Forecast) of of YOY Amount Sales Amount Sales () Net Sales 35331 1000 35500 1000 05 Pharmaceuticals 34279 970 ― ― ― Others 1051 30 ― ― ― Cost of sales 19535 553 ― ― ― SGampA expenses 13947 395 ― ― ― RampD expenses 2280 65 2700 76 184 Operating income 1848 0 52 1100 31 (405) Income before income taxes and minority interests 1777 50 ― ― ― Net income attributble to owners of the parent 1160 33 500 14 (569)
Capital Expenditure and Other (yenmn) Items FY2016 FY2017 Usage Amount Amount YOY () Forecast Rate () Capital expenditure 2928 1645 (438) 1650 997 Depreciation and amortization 1112 1192 72 1250 954 Revised forecast issued on October 31 2017
Cash Flow Statements (yenmn) FY2016 FY2017 Amount Amount Net cash Provided by operating activities 2737 3188 Used in investing activities (2504) (1606) Used in financing activities 787 (1741) Cash and cash equivalents 8084 7890 Free cash flow 232 1582
Per Share Information (yen) FY2016 FY2017 Amount Amount Change Forecast Earnings per share 53002 31528 (21474) 30673 Book value per share 454880 485986 31106 ― Dividend per share 10000 10000 ― 10000 Dividend payout ratio () 189 317 ― 326 Revised forecast issued on October 31 2017
Balance Sheet Data (yenmn) March 31 2017 March 31 2018 March 31 2015 Amount Amount Change Total assets 47002 46814 3358 (187) Return on assets () 63 36 -06 (27) Net assets 17355 17487 1313 132 Owned capital 17346 17474 1312 127 Capital-to-asset ratio () 369 373 02 04 Return on equity () 123 67 (01) (56) Current assets 29009 28334 1630 (674) Current liabilities 14939 14914 (716) (25) Current ratio (x) 194 19 019 (004)
By Main Therapeutic Categories () FY2016 FY2017 Cardiovascular and respiratory drugs 309 320 Digestive organ drugs 196 183 Agents affecting metabolism 164 165 Drugs for nervous system sensory organs 99 91 Antibiotics and chemotherapeutic drugs 65 62 Antineoplastic agents 32 34 Others 135 145
Sales Distribution By Launch Year (yenmn) FY2016 FY2017 Fiscal Year Amount Distrib () Amount Distrib () YOY () 2010 and before 19487 1 667 19194 637 (15) 2009 2011 2348 0 80 2210 73 (59) 2012 1484 0 51 1404 47 (54) 2013 2917 0 100 3127 104 72 2014 1746 0 60 1937 64 110 2015 1001 0 34 1222 41 221 2016 219 0 08 459 15 1091 2017 ― ― 558 19 ― Total 29204 1 1000 30115 1000 31
Generics Proprietary Products (yenmn) FY2016 FY2017 Distrib Distrib YOY Achieved Amount () Amount () () Forecast () Total 31513 1 1000 32153 1 1000 20 32000 1005 Generics 29204 1 927 30115 1 937 31 30000 1 1004 To medical institutions 27808 29174 49 29100 1 1003 To other makers 1395 941 (326) 900 1 1046 Amlodipine 2865 2940 26 2900 1 1014 Lansoprazole 2279 2163 (51) 2100 1 1030 Donepezil 1642 1557 (52) 1600 1 973 Rabeprazole 1586 1558 (18) 1600 1 974 Limaprost Alfadex 1469 1427 (28) 1400 1 1020 Pravastatine 1173 1147 (22) 1100 1 1043 Voglibose 957 870 (91) 900 1 967 Others 17229 18449 71 18400 1 1003 Proprietary products 2308 0 73 2038 0 63 (117) 2000 1 1019 Uralyt 1409 1225 (131) 1200 1 1021 Soleton 679 598 (120) 600 1 997 Calvan 219 214 (21) 200 1 1074 Chemiphar ODM Generics (yenmn) FY2016 FY2017 Distrib Distrib YOY Achieved Amount () Amount () () Forecast () Total 30445 1000 31100 1000 22 31400 990 Generics 29204 959 30115 968 31 30000 1004 Generics (ODM) 1240 41 985 32 (206) 1400 704 Includes exports Revised forecast issued on October 31 2017
Income Statement Overview (yenmn) FY2016 FY2017 of of YOY Achieved Amount Sales Amount Sales () Forecast () Net Sales 35689 1 1000 35331 1 1000 (10) 35500 1 995 Pharmaceuticals 34551 1 968 34279 1 970 (08) ― ― Others 1137 0 32 1051 0 30 (76) ― ― Cost of sales 19449 1 545 19535 1 553 04 ― ― SGampA expenses 13403 0 376 13947 0 395 41 ― ― RampD expenses 1984 0 56 2280 0 65 150 2200 0 1037 Operating income 2836 0 79 1848 0 52 (348) 1800 0 1027 Income before income taxes and minority interests 2849 0 80 1777 0 50 (376) ― ― Net income attributble to owners of the parent 2054 0 58 1160 0 33 (435) 1150 ― 1009 1961 00550933658 00550933658 00575628587 Revised forecast issued on October 31 2017
Per Share Information (yen) FY2017 FY2018 (Forecast) Amount Amount YOY () Earnings per share 31528 13584 (569) Book value per share 485986 ― ― Dividends per share 10000 7500 ― Dividend payout ratio() 317 552 ― Capital Expenditure and Other (yenmn) FY2017 FY2018 (Forecast) Amount Amount Change Capital expenditure 1645 950 (695) Depreciation and amortization 1192 1350 157 2015年3月期 ガツキ 2016年3月期(予想) ガツキ ヨソウ 金額 キンガク 金額 キンガク 増減額 ゾウゲンガク 増減率 ゾウゲン リツ 医療用医薬品 イリョウヨウ イヤクヒン 27400 30950 +05 ジェネリック医薬品(荷離) イヤクヒン ニ バナレ 25079 27430 +01 内自社販売 ウチ ジシャ ハンバイ 2321 25100 +01 内導出輸出 ウチ ドウシュツ ユシュツ 3011 2330 +04 アムロジピン 1935 3040 +09 ランソプラゾール 1509 1890 24 プラバスタチン 1595 1570 +40 ラベプラゾール 1704 1570 16 リマプロストアルファデクス 1273 1660 26 ボグリボース 1013 1300 +21 ドネペジル 15357 1030 +16 その他 タ 3400 15370 +01 主力品 シュリョク ヒン 1975 3520 +35 ウラリット 1134 1970 03 ソレトン 290 1250 +102 カルバン 0 300 +34 ジェネリック医薬品事業 イヤクヒン ジギョウ 2015年3月期 ガツキ 2016年3月期(予想) ガツキ ヨソウ 金額 キンガク 金額 キンガク 増減額 ゾウゲンガク 増減率 ゾウゲン リツ ジェネリック医薬品事業 イヤクヒン ジギョウ 28918 28840 +1003 ジェネリック医薬品(荷離) イヤクヒン ニ バナレ 27400 27430 +999 受託 ジュタク 1518 1410 +1077
Generics Proprietary Products (yenmn) FY2017 FY2018 (Forecast) Amount Amount YOY () Total 32153 31800 (11) Generics 30115 30150 01 To medical institutions 29174 29250 03 To other makers 941 900 (44) Amlodipine 2940 2900 (14) Lansoprazole 2163 1900 (122) Donepezil 1557 1350 (133) Rabeprazole 1558 1350 (134) Limaprost Alfadex 1427 1350 (55) Pravastatine 1147 1100 (41) Voglibose 870 750 (139) Others 18449 19450 54 Proprietary products 2038 1650 (190) Uralyt 1225 1070 (127) Soleton 598 400 (331) Calvan 214 180 (162) Chemiphar ODM Generics (yenmn) FY2017 FY2018 (Forecast) Amount Amount YOY () Total 31100 31350 08 Generics 30115 30150 01 Generics (ODM) 985 1200 218
Income Statement Overview (yenmn) FY2017 FY2018 (Forecast) of of YOY Amount Sales Amount Sales () Net Sales 35331 1000 35500 1000 05 Pharmaceuticals 34279 970 ― ― ― Others 1051 30 ― ― ― Cost of sales 19535 553 ― ― ― SGampA expenses 13947 395 ― ― ― RampD expenses 2280 65 2700 76 184 Operating income 1848 0 52 1100 31 (405) Income before income taxes and minority interests 1777 80 ― ― ― Net income attributble to owners of the parent 1160 33 500 14 (569)
Capital Expenditure and Other (yenmn) Items FY2016 FY2017 Usage Amount Amount YOY () Forecast Rate () Capital expenditure 2928 1645 (438) 1650 997 Depreciation and amortization 1112 1192 72 1250 954 Revised forecast issued on October 31 2017
Cash Flow Statements (yenmn) FY2016 FY2017 Amount Amount Net cash Provided by operating activities 2737 3188 Used in investing activities (2504) (1606) Used in financing activities 787 (1741) Cash and cash equivalents 8084 7890 Free cash flow 232 1582
Per Share Information (yen) FY2016 FY2017 Amount Amount Change Forecast Earnings per share 53002 31528 (21474) 30673 Book value per share 454880 485986 31106 ― Dividend per share 10000 10000 ― 10000 Dividend payout ratio () 189 317 ― 326 Revised forecast issued on October 31 2017
Balance Sheet Data (yenmn) March 31 2017 August 31 2017 March 31 2015 Amount Amount Change Total assets 47002 46814 3358 (187) Return on assets () 63 36 -06 (27) Net assets 17355 17487 1313 132 Owned capital 17346 17474 1312 127 Capital-to-asset ratio () 369 373 02 +04 Return on equity () 123 67 (01) (56) Current assets 29009 28334 1630 (674) Current liabilities 14939 14914 (716) (25) Current ratio (x) 194 19 019 004
By Main Therapeutic Categories () FY2016 FY2017 Cardiovascular and respiratory drugs 309 320 Digestive organ drugs 196 183 Agents affecting metabolism 164 165 Drugs for nervous system sensory organs 99 91 Antibiotics and chemotherapeutic drugs 65 62 Antineoplastic agents 32 34 Others 135 145
Sales Distribution By Launch Year (yenmn) FY2016 FY2017 Fiscal Year Amount Distrib () Amount Distrib () YOY () 2010 and before 19487 1 667 19194 637 (15) 2009 2011 2348 0 80 2210 73 (59) 2012 1484 0 51 1404 47 (54) 2013 2917 0 100 3127 104 72 2014 1746 0 60 1937 64 110 2015 1001 0 34 1222 41 221 2016 219 0 08 459 15 1091 2017 ― ― ― 558 19 ― Total 29204 1 1000 30115 1000 31
Generics Proprietary Products (yenmn) FY2016 FY2017 Distrib Distrib YOY Achieved Amount () Amount () () Forecast () Total 31513 1 1000 32153 1 1000 20 32000 1005 Generics 29204 1 927 30115 1 937 31 30000 1 1004 To medical institutions 27808 29174 49 29100 1 1003 To other makers 1395 941 (326) 900 1 1046 Amlodipine 2865 2940 26 2900 1 1014 Lansoprazole 2279 2163 (51) 2100 1 1030 Donepezil 1642 1557 (52) 1600 1 973 Rabeprazole 1586 1558 (18) 1600 1 974 Limaprost Alfadex 1469 1427 (28) 1400 1 1020 Pravastatine 1173 1147 (22) 1100 1 1043 Voglibose 957 870 (91) 900 1 967 Others 17229 18449 71 18400 1 1003 Proprietary products 2308 0 73 2038 0 63 (117) 2000 1 1019 Uralyt 1409 1225 (131) 1200 1 1021 Soleton 679 598 (120) 600 1 997 Calvan 219 214 (21) 200 1 1074 Chemiphar ODM Generics (yenmn) FY2016 FY2017 Distrib Distrib YOY Achieved Amount () Amount () () Forecast () Total 30445 1000 31100 1000 22 31400 990 Generics 29204 959 30115 968 31 30000 1004 Generics (ODM) 1240 41 985 32 (206) 1400 704 Includes exports Revised forecast issued on October 31 2017
Income Statement Overview (yenmn) FY2016 FY2017 of of YOY Achieved Amount Sales Amount Sales () Forecast () Net Sales 35689 1 1000 35331 1 1000 (10) 35500 1 995 Pharmaceuticals 34551 1 968 34279 1 970 (08) ― ― ― Others 1137 0 32 1051 0 30 (76) ― ― ― Cost of sales 19449 1 545 19535 1 553 04 ― ― ― SGampA expenses 13403 0 376 13947 0 395 41 ― ― ― RampD expenses 1984 0 56 2280 0 65 150 2200 0 1037 Operating income 2836 0 79 1848 0 52 (348) 1800 0 1027 Income before income taxes and minority interests 2849 0 80 1696 0 48 (405) 1700 ― 998 Net income attributble to owners of the parent 2054 0 58 1160 0 33 (435) 1150 ― 1009 1961 00550933658 00550933658 00575628587 Revised forecast issued on October 31 2017
Per Share Information (yen) FY2017 FY2018 (Forecast) Amount Amount YOY () Earnings per share 31528 13584 (569) Book value per share 485986 ― ― Dividends per share 10000 7500 ― Dividend payout ratio() 317 552 ― Capital Expenditure and Other (yenmn) FY2017 FY2018 (Forecast) Amount Amount Change Capital expenditure 1645 950 (695) Depreciation and amortization 1192 1350 157 2015年3月期 ガツキ 2016年3月期(予想) ガツキ ヨソウ 金額 キンガク 金額 キンガク 増減額 ゾウゲンガク 増減率 ゾウゲン リツ 医療用医薬品 イリョウヨウ イヤクヒン 27400 30950 +05 ジェネリック医薬品(荷離) イヤクヒン ニ バナレ 25079 27430 +01 内自社販売 ウチ ジシャ ハンバイ 2321 25100 +01 内導出輸出 ウチ ドウシュツ ユシュツ 3011 2330 +04 アムロジピン 1935 3040 +09 ランソプラゾール 1509 1890 24 プラバスタチン 1595 1570 +40 ラベプラゾール 1704 1570 16 リマプロストアルファデクス 1273 1660 26 ボグリボース 1013 1300 +21 ドネペジル 15357 1030 +16 その他 タ 3400 15370 +01 主力品 シュリョク ヒン 1975 3520 +35 ウラリット 1134 1970 03 ソレトン 290 1250 +102 カルバン 0 300 +34 ジェネリック医薬品事業 イヤクヒン ジギョウ 2015年3月期 ガツキ 2016年3月期(予想) ガツキ ヨソウ 金額 キンガク 金額 キンガク 増減額 ゾウゲンガク 増減率 ゾウゲン リツ ジェネリック医薬品事業 イヤクヒン ジギョウ 28918 28840 +1003 ジェネリック医薬品(荷離) イヤクヒン ニ バナレ 27400 27430 +999 受託 ジュタク 1518 1410 +1077
Generics Proprietary Products (yenmn) FY2017 FY2018 (Forecast) Amount Amount YOY () Total 32153 31800 (11) Generics 30115 30150 01 To medical institutions 29174 29250 03 To other makers 941 900 (44) Amlodipine 2940 2900 (14) Lansoprazole 2163 1900 (122) Donepezil 1557 1350 (133) Rabeprazole 1558 1350 (134) Limaprost Alfadex 1427 1350 (55) Pravastatine 1147 1100 (41) Voglibose 870 750 (139) Others 18449 19450 54 Proprietary products 2038 1650 (190) Uralyt 1225 1070 (127) Soleton 598 400 (331) Calvan 214 180 (162) Chemiphar ODM Generics (yenmn) FY2017 FY2018 (Forecast) Amount Amount YOY () Total 31100 31350 08 Generics 30115 30150 01 Generics (ODM) 985 1200 218
Income Statement Overview (yenmn) FY2017 FY2018 (Forecast) of of YOY Amount Sales Amount Sales () Net Sales 35331 1000 35500 1000 05 Pharmaceuticals 34279 970 ― ― ― Others 1051 30 ― ― ― Cost of sales 19535 553 ― ― ― SGampA expenses 13947 395 ― ― ― RampD expenses 2280 65 2700 76 184 Operating income 1848 0 52 1100 31 (405) Income before income taxes and minority interests 1777 80 ― ― ― Net income attributble to owners of the parent 1160 33 500 14 (569)
Capital Expenditure and Other (yenmn) Items FY2016 FY2017 Usage Amount Amount YOY () Forecast Rate () Capital expenditure 2928 1645 (438) 1650 997 Depreciation and amortization 1112 1192 72 1250 954 Revised forecast issued on October 31 2017
Cash Flow Statements (yenmn) FY2016 FY2017 Amount Amount Net cash Provided by operating activities 2737 3188 Used in investing activities (2504) (1606) Provided by (Used in) financing activities 787 (1741) Cash and cash equivalents 8084 7890 Free cash flow 232 1582
Per Share Information (yen) FY2016 FY2017 Amount Amount Change Forecast Earnings per share 53002 31528 (21474) 30673 Book value per share 454880 485986 31106 ― Dividend per share 10000 10000 ― 10000 Dividend payout ratio () 189 317 ― 326 Revised forecast issued on October 31 2017
Balance Sheet Data (yenmn) March 31 2017 August 31 2017 March 31 2015 Amount Amount Change Total assets 47002 46814 3358 (187) Return on assets () 63 36 -06 (27) Net assets 17355 17487 1313 132 Owned capital 17346 17474 1312 127 Capital-to-asset ratio () 369 373 02 +04 Return on equity () 123 67 (01) (56) Current assets 29009 28334 1630 (674) Current liabilities 14939 14914 (716) (25) Current ratio (x) 194 19 019 004
By Main Therapeutic Categories () FY2016 FY2017 Cardiovascular and respiratory drugs 309 320 Digestive organ drugs 196 183 Agents affecting metabolism 164 165 Drugs for nervous system sensory organs 99 91 Antibiotics and chemotherapeutic drugs 65 62 Antineoplastic agents 32 34 Others 135 145
Sales Distribution By Launch Year (yenmn) FY2016 FY2017 Fiscal Year Amount Distrib () Amount Distrib () YOY () 2010 and before 19487 1 667 19194 637 (15) 2009 2011 2348 0 80 2210 73 (59) 2012 1484 0 51 1404 47 (54) 2013 2917 0 100 3127 104 72 2014 1746 0 60 1937 64 110 2015 1001 0 34 1222 41 221 2016 219 0 08 459 15 1091 2017 ― ― ― 558 19 ― Total 29204 1 1000 30115 1000 31
Generics Proprietary Products (yenmn) FY2016 FY2017 Distrib Distrib YOY Achieved Amount () Amount () () Forecast () Total 31513 1 1000 32153 1 1000 20 32000 1005 Generics 29204 1 927 30115 1 937 31 30000 1 1004 To medical institutions 27808 29174 49 29100 1 1003 To other makers 1395 941 (326) 900 1 1046 Amlodipine 2865 2940 26 2900 1 1014 Lansoprazole 2279 2163 (51) 2100 1 1030 Donepezil 1642 1557 (52) 1600 1 973 Rabeprazole 1586 1558 (18) 1600 1 974 Limaprost Alfadex 1469 1427 (28) 1400 1 1020 Pravastatine 1173 1147 (22) 1100 1 1043 Voglibose 957 870 (91) 900 1 967 Others 17229 18449 71 18400 1 1003 Proprietary products 2308 0 73 2038 0 63 (117) 2000 1 1019 Uralyt 1409 1225 (131) 1200 1 1021 Soleton 679 598 (120) 600 1 997 Calvan 219 214 (21) 200 1 1074 Chemiphar ODM Generics (yenmn) FY2016 FY2017 Distrib Distrib YOY Achieved Amount () Amount () () Forecast () Total 30445 1000 31100 1000 22 31400 990 Generics 29204 959 30115 968 31 30000 1004 Generics (ODM) 1240 41 985 32 (206) 1400 704 Includes exports Revised forecast issued on October 31 2017
Income Statement Overview (yenmn) FY2016 FY2017 of of YOY Achieved Amount Sales Amount Sales () Forecast () Net Sales 35689 1 1000 35331 1 1000 (10) 35500 1 995 Pharmaceuticals 34551 1 968 34279 1 970 (08) ― ― ― Others 1137 0 32 1051 0 30 (76) ― ― ― Cost of sales 19449 1 545 19535 1 553 04 ― ― ― SGampA expenses 13403 0 376 13947 0 395 41 ― ― ― RampD expenses 1984 0 56 2280 0 65 150 2200 0 1037 Operating income 2836 0 79 1848 0 52 (348) 1800 0 1027 Income before income taxes and minority interests 2849 0 80 1696 0 48 (405) 1700 ― 998 Net income attributble to owners of the parent 2054 0 58 1160 0 33 (435) 1150 ― 1009 1961 00550933658 00550933658 00575628587 Revised forecast issued on October 31 2017
Page 9
8
II FY2018 Forecasts
Sales Income
9
(yenmn)
of of YOYAmount Sales Amount Sales ()
Net Sales 35331 1000 35500 1000 05 Pharmaceuticals 34279 970 ― ― ― Others 1051 30 ― ― ―Cost of sales 19535 553 ― ― ―SGampA expenses 13947 395 ― ― ― RampD expenses 2280 65 2700 76 184Operating income 1848 52 1100 31 (405)
1777 50 ― ― ―
1160 33 500 14 (569)Net income attributble to owners of the parent
FY2018 (Forecast)FY2017
Income before income taxes and minority interests
Annual ForecastSales and profit in FY2018 will be impacted by NHI drug price revisions On the other hand however due to our focus on newly launched products and expansion of new sales channels sales of generic drugs are expected to be nearly flat compared to the previous fiscal year As a result consolidated net sales including other businesses such as contracted testing business are projected to be yen35500 million (up 05 YOY)
Regarding profits due to increased development costs as the progress in new drug development and continued strategic expenses such as trial costs leading up to the commencement of commercial production at the Vietnam factory operating income is forecast at yen1100 million (down 405 YOY) and net income attributable to owners of the parent is expected to be yen500 million (down 569 YOY)
PL 医薬品① 医薬品② 医薬品③ BS① BS③ 和文にある「前年同期間比」「前期3月末比」は記載が難しく英語版では必要度の低い情報であるとみなして記載をしないこととなった2016年2Q~(木村)ただし期末では記載が可能なので書きます(須田)
CF CAP EX 業績予想① 英語版では経常利益は書かないので注意(須田)
業績予想 ② 業績予想③ Pharmaceutical Sales
10
Generics Proprietary Products (yenmn)FY2017Amount Amount YOY ()
Total 32153 31800 (11) Generics 30115 30150 01 To medical institutions 29174 29250 03 To other makers 941 900 (44) Amlodipine 2940 2900 (14) Lansoprazole 2163 1900 (122) Donepezil 1557 1350 (133) Rabeprazole 1558 1350 (134) Limaprost Alfadex 1427 1350 (55) Pravastatine 1147 1100 (41) Voglibose 870 750 (139) Others 18449 19450 54 Proprietary products 2038 1650 (190) Uralyt 1225 1070 (127) Soleton 598 400 (331) Calvan 214 180 (162)
Chemiphar ODM Generics (yenmn)FY2017Amount Amount YOY ()
Total 31100 31350 08 Generics 30115 30150 01 Generics (ODM) 985 1200 218
FY2018 (Forecast)
FY2018 (Forecast)
PL 医薬品① 医薬品② 医薬品③ BS① BS③ 和文にある「前年同期間比」「前期3月末比」は記載が難しく英語版では必要度の低い情報であるとみなして記載をしないこととなった2016年2Q~(木村)ただし期末では記載が可能なので書きます(須田)
CF CAP EX 業績予想① 英語版では経常利益は書かないので注意(須田)
業績予想 ② 業績予想③ Per Share Information Expenditure
11
For further information contactPublic Relations Department Nippon Chemiphar Co LtdE-mail irchemipharcojp
Note about Forward-looking Statements and ForecastsStatements made in this Highlights of Business Results with respect to current plans estimates strategies and beliefs and other statements of Nippon Chemiphar that are not historical facts are forward-looking statements about the future performance of Nippon Chemiphar
These statements are based on managementrsquos current assumptions and beliefs in light of the information currently available to it and involve known and unknown risks and uncertainties Consequently undue reliance should not be placed on these statements
Nippon Chemiphar cautions the reader that a number of important factors could cause actual results to differ materially from those discussed in the forward-looking statements
Per Share Information (yen)FY2017Amount Amount YOY ()
Earnings per share 31528 13584 (569)Book value per share 485986 ― ―Dividends per share 10000 7500 ―Dividend payout ratio () 317 552 ―
Capital Expenditure and Other (yenmn)FY2017Amount Amount Change
Capital expenditure 1645 950 (695)Depreciation and amortization 1192 1350 157
FY2018 (Forecast)
FY2018 (Forecast)
Dividend ForecastAs mentioned above we are forecasting a decline in profit in FY2018 due to the influence of NHI drug price revisions ongoing strategic spending including new drug development expenses and start-up expenses at the Vietnam factory Thus we expect to pay a dividend per share of 75 yen (down 25 yen per share YOY) with a payout ratio of 552
PL 医薬品① 医薬品② 医薬品③ BS① BS③ 和文にある「前年同期間比」「前期3月末比」は記載が難しく英語版では必要度の低い情報であるとみなして記載をしないこととなった2016年2Q~(木村)ただし期末では記載が可能なので書きます(須田)
CF CAP EX 業績予想① 英語版では経常利益は書かないので注意(須田)
業績予想 ② 業績予想③ スライド番号 1 Contents スライド番号 3 Sales Income Pharmaceutical Sales Sales Distribution Balance Sheet per Share Information Cash Flow Expenditure スライド番号 9 Sales Income Pharmaceutical Sales Per Share Information Expenditure Per Share Information (yen) FY2017 FY2018 (Forecast) Amount Amount YOY () Earnings per share 31528 13584 (569) Book value per share 485986 ― ― Dividends per share 10000 7500 ― Dividend payout ratio () 317 552 ― Capital Expenditure and Other (yenmn) FY2017 FY2018 (Forecast) Amount Amount Change Capital expenditure 1645 950 (695) Depreciation and amortization 1192 1350 157 2015年3月期 ガツキ 2016年3月期(予想) ガツキ ヨソウ 金額 キンガク 金額 キンガク 増減額 ゾウゲンガク 増減率 ゾウゲン リツ 医療用医薬品 イリョウヨウ イヤクヒン 27400 30950 +05 ジェネリック医薬品(荷離) イヤクヒン ニ バナレ 25079 27430 +01 内自社販売 ウチ ジシャ ハンバイ 2321 25100 +01 内導出輸出 ウチ ドウシュツ ユシュツ 3011 2330 +04 アムロジピン 1935 3040 +09 ランソプラゾール 1509 1890 24 プラバスタチン 1595 1570 +40 ラベプラゾール 1704 1570 16 リマプロストアルファデクス 1273 1660 26 ボグリボース 1013 1300 +21 ドネペジル 15357 1030 +16 その他 タ 3400 15370 +01 主力品 シュリョク ヒン 1975 3520 +35 ウラリット 1134 1970 03 ソレトン 290 1250 +102 カルバン 0 300 +34 ジェネリック医薬品事業 イヤクヒン ジギョウ 2015年3月期 ガツキ 2016年3月期(予想) ガツキ ヨソウ 金額 キンガク 金額 キンガク 増減額 ゾウゲンガク 増減率 ゾウゲン リツ ジェネリック医薬品事業 イヤクヒン ジギョウ 28918 28840 +1003 ジェネリック医薬品(荷離) イヤクヒン ニ バナレ 27400 27430 +999 受託 ジュタク 1518 1410 +1077
Generics Proprietary Products (yenmn) FY2017 FY2018 (Forecast) Amount Amount YOY () Total 32153 31800 (11) Generics 30115 30150 01 To medical institutions 29174 29250 03 To other makers 941 900 (44) Amlodipine 2940 2900 (14) Lansoprazole 2163 1900 (122) Donepezil 1557 1350 (133) Rabeprazole 1558 1350 (134) Limaprost Alfadex 1427 1350 (55) Pravastatine 1147 1100 (41) Voglibose 870 750 (139) Others 18449 19450 54 Proprietary products 2038 1650 (190) Uralyt 1225 1070 (127) Soleton 598 400 (331) Calvan 214 180 (162) Chemiphar ODM Generics (yenmn) FY2017 FY2018 (Forecast) Amount Amount YOY () Total 31100 31350 08 Generics 30115 30150 01 Generics (ODM) 985 1200 218
Income Statement Overview (yenmn) FY2017 FY2018 (Forecast) of of YOY Amount Sales Amount Sales () Net Sales 35331 1000 35500 1000 05 Pharmaceuticals 34279 970 ― ― ― Others 1051 30 ― ― ― Cost of sales 19535 553 ― ― ― SGampA expenses 13947 395 ― ― ― RampD expenses 2280 65 2700 76 184 Operating income 1848 0 52 1100 31 (405) Income before income taxes and minority interests 1777 80 ― ― ― Net income attributble to owners of the parent 1160 33 500 14 (569)
Capital Expenditure and Other (yenmn) Items FY2016 FY2017 Usage Amount Amount YOY () Forecast Rate () Capital expenditure 2928 1645 (438) 1650 997 Depreciation and amortization 1112 1192 72 1250 954 Revised forecast issued on October 31 2017
Cash Flow Statements (yenmn) FY2016 FY2017 Amount Amount Net cash Provided by operating activities 2737 3188 Used in investing activities (2504) (1606) Used in financing activities 787 (1741) Cash and cash equivalents 8084 7890 Free cash flow 232 1582
Per Share Information (yen) FY2016 FY2017 Amount Amount Change Forecast Earnings per share 53002 31528 (21474) 30673 Book value per share 454880 485986 31106 ― Dividend per share 10000 10000 ― 10000 Dividend payout ratio () 189 317 ― 326 Revised forecast issued on October 31 2017
Balance Sheet Data (yenmn) March 31 2017 August 31 2017 March 31 2015 Amount Amount Change Total assets 47002 46814 3358 (187) Return on assets () 63 36 -06 (27) Net assets 17355 17487 1313 132 Owned capital 17346 17474 1312 127 Capital-to-asset ratio () 369 373 02 +04 Return on equity () 123 67 (01) (56) Current assets 29009 28334 1630 (674) Current liabilities 14939 14914 (716) (25) Current ratio (x) 194 19 019 004
By Main Therapeutic Categories () FY2016 FY2017 Cardiovascular and respiratory drugs 309 320 Digestive organ drugs 196 183 Agents affecting metabolism 164 165 Drugs for nervous system sensory organs 99 91 Antibiotics and chemotherapeutic drugs 65 62 Antineoplastic agents 32 34 Others 135 145
Sales Distribution By Launch Year (yenmn) FY2016 FY2017 Fiscal Year Amount Distrib () Amount Distrib () YOY () 2010 and before 19487 1 667 19194 637 (15) 2009 2011 2348 0 80 2210 73 (59) 2012 1484 0 51 1404 47 (54) 2013 2917 0 100 3127 104 72 2014 1746 0 60 1937 64 110 2015 1001 0 34 1222 41 221 2016 219 0 08 459 15 1091 2017 ― ― ― 558 19 ― Total 29204 1 1000 30115 1000 31
Generics Proprietary Products (yenmn) FY2016 FY2017 Distrib Distrib YOY Achieved Amount () Amount () () Forecast () Total 31513 1 1000 32153 1 1000 20 32000 1005 Generics 29204 1 927 30115 1 937 31 30000 1 1004 To medical institutions 27808 29174 49 29100 1 1003 To other makers 1395 941 (326) 900 1 1046 Amlodipine 2865 2940 26 2900 1 1014 Lansoprazole 2279 2163 (51) 2100 1 1030 Donepezil 1642 1557 (52) 1600 1 973 Rabeprazole 1586 1558 (18) 1600 1 974 Limaprost Alfadex 1469 1427 (28) 1400 1 1020 Pravastatine 1173 1147 (22) 1100 1 1043 Voglibose 957 870 (91) 900 1 967 Others 17229 18449 71 18400 1 1003 Proprietary products 2308 0 73 2038 0 63 (117) 2000 1 1019 Uralyt 1409 1225 (131) 1200 1 1021 Soleton 679 598 (120) 600 1 997 Calvan 219 214 (21) 200 1 1074 Chemiphar ODM Generics (yenmn) FY2016 FY2017 Distrib Distrib YOY Achieved Amount () Amount () () Forecast () Total 30445 1000 31100 1000 22 31400 990 Generics 29204 959 30115 968 31 30000 1004 Generics (ODM) 1240 41 985 32 (206) 1400 704 Includes exports Revised forecast issued on October 31 2017
Income Statement Overview (yenmn) FY2016 FY2017 of of YOY Achieved Amount Sales Amount Sales () Forecast () Net Sales 35689 1 1000 35331 1 1000 (10) 35500 1 995 Pharmaceuticals 34551 1 968 34279 1 970 (08) ― ― ― Others 1137 0 32 1051 0 30 (76) ― ― ― Cost of sales 19449 1 545 19535 1 553 04 ― ― ― SGampA expenses 13403 0 376 13947 0 395 41 ― ― ― RampD expenses 1984 0 56 2280 0 65 150 2200 0 1037 Operating income 2836 0 79 1848 0 52 (348) 1800 0 1027 Income before income taxes and minority interests 2849 0 80 1696 0 48 (405) 1700 ― 998 Net income attributble to owners of the parent 2054 0 58 1160 0 33 (435) 1150 ― 1009 1961 00550933658 00550933658 00575628587 Revised forecast issued on October 31 2017
Per Share Information (yen) FY2017 FY2018 (Forecast) Amount Amount YOY () Earnings per share 31528 13584 (569) Book value per share 485986 ― ― Dividends per share 10000 7500 ― Dividend payout ratio() 317 552 ― Capital Expenditure and Other (yenmn) FY2017 FY2018 (Forecast) Amount Amount Change Capital expenditure 1645 950 (695) Depreciation and amortization 1192 1350 157 2015年3月期 ガツキ 2016年3月期(予想) ガツキ ヨソウ 金額 キンガク 金額 キンガク 増減額 ゾウゲンガク 増減率 ゾウゲン リツ 医療用医薬品 イリョウヨウ イヤクヒン 27400 30950 +05 ジェネリック医薬品(荷離) イヤクヒン ニ バナレ 25079 27430 +01 内自社販売 ウチ ジシャ ハンバイ 2321 25100 +01 内導出輸出 ウチ ドウシュツ ユシュツ 3011 2330 +04 アムロジピン 1935 3040 +09 ランソプラゾール 1509 1890 24 プラバスタチン 1595 1570 +40 ラベプラゾール 1704 1570 16 リマプロストアルファデクス 1273 1660 26 ボグリボース 1013 1300 +21 ドネペジル 15357 1030 +16 その他 タ 3400 15370 +01 主力品 シュリョク ヒン 1975 3520 +35 ウラリット 1134 1970 03 ソレトン 290 1250 +102 カルバン 0 300 +34 ジェネリック医薬品事業 イヤクヒン ジギョウ 2015年3月期 ガツキ 2016年3月期(予想) ガツキ ヨソウ 金額 キンガク 金額 キンガク 増減額 ゾウゲンガク 増減率 ゾウゲン リツ ジェネリック医薬品事業 イヤクヒン ジギョウ 28918 28840 +1003 ジェネリック医薬品(荷離) イヤクヒン ニ バナレ 27400 27430 +999 受託 ジュタク 1518 1410 +1077
Generics Proprietary Products (yenmn) FY2017 FY2018 (Forecast) Amount Amount YOY () Total 32153 31800 (11) Generics 30115 30150 01 To medical institutions 29174 29250 03 To other makers 941 900 (44) Amlodipine 2940 2900 (14) Lansoprazole 2163 1900 (122) Donepezil 1557 1350 (133) Rabeprazole 1558 1350 (134) Limaprost Alfadex 1427 1350 (55) Pravastatine 1147 1100 (41) Voglibose 870 750 (139) Others 18449 19450 54 Proprietary products 2038 1650 (190) Uralyt 1225 1070 (127) Soleton 598 400 (331) Calvan 214 180 (162) Chemiphar ODM Generics (yenmn) FY2017 FY2018 (Forecast) Amount Amount YOY () Total 31100 31350 08 Generics 30115 30150 01 Generics (ODM) 985 1200 218
Income Statement Overview (yenmn) FY2017 FY2018 (Forecast) of of YOY Amount Sales Amount Sales () Net Sales 35331 1000 35500 1000 05 Pharmaceuticals 34279 970 ― ― ― Others 1051 30 ― ― ― Cost of sales 19535 553 ― ― ― SGampA expenses 13947 395 ― ― ― RampD expenses 2280 65 2700 76 184 Operating income 1848 0 52 1100 31 (405) Income before income taxes and minority interests 1777 80 ― ― ― Net income attributble to owners of the parent 1160 33 500 14 (569)
Capital Expenditure and Other (yenmn) Items FY2016 FY2017 Usage Amount Amount YOY () Forecast Rate () Capital expenditure 2928 1645 (438) 1650 997 Depreciation and amortization 1112 1192 72 1250 954 Revised forecast issued on October 31 2017
Cash Flow Statements (yenmn) FY2016 FY2017 Amount Amount Net cash Provided by operating activities 2737 3188 Used in investing activities (2504) (1606) Used in financing activities 787 (1741) Cash and cash equivalents 8084 7890 Free cash flow 232 1582
Per Share Information (yen) FY2016 FY2017 Amount Amount Change Forecast Earnings per share 53002 31528 (21474) 30673 Book value per share 454880 485986 31106 ― Dividend per share 10000 10000 ― 10000 Dividend payout ratio () 189 317 ― 326 Revised forecast issued on October 31 2017
Balance Sheet Data (yenmn) March 31 2017 August 31 2017 March 31 2015 Amount Amount Change Total assets 47002 46814 3358 (187) Return on assets () 63 36 -06 (27) Net assets 17355 17487 1313 132 Owned capital 17346 17474 1312 127 Capital-to-asset ratio () 369 373 02 +04 Return on equity () 123 67 (01) (56) Current assets 29009 28334 1630 (674) Current liabilities 14939 14914 (716) (25) Current ratio (x) 194 19 019 004
By Main Therapeutic Categories () FY2016 FY2017 Cardiovascular and respiratory drugs 309 320 Digestive organ drugs 196 183 Agents affecting metabolism 164 165 Drugs for nervous system sensory organs 99 91 Antibiotics and chemotherapeutic drugs 65 62 Antineoplastic agents 32 34 Others 135 145
Sales Distribution By Launch Year (yenmn) FY2016 FY2017 Fiscal Year Amount Distrib () Amount Distrib () YOY () 2010 and before 19487 1 667 19194 637 (15) 2009 2011 2348 0 80 2210 73 (59) 2012 1484 0 51 1404 47 (54) 2013 2917 0 100 3127 104 72 2014 1746 0 60 1937 64 110 2015 1001 0 34 1222 41 221 2016 219 0 08 459 15 1091 2017 ― ― ― 558 19 ― Total 29204 1 1000 30115 1000 31
Generics Proprietary Products (yenmn) FY2016 FY2017 Distrib Distrib YOY Achieved Amount () Amount () () Forecast () Total 31513 1 1000 32153 1 1000 20 32000 1005 Generics 29204 1 927 30115 1 937 31 30000 1 1004 To medical institutions 27808 29174 49 29100 1 1003 To other makers 1395 941 (326) 900 1 1046 Amlodipine 2865 2940 26 2900 1 1014 Lansoprazole 2279 2163 (51) 2100 1 1030 Donepezil 1642 1557 (52) 1600 1 973 Rabeprazole 1586 1558 (18) 1600 1 974 Limaprost Alfadex 1469 1427 (28) 1400 1 1020 Pravastatine 1173 1147 (22) 1100 1 1043 Voglibose 957 870 (91) 900 1 967 Others 17229 18449 71 18400 1 1003 Proprietary products 2308 0 73 2038 0 63 (117) 2000 1 1019 Uralyt 1409 1225 (131) 1200 1 1021 Soleton 679 598 (120) 600 1 997 Calvan 219 214 (21) 200 1 1074 Chemiphar ODM Generics (yenmn) FY2016 FY2017 Distrib Distrib YOY Achieved Amount () Amount () () Forecast () Total 30445 1000 31100 1000 22 31400 990 Generics 29204 959 30115 968 31 30000 1004 Generics (ODM) 1240 41 985 32 (206) 1400 704 Includes exports Revised forecast issued on October 31 2017
Income Statement Overview (yenmn) FY2016 FY2017 of of YOY Achieved Amount Sales Amount Sales () Forecast () Net Sales 35689 1 1000 35331 1 1000 (10) 35500 1 995 Pharmaceuticals 34551 1 968 34279 1 970 (08) ― ― ― Others 1137 0 32 1051 0 30 (76) ― ― ― Cost of sales 19449 1 545 19535 1 553 04 ― ― ― SGampA expenses 13403 0 376 13947 0 395 41 ― ― ― RampD expenses 1984 0 56 2280 0 65 150 2200 0 1037 Operating income 2836 0 79 1848 0 52 (348) 1800 0 1027 Income before income taxes and minority interests 2849 0 80 1696 0 48 (405) 1700 ― 998 Net income attributble to owners of the parent 2054 0 58 1160 0 33 (435) 1150 ― 1009 1961 00550933658 00550933658 00575628587 Revised forecast issued on October 31 2017
Per Share Information (yen) FY2017 FY2018 (Forecast) Amount Amount YOY () Earnings per share 31528 13584 (569) Book value per share 485986 ― ― Dividends per share 10000 7500 ― Dividend payout ratio() 317 552 ― Capital Expenditure and Other (yenmn) FY2017 FY2018 (Forecast) Amount Amount Change Capital expenditure 1645 950 (695) Depreciation and amortization 1192 1350 157 2015年3月期 ガツキ 2016年3月期(予想) ガツキ ヨソウ 金額 キンガク 金額 キンガク 増減額 ゾウゲンガク 増減率 ゾウゲン リツ 医療用医薬品 イリョウヨウ イヤクヒン 27400 30950 +05 ジェネリック医薬品(荷離) イヤクヒン ニ バナレ 25079 27430 +01 内自社販売 ウチ ジシャ ハンバイ 2321 25100 +01 内導出輸出 ウチ ドウシュツ ユシュツ 3011 2330 +04 アムロジピン 1935 3040 +09 ランソプラゾール 1509 1890 24 プラバスタチン 1595 1570 +40 ラベプラゾール 1704 1570 16 リマプロストアルファデクス 1273 1660 26 ボグリボース 1013 1300 +21 ドネペジル 15357 1030 +16 その他 タ 3400 15370 +01 主力品 シュリョク ヒン 1975 3520 +35 ウラリット 1134 1970 03 ソレトン 290 1250 +102 カルバン 0 300 +34 ジェネリック医薬品事業 イヤクヒン ジギョウ 2015年3月期 ガツキ 2016年3月期(予想) ガツキ ヨソウ 金額 キンガク 金額 キンガク 増減額 ゾウゲンガク 増減率 ゾウゲン リツ ジェネリック医薬品事業 イヤクヒン ジギョウ 28918 28840 +1003 ジェネリック医薬品(荷離) イヤクヒン ニ バナレ 27400 27430 +999 受託 ジュタク 1518 1410 +1077
Generics Proprietary Products (yenmn) FY2017 FY2018 (Forecast) Amount Amount YOY () Total 32153 31800 (11) Generics 30115 30150 01 To medical institutions 29174 29250 03 To other makers 941 900 (44) Amlodipine 2940 2900 (14) Lansoprazole 2163 1900 (122) Donepezil 1557 1350 (133) Rabeprazole 1558 1350 (134) Limaprost Alfadex 1427 1350 (55) Pravastatine 1147 1100 (41) Voglibose 870 750 (139) Others 18449 19450 54 Proprietary products 2038 1650 (190) Uralyt 1225 1070 (127) Soleton 598 400 (331) Calvan 214 180 (162) Chemiphar ODM Generics (yenmn) FY2017 FY2018 (Forecast) Amount Amount YOY () Total 31100 31350 08 Generics 30115 30150 01 Generics (ODM) 985 1200 218
Income Statement Overview (yenmn) FY2017 FY2018 (Forecast) of of YOY Amount Sales Amount Sales () Net Sales 35331 1000 35500 1000 05 Pharmaceuticals 34279 970 ― ― ― Others 1051 30 ― ― ― Cost of sales 19535 553 ― ― ― SGampA expenses 13947 395 ― ― ― RampD expenses 2280 65 2700 76 184 Operating income 1848 0 52 1100 31 (405) Income before income taxes and minority interests 1777 50 ― ― ― Net income attributble to owners of the parent 1160 33 500 14 (569)
Capital Expenditure and Other (yenmn) Items FY2016 FY2017 Usage Amount Amount YOY () Forecast Rate () Capital expenditure 2928 1645 (438) 1650 997 Depreciation and amortization 1112 1192 72 1250 954 Revised forecast issued on October 31 2017
Cash Flow Statements (yenmn) FY2016 FY2017 Amount Amount Net cash Provided by operating activities 2737 3188 Used in investing activities (2504) (1606) Used in financing activities 787 (1741) Cash and cash equivalents 8084 7890 Free cash flow 232 1582
Per Share Information (yen) FY2016 FY2017 Amount Amount Change Forecast Earnings per share 53002 31528 (21474) 30673 Book value per share 454880 485986 31106 ― Dividend per share 10000 10000 ― 10000 Dividend payout ratio () 189 317 ― 326 Revised forecast issued on October 31 2017
Balance Sheet Data (yenmn) March 31 2017 March 31 2018 March 31 2015 Amount Amount Change Total assets 47002 46814 3358 (187) Return on assets () 63 36 -06 (27) Net assets 17355 17487 1313 132 Owned capital 17346 17474 1312 127 Capital-to-asset ratio () 369 373 02 04 Return on equity () 123 67 (01) (56) Current assets 29009 28334 1630 (674) Current liabilities 14939 14914 (716) (25) Current ratio (x) 194 19 019 (004)
By Main Therapeutic Categories () FY2016 FY2017 Cardiovascular and respiratory drugs 309 320 Digestive organ drugs 196 183 Agents affecting metabolism 164 165 Drugs for nervous system sensory organs 99 91 Antibiotics and chemotherapeutic drugs 65 62 Antineoplastic agents 32 34 Others 135 145
Sales Distribution By Launch Year (yenmn) FY2016 FY2017 Fiscal Year Amount Distrib () Amount Distrib () YOY () 2010 and before 19487 1 667 19194 637 (15) 2009 2011 2348 0 80 2210 73 (59) 2012 1484 0 51 1404 47 (54) 2013 2917 0 100 3127 104 72 2014 1746 0 60 1937 64 110 2015 1001 0 34 1222 41 221 2016 219 0 08 459 15 1091 2017 ― ― 558 19 ― Total 29204 1 1000 30115 1000 31
Generics Proprietary Products (yenmn) FY2016 FY2017 Distrib Distrib YOY Achieved Amount () Amount () () Forecast () Total 31513 1 1000 32153 1 1000 20 32000 1005 Generics 29204 1 927 30115 1 937 31 30000 1 1004 To medical institutions 27808 29174 49 29100 1 1003 To other makers 1395 941 (326) 900 1 1046 Amlodipine 2865 2940 26 2900 1 1014 Lansoprazole 2279 2163 (51) 2100 1 1030 Donepezil 1642 1557 (52) 1600 1 973 Rabeprazole 1586 1558 (18) 1600 1 974 Limaprost Alfadex 1469 1427 (28) 1400 1 1020 Pravastatine 1173 1147 (22) 1100 1 1043 Voglibose 957 870 (91) 900 1 967 Others 17229 18449 71 18400 1 1003 Proprietary products 2308 0 73 2038 0 63 (117) 2000 1 1019 Uralyt 1409 1225 (131) 1200 1 1021 Soleton 679 598 (120) 600 1 997 Calvan 219 214 (21) 200 1 1074 Chemiphar ODM Generics (yenmn) FY2016 FY2017 Distrib Distrib YOY Achieved Amount () Amount () () Forecast () Total 30445 1000 31100 1000 22 31400 990 Generics 29204 959 30115 968 31 30000 1004 Generics (ODM) 1240 41 985 32 (206) 1400 704 Includes exports Revised forecast issued on October 31 2017
Income Statement Overview (yenmn) FY2016 FY2017 of of YOY Achieved Amount Sales Amount Sales () Forecast () Net Sales 35689 1 1000 35331 1 1000 (10) 35500 1 995 Pharmaceuticals 34551 1 968 34279 1 970 (08) ― ― Others 1137 0 32 1051 0 30 (76) ― ― Cost of sales 19449 1 545 19535 1 553 04 ― ― SGampA expenses 13403 0 376 13947 0 395 41 ― ― RampD expenses 1984 0 56 2280 0 65 150 2200 0 1037 Operating income 2836 0 79 1848 0 52 (348) 1800 0 1027 Income before income taxes and minority interests 2849 0 80 1777 0 50 (376) ― ― Net income attributble to owners of the parent 2054 0 58 1160 0 33 (435) 1150 ― 1009 1961 00550933658 00550933658 00575628587 Revised forecast issued on October 31 2017
Page 10
Sales Income
9
(yenmn)
of of YOYAmount Sales Amount Sales ()
Net Sales 35331 1000 35500 1000 05 Pharmaceuticals 34279 970 ― ― ― Others 1051 30 ― ― ―Cost of sales 19535 553 ― ― ―SGampA expenses 13947 395 ― ― ― RampD expenses 2280 65 2700 76 184Operating income 1848 52 1100 31 (405)
1777 50 ― ― ―
1160 33 500 14 (569)Net income attributble to owners of the parent
FY2018 (Forecast)FY2017
Income before income taxes and minority interests
Annual ForecastSales and profit in FY2018 will be impacted by NHI drug price revisions On the other hand however due to our focus on newly launched products and expansion of new sales channels sales of generic drugs are expected to be nearly flat compared to the previous fiscal year As a result consolidated net sales including other businesses such as contracted testing business are projected to be yen35500 million (up 05 YOY)
Regarding profits due to increased development costs as the progress in new drug development and continued strategic expenses such as trial costs leading up to the commencement of commercial production at the Vietnam factory operating income is forecast at yen1100 million (down 405 YOY) and net income attributable to owners of the parent is expected to be yen500 million (down 569 YOY)
PL 医薬品① 医薬品② 医薬品③ BS① BS③ 和文にある「前年同期間比」「前期3月末比」は記載が難しく英語版では必要度の低い情報であるとみなして記載をしないこととなった2016年2Q~(木村)ただし期末では記載が可能なので書きます(須田)
CF CAP EX 業績予想① 英語版では経常利益は書かないので注意(須田)
業績予想 ② 業績予想③ Pharmaceutical Sales
10
Generics Proprietary Products (yenmn)FY2017Amount Amount YOY ()
Total 32153 31800 (11) Generics 30115 30150 01 To medical institutions 29174 29250 03 To other makers 941 900 (44) Amlodipine 2940 2900 (14) Lansoprazole 2163 1900 (122) Donepezil 1557 1350 (133) Rabeprazole 1558 1350 (134) Limaprost Alfadex 1427 1350 (55) Pravastatine 1147 1100 (41) Voglibose 870 750 (139) Others 18449 19450 54 Proprietary products 2038 1650 (190) Uralyt 1225 1070 (127) Soleton 598 400 (331) Calvan 214 180 (162)
Chemiphar ODM Generics (yenmn)FY2017Amount Amount YOY ()
Total 31100 31350 08 Generics 30115 30150 01 Generics (ODM) 985 1200 218
FY2018 (Forecast)
FY2018 (Forecast)
PL 医薬品① 医薬品② 医薬品③ BS① BS③ 和文にある「前年同期間比」「前期3月末比」は記載が難しく英語版では必要度の低い情報であるとみなして記載をしないこととなった2016年2Q~(木村)ただし期末では記載が可能なので書きます(須田)
CF CAP EX 業績予想① 英語版では経常利益は書かないので注意(須田)
業績予想 ② 業績予想③ Per Share Information Expenditure
11
For further information contactPublic Relations Department Nippon Chemiphar Co LtdE-mail irchemipharcojp
Note about Forward-looking Statements and ForecastsStatements made in this Highlights of Business Results with respect to current plans estimates strategies and beliefs and other statements of Nippon Chemiphar that are not historical facts are forward-looking statements about the future performance of Nippon Chemiphar
These statements are based on managementrsquos current assumptions and beliefs in light of the information currently available to it and involve known and unknown risks and uncertainties Consequently undue reliance should not be placed on these statements
Nippon Chemiphar cautions the reader that a number of important factors could cause actual results to differ materially from those discussed in the forward-looking statements
Per Share Information (yen)FY2017Amount Amount YOY ()
Earnings per share 31528 13584 (569)Book value per share 485986 ― ―Dividends per share 10000 7500 ―Dividend payout ratio () 317 552 ―
Capital Expenditure and Other (yenmn)FY2017Amount Amount Change
Capital expenditure 1645 950 (695)Depreciation and amortization 1192 1350 157
FY2018 (Forecast)
FY2018 (Forecast)
Dividend ForecastAs mentioned above we are forecasting a decline in profit in FY2018 due to the influence of NHI drug price revisions ongoing strategic spending including new drug development expenses and start-up expenses at the Vietnam factory Thus we expect to pay a dividend per share of 75 yen (down 25 yen per share YOY) with a payout ratio of 552
PL 医薬品① 医薬品② 医薬品③ BS① BS③ 和文にある「前年同期間比」「前期3月末比」は記載が難しく英語版では必要度の低い情報であるとみなして記載をしないこととなった2016年2Q~(木村)ただし期末では記載が可能なので書きます(須田)
CF CAP EX 業績予想① 英語版では経常利益は書かないので注意(須田)
業績予想 ② 業績予想③ スライド番号 1 Contents スライド番号 3 Sales Income Pharmaceutical Sales Sales Distribution Balance Sheet per Share Information Cash Flow Expenditure スライド番号 9 Sales Income Pharmaceutical Sales Per Share Information Expenditure Per Share Information (yen) FY2017 FY2018 (Forecast) Amount Amount YOY () Earnings per share 31528 13584 (569) Book value per share 485986 ― ― Dividends per share 10000 7500 ― Dividend payout ratio () 317 552 ― Capital Expenditure and Other (yenmn) FY2017 FY2018 (Forecast) Amount Amount Change Capital expenditure 1645 950 (695) Depreciation and amortization 1192 1350 157 2015年3月期 ガツキ 2016年3月期(予想) ガツキ ヨソウ 金額 キンガク 金額 キンガク 増減額 ゾウゲンガク 増減率 ゾウゲン リツ 医療用医薬品 イリョウヨウ イヤクヒン 27400 30950 +05 ジェネリック医薬品(荷離) イヤクヒン ニ バナレ 25079 27430 +01 内自社販売 ウチ ジシャ ハンバイ 2321 25100 +01 内導出輸出 ウチ ドウシュツ ユシュツ 3011 2330 +04 アムロジピン 1935 3040 +09 ランソプラゾール 1509 1890 24 プラバスタチン 1595 1570 +40 ラベプラゾール 1704 1570 16 リマプロストアルファデクス 1273 1660 26 ボグリボース 1013 1300 +21 ドネペジル 15357 1030 +16 その他 タ 3400 15370 +01 主力品 シュリョク ヒン 1975 3520 +35 ウラリット 1134 1970 03 ソレトン 290 1250 +102 カルバン 0 300 +34 ジェネリック医薬品事業 イヤクヒン ジギョウ 2015年3月期 ガツキ 2016年3月期(予想) ガツキ ヨソウ 金額 キンガク 金額 キンガク 増減額 ゾウゲンガク 増減率 ゾウゲン リツ ジェネリック医薬品事業 イヤクヒン ジギョウ 28918 28840 +1003 ジェネリック医薬品(荷離) イヤクヒン ニ バナレ 27400 27430 +999 受託 ジュタク 1518 1410 +1077
Generics Proprietary Products (yenmn) FY2017 FY2018 (Forecast) Amount Amount YOY () Total 32153 31800 (11) Generics 30115 30150 01 To medical institutions 29174 29250 03 To other makers 941 900 (44) Amlodipine 2940 2900 (14) Lansoprazole 2163 1900 (122) Donepezil 1557 1350 (133) Rabeprazole 1558 1350 (134) Limaprost Alfadex 1427 1350 (55) Pravastatine 1147 1100 (41) Voglibose 870 750 (139) Others 18449 19450 54 Proprietary products 2038 1650 (190) Uralyt 1225 1070 (127) Soleton 598 400 (331) Calvan 214 180 (162) Chemiphar ODM Generics (yenmn) FY2017 FY2018 (Forecast) Amount Amount YOY () Total 31100 31350 08 Generics 30115 30150 01 Generics (ODM) 985 1200 218
Income Statement Overview (yenmn) FY2017 FY2018 (Forecast) of of YOY Amount Sales Amount Sales () Net Sales 35331 1000 35500 1000 05 Pharmaceuticals 34279 970 ― ― ― Others 1051 30 ― ― ― Cost of sales 19535 553 ― ― ― SGampA expenses 13947 395 ― ― ― RampD expenses 2280 65 2700 76 184 Operating income 1848 0 52 1100 31 (405) Income before income taxes and minority interests 1777 80 ― ― ― Net income attributble to owners of the parent 1160 33 500 14 (569)
Capital Expenditure and Other (yenmn) Items FY2016 FY2017 Usage Amount Amount YOY () Forecast Rate () Capital expenditure 2928 1645 (438) 1650 997 Depreciation and amortization 1112 1192 72 1250 954 Revised forecast issued on October 31 2017
Cash Flow Statements (yenmn) FY2016 FY2017 Amount Amount Net cash Provided by operating activities 2737 3188 Used in investing activities (2504) (1606) Used in financing activities 787 (1741) Cash and cash equivalents 8084 7890 Free cash flow 232 1582
Per Share Information (yen) FY2016 FY2017 Amount Amount Change Forecast Earnings per share 53002 31528 (21474) 30673 Book value per share 454880 485986 31106 ― Dividend per share 10000 10000 ― 10000 Dividend payout ratio () 189 317 ― 326 Revised forecast issued on October 31 2017
Balance Sheet Data (yenmn) March 31 2017 August 31 2017 March 31 2015 Amount Amount Change Total assets 47002 46814 3358 (187) Return on assets () 63 36 -06 (27) Net assets 17355 17487 1313 132 Owned capital 17346 17474 1312 127 Capital-to-asset ratio () 369 373 02 +04 Return on equity () 123 67 (01) (56) Current assets 29009 28334 1630 (674) Current liabilities 14939 14914 (716) (25) Current ratio (x) 194 19 019 004
By Main Therapeutic Categories () FY2016 FY2017 Cardiovascular and respiratory drugs 309 320 Digestive organ drugs 196 183 Agents affecting metabolism 164 165 Drugs for nervous system sensory organs 99 91 Antibiotics and chemotherapeutic drugs 65 62 Antineoplastic agents 32 34 Others 135 145
Sales Distribution By Launch Year (yenmn) FY2016 FY2017 Fiscal Year Amount Distrib () Amount Distrib () YOY () 2010 and before 19487 1 667 19194 637 (15) 2009 2011 2348 0 80 2210 73 (59) 2012 1484 0 51 1404 47 (54) 2013 2917 0 100 3127 104 72 2014 1746 0 60 1937 64 110 2015 1001 0 34 1222 41 221 2016 219 0 08 459 15 1091 2017 ― ― ― 558 19 ― Total 29204 1 1000 30115 1000 31
Generics Proprietary Products (yenmn) FY2016 FY2017 Distrib Distrib YOY Achieved Amount () Amount () () Forecast () Total 31513 1 1000 32153 1 1000 20 32000 1005 Generics 29204 1 927 30115 1 937 31 30000 1 1004 To medical institutions 27808 29174 49 29100 1 1003 To other makers 1395 941 (326) 900 1 1046 Amlodipine 2865 2940 26 2900 1 1014 Lansoprazole 2279 2163 (51) 2100 1 1030 Donepezil 1642 1557 (52) 1600 1 973 Rabeprazole 1586 1558 (18) 1600 1 974 Limaprost Alfadex 1469 1427 (28) 1400 1 1020 Pravastatine 1173 1147 (22) 1100 1 1043 Voglibose 957 870 (91) 900 1 967 Others 17229 18449 71 18400 1 1003 Proprietary products 2308 0 73 2038 0 63 (117) 2000 1 1019 Uralyt 1409 1225 (131) 1200 1 1021 Soleton 679 598 (120) 600 1 997 Calvan 219 214 (21) 200 1 1074 Chemiphar ODM Generics (yenmn) FY2016 FY2017 Distrib Distrib YOY Achieved Amount () Amount () () Forecast () Total 30445 1000 31100 1000 22 31400 990 Generics 29204 959 30115 968 31 30000 1004 Generics (ODM) 1240 41 985 32 (206) 1400 704 Includes exports Revised forecast issued on October 31 2017
Income Statement Overview (yenmn) FY2016 FY2017 of of YOY Achieved Amount Sales Amount Sales () Forecast () Net Sales 35689 1 1000 35331 1 1000 (10) 35500 1 995 Pharmaceuticals 34551 1 968 34279 1 970 (08) ― ― ― Others 1137 0 32 1051 0 30 (76) ― ― ― Cost of sales 19449 1 545 19535 1 553 04 ― ― ― SGampA expenses 13403 0 376 13947 0 395 41 ― ― ― RampD expenses 1984 0 56 2280 0 65 150 2200 0 1037 Operating income 2836 0 79 1848 0 52 (348) 1800 0 1027 Income before income taxes and minority interests 2849 0 80 1696 0 48 (405) 1700 ― 998 Net income attributble to owners of the parent 2054 0 58 1160 0 33 (435) 1150 ― 1009 1961 00550933658 00550933658 00575628587 Revised forecast issued on October 31 2017
Per Share Information (yen) FY2017 FY2018 (Forecast) Amount Amount YOY () Earnings per share 31528 13584 (569) Book value per share 485986 ― ― Dividends per share 10000 7500 ― Dividend payout ratio() 317 552 ― Capital Expenditure and Other (yenmn) FY2017 FY2018 (Forecast) Amount Amount Change Capital expenditure 1645 950 (695) Depreciation and amortization 1192 1350 157 2015年3月期 ガツキ 2016年3月期(予想) ガツキ ヨソウ 金額 キンガク 金額 キンガク 増減額 ゾウゲンガク 増減率 ゾウゲン リツ 医療用医薬品 イリョウヨウ イヤクヒン 27400 30950 +05 ジェネリック医薬品(荷離) イヤクヒン ニ バナレ 25079 27430 +01 内自社販売 ウチ ジシャ ハンバイ 2321 25100 +01 内導出輸出 ウチ ドウシュツ ユシュツ 3011 2330 +04 アムロジピン 1935 3040 +09 ランソプラゾール 1509 1890 24 プラバスタチン 1595 1570 +40 ラベプラゾール 1704 1570 16 リマプロストアルファデクス 1273 1660 26 ボグリボース 1013 1300 +21 ドネペジル 15357 1030 +16 その他 タ 3400 15370 +01 主力品 シュリョク ヒン 1975 3520 +35 ウラリット 1134 1970 03 ソレトン 290 1250 +102 カルバン 0 300 +34 ジェネリック医薬品事業 イヤクヒン ジギョウ 2015年3月期 ガツキ 2016年3月期(予想) ガツキ ヨソウ 金額 キンガク 金額 キンガク 増減額 ゾウゲンガク 増減率 ゾウゲン リツ ジェネリック医薬品事業 イヤクヒン ジギョウ 28918 28840 +1003 ジェネリック医薬品(荷離) イヤクヒン ニ バナレ 27400 27430 +999 受託 ジュタク 1518 1410 +1077
Generics Proprietary Products (yenmn) FY2017 FY2018 (Forecast) Amount Amount YOY () Total 32153 31800 (11) Generics 30115 30150 01 To medical institutions 29174 29250 03 To other makers 941 900 (44) Amlodipine 2940 2900 (14) Lansoprazole 2163 1900 (122) Donepezil 1557 1350 (133) Rabeprazole 1558 1350 (134) Limaprost Alfadex 1427 1350 (55) Pravastatine 1147 1100 (41) Voglibose 870 750 (139) Others 18449 19450 54 Proprietary products 2038 1650 (190) Uralyt 1225 1070 (127) Soleton 598 400 (331) Calvan 214 180 (162) Chemiphar ODM Generics (yenmn) FY2017 FY2018 (Forecast) Amount Amount YOY () Total 31100 31350 08 Generics 30115 30150 01 Generics (ODM) 985 1200 218
Income Statement Overview (yenmn) FY2017 FY2018 (Forecast) of of YOY Amount Sales Amount Sales () Net Sales 35331 1000 35500 1000 05 Pharmaceuticals 34279 970 ― ― ― Others 1051 30 ― ― ― Cost of sales 19535 553 ― ― ― SGampA expenses 13947 395 ― ― ― RampD expenses 2280 65 2700 76 184 Operating income 1848 0 52 1100 31 (405) Income before income taxes and minority interests 1777 80 ― ― ― Net income attributble to owners of the parent 1160 33 500 14 (569)
Capital Expenditure and Other (yenmn) Items FY2016 FY2017 Usage Amount Amount YOY () Forecast Rate () Capital expenditure 2928 1645 (438) 1650 997 Depreciation and amortization 1112 1192 72 1250 954 Revised forecast issued on October 31 2017
Cash Flow Statements (yenmn) FY2016 FY2017 Amount Amount Net cash Provided by operating activities 2737 3188 Used in investing activities (2504) (1606) Used in financing activities 787 (1741) Cash and cash equivalents 8084 7890 Free cash flow 232 1582
Per Share Information (yen) FY2016 FY2017 Amount Amount Change Forecast Earnings per share 53002 31528 (21474) 30673 Book value per share 454880 485986 31106 ― Dividend per share 10000 10000 ― 10000 Dividend payout ratio () 189 317 ― 326 Revised forecast issued on October 31 2017
Balance Sheet Data (yenmn) March 31 2017 August 31 2017 March 31 2015 Amount Amount Change Total assets 47002 46814 3358 (187) Return on assets () 63 36 -06 (27) Net assets 17355 17487 1313 132 Owned capital 17346 17474 1312 127 Capital-to-asset ratio () 369 373 02 +04 Return on equity () 123 67 (01) (56) Current assets 29009 28334 1630 (674) Current liabilities 14939 14914 (716) (25) Current ratio (x) 194 19 019 004
By Main Therapeutic Categories () FY2016 FY2017 Cardiovascular and respiratory drugs 309 320 Digestive organ drugs 196 183 Agents affecting metabolism 164 165 Drugs for nervous system sensory organs 99 91 Antibiotics and chemotherapeutic drugs 65 62 Antineoplastic agents 32 34 Others 135 145
Sales Distribution By Launch Year (yenmn) FY2016 FY2017 Fiscal Year Amount Distrib () Amount Distrib () YOY () 2010 and before 19487 1 667 19194 637 (15) 2009 2011 2348 0 80 2210 73 (59) 2012 1484 0 51 1404 47 (54) 2013 2917 0 100 3127 104 72 2014 1746 0 60 1937 64 110 2015 1001 0 34 1222 41 221 2016 219 0 08 459 15 1091 2017 ― ― ― 558 19 ― Total 29204 1 1000 30115 1000 31
Generics Proprietary Products (yenmn) FY2016 FY2017 Distrib Distrib YOY Achieved Amount () Amount () () Forecast () Total 31513 1 1000 32153 1 1000 20 32000 1005 Generics 29204 1 927 30115 1 937 31 30000 1 1004 To medical institutions 27808 29174 49 29100 1 1003 To other makers 1395 941 (326) 900 1 1046 Amlodipine 2865 2940 26 2900 1 1014 Lansoprazole 2279 2163 (51) 2100 1 1030 Donepezil 1642 1557 (52) 1600 1 973 Rabeprazole 1586 1558 (18) 1600 1 974 Limaprost Alfadex 1469 1427 (28) 1400 1 1020 Pravastatine 1173 1147 (22) 1100 1 1043 Voglibose 957 870 (91) 900 1 967 Others 17229 18449 71 18400 1 1003 Proprietary products 2308 0 73 2038 0 63 (117) 2000 1 1019 Uralyt 1409 1225 (131) 1200 1 1021 Soleton 679 598 (120) 600 1 997 Calvan 219 214 (21) 200 1 1074 Chemiphar ODM Generics (yenmn) FY2016 FY2017 Distrib Distrib YOY Achieved Amount () Amount () () Forecast () Total 30445 1000 31100 1000 22 31400 990 Generics 29204 959 30115 968 31 30000 1004 Generics (ODM) 1240 41 985 32 (206) 1400 704 Includes exports Revised forecast issued on October 31 2017
Income Statement Overview (yenmn) FY2016 FY2017 of of YOY Achieved Amount Sales Amount Sales () Forecast () Net Sales 35689 1 1000 35331 1 1000 (10) 35500 1 995 Pharmaceuticals 34551 1 968 34279 1 970 (08) ― ― ― Others 1137 0 32 1051 0 30 (76) ― ― ― Cost of sales 19449 1 545 19535 1 553 04 ― ― ― SGampA expenses 13403 0 376 13947 0 395 41 ― ― ― RampD expenses 1984 0 56 2280 0 65 150 2200 0 1037 Operating income 2836 0 79 1848 0 52 (348) 1800 0 1027 Income before income taxes and minority interests 2849 0 80 1696 0 48 (405) 1700 ― 998 Net income attributble to owners of the parent 2054 0 58 1160 0 33 (435) 1150 ― 1009 1961 00550933658 00550933658 00575628587 Revised forecast issued on October 31 2017
Per Share Information (yen) FY2017 FY2018 (Forecast) Amount Amount YOY () Earnings per share 31528 13584 (569) Book value per share 485986 ― ― Dividends per share 10000 7500 ― Dividend payout ratio() 317 552 ― Capital Expenditure and Other (yenmn) FY2017 FY2018 (Forecast) Amount Amount Change Capital expenditure 1645 950 (695) Depreciation and amortization 1192 1350 157 2015年3月期 ガツキ 2016年3月期(予想) ガツキ ヨソウ 金額 キンガク 金額 キンガク 増減額 ゾウゲンガク 増減率 ゾウゲン リツ 医療用医薬品 イリョウヨウ イヤクヒン 27400 30950 +05 ジェネリック医薬品(荷離) イヤクヒン ニ バナレ 25079 27430 +01 内自社販売 ウチ ジシャ ハンバイ 2321 25100 +01 内導出輸出 ウチ ドウシュツ ユシュツ 3011 2330 +04 アムロジピン 1935 3040 +09 ランソプラゾール 1509 1890 24 プラバスタチン 1595 1570 +40 ラベプラゾール 1704 1570 16 リマプロストアルファデクス 1273 1660 26 ボグリボース 1013 1300 +21 ドネペジル 15357 1030 +16 その他 タ 3400 15370 +01 主力品 シュリョク ヒン 1975 3520 +35 ウラリット 1134 1970 03 ソレトン 290 1250 +102 カルバン 0 300 +34 ジェネリック医薬品事業 イヤクヒン ジギョウ 2015年3月期 ガツキ 2016年3月期(予想) ガツキ ヨソウ 金額 キンガク 金額 キンガク 増減額 ゾウゲンガク 増減率 ゾウゲン リツ ジェネリック医薬品事業 イヤクヒン ジギョウ 28918 28840 +1003 ジェネリック医薬品(荷離) イヤクヒン ニ バナレ 27400 27430 +999 受託 ジュタク 1518 1410 +1077
Generics Proprietary Products (yenmn) FY2017 FY2018 (Forecast) Amount Amount YOY () Total 32153 31800 (11) Generics 30115 30150 01 To medical institutions 29174 29250 03 To other makers 941 900 (44) Amlodipine 2940 2900 (14) Lansoprazole 2163 1900 (122) Donepezil 1557 1350 (133) Rabeprazole 1558 1350 (134) Limaprost Alfadex 1427 1350 (55) Pravastatine 1147 1100 (41) Voglibose 870 750 (139) Others 18449 19450 54 Proprietary products 2038 1650 (190) Uralyt 1225 1070 (127) Soleton 598 400 (331) Calvan 214 180 (162) Chemiphar ODM Generics (yenmn) FY2017 FY2018 (Forecast) Amount Amount YOY () Total 31100 31350 08 Generics 30115 30150 01 Generics (ODM) 985 1200 218
Income Statement Overview (yenmn) FY2017 FY2018 (Forecast) of of YOY Amount Sales Amount Sales () Net Sales 35331 1000 35500 1000 05 Pharmaceuticals 34279 970 ― ― ― Others 1051 30 ― ― ― Cost of sales 19535 553 ― ― ― SGampA expenses 13947 395 ― ― ― RampD expenses 2280 65 2700 76 184 Operating income 1848 0 52 1100 31 (405) Income before income taxes and minority interests 1777 50 ― ― ― Net income attributble to owners of the parent 1160 33 500 14 (569)
Capital Expenditure and Other (yenmn) Items FY2016 FY2017 Usage Amount Amount YOY () Forecast Rate () Capital expenditure 2928 1645 (438) 1650 997 Depreciation and amortization 1112 1192 72 1250 954 Revised forecast issued on October 31 2017
Cash Flow Statements (yenmn) FY2016 FY2017 Amount Amount Net cash Provided by operating activities 2737 3188 Used in investing activities (2504) (1606) Used in financing activities 787 (1741) Cash and cash equivalents 8084 7890 Free cash flow 232 1582
Per Share Information (yen) FY2016 FY2017 Amount Amount Change Forecast Earnings per share 53002 31528 (21474) 30673 Book value per share 454880 485986 31106 ― Dividend per share 10000 10000 ― 10000 Dividend payout ratio () 189 317 ― 326 Revised forecast issued on October 31 2017
Balance Sheet Data (yenmn) March 31 2017 March 31 2018 March 31 2015 Amount Amount Change Total assets 47002 46814 3358 (187) Return on assets () 63 36 -06 (27) Net assets 17355 17487 1313 132 Owned capital 17346 17474 1312 127 Capital-to-asset ratio () 369 373 02 04 Return on equity () 123 67 (01) (56) Current assets 29009 28334 1630 (674) Current liabilities 14939 14914 (716) (25) Current ratio (x) 194 19 019 (004)
By Main Therapeutic Categories () FY2016 FY2017 Cardiovascular and respiratory drugs 309 320 Digestive organ drugs 196 183 Agents affecting metabolism 164 165 Drugs for nervous system sensory organs 99 91 Antibiotics and chemotherapeutic drugs 65 62 Antineoplastic agents 32 34 Others 135 145
Sales Distribution By Launch Year (yenmn) FY2016 FY2017 Fiscal Year Amount Distrib () Amount Distrib () YOY () 2010 and before 19487 1 667 19194 637 (15) 2009 2011 2348 0 80 2210 73 (59) 2012 1484 0 51 1404 47 (54) 2013 2917 0 100 3127 104 72 2014 1746 0 60 1937 64 110 2015 1001 0 34 1222 41 221 2016 219 0 08 459 15 1091 2017 ― ― 558 19 ― Total 29204 1 1000 30115 1000 31
Generics Proprietary Products (yenmn) FY2016 FY2017 Distrib Distrib YOY Achieved Amount () Amount () () Forecast () Total 31513 1 1000 32153 1 1000 20 32000 1005 Generics 29204 1 927 30115 1 937 31 30000 1 1004 To medical institutions 27808 29174 49 29100 1 1003 To other makers 1395 941 (326) 900 1 1046 Amlodipine 2865 2940 26 2900 1 1014 Lansoprazole 2279 2163 (51) 2100 1 1030 Donepezil 1642 1557 (52) 1600 1 973 Rabeprazole 1586 1558 (18) 1600 1 974 Limaprost Alfadex 1469 1427 (28) 1400 1 1020 Pravastatine 1173 1147 (22) 1100 1 1043 Voglibose 957 870 (91) 900 1 967 Others 17229 18449 71 18400 1 1003 Proprietary products 2308 0 73 2038 0 63 (117) 2000 1 1019 Uralyt 1409 1225 (131) 1200 1 1021 Soleton 679 598 (120) 600 1 997 Calvan 219 214 (21) 200 1 1074 Chemiphar ODM Generics (yenmn) FY2016 FY2017 Distrib Distrib YOY Achieved Amount () Amount () () Forecast () Total 30445 1000 31100 1000 22 31400 990 Generics 29204 959 30115 968 31 30000 1004 Generics (ODM) 1240 41 985 32 (206) 1400 704 Includes exports Revised forecast issued on October 31 2017
Income Statement Overview (yenmn) FY2016 FY2017 of of YOY Achieved Amount Sales Amount Sales () Forecast () Net Sales 35689 1 1000 35331 1 1000 (10) 35500 1 995 Pharmaceuticals 34551 1 968 34279 1 970 (08) ― ― Others 1137 0 32 1051 0 30 (76) ― ― Cost of sales 19449 1 545 19535 1 553 04 ― ― SGampA expenses 13403 0 376 13947 0 395 41 ― ― RampD expenses 1984 0 56 2280 0 65 150 2200 0 1037 Operating income 2836 0 79 1848 0 52 (348) 1800 0 1027 Income before income taxes and minority interests 2849 0 80 1777 0 50 (376) ― ― Net income attributble to owners of the parent 2054 0 58 1160 0 33 (435) 1150 ― 1009 1961 00550933658 00550933658 00575628587 Revised forecast issued on October 31 2017
Page 11
Pharmaceutical Sales
10
Generics Proprietary Products (yenmn)FY2017Amount Amount YOY ()
Total 32153 31800 (11) Generics 30115 30150 01 To medical institutions 29174 29250 03 To other makers 941 900 (44) Amlodipine 2940 2900 (14) Lansoprazole 2163 1900 (122) Donepezil 1557 1350 (133) Rabeprazole 1558 1350 (134) Limaprost Alfadex 1427 1350 (55) Pravastatine 1147 1100 (41) Voglibose 870 750 (139) Others 18449 19450 54 Proprietary products 2038 1650 (190) Uralyt 1225 1070 (127) Soleton 598 400 (331) Calvan 214 180 (162)
Chemiphar ODM Generics (yenmn)FY2017Amount Amount YOY ()
Total 31100 31350 08 Generics 30115 30150 01 Generics (ODM) 985 1200 218
FY2018 (Forecast)
FY2018 (Forecast)
PL 医薬品① 医薬品② 医薬品③ BS① BS③ 和文にある「前年同期間比」「前期3月末比」は記載が難しく英語版では必要度の低い情報であるとみなして記載をしないこととなった2016年2Q~(木村)ただし期末では記載が可能なので書きます(須田)
CF CAP EX 業績予想① 英語版では経常利益は書かないので注意(須田)
業績予想 ② 業績予想③ Per Share Information Expenditure
11
For further information contactPublic Relations Department Nippon Chemiphar Co LtdE-mail irchemipharcojp
Note about Forward-looking Statements and ForecastsStatements made in this Highlights of Business Results with respect to current plans estimates strategies and beliefs and other statements of Nippon Chemiphar that are not historical facts are forward-looking statements about the future performance of Nippon Chemiphar
These statements are based on managementrsquos current assumptions and beliefs in light of the information currently available to it and involve known and unknown risks and uncertainties Consequently undue reliance should not be placed on these statements
Nippon Chemiphar cautions the reader that a number of important factors could cause actual results to differ materially from those discussed in the forward-looking statements
Per Share Information (yen)FY2017Amount Amount YOY ()
Earnings per share 31528 13584 (569)Book value per share 485986 ― ―Dividends per share 10000 7500 ―Dividend payout ratio () 317 552 ―
Capital Expenditure and Other (yenmn)FY2017Amount Amount Change
Capital expenditure 1645 950 (695)Depreciation and amortization 1192 1350 157
FY2018 (Forecast)
FY2018 (Forecast)
Dividend ForecastAs mentioned above we are forecasting a decline in profit in FY2018 due to the influence of NHI drug price revisions ongoing strategic spending including new drug development expenses and start-up expenses at the Vietnam factory Thus we expect to pay a dividend per share of 75 yen (down 25 yen per share YOY) with a payout ratio of 552
PL 医薬品① 医薬品② 医薬品③ BS① BS③ 和文にある「前年同期間比」「前期3月末比」は記載が難しく英語版では必要度の低い情報であるとみなして記載をしないこととなった2016年2Q~(木村)ただし期末では記載が可能なので書きます(須田)
CF CAP EX 業績予想① 英語版では経常利益は書かないので注意(須田)
業績予想 ② 業績予想③ スライド番号 1 Contents スライド番号 3 Sales Income Pharmaceutical Sales Sales Distribution Balance Sheet per Share Information Cash Flow Expenditure スライド番号 9 Sales Income Pharmaceutical Sales Per Share Information Expenditure Per Share Information (yen) FY2017 FY2018 (Forecast) Amount Amount YOY () Earnings per share 31528 13584 (569) Book value per share 485986 ― ― Dividends per share 10000 7500 ― Dividend payout ratio () 317 552 ― Capital Expenditure and Other (yenmn) FY2017 FY2018 (Forecast) Amount Amount Change Capital expenditure 1645 950 (695) Depreciation and amortization 1192 1350 157 2015年3月期 ガツキ 2016年3月期(予想) ガツキ ヨソウ 金額 キンガク 金額 キンガク 増減額 ゾウゲンガク 増減率 ゾウゲン リツ 医療用医薬品 イリョウヨウ イヤクヒン 27400 30950 +05 ジェネリック医薬品(荷離) イヤクヒン ニ バナレ 25079 27430 +01 内自社販売 ウチ ジシャ ハンバイ 2321 25100 +01 内導出輸出 ウチ ドウシュツ ユシュツ 3011 2330 +04 アムロジピン 1935 3040 +09 ランソプラゾール 1509 1890 24 プラバスタチン 1595 1570 +40 ラベプラゾール 1704 1570 16 リマプロストアルファデクス 1273 1660 26 ボグリボース 1013 1300 +21 ドネペジル 15357 1030 +16 その他 タ 3400 15370 +01 主力品 シュリョク ヒン 1975 3520 +35 ウラリット 1134 1970 03 ソレトン 290 1250 +102 カルバン 0 300 +34 ジェネリック医薬品事業 イヤクヒン ジギョウ 2015年3月期 ガツキ 2016年3月期(予想) ガツキ ヨソウ 金額 キンガク 金額 キンガク 増減額 ゾウゲンガク 増減率 ゾウゲン リツ ジェネリック医薬品事業 イヤクヒン ジギョウ 28918 28840 +1003 ジェネリック医薬品(荷離) イヤクヒン ニ バナレ 27400 27430 +999 受託 ジュタク 1518 1410 +1077
Generics Proprietary Products (yenmn) FY2017 FY2018 (Forecast) Amount Amount YOY () Total 32153 31800 (11) Generics 30115 30150 01 To medical institutions 29174 29250 03 To other makers 941 900 (44) Amlodipine 2940 2900 (14) Lansoprazole 2163 1900 (122) Donepezil 1557 1350 (133) Rabeprazole 1558 1350 (134) Limaprost Alfadex 1427 1350 (55) Pravastatine 1147 1100 (41) Voglibose 870 750 (139) Others 18449 19450 54 Proprietary products 2038 1650 (190) Uralyt 1225 1070 (127) Soleton 598 400 (331) Calvan 214 180 (162) Chemiphar ODM Generics (yenmn) FY2017 FY2018 (Forecast) Amount Amount YOY () Total 31100 31350 08 Generics 30115 30150 01 Generics (ODM) 985 1200 218
Income Statement Overview (yenmn) FY2017 FY2018 (Forecast) of of YOY Amount Sales Amount Sales () Net Sales 35331 1000 35500 1000 05 Pharmaceuticals 34279 970 ― ― ― Others 1051 30 ― ― ― Cost of sales 19535 553 ― ― ― SGampA expenses 13947 395 ― ― ― RampD expenses 2280 65 2700 76 184 Operating income 1848 0 52 1100 31 (405) Income before income taxes and minority interests 1777 80 ― ― ― Net income attributble to owners of the parent 1160 33 500 14 (569)
Capital Expenditure and Other (yenmn) Items FY2016 FY2017 Usage Amount Amount YOY () Forecast Rate () Capital expenditure 2928 1645 (438) 1650 997 Depreciation and amortization 1112 1192 72 1250 954 Revised forecast issued on October 31 2017
Cash Flow Statements (yenmn) FY2016 FY2017 Amount Amount Net cash Provided by operating activities 2737 3188 Used in investing activities (2504) (1606) Used in financing activities 787 (1741) Cash and cash equivalents 8084 7890 Free cash flow 232 1582
Per Share Information (yen) FY2016 FY2017 Amount Amount Change Forecast Earnings per share 53002 31528 (21474) 30673 Book value per share 454880 485986 31106 ― Dividend per share 10000 10000 ― 10000 Dividend payout ratio () 189 317 ― 326 Revised forecast issued on October 31 2017
Balance Sheet Data (yenmn) March 31 2017 August 31 2017 March 31 2015 Amount Amount Change Total assets 47002 46814 3358 (187) Return on assets () 63 36 -06 (27) Net assets 17355 17487 1313 132 Owned capital 17346 17474 1312 127 Capital-to-asset ratio () 369 373 02 +04 Return on equity () 123 67 (01) (56) Current assets 29009 28334 1630 (674) Current liabilities 14939 14914 (716) (25) Current ratio (x) 194 19 019 004
By Main Therapeutic Categories () FY2016 FY2017 Cardiovascular and respiratory drugs 309 320 Digestive organ drugs 196 183 Agents affecting metabolism 164 165 Drugs for nervous system sensory organs 99 91 Antibiotics and chemotherapeutic drugs 65 62 Antineoplastic agents 32 34 Others 135 145
Sales Distribution By Launch Year (yenmn) FY2016 FY2017 Fiscal Year Amount Distrib () Amount Distrib () YOY () 2010 and before 19487 1 667 19194 637 (15) 2009 2011 2348 0 80 2210 73 (59) 2012 1484 0 51 1404 47 (54) 2013 2917 0 100 3127 104 72 2014 1746 0 60 1937 64 110 2015 1001 0 34 1222 41 221 2016 219 0 08 459 15 1091 2017 ― ― ― 558 19 ― Total 29204 1 1000 30115 1000 31
Generics Proprietary Products (yenmn) FY2016 FY2017 Distrib Distrib YOY Achieved Amount () Amount () () Forecast () Total 31513 1 1000 32153 1 1000 20 32000 1005 Generics 29204 1 927 30115 1 937 31 30000 1 1004 To medical institutions 27808 29174 49 29100 1 1003 To other makers 1395 941 (326) 900 1 1046 Amlodipine 2865 2940 26 2900 1 1014 Lansoprazole 2279 2163 (51) 2100 1 1030 Donepezil 1642 1557 (52) 1600 1 973 Rabeprazole 1586 1558 (18) 1600 1 974 Limaprost Alfadex 1469 1427 (28) 1400 1 1020 Pravastatine 1173 1147 (22) 1100 1 1043 Voglibose 957 870 (91) 900 1 967 Others 17229 18449 71 18400 1 1003 Proprietary products 2308 0 73 2038 0 63 (117) 2000 1 1019 Uralyt 1409 1225 (131) 1200 1 1021 Soleton 679 598 (120) 600 1 997 Calvan 219 214 (21) 200 1 1074 Chemiphar ODM Generics (yenmn) FY2016 FY2017 Distrib Distrib YOY Achieved Amount () Amount () () Forecast () Total 30445 1000 31100 1000 22 31400 990 Generics 29204 959 30115 968 31 30000 1004 Generics (ODM) 1240 41 985 32 (206) 1400 704 Includes exports Revised forecast issued on October 31 2017
Income Statement Overview (yenmn) FY2016 FY2017 of of YOY Achieved Amount Sales Amount Sales () Forecast () Net Sales 35689 1 1000 35331 1 1000 (10) 35500 1 995 Pharmaceuticals 34551 1 968 34279 1 970 (08) ― ― ― Others 1137 0 32 1051 0 30 (76) ― ― ― Cost of sales 19449 1 545 19535 1 553 04 ― ― ― SGampA expenses 13403 0 376 13947 0 395 41 ― ― ― RampD expenses 1984 0 56 2280 0 65 150 2200 0 1037 Operating income 2836 0 79 1848 0 52 (348) 1800 0 1027 Income before income taxes and minority interests 2849 0 80 1696 0 48 (405) 1700 ― 998 Net income attributble to owners of the parent 2054 0 58 1160 0 33 (435) 1150 ― 1009 1961 00550933658 00550933658 00575628587 Revised forecast issued on October 31 2017
Per Share Information (yen) FY2017 FY2018 (Forecast) Amount Amount YOY () Earnings per share 31528 13584 (569) Book value per share 485986 ― ― Dividends per share 10000 7500 ― Dividend payout ratio() 317 552 ― Capital Expenditure and Other (yenmn) FY2017 FY2018 (Forecast) Amount Amount Change Capital expenditure 1645 950 (695) Depreciation and amortization 1192 1350 157 2015年3月期 ガツキ 2016年3月期(予想) ガツキ ヨソウ 金額 キンガク 金額 キンガク 増減額 ゾウゲンガク 増減率 ゾウゲン リツ 医療用医薬品 イリョウヨウ イヤクヒン 27400 30950 +05 ジェネリック医薬品(荷離) イヤクヒン ニ バナレ 25079 27430 +01 内自社販売 ウチ ジシャ ハンバイ 2321 25100 +01 内導出輸出 ウチ ドウシュツ ユシュツ 3011 2330 +04 アムロジピン 1935 3040 +09 ランソプラゾール 1509 1890 24 プラバスタチン 1595 1570 +40 ラベプラゾール 1704 1570 16 リマプロストアルファデクス 1273 1660 26 ボグリボース 1013 1300 +21 ドネペジル 15357 1030 +16 その他 タ 3400 15370 +01 主力品 シュリョク ヒン 1975 3520 +35 ウラリット 1134 1970 03 ソレトン 290 1250 +102 カルバン 0 300 +34 ジェネリック医薬品事業 イヤクヒン ジギョウ 2015年3月期 ガツキ 2016年3月期(予想) ガツキ ヨソウ 金額 キンガク 金額 キンガク 増減額 ゾウゲンガク 増減率 ゾウゲン リツ ジェネリック医薬品事業 イヤクヒン ジギョウ 28918 28840 +1003 ジェネリック医薬品(荷離) イヤクヒン ニ バナレ 27400 27430 +999 受託 ジュタク 1518 1410 +1077
Generics Proprietary Products (yenmn) FY2017 FY2018 (Forecast) Amount Amount YOY () Total 32153 31800 (11) Generics 30115 30150 01 To medical institutions 29174 29250 03 To other makers 941 900 (44) Amlodipine 2940 2900 (14) Lansoprazole 2163 1900 (122) Donepezil 1557 1350 (133) Rabeprazole 1558 1350 (134) Limaprost Alfadex 1427 1350 (55) Pravastatine 1147 1100 (41) Voglibose 870 750 (139) Others 18449 19450 54 Proprietary products 2038 1650 (190) Uralyt 1225 1070 (127) Soleton 598 400 (331) Calvan 214 180 (162) Chemiphar ODM Generics (yenmn) FY2017 FY2018 (Forecast) Amount Amount YOY () Total 31100 31350 08 Generics 30115 30150 01 Generics (ODM) 985 1200 218
Income Statement Overview (yenmn) FY2017 FY2018 (Forecast) of of YOY Amount Sales Amount Sales () Net Sales 35331 1000 35500 1000 05 Pharmaceuticals 34279 970 ― ― ― Others 1051 30 ― ― ― Cost of sales 19535 553 ― ― ― SGampA expenses 13947 395 ― ― ― RampD expenses 2280 65 2700 76 184 Operating income 1848 0 52 1100 31 (405) Income before income taxes and minority interests 1777 80 ― ― ― Net income attributble to owners of the parent 1160 33 500 14 (569)
Capital Expenditure and Other (yenmn) Items FY2016 FY2017 Usage Amount Amount YOY () Forecast Rate () Capital expenditure 2928 1645 (438) 1650 997 Depreciation and amortization 1112 1192 72 1250 954 Revised forecast issued on October 31 2017
Cash Flow Statements (yenmn) FY2016 FY2017 Amount Amount Net cash Provided by operating activities 2737 3188 Used in investing activities (2504) (1606) Used in financing activities 787 (1741) Cash and cash equivalents 8084 7890 Free cash flow 232 1582
Per Share Information (yen) FY2016 FY2017 Amount Amount Change Forecast Earnings per share 53002 31528 (21474) 30673 Book value per share 454880 485986 31106 ― Dividend per share 10000 10000 ― 10000 Dividend payout ratio () 189 317 ― 326 Revised forecast issued on October 31 2017
Balance Sheet Data (yenmn) March 31 2017 August 31 2017 March 31 2015 Amount Amount Change Total assets 47002 46814 3358 (187) Return on assets () 63 36 -06 (27) Net assets 17355 17487 1313 132 Owned capital 17346 17474 1312 127 Capital-to-asset ratio () 369 373 02 +04 Return on equity () 123 67 (01) (56) Current assets 29009 28334 1630 (674) Current liabilities 14939 14914 (716) (25) Current ratio (x) 194 19 019 004
By Main Therapeutic Categories () FY2016 FY2017 Cardiovascular and respiratory drugs 309 320 Digestive organ drugs 196 183 Agents affecting metabolism 164 165 Drugs for nervous system sensory organs 99 91 Antibiotics and chemotherapeutic drugs 65 62 Antineoplastic agents 32 34 Others 135 145
Sales Distribution By Launch Year (yenmn) FY2016 FY2017 Fiscal Year Amount Distrib () Amount Distrib () YOY () 2010 and before 19487 1 667 19194 637 (15) 2009 2011 2348 0 80 2210 73 (59) 2012 1484 0 51 1404 47 (54) 2013 2917 0 100 3127 104 72 2014 1746 0 60 1937 64 110 2015 1001 0 34 1222 41 221 2016 219 0 08 459 15 1091 2017 ― ― ― 558 19 ― Total 29204 1 1000 30115 1000 31
Generics Proprietary Products (yenmn) FY2016 FY2017 Distrib Distrib YOY Achieved Amount () Amount () () Forecast () Total 31513 1 1000 32153 1 1000 20 32000 1005 Generics 29204 1 927 30115 1 937 31 30000 1 1004 To medical institutions 27808 29174 49 29100 1 1003 To other makers 1395 941 (326) 900 1 1046 Amlodipine 2865 2940 26 2900 1 1014 Lansoprazole 2279 2163 (51) 2100 1 1030 Donepezil 1642 1557 (52) 1600 1 973 Rabeprazole 1586 1558 (18) 1600 1 974 Limaprost Alfadex 1469 1427 (28) 1400 1 1020 Pravastatine 1173 1147 (22) 1100 1 1043 Voglibose 957 870 (91) 900 1 967 Others 17229 18449 71 18400 1 1003 Proprietary products 2308 0 73 2038 0 63 (117) 2000 1 1019 Uralyt 1409 1225 (131) 1200 1 1021 Soleton 679 598 (120) 600 1 997 Calvan 219 214 (21) 200 1 1074 Chemiphar ODM Generics (yenmn) FY2016 FY2017 Distrib Distrib YOY Achieved Amount () Amount () () Forecast () Total 30445 1000 31100 1000 22 31400 990 Generics 29204 959 30115 968 31 30000 1004 Generics (ODM) 1240 41 985 32 (206) 1400 704 Includes exports Revised forecast issued on October 31 2017
Income Statement Overview (yenmn) FY2016 FY2017 of of YOY Achieved Amount Sales Amount Sales () Forecast () Net Sales 35689 1 1000 35331 1 1000 (10) 35500 1 995 Pharmaceuticals 34551 1 968 34279 1 970 (08) ― ― ― Others 1137 0 32 1051 0 30 (76) ― ― ― Cost of sales 19449 1 545 19535 1 553 04 ― ― ― SGampA expenses 13403 0 376 13947 0 395 41 ― ― ― RampD expenses 1984 0 56 2280 0 65 150 2200 0 1037 Operating income 2836 0 79 1848 0 52 (348) 1800 0 1027 Income before income taxes and minority interests 2849 0 80 1696 0 48 (405) 1700 ― 998 Net income attributble to owners of the parent 2054 0 58 1160 0 33 (435) 1150 ― 1009 1961 00550933658 00550933658 00575628587 Revised forecast issued on October 31 2017
Page 12
Per Share Information Expenditure
11
For further information contactPublic Relations Department Nippon Chemiphar Co LtdE-mail irchemipharcojp
Note about Forward-looking Statements and ForecastsStatements made in this Highlights of Business Results with respect to current plans estimates strategies and beliefs and other statements of Nippon Chemiphar that are not historical facts are forward-looking statements about the future performance of Nippon Chemiphar
These statements are based on managementrsquos current assumptions and beliefs in light of the information currently available to it and involve known and unknown risks and uncertainties Consequently undue reliance should not be placed on these statements
Nippon Chemiphar cautions the reader that a number of important factors could cause actual results to differ materially from those discussed in the forward-looking statements
Per Share Information (yen)FY2017Amount Amount YOY ()
Earnings per share 31528 13584 (569)Book value per share 485986 ― ―Dividends per share 10000 7500 ―Dividend payout ratio () 317 552 ―
Capital Expenditure and Other (yenmn)FY2017Amount Amount Change
Capital expenditure 1645 950 (695)Depreciation and amortization 1192 1350 157
FY2018 (Forecast)
FY2018 (Forecast)
Dividend ForecastAs mentioned above we are forecasting a decline in profit in FY2018 due to the influence of NHI drug price revisions ongoing strategic spending including new drug development expenses and start-up expenses at the Vietnam factory Thus we expect to pay a dividend per share of 75 yen (down 25 yen per share YOY) with a payout ratio of 552
PL 医薬品① 医薬品② 医薬品③ BS① BS③ 和文にある「前年同期間比」「前期3月末比」は記載が難しく英語版では必要度の低い情報であるとみなして記載をしないこととなった2016年2Q~(木村)ただし期末では記載が可能なので書きます(須田)
CF CAP EX 業績予想① 英語版では経常利益は書かないので注意(須田)
業績予想 ② 業績予想③ スライド番号 1 Contents スライド番号 3 Sales Income Pharmaceutical Sales Sales Distribution Balance Sheet per Share Information Cash Flow Expenditure スライド番号 9 Sales Income Pharmaceutical Sales Per Share Information Expenditure Per Share Information (yen) FY2017 FY2018 (Forecast) Amount Amount YOY () Earnings per share 31528 13584 (569) Book value per share 485986 ― ― Dividends per share 10000 7500 ― Dividend payout ratio () 317 552 ― Capital Expenditure and Other (yenmn) FY2017 FY2018 (Forecast) Amount Amount Change Capital expenditure 1645 950 (695) Depreciation and amortization 1192 1350 157 2015年3月期 ガツキ 2016年3月期(予想) ガツキ ヨソウ 金額 キンガク 金額 キンガク 増減額 ゾウゲンガク 増減率 ゾウゲン リツ 医療用医薬品 イリョウヨウ イヤクヒン 27400 30950 +05 ジェネリック医薬品(荷離) イヤクヒン ニ バナレ 25079 27430 +01 内自社販売 ウチ ジシャ ハンバイ 2321 25100 +01 内導出輸出 ウチ ドウシュツ ユシュツ 3011 2330 +04 アムロジピン 1935 3040 +09 ランソプラゾール 1509 1890 24 プラバスタチン 1595 1570 +40 ラベプラゾール 1704 1570 16 リマプロストアルファデクス 1273 1660 26 ボグリボース 1013 1300 +21 ドネペジル 15357 1030 +16 その他 タ 3400 15370 +01 主力品 シュリョク ヒン 1975 3520 +35 ウラリット 1134 1970 03 ソレトン 290 1250 +102 カルバン 0 300 +34 ジェネリック医薬品事業 イヤクヒン ジギョウ 2015年3月期 ガツキ 2016年3月期(予想) ガツキ ヨソウ 金額 キンガク 金額 キンガク 増減額 ゾウゲンガク 増減率 ゾウゲン リツ ジェネリック医薬品事業 イヤクヒン ジギョウ 28918 28840 +1003 ジェネリック医薬品(荷離) イヤクヒン ニ バナレ 27400 27430 +999 受託 ジュタク 1518 1410 +1077
Generics Proprietary Products (yenmn) FY2017 FY2018 (Forecast) Amount Amount YOY () Total 32153 31800 (11) Generics 30115 30150 01 To medical institutions 29174 29250 03 To other makers 941 900 (44) Amlodipine 2940 2900 (14) Lansoprazole 2163 1900 (122) Donepezil 1557 1350 (133) Rabeprazole 1558 1350 (134) Limaprost Alfadex 1427 1350 (55) Pravastatine 1147 1100 (41) Voglibose 870 750 (139) Others 18449 19450 54 Proprietary products 2038 1650 (190) Uralyt 1225 1070 (127) Soleton 598 400 (331) Calvan 214 180 (162) Chemiphar ODM Generics (yenmn) FY2017 FY2018 (Forecast) Amount Amount YOY () Total 31100 31350 08 Generics 30115 30150 01 Generics (ODM) 985 1200 218
Income Statement Overview (yenmn) FY2017 FY2018 (Forecast) of of YOY Amount Sales Amount Sales () Net Sales 35331 1000 35500 1000 05 Pharmaceuticals 34279 970 ― ― ― Others 1051 30 ― ― ― Cost of sales 19535 553 ― ― ― SGampA expenses 13947 395 ― ― ― RampD expenses 2280 65 2700 76 184 Operating income 1848 0 52 1100 31 (405) Income before income taxes and minority interests 1777 80 ― ― ― Net income attributble to owners of the parent 1160 33 500 14 (569)
Capital Expenditure and Other (yenmn) Items FY2016 FY2017 Usage Amount Amount YOY () Forecast Rate () Capital expenditure 2928 1645 (438) 1650 997 Depreciation and amortization 1112 1192 72 1250 954 Revised forecast issued on October 31 2017
Cash Flow Statements (yenmn) FY2016 FY2017 Amount Amount Net cash Provided by operating activities 2737 3188 Used in investing activities (2504) (1606) Used in financing activities 787 (1741) Cash and cash equivalents 8084 7890 Free cash flow 232 1582
Per Share Information (yen) FY2016 FY2017 Amount Amount Change Forecast Earnings per share 53002 31528 (21474) 30673 Book value per share 454880 485986 31106 ― Dividend per share 10000 10000 ― 10000 Dividend payout ratio () 189 317 ― 326 Revised forecast issued on October 31 2017
Balance Sheet Data (yenmn) March 31 2017 August 31 2017 March 31 2015 Amount Amount Change Total assets 47002 46814 3358 (187) Return on assets () 63 36 -06 (27) Net assets 17355 17487 1313 132 Owned capital 17346 17474 1312 127 Capital-to-asset ratio () 369 373 02 +04 Return on equity () 123 67 (01) (56) Current assets 29009 28334 1630 (674) Current liabilities 14939 14914 (716) (25) Current ratio (x) 194 19 019 004
By Main Therapeutic Categories () FY2016 FY2017 Cardiovascular and respiratory drugs 309 320 Digestive organ drugs 196 183 Agents affecting metabolism 164 165 Drugs for nervous system sensory organs 99 91 Antibiotics and chemotherapeutic drugs 65 62 Antineoplastic agents 32 34 Others 135 145
Sales Distribution By Launch Year (yenmn) FY2016 FY2017 Fiscal Year Amount Distrib () Amount Distrib () YOY () 2010 and before 19487 1 667 19194 637 (15) 2009 2011 2348 0 80 2210 73 (59) 2012 1484 0 51 1404 47 (54) 2013 2917 0 100 3127 104 72 2014 1746 0 60 1937 64 110 2015 1001 0 34 1222 41 221 2016 219 0 08 459 15 1091 2017 ― ― ― 558 19 ― Total 29204 1 1000 30115 1000 31
Generics Proprietary Products (yenmn) FY2016 FY2017 Distrib Distrib YOY Achieved Amount () Amount () () Forecast () Total 31513 1 1000 32153 1 1000 20 32000 1005 Generics 29204 1 927 30115 1 937 31 30000 1 1004 To medical institutions 27808 29174 49 29100 1 1003 To other makers 1395 941 (326) 900 1 1046 Amlodipine 2865 2940 26 2900 1 1014 Lansoprazole 2279 2163 (51) 2100 1 1030 Donepezil 1642 1557 (52) 1600 1 973 Rabeprazole 1586 1558 (18) 1600 1 974 Limaprost Alfadex 1469 1427 (28) 1400 1 1020 Pravastatine 1173 1147 (22) 1100 1 1043 Voglibose 957 870 (91) 900 1 967 Others 17229 18449 71 18400 1 1003 Proprietary products 2308 0 73 2038 0 63 (117) 2000 1 1019 Uralyt 1409 1225 (131) 1200 1 1021 Soleton 679 598 (120) 600 1 997 Calvan 219 214 (21) 200 1 1074 Chemiphar ODM Generics (yenmn) FY2016 FY2017 Distrib Distrib YOY Achieved Amount () Amount () () Forecast () Total 30445 1000 31100 1000 22 31400 990 Generics 29204 959 30115 968 31 30000 1004 Generics (ODM) 1240 41 985 32 (206) 1400 704 Includes exports Revised forecast issued on October 31 2017
Income Statement Overview (yenmn) FY2016 FY2017 of of YOY Achieved Amount Sales Amount Sales () Forecast () Net Sales 35689 1 1000 35331 1 1000 (10) 35500 1 995 Pharmaceuticals 34551 1 968 34279 1 970 (08) ― ― ― Others 1137 0 32 1051 0 30 (76) ― ― ― Cost of sales 19449 1 545 19535 1 553 04 ― ― ― SGampA expenses 13403 0 376 13947 0 395 41 ― ― ― RampD expenses 1984 0 56 2280 0 65 150 2200 0 1037 Operating income 2836 0 79 1848 0 52 (348) 1800 0 1027 Income before income taxes and minority interests 2849 0 80 1696 0 48 (405) 1700 ― 998 Net income attributble to owners of the parent 2054 0 58 1160 0 33 (435) 1150 ― 1009 1961 00550933658 00550933658 00575628587 Revised forecast issued on October 31 2017