business research measurement scales
TRANSCRIPT
TYPES OF SCALING TECHNIQUES
The various types of scaling techniques used in research can be classified into two categories: (a)
comparative scales, and (b) Non-comparative scales.
Comparative scale - A type of scale where one object is compared with another and a relative
measure of preference is obtained, eg do respondents prefer one or another soft drink? The main
types of comparative scales are: paired comparison, rank order, constant sum. In comparative
scaling, the respondent is asked to compare one object with another. For example, the researcher
can ask the respondents whether they
prefer brand A or brand B of a detergent.
Non- comparative scale – In these scaling, respondents needs only to evaluate a single object.
Their evaluation is independent of the other object which the researcher is studying. Respondents
using a non-comparative scale employ whatever rating standard seems appropriate to them. Non-
comparative techniques consist of continuousand itemized rating scales. shows the classification
of these scaling techniques.
Continuous rating scales: The respondents are asked to give a rating by placing a
mark at the appropriate position on a continuous line. The scale can be written on
card and shown to the respondent during the interview.
Line marking scale: The line marked scale is typically used to measure perceived
similarity differences between products, brands or other objects. Technically, such a
scale is a form of what is termed a semantic differential scale since each end of the
scale is labelled with a word/phrase (or semantic) that is opposite in meaning to the
other.
Itemised rating scales: With an itemised scale, respondents are provided with a
scale having numbers and/or brief descriptions associated with each category and are
asked to select one of the limited number of categories, ordered in terms of scale
position, that best describes the product, brand, company or product attribute being
studied.
Semantic scales: This type of scale makes extensive use of words rather than
numbers. Respondents describe their feelings about the products or brands on scales
with semantic labels. When bipolar adjectives are used at the end points of the scales,
these are termed semantic differential scales.
Likert scales: A Likert scale is what is termed a summated instrument scale. This
means that the items making up a Liken scale are summed to produce a total score. In
fact, a Likert scale is a composite of itemised scales. Typically, each scale item will
have 5 categories, with scale values ranging from -2 to +2 with 0 as neutral response
Types of scaling techniques in social and educational research
Nominal
The lowest measurement level you can use, from a statistical point of view, is a nominal scale. A nominal
scale, as the name implies, is simply some placing of data into categories, without any order or structure.
A physical example of a nominal scale is the terms we use for colours. The underlying spectrum is
ordered but the names are nominal.
Ordinal
An ordinal scale is next up the list in terms of power of measurement. The simplest ordinal scale is a
ranking. When a market researcher asks you to rank 5 types of beer from most flavourful to least
flavourful, he/she is asking you to create an ordinal scale of preference. There is no objective distance
between any two points on your subjective scale. For you the top beer may be far superior to the second
prefered beer but, to another respondant with the same top and second beer, the distance may be
subjectively small.
Interval
The standard survey rating scale is an interval scale. When you are asked to rate your satisfaction with a
piece of software on a 7 point scale, from Dissatisfied to Satisfied, you are using an interval scale. It is an
interval scale because it is assumed to have equidistant points between each of the scale elements. This
means that we can interpret differences in the distance along the scale. We contrast this to an ordinal scale
where we can only talk about differences in order, not differences in the degree of order.
Ratio
A ratio scale is the top level of measurement and is not often available in social research. The factor
which clearly defines a ratio scale is that it has a true zero point. The simplest example of a ratio scale is
the measurement of length (disregarding any philosophical points about defining how we can identify
zero length).
Selecting the appropriate scale to use:
Before finalizing on the scale usage, it is advisable to consider the following aspects,
1. Type/details of information required.
2. Time and cost constraints.
3. Literary level of target respondents (for easy communication)
4. Stimulus characteristics
5. Analysis methodology to be used
6. Past experience to be used
7. Rural vs. urban context
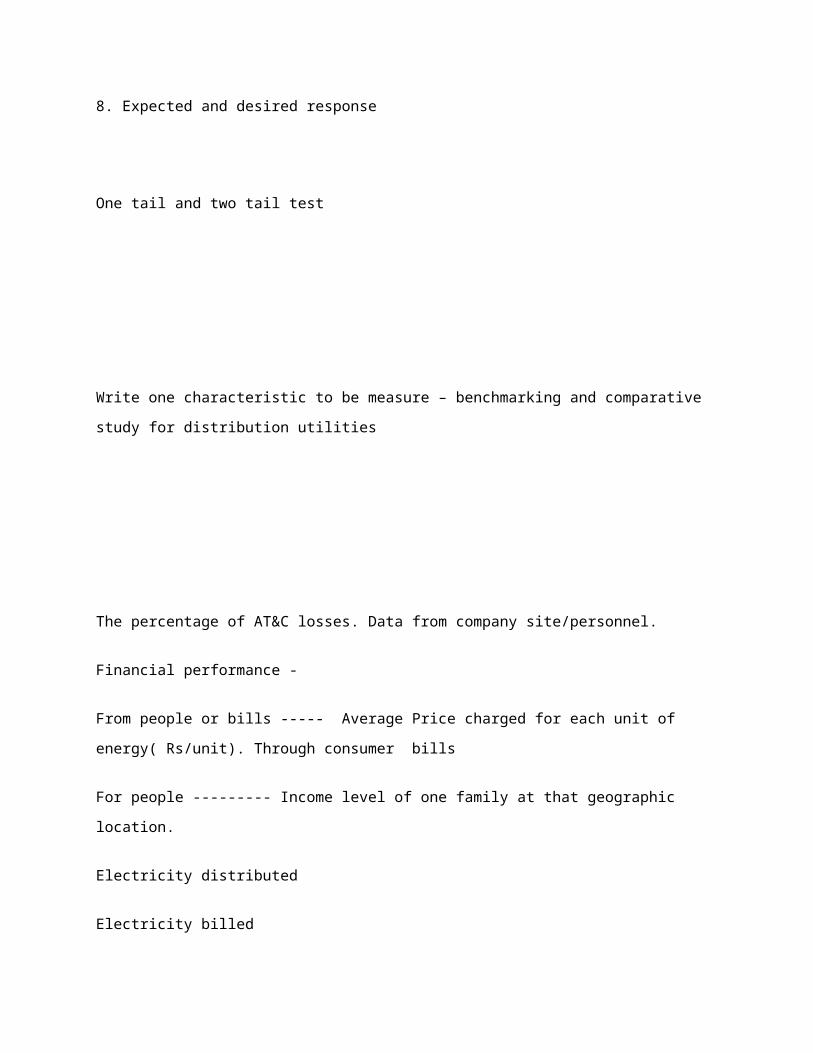
8. Expected and desired response
One tail and two tail test
Write one characteristic to be measure – benchmarking and comparative study for distribution utilities
The percentage of AT&C losses. Data from company site/personnel.
Financial performance -
From people or bills ----- Average Price charged for each unit of energy( Rs/unit). Through consumer
bills
For people --------- Income level of one family at that geographic location.
Electricity distributed
Electricity billed
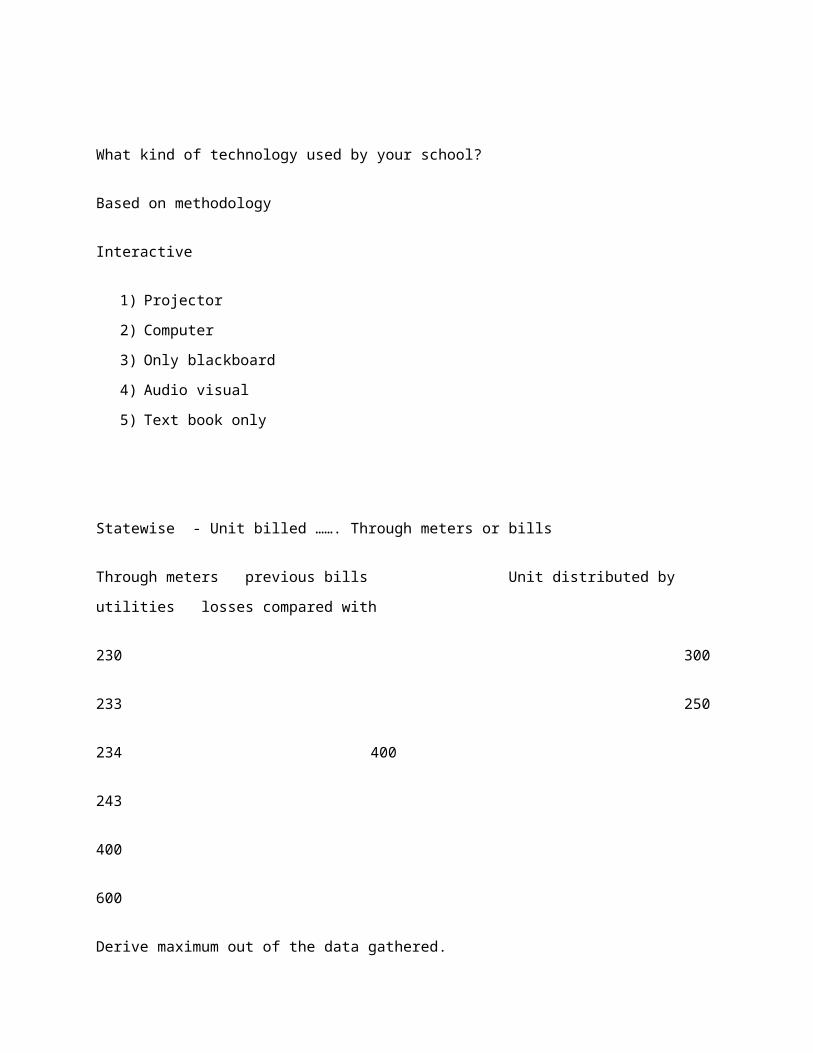
What kind of technology used by your school?
Based on methodology
Interactive
1) Projector
2) Computer
3) Only blackboard
4) Audio visual
5) Text book only
Statewise - Unit billed ……. Through meters or bills
Through meters previous bills Unit distributed by utilities losses compared with
230 300
233 250
234 400
243
400
600
Derive maximum out of the data gathered.
A good measurement has -
1.Reliability
2.Validity
3.Sensitivity
Business research
Research methodology
Title page
Acknowledgement
Decleration of autanticity or work
Content
List of table
figures
List of abbreviation
Executive summary
Chapter -1 Introduction
Need
Objective
Methodology – research design
Chapter – 2 Literature review ( references)
Chapter-3 Description of industry
Chapters 4 ,5,6,7,8( dedicated to each objective).
Chapter -9 recommendation and conclusions
Chapter – 10 bibliography ( reference will be added)
Chapter -11 annexure