business profile annual report 2011 - saskatoon · a pdf version of this publication is available...
TRANSCRIPT

222 - 3rd Avenue North, Saskatoon, SK S7K 0J5Phone: (306) 975-7710 Fax: (306) 975-7712 Email: [email protected]
A PDF version of this publication is available online at www.saskatoon.ca/go/businesslicense. If you would like us to email it to you, contact [email protected].
BU
SINESS PR
OFILE - A
NN
UA
L REPO
RT 2011
Annual report of business information for the City of Saskatoon
INSIDE THIS ISSUETotal Licensed Businesses21% increase since 2007 ............................................................2New Businesses1,166 new business licenses in 2011 ................................. 3Commercial/Industrial Businesses41% growth in the Construction Sector since 2007 .......................4
Home Based Businesses7% increase in 2011 ............................................................. 5Appendix 1 - Commercial Businesses by NAICS ................ 8Appendix 2 - Commercial Businesses by Neighbourhood ... 9Appendix 3 - Home Based Businesses by NAICS...............10Appendix 4 - Home Based Businesses by Neighbourhood .11
Business License Program - Annual Report 2011The Planning & Development Branch, Business License Program, licenses all businesses operating from a fi xed address within Saskatoon. This includes all home based businesses as well as businesses operating from commercial and industrial locations.
The Business Profi le Annual Report provides a summary and analysis of business activity in Saskatoon, including information on new businesses, commercial/industrial businesses, and home based businesses for 2011.
All data contained within this publication was obtained by the City of Saskatoon through the Business License Program. All businesses have been classifi ed based on their primary business type or activity according to the North American Industry Classifi cation System (NAICS). Forinformation on NAICS, visit www.statcan.gc.caand search “NAICS 2012” or [email protected].
Hightlights from 2011:● Strong growth overall in 2011● 2nd highest year for new Home Based Business applications● Commercial/Industrial/Businesses - the Mining, Oil and Gas Extraction Sector saw the largest percentage increase (17%)● Home Based Businesses - there were 120 new businesses involved in Residential Building Construction.
Coming Soon!The Business License Program is developing an online business license application service, scheduled to be launched on the City of Saskatoon’s website in 2012. This service will provide new and existing businessowners the ability to apply for and renew business licenses online.
7,939 8,455 8,795 9,299 9,632
5,803
3,829
-
2,000
4,000
6,000
8,000
10,000
12,000
2007 2008 2009 2010 2011
Summary of Total Business Ac�vity
Total Businesses Commercial Home Based
961 1,172
1,042
1,234 1,166
798
368
-200 400 600 800
1,000 1,200 1,400
2007 2008 2009 2010 2011
Summary of New Business Ac�vity
Total New Businesses New Home Based New Commercial

BU
SIN
ESS
PRO
FILE
2w
ww
.sas
kato
on.c
a
Figure 2: Total Licensed Businesses by Major Sector, 2011
Total Licensed BusinessesThe City of Saskatoon Business License Program requires all businesses to obtain a license prior to operating. In 2011, there were 9,632 businesses licensed by the Program. Figure 1 illustrates the overall business growth in Saskatoon and identifi es the total number of home based and commercial/industrial businesses licensed from 2007 to 2011. The total number of businesses has increased by more than 21% since 2007.
Figure 1: Total Licensed Businesses, 2007-2011
Saskatoon’s total licensed businesses can be divided into two major sectors: (1) goods-producing and (2) services-producing. As shown in Figure 2, Saskatoon’s economy is primarily made up of services-producing businesses.
Table 1 provides a breakdown of all licensed businesses in Saskatoon by goods- and services-producing sectors as well as by NAICS sectors for the years 2007 to 2011.
Table 1: Total Licensed Businesses by NAICS Sector, 2007-2011
The Business License Program collects and manages all personal information in accordance with The Local Authority Freedom of Information and Protection of Privacy Act.
Information and Mapping Requests
The Business License Programsupports economic growth and community planning by providing statistical information relating to business activity in Saskatoon. The type of information available upon request includes, but is not limited to the following:
• square footage of commercial/ industrial space
• employment fi gures
• specifi c data by business type, such as geographic distribution, new business listings, number of closed businesses
The Business License Program can be reached at (306) 975-7710.
For more information please visitwww.saskatoon.ca/go/
businesslicense.
The Mapping and Research Group provides mapping and GIS (geographic information system) services to internal and external clients. Mapping products include zoning and address maps, neighbourhood boundary maps, projected growth concept maps and more. Mapping products are available to download as PDFs or are available as a hard copy.
Custom research and mapping services on various demographic, social, and economic trends in Saskatoon may also be available upon request. The type of information available upon request includes, but is not limited to the following:
• Neighbourhood Profi les
• Population Projections
• Census Data
• Quality of Life Indicators
The Mapping and Research Group can be reached at
(306) 975-7641.
For more information on mapping services, please visit
www.saskatoon.ca and click on‘M’ for Maps.
23% Goods
77% Services
Saskatoon has had an
average of 1,115 new
licensed businesses per
year for the past fi ve
years.

BU
SINESS PR
OFILE
3In 2011, the largest sector was Trade, which includes both wholesale and retail and accounts for 21% of all licensed businesses. The Construction sector showed continued growth, increasing 8% over 2010 and over 63% since 2007. With this growth, the Construction sector makes up 17% of all licensed businesses. The top four sectors make up 63% of the total number of licensed businesses in Saskatoon; these sectors include Trade, Construction, Professional Services, and Other Services (such as Hair Salons, Automotive Repair, Dry Cleaning and Photo Services). Figure 3 shows a breakdown of all sectors.
Figure 3: Total Licensed Businesses by NAICS Sector, 2011
New BusinessesThe City of Saskatoon Business License Program issued 1,166 new business licenses in 2011. Figure 4 illustrates the number of new licenses issued for the years 2007 to 2011. The number of new home based businesses continues to exceed the number of new commercial/industrial businesses.
Figure 4: New Licensed Businesses, 2007-2011
Tables 2 and 3 list the top ten business starts by NAICS industry group for 2011.
Table 2: Top 10 New Commercial/Industrial Businesses, 2011* Table 3: Top 10 New Home Based Businesses, 2011*
Based on TOTAL businesses in
Saskatoon for 2011, the top three
industries in the construction
sector were:
• Residential building construction
- 623
• Plumbing, heating & air-
conditioning contractors - 208
• Electrical contractors
& other wiring installation
contractors - 113
Saskatoon is Saskatchewan’s
largest city with an estimated
population of 234,200 as of
December 31, 2011 (Courtesy of
the City of Saskatoon Mapping
& Research Group) .

BU
SIN
ESS
PRO
FILE
4w
ww
.sas
kato
on.c
aCommercial/Industrial BusinessesIn 2011, Saskatoon had a total of 5,803 licensed commercial/industrial businesses representing 60% of all businesses. Table 4 provides a breakdown of businesses by NAICS sectors for the years 2007 to 2011. Since 2007, commercial/industrial businesses have increased by over 8%. The Trade, Accommodation & Food Services, and Other Services sectors continue to be the most prevalent. The largest percentage increase in 2011 was in the Mining, Oil & Gas Extraction sector, which increased by 17% over last year.
A more detailed breakdown of the total number of commercial/industrial businesses by NAICS sub-sector can be found inAppendix 1 on page 8.
Table 4: Total Commercial/Industrial Businesses by NAICS Sector, 2007-2011
Commercial/Industrial Businesses by Neighbourhood
Figure 5 illustrates the distribution of commercial/industrial businesses in Saskatoon by neighbourhood. The neighbourhoods withthe greatest number of commercial/industrial businesses are Central Business District (893), North Industrial (740), Hudson BayIndustrial (463), and Airport Business Area (374).
Figure 5: Distribution of Commercial/IndustrialBusinesses by Neighbourhood, 2011

BU
SINESS PR
OFILE
5The top sectors found in the Central Business District were Trade (25%), Professional, Scientifi c & Technical Services (15%), and Health Care & Social Assistance (13%). The top sectors found in the North Industrial wereTrade (38%), Other Services (14%), andConstruction (12%). The top sectors found in the Hudson Bay Industrial were Trade (38%), Construction (18%), and Manufacturing (13%). The top sectors found in the Airport Business Area were Trade (29%), Construction (16%), and Professional, Scientifi c & Technical Services (11%).
A more detailed breakdown of the total number of commercial/industrial businesses by neighbourhood can be found inAppendix 2 on page 9.
New Commercial/Industrial Businesses
The Business License Program issued 368 new commercial/industrial business licenses in 2011. This represents 32% of all new business licenses issued. Table 5 shows the number of new commercial/industrial business license applications by NAICS sector for 2007 through 2011. The Trade sector, which consistently has the greatest number of new licenses issued, accounted for 29% ofall new commercial/industrial businesses in 2011. Table 6 lists the top 10 new commercial/industrial businesses by neighbourhoodin 2011.
Table 5: New Commercial/Industrial Businesses by NAICS Sector, 2007-2011
Table 6: Top 10 New Commercial/Industrial Businesses by Neighbourhood, 2011*
Home Based BusinessesIn 2011, there were a total of 3,829 licensed home based businesses in Saskatoon. The proportion of home based businesses has grown steadily over the past fi ve years. There are 7% more home based businesses in 2011 compared to 2010 and they now account for 40% of the total number of licensed businesses in Saskatoon – up from 32% fi ve years ago.
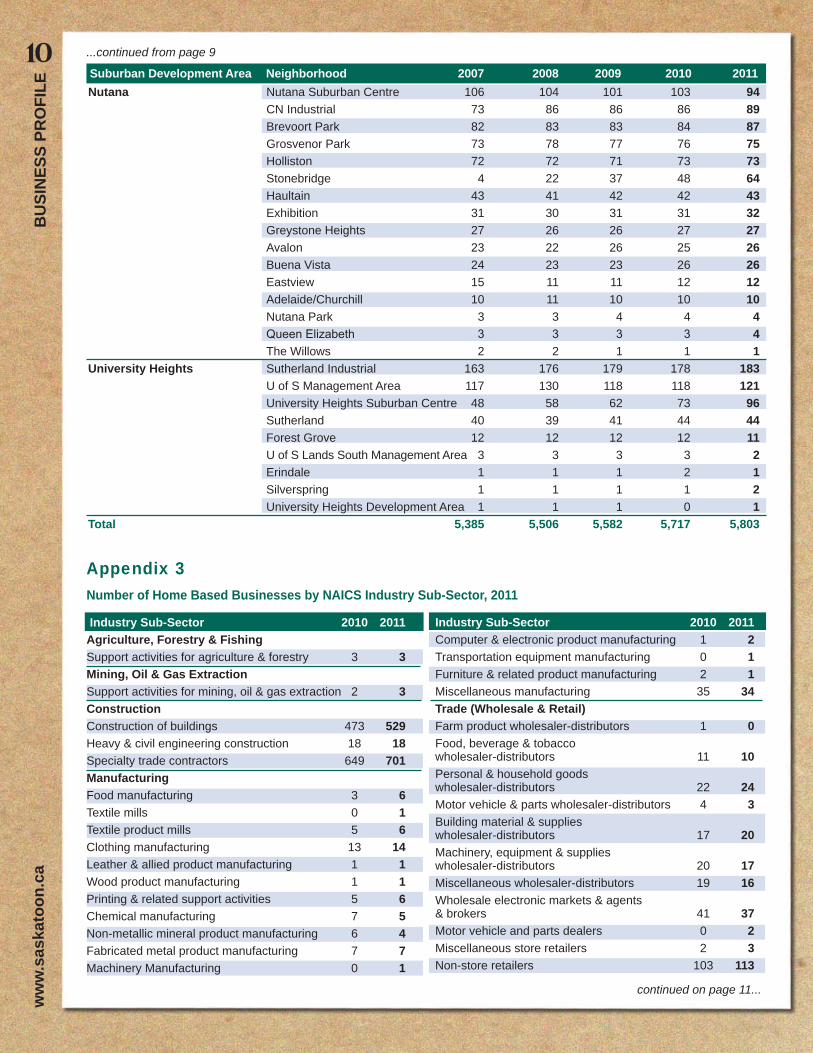
Table 7 summarizes the total number of home based businesses by NAICS sector for the years 2007 to 2011. The data in Table 7 indicates that the Construction sector and the Professional, Scientifi c & Technical Services sector continue to be the most prevalent home based businesses. The Health Care & Social Assistance sector saw the largest increase of 14% over the last year. A more detailed breakdown of the total number of home based businesses by NAICS sub-sector can be found in Appendix 3 on page 10.

BU
SIN
ESS
PRO
FILE
6w
ww
.sas
kato
on.c
aHome Based Businesses by NeighbourhoodFigure 6 illustrates the total number of licensed home based businesses by neighbourhood. The neighbourhoods with the greatest number of home based businesses are Silverwood Heights (206), Willowgrove (145), Silverspring (127), Lakeview (118), and Briarwood (105).
The most prevalent sector in Silverwood Heights is Professional, Scientifi c & Technical Services, in Willowgrove it is Administrative & Support Services, and in Silverspring it is Construction. A more detailed breakdown of the total number of home based businessesby neighbourhood can be found in Appendix 4 on page 11.
Figure 6: Number of Licensed Home BasedBusinesses by Neighbourhood, 2011
Table 7: Total Home Based Businesses by NAICS Sector, 2007-2011

BU
SINESS PR
OFILE
7New Home Based BusinessesThe Business License Program issued 798 new home based business licenses in 2011, representing 68% of all new business licenses issued. Table 8 shows the number of new home based business license applications by NAICS sector for 2007 through 2011. The Construction sector had the greatest number of new licenses issued, accounting for 34% of all new home based businesses. There were 101 new home based businesses in the Other Services sector, an increase of 13% over 2010, and the largest increase over all sectors. Table 9 lists the top 10 new home based businesses by neighbourhood in 2011.
Table 8: New Home Based Businesses by NAICS Sector, 2007-2011
Table 9: Top 10 New Home Based Businesses by Neighbourhood, 2011*
The Business Start-Up Guide is a
great resource to assist entrepreneurs
with starting, relocating or expanding
a business. This resource helps to guide
entrepreneurs through the licensing and
start-up process, and provide a list of
agencies that can help achieve their
business goals.
Business Resources
The Business License Program offers a variety of
business resources:
• BizPaL
• Business Start-Up Guide and Checklist
• Saskatoon Business Directory
• Business Profi le newsletters and annual reports
• Employment Profi le publication
• Statistical information and customized information
requests
• Business License brochures, summarizing development
standards and applicable bylaws
For more information, please visit
www.saskatoon.ca/go/businesslicense.

BU
SIN
ESS
PRO
FILE
8w
ww
.sas
kato
on.c
aAppendix 1 Number of Commercial/Industrial Businesses by NAICS Industry Sub-Sector, 2011
Industry Sub-Sector 2010 2011Agriculture, Forestry & Fishing Crop production 3 2Animal production 2 1Support activities for agriculture & forestry 2 2Mining, Oil & Gas Extraction Oil & gas extraction 2 3Mining & quarrying (except oil & gas) 12 15Support activities for mining, oil & gas extraction 15 16ConstructionConstruction of buildings 133 146Heavy & civil engineering construction 36 35Specialty trade contractors 238 238ManufacturingFood manufacturing 45 46Beverage & tobacco product manufacturing 9 10Textile mills 0 0Textile product mills 8 8Clothing manufacturing 11 11Leather & allied product manufacturing 2 2Wood product manufacturing 10 12Paper manufacturing 1 1Printing & related support activities 30 32Petroleum & coal product manufacturing 3 2Chemical manufacturing 13 13Plastics & rubber products manufacturing 20 19Non-metallic mineral product manufacturing 17 17Primary metal manufacturing 1 1Fabricated metal product manufacturing 59 59Machinery manufacturing 31 31Computer & electronic product manufacturing 13 13Electrical equipment, appliance & componentmanufacturing 3 3Transportation equipment manufacturing 14 13Furniture & related product manufacturing 33 34Miscellaneous manufacturing 41 40Trade (Wholesale & Retail) Farm product wholesaler-distributors 13 15Petroleum product wholesaler-distributors 8 8Food, beverage & tobacco wholesaler-distributors 35 34Personal & household goods wholesaler-distributors 43 42Motor vehicle & parts wholesaler-distributors 43 43Building material & supplies wholesaler-distributors 126 124Machinery, equipment & supplieswholesaler-distributors 146 149Miscellaneous wholesaler-distributors 44 44Wholesale electronic markets, & agents & brokers 25 27Motor vehicle & parts dealers 183 192Furniture & home furnishings stores 106 110Electronics & appliance stores 89 88Building material & garden equipment &supplies dealers 58 59Food & beverage stores 115 120Health & personal care stores 122 123
Gasoline stations 59 56Clothing & clothing accessories stores 282 269Sporting goods, hobby, book & music stores 98 90General merchandise stores 30 30Miscellaneous store retailers 160 163Non-store retailers 9 9Transportation & Warehousing Air transportation 11 11Rail transportation 1 1Truck transportation 70 66Transit & ground passenger transportation 9 10Support activities for transportation 31 31Couriers & messengers 27 26Warehousing & storage 26 27Finance, Insurance, Real Estate & Leasing Credit intermediation & related activities 111 111Securities, commodity contracts & otherfi nancial investment & related activities 85 84Insurance carriers & related activities 76 76Funds & other fi nancial vehicles 1 1Real estate 82 88Rental & leasing services 71 73Professional, Scientifi c & Technical Professional, scientifi c & technical services 497 508Business, Building & Other Support services Management of companies & enterprises 29 26Administrative & support services 145 145Waste management & remediation services 9 9Educational Services Educational services 74 80Health Care & Social Assistance Ambulatory health care services 324 331Nursing & residential care facilities 4 4Social assistance 23 27Information, Culture & Recreation Publishing industries (except internet) 13 13Motion picture & sound recording industries 21 23Broadcasting (except internet) 5 5Telecommunications 12 19Data processing, hosting & related services 3 3Performing arts, spectator sports & relatedindustries 23 20Heritage institutions 1 1Amusement, gambling & recreation industries 62 60Accommodation & Food Services Accommodation services 45 51Food services & drinking places 526 534Other Services Repair & maintenance 273 274Personal & laundry services 424 442Religious, grant-making, civic, professional& similar organizations 2 3
Industry Sub-Sector 2010 2011

BU
SINESS PR
OFILE
9
continued on page 10...
Appendix 2Number of Commercial/Industrial Businesses by Neighborhood, 2007-2011
Suburban Development Area Neighborhood 2007 2008 2009 2010 2011Blairmore Blairmore Suburban Centre 0 0 6 16 18 Blairmore Development Area 3 3 3 3 2Central Business District Central Business District 934 925 907 917 893Confederation Confederation Suburban Centre 124 122 119 116 110 West Industrial 70 79 84 81 83 South West Industrial 44 48 49 50 48 Mount Royal 31 32 31 30 31 Hudson Bay Park 17 18 19 18 17 Meadowgreen 18 16 16 15 16 Holiday Park 12 12 12 11 10 Massey Place 5 7 7 6 7 Confederation Park 5 6 7 7 7 Dundonald 8 5 7 7 7 Westview 4 5 5 7 5 Gordie Howe Management Area 4 4 4 4 3 CN Yards Management Area 3 3 3 3 3 Montgomery Place 3 3 3 3 3 Agpro Industrial 2 2 2 2 2 Fairhaven 2 2 2 2 2 Hampton Village 0 0 0 1 2 SaskPower Management Area 1 0 0 0 0Core Neighborhoods City Park 216 218 229 228 222 Riversdale 145 152 151 160 168 Nutana 160 162 157 156 162 Caswell Hill 102 100 104 112 119 Varsity View 53 56 61 59 60 Pleasant Hill 60 54 54 58 58 Westmount 21 19 20 19 19 King George 12 11 11 10 12East East Development Area - - - - 1Lakewood Wildwood 107 110 110 113 112 College Park 108 112 111 110 110 Lakeview 51 47 45 43 42 Lakewood Suburban Centre 4 8 14 17 20 College Park East 11 12 12 12 12 S.E. Development Area 4 4 4 4 4Lawson Kelsey – Woodlawn 196 211 216 220 223 Lawson Heights Suburban Centre 149 146 153 154 154 Mayfair 51 53 51 48 55 River Heights 18 19 19 18 18 Central Industrial 19 17 17 21 22 Richmond Heights 7 6 6 8 9 North Park 9 9 7 7 8 Silverwood Heights 1 1 2 2 2North North Development Area - - - - 2North West Industrial North Industrial 694 701 715 745 740 Hudson Bay Industrial 422 439 443 468 463 Airport Business Area 375 381 387 375 374 Marquis Industrial 26 29 42 64 103 Agriplace 59 63 68 68 73 Airport Management Area 38 36 37 37 39
BU
SIN
ESS
PRO
FILE
10w
ww
.sas
kato
on.c
a
Appendix 3Number of Home Based Businesses by NAICS Industry Sub-Sector, 2011
...continued from page 9
Suburban Development Area Neighborhood 2007 2008 2009 2010 2011Nutana Nutana Suburban Centre 106 104 101 103 94 CN Industrial 73 86 86 86 89 Brevoort Park 82 83 83 84 87 Grosvenor Park 73 78 77 76 75 Holliston 72 72 71 73 73 Stonebridge 4 22 37 48 64 Haultain 43 41 42 42 43 Exhibition 31 30 31 31 32 Greystone Heights 27 26 26 27 27 Avalon 23 22 26 25 26 Buena Vista 24 23 23 26 26 Eastview 15 11 11 12 12 Adelaide/Churchill 10 11 10 10 10 Nutana Park 3 3 4 4 4 Queen Elizabeth 3 3 3 3 4 The Willows 2 2 1 1 1University Heights Sutherland Industrial 163 176 179 178 183 U of S Management Area 117 130 118 118 121 University Heights Suburban Centre 48 58 62 73 96 Sutherland 40 39 41 44 44 Forest Grove 12 12 12 12 11 U of S Lands South Management Area 3 3 3 3 2 Erindale 1 1 1 2 1
Silverspring 1 1 1 1 2 University Heights Development Area 1 1 1 0 1Total 5,385 5,506 5,582 5,717 5,803
Industry Sub-Sector 2010 2011Agriculture, Forestry & Fishing Support activities for agriculture & forestry 3 3Mining, Oil & Gas Extraction Support activities for mining, oil & gas extraction 2 3ConstructionConstruction of buildings 473 529Heavy & civil engineering construction 18 18Specialty trade contractors 649 701ManufacturingFood manufacturing 3 6Textile mills 0 1Textile product mills 5 6Clothing manufacturing 13 14Leather & allied product manufacturing 1 1Wood product manufacturing 1 1Printing & related support activities 5 6Chemical manufacturing 7 5Non-metallic mineral product manufacturing 6 4Fabricated metal product manufacturing 7 7Machinery Manufacturing 0 1
Industry Sub-Sector 2010 2011Computer & electronic product manufacturing 1 2Transportation equipment manufacturing 0 1Furniture & related product manufacturing 2 1Miscellaneous manufacturing 35 34Trade (Wholesale & Retail) Farm product wholesaler-distributors 1 0Food, beverage & tobaccowholesaler-distributors 11 10Personal & household goodswholesaler-distributors 22 24Motor vehicle & parts wholesaler-distributors 4 3Building material & supplieswholesaler-distributors 17 20Machinery, equipment & supplieswholesaler-distributors 20 17Miscellaneous wholesaler-distributors 19 16Wholesale electronic markets & agents& brokers 41 37Motor vehicle and parts dealers 0 2Miscellaneous store retailers 2 3Non-store retailers 103 113
continued on page 11...

BU
SINESS PR
OFILE
11
continued on page 12...
Industry Sub-Sector 2010 2011 Industry Sub-Sector 2010 2011
Appendix 4 Number of Home Based Businesses by Neighbourhood, 2007-2011
Suburban Development Area Neighbourhood 2007 2008 2009 2010 2011Blairmore Blairmore Suburban Centre - - - - 3 Blairmore Development Area - - - - 1Central Business District Central Business District 14 14 21 23 32Confederation Confederation Park 79 92 92 98 88 Westview 55 69 71 75 83 Dundonald 68 73 74 87 82 Montgomery Place 44 55 61 65 72 Meadowgreen 39 44 50 56 71 Hampton Village 7 14 26 48 69 Parkridge 47 51 57 61 62 Mount Royal 57 68 68 60 61 Pacifi c Heights 52 61 64 64 59 Fairhaven 36 39 36 38 42 Massey Place 27 31 36 35 39 Hudson Bay Park 19 28 33 38 37 Holiday Park 23 28 30 29 29 Confederation Park Suburban Centre 0 2 3 8 4Core Neighbourhoods Nutana 79 75 85 105 104 City Park 55 57 63 66 71 Caswell Hill 54 60 67 76 69 Varsity View 43 50 49 59 52 Westmount 17 25 38 31 34 Riversdale 12 20 30 38 35 King George 17 26 26 26 33 Pleasant Hill 23 29 31 27 30East East Development Area - - - - 1
Transportation & Warehousing Truck transportation 52 51Transit & ground passenger transportation 12 9Scenic & sightseeing transportation 3 3Support activities for transportation 11 10Couriers & messengers 23 19Finance, Insurance, Real Estate & Leasing Credit intermediation & related activities 6 2Securities, commodity contracts & otherfi nancial investment & related activities 12 10Insurance carriers & related activities 11 11Real estate 23 29Rental & leasing services 13 14Professional, Scientifi c & Technical Services Professional, scientifi c & technical services 658 707Business, building & other support services Management of companies & enterprises 4 4Administrative & support services 482 502Waste management & remediation services 7 7
Educational Services Educational services 133 140Health Care & Social Assistance Ambulatory health care services 66 79Social assistance 25 25Information, Culture & Recreation Publishing industries (except internet) 13 13Motion picture & sound recording industries 26 24Broadcasting (except internet) 1 1Telecommunications 1 2Data processing, hosting & related services 3 6Other information services 11 10Performing arts, spectator sports & relatedindustries 99 96Amusement, gambling & recreation industries 8 9Accommodation & Food Services Food services & drinking places 17 21Other Services Repair & maintenance 112 129Personal & laundry services 278 305

ww
w.s
aska
toon
.ca
...continued from page 11
The Business Profi le Annual Report is provided as an informational service to the business community, the general public, and agencies who regularlydo business with City Hall. The information contained in this publication is not copyright protected and may be used freely. The Community Services Department believes all information and sources in this publication to be correct, however assumes no responsibility for its use. Readers should not act upon the information contained in this publication without fi rst seeking professional advice.
BU
SIN
ESS
PRO
FILE
12 Suburban Development Area Neighbourhood 2007 2008 2009 2010 2011Lakewood Lakeview 83 91 102 113 118 Briarwood 74 86 95 100 105 College Park 69 82 89 91 103 College Park East 59 66 74 87 96 Wildwood 67 78 75 77 95 Lakeridge 54 64 66 68 72 Lakewood Suburban Centre 7 19 25 31 37 Rosewood 0 0 0 1 8Lawson Silverwood Heights 162 178 178 192 206 River Heights 71 81 76 90 100 Lawson Heights 42 49 58 66 76 North Park 33 44 37 48 59 Mayfair 33 41 48 59 50 Kelsey - Woodlawn 7 12 16 14 13 Richmond Heights 9 8 9 13 13 Central Industrial 1 7 5 6 9 Lawson Heights Suburban Centre 5 6 5 5 6North West Industrial Airport Business Area 1 5 2 1 0Nutana Adelaide/Churchill 55 60 76 83 84 Stonebridge 12 29 48 69 76 Eastview 58 69 58 68 71 Holliston 46 50 66 68 70 Buena Vista 56 57 63 64 66 Avalon 46 56 60 61 66 Haultain 45 45 44 58 63 Exhibition 45 55 55 62 56 Nutana Park 37 41 46 41 52 Queen Elizabeth 27 37 44 39 49 Brevoort Park 42 41 49 52 48 Greystone Heights 29 29 34 40 43 Grosvenor Park 16 16 18 23 27 Nutana Suburban Centre 3 4 3 4 6 The Willows 1 2 3 5 7University Heights Silverspring 103 110 112 121 127 Willowgrove 24 40 74 111 145 Arbor Creek 58 67 80 99 102 Forest Grove 63 69 73 82 76 Sutherland 62 63 58 71 75 Erindale 70 68 64 72 72 University Heights Suburban Centre 12 12 14 14 13 Evergreen - - - - 5 U of S Lands South MA 0 1 0 0 1Total 2,554 2,949 3,213 3,582 3,829