business process reengineering project (bprp): …...business process reengineering project (bprp):...
TRANSCRIPT
STATE OF HAWAII
DEPARTMENT OF HUMAN SERVICES BENEFIT, EMPLOYMENT AND SUPPORT SERVICES DIVISION
BUSINESS PROCESS
REENGINEERING PROJECT (BPRP): CHALLENGES AND SUCCESSES
AUGUST 14-15, 2012

2
Case Management Model
Eligibility determination for SNAP, TANF, GA and AABD via a Case Management Process.
Application for benefits was processed by one case manager (Eligibility Worker (EW) in Hawaii’s case) from start to end.
Case Management Model is heavily dependent on staff to case ratio to ensure benefits are issued timely.
Any reduction in or unavailability of staff and other resources would result in higher average caseload per EW and delay in processing of benefits.
2

3
WHY ENGAGE IN BUSINESS PROCESS REENGINEERING
Increase in SNAP and Financial Assistance Applications
Vacancy Freezes and Reduction in Force (RIF) Severe Economic Downturn Increase in Staff Workloads and Decrease in
Resources Outdated Business Processes Decrease in Timeliness in Issuance of Benefits

4
UNPRECEDENTED INCREASE IN CASELOADS
BESSD began to see unprecedented increase in the SNAP and
Financial Assistance (TANF/GA/AABD) caseloads between 2008-
2011.
4
June 2008
September 2011
Percentage Increase
SNAP 45,027 77,133 71% TANF 8,344 9,477 14% GA 3,997 5,381 35% AABD 1,466 1,549 6%

5
UNPRECEDENTED DECREASE IN STAFFING
Number of eligibility staff available prior to 2008 = 425
Number of eligibility staff RIF’d in December 2009 and January 2010 = 85
Number of eligibility positions deleted = 41
Total Eligibility positions lost = 126 (30% of the total EW positions)
Total Eligibility positions frozen = 99
Total Eligibility Positions available in September 2011 = 200
5
6
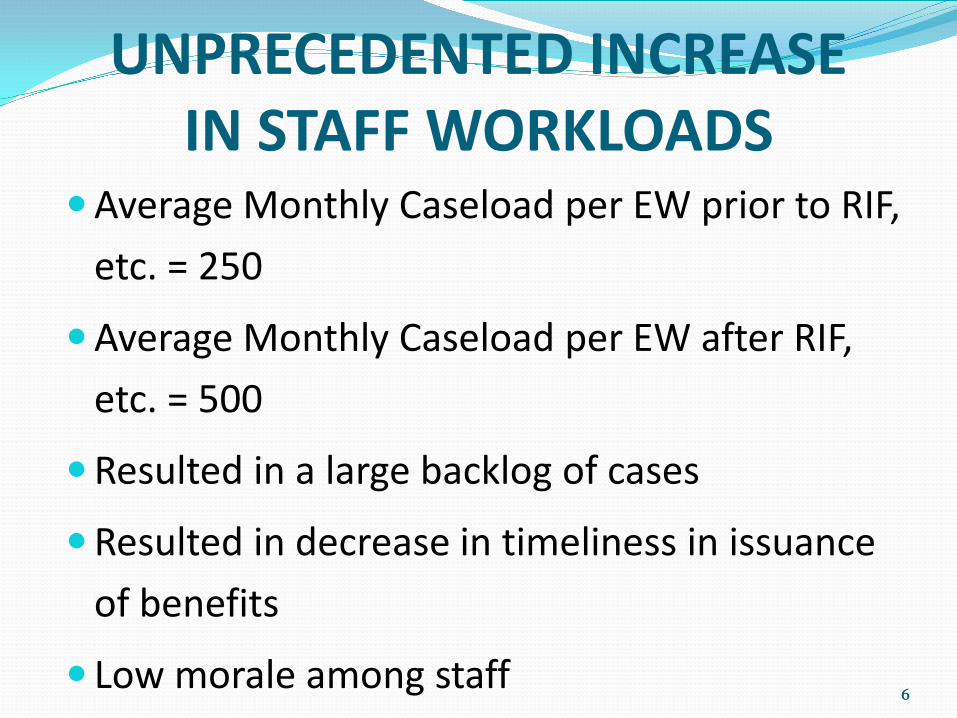
UNPRECEDENTED INCREASE IN STAFF WORKLOADS
Average Monthly Caseload per EW prior to RIF, etc. = 250
Average Monthly Caseload per EW after RIF, etc. = 500
Resulted in a large backlog of cases
Resulted in decrease in timeliness in issuance of benefits
Low morale among staff
6

7
DECREASE IN TIMELINESS IN ISSUANCE OF BENEFITS
Federal regulations require states to issue benefits within 7 days from the date of application in SNAP expedited
cases Within 30 days in regular SNAP cases Within 45 days in financial assistance cases (TANF,
TAONF, GA, and AABD) Timeliness rates prior to September 2011 were: - Maui: 29% Hilo: 72% Kona: 59% - Kauai: 80% Oahu: 66%
7

8
DEPARTMENT’S INITIAL RESPONSE
In January 2010 DHS proposed to establish the Eligibility Processing and Operations Division (EPOD) within DHS: Two centralized eligibility determination centers,
one each on Oahu and Hilo Close offices on Kauai, Maui, Molokai, Lanai and
Kona Conduct all business via phone, fax and mail
8

9
FAILURE OF EPOD It was a top-down effort Staff at different levels were not consulted Employees union was not consulted Community was not in favor of closing front line
offices on their islands No plan to address the large backlog There was no transition planning to prepare staff
and clients FNS and ACF were concerned about access to
benefits and services April 2010, Hawaii Legislature enacted a law
(Act 67) to stop EPOD
9
10
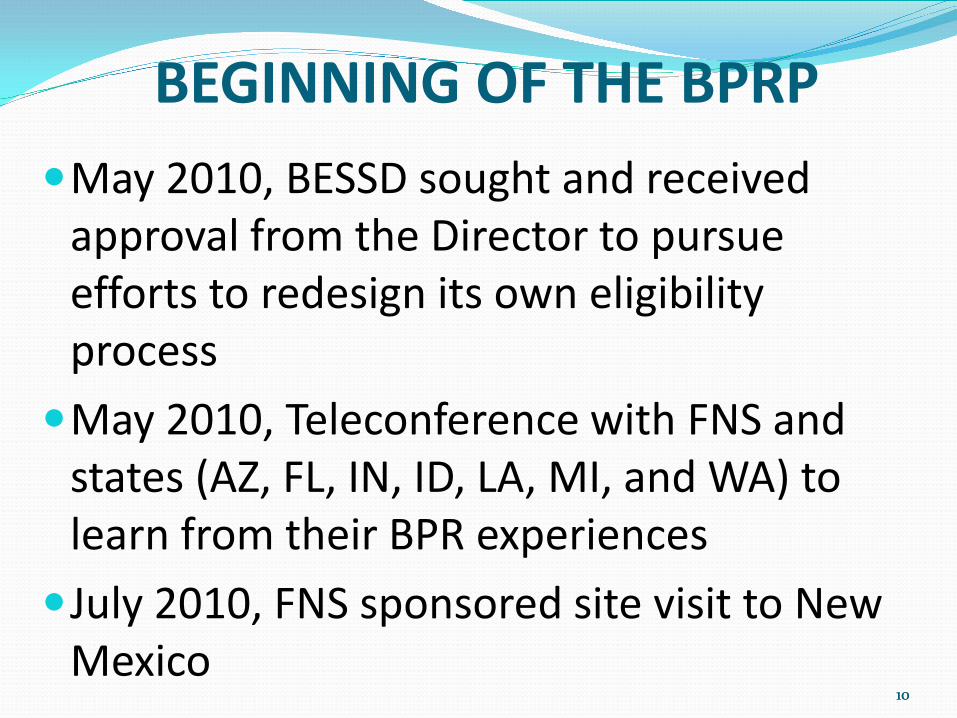
BEGINNING OF THE BPRP May 2010, BESSD sought and received
approval from the Director to pursue efforts to redesign its own eligibility process May 2010, Teleconference with FNS and
states (AZ, FL, IN, ID, LA, MI, and WA) to learn from their BPR experiences July 2010, FNS sponsored site visit to New
Mexico
10

11
BUSINESS PROCESS REENGINEERING PLAN – cont.
Key Goals and Objectives Create Capacity Improve Timeliness Improve Accuracy Increase Program Participation Increase Client Satisfaction

12
BUSINESS PROCESS REENGINEERING PLAN – cont.
August 2010, Appointment of the BPR Steering Committee
BPR Project Strategies Involve staff at all levels of organization and work Active leadership involvement. Actively seek stakeholder input, particularly employees
union Transparency (keep all stakeholders informed) Continual evaluation of the project Communicate clearly, effectively and often Phased implementation
12

13
BUSINESS PROCESS REENGINEERING PLAN
Key Guiding Principles
Customers Have Different Needs (one size does not fit all) - Triaging lobby traffic and interviews
Eliminate Repeat Visits (Same Day Processing of Applications) - First Contact Resolution - On-demand interviews and processing
Reduce Rework - Consistent tools and standard practices
Real-time Data and Resource Management - Process Measures - Fluid staff assignments
14
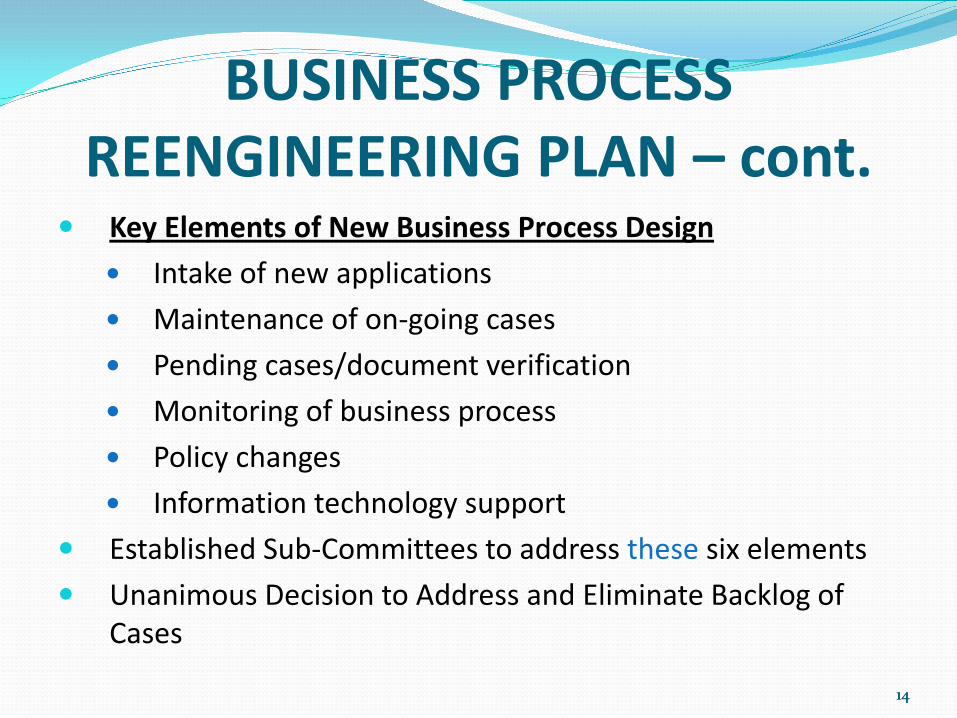
BUSINESS PROCESS REENGINEERING PLAN – cont.
Key Elements of New Business Process Design Intake of new applications Maintenance of on-going cases Pending cases/document verification Monitoring of business process Policy changes Information technology support
Established Sub-Committees to address these six elements Unanimous Decision to Address and Eliminate Backlog of
Cases
14
15
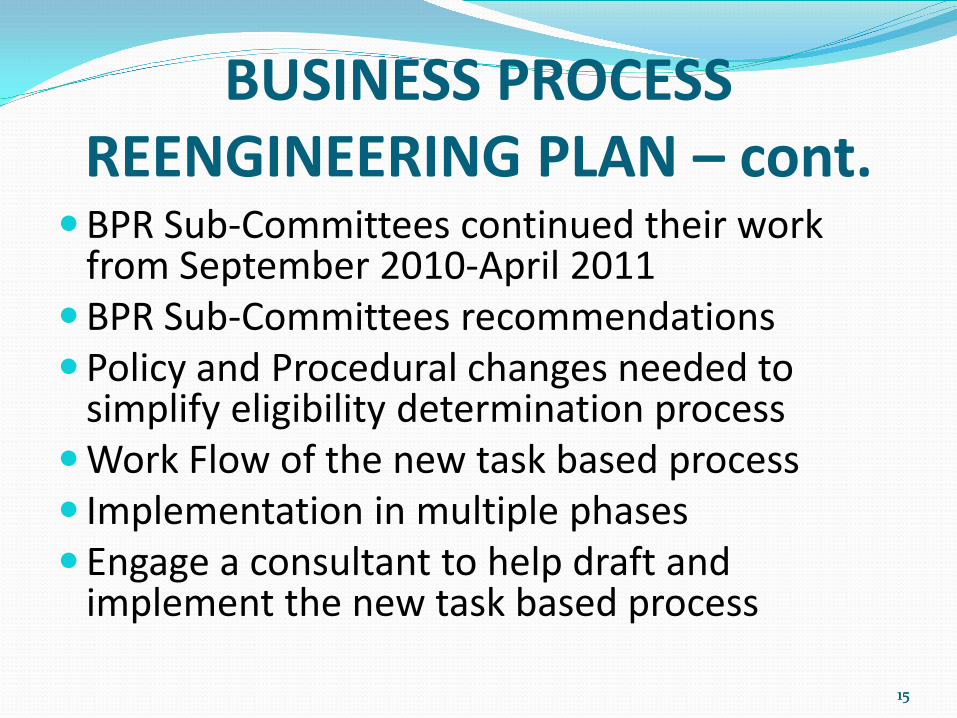
BUSINESS PROCESS REENGINEERING PLAN – cont.
BPR Sub-Committees continued their work from September 2010-April 2011
BPR Sub-Committees recommendations Policy and Procedural changes needed to
simplify eligibility determination process Work Flow of the new task based process Implementation in multiple phases Engage a consultant to help draft and
implement the new task based process 15
16
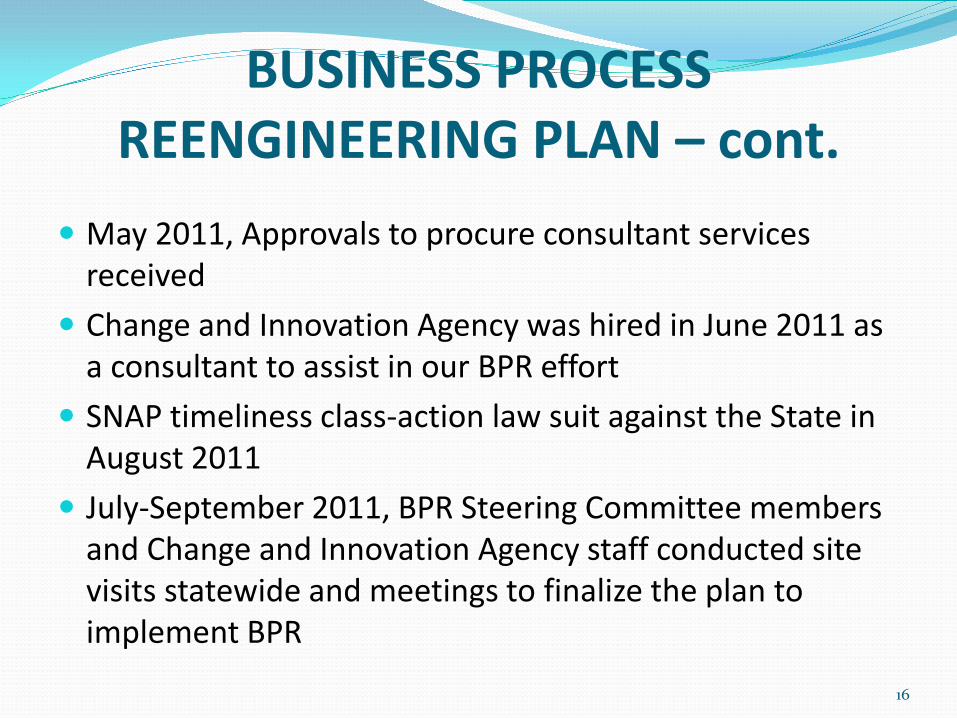
BUSINESS PROCESS REENGINEERING PLAN – cont.
May 2011, Approvals to procure consultant services received
Change and Innovation Agency was hired in June 2011 as a consultant to assist in our BPR effort
SNAP timeliness class-action law suit against the State in August 2011
July-September 2011, BPR Steering Committee members and Change and Innovation Agency staff conducted site visits statewide and meetings to finalize the plan to implement BPR

17
BUSINESS PROCESS REENGINEERING WORKFLOW

18
NEW BUSINESS PROCESS AND TOOLS
Consistent process management model Statewide (starting with the island of Maui)
Eliminated backlog of applications Same day service Standardized interviews through the use of interview
scripts Standardized case narratives through the use of
documentation templates Consistent verification practices and approach

19
NEW BUSINESS PROCESS AND TOOLS - continued
New and improved procedural handbook and additional desk aids
Allowed eligibility workers to perform case registration
Developed and implemented Client Flow/Workload Tracker to assist with the work flow management on a daily basis
Developed and implemented a file control plan Auto-generated Simplified Recertification Forms Developed a system generated appointment letter
20
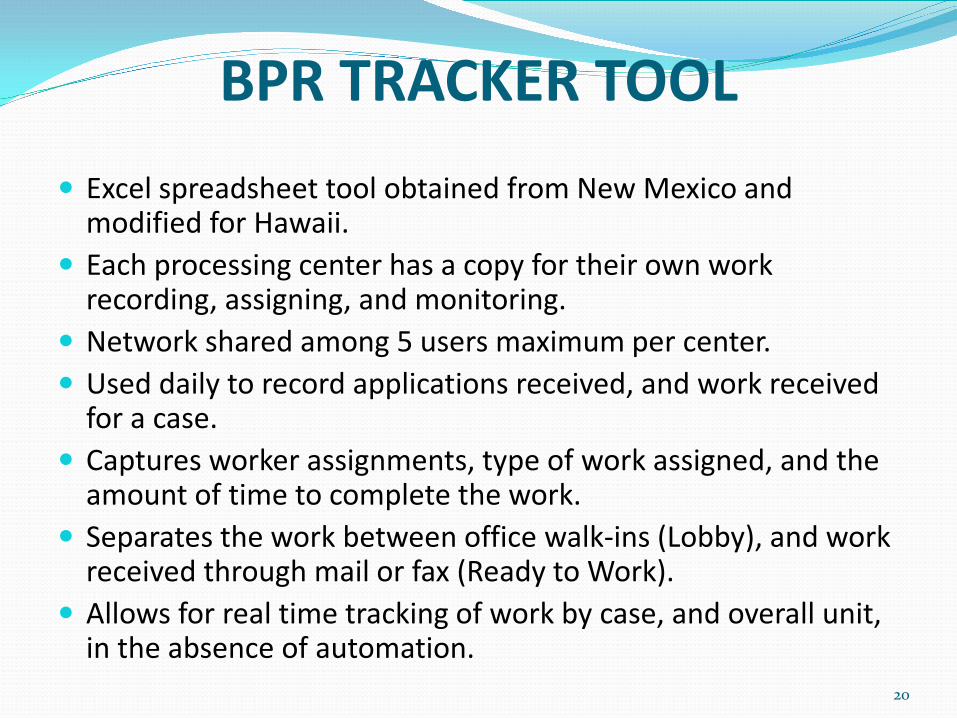
BPR TRACKER TOOL Excel spreadsheet tool obtained from New Mexico and
modified for Hawaii. Each processing center has a copy for their own work
recording, assigning, and monitoring. Network shared among 5 users maximum per center. Used daily to record applications received, and work received
for a case. Captures worker assignments, type of work assigned, and the
amount of time to complete the work. Separates the work between office walk-ins (Lobby), and work
received through mail or fax (Ready to Work). Allows for real time tracking of work by case, and overall unit,
in the absence of automation.

21
BPR TRACKER TOOL – Cont.
Case Number or DOB
CASE NAME DATE RECEIVED Time In
Gre
en -
SN
AP
Red
- F
A
Blu
e -
ER
Ch
ange
Pen
d/
Pro
cess
ing
SMR
F
EBT
Q &
A
Fair
Hea
rin
g
START TIME
WorkerP=PENDING,
C=COMPLETED, NS = NO SHOW
TIME FINISHED
WAIT TIME FOR
INTER-VIEW
LENGTH OF INTER-
VIEW
101 Case 1 7/20/2012 08:10 AM X 08:11 AM Ueshiro C 08:20 AM 0:00 0:09102 Case 2 7/20/2012 08:06 AM X 08:28 AM pouliquen c 08:50 AM 0:21 0:22103 Case 3 7/20/2012 08:23 AM X 08:29 AM woods C 09:50 AM 0:06 1:20104 Case 4 7/20/2012 08:24 AM X 08:27 AM Doane c 09:15 AM 0:03 0:47105 Case 5 7/20/2012 08:26 AM X 08:30 AM peahi P 09:05 AM 0:03 0:35106 Case 6 7/20/2012 09:04 AM X 09:05 AM Ueshiro C 09:06 AM 0:00 0:01107 Case 7 7/20/2012 08:50 AM X 09:09 AM Leverenz C 10:10 AM 0:19 1:00108 Case 8 7/20/2012 08:51 AM X 09:24 AM Doane c 09:48 AM 0:33 0:23109 Case 9 7/20/2012 08:53 AM X 08:53 AM mercado c 09:55 AM 0:00 1:02
4/19/1900 Case 10 7/20/2012 09:10 AM X 09:23 AM pouliquen p 10:15 AM 0:13 0:51111 Case 11 7/20/2012 09:13 AM X 09:39 AM banasihan c 09:59 AM 0:25 0:20112 Case 12 7/20/2012 09:28 AM X 09:35 AM Tsukazaki C 09:50 AM 0:06 0:15113 Case 13 7/20/2012 09:33 AM X 09:48 AM Doane c 11:33 AM 0:15 1:44114 Case 14 7/20/2012 09:38 AM X 09:42 AM Tasi C 09:50 AM 0:03 0:07115 Case 15 7/20/2012 09:46 AM X 10:04 AM peahi P 10:26 AM 0:18 0:21
Double click on the colored header to find next unclaimed case
July 20, 2012
Time CalculatioCompleted by EW
Begin I End
KPTLOBBY Log

22
BPR TRACKER TOOL – Cont. 7/20/2012Site: KPTLOBBY Log
Generated: 7/26/2012 2:53:39 PMBy snakasone2 (v5.6)
Vis
its
Tra
cks
Gre
en
Re
d
Blu
e
Ch
an
ge
Pe
nd
/ P
roce
ssin
g
SMR
F
EB
T
Q &
A
Fair
He
ari
ng
Tra
cks
Gre
en
Re
d
Blu
e
Ch
an
ge
Pe
nd
/ P
roce
ssin
g
AFI
P
EB
T
Q &
A
Fair
He
ari
ng
Total 72 72 9 9 25 3 8 2 6 10 0 Total (%) 100% 13% 13% 35% 4% 11% 3% 8% 14% 0%Finished Visits 69 9 9 25 3 6 2 6 9 Finished Visits (%) 96% 100% 100% 100% 100% 75% 100% 100% 90% #DIV/0!
Completed (C ) 56 5 6 22 3 3 2 6 9 Completed (C ) (%) 81% 56% 67% 88% 100% 50% 100% 100% 100% #DIV/0!Completed (CV) 0 Completed (CV) (%) 0% 0% 0% 0% 0% 0% 0% 0% 0% #DIV/0!
Pending (P) 11 4 3 2 2 Pending (P) (%) 16% 44% 33% 8% 0% 33% 0% 0% 0% #DIV/0!No Show (NS) 2 1 1 No Show (NS) (%) 3% 0% 0% 4% 0% 17% 0% 0% 0% #DIV/0!
Other (*) 0 Other (*) (%) 0% 0% 0% 0% 0% 0% 0% 0% 0% #DIV/0!Total Wait Time 21:23 3:31 4:05 10:05 0:00 1:50 0:04 0:03 1:42 Total Wait Time (%)
Total Interview Duration 33:02 7:03 6:08 15:04 0:22 2:53 0:17 0:26 0:46 Total Interview Duration (%)Avg Wait Time 0:13 0:23 0:27 0:24 0:00 0:18 0:02 0:00 0:11 Avg Wait Time (%) 1:47 22% 25% 22% 0% 17% 2% 1% 11% #VALUE!
Avg Interview Duration 0:22 0:47 0:40 0:36 0:07 0:28 0:08 0:04 0:05 Avg Interview Duration (%) 2:58 26% 23% 20% 4% 16% 5% 2% 3% #VALUE!Avg Visit Duration 0:35 1:10 1:08 1:00 0:07 0:47 0:10 0:05 0:16 Avg Visit Duration (%) 4:46 25% 24% 21% 3% 17% 4% 2% 6% #VALUE!
Clients in the Lobby 1 1 Clients in the Lobby (%) 1% 0% 0% 0% 0% 0% 0% 0% 10% #DIV/0!Total Wait Time 0:00 Total Wait Time (%)
Avg Wait Time 0:00 0:00 Avg Wait Time (%) 0:00
Clients being Interviewed 2 2 Clients being Interviewed (%) 3% 0% 0% 0% 0% 25% 0% 0% 0% #DIV/0!Total Interview Duration 1:35 Total Interview Duration (%)
Avg Interview Duration 0:47 0:47 Avg Interview Duration (%) 0:47 #VALUE! #VALUE! #VALUE! #VALUE! 100% #VALUE! #VALUE! #VALUE! #VALUE!Invalid Rows Invalid Rows (%)
# of Staff assigned 2 2 4 3 4 2# of Staff available today 1 1 3 2 3 2

23
IMPLEMENTATION OF BPR We went live on Maui in early November 2011
Prior to implementation of BPR in Maui, the Maui Section’s SNAP timeliness rate was 29.1%
After one month (December 2011) of implementation of BPR , Maui’s timeliness rate jumped to 42%
Currently Maui’s timeliness is averaging (last four months) at 96%
East Hawaii (Hilo) implemented in November 2011 Prior to implementation of BPR in Hilo, the East Hawaii
Section’s SNAP timeliness rate was 72% After one month (December 2011) of implementation of
BPR , East Hawaii’s timeliness rate jumped to 87% Currently East Hawaii’s timeliness is averaging (last four
months) at 98%

24
IMPLEMENTATION OF BPR - continued
Implemented BPR on Oahu at following locations: Prior to implementation of BPR, timeliness on Oahu ranged
from 66-76% Kapolei Processing Center in January 2012 (96% timely) OR&L Processing Center in March 2012 (75% timely) Pohulani Processing Center in March 2012 (89% timely) Kuhio Park Terrace Processing Center in June 2012 (96%
timely) Waipahu Processing Center in July 2012 (95% timely)

25
IMPLEMENTATION OF BPR - continued
Kauai was implemented in May 2012 Prior to implementation of BPR in Kauai, the
Kauai Section’s SNAP timeliness rate was 80% Currently Kauai’s timeliness is averaging (last
three months) at 96% Statewide timeliness rate is 90.1% and increasing We are in a planning phase for the remaining two
processing centers on Oahu and one in West Hawaii (Kona)
26
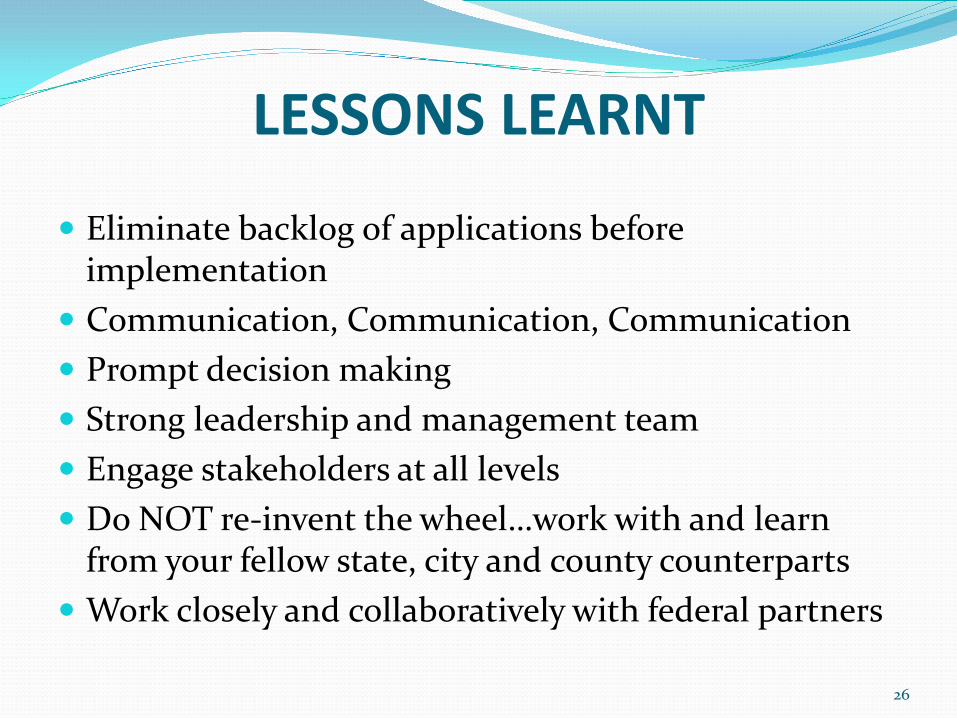
LESSONS LEARNT
Eliminate backlog of applications before implementation
Communication, Communication, Communication Prompt decision making Strong leadership and management team Engage stakeholders at all levels Do NOT re-invent the wheel…work with and learn
from your fellow state, city and county counterparts Work closely and collaboratively with federal partners

27
NEXT STEPS Limit EBT replacements Automate the Tracker (using Sharepoint
or similar platform) Document Imaging and Content
Management Leverage Medicaid Eligibility System to
include TANF and SNAP by December 31, 2015

28
CONTENT MANAGEMENT AND DOCUMENT IMAGING
Create electronic case records Automate the BPR workflow through
understanding and designing the document road map
Automate the BPR Tracker Allows for more flexibility in utilizing manpower Allows for the possibility of on-line application
and forms
29
CONTENT MANAGEMENT AND DOCUMENT IMAGING – cont.
CURRENT STATUS AND TIMELINE 6/2012 - Awarded contract to Imagine Solutions, Inc. to
design, construct, and implement this project 7/2012 – present – Project group involving
representatives from Program, IT, and operations meeting with Imagine Solutions to gather requirements, system design and testing
12/2012 – Phase 1 rollout to offices on the island of Hawaii. Phase 2 rollout throughout the State thereafter